the Creative Commons Attribution 4.0 License.
the Creative Commons Attribution 4.0 License.
 | 02 Jul 2026
Quantifying the response of water and carbon balances to land cover and climate extremes across Germany
Karim Pyarali
Lulu Zhang
Ning Liu
Abdulhakeem Al-Qubati
Ge Sun
Land cover and extreme weather events are closely connected to ecosystem services like water yield and carbon sequestration. Understanding how carbon and water respond to human disturbances is critical for managing these resources and realize desired ecosystem services at the national llevel. The monthly scale ecosystem model, Water Supply Stress Index (WaSSI), was tested and applied across Germany for mapping carbon and water balances from 2001 to 2019. We estimated that ecosystems in Germany generate 84.86 billion m3 of water yield and sequester 106.03 Tg of carbon annually on average. Most of the precipitation was lost as evapotranspiration in eastern states that were comparatively drier in river flows than the rest of the country. Croplands, urban areas and Evergreen Needle Forests (ENF) provide 82.5 % of the national water yield, while the forest lands share the majority (56.3 %) of land carbon sequestration altogether. Our simulation results highlight the importance of sparse land covers (e.g. wetlands) in carbon sequestration. Findings also suggest that national water yield and carbon balances are sensitive to extreme events such as the floods in 2002 and 2013 and the extreme drought in 2003 and 2018. We found that hydrologic buffers from the previous year played an important role in mitigating negative impacts on both carbon and water availability. This study highlights that, when integrated with local data, a relatively simple modelling approach is adequate to quantify the coupled water and carbon responses to climatic and land cover variability at a large scale. We conclude that land management of both forests and croplands is vital to sustain ecosystem services under a changing climate at regional to national levels.
- Article
(12056 KB) - Full-text XML
-
Supplement
(26783 KB) - BibTeX
- EndNote


Ecosystem services such as water yield and carbon sequestration are intimately linked with land cover and climate extremes. The two key ecosystem services support life and economic activity (Morales et al., 2005). The tightly coupled links between water and carbon cycles through parameters such as precipitation, temperature, evapotranspiration (ET), and ecosystem services are well recognized (Beer et al., 2007; Sun et al., 2011). However, it is still unclear how changes in land cover and climate extremes have impacted these services in Germany at a national level. These services are challenging to measure directly, but an ecosystem services model can be applied to estimate them across the German landscape at a sub-basin scale.
Changes in land cover are driven by multiple interconnected reasons, two of them are improving living standards and population growth (Allan et al., 2022). Studies have shown that land cover change greatly reduces ecosystem services, but the impact varies spatially and temporally (Hasan et al., 2020). According to Pandey and Ghosh (2023) and Salerno et al. (2018), urbanization disrupts regulating service for e.g., water purification, soil retention, and climate regulation. On the other hand, Arowolo et al. (2018) and Cui et al. (2021) observed that expansion of cropland often increases goods from provisioning services such as food, fodder and water yield. A recent survey in 2022 from the German national forest inventory found that since 2017, the German forest has become a source of carbon dioxide, instead of being a sink. The reason behind the change in ecosystem functions is the high loss of living biomass due to climate change and low forest growth (Riedel et al., 2024).
Another environmental phenomena that impact ecosystem services are extreme climate events (e.g. droughts and extreme precipitation). Catastrophic weather events not only made countries in the Global South but also in Global North vulnerable. Germany's 2021 summer flood resulted in a loss of 220 lives and USD 40 billion (Natural disasters cost USD 280 billion in 2021: Schumacher, 2022); the incurred damages from the 2003 drought, primarily on agriculture, were approximately USD 13 billion across Europe (Eisenreich, 2005). Germany has seen an increase in the intensity and frequency of heavy rainfall, more in winter than in summer. The air temperatures are also projected to rise by 1.6 to 3.8 °C by 2080 (Schröter et al., 2005). A shift in precipitation season has been observed, which will potentially increase the risks of floods during winter and decrease the water supply during summer periods (Schröter et al., 2005). The extreme events are changing due to climate change. Their impacts may reduce terrestrial carbon uptake or gross primary productivity (GPP) (Williams et al., 2014), which negatively affects other factors within the co-evolved processes of carbon-water cycle in an integrated terrestrial system (Zhang et al., 2018). Potentially leading to adverse effects on regional food and livelihood security.
Although ecosystem services are essential and well-recognized in Germany, national-scale studies on both carbon and water yield are still lacking. There are multiple studies that focus on a specific land cover type or specific ecosystem services at the European, national or subnational scales. For example, Potter and Pass (2024) estimated the changes in net primary productivity (NEP or carbon sequestration) for Western Europe, including Germany. Gutsch et al. (2018) assessed German forest ecosystem services under climate change and different management scenarios. Their results showed that climate change has negative impacts on water percolation and positive impacts on carbon sequestration. Using agricultural long-term field experiments, carbon sequestration was projected to increase in the southern parts of Germany, indicating higher productivity, and decrease in central and east Germany where poor soil will further reduce the productivity (Donmez et al., 2024). Other studies used regional analysis to assess water or carbon cycles (Al-Qubati et al., 2023; Prescher et al., 2010; Ungaro et al., 2021; Wu et al., 2021). The lack of integrated water-carbon cycles assessment hampers deriving national or regional adaptive land management strategies to alleviate the adverse impacts resulting from environmental and climate change, particularly in the long term.
Furthermore, we observed a varied response of the coupled water-carbon cycle to changes in land cover and climate (Cheng et al., 2017; Jung et al., 2017; Zeng et al., 2018). The variation is manifested by the coupled mechanisms occurring at multiple timescales. These may be short-term leaf-gas exchanges, monthly or annual ET and carbon accumulation, and long-term water yield and species composition. This emphasises that a single type of observation is not sufficient to provide the robust validation needed to address the response of water and carbon cycles to environmental disturbances or climate shocks (Margulis et al., 2006). Gentine et al. (2019) argued that terrestrial water-carbon cycles must be investigated as an integrated system. They recognized the importance of incorporating multiple observations on different timescales from various sources to better validate model simulations, which may reduce uncertainties, mitigate bias, and provide better predictions. Unfortunately, the suggested approach is seldomly applied in hydrological modelling (Sun et al., 2011, 2023; Zhang et al., 2022, 2016). Thus, impeding the improvement of our predictive ability to quantify the potential water-carbon changes and consequences that are vital to effective policy decision-making for developing climate adaptation and mitigation strategies. Therefore, we integrated multi-timescale observations and information sources in our model to validate simulated water yield and carbon sequestration. We used gauged river discharge (Q), in-situ measured ET and GPP from eddy flux towers, and remotely sensed ET and GPP data for model validation.
In this study, WaSSI, an ecosystem service model, was applied on a monthly and subbasin (804) resolution to simulate the water and carbon processes across the different land covers within Germany (Sun et al., 2011). The model has been used globally for various purposes and under different climatic and socioeconomic conditions (Averyt et al., 2011; Caldwell et al., 2011, 2014, 2012; Liu et al., 2020; Sun et al., 2011, 2015) in countries like the United States of America, Rwanda, Australia, Turkiye, Nepal and China (Chen et al., 2024; Jin et al., 2025; Liu, 2017; Liu et al., 2013; Mcnulty et al., 2016; Sun et al., 2011). By validating the WaSSI model, we aim to have an improved understanding of the response of water-carbon cycles on German land cover with climate variability at a watershed scale. Furthermore, we focus on three questions: (i) How did ET, water yield and NEP vary over time and space? (ii) How did different land cover contribute to water yield and carbon sequestration? and (iii) to what extent and how sensitive are the two ecosystem services to extreme weather events?
The WaSSI model merges the water and carbon cycle using water use efficiency (WUE) parameters estimated from global eddy flux observations. It is made up of two components: a hydrological and a carbon sub-model. The required inputs are precipitation, temperature, digital elevation model, land cover, fractional impervious cover, leaf area index (LAI), and soil parameters, while the outputs are Q, ET, GPP, and net ecosystem exchange (NEE) (Liu, 2017). Transboundary inflows and outflows were not accounted in this study; therefore, watersheds close to Germany's boundary, which accumulated their flow across the border, were not considered.
The WaSSI model estimates land cover-specific water yield (mm per month), which can be aggregated as flow volume downstream (m3 per month) for any individual watersheds. The hydrologic fluxes estimated are snow melt, snow accumulation, soil storage, surface flow, base flow, routed flow accumulation, and ET (Sun et al., 2011). The model employs a conceptual method (McCabe and Wolock, 1999) that uses the monthly average temperature and mean average elevation of a watershed to partition precipitation into rainfall and snowfall, estimate the rate of snow melt, and calculate the mean monthly snow water equivalent for each watershed (Caldwell et al., 2012). The Sacramento Soil Moisture Accounting (SAC-SMA) model was used for soil and runoff parameters, which runs infiltration, baseflow, surface runoff, and soil moisture processes, while also constraints ET estimates based on soil water content. For ET estimations, we used the Type II regression model from (Fang et al., 2015), where the ET model was developed using quality-controlled global data from more than 200 eddy flux sites (Pastorello et al., 2020), incorporating the three most commonly available biophysical parameters precipitation (P), potential ET (PET) (Temperature based) and LAI in the following equation:
WaSSI estimates three main components of the carbon cycles: (i) GPP or total carbon uptake, (ii) ecosystem respiration (Re) representing carbon loss, and (iii) Net Ecosystem Productivity (NEP) or negative Net Ecosystem Exchange (NEE) or carbon sequestration:
Furthermore, a closely coupled relationship between ET and GPP has been found in multiple studies (Law et al., 2002; Sun et al., 2011), as presented in Eq. (3). In the WaSSI model, according to Sun et al. (2011), the relationship of monthly GPP with ET was estimated using linear regression for each land cover. Furthermore, land cover-specific WUE parameters were used, which were estimated using 142 eddy flux tower data (Zhang et al., 2016). Similarly, the Re from heterotrophic and autotrophic bacteria can be estimated using Eq. (4), where regression coefficients are estimated from eddy flux data. The coefficient (a, m, and n) values used in this study are provided in Table S1 in the Supplement.
2.1 Model Validation
We validated the model outputs using both in-situ observed data (e.g., stream discharge data from gauge stations and ET eddy flux data) and remotely sensed data (e.g., ET and GPP estimates from satellites). The temporal resolution of the WaSSI model output was monthly. The discharge was validated across the entire available temporal period, during dry–hot years and during wet–cold years. Twelve upstream watersheds were nominated for validation spread across Germany (Fig. 1). The chosen upstream stations were selected to ensure spatial coverage across Germany, representing the country's major climatic zones, land use, and land cover types. Stations with long and continuous discharge records were prioritised. The performance criteria to determine the accuracy of outputs are model bias (%), coefficient of determination (R2), scatter plots, Nash-Sutcliffe efficiency (NSE), and Kling-Gupta efficiency (KGE). The estimated ET was validated against data on different timescales. Simulated ET was compared with daily data from multiple eddy flux towers, monthly ET from Moderate Resolution Imaging Spectroradiometer (MODIS) (MOD16A2GF) (Running et al., 2019b), and watershed-specific water balance values, which were calculated by subtracting discharge from precipitation, on a monthly and annual timescale. Depending on the validation datasets, values were summed to either monthly or annual timesteps. For carbon, we compared the GPP estimates with GPP measurements from eddy flux towers, MODIS GPP (MOD17A2HGF) and Copernicus Global Land Service (CGLS) GPP (Running et al., 2019a; Smets et al., 2019). A monthly land cover-specific validation was conducted between modelled GPP and observed GPP. Where observed GPP estimates were developed using the daytime partitioning method (GPP_DT_VUT_REF). Further details for each validation dataset are provided in the following Sect. 2.3. Since the observed data from the gauge stations and eddy flux towers did not overlap, therefore, joint evaluation at the same subbasin for both Q and ET was not possible in this study.
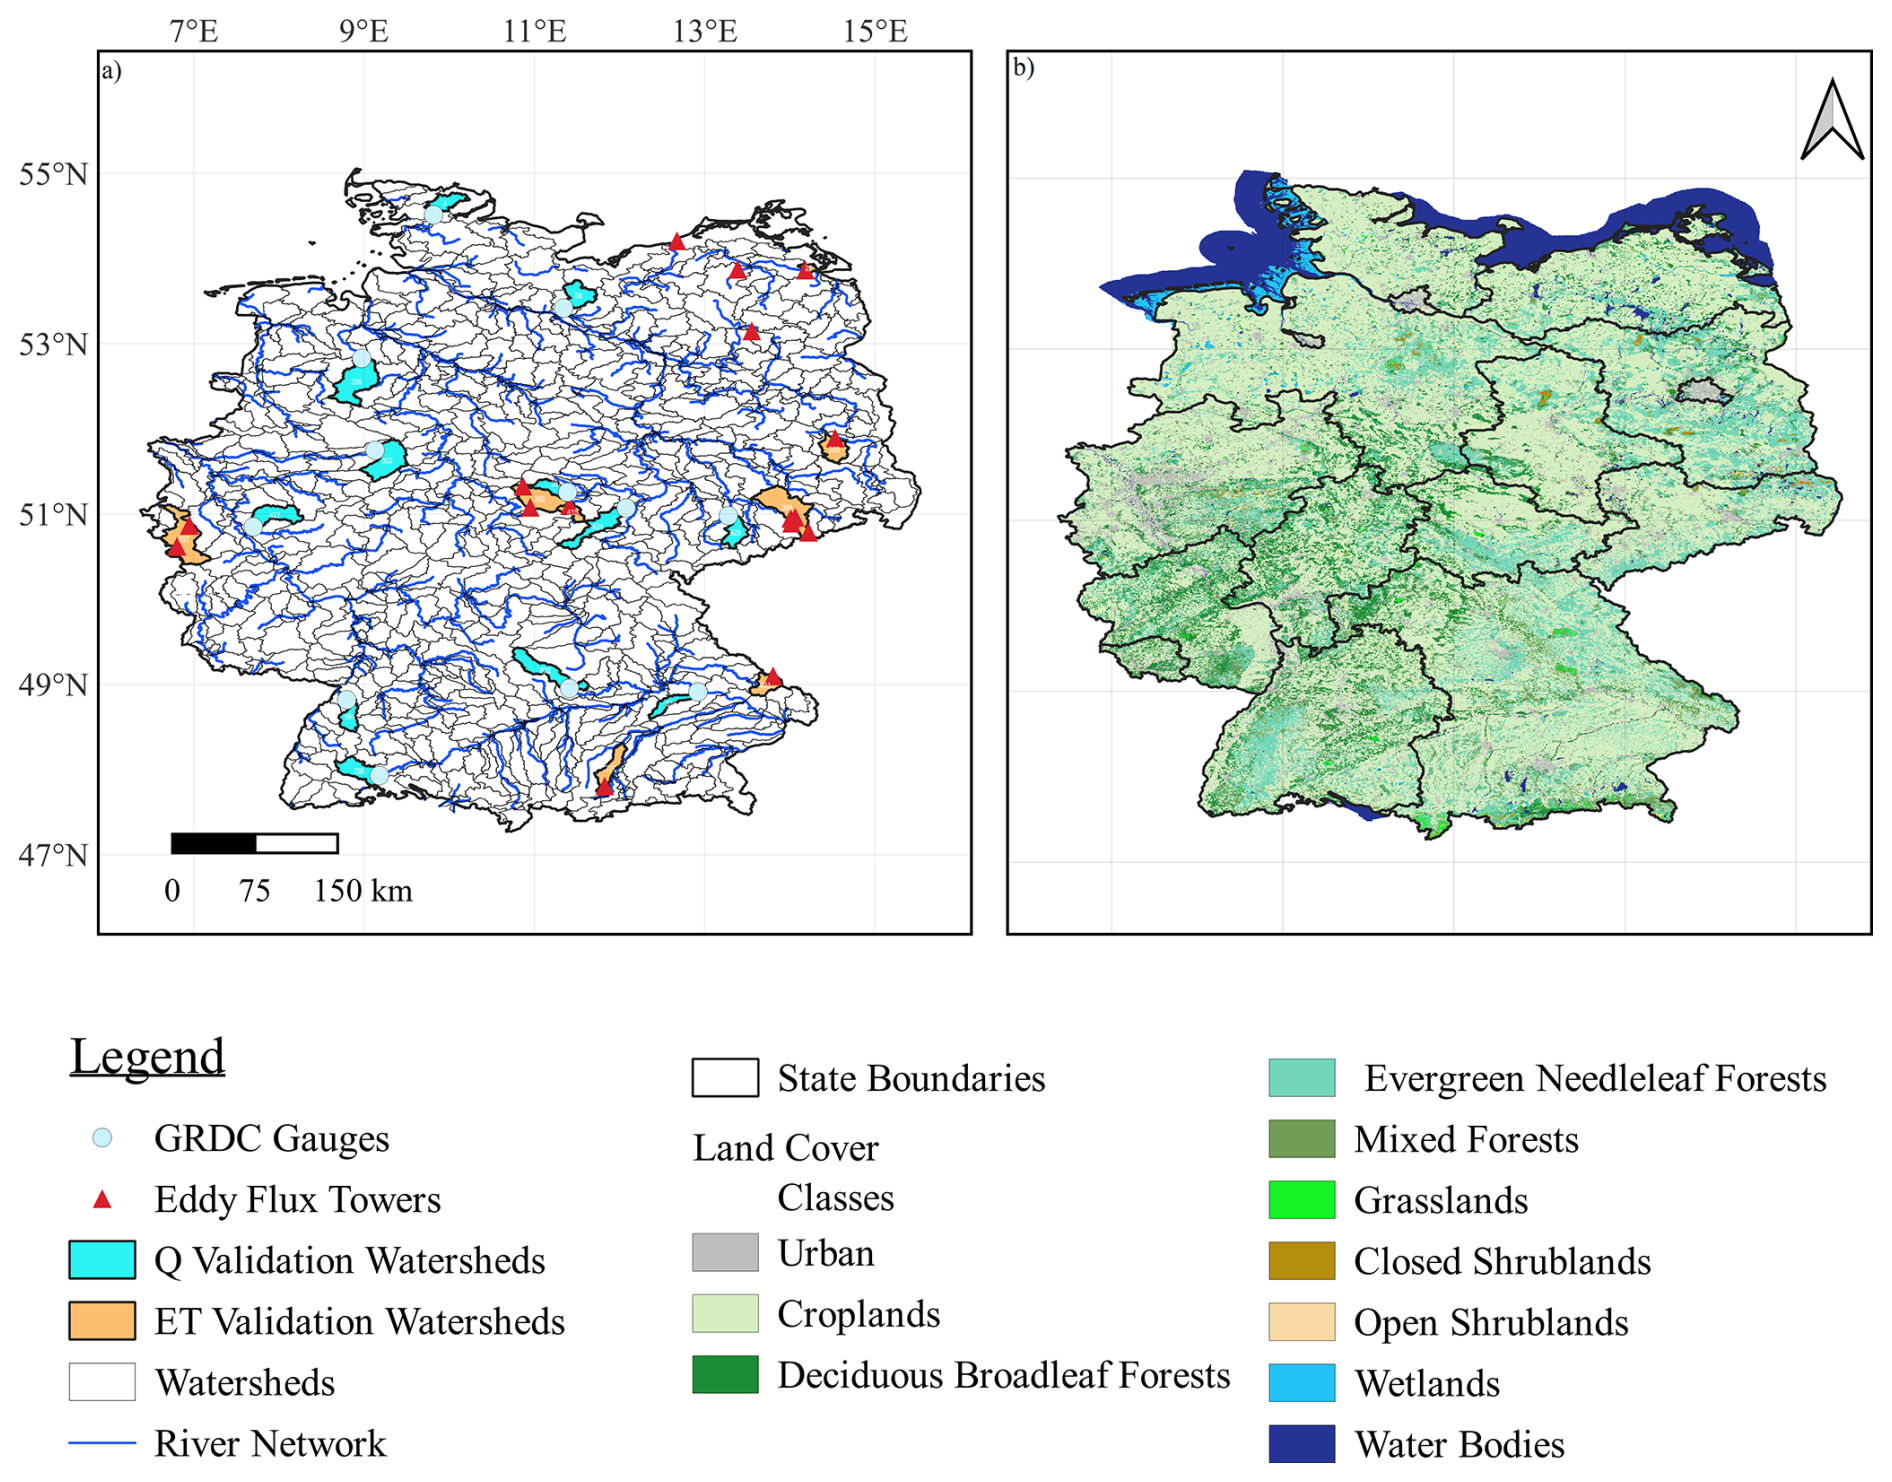
Figure 1A map of the study area presenting (a) Germany's boundaries with all the 804 watersheds delineated, Global Runoff Data Center's (GRDC) gauge station locations, major rivers, eddy flux tower sites and representative watersheds for streamflow (Q) and evapotranspiration (ET) validation and (b) Germany's land cover and state boundaries.
2.2 Input Data
2.2.1 Study Area
Germany, with an area of 357 168 km2, consists of sixteen states. Approximately 83.5 million people reside across five major river basins that fall within Germany (Rhine, Danube, Elbe, Weser, and Ems). Due to cross-boundary flows, Germany has bilateral water treaties with all of its neighbours. The climatic conditions span from maritime to continental. The annual mean temperature ranges from 9 to 11 °C, and the annual precipitation ranges from 450 to 970 mm (Kosanic et al., 2019). The land use is dominated by agriculture (61 %) and forests (29 %). Furthermore, the built-up area (6 %) is continuously expanding as cities grow due to urbanization. Socio-economically there is a clear divide between the Eastern and Western states due to the Soviet-era policies. In this study, Germany was delineated into 804 subbasins as the modeling units using a high-resolution digital elevation model (Fig. 1).
2.2.2 Climate Data
Climate data (i.e., precipitation and temperature) is sourced from Germany's national meteorological service (DWD Climate Data Center (CDC), 2023). Datasets have a spatial resolution of 1km and a temporal resolution of months. The gridded data are prepared by estimating monthly deviations for each station, which are then interpolated using inverse squared distance weighted interpolation and transformed back into real values using reference grids (Kaspar et al., 2013).
2.2.3 Land cover classification
CORINE land cover (CLC) map of 2018 with a 100 m spatial resolution was used in this study (EEA, 2021). Validation studies showed that it can capture land cover with an accuracy of 85 % (Büttner et al., 2021; Keil, 2017). This study reclassified land cover into 10 major classes. Table S2 shows the range of CLC classes that were merged along with their percentage across Germany. The selection of 10 classes was based on the availability of water-use efficiency (WUE) parameters. These 10 classes encompass all dominant ecosystem types across the study.
2.2.4 Leaf Area Index
Climate Data Record's (CDR) Vegetation (VGT) sensor LAI was used. The data is available from 2001 to 2014, with a 10 d temporal and 1 km spatial resolution. All pixels with an invalid LAI status were removed during quality control. Invalid LAI status refers to pixel values that do not fall within an expected range (Verger et al., 2018). Validation studies of this product showed that it underestimates ground data with a bias of 0.31 and a correlation of 0.72, while against multiple satellite datasets, it overestimates with biases ranging between 0.03 (for MODIS) to 0.36 (for GLOBCARBON) (Camacho and Cernicharo, 2014).
2.2.5 Fractional impervious cover and soil data
The fractional impervious cover is derived from the Global Man-made Impervious Surface (GMIS) dataset (Brown de Colstoun et al., 2017). It has a spatial resolution of 30 m.
Digital soil map BUEK 200 was used to estimate eleven soil parameters following Zhang et al. (2011) and Anderson et al. (2006). Land cover and soil properties were used to obtain the curve number (CN) that controls the partitioning of soil into upper and lower zones. The water allocation between tensed and free water storage is determined by soil composition. The final product has a spatial resolution of 500 m.
2.3 Validation Data
2.3.1 Stream Discharge Data
The discharge data used for validation are sourced from the Global Runoff Data Center (GRDC). Twelve upstream stations were identified from a large group of stations for validation of discharge in this work. The selection focused on upstream watersheds that have less anthropogenic influence (e.g. dams), thus representing natural processes reasonably well. Furthermore, these stations had continuous long-term discharge data, they represent different climatic zones in Germany, and they capture diverse land use and land cover types. The location of stations can be observed in Fig. 1, while their names and ID are provided in Table S3.
2.3.2 Eddy Flux ET and GPP
ET and GPP in-situ measurements were acquired from the FLUXNET2015 database (Pastorello et al., 2020). The data available is quality-controlled. The gaps within the data are filled and corrected following standardised FLUXNET2015 procedures, which apply algorithms to ensure temporal continuity and consistent flux measurements. Furthermore, the energy balance closure correction factors (EBC_CF) were used to correct these datasets. The EBC_CF were estimated using three different methods, each assuming that the Bowen ratio holds true. In this study, monthly latent heat turbulent flux (LE) was converted to ET with and without energy closure corrections and GPP was calculated using the daytime partitioning method (Pastorello et al., 2020).
2.3.3 MODIS ET and GPP Data
The MODIS ET product MOD16A2GF is employed in this work (Running et al., 2019b). The remote sensing data is used to compare the spatial variation of model output. MODIS has a spatial resolution of 500 m and a temporal resolution of 8 d. The ET estimation follows the Penman-Monteith equation (Running et al., 2019b). The product has been comprehensively validated in multiple studies (Kim et al., 2012; Liu et al., 2015; Trambauer et al., 2014; Velpuri et al., 2013) and used to evaluate the output of hydrological models (Sun et al., 2011). This study used a monthly sum of ET values and spatial average calculated on a sub-watershed scale.
The gap-filled GPP product employed in this study is MOD17A2HGF, with a spatial resolution of 500 m and a temporal resolution of 8 d (Running et al., 2019a). It follows Monteith's logic and uses land cover specific light use efficiency (ε), fraction of absorbed photosynthetically active radiation (FPAR), incident photosynthetically active radiation (IPAR), the deficit of vapor pressure, and minimum air temperature (Running et al., 2019a). Insights on the application and validation of MODIS-GPP are provided in multiple studies (Liu et al., 2015; Sun et al., 2011; Turner et al., 2006; Wang et al., 2017; Zhu et al., 2018).
CGLS GPP are derived from the Gross Dry Matter Productivity (GDMP) values (Smets et al., 2019). We used the version 2 product from SPOT/VGT and PROBA-V satellites to evaluate the model GPP estimates for the period of 2001–2019. The GDMP product has a spatial and temporal resolution of 1 km and 10 d. It represents the additional gross dry biomass stored in vegetation, which could be converted into gross carbon uptake by multiplying it with a scaling factor of 0.45 g C g DM−1 (Smets et al., 2019):
3.1 Model Validation
3.1.1 Discharge Validation
The hydrograph plots, ordered by decreasing watershed area, reveal that the model, in general, is able to simulate the monthly flows reasonably well (Fig. 2). Furthermore, the model discharge validated on a monthly scale gives KGE for eight out of the twelve watersheds above 0.5 and NSE for six out of twelve watersheds greater than 0.6, as shown in Table S3. While on an annual scale the values of model bias (%) for eleven out of the twelve stations are between −25 % to 25 % and for R2 ten out of twelve stations are above 0.60, as presented in Table S4. The model also performs reasonably well during dry-hot and wet-cold years, as shown in Table S4. The scatter plot between modelled and observed discharge, across the twelve watersheds on both annual and monthly scales, is presented in Fig. S1 in the Supplement. The plot shows high correlation between the two datasets suggesting the model performs reasonably well. Except for the Wasserthaleben station, where the model performance is weak with bias equal to 131.8 % and annual R2 of 0.18.
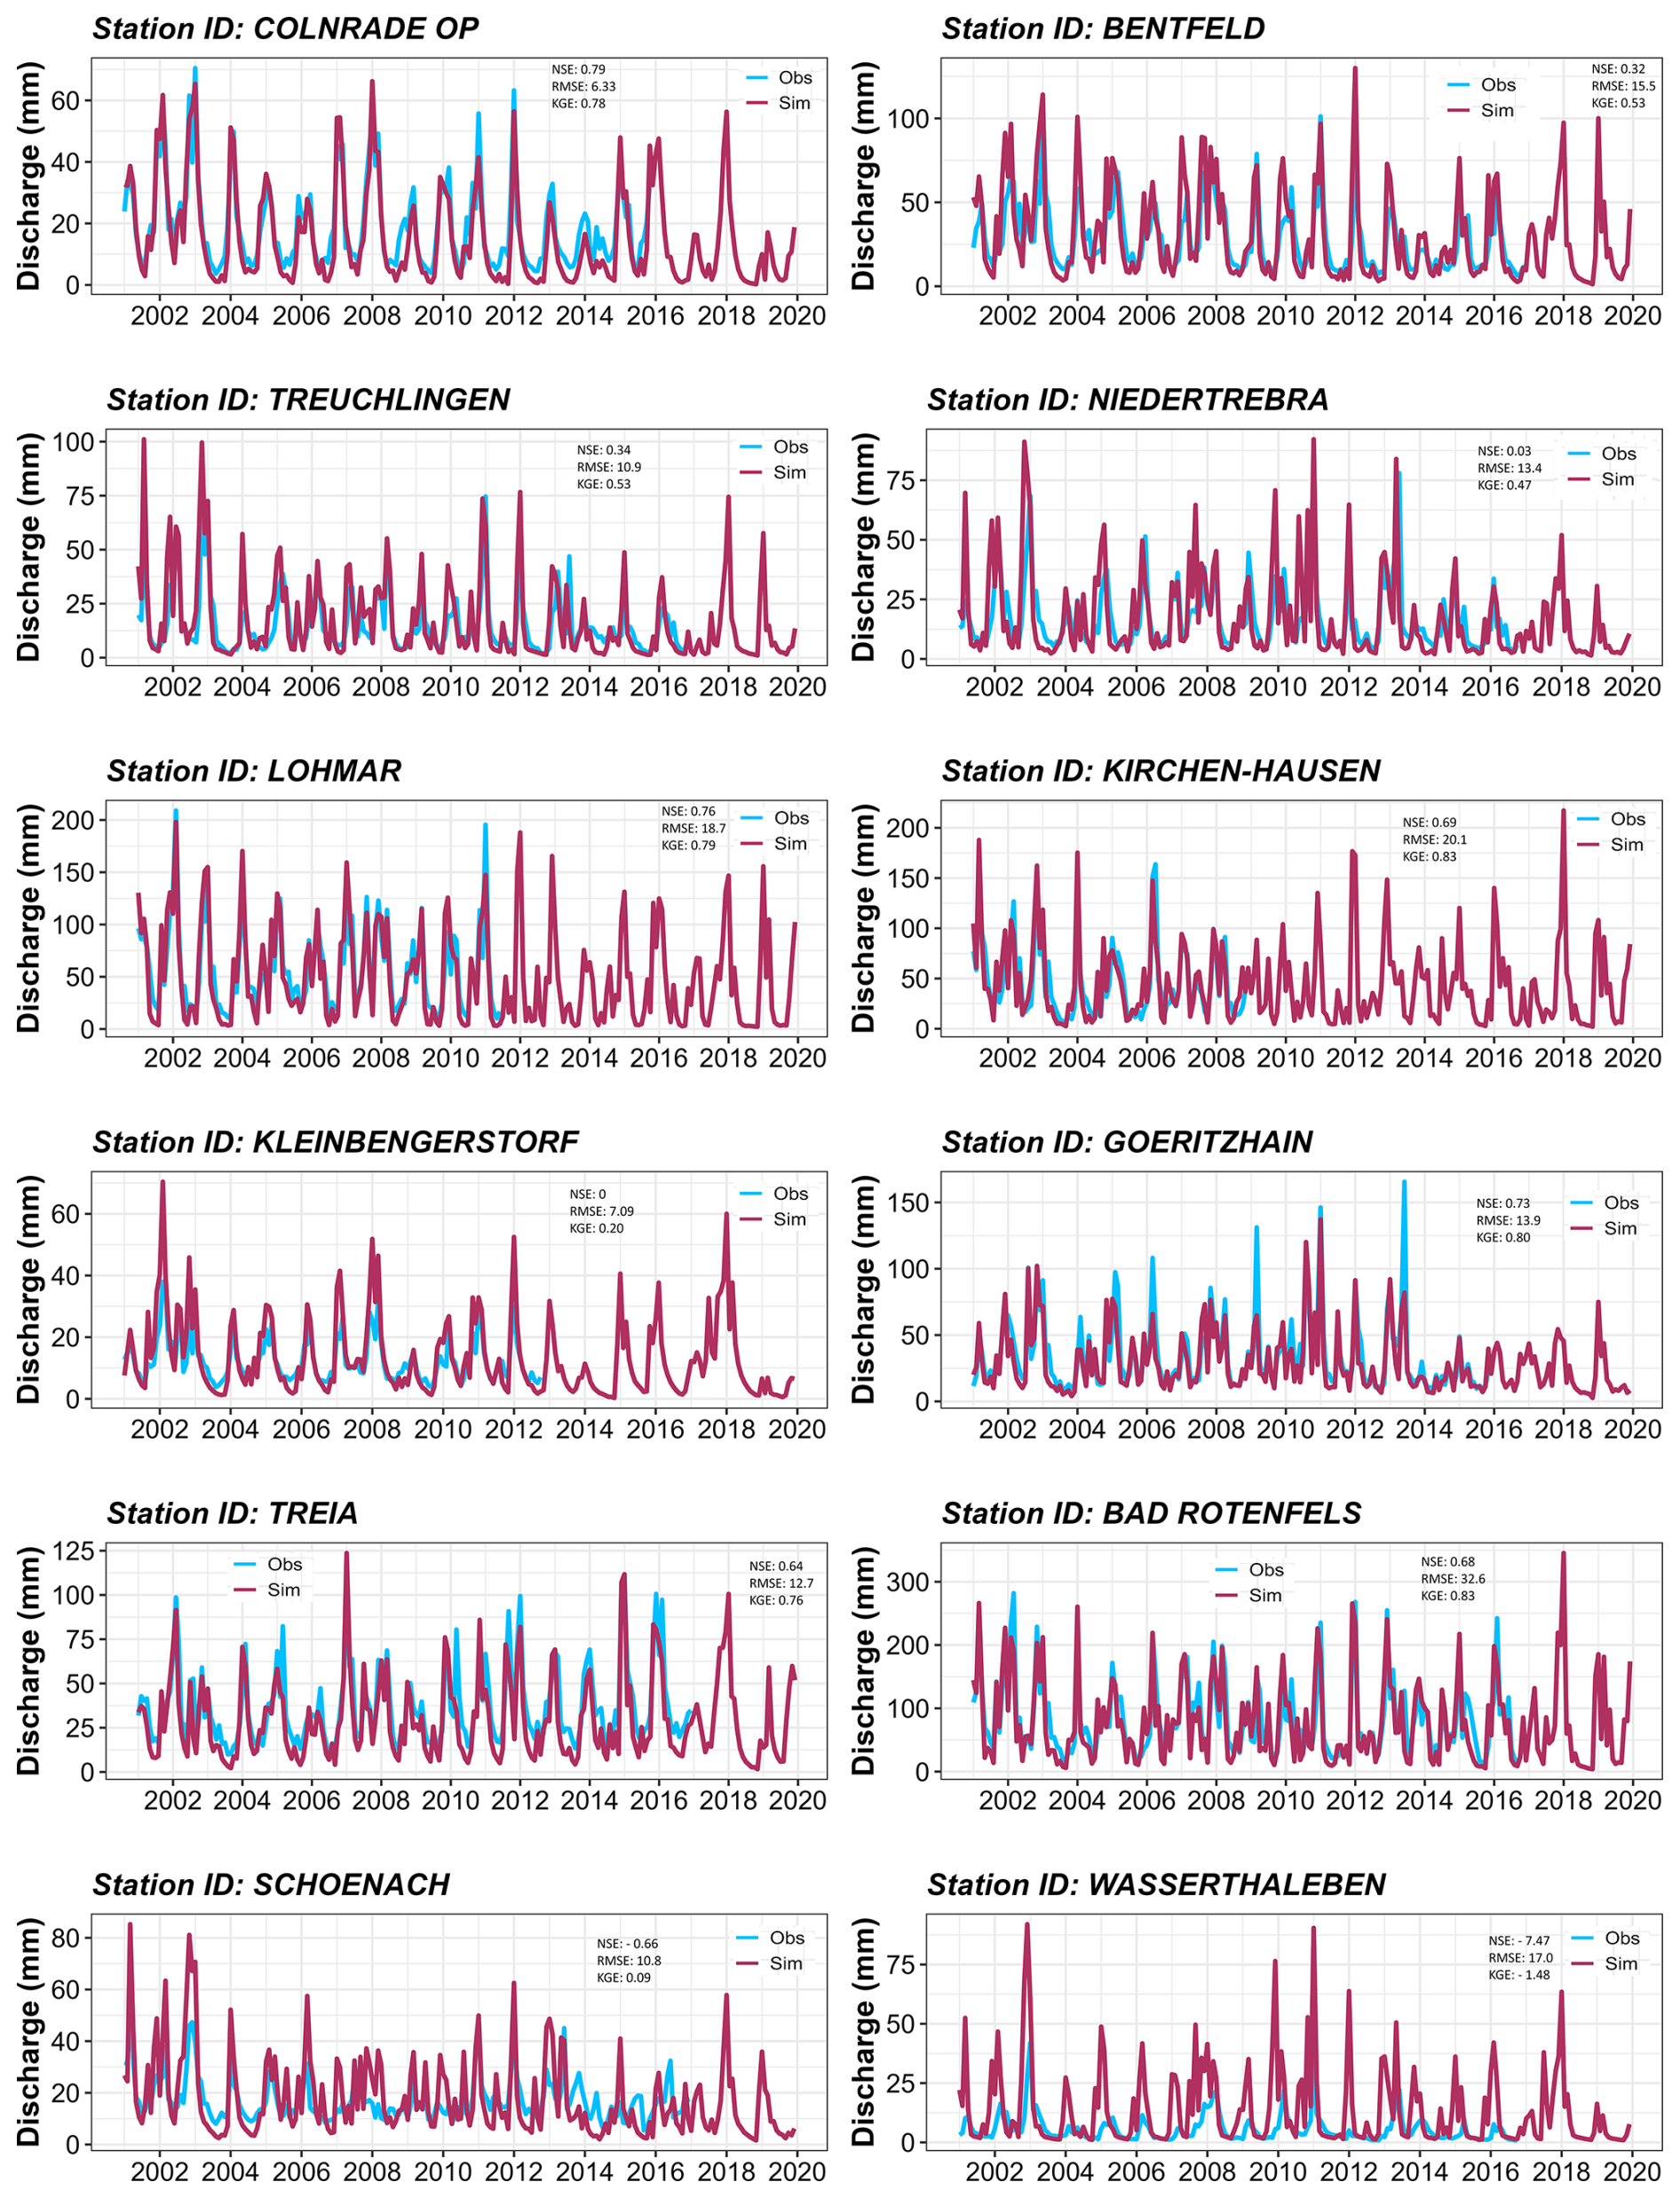
Figure 2Monthly discharge time series from WaSSI simulation in mm (maroon) plotted against observed gauge station flow in mm (blue) during 2000–2020. The panels are arranged based on the corresponding watershed area, starting from the largest to the smallest.
3.1.2 ET Validation
Monthly land cover specific validation of simulated ET against EC ET is presented in Fig. 3. The ET estimates are captured reasonably well by the model as the points in the scatter plot generally stayed close to the 1:1 line except for Grassland. The detailed validation results are provided in Table S5. Ten out of eleven watersheds have an R2 value > 0.6 and a correlation >0.75. Seven out of eleven watersheds have a model bias (%) between −25 % to 25 %, and KGE estimate ≥0.6. Discrepancies are found in Lackenberg station with a bias of 52.4 %, and in general we observed that WaSSI model tends to slightly overestimate ET during winter. Overall, the model is able to capture ET values reasonably well across different land covers within Germany (Fig. S2a).
WaSSI ET on an interannual scale showed that it can satisfactorily simulate the variability of ET captured by MODIS across Germany, as shown in Fig. S2b–c. The model mostly underestimated ET in southern and northwestern Germany, while slightly overestimating the ET in mid-western and eastern Germany. When the simulated ET is assessed against ET estimates as precipitation minus observed discharge (P−Qobserved) interannually, the mean annual biases for all the twelve watersheds are within ±25 % threshold. Eight out of the twelve watersheds have biases within ±10 %, indicating a very good model performance (Table S6).
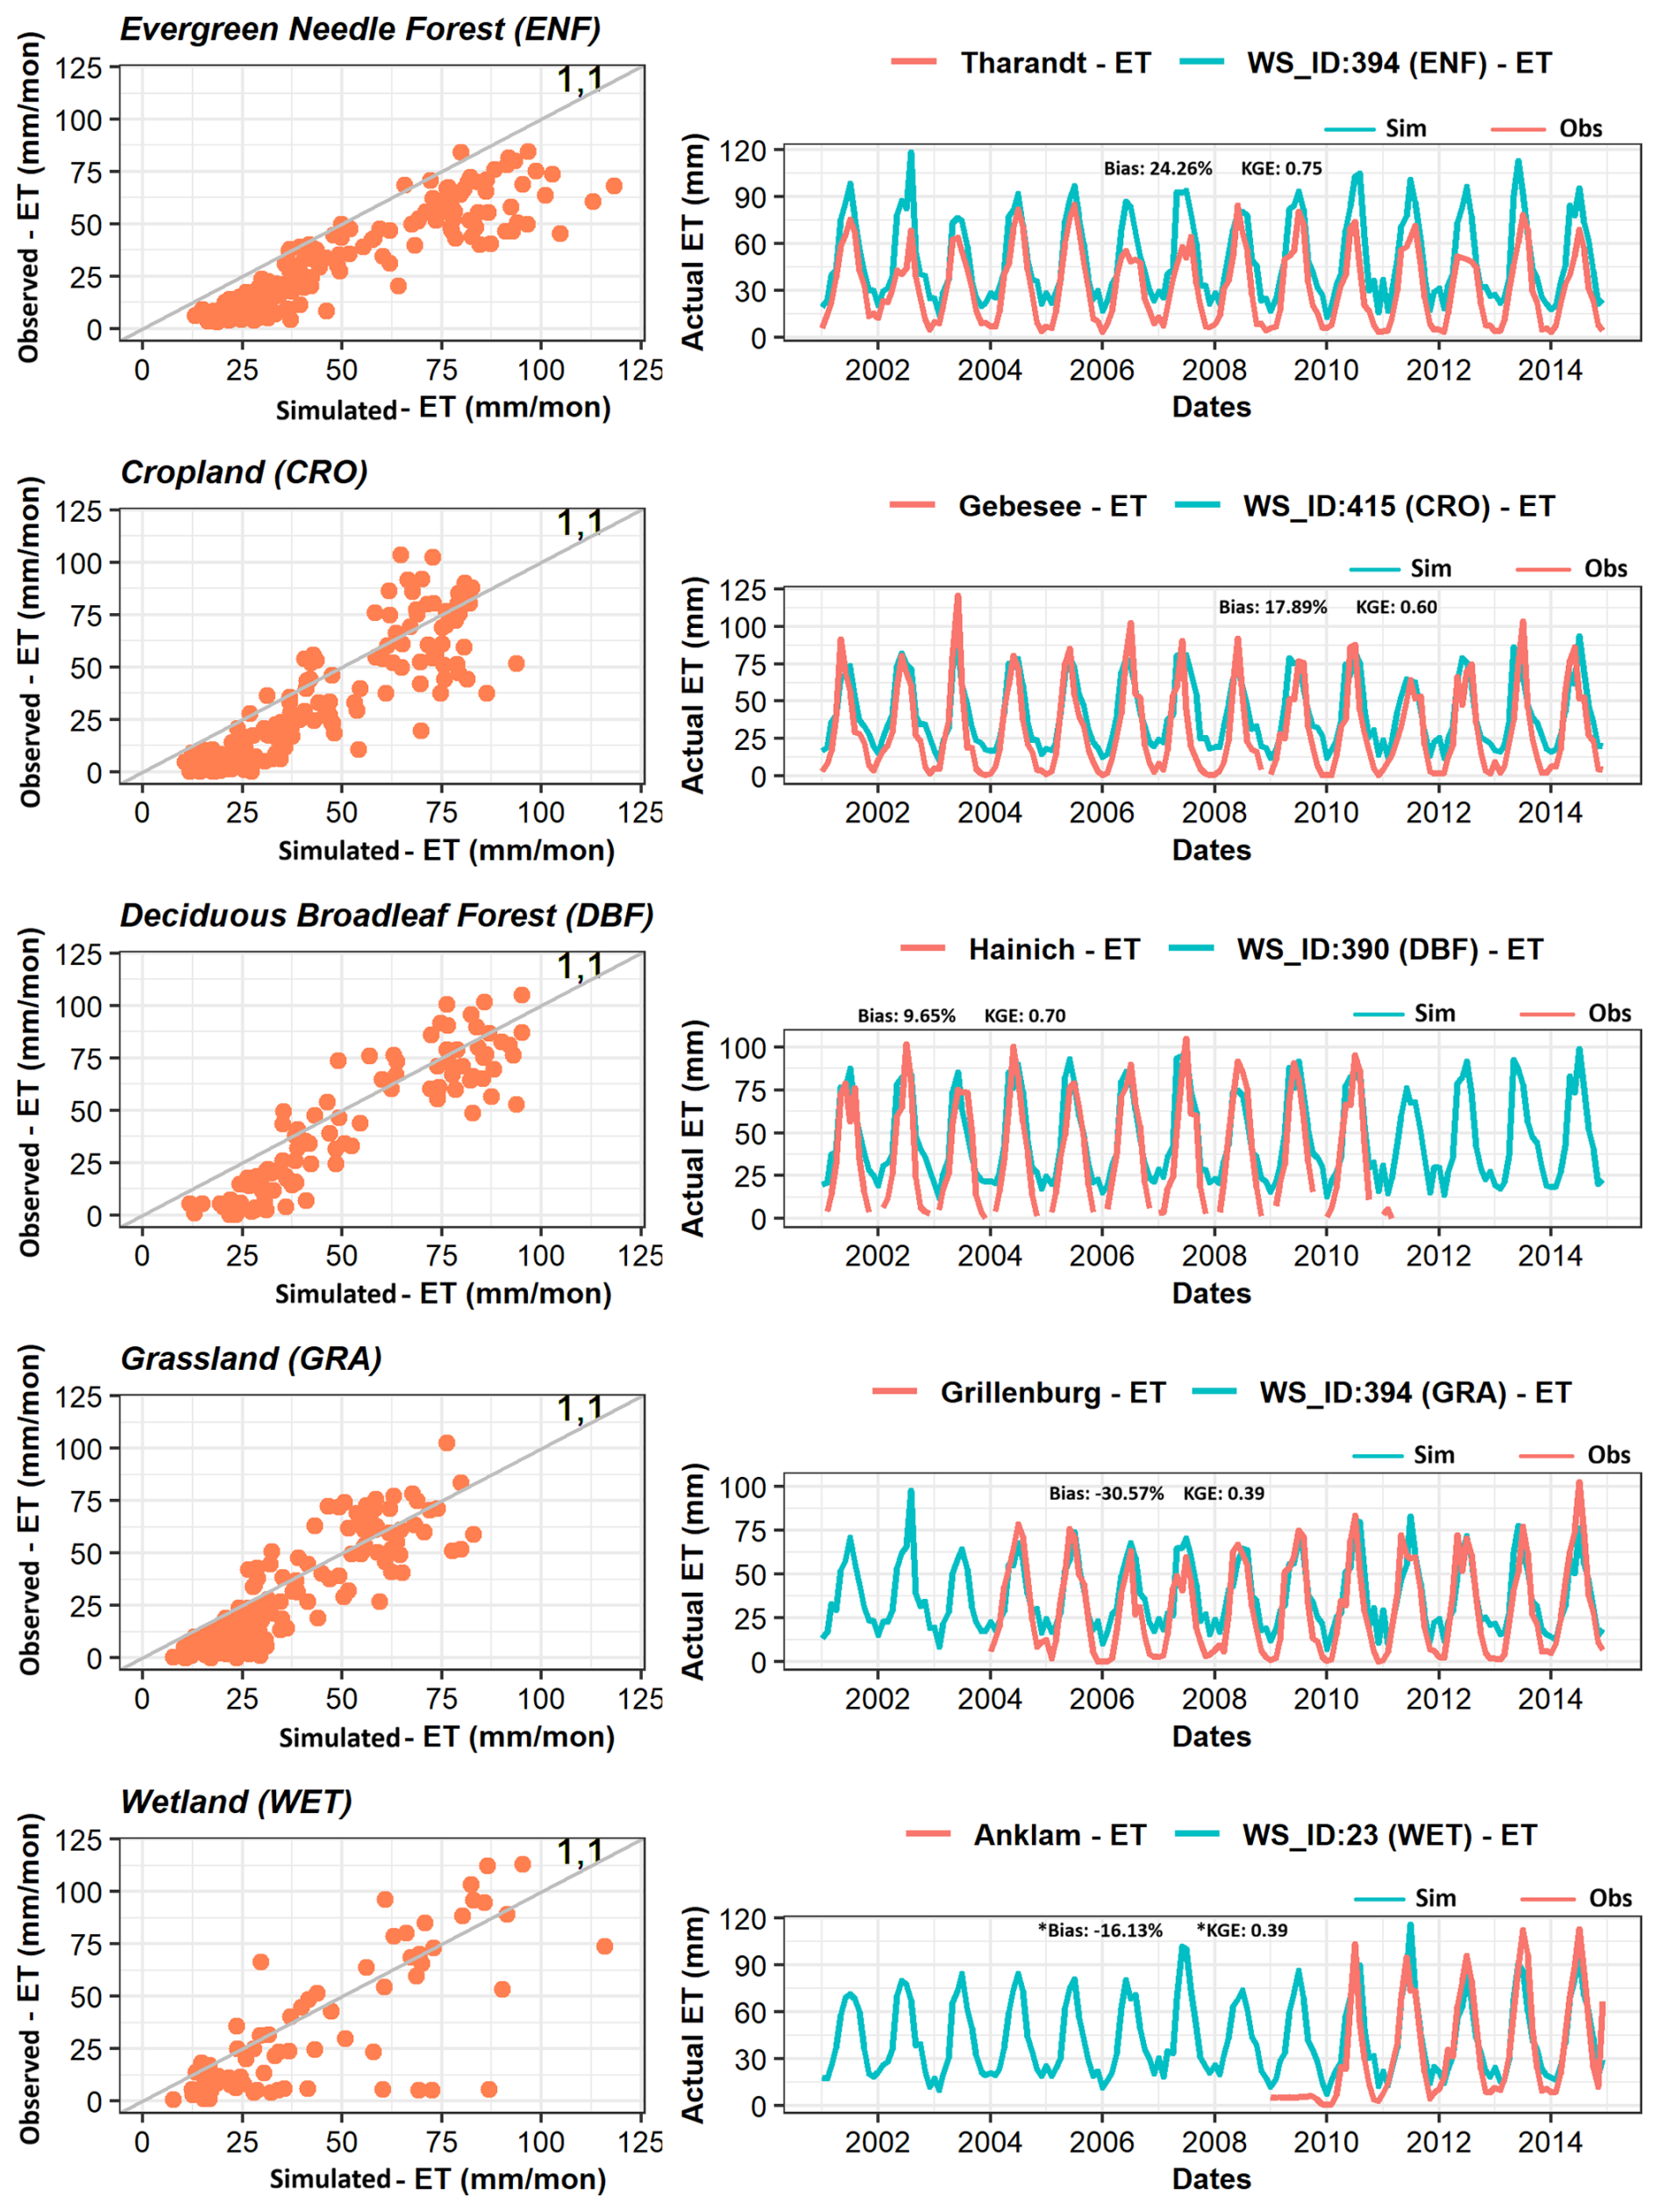
Figure 3Land cover specific simulated ET validation (WS_ID) against corrected eddy flux ET data. The line running diagonally through the scatter plot is a 1:1 line. The performance metrics provided were calculated using corrected ET for all stations except for Anklam (wetland).
3.1.3 GPP Validation
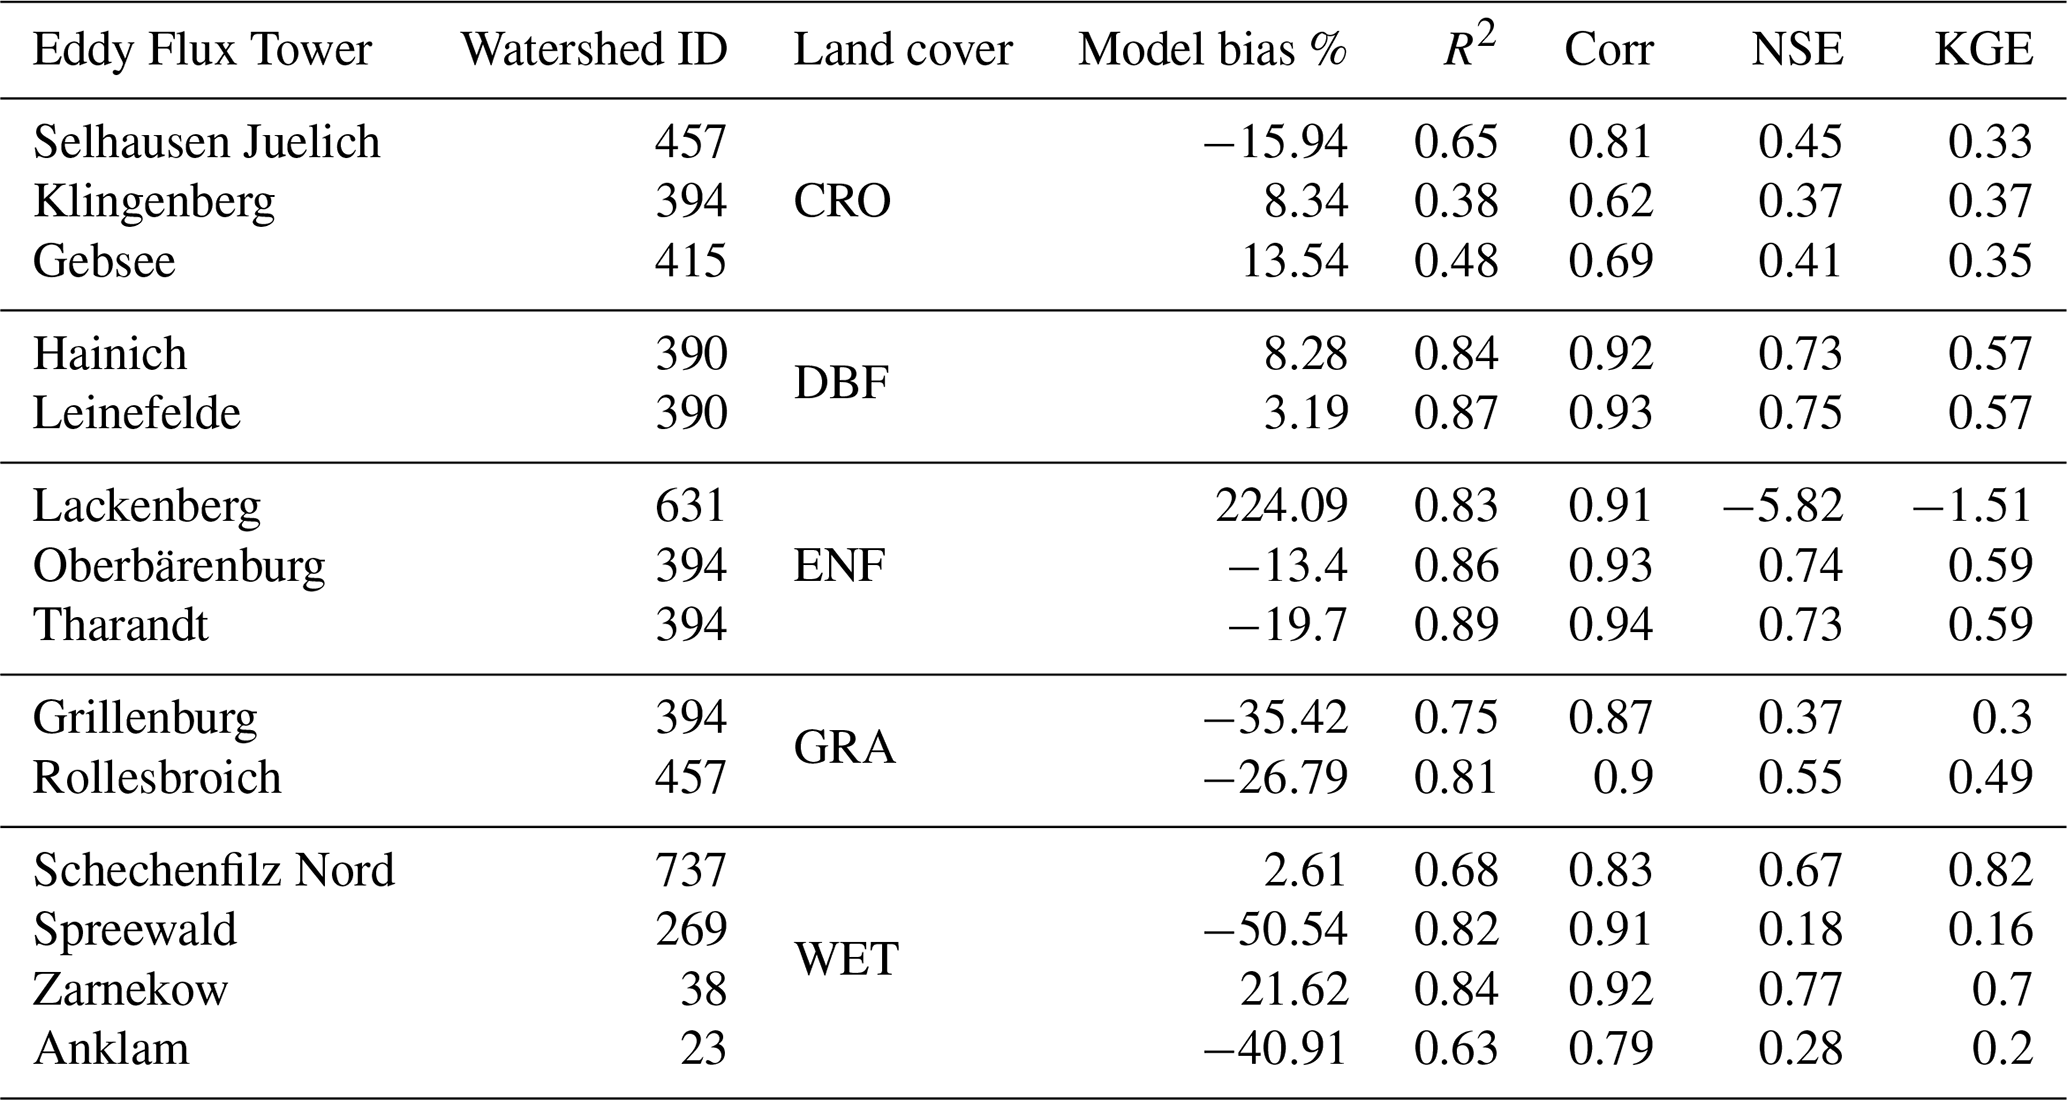
The results showed that nine out of fourteen watersheds have a model bias within ±25 %, twelve had R2>0.6, seven had NSE >0.5, six have KGE >0.5, and all the watersheds have a correlation >0.6, as shown in Table 1. Furthermore, the results show that simulated GPP from WaSSI are higher compared to the remotely sensed GPP estimates from Copernicus and MODIS satellite by approximately 7 % and 16 %, respectively. The difference, correlation and regression between simulated GPP and remotely sensed GPP is shown in Fig. S3.
Table 1Monthly validation of WaSSI-GPP against EC-GPP. Stations are grouped for different land covers e.g. cropland (CRO), deciduous broadleaf forest (DBF), ENF, grassland (GRA) and wetland (WET).
3.2 Understanding the water-carbon coupling across Germany
3.2.1 Spatial variation of ET from 2001–2019
Over a nineteen-year period, the mean annual ET across Germany ranges between 250 to 800 mm yr−1 and has a spatial mean and standard deviation of 530±49.5 mm yr−1. Eastern Germany (Saxony Anhalt, Brandenburg, Mecklenburg Vorpommern, Saxony, and Thuringia) have lower ET than the spatial mean, while the South and West has higher ET, as shown in Fig. 4a. On an annual scale, Bavaria and Lower Saxony experiences significant ET losses. The absolute losses are 39.5 billion m3 yr−1 in Bavaria and 25.7 billion m3 yr−1 in Lower Saxony. Bavaria has a smaller fraction of its precipitation lost as ET (0.3 to 0.9) compared to Lower Saxony (0.5 to 0.9). Across Germany, the eastern states lost the largest share of their precipitation as ET (0.8–1.0), leading to a very limited available water supply in the region, shown in Fig. 4b. Furthermore, to understand whether ET is limited by energy or water availability, we estimated ET:PET ratio across Germany. PET is the atmospheric evaporative demand under ideal conditions (i.e., no soil water stress) and acts as an upper limit of ET. The actual ET of watersheds near the Alps exceeds the PET due to high precipitation, saturated soils and land cover type. These watersheds receive more precipitation compared to the rest therefore energy limits the ET values, while for the rest parts of Germany the water availability limits ET (Fig. 4c). Lastly, eastern states and some watersheds in Rhineland-Pfalz and Hessen are drier with relatively high-water scarcity as they receive less precipitation compared to their PET (Fig. 4d).
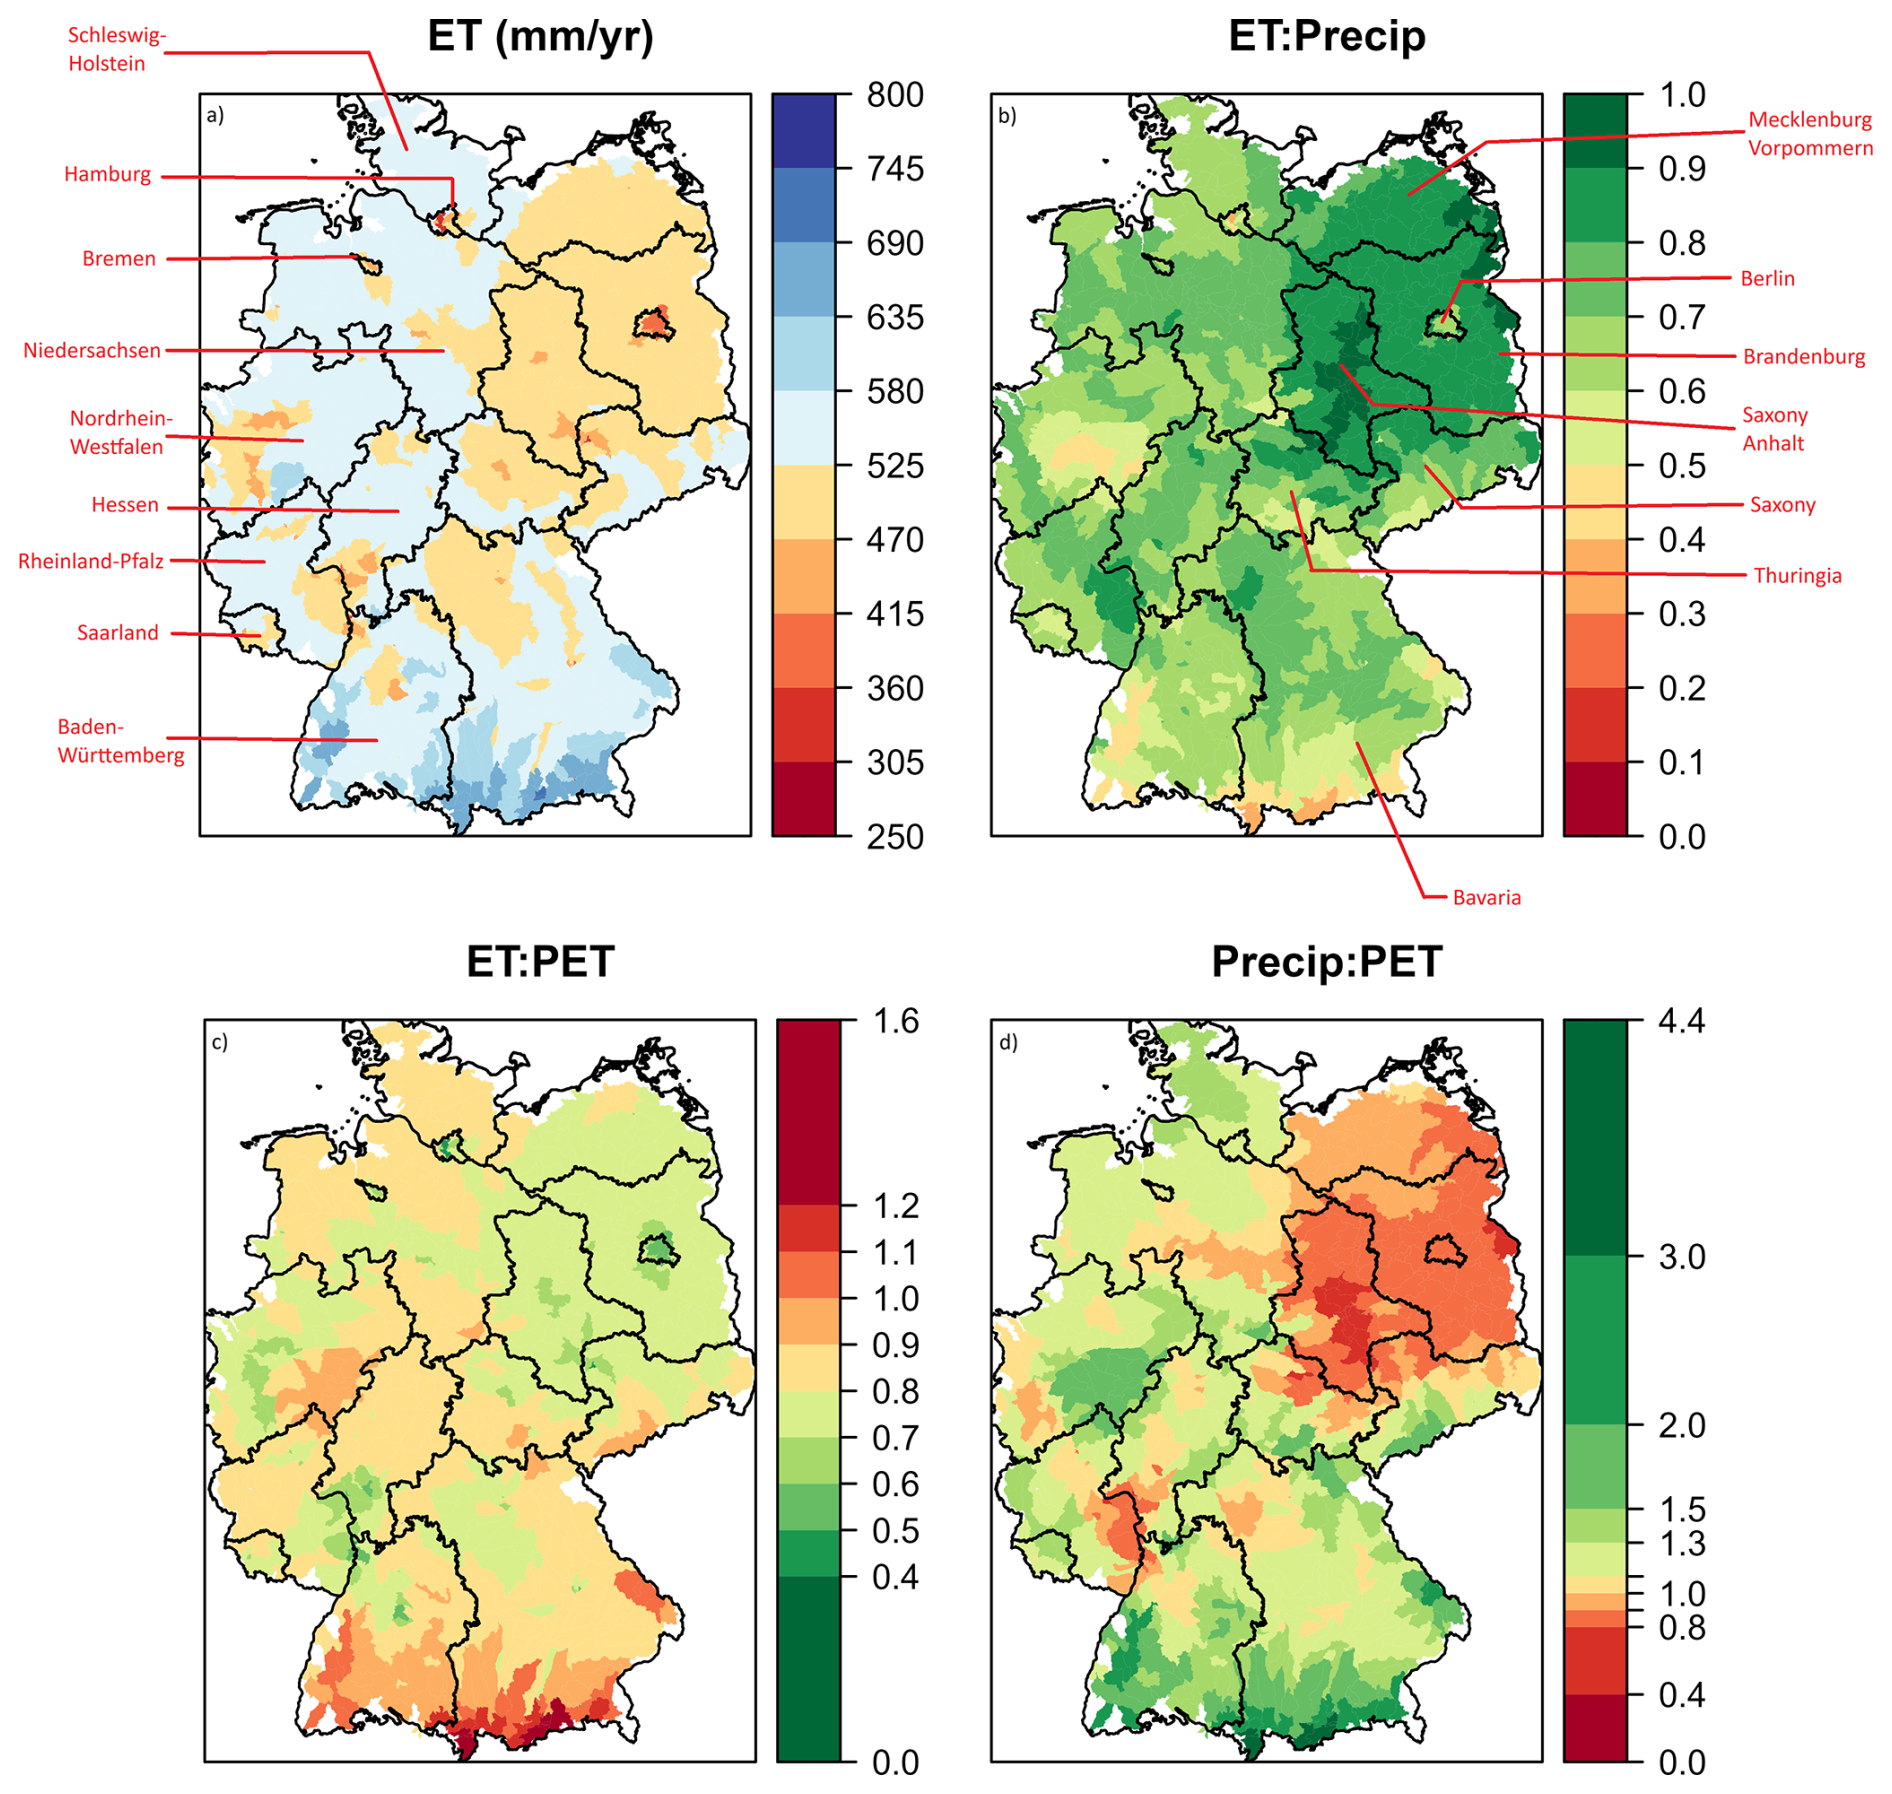
Figure 4Modelled parameters presenting ET dynamics on a watershed scale across Germany over state boundaries within the period of 2001–2019. The separate sections show (a) mean annual actual ET (mm yr−1), (b) ratios between ET and precipitation, (c) ratios between ET and potential ET and (d) ratios between precipitation and potential ET.
3.2.2 Ecosystem services across Germany throughout 2001–2019
The mean annual water yield across Germany ranges between 31.8–1477.5 mm yr−1, has a spatial average of 259±173.5 mm yr−1 and generates a total discharge of 84.86 billion m3 yr−1 (Fig. 5a). In eastern states the water yield is lower than the spatial average, while in southern states it is higher. The mean annual GPP estimates (Fig. 5b) are found between 0–2046.5 with a spatial average of 1278.8±237.7 and a total national carbon uptake of 441.54 Tg C yr−1. The mean annual NEP values (Fig. 5c) are observed between 0–665.5 with a spatial average of 308.3±78.2 and a total national carbon sequestration of 106.03 Tg C yr−1.
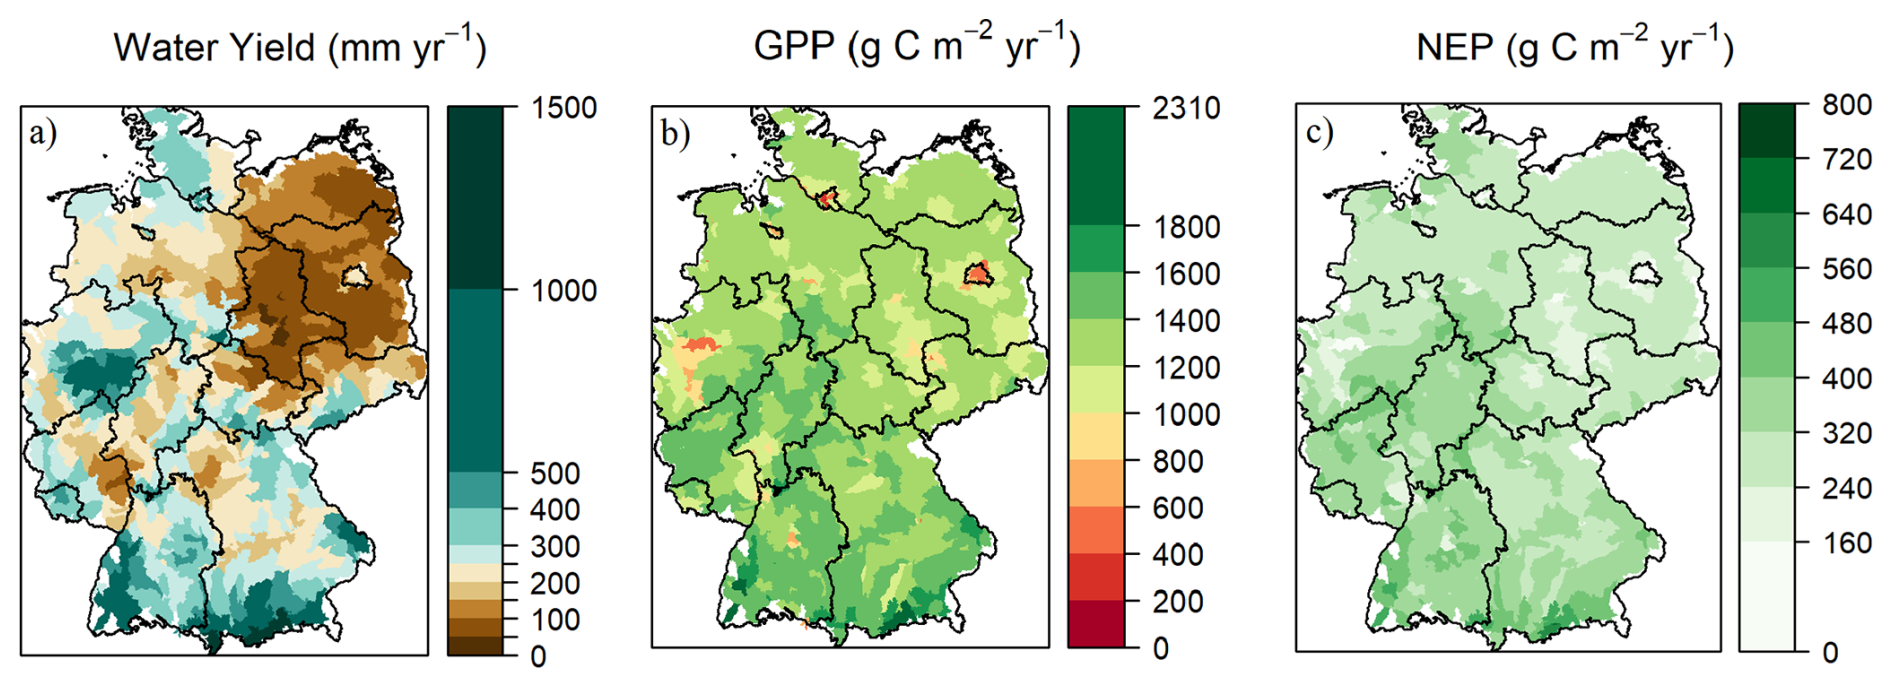
Figure 5Spatial distribution of model simulated (a) mean annual total water yield (mm yr−1), (b) mean annual GPP (), and (c) mean annual NEP ().
3.2.3 Temporal variability of ecosystem services and the control of land cover on these services
The mean annual precipitation for the period 2001–2019 is estimated at 779±106.2 mm yr−1. Notably, 2002 and 2007 are identified as the two wettest years within this timeframe. Precipitation in 2002 exceeded the mean by 30.2 %, while in 2007 it was 24 % higher than the mean. Conversely, the driest years are 2003 and 2018, with rainfall falling below the mean by 22.7 % and 25.5 %, respectively. There are relatively high variations in Q and NEP during these wet and dry years, indicating that these two fluxes are sensitive to changes in precipitation compared to ET and GPP. In 2018, which is the driest year in the study period, we observed that compared to the mean there is 25.5 % less precipitation. This is accompanied by 11.7 % less ET, a 26.8 % reduction in Q, 11.7 % less GPP and 24.7 % lower NEP. Alternatively, during 2002, the wettest year in our study, we found 30.2 % more precipitation compared to mean. Which may have lead to 7.4 % more in ET, 73.4 % higher Q, 7.3 % more GPP, and 15.5 % rise in NEP, relative to mean. An annual overview for temporal variation is presented in Fig. 6.
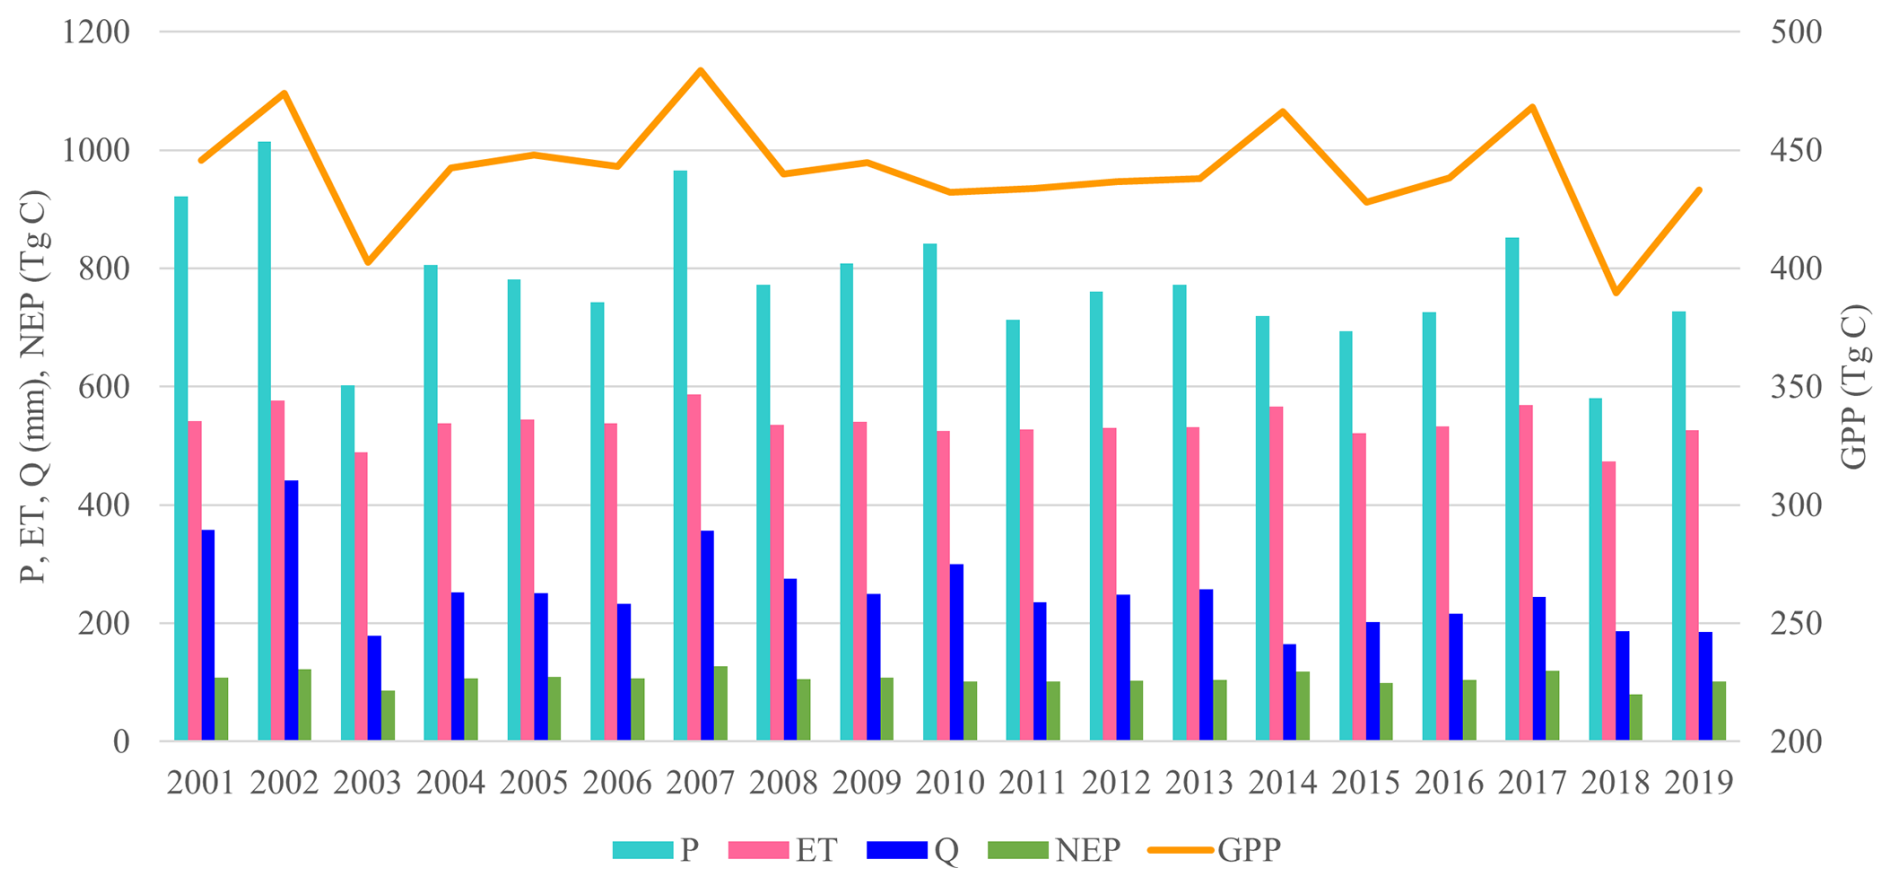
Figure 6Simulated annual ecosystem fluxes evapotranspiration ET (mm), Net ecosystem productivity NEP (Tg C), Gross Primary Productivity GPP (Tg C), discharge Q (mm) and precipitation P (mm) across Germany simulated by the model during 2001–2019.
To evaluate the role of land cover in water yield and carbon sequestration, we estimated the share of ecosystem services provided by the ten different land cover classes. The most essential land covers that provide the largest share of water across Germany are Cropland (52.1 %), ENF (16.7 %), and Urban (13.7 %); they supply 82.5 % of the water in total. Furthermore, forest sequester most of the carbon DBF (25.3 %), mixed forest (MF) (16.3 %), and ENF (14.7 %). They contribute 56.3 % of carbon sequestered in Germany while only accounting for 30.5 % of the land cover. Lastly, we would like to highlight that a small portion of land covers, such as wetlands, open shrubland, closed shrubland, and grasslands cover less than 2 % of German territory; however, they regulate >30 % of the total carbon sequestered in Germany, indicating the high importance of conserving these ecosystems, as shown in Fig. 7.
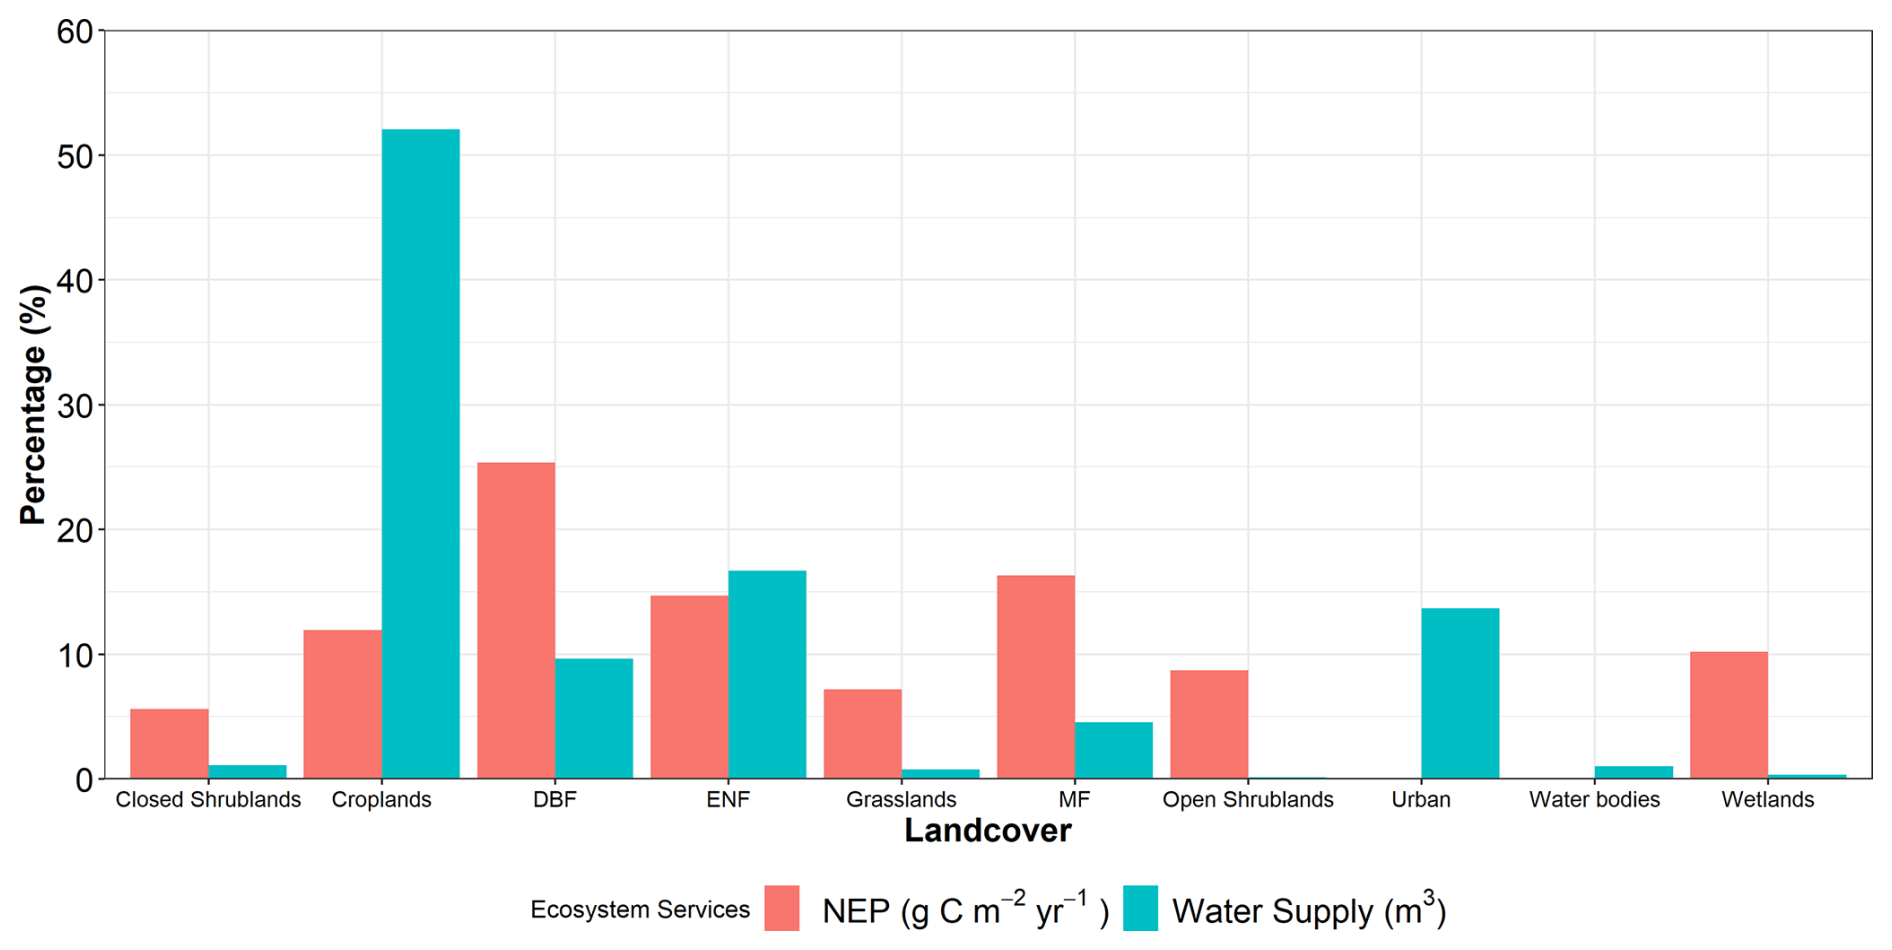
Figure 7Simulated mean percentage or share of carbon sequestration and water supply originating from different land covers across Germany.
3.2.4 Spatial variability of ecosystem services during extreme weather events
To understand the impact of droughts and extreme precipitation on ecosystem services, we examined the droughts for the year 2003 and 2018 and the extremely wet years 2002 and 2013. During 2003, precipitation was 22.7 % less than its average and only western states had close to average precipitation. The total water yield was 29.6 % less than average. The carbon sequestration was 18.5 % lower than average. While western states had close to average carbon sequestration the rest experienced significantly reduced levels. Compared to 2003, the pattern and intensity of the 2018 drought was more severe. During this event, Germany cumulatively received 25.5 % less precipitation, had a 26.8 % lower water yield, and had 24.7 % less carbon sequestration. The total water yield was 62.13 billion m3, total carbon uptake was 389.77 Tg C, and total carbon sequestration was 79.82 Tg C. The variations in ecosystem services due to both drought events are presented in Fig. 8. On the other hand, during the extremely wet year of 2002, Germany received 30 % more precipitation than annual mean. The water yield and carbon sequestration were 70 % and 15.5 % higher than the mean, respectively. The second wet year of 2013 suffered from severe regional floods. The regions that received higher precipitation had a larger water yield and sequestered more carbon. Interestingly, northwest Germany was drier than the mean, as a result, the overall ecosystem services for 2013 were close to the mean estimates. The variations in ecosystem services during both years are presented in Fig. 9. Similar patterns were observed in the standardized anomaly plots presented in Figs. S4 and S5.
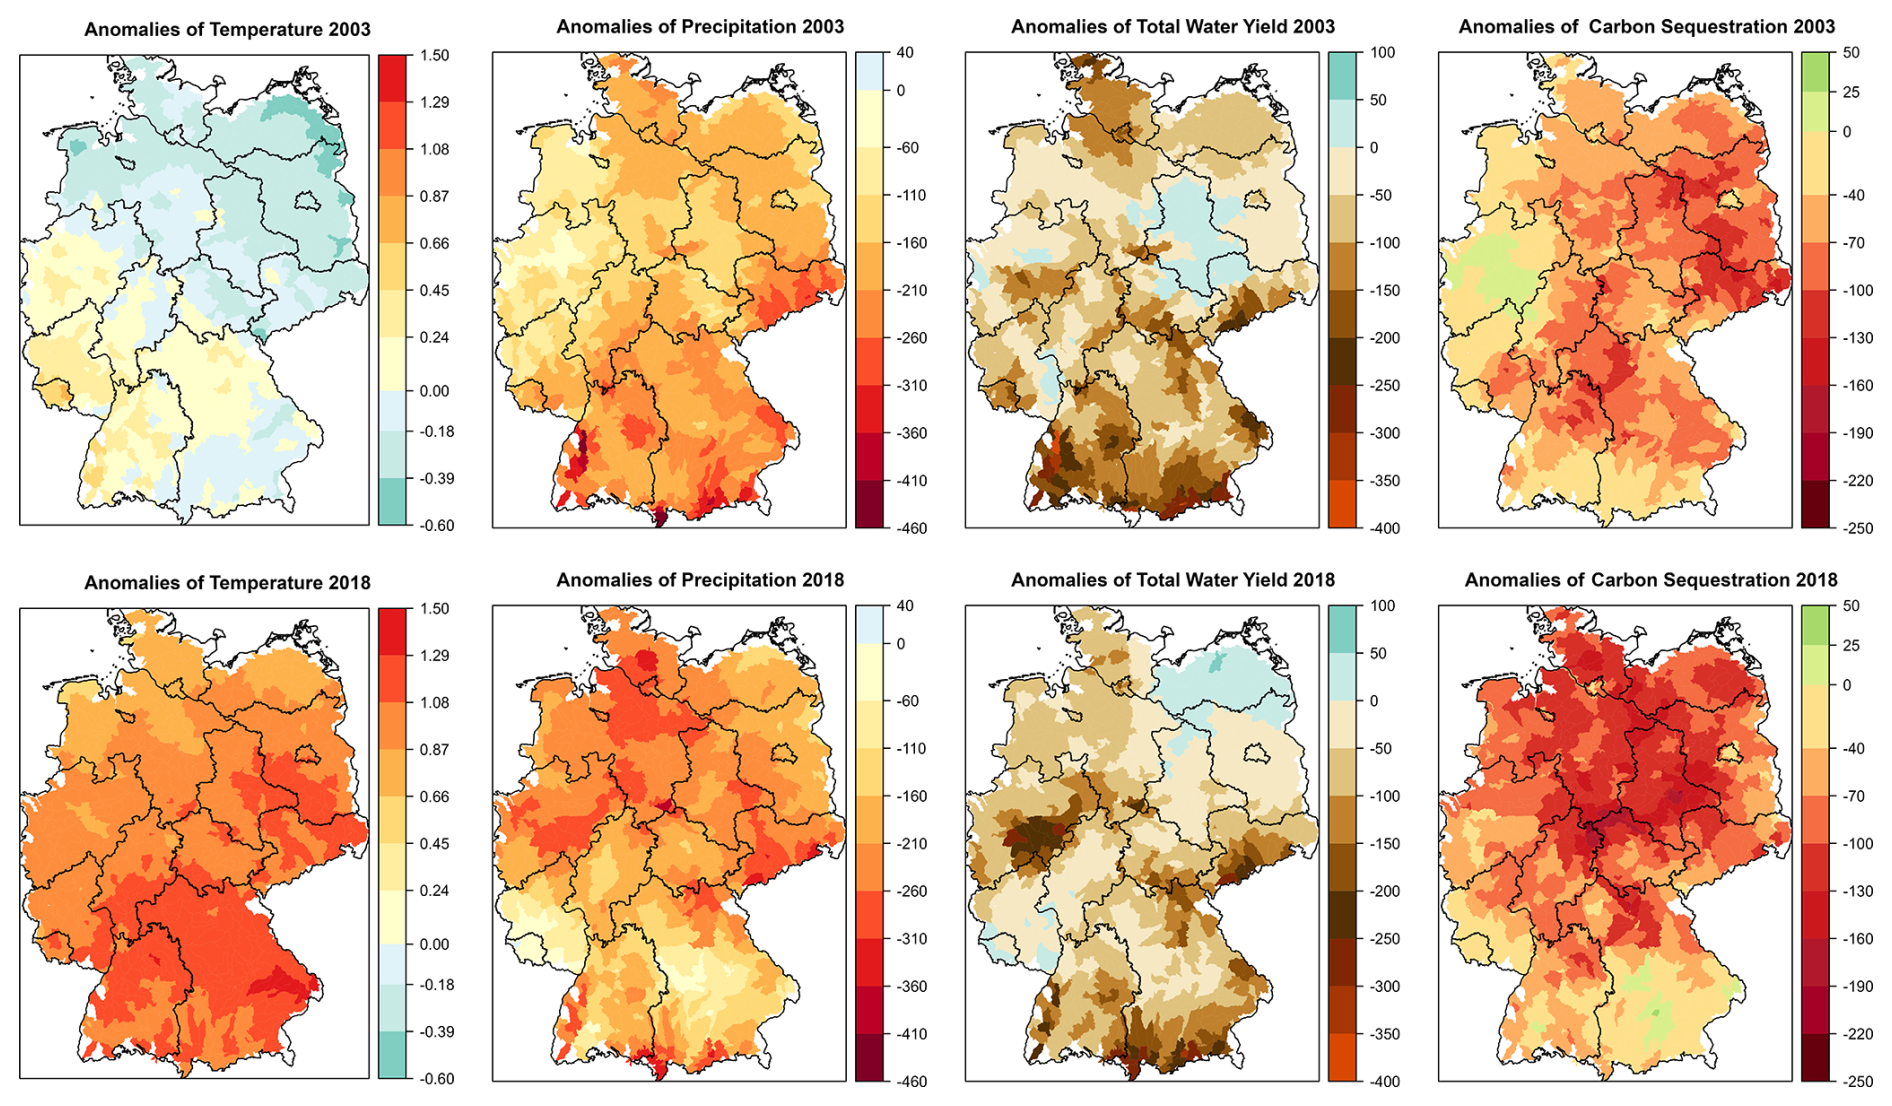
Figure 8The response of ecosystem services, water yield (mm) and carbon sequestration (g C m−2), during two drought events (2003 and 2018). Both drought events had different spatial patterns and intensities, thus the response from the ecosystem varied spatially. The anomalies in the figure were estimated by subtracting the mean annual values for the period 2001–2019 from the estimates of the individual drought years 2003 and 2018 on a watershed scale. The temperature anomalies (°C) are also provided for understanding the events.
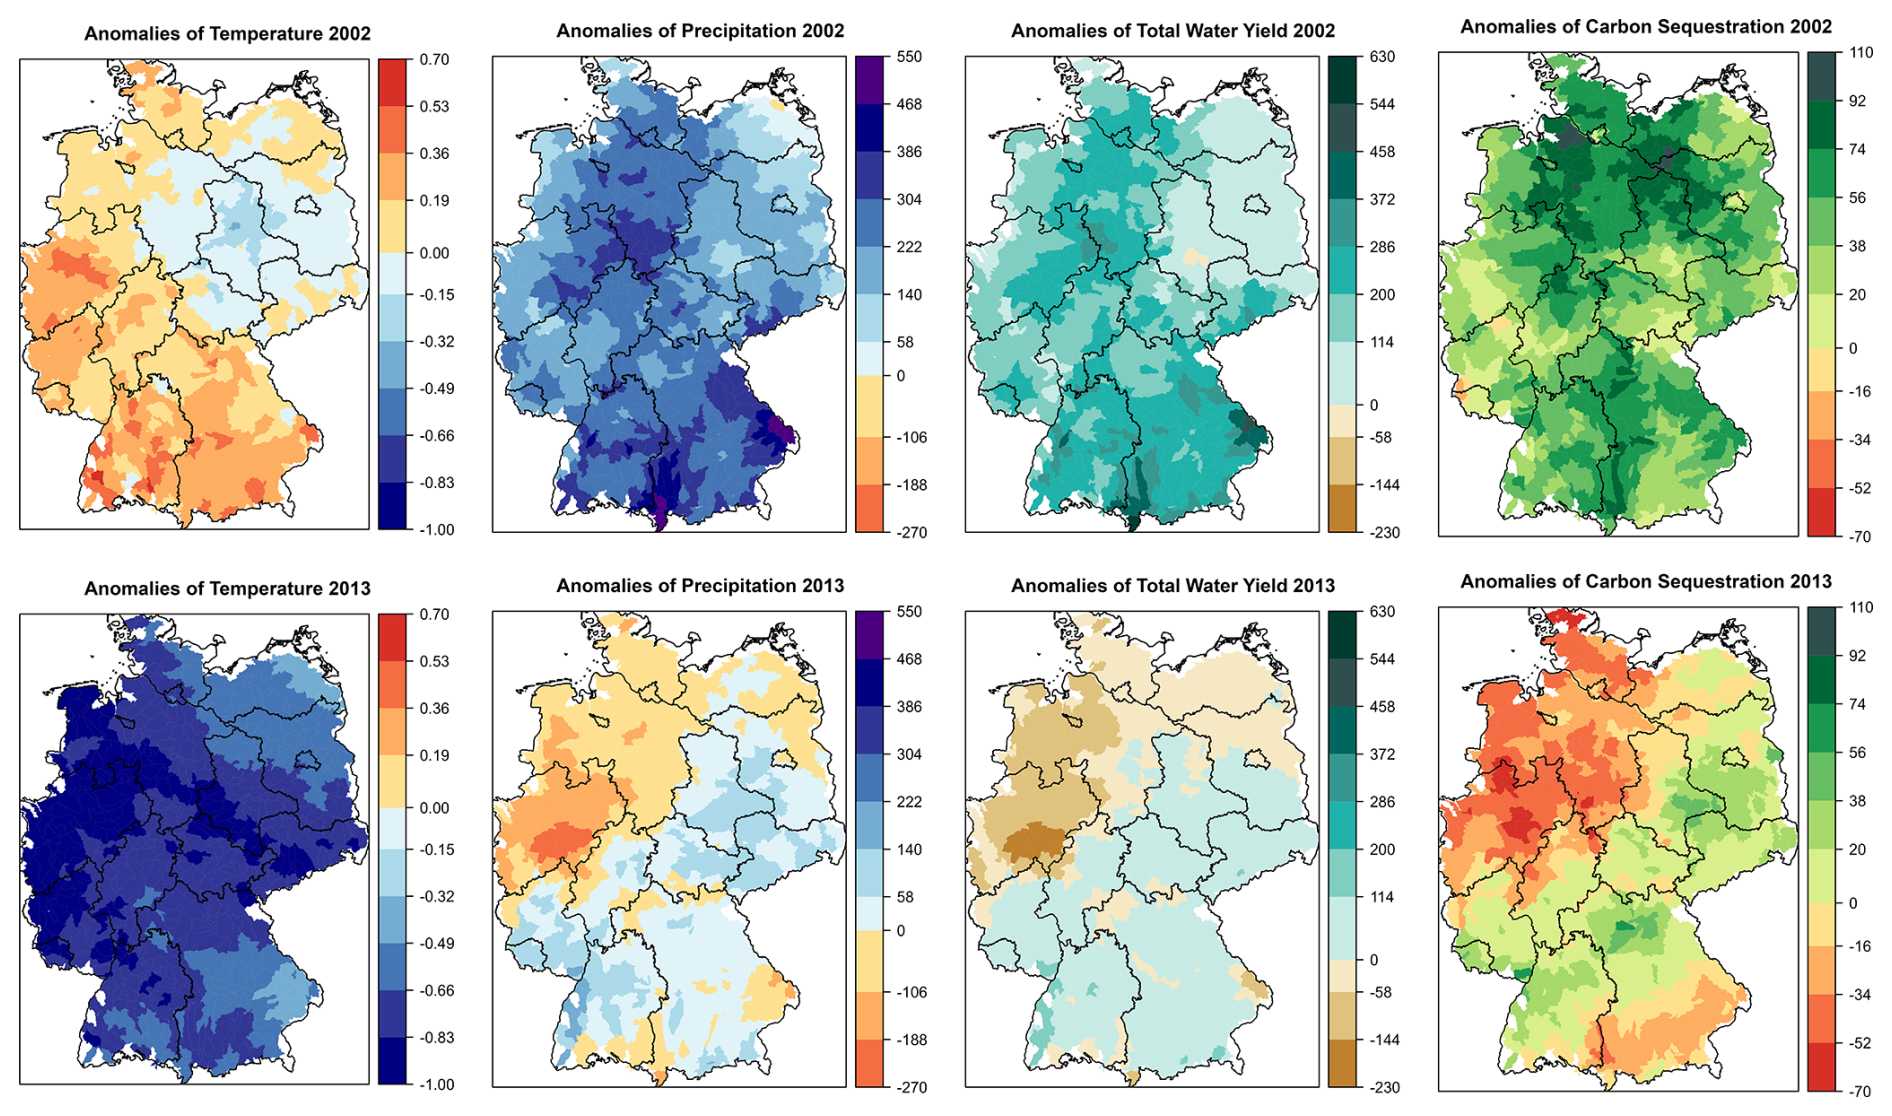
Figure 9The response of ecosystem services, water yield (mm) and carbon sequestration (g C m−2), during two extreme precipitation events (2002 and 2013). Both events had different spatial patterns and intensities, thus the response from the ecosystem varied spatially. The anomalies in the figure were estimated by subtracting the mean annual values for the period 2001–2019 from the estimates of the individual years 2002 and 2013 on a watershed scale. The temperature anomalies (°C) are also provided for understanding the events.
This study explores the response of water-carbon cycle to land cover and extreme events across Germany on watershed scale. The WaSSI model performs reasonably well in this region and is estimated to generate 84.86 billion m3 of discharge and 106.03 Tg C of carbon sequestration per year. The results (Fig. 7) also highlight the importance of sparse landcovers (e.g. wetlands, open shrubland, closed shrubland, and grasslands) in regulating carbon sequestration. Furthermore, the study shows that ecosystem services are quite sensitive to droughts and extreme precipitation events, but buffers developed from the previous year can play a significant role in mitigating this effect. As shown in Fig. 8, we observe low but positive water yield anomalies during drought years in parts of Germany. Buffers can help delay the onset of hydrological droughts in the region.
The model validation results successfully demonstrate that the model can be applied across Germany. Furthermore, due to the common climatic and hydrological regime, we believe the model can potentially be applied to a broader central European region. The simulated discharge had small model bias percentage and high regression values. Furthermore, the spatial and temporal variability of the discharge was modelled reasonably well with high NSE, KGE, R2, and low P-bias for most watersheds (Tables S3–S4). Except for station Wasserthaleben, which had very high flow values leading to a P-bias equal to 131.8 %, KGE of −1.48, and annual R2 of 0.18. The poor performance of this individual station could be attributed to several possible reasons, including its relatively small surface area, the uncertainty of input data (soil parameters or climate data), underestimation of losses to groundwater, simplification of physical processes that estimate surface runoff, or the presence of prevalent unidentified dams in the watershed (Caldwell et al., 2012). Simulated ET validated reasonably well against data from different eddy flux towers across the study area (Fig. 3). The largest discrepancy was found in Lackenberg station. Even though corrected ET values are used for validation, there might be uncertainties in correction factor (Pastorello et al., 2020) and inaccuracies in the observed data due to energy imbalance. For spatial analysis, the simulated ET was compared with MODIS data. The model values were low compared to MODIS ET in southern and northwestern Germany, but high in mid-western and eastern Germany. The discrepancies between MODIS-ET and WaSSI ET could be attributed to multiple factors, i.e. the intrinsic limitations of the different algorithms used by the model and MODIS to estimate ET, uncertainty from the misclassification of land cover between the two datasets, uncertainties in the model's input data, uncertainties in MODIS's input data, exclusion of waterbodies in ET estimation by MODIS, and the role of interception in MODIS-ET estimation (Kim et al., 2012; Trambauer et al., 2014).
Furthermore, the model performance across different land covers showed that simulated GPP estimates capture forest biomes significantly well, except for the station in Lackenberg Forest. The model performance for the rest of the land covers was less straightforward. For example, croplands had good model biases but low regression values; grasslands had poor model biases, but high regression estimates; wetlands are more multifaceted (see Table 1). The discrepancies in the results can be from (1) the model's inherent limitation i.e., lack of radiation in model PET leading to underestimation of GPP, (2) an insufficient number of eddy flux data for different land covers, and uncertainty in eddy flux GPP. The uncertainty of daily GPP can reach 15 % to 20 % (Falge et al., 2002; Hagen et al., 2006; Lasslop et al., 2010; Verma et al., 2014). Understanding uncertainties in eddy flux GPP is ongoing research. The mismatch of land cover and landscape heterogeneity at the evaluation sites between the model (watershed scale) and the eddy flux (single location) will reduce as more data becomes available with time (Verma et al., 2014). Lastly, the difference between spatial distribution of simulated GPP and remotely sensed GPP may be due to WUE parameters. They were derived from the global FLUXNET database, which might not have sufficient representation of certain ecosystems (e.g., wetlands and savannas) resulting in a bias of GPP estimation (Sun et al., 2011). Nevertheless, multiple studies have also shown that data from remote sensing tends to underestimate GPP (Liu et al., 2015; Wang et al., 2017; Zhu et al., 2018).
The simulated stocks and flows of ecosystem services across Germany by this study were similar to Zink et al. (2017) and Huang et al. (2010) who reported annual ET and water scarcity patterns at individual sites. The eastern region in Germany generally receives less precipitation, has high mean annual temperature, high ET from forests and low water yield, implying intense water use competition. The total water supply reported by German Environment Agency (UBA) was higher than the simulated results because WaSSI model does not consider transboundary flows (Arle et al., 2018). Furthermore, the southern region in Germany had slightly higher carbon uptake and sequestration values then the rest of the country. The distribution patterns of carbon sequestration were similar to carbon uptake because NEP and GPP have a linear relationship. Urban areas sequestered limited carbon but played a significant role in altering water balances. The distribution and management of land use and land cover determine how ecosystem services vary. To ensure adequate quantity and quality of services, like freshwater and natural sink of CO2, land use decision-making must incorporate the assessment of currently available stocks and their actual value according to regional and national priorities. Based on historical data, the available stocks quantified in this study provide evidence to relevant stakeholders of different regions. Furthermore, the significance of minor land covers or ecosystems in terms of proportional coverage, such as wetlands, is also highlighted. Germany aims to become CO2 neutral by 2045; synergies and tradeoffs of ecosystem services can be used to design land use policy that align with Sustainable Development Goals. A science-based approach will be necessary to leverage the potential of natural C sink to fix and offset carbon emissions.
As the frequency and intensity of periodic dry and wet spells change due to global warming so does their impact through drought and extreme precipitation events. In this work, we, quantified the response of water yield and carbon sequestration to extreme drought and high precipitation events across Germany. During the drought events of 2003 and 2018, the lack of precipitation, overall, had a direct negative impact on water yield and carbon sequestration. But it is interesting to see that soil has stored water from previous years, acting as a buffer and provide limited relief during extreme drought events (Fig. 8). According to Ciais et al. (2005), a 30 % reduction in carbon uptake was observed across Europe during the drought of 2003, while we estimated a reduction of around 8.8 % for Germany. Europe-wide studies on the impacts of the 2018 drought event on carbon sequestration are presented by Thompson et al. (2020) and Smith et al. (2020). They found that the annual sequestration anomaly in 2018 across northern Europe was 0.02±0.02 Pg C yr−1 less compared to a 10-year European mean (Thompson et al., 2020). It was estimated that during the year 2018 an overall reduction in sequestration was around 57 Tg C (Smith et al., 2020). However, a direct comparison between our research is difficult due to the difference in the spatial boundaries. In general, Germany has no shortage of water, however, a trend to have less precipitation during summer seasons or prolonged dry spells during main vegetation growing months can have substantial adverse effects on both surface water and groundwater supply. Temporary seasonal rainfall deficiency can cause significant losses of surface water supply and carbon sequestration, leading to dry conditions that negatively affect the yields and products from the agriculture and forestry sectors. For example, low soil water availability weakens forest health and favors bark beetle infestation, resulting in huge economic losses of timber values and forest areas in Germany over the last few years (Lausch et al., 2013; Zimmermann and Hoffmann, 2020) and the situation continues to worsen. Therefore, land use transformation to adapt to climate change is indispensable to developing ecological resiliency based on an improved understanding of the role of various land covers in providing ecosystem services.
While this study provides valuable insights on response of water-carbon cycle to land cover and extreme events, it is limited by the scope of WaSSI Model. The monthly temporal resolution of the model prevents it from estimating peak flows accurately. The use of WUE to connect ET and carbon sequestration is limited due to insufficient eddy flux tower coverage. The lack of transboundary river flow and omission of crop rotation further limits the application of this model. In future, we plan to use WaSSI model across hydrological boundaries, apply projected climate data and projected landcover data to run simulations for different scenarios. The analysis will help us evaluate future changes in ecosystem services.
This study presents new insights into the relationship between water-carbon cycle and land cover, and the impacts of climate extremes across Germany. The model validation results holistically show that the simple water and carbon model could capture ecosystem services reasonably well at the national level. Furthermore, the spatial and temporal relationship between carbon and water highlighted that the eastern states of Germany are comparatively drier than the rest of the country because most of their precipitation is lost as ET. Nationally, ecosystems in Germany generates a total annual discharge of 84.86 billion m3 and sequester 106 Tg C yr−1 carbon. Croplands supply the largest percentage of available water, while forests sequester the major share of carbon. Minor land covers (e.g. wetlands, open shrubland, closed shrubland, and grasslands) are also very important in providing ecosystem services for carbon sequestration. The extreme events in 2003 and 2018 had a significant impact on ecosystem services at the national level. Moreover, the severe flood of 2013 also played a major role on a regional scale in the Elbe and Danube River basins. This rigorously verified model provides confidence that the model can be used to strategic applications for developing Nature-based Solutions (NbS), which will be helpful for Germany to meet its net-zero carbon emissions by 2050.
Model software (Liu, 2021, https://sites.google.com/view/rwassi/home?authuser=0, last access: 19 June 2026), output data (WaSSI Model Output: https://doi.org/10.6084/m9.figshare.25053641.v1, Pyarali, 2024a) and corresponding watershed shapefile (Germany Watershed Delineation: https://doi.org/10.6084/m9.figshare.25053599.v1, Pyarali, 2024b) used and prepared in this study are available open source via figshare and can be access from the links in reference list.
The supplement related to this article is available online at https://doi.org/10.5194/hess-30-4157-2026-supplement.
KP: Writing, review and editing manuscript, Methodology, Investigation, Data curation, Conceptualization. LZ: Review, Supervision, Methodology, Funding acquisition, Conceptualization. GS: Review, Supervision, Methodology, Conceptualization. NL: Review, Data curation, Methodology. AAQ: Review, Data curation, Methodology.
The contact author has declared that none of the authors has any competing interests.
Publisher's note: Copernicus Publications remains neutral with regard to jurisdictional claims made in the text, published maps, institutional affiliations, or any other geographical representation in this paper. The authors bear the ultimate responsibility for providing appropriate place names. Views expressed in the text are those of the authors and do not necessarily reflect the views of the publisher.
We want to thank the Thünen Institute of Forest Ecosystems for its collaboration.
This work was supported by the German Academic Exchange Service (DAAD) PPP Grant (Projekt-ID: 57510261). We appreciate the funding support from UNU-FLORES and the generous support provided by the US partner – the Southern Research Station of the United States Forest Service.
This paper was edited by Alexander Gruber and reviewed by two anonymous referees.
Allan, A., Soltani, A., Abdi, M. H., and Zarei, M.: Driving Forces behind Land Use and Land Cover Change: A Systematic and Bibliometric Review, Land (Basel), 11, 1222, https://doi.org/10.3390/land11081222, 2022.
Al-Qubati, A., Zhang, L., and Pyarali, K.: Climatic drought impacts on key ecosystem services of a low mountain region in Germany, Environ. Monit. Assess., 195, 800, https://doi.org/10.1007/s10661-023-11397-1, 2023.
Anderson, R. M., Koren, V. I., and Reed, S. M.: Using SSURGO data to improve Sacramento Model a priori parameter estimates, J. Hydrol. (Amst.), 320, 103–116, https://doi.org/10.1016/J.JHYDROL.2005.07.020, 2006.
Arle, J., Bartel, H., Baumgarten, C., Bertram, A., Wolter, R., Winkelmann-Oei, G., and Winde, C.: Water Resource Management in Germany: Fundamentals, Pressures, Measures, Dessau-Roßlau, Umwelt Bundesamt, 26–27, https://www.uba.de/n62362en (last access: 19 June 2026), 2018.
Arowolo, A. O., Deng, X., Olatunji, O. A., and Obayelu, A. E.: Assessing changes in the value of ecosystem services in response to land-use/land-cover dynamics in Nigeria, Sci. Total Environ., 636, 597–609, https://doi.org/10.1016/j.scitotenv.2018.04.277, 2018.
Averyt, K., Fisher, J., Huber-Lee, A., Lewis, A., Macknick, J., Madden, N., Rogers, J., and Tellinghuisen, S.: Freshwater Use by U.S. Power Plants. Electricity's Thirst for a Precious Re source, Cambridge, MA, https://www3.epa.gov/region1/npdes/merrimackstation/pdfs/ar/AR-1501.pdf (last access: 19 June 2026), 2011.
Beer, C., Reichstein, M., Ciais, P., Farquhar, G. D., and Papale, D.: Mean annual GPP of Europe derived from its water balance, Geophys. Res. Lett., 34, https://doi.org/10.1029/2006GL029006, 2007.
Brown de Colstoun, E. C., Huang, C., Wang, P., Tilton, J. C., Tan, B., Phillips, J., Niemczura, S., Ling, P.-Y., and Wolfe, R. E.: Global Man-made Impervious Surface (GMIS) Dataset From Landsat (Version 1.00) [Data set], Palisades, NY: NASA Socioeconomic Data and Applications Center (SEDAC), https://www.earthdata.nasa.gov/data/catalog/sedac-ciesin-sedac-ulandsat-gmis-v1-1.0 (last acccess: 19 June 2026), 2017.
Büttner, G., Kosztra, B., Maucha, G., Pataki, R., Kleeschulte, S., Hazeu, G., Vittek, M., Schröder, C., and Littkopf, A.: Copernicus Land Monitoring Service CORINE Land Cover (User Manual), https://land.copernicus.eu/user-corner/technical-library/clc-product-user-manual/view (last access: 19 June 2026), 2021.
Caldwell, P., Sun, G., McNulty, S. G., Cohen, E., and Moore Myers, J. A.: Modeling impacts of environmental change on ecosystem services across the conterminous United States, The Fourth Interagency Conference on Research in the Watersheds, Fairbanks, AK, USA, 63 pp., https://icrwatersheds.org/wp-content/uploads/2019/03/2011-ICRW-proceedings.pdf (last acccess: 19 June 2026), 2011.
Caldwell, P., Muldoon, C., Ford-Miniat, C., Cohen, E., Krieger, S., Sun, G., McNulty, S., and Bolstad, P. V.: Quantifying the role of National Forest System lands in providing surface drinking water supply for the Southern United States, https://doi.org/10.2737/SRS-GTR-197, 2014.
Caldwell, P. V., Sun, G., McNulty, S. G., Cohen, E. C., and Moore Myers, J. A.: Impacts of impervious cover, water withdrawals, and climate change on river flows in the conterminous US, Hydrol. Earth Syst. Sci., 16, 2839–2857, https://doi.org/10.5194/hess-16-2839-2012, 2012.
Camacho, F. and Cernicharo, J.: Gio Global Land Component – Lot I “Operation of the Global Land Component”, Algorithm Theoretical Basis Document, Issue I1.01, 1–31 pp., 2014.
Chen, D., Liu, N., Gan, G., Liu, Y., Qin, M., Zheng, Q., Sun, G., and Hao, L.: Combined effects of urbanization and climate variability on water and carbon balances in a rice paddy-dominated basin in southern China, Environ. Res. Lett., 19, 124042, https://doi.org/10.1088/1748-9326/ad8a73, 2024.
Cheng, L., Zhang, L., Wang, Y. P., Canadell, J. G., Chiew, F. H. S., Beringer, J., Li, L., Miralles, D. G., Piao, S., and Zhang, Y.: Recent increases in terrestrial carbon uptake at little cost to the water cycle, Nat. Commun., 8, 1–10, https://doi.org/10.1038/s41467-017-00114-5, 2017.
Ciais, P., Reichstein, M., Viovy, N., Granier, A., Ogée, J., Allard, V., Aubinet, M., Buchmann, N., Bernhofer, C., Carrara, A., Chevallier, F., De Noblet, N., Friend, A. D., Friedlingstein, P., Grünwald, T., Heinesch, B., Keronen, P., Knohl, A., Krinner, G., Loustau, D., Manca, G., Matteucci, G., Miglietta, F., Ourcival, J. M., Papale, D., Pilegaard, K., Rambal, S., Seufert, G., Soussana, J. F., Sanz, M. J., Schulze, E. D., Vesala, T., and Valentini, R.: Europe-wide reduction in primary productivity caused by the heat and drought in 2003, Nature, 437, 529–533, https://doi.org/10.1038/nature03972, 2005.
Cui, F., Wang, B., Zhang, Q., Tang, H., De Maeyer, P., Hamdi, R., and Dai, L.: Climate change versus land-use change – What affects the ecosystem services more in the forest-steppe ecotone?, Sci. Total Environ., 759, 143525, https://doi.org/10.1016/j.scitotenv.2020.143525, 2021.
Donmez, C., Sahingoz, M., Paul, C., Cilek, A., Hoffmann, C., Berberoglu, S., Webber, H., and Helming, K.: Climate change causes spatial shifts in the productivity of agricultural long-term field experiments, Eur. J. Agronomy, 155, 127121, https://doi.org/10.1016/j.eja.2024.127121, 2024.
DWD Climate Data Center (CDC): Grids of monthly averaged daily air temperature (2 m) over Germany, https://opendata.dwd.de/climate_environment/CDC/grids_germany/monthly/, last access: 9 April 2023.
EEA: CLC 2018, Copernicus Land Monitoring Service, https://doi.org/10.2909/960998c1-1870-4e82-8051-6485205ebbac (last access: 19 June 2026), 2021.
Eisenreich, S. J.: Climate Change and the European Water Dimension. A report to the European Water Directors 2005, EU Report No. 21553, 2005.
Falge, E., Baldocchi, D., Tenhunen, J., Aubinet, M., Bakwin, P., Berbigier, P., Bernhofer, C., Burba, G., Clement, R., Davis, K. J., Elbers, J. A., Goldstein, A. H., Grelle, A., Granier, A., Gumundsson, J., Hollinger, D., Kowalski, A. S., Katul, G., Law, B. E., Malhi, Y., Meyers, T., Monson, R. K., Munger, J. W., Oechel, W., Paw U, K. T., Pilegaard, K., Rannik, Ü., Rebmann, C., Suyker, A., Valentini, R., Wilson, K., and Wofsy, S.: Seasonality of ecosystem respiration and gross primary production as derived from FLUXNET measurements, Agric. For. Meteorol., 113, 53–74, https://doi.org/10.1016/S0168-1923(02)00102-8, 2002.
Fang, Y., Sun, G., Caldwell, P., McNulty, S. G., Noormets, A., Domec, J., King, J., Zhang, Z., Zhang, X., Lin, G., Zhou, G., Xiao, J., and Chen, J.: Monthly land cover-specific evapotranspiration models derived from global eddy flux measurements and remote sensing data, Ecohydrology, 9, 248–266, https://doi.org/10.1002/eco.1629, 2015.
Gentine, P., Green, J. K., Guérin, M., Humphrey, V., Seneviratne, S. I., Zhang, Y., and Zhou, S.: Coupling between the terrestrial carbon and water cycles – a review, Environ. Res. Lett., 14, 083003, https://doi.org/10.1088/1748-9326/AB22D6, 2019.
Gutsch, M., Lasch-Born, P., Kollas, C., Suckow, F., and Reyer, C. P. O.: Balancing trade-offs between ecosystem services in Germany's forests under climate change, Environ. Res. Lett., 13, 045012, https://doi.org/10.1088/1748-9326/aab4e5, 2018.
Hagen, S. C., Braswell, B. H., Linder, E., Frolking, S., Richardson, A. D., and Hollinger, D. Y.: Statistical uncertainty of eddy flux – Based estimates of gross ecosystem carbon exchange at Howland Forest, Maine, J. Geophys. Res.-Atmos., 111, 1–12, https://doi.org/10.1029/2005JD006154, 2006.
Hasan, S. S., Zhen, L., Miah, Md. G., Ahamed, T., and Samie, A.: Impact of land use change on ecosystem services: A review, Environ. Dev., 34, 100527, https://doi.org/10.1016/j.envdev.2020.100527, 2020.
Huang, S., Krysanova, V., Österle, H., and Hattermann, F. F.: Simulation of spatiotemporal dynamics of water fluxes in Germany under climate change, Hydrol. Process., 24, 3289–3306, https://doi.org/10.1002/HYP.7753, 2010.
Jin, K., Liu, N., Tang, R., Sun, G., and Hao, L.: Quantifying Long Term (2000–2020) Water Balances Across Nepal by Integrating Remote Sensing and an Ecohydrological Model, Remote Sens. (Basel), 17, 1819, https://doi.org/10.3390/rs17111819, 2025.
Jung, M., Reichstein, M., Schwalm, C. R., Huntingford, C., Sitch, S., Ahlström, A., Arneth, A., Camps-Valls, G., Ciais, P., Friedlingstein, P., Gans, F., Ichii, K., Jain, A. K., Kato, E., Papale, D., Poulter, B., Raduly, B., Rödenbeck, C., Tramontana, G., Viovy, N., Wang, Y. P., Weber, U., Zaehle, S., and Zeng, N.: Compensatory water effects link yearly global land CO2 sink changes to temperature, Nature, 541, 516–520, https://doi.org/10.1038/nature20780, 2017.
Kaspar, F., Müller-Westermeier, G., Penda, E., Mächel, H., Zimmermann, K., Kaiser-Weiss, A., and Deutschländer, T.: Monitoring of climate change in Germany – data, products and services of Germany's National Climate Data Centre, Adv. Sci. Res., 10, 99–106, https://doi.org/10.5194/asr-10-99-2013, 2013.
Keil, M.: Überblick: “CORINE Land Cover products for Germany, created by DLR-DFD”, DLR Earth Observation Center, https://www.dlr.de/eoc/Portaldata/60/Resources/dokumente/6_anw_land/CORINE_Land_Cover_products_for_Germany_at_DFD.pdf (last access: 19 June 2026), 2017.
Kim, H. W., Hwang, K., Mu, Q., Lee, S. O., and Choi, M.: Validation of MODIS 16 global terrestrial evapotranspiration products in various climates and land cover types in Asia, KSCE Journal of Civil Engineering, 16, 229–238, https://doi.org/10.1007/s12205-012-0006-1, 2012.
Kosanic, A., Kavcic, I., van Kleunen, M., and Harrison, S.: Climate change and climate change velocity analysis across Germany, Sci. Rep., 9, 2196, https://doi.org/10.1038/s41598-019-38720-6, 2019.
Lasslop, G., Reichstein, M., Papale, D., Richardson, A., Arneth, A., Barr, A., Stoy, P., and Wohlfahrt, G.: Separation of net ecosystem exchange into assimilation and respiration using a light response curve approach: Critical issues and global evaluation, Glob. Chang. Biol., 16, 187–208, https://doi.org/10.1111/j.1365-2486.2009.02041.x, 2010.
Lausch, A., Heurich, M., and Fahse, L.: Spatio-temporal infestation patterns of Ips typographus (L.) in the Bavarian Forest National Park, Germany, Ecol. Indic., 31, 73–81, https://doi.org/10.1016/J.ECOLIND.2012.07.026, 2013.
Law, B. E., Falge, E., Gu, L., Baldocchi, D. D., Bakwin, P., Berbigier, P., Davis, K., Dolman, A. J., Falk, M., Fuentes, J. D., Goldstein, A., Granier, A., Grelle, A., Hollinger, D., Janssens, I. A., Jarvis, P., Jensen, N. O., Katul, G., Mahli, Y., Matteucci, G., Meyers, T., Monson, R., Munger, W., Oechel, W., Olson, R., Pilegaard, K., Paw U, K. T., Thorgeirsson, H., Valentini, R., Verma, S., Vesala, T., Wilson, K., and Wofsy, S.: Environmental controls over carbon dioxide and water vapor exchange of terrestrial vegetation, Agric. For. Meteorol., 113, 97–120, https://doi.org/10.1016/S0168-1923(02)00104-1, 2002.
Liu, N.: Changes in Water and Carbon in Australian Vegetation in Response to Climate Change, Murdoch University, 2017.
Liu, N.: R-based Water Supply Stress Index (rWaSSI) model, rWaSSI [code], https://sites.google.com/view/rwassi/home?authuser=0 (last access: 19 June 2026), 2021.
Liu, N., SUN, P.-S., Liu, S.-R., and Sun, G.: Determination of spatial scale of response unit for WASSI-C eco–hydrological model—a case study on the upper Zagunao River watershed of China, Chinese Journal of Plant Ecology, https://research.fs.usda.gov/treesearch/44237 (last access: 19 June 2026), 2013.
Liu, N., Dobbs, G. R., Caldwell, P. V., Miniat, C. F., Bolstad, P. V., Nelson, S., and Sun, G.: Quantifying the role of State and private forest lands in providing surface drinking water supply for the Southern United States, USDA, https://doi.org/10.2737/SRS-GTR-248, 2020.
Liu, Z., Shao, Q., and Liu, J.: The performances of MODIS-GPP and -ET products in China and their sensitivity to input data (FPAR/LAI), Remote Sens. (Basel), 7, 135–152, https://doi.org/10.3390/rs70100135, 2015.
Margulis, S. A., Wood, E. F., and Troch, P. A.: The Terrestrial Water Cycle: Modeling and Data Assimilation across Catchment Scales, J. Hydrometeorol., 7, 309–311, https://doi.org/10.1175/JHM999.1, 2006.
McCabe, G. J. and Wolock, D. M.: GENERAL-CIRCULATION-MODEL SIMULATIONS OF FUTURE SNOWPACK IN THE WESTERN UNITED STATES1, JAWRA Journal of the American Water Resources Association, 35, 1473–1484, https://doi.org/10.1111/J.1752-1688.1999.TB04231.X, 1999.
Mcnulty, S., Cohen, E., Sun, G., and Caldwell, P.: HYDROLOGIC MODELING FOR WATER RESOURCE ASSESSMENT IN A DEVELOPING COUNTRY: THE RWANDA CASE STUDY, USDA FOREST SERVICE, https://research.fs.usda.gov/treesearch/53039 (last access: 19 June 2026), 2016.
Morales, P., Sykes, M. T., Prentice, I. C., Smith, P., Smith, B., Bugmann, H., Zierl, B., Friedlingstein, P., Viovy, N., Sabaté, S., Sánchez, A., Pla, E., Gracia, C. A., Sitch, S., Arneth, A., and Ogee, J.: Comparing and evaluating process-based ecosystem model predictions of carbon and water fluxes in major European forest biomes, Glob. Chang. Biol., 11, 2211–2233, https://doi.org/10.1111/J.1365-2486.2005.01036.X, 2005.
Pandey, B. and Ghosh, A.: Urban ecosystem services and climate change: a dynamic interplay, Frontiers in Sustainable Cities, 5, https://doi.org/10.3389/frsc.2023.1281430, 2023.
Pastorello, G., Trotta, C., Canfora, E., et al.: The FLUXNET2015 dataset and the ONEFlux processing pipeline for eddy covariance data, Sci. Data, 7, 225, https://doi.org/10.1038/s41597-020-0534-3, 2020.
Potter, C. and Pass, S.: Changes in the net primary production of ecosystems across Western Europe from 2015 to 2022 in response to historic drought events, Carbon Balance Manag., 19, 32, https://doi.org/10.1186/s13021-024-00279-9, 2024.
Prescher, A.-K., Grünwald, T., and Bernhofer, C.: Land use regulates carbon budgets in eastern Germany: From NEE to NBP, Agric. For. Meteorol., 150, 1016–1025, https://doi.org/10.1016/j.agrformet.2010.03.008, 2010.
Pyarali, K.: WaSSI Model Output, figshare [data set], https://doi.org/10.6084/m9.figshare.25053641.v1, 2024a.
Pyarali, K.: Germany Watershed Delineation, figshare [data set], https://doi.org/10.6084/m9.figshare.25053599.v1, 2024b.
Riedel, T., Bender, S., Hennig, P., Kroiher, F., Schnell, S., Schwitzgebel, F., Stauber, T., Stahlmann, J. K., and Kühling, M.: Fourth Federal Forest Inventory 2022, Fachagentur Nachwachsende Rohstoffe e. V. (FNR), https://www.bundeswaldinventur.de/vierte-bundeswaldinventur-2022/vorwort (last access: 19 June 2026), 2024.
Running, S. W., Mu, Q., Zhao, M., and Moreno, A.: User's Guide Daily GPP and Annual NPP (MOD17A2H/A3H) and Year-end Gap-Filled (MOD17A2HGF/A3HGF) Products, 1–40 pp., 2019a.
Running, S. W., Mu, Q., Zhao, M., and Moreno, A.: User's Guide MODIS Global Terrestrial Evapotranspiration (ET) Product NASA Earth Observing System MODIS Land Algorithm (For Collection 6), 1–40 pp., https://doi.org/10.5067/MODIS/MOD16A2GF.006, 2019b.
Salerno, F., Gaetano, V., and Gianni, T.: Urbanization and climate change impacts on surface water quality: Enhancing the resilience by reducing impervious surfaces, Water Res., 144, 491–502, https://doi.org/10.1016/j.watres.2018.07.058, 2018.
Schröter, D., Zebisch, M., and Grothmann, T.: Climate Change in Germany-Vulnerability and Adaptation of Climate-Sensitive Sectors, https://www.researchgate.net/publication/232071870_Climate_Change_in_Germany-Vulnerability_and_Adaptation_of_Climate-Sensitive_Sectors (last access: 19 June 2026), 2005.
Schumacher, E.: Natural disasters cost $280 billion in 2021: German insurance firm | News | DW | 10.01.2022, https://www.dw.com/en/natural-disasters-cost-280-billion-in- 2021-german-insurance-firm/a-60378575, last access: 28 September 2022.
Smets, B., Swinnen, E., and Van Hoolst, R.: Product User Manual: Dry Matter Productivity and Gross Dry Matter Productivity. Version 2. Collection 1km, Copernicus Global Land Services, 1–93 pp., 2019.
Smith, N. E., Kooijmans, L. M. J., Koren, G., Van Schaik, E., Van Der Woude, A. M., Wanders, N., Ramonet, M., Xueref-Remy, I., Siebicke, L., Manca, G., Brümmer, C., Baker, I. T., Haynes, K. D., Luijkx, I. T., and Peters, W.: Spring enhancement and summer reduction in carbon uptake during the 2018 drought in northwestern Europe, Philos. T. R. Soc. B, 375, https://doi.org/10.1098/RSTB.2019.0509, 2020.
Sun, G., Caldwell, P., Noormets, A., McNulty, S. G., Cohen, E., Myers, J. M., Domec, J.-C., Treasure, E., Mu, Q., Xiao, J., John, R., and Chen, J.: Upscaling key ecosystem functions across the conterminous United States by a water-centric ecosystem model, J. Geophys. Res.-Biogeo., 116, https://doi.org/10.1029/2010JG001573, 2011.
Sun, G., Wei, X., Hao, L., Sanchis, M. G., Hou, Y., Yousefpour, R., Tang, R., and Zhang, Z.: Forest hydrology modeling tools for watershed management: A review, For. Ecol. Manage., 530, 120755, https://doi.org/10.1016/J.FORECO.2022.120755, 2023.
Sun, S., Sun, G., Caldwell, P., McNulty, S. G., Cohen, E., Xiao, J., and Zhang, Y.: Drought impacts on ecosystem functions of the U.S. National Forests and Grasslands: Part I evaluation of a water and carbon balance model, For. Ecol. Manage., 353, 260–268, https://doi.org/10.1016/j.foreco.2015.03.054, 2015.
Thompson, R. L., Broquet, G., Gerbig, C., Koch, T., Lang, M., Monteil, G., Munassar, S., Nickless, A., Scholze, M., Ramonet, M., Karstens, U., Van Schaik, E., Wu, Z., and Rödenbeck, C.: Changes in net ecosystem exchange over Europe during the 2018 drought based on atmospheric observations, Philos. T. R. Soc. B, 375, https://doi.org/10.1098/RSTB.2019.0512, 2020.
Trambauer, P., Dutra, E., Maskey, S., Werner, M., Pappenberger, F., van Beek, L. P. H., and Uhlenbrook, S.: Comparison of different evaporation estimates over the African continent, Hydrol. Earth Syst. Sci., 18, 193–212, https://doi.org/10.5194/hess-18-193-2014, 2014.
Turner, D. P., Ritts, W. D., Cohen, W. B., Gower, S. T., Running, S. W., Zhao, M., Costa, M. H., Kirschbaum, A. A., Ham, J. M., Saleska, S. R., and Ahl, D. E.: Evaluation of MODIS NPP and GPP products across multiple biomes, Remote Sens. Environ., 102, 282–292, https://doi.org/10.1016/j.rse.2006.02.017, 2006.
Ungaro, F., Schwartz, C., and Piorr, A.: Ecosystem services indicators dataset for the utilized agricultural area of the Märkisch-Oderland District-Brandenburg, Germany, Data Brief, 34, 106645, https://doi.org/10.1016/j.dib.2020.106645, 2021.
Velpuri, N. M., Senay, G. B., Singh, R. K., Bohms, S., and Verdin, J. P.: A comprehensive evaluation of two MODIS evapotranspiration products over the conterminous United States: Using point and gridded FLUXNET and water balance ET, Remote Sens. Environ., 139, 35–49, https://doi.org/10.1016/j.rse.2013.07.013, 2013.
Verger, A., Descals, A., Benhadj, I., and Claes, P.: Product User Guide and Specification: CDR VGT-based LAI and fAPAR v1.0, 1–32 pp., 2018.
Verma, M., Friedl, M. A., Richardson, A. D., Kiely, G., Cescatti, A., Law, B. E., Wohlfahrt, G., Gielen, B., Roupsard, O., Moors, E. J., Toscano, P., Vaccari, F. P., Gianelle, D., Bohrer, G., Varlagin, A., Buchmann, N., van Gorsel, E., Montagnani, L., and Propastin, P.: Remote sensing of annual terrestrial gross primary productivity from MODIS: an assessment using the FLUXNET La Thuile data set, Biogeosciences, 11, 2185–2200, https://doi.org/10.5194/bg-11-2185-2014, 2014.
Wang, L., Zhu, H., Lin, A., Zou, L., Qin, W., and Du, Q.: Evaluation of the latest MODIS GPP products across multiple biomes using global eddy covariance flux data, Remote Sens. (Basel), 9, https://doi.org/10.3390/rs9050418, 2017.
Williams, I. N., Torn, M. S., Riley, W. J., and Wehner, M. F.: Impacts of climate extremes on gross primary production under global warming, Environ. Res. Lett., 9, 094011, https://doi.org/10.1088/1748-9326/9/9/094011, 2014.
Wu, S., Tetzlaff, D., Goldhammer, T., and Soulsby, C.: Hydroclimatic variability and riparian wetland restoration control the hydrology and nutrient fluxes in a lowland agricultural catchment, J. Hydrol. (Amst.), 603, 126904, https://doi.org/10.1016/j.jhydrol.2021.126904, 2021.
Zeng, Z., Piao, S., Li, L. Z. X., Wang, T., Ciais, P., Lian, X., Yang, Y., Mao, J., Shi, X., and Myneni, R. B.: Impact of Earth Greening on the Terrestrial Water Cycle, J. Climate, 31, 2633–2650, https://doi.org/10.1175/JCLI-D-17-0236.1, 2018.
Zhang, J., Zhang, Y., Sun, G., Song, C., Li, J., Hao, L., and Liu, N.: Climate Variability Masked Greening Effects on Water Yield in the Yangtze River Basin During 2001–2018, Water Resour. Res., 58, e2021WR030382, https://doi.org/10.1029/2021WR030382, 2022.
Zhang, L., Cheng, L., Chiew, F., and Fu, B.: Understanding the impacts of climate and landuse change on water yield, Curr. Opin. Environ. Sustain., 33, 167–174, https://doi.org/10.1016/J.COSUST.2018.04.017, 2018.
Zhang, Y., Zhang, Z., Reed, S., and Koren, V.: An enhanced and automated approach for deriving a priori SAC-SMA parameters from the soil survey geographic database, Comput. Geosci., 37, 219–231, https://doi.org/10.1016/J.CAGEO.2010.05.016, 2011.
Zhang, Y., Song, C., Sun, G., Band, L. E., McNulty, S., Noormets, A., Zhang, Q., and Zhang, Z.: Development of a coupled carbon and water model for estimating global gross primary productivity and evapotranspiration based on eddy flux and remote sensing data, Agric. For. Meteorol., 223, 116–131, https://doi.org/10.1016/J.AGRFORMET.2016.04.003, 2016.
Zhu, X., Pei, Y., Zheng, Z., Dong, J., Zhang, Y., Wang, J., Chen, L., Doughty, R. B., Zhang, G., and Xiao, X.: Underestimates of grassland gross primary production in MODIS standard products, Remote Sens. (Basel), 10, https://doi.org/10.3390/rs10111771, 2018.
Zimmermann, S. and Hoffmann, K.: Evaluating the capabilities of Sentinel-2 data for large-area detection of bark beetle infestation in the Central German Uplands, J. Appl. Remote Sens., 14, 024515, https://doi.org/10.1117/1.JRS.14.024515, 2020.
Zink, M., Kumar, R., Cuntz, M., and Samaniego, L.: A high-resolution dataset of water fluxes and states for Germany accounting for parametric uncertainty, Hydrol. Earth Syst. Sci., 21, 1769–1790, https://doi.org/10.5194/hess-21-1769-2017, 2017.