the Creative Commons Attribution 4.0 License.
the Creative Commons Attribution 4.0 License.
 | 30 Jun 2026
Scale-dependent biases in Alpine sub-daily areal precipitation extremes: added value of convection permitting models
Rashid Akbary
Eleonora Dallan
Paul C. Astagneau
Raul R. Wood
Francesco Marra
Manuela I. Brunner
Marco Borga
Intense sub-daily precipitation is a key driver of flash floods and debris flows. Convection-permitting models (CPMs) have shown improved representation of short-duration and localized precipitation extremes compared to coarser regional climate models (RCMs), yet their evaluation is typically performed at the native grid scale, neglecting hydrologically relevant spatial aggregations. Here, we assess how well CPM simulations represent areal precipitation extremes over Switzerland across durations from 1 to 24 h and spatial scales from ∼ 10 to 5000 km2. We use 20 years (2005–2024) of hourly precipitation from Switzerland's high-resolution radar–gauge product as reference and analyse simulations from the CORDEX Flagship Pilot Study on Convection Phenomena, including nine CPMs (2–3 km resolution) and seven driving RCMs (12–25 km resolution).
CPMs reproduce the observed spatial organization of short- and long-duration precipitation extremes more realistically than RCMs over complex terrain. For 1–3 h extremes, CPM bias in 20-year return levels strongly depends on the spatial scale, shifting from a ∼ 15 % underestimation at native resolution to near-zero bias at ∼ 400 km2 and to ∼ 20 % overestimation at ∼ 4000 km2. RCMs consistently underestimate 20-year return levels across all spatial scales, with biases ranging from ∼ 40 % underestimation at native resolution (∼ 144 km2) to ∼ 10 % underestimation at the largest aggregation scales (∼ 5000 km2). For longer durations (6–24 h), both ensembles show an approximately scale-invariant positive bias of ∼ 15 %. Biases also increase with elevation, particularly for daily extremes, highlighting challenges in modelling complex terrain and in radar–gauge observations. Overall, CPMs offer important added value for representing short-duration extremes relevant to flash floods and debris flows in small to medium-size Alpine catchments (10–103 km2), but scale-dependent biases must be accounted for when translating CPM outputs into flood-risk assessments at these scales.
- Article
(7716 KB) - Full-text XML
-
Supplement
(2090 KB) - BibTeX
- EndNote


A defining characteristic of extreme precipitation is its inherent space and time scale dependence. Extremes measured at a point location differ systematically from extremes averaged over a catchment area, and as the spatial averaging scale increases, extreme precipitation intensities generally decrease. The rate of this reduction depends on storm type, storm organization, and terrain complexity (Breinl et al., 2020; De Michele et al., 2001; Gericke and Pietersen, 2020; Svensson and Jones, 2010). While these scaling relationships apply universally, they are particularly pronounced in regions of complex terrain, where orographic effect, and sharp climatic gradients across mountain ranges produce strong spatial heterogeneity in storm structure. In such regions, the spatial scales relevant for flood hydrology span several orders of magnitude, from a few square kilometers in small Alpine or urban catchments to several thousand square kilometers in large river basins. Across these scales, both the intensity of extreme precipitation and the total precipitation volume accumulated over the catchment shape the flood response, with their relative importance depending on catchment size, storm duration, and antecedent conditions (Viglione and Blöschl, 2009).
This scale problem poses a fundamental challenge for hydrological applications based on climate simulations. Many commonly used climate model products are too coarse to resolve deep convection and to represent the storm structures and topographic gradients that control sub-daily streamflow extremes (Cortés-Hernández et al., 2024; Kendon et al., 2017; Prein et al., 2015). For this reason, assessments of climate change on flood processes in rough orography require climate simulations that can represent both convective organization and orographic forcing at kilometer scales (Chan et al., 2014; Kendon et al., 2012; Prein et al., 2015).
The emergence of convection-permitting models (CPMs) over the past two decades has opened new opportunities to assess climate change impacts on sub-daily convective extremes (Ban et al., 2014; Fosser et al., 2024; Kendon et al., 2012; Prein et al., 2015). CPMs operate at horizontal grid spacings typically finer than ∼ 4 km, enabling the explicit representation of deep convection rather than relying on convection parameterizations, which are a long-recognized source of uncertainty in the simulation of short-duration precipitation extremes (Ban et al., 2014; Fosser et al., 2015). As a result, CPMs frequently demonstrate added value over coarser-resolution regional climate models (RCMs) in reproducing hourly precipitation characteristics and heavy-precipitation statistics (Ban et al., 2014; Caillaud et al., 2021; Coppola et al., 2020; Fosser et al., 2015).
Despite the growing evidence that CPMs improve sub-daily precipitation statistics (Estermann et al., 2025; Fosser et al., 2024; Lucas-Picher et al., 2024), most evaluation studies still emphasize grid-point metrics and station-based comparisons, while hydrological applications typically require areal precipitation over scales spanning up to several thousands of square kilometers (Rasmussen et al., 2012). The relevance of potential improvements obtained by using CPMs instead of coarser resolution climate data for flood hazard applications depends strongly on the flood type and catchment scale considered. In small, fast-responding Alpine catchments, flash floods and debris flows are most often driven by short-duration, high-intensity convective precipitation, with characteristic response times of a few hours (Borga et al., 2014; Marchi et al., 2010). For these flood types, the spatial organization and intensity of hourly precipitation extremes – which CPMs explicitly resolve – directly control flood magnitude and timing. As catchment size increases, response times lengthen and flood-generating precipitation durations shift toward sub-daily to multi-day accumulations, with saturation-excess processes and antecedent soil moisture playing a more important role (Viglione and Blöschl, 2009). For these flood types, large-scale synoptic forcing dominates the precipitation mechanism, and the added value of explicitly resolving convection may be less critical. However, it is still not well known how CPM skill in reproducing precipitation extremes changes with areal aggregation, nor whether CPMs and their driving regional climate models (RCMs) behave differently under the same spatial averaging. Clarifying these scale-dependent behaviors is necessary if CPMs are to be used confidently for analysing climate change impacts on flood hazard. At the same time, CPM simulations remain computationally demanding (Ban et al., 2021; Schär et al., 2020), and it is important to understand at which spatial and temporal scales they provide clear practical benefits over RCMs (Kendon et al., 2021; Poncet et al., 2024).
This study sheds light on the dependence of climate model biases on spatial and temporal aggregation scales by evaluating how well a multi-model CPM ensemble from the CORDEX-FPS framework represents precipitation extremes over the complex orography of Switzerland as compared to the driving RCM ensemble, using the high-resolution CombiPrecip radar–gauge product as an observational reference (MeteoSwiss – Federal Office of Meteorology and Climatology, 2025b). We examine precipitation extremes across spatial scales from approximately 10 to 5000 km2 and durations from 1 to 24 h. In particular, we (i) assess how spatial patterns and the magnitudes of extreme precipitation return levels change from the native grid spacing to aggregated areas, (ii) quantify how CPM and RCM biases in extreme precipitation return levels depend on precipitation accumulation duration and spatial aggregation, and (iii) assess why these biases change with spatial scale. We do this by analysing the within-area spatial variability of the precipitation field at the time of annual maximum precipitation and intensity reduction of extreme precipitation return levels under aggregation.
2.1 Study area
The study area covers the majority of Switzerland within the continuous coverage of the Swiss weather-radar network (Fig. 1a). We select this domain for two reasons: (i) Switzerland's strong elevation gradients and complex topography produce pronounced regional and seasonal precipitation contrasts, allowing evaluation of model performance across diverse climatic and orographic conditions; and (ii) MeteoSwiss' radar–gauge merged product CombiPrecip provides hourly precipitation at ∼ 1 km resolution over this region, offering a high-resolution observational benchmark for extreme precipitation. The study area is slightly smaller than Switzerland due to data constraints of the CombiPrecip product (see Sect. 2.2.1).
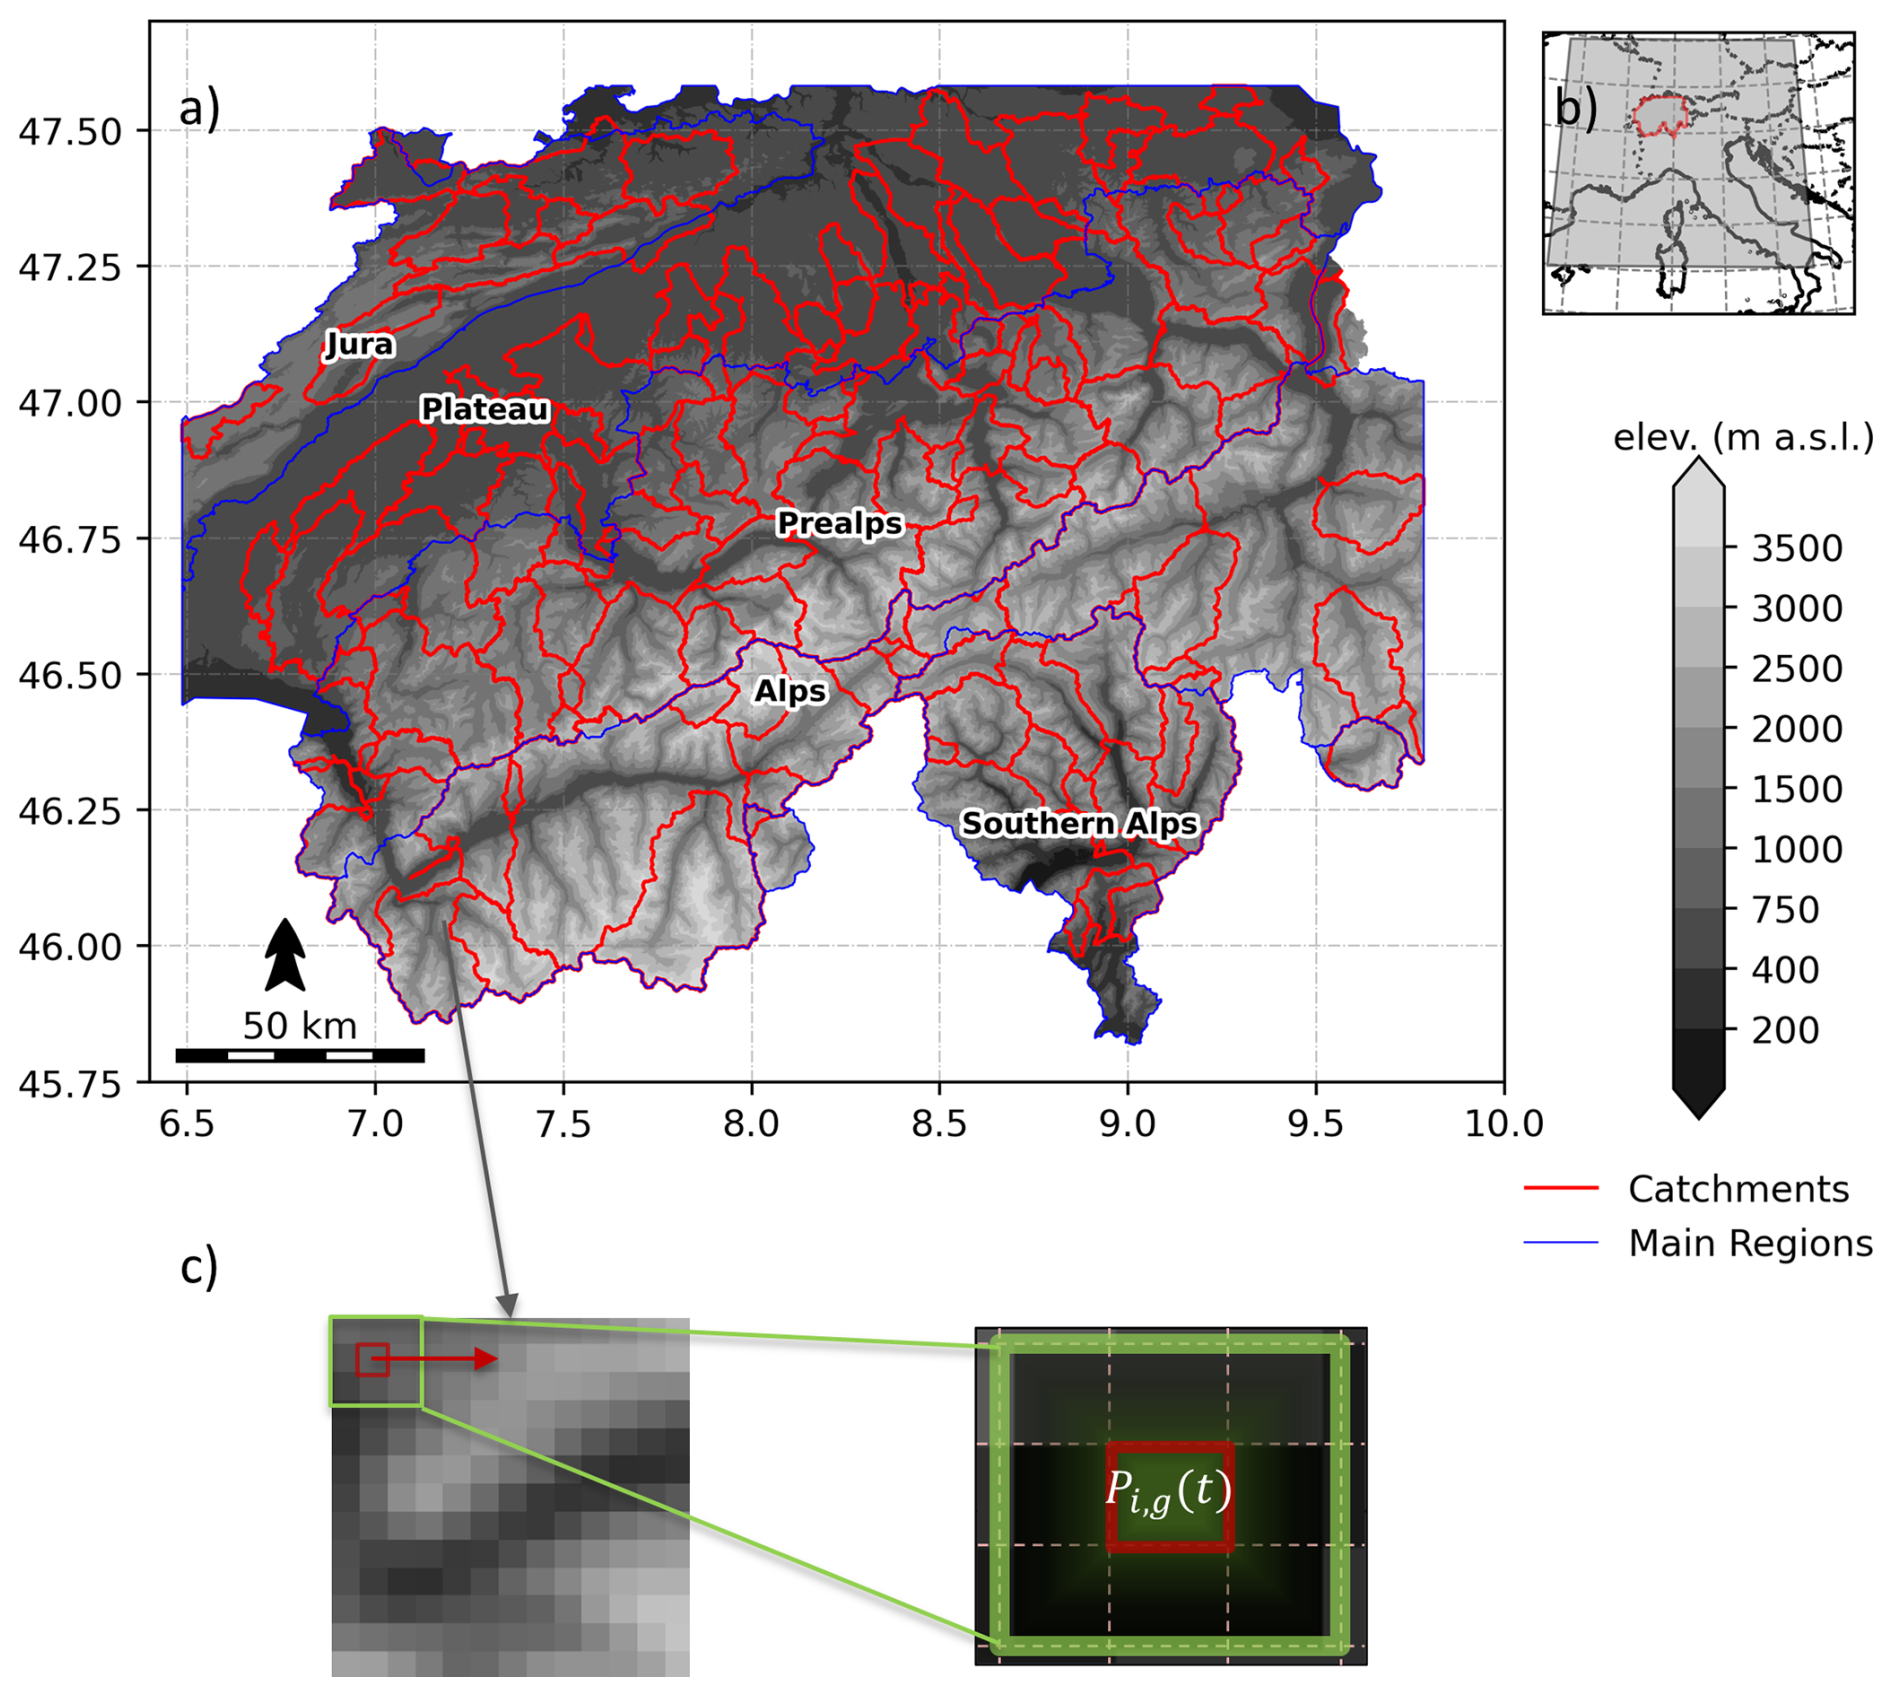
Figure 1(a) Study domain used to evaluate simulated precipitation products. The red lines represent the outlines of 143 nested catchments and the blue lines distinguish the main climatological regions of Switzerland (Jura, the Plateau, the Prealps, the Alps and the Southern Alps). (b) Location of the study area in Europe and the CPM ALP-3 modeling domain. (c) An illustration of the moving window procedure for the computation of mean areal precipitation.
Switzerland covers three major physiographic units – the Alps, the Swiss Plateau, and the Jura – spanning elevations from ∼ 200–600 m a.s.l. to high-alpine chains exceeding 4000 m. This orographic complexity imposes strong spatial structure on precipitation and produces a sharp north-south contrast across the Alpine crest, with mountain flanks acting as preferred zones for uplift and heavy precipitation (Cetti et al., 2015; Frei and Schär, 1998; MeteoSwiss – Federal Office of Meteorology and Climatology, 2025b). These physiographic controls are central to our analysis because intensity-area relations for sub-daily extremes depend not only on convective organization but also on how orography structures storm footprints (Frei and Schär, 1998; Isotta et al., 2014).
Climatologically, annual precipitation totals are highest along the Prealps, the Southern Alps (e.g., Ticino), and across parts of the western Jura, with typical values around ∼ 2000 mm yr−1 (MeteoSwiss – Federal Office of Meteorology and Climatology, 2025a). Above roughly 1200–1500 m a.s.l., a large share of cold-season precipitation falls as snow, whereas snowfall is comparatively rare in low-lying regions. In contrast, much of the northern Plateau records precipitation of ∼ 1000–1500 mm yr−1 on average, predominantly falling as rain (MeteoSwiss – Federal Office of Meteorology and Climatology, 2025a). These patterns reflect the combined influence of westerly storm tracks, moisture advection from the Atlantic-Mediterranean sector, and the Alpine barrier. In terms of precipitation extremes, sub-daily and daily extremes are dominated by distinct regimes. On the south side of the Alps (e.g., Ticino and adjacent valleys), the largest 1 d and multi-day accumulations often occur in autumn during southerly flow, when moist Mediterranean air impinges on south-facing slopes and sustains orographic lifting (Rotunno and Houze, 2007). North of the Alps and across the Plateau, warm-season convection is the primary driver of hourly to sub-daily extremes, frequently organized by mesoscale circulations and frontal passages (Panziera et al., 2018). Radar-based climatologies further show that both daily and sub-daily extremes tend to be more intense along the Alpine slopes than at the crest, emphasizing the role of orographic organization in setting extreme intensities at short durations (MeteoSwiss – Federal Office of Meteorology and Climatology, 2025a; Panziera et al., 2018).
2.2 Data
2.2.1 Observation
As an observational reference product, we use CombiPrecip, the radar-gauge merged precipitation dataset by MeteoSwiss (Sideris et al., 2014). CombiPrecip provides hourly ground-level precipitation on a 1 km2 grid, covering Switzerland and adjacent regions wherever the Swiss C-band radar composite offers reliable coverage. Operational since 2005, CombiPrecip is designed for high-resolution hydrological and hazard applications (MeteoSwiss – Federal Office of Meteorology and Climatology, 2025b). At the time of this analysis, the complete CombiPrecip record spans 20 years, from 1 January 2005 to 31 December 2024 and we use the full available period in our evaluation.
The product results from a geostatistical merging of radar precipitation estimates (5 min Swiss radar composite) with quality-controlled gauge observations (SwissMetNet, 10 min resolution) using spatio-temporal kriging with external drift (Sideris et al., 2014). In the merging procedure, the rain gauge data is treated as the primary variable and radar is used as an external drift. Thus, the merging mainly adjusts the radar field locally to match gauge totals while retaining the radar-derived spatial structure of precipitation. The scheme also includes a convection control step aimed to reduce the impact of limited gauge representativeness during short-lived convective events (see Sideris et al., 2014). The algorithm draws on more than 250 automatic rain gauges and a network of five polarimetric C-band Doppler radars positioned to provide robust coverage in complex Alpine terrain (MeteoSwiss – Federal Office of Meteorology and Climatology, 2025a).
Both input datasets undergo extensive quality control. Gauge records are checked for physical plausibility, spatial consistency, and inter-parameter agreement, while radar fields are corrected for clutter, visibility losses from orographic shielding, vertical reflectivity profile effects, and residual biases, supported by routine hardware calibration and a tailored multi-elevation scan strategy (Gabella et al., 2017; Germann et al., 2006, 2022).
It is important to note that MeteoSwiss also provides a radar-only precipitation product. For the purpose of our study, CombiPrecip offers a pragmatic compromise between spatial detail and bias control, combining the spatial information of the radar mosaic with gauge-based adjustment at the ground. Cross-validation against rain gauges shows that this merging reduces the quantitative error of the radar-only product by approximately 40 % at hourly aggregation (Barton et al., 2020). Residual errors in CombiPrecip nonetheless vary systematically with altitude, with bias becoming increasingly negative at higher elevations (Ghaemi et al., 2023), and agreement with gauge observations for extreme precipitation decreases with increasing event severity (Panziera et al., 2018).
We defined the study domain based on data availability by retaining only grid cells with a complete 20-year record, allowing a maximum of 10 % missing hours in any given year; the resulting domain is shown in Fig. 1a. Within this area we selected 143 nested catchments from CAMELS-CH (Höge et al., 2023), to quantify precipitation biases at the catchment scale with areas ranging from 10 to 5238 km2. Such a catchment-specific analysis is used to complement the grid-based analysis with the aim to provide insights at the spatial scale of hydrological climate impact studies.
2.2.2 CPM and RCM model simulations
We use simulations from the CORDEX Flagship Pilot Study on Convective Phenomena over Europe and the Mediterranean (FPS-Convection), which provides the first coordinated multi-model ensemble of decade-long, kilometer-scale regional climate simulations over the Greater Alpine Region ALP-3 domain (Ban et al., 2021; Coppola et al., 2020; Pichelli et al., 2021). The FPS-Convection framework prescribes common domains, time-slice experiments, and output conventions, enabling consistent intercomparison across modelling systems. Most configurations follow a one-way nesting strategy in which a convection-parameterizing RCM (typically 12–25 km resolution) provides boundary conditions for a convection-permitting nest at 2.2–4 km, driven by a CMIP5 GCM for historical and future periods (Ban et al., 2021; Pichelli et al., 2021). The CPM and RCM simulations available in our ensemble sample four of the six regional climate model families represented in the full CORDEX-FPS ensemble, namely: WRF (Weather Research and Forecasting model; Powers et al., 2017), AROME (Belušić et al., 2020; Fumière et al., 2020), the Unified Model (Berthou et al., 2020; Chan et al., 2020), and COSMO in climate mode (Baldauf et al., 2011; Rockel et al., 2008). Further details on these model families and their FPS-Convection configurations are summarized in Ban et al. (2021) and Coppola et al. (2020). In this work we use the GCM-driven free-running historical decade (1996–2005) for the configurations available.
We use hourly precipitation fields from nine CPM configurations produced within the CORDEX-FPS Convection program, see Table 1 for details. One Met Office Hadley Centre (MOHC) configuration (HadREM UM10.1) follows the CPM practice of direct nesting inside a high-resolution global model (25 km) and therefore uses 1998–2007 as the historical window. We note that the observational reference period available from CombiPrecip (2005–2024) does not overlap with the CPM historical decade (1996–2005). This mismatch is unavoidable given the start date of the radar–gauge record. We also acknowledge that a 20-year observational record and a 10-year simulation are relatively short for robust climatological analysis of extremes, particularly when considering long return periods. This, however, motivates our use of the non-asymptotic SMEV approach (Sect. 2.3.3). In the absence of an overlapping high-resolution observational period, we make a stationarity assumption, and therefore interpret differences primarily in terms of model bias and scale behaviour, while acknowledging that part of the discrepancy between datasets can reflect internal climate variability between non-overlapping decades.
Table 1List of the 9 CPM members used with the reference name, the original CPM name and resolution, and the coupled RCM with its resolution along with their driving GCMs. Institute short names are in bold; native model resolutions are given in italics.
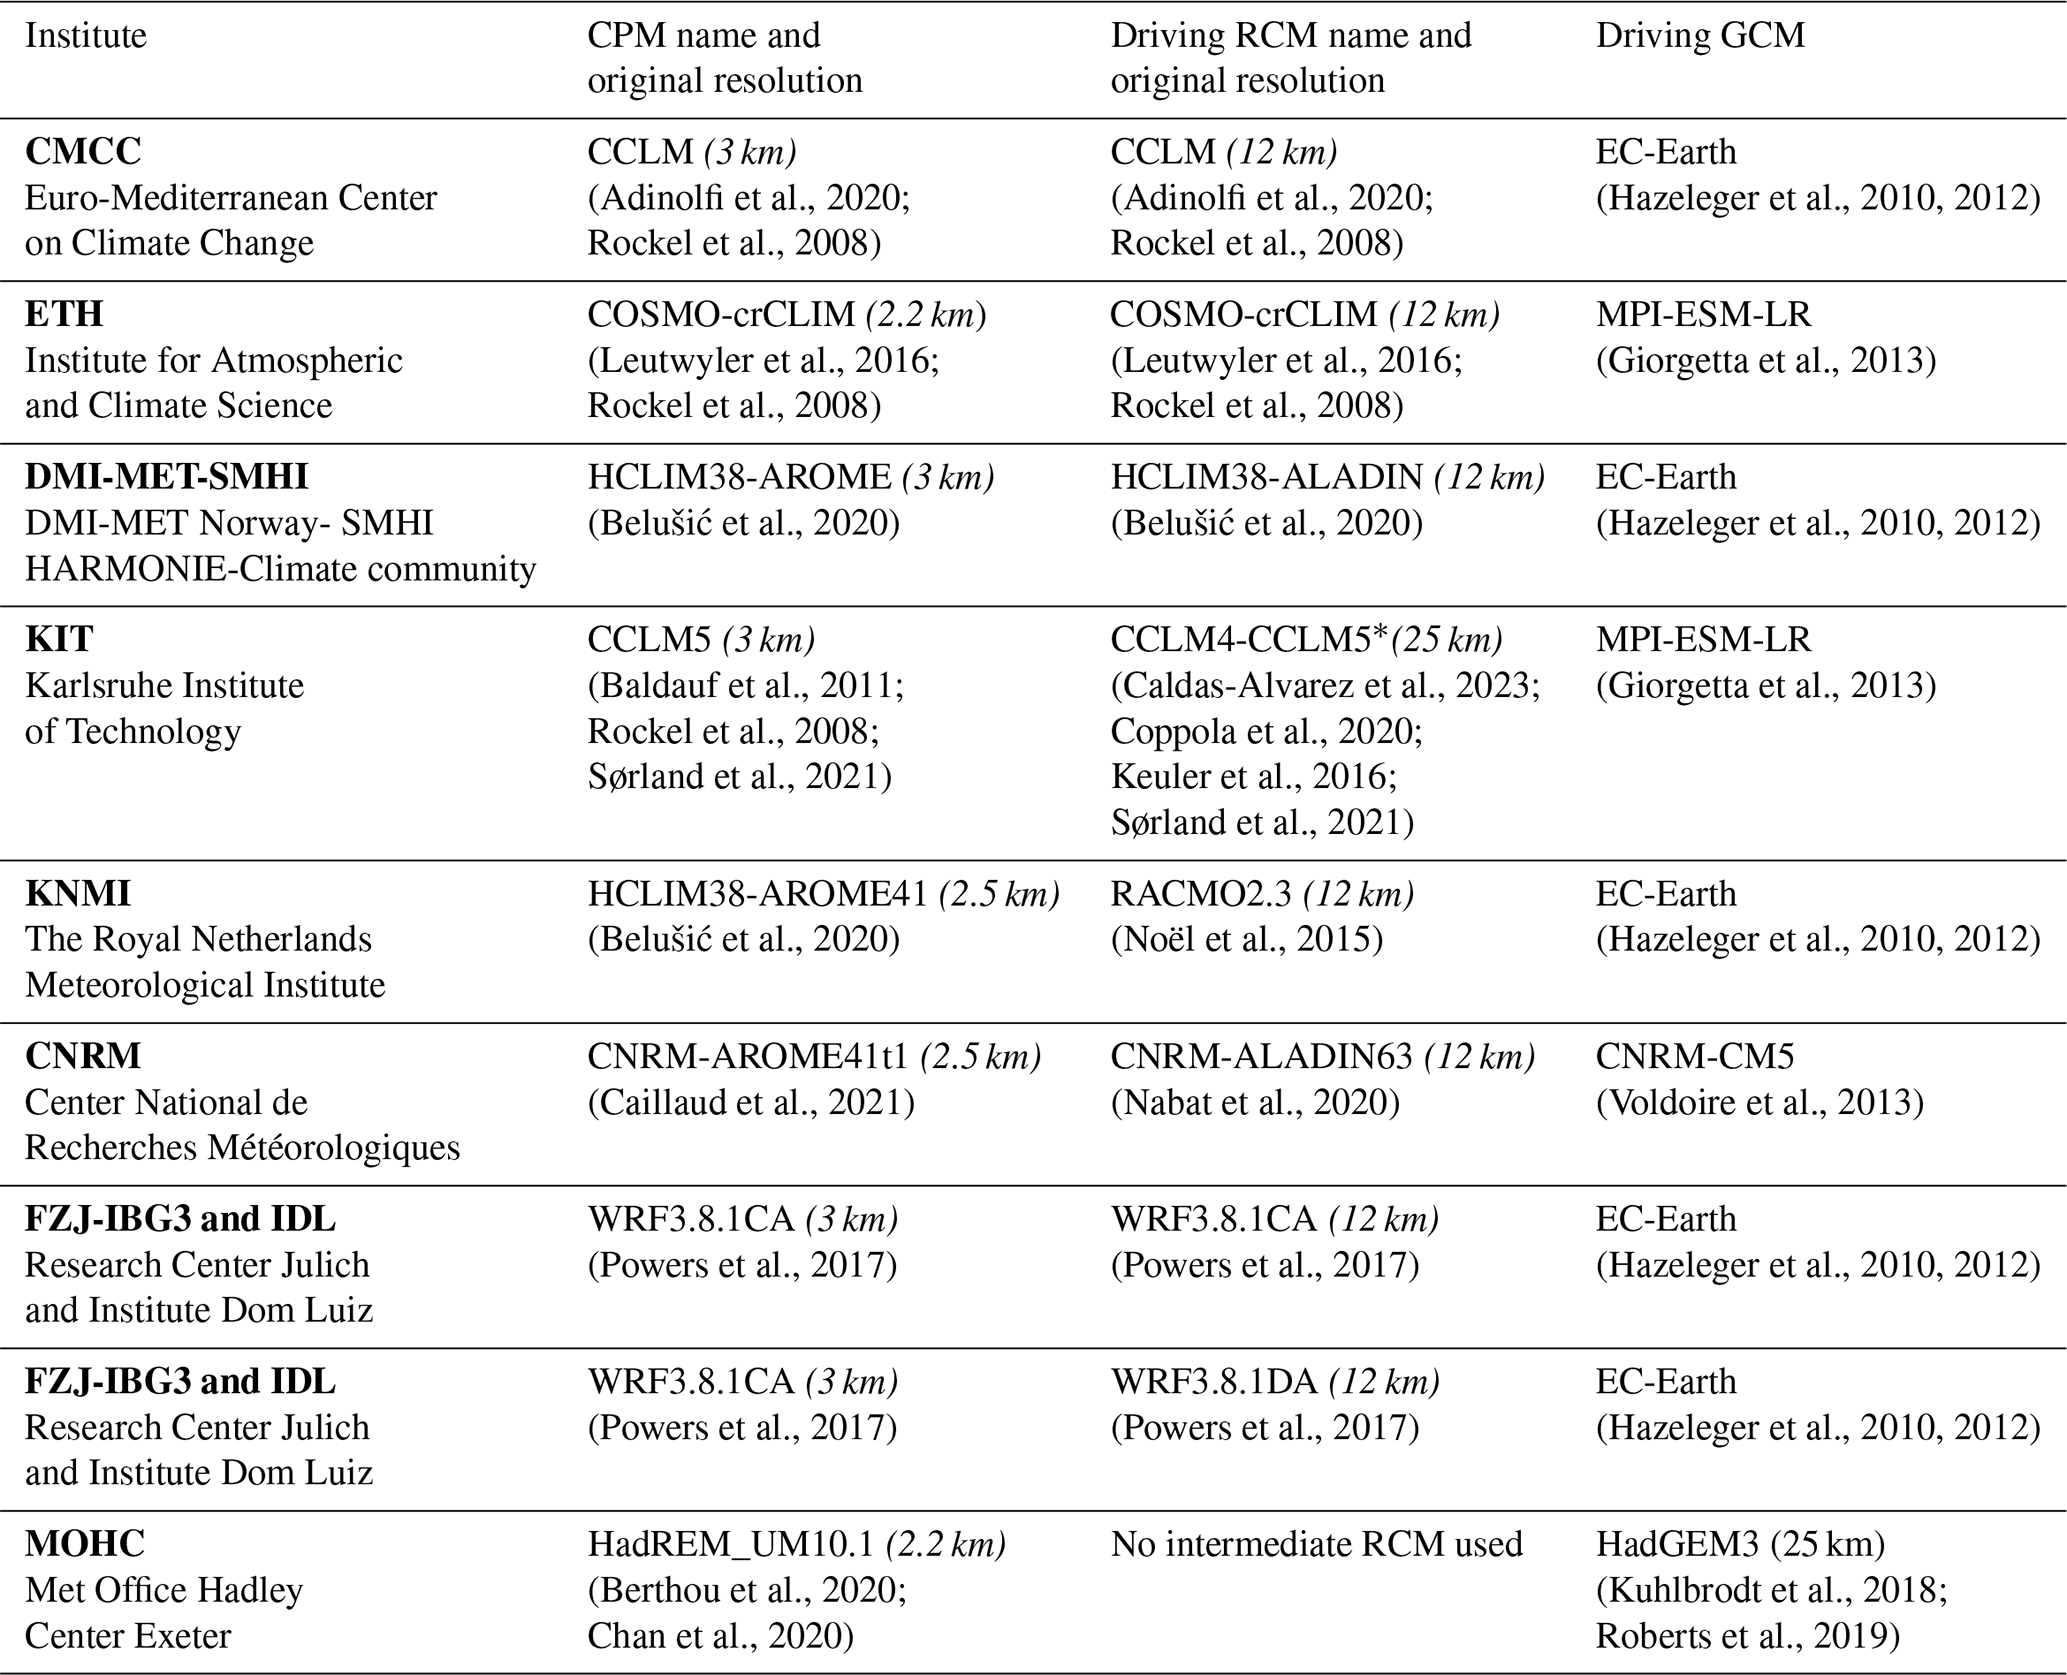
* The driving RCM is not available to us at the time of analysis.
To quantify the added value of kilometer-scale modelling, we also analyse the driving RCM simulations associated with the selected CPM configurations (Table 1).
2.3 Methodology
We adopt a common analysis workflow to ensure a consistent comparison between the observational reference dataset and the model ensemble across temporal and spatial aggregation scales. For brevity, we denote the observation product as OBS (CombiPrecip) and the model ensemble median as CPMs/RCMs. In summary, we (i) conservatively remap all datasets to the common grid, (ii) construct areal-mean precipitation time series using sliding windows and catchment outlines, (iii) estimate extreme precipitation return levels with the Simplified Metastatistical Extreme Value (SMEV) framework (Marra et al., 2019), (iv) evaluate scale-dependent biases in areal precipitation extremes, for both CPMs and their driving RCMs, and (v) estimate the within-window spatial variability of areal precipitation extremes.
2.3.1 Conservative remapping
Because the observational and model datasets differ in coordinate reference system (CRS) and horizontal resolution, we first remap all fields to regular latitude-longitude grids to ensure a common grid for the subsequent areal aggregation and extreme-value analysis. Specifically, OBS and all CPM models are conservatively remapped to a 0.0275° grid (≈ 3 km), while all RCM models are conservatively remapped to a 0.11° grid (≈ 12 km). The remapping is performed with the conservative scheme implemented in the Climate Data Operators (CDO) package (Schulzweida, 2022), which preserves areal mean precipitation. Although we are aware that remapping can introduce potential biases (Rajulapati et al., 2021), using common grids is required here because our evaluation is carried out on a pixel-to-pixel basis and relies on consistent spatial sampling across OBS, CPMs, and RCMs.
2.3.2 Spatial aggregation of precipitation time series
For OBS, CPMs and RCMs alike, we derive areal mean precipitation time series using a sliding, square window centered on each grid cell (see Fig. 1c). For the OBS and CPM models, window sizes include side lengths g ∈ pixels, corresponding to g × g pixel windows yielding effective areas from A ≈ 9 up to A ≈ 3969 km2. For the RCM models, given their coarser native resolution, the analysis spans side lengths g ∈ pixels (g × g windows), corresponding to effective areas from A ≈ 144 up to A ≈ 5184 km2. At each hour t and for each center cell i, the areal mean Pi,g(t) is the arithmetic average of precipitation within the g × g window. This sliding-window procedure produces, for every grid cell, a stack of time series {Pi,g(t)} spanning the various spatial scales considered here.
For the catchment-based aggregation, we additionally construct Pj(t) for 143 selected nested catchments within the study domain (see Fig. 1a), with areas ranging from 10 to 5238 km2. Mean areal precipitation for each catchment is computed using areal weighting based on pixel-area fractions falling within each catchment outline.
2.3.3 Estimation of extreme precipitation return levels
We estimate areal precipitation return levels for different return periods (2-, 5-, 10-, 20-, and 50-years) and durations (1-, 3-, 6-, 12-, and 24-h) by applying the Simplified Metastatistical Extreme Value (SMEV) approach proposed by Marra et al. (2019, 2020). The SMEV is a non-asymptotic approach that explicitly accounts for the distribution of the intensity of independent “ordinary” events (maximum intensity for a duration of interest within an independent storm event) and the finite occurrence frequency of these events. In contrast to the asymptotic theory leading to the Generalized Extreme Value distribution (Fisher and Tippett, 1928), it can be applied by using a large fraction of the observations, rather than just the yearly maxima or a few values above a high threshold (Fisher and Tippett, 1928; Gnedenko, 1943; Jenkinson, 1955; Tocher and Gumbel, 1955). Several previous studies have shown the advantages of non-asymptotic approaches in general, and of the SMEV approach in particular, in estimating extreme return levels with respect to traditional approaches, especially from short-record lengths as it is the case for CPM simulations (Dallan et al., 2024a; Poschlod and Koh, 2024; Vidrio-Sahagún et al., 2025; Vidrio-Sahagún and He, 2022; Zorzetto et al., 2024). Moreover, SMEV has been applied to areal and catchment-scale precipitation extremes (Rosin et al., 2024; Vohnicky et al., 2025).
Once the tail of the ordinary events distribution is known, the cumulative probability distribution function of the yearly maxima can be expressed as:
where n is the average number of ordinary events per year, and F(x) is the cumulative distribution function describing the intensity, x, of the ordinary events.
In the case of precipitation, the tail of the parent distribution F(x) is modeled using a two-parameter Weibull distribution (Weibull, 1951), a choice based on physically-based assumptions rooted in atmospheric physics (Wilson and Toumi, 2005) and supported by observations (Papalexiou et al., 2018; Papalexiou and Koutsoyiannis, 2013). The Weibull cumulative distribution function can be written as follows:
where x is the precipitation intensity and λ and k are the scale and shape parameters of the Weibull distribution, respectively.
The SMEV approach requires the identification of independent storms (Marra et al., 2020). We here define them as wet periods separated by dry intervals with less than 0.1 mm of precipitation recorded over at least 24 consecutive hours (see also Dallan et al., 2024b). For each storm, we identify the peak intensity x for the specific duration of interest, resulting in a series of “ordinary events”. The Weibull distribution is then fitted to the upper tail of the ordinary event series, which is identified by a left-censoring threshold. Following Dallan et al. (2023, 2024b) and employing the test by Marra et al. (2023), we select the 85th percentile of the ordinary events as the left-censoring threshold across all durations (refer to Fig. S1 for detailed description on the selection of optimal left-censoring threshold). It is important to recall that (i) this left censoring operation is not equivalent to threshold exceedance methods, and that (ii) when the Weibull tail model is adequate, there is no sensitivity to the exact choice of this threshold, meaning that any threshold higher than a certain “optimal threshold” will lead to the same estimates (Marra et al., 2019, 2023).
Return levels associated with a return period of T-years are determined by inverting the SMEV cumulative distribution function in Eq. (1), for each grid cell i, effective area A, and duration D. For CPMs and RCMs, specifically we first estimate return levels separately for each model member at every grid cell. Ensemble summaries are obtained by computing, at each grid cell, the median of the return levels estimated for individual members, which defines the ensemble-median CPM and RCM return levels.
2.3.4 Bias metric
The bias of precipitation simulations as compared to observations is evaluated at both single-member and ensemble-median level, as follows:
where is the ensemble-median and individual-member CPM/RCM return levels, and is the CombiPrecip (OBS) estimate for grid cell i, effective area A and duration D respectively. Biases are always computed at matched effective areas, however, for the RCMs this means comparing each RCM aggregation window against the OBS aggregation window whose effective area is closest to the RCM's. Values > 1 indicate CPM/RCM overestimation of the OBS return level; values < 1 indicate underestimation. Then we quantify model skill relative to OBS, through three summary metrics in the study domain: spatial correlation (r), mean bias, and spatial variability ratio (VR), defined as the ratio of the spatial standard deviation in the model field to that in OBS (Ban et al., 2021).
We summarize bias by its mean value for each duration and spatial scale, over the study domain and by elevation bands. For the elevation-based analysis, we partition the domain into three elevation groups with approximately an equal number of grid cells: G1 (259–1000 m), G2 (1000–1700 m), and G3 (1700–3612 m). The elevation assigned to each grid cell depends on the spatial aggregation scale considered: for a window size g, each cell is assigned the median elevation within its g × g window, so that the elevation classification is consistent with the spatial scale at which the precipitation field is aggregated. Additionally, we assess the ensemble agreement on the direction of the bias at each pixel, by flagging grid cells where more than 40 % individual members disagree with the ensemble-median bias direction (≥ 4 CPM members, out of 9, and ≥ 3 RCM members, out of 7).
2.3.5 Estimation of spatial heterogeneity
To interpret how CPM and RCM biases to OBS in areal precipitation extremes evolve with spatial scales, we investigate the within-window coefficient of variation (CV) for annual maximum precipitation, which quantifies the spatial heterogeneity of extreme precipitation within the averaging window:
where σi,g and are the within-window spatial standard deviation and spatial mean of extreme precipitation. Note that CV here is calculated at each grid cell i, window size g and at the time (t) of annual maximum precipitation. In addition to this analysis, an areal reduction factor is calculated across the datasets for the estimated return levels, which summarizes the rate at which the intensity of extreme precipitation decreases with increasing area.
where for each datasets, is the estimated return level at grid cell i, effective area A and duration D respectively, and is the estimated return level at grid cell i, and duration D for the smallest area Amin.
3.1 Spatial pattern of extreme precipitation
The spatial distribution of the 20-year return levels of hourly extreme precipitation (1 h–20 years) for CombiPrecip (OBS), CPMs and RCMs is presented in Fig. 2 for the smallest and for the ≈ 1000 km2 spatial scale. At the smallest scale (Fig. 2a; ≈ 9 km2), the OBS field exhibits the largest 1 h–20-year extreme precipitation values over the Southern Alps (Ticino region), Prealps and parts of Jura mountains, with relatively lower values occurring over the Alps and the Plateau (see Fig. 1 for an overview of the location of these regions). After aggregation to areas of ≈ 1089 km2 (Fig. 2b), the small-scale variability in OBS is reduced and the field becomes smoother, but the distinct regions of maxima observed at 9 km2 remain evident. The CPM ensemble-median reproduces these spatial features at both spatial scales relatively well (Fig. 2c–d; r = 0.72 and 0.56), while underestimating the spatial variability of OBS at 9 km2 (VR = 0.43) but matching it better after areal aggregation to ≈ 1089 km2 (VR = 0.97). In contrast, the RCM ensemble-median shows weaker spatial contrast and low variability (Fig. 2e–f; VR = 0.28–0.47), despite its moderate spatial correlations (r ≈ 0.5).
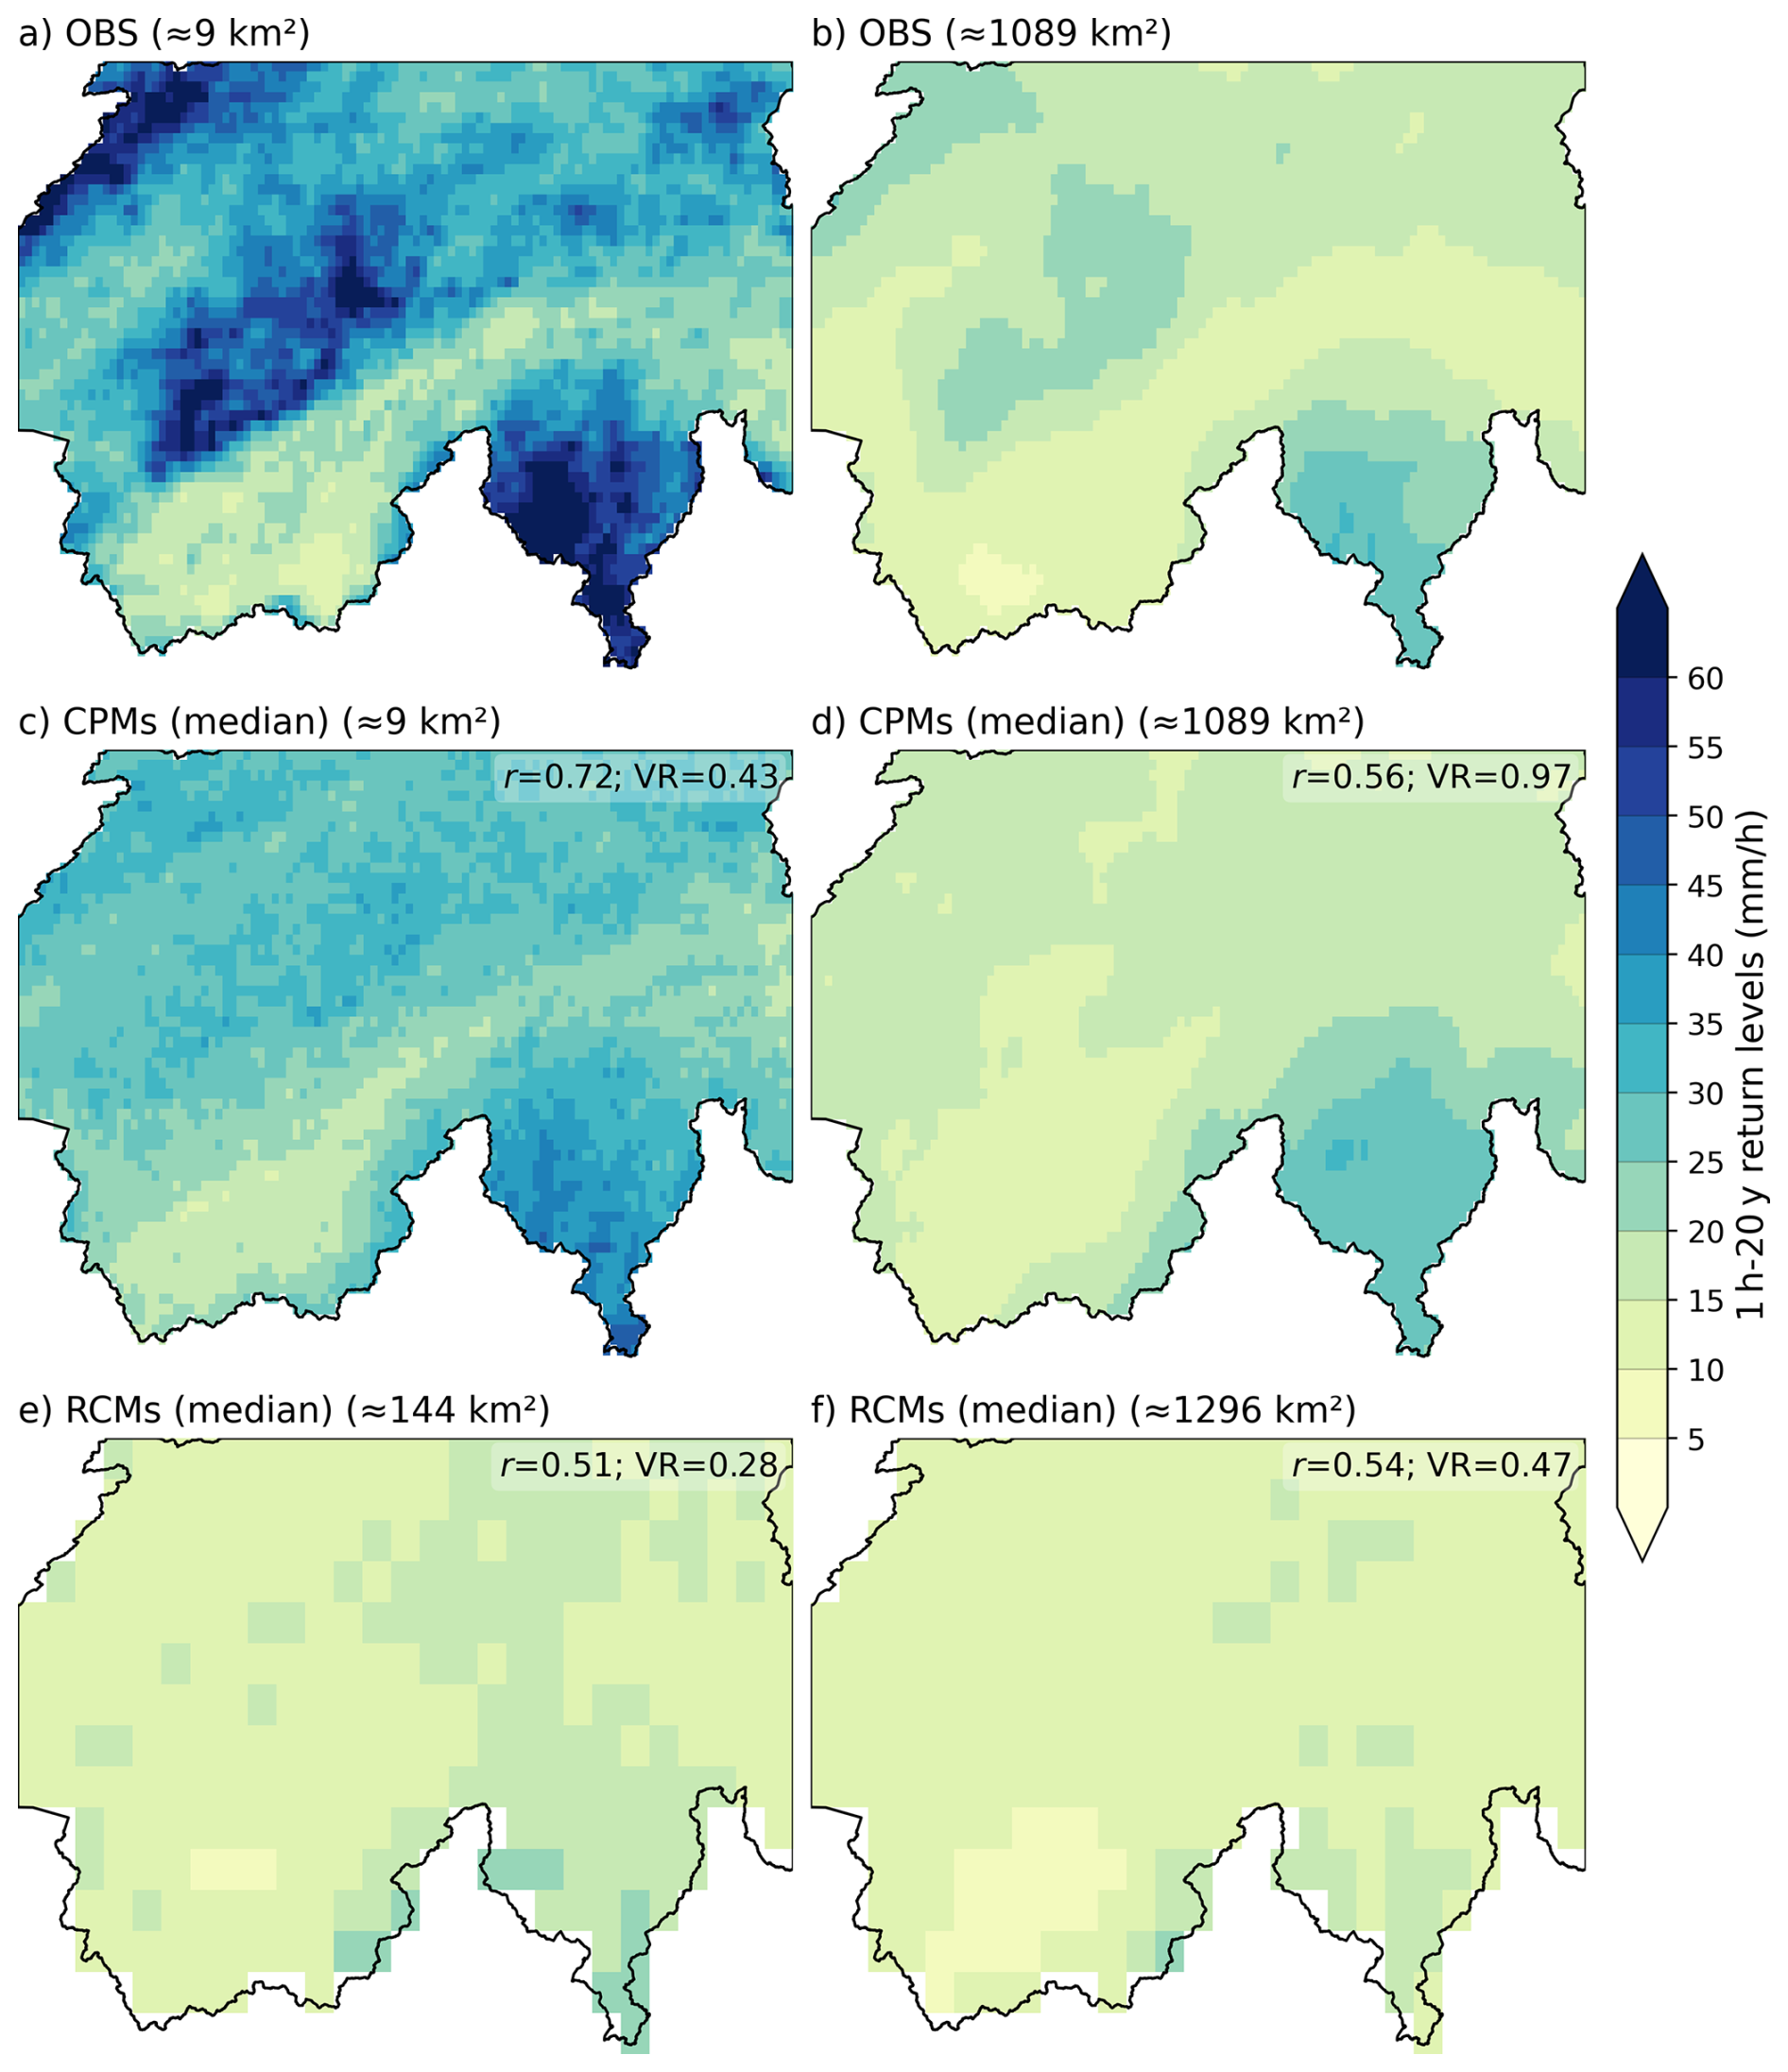
Figure 2Spatial distribution of 1 h–20-year extreme precipitation return levels over Switzerland for CombiPrecip (OBS) and model ensemble medians at smallest and aggregated spatial scales. (a–b) Observational field at ≈ 9 and ≈ 1089 km2. (c–d) CPM ensemble-median at ≈ 9 and ≈ 1089 km2. (e–f) RCM ensemble-median at ≈ 144 and ≈ 1296 km2. In each model panel, r denotes the spatial correlation with OBS and VR the variability ratio (model OBS; ratio of spatial standard deviations).
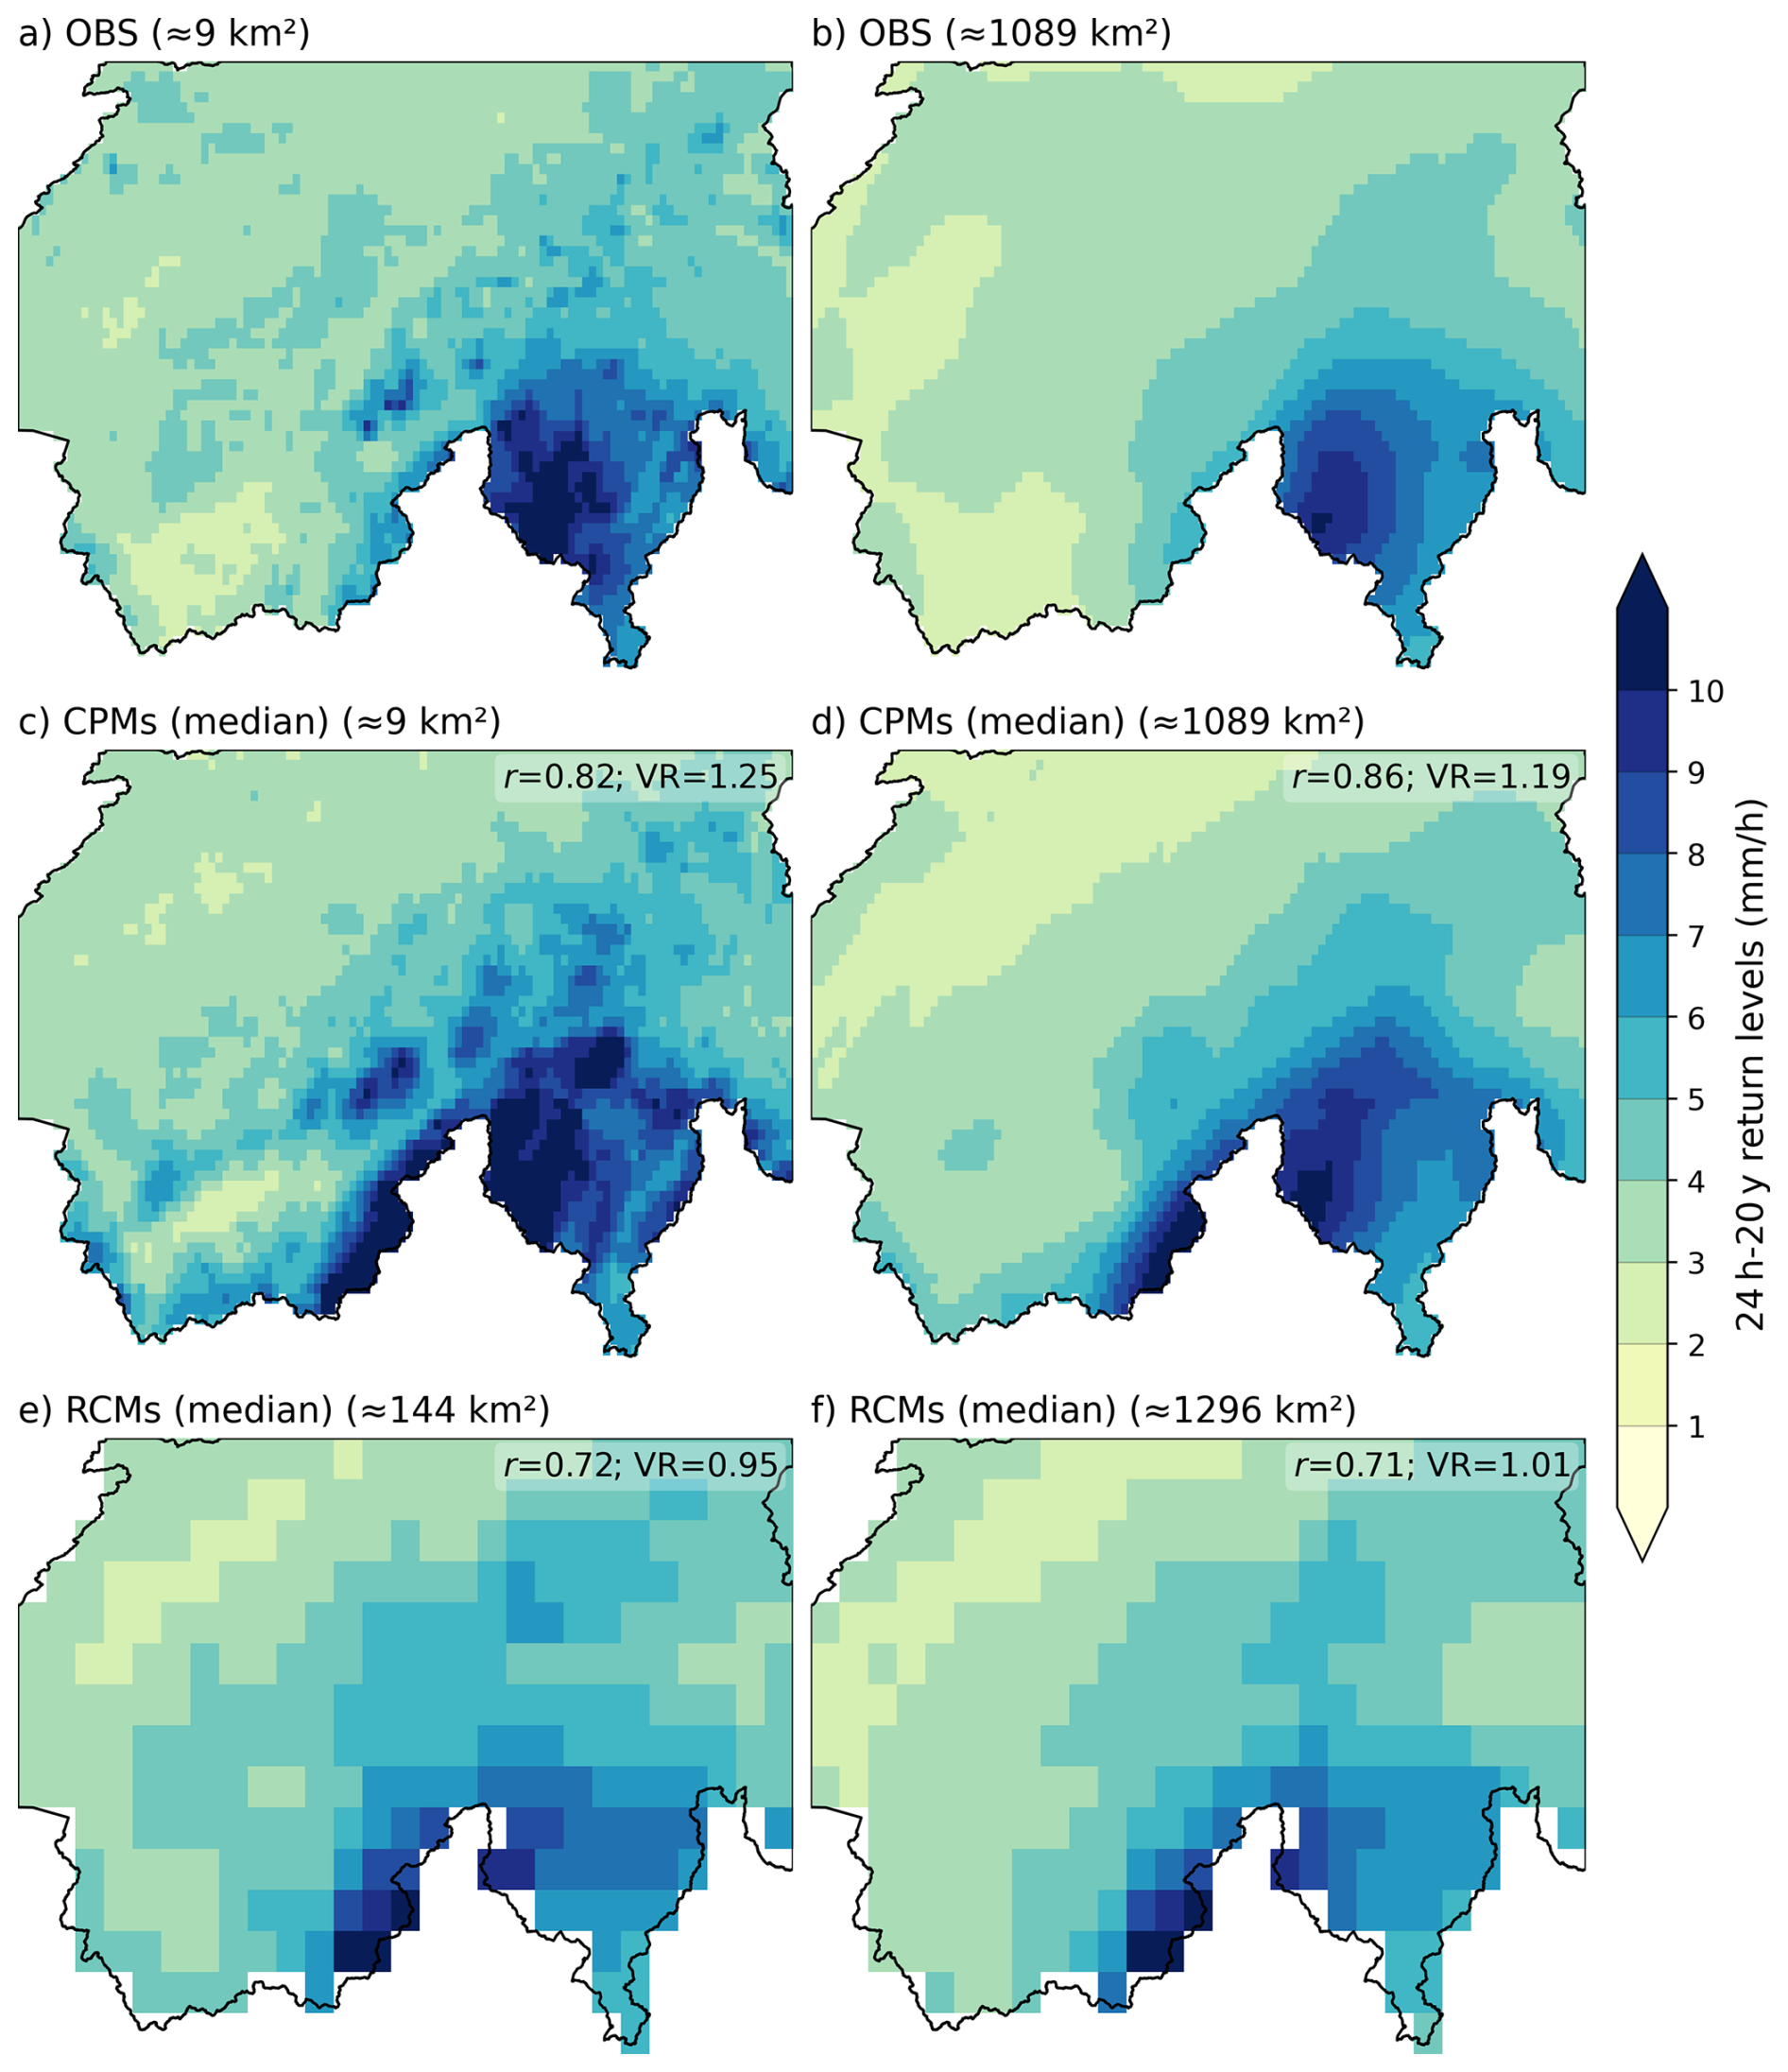
Figure 3Spatial distribution of 24 h–20-year extreme precipitation return levels over Switzerland for CombiPrecip (OBS) and model ensemble medians at smallest and aggregated spatial scales. (a–b) Observational field at ≈ 9 and ≈ 1089 km2. (c–d) CPM ensemble-median at ≈ 9 and ≈ 1089 km2. (e–f) RCM ensemble-median at ≈ 144 and ≈ 1296 km2. In each model panel, r denotes the spatial correlation with OBS and VR the variability ratio (model OBS; ratio of spatial standard deviations).
For 24 h–20-year extreme precipitation return levels, OBS (Fig. 3a; ≈ 9 km2) shows a distinct south-north gradient with the most intense daily extremes located over the Southern Alps and adjacent regions, along with secondary maxima aligned with major orographic features. At ≈ 1089 km2 (Fig. 3b), the 24 h–20-year return levels remain highest over the Southern Alps, and the overall south-north contrast in return level intensities is still clearly evident. The CPM ensemble-median reproduces this large-scale organization well at both scales (Fig. 3c–d; r = 0.82–0.86), but with slightly higher spatial variability compared to OBS (VR = 1.19–1.25). The RCM ensemble-median captures the broad south-north gradient of return level intensities (Fig. 3e–f; r ≈ 0.71–0.72) and shows variability closer to OBS (VR ≈ 0.95–1.01), although with a smoother representation of the spatial structure. Similar results are obtained for mean annual maximum precipitation (mean AM; Figs. S2 and S3).
As shown in Fig. 4 (see also Table S1 in the Supplement), both r and VR vary substantially across individual CPM members for 1 h–20-year return levels at the native scale (r = 0.35–0.67, VR = 0.39–0.89), with the corresponding RCM statistics being systematically lower. After aggregation to an order of ≈ 103 km2, most CPMs show improvement in VR values, moving closer to unity. For the 24 h–20-year return levels, all members show higher correlations and variability ratios closer to unity already at the native scale, indicating a better reproduction of the spatial organization of daily extremes across both ensembles. Mean bias values follow the areal- and duration-dependent patterns examined in detail in Sect. 3.3.
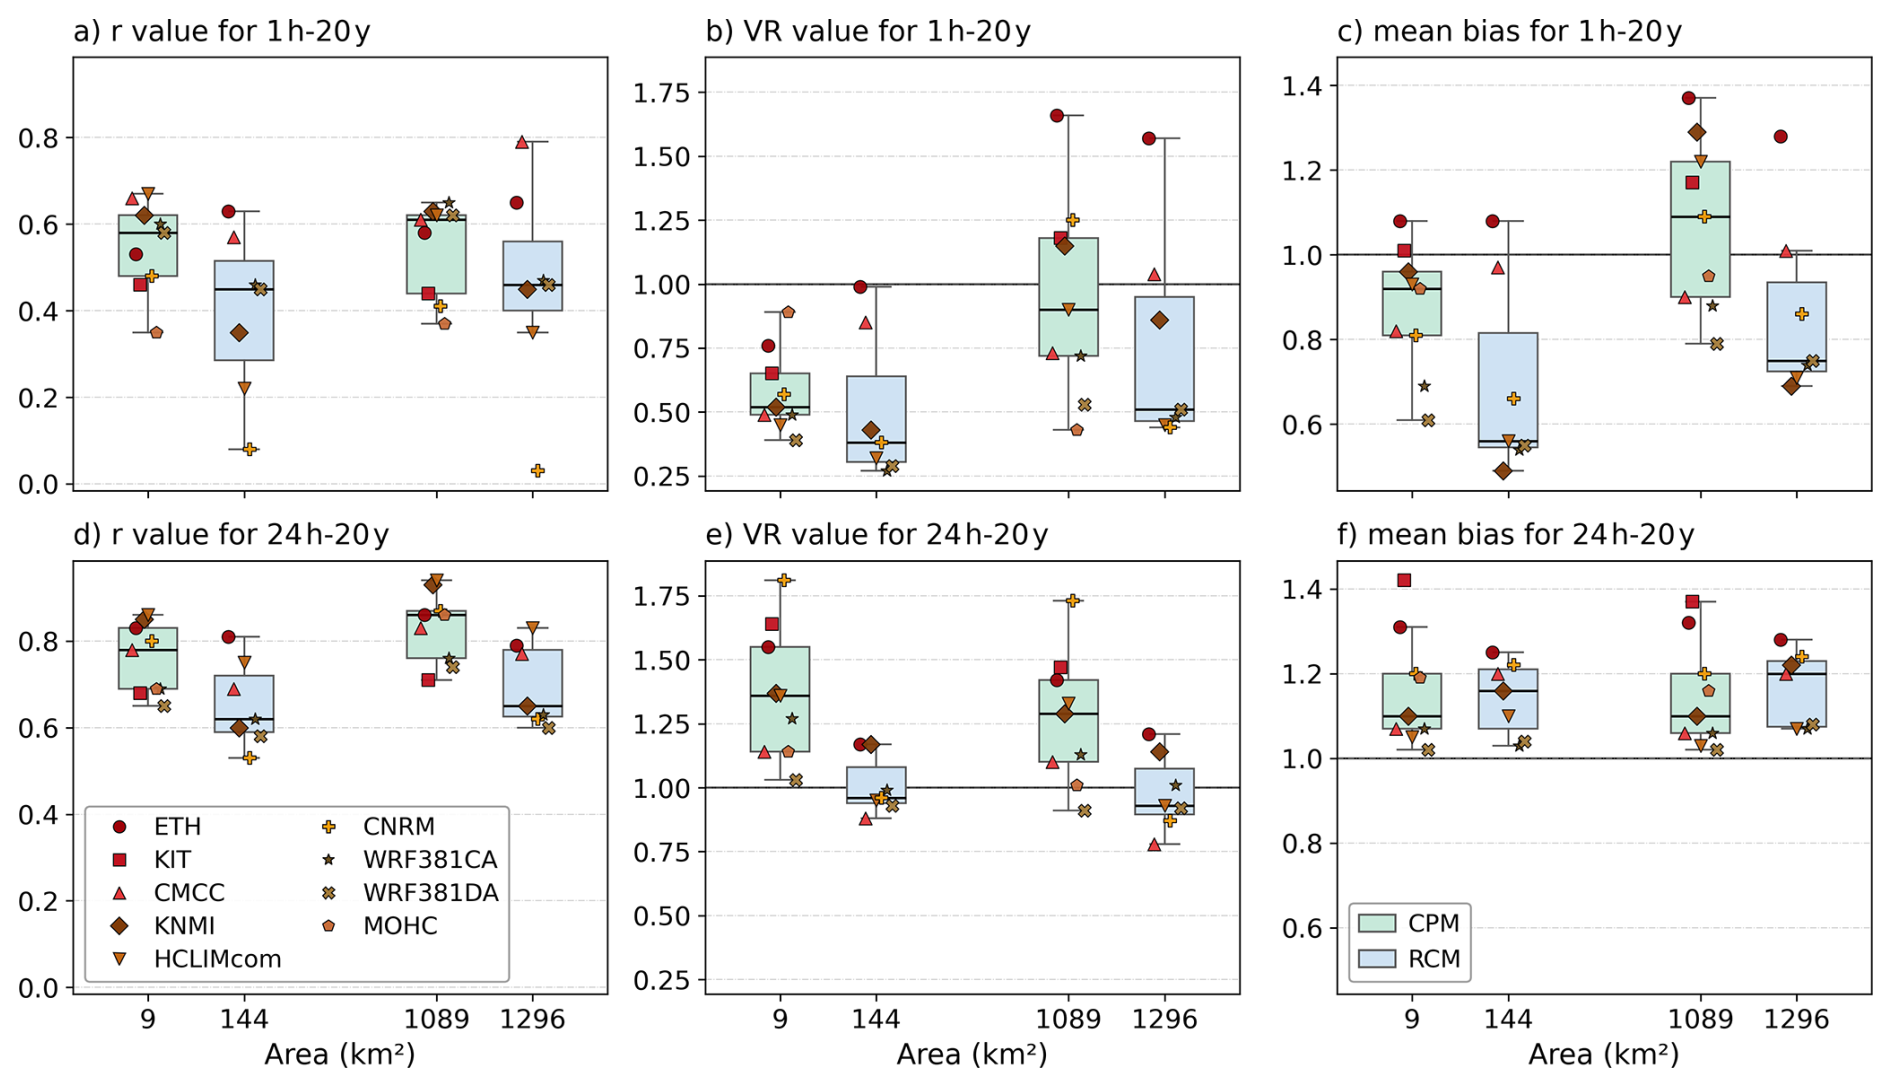
Figure 4Per-member spatial correlation (r, a, d), variability ratio (VR, b, e), and mean bias (c, f) of CPM and RCM return levels relative to CombiPrecip (OBS), for 1 h–20-year (top row) and 24 h–20-year (bottom row) return levels. Statistics are reported at two spatial scales: smallest area (≈ 9 km2 for CPMs and ≈ 144 km2 for RCMs) and aggregated area (≈ 1089 km2 for CPMs and ≈ 1296 km2 for RCMs). For the return-level fields across the study domain, r is the Pearson spatial correlation between the model and OBS; VR is the ratio of model-to-OBS spatial standard deviations; mean bias is the model-to-OBS ratio of return levels averaged over the study domain. Box color denotes model family (light green for CPM and light blue for RCM) and the black line marks the median. Individual models are shown with a unique marker-color combination as indicated in the legend.
3.2 Spatial patterns of CPM/RCM bias
We identify areas in which CPMs and their driving RCMs systematically over- or underestimate the OBS extreme precipitation return levels, and in which the ensemble members agree on the sign of that bias.
For the 1 h–20-year extremes at the smallest 9 km2 scale (Fig. 5a), CPMs systematically underestimate precipitation across much of the Prealps, the Jura Mountains, and Ticino, with underestimation values below 0.6 (i.e., < 60 % of OBS). Localized overestimation (≈ 1.2–1.4) occurs mainly along Alpine peaks. After aggregation to 1089 km2 (Fig. 5b), fine-scale noise in the 1 h bias field is reduced. A clearer north–south contrast emerges, with underestimation (≈ 0.8–0.9) over the Jura and most of the Prealps, and stronger overestimation (> 1.2) toward the southern edge of the domain. Non-concordant cells occur mainly in transition zones between under- and overestimation.
For the 24 h–20-year precipitation extremes (Fig. 5c–d), the CPM ensemble median exhibits weaker and more spatially coherent biases than for 1 h, with underestimation (≈ 0.9–0.7) over parts of the northern lowlands (the Swiss Plateau and Jura) and a marked band of overestimation (> 1.4) along the southern Alpine flank. Aggregation to 1089 km2 further emphasizes this north-south contrasting pattern of biases relative to OBS.
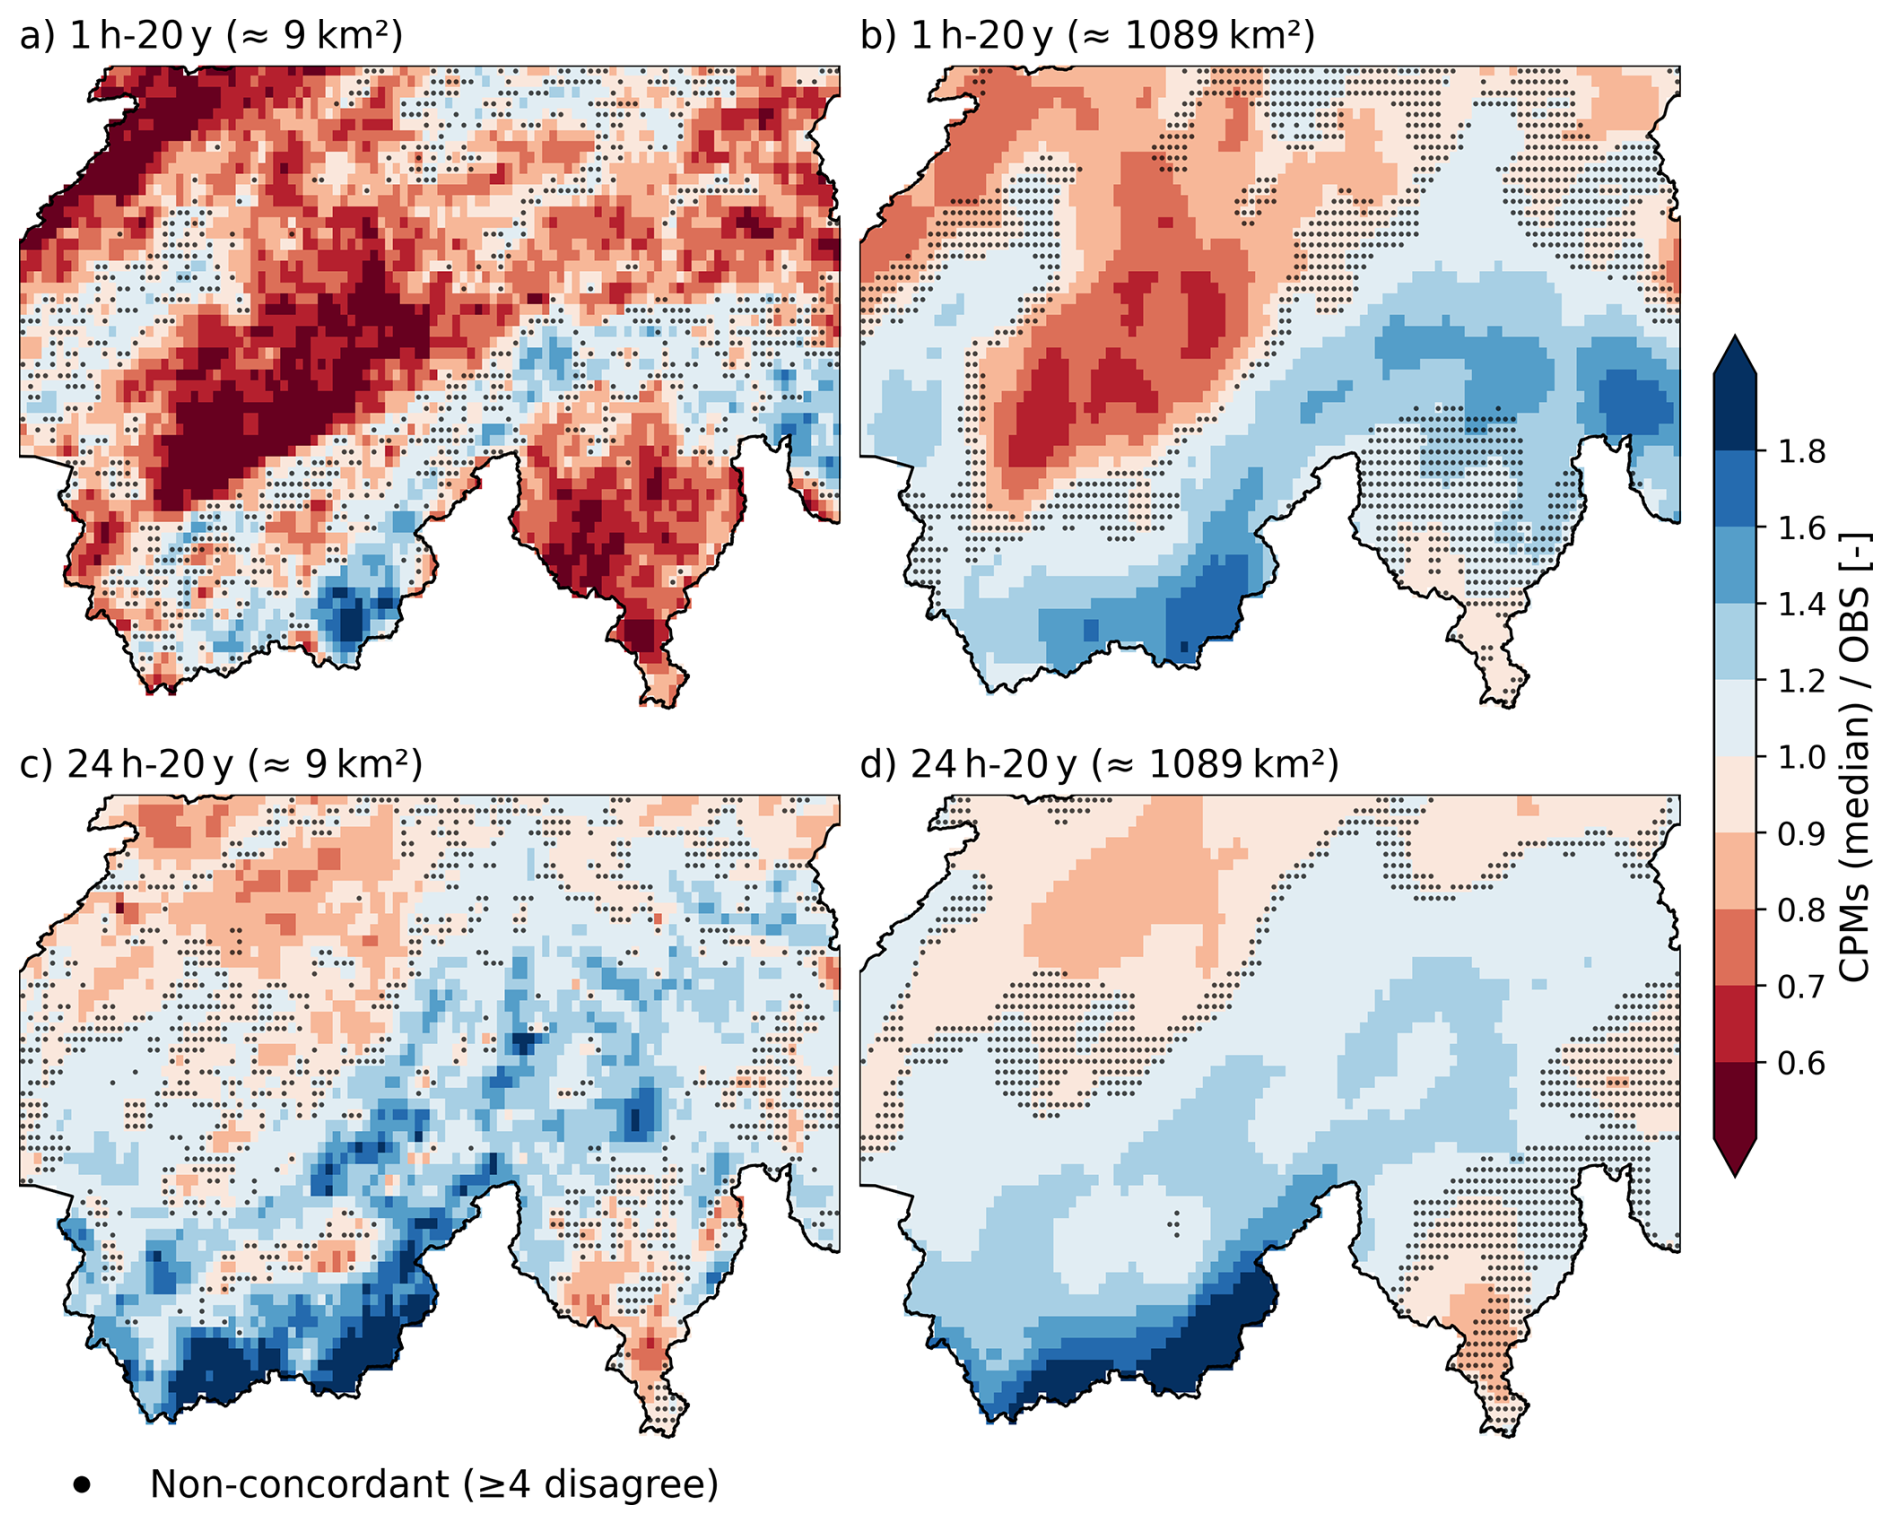
Figure 5Spatial patterns of the bias of the CPM ensemble median relative to CombiPrecip (OBS) for 20-year extreme precipitation at 1 h (a, b) and 24 h (c, d) durations. Panels (a) and (c) show biases at the native CPM resolution (approximately 9 km2), while panels (b) and (d) present results after spatial aggregation to areas of about 1089 km2 (11 × 11 grids). Bias is expressed as the ratio CPM OBS, where values above 1 indicate overestimation. Black dots mark non-concordant grid cells, defined as locations where four or more CPM members disagree on the sign of the bias.
The driving RCMs show a more spatially extensive and uniform underestimation (≤ 0.6) for 1 h–20-year extreme precipitation at ≈ 144 km2 (Fig. 6a), with a reduction in magnitude (≤ 0.8) after aggregation to ≈ 1296 km2 (Fig. 6b). For 24 h extreme precipitation (Fig. 6c–d), biases are weaker with values closer to unity and regionally varying over- and underestimation. The spatial pattern of biases becomes smoother after aggregation to ≈ 1296 km2; overall, RCM members largely agree on the sign of the bias across temporal and spatial scales.
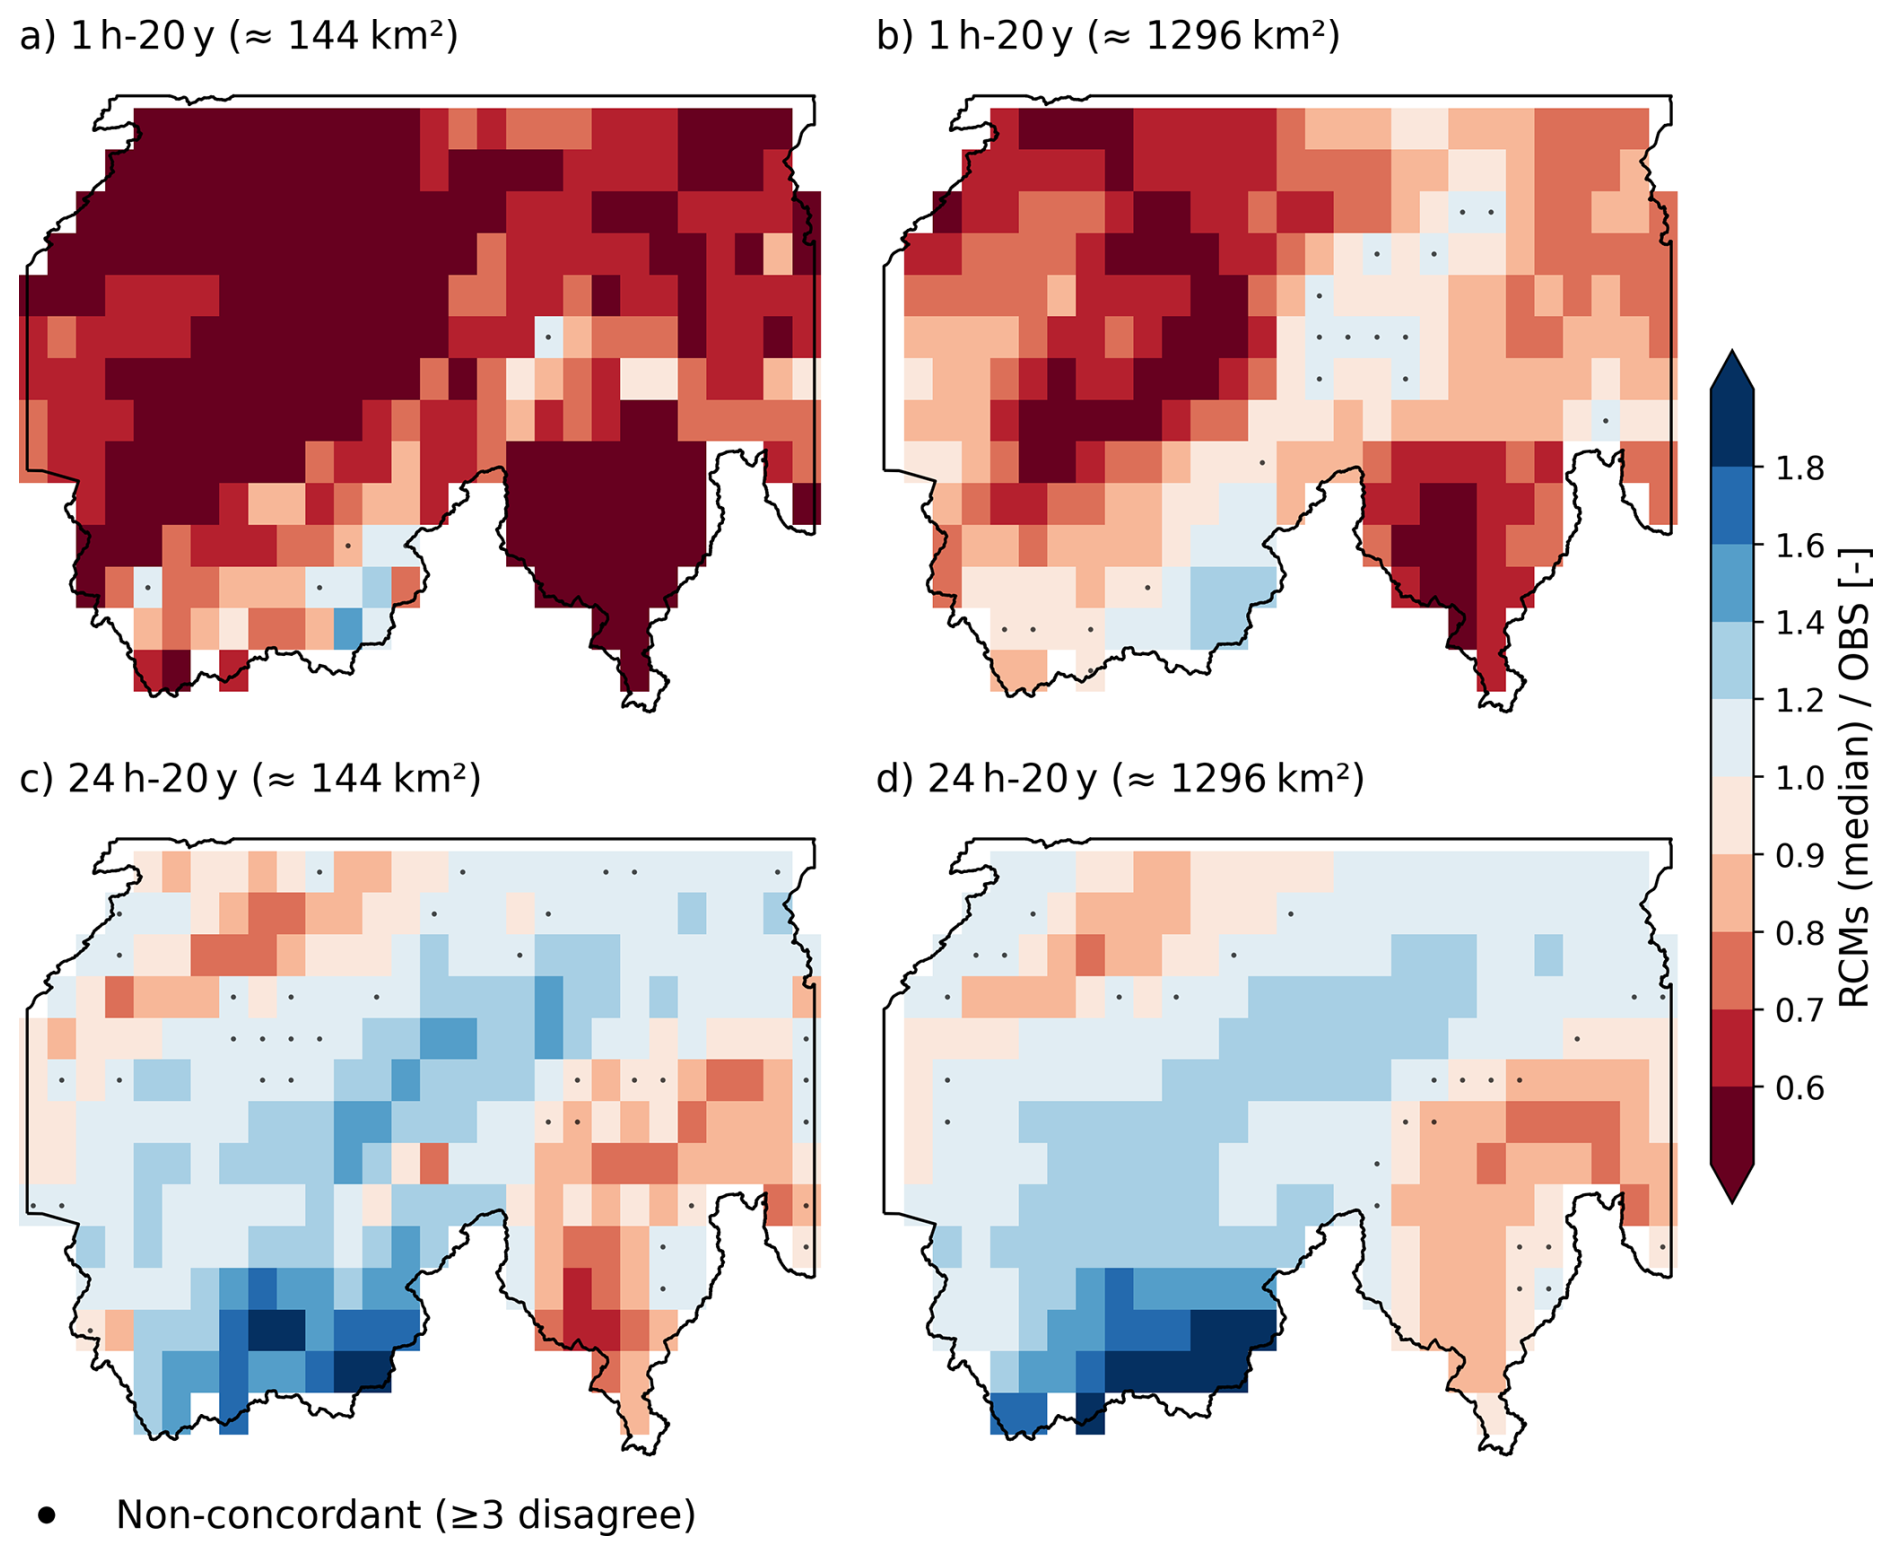
Figure 6Spatial patterns of bias of the RCM ensemble median relative to CombiPrecip (OBS) for 20-year extreme precipitation at 1 h (a, b) and 24 h (c, d) durations. Panels (a) and (c) show biases at the native RCM resolution (approximately 144 km2), while panels (b) and (d) present results after spatial aggregation to areas of about 1296 km2 (3 × 3 grids). Bias is expressed as the ratio RCM OBS, where values above 1 indicate overestimation. Black dots mark non-concordant grid cells, defined as locations where 3 or more RCM members disagree on the sign of the bias.
The bias patterns of CPMs/RCMs for mean annual maximum precipitation (mean AM) are presented in Figs. S4 and S5 and show an overall similar spatial pattern in the bias of 1 h and 24 h 20-year return levels.
3.3 Space and time scale dependence of model bias
This section examines how CPM and RCM biases vary with spatial aggregation and duration, using regional moving-window averages and catchment-based estimates.
For 1 h–20-year extremes (Fig. 7a), the CPM ensemble median underestimates observations at small areas (≈ 0.85 at ≈ 9 km2). The bias magnitude decreases with area increase, becomes neutral at a few hundred to ∼ 1000 km2, and turns into overestimation at larger scales (≈ 1.15–1.2). Member spread is large at all scales, though the median behavior is consistent except for MOHC. Two COSMO configurations (ETH, KIT) overestimate observations across all areas, while two WRF models consistently underestimate them. RCMs show stronger underestimation at native resolution (≈ 0.6 at ≈ 144 km2) and improve with spatial aggregation, but remain below unity even over the largest areas (≈ 0.9). The ETH RCM overestimates extreme precipitation at all scales, whereas KNMI (AROME) and both WRF configurations show the strongest underestimation.
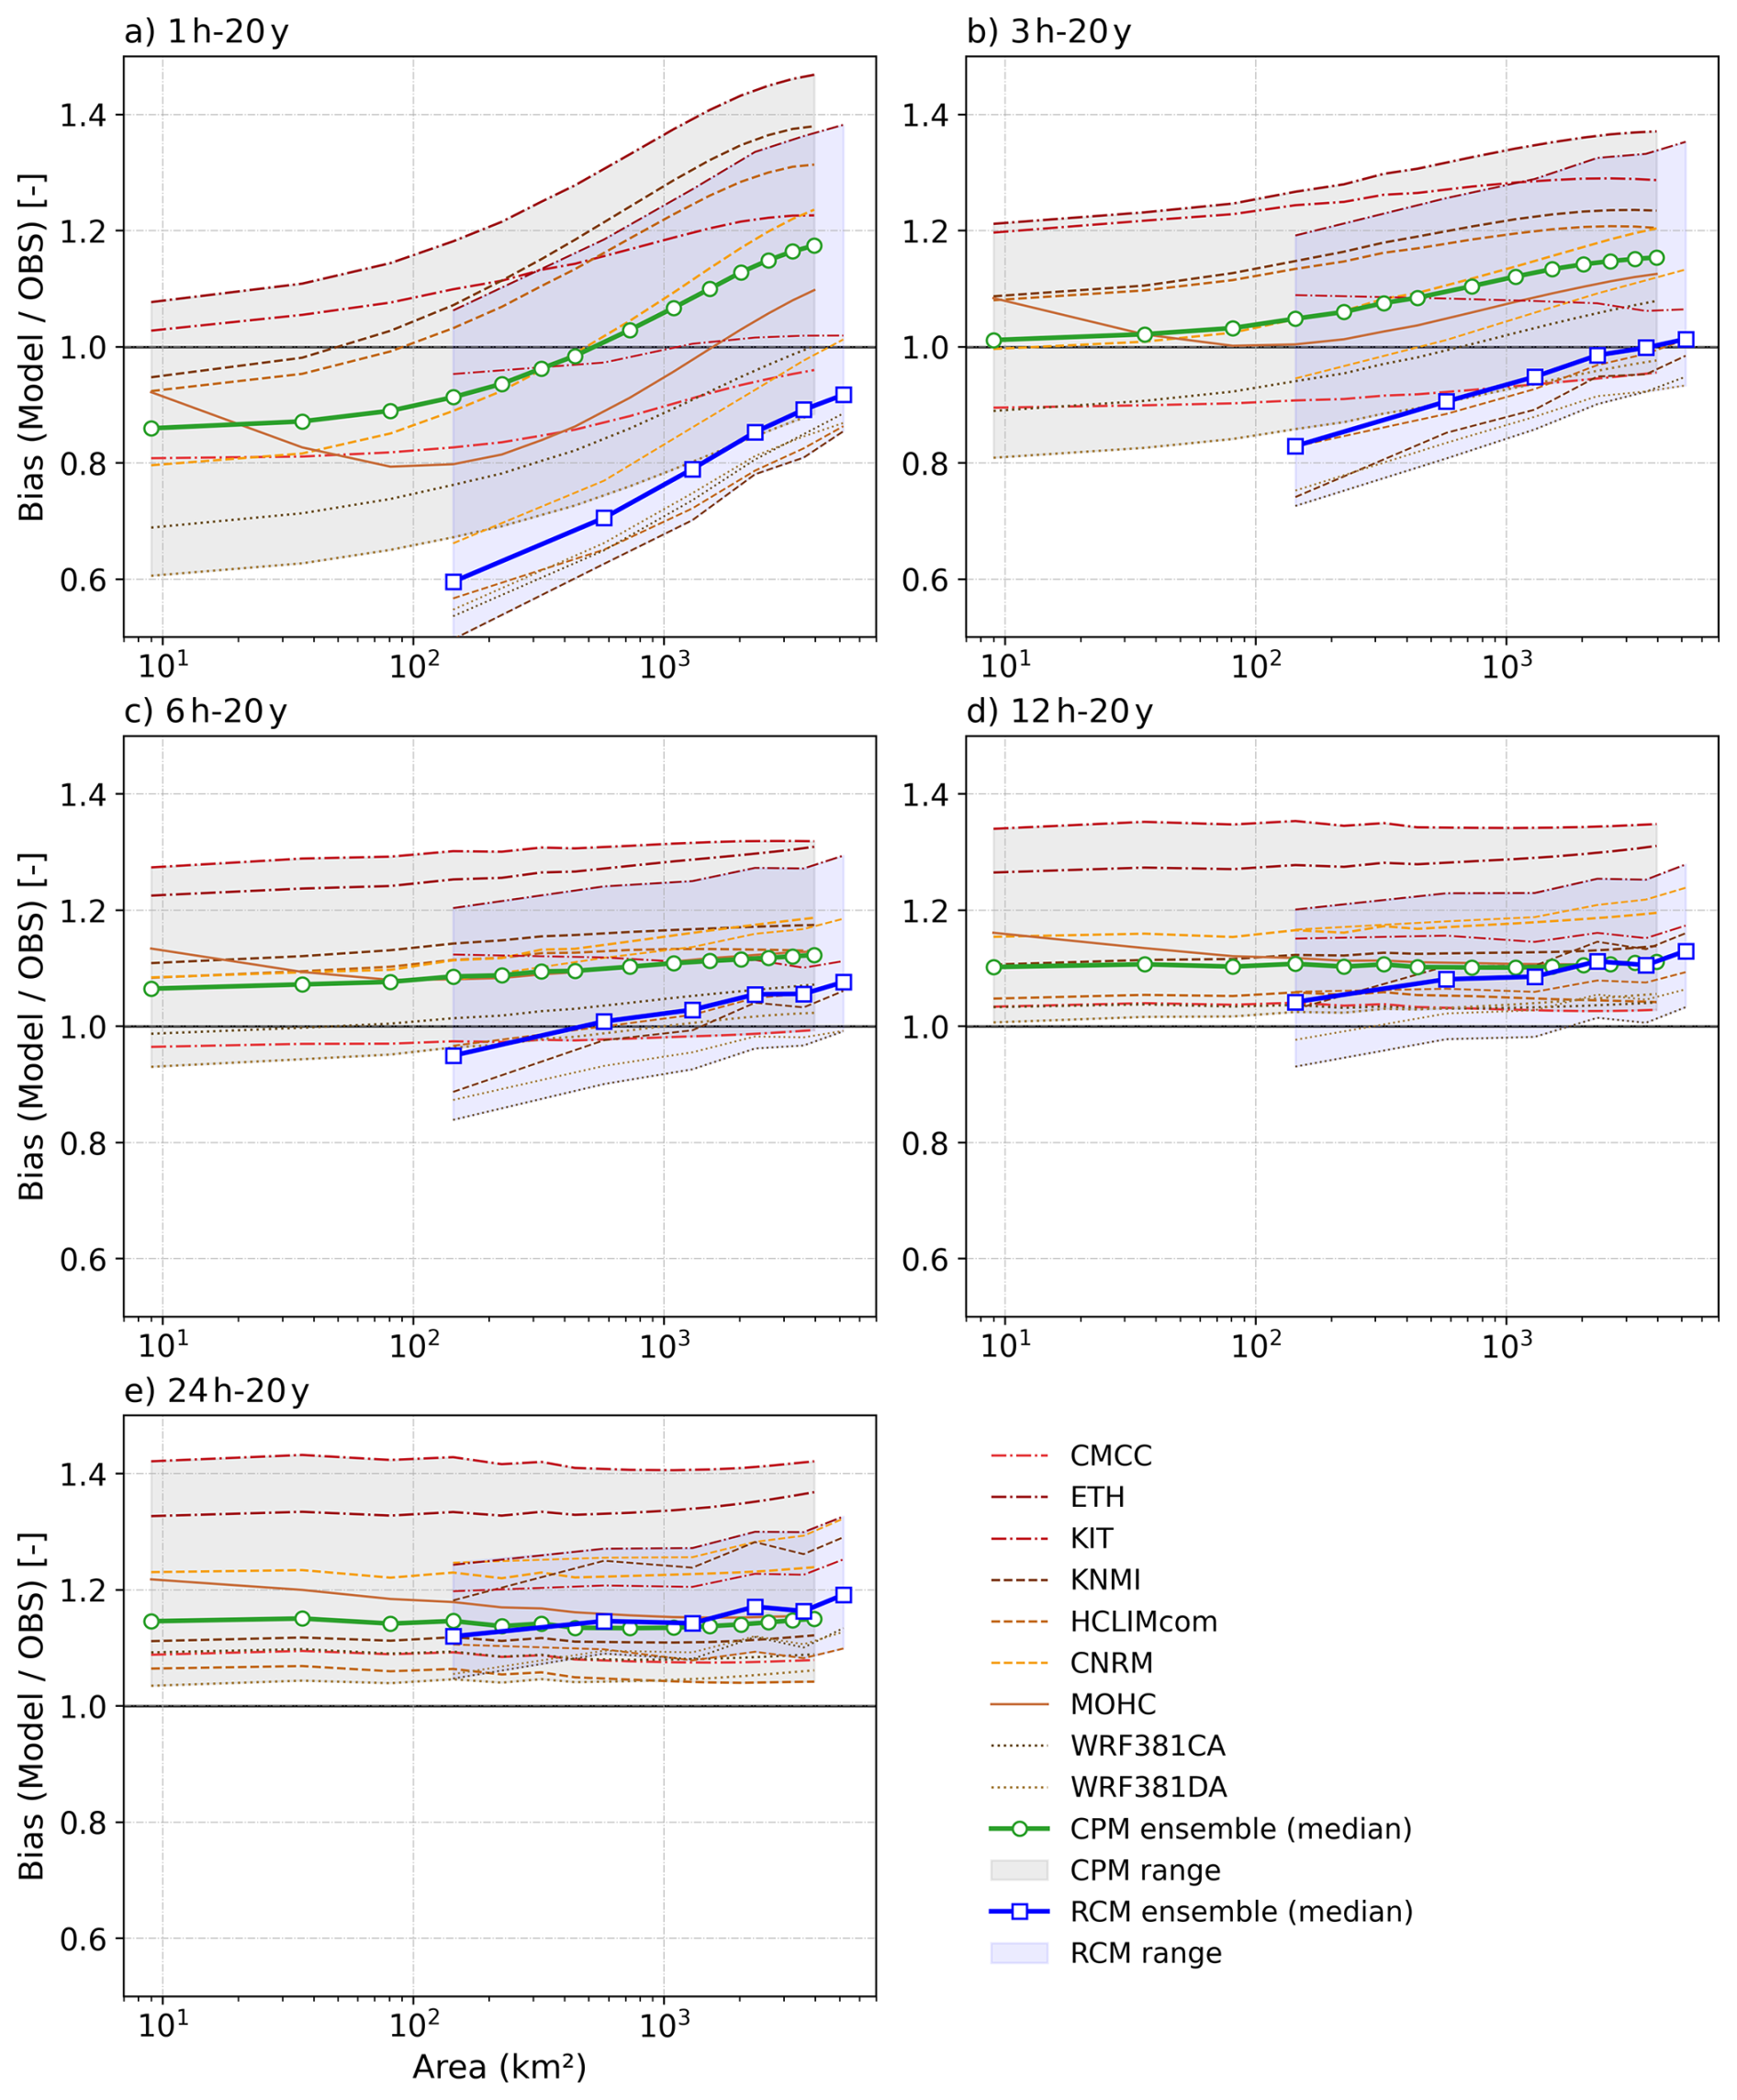
Figure 7Scale dependence of CPM and RCM bias for 20-year extreme precipitation for durations of (a) 1 h, (b) 3 h, (c) 6 h, (d) 12 h and (e) 24 h. Bias is expressed as the ratio of CPMs to CombiPrecip (OBS) and RCMs to OBS as a function of areal extent. Solid green and blue lines denote regional mean biases from moving-window areal aggregation for the median of CPM and RCM ensembles, respectively. The other lines represent each CPM/RCM model and the shaded grey and blue bands indicate the corresponding ensemble ranges.
For 3 h–20-year extremes (Fig. 7b), CPMs are near-unbiased at small areas and increasingly overestimate precipitation with increasing areal scale (≈ 1.1–1.15). RCMs again underestimate extreme precipitation at the native resolution (≈ 0.8) but approach unity with spatial aggregation. Compared to 1 h, CPM–RCM differences, member spread, and scale dependence are reduced. At longer durations (6–24 h; Fig. 7c–e), biases become nearly scale-invariant. Both CPMs and RCMs generally overestimate observations and converge toward similar regional-mean biases.
Comparing each CPM with its driving RCM across the range of areas (Figs. 7 and 4) shows that the wet/dry ranking is only partially preserved across the convection-permitting downscaling step, and that this degree of preservation depends on duration. For 24 h–20-year return levels, the ranking is largely consistent: 5 of 7 paired chains keep the same wet/dry position relative to their ensemble median at both native and aggregated scales (except for the models from CMCC and KNMI). For 1 h–20-year return levels, the ranking is less consistent, with only 3 of 7 chains preserving their rank at the native scale (ETH and the two WRF configurations). Of the four chains with different ranks at 1 h, HCLIMcom and KNMI are among the wettest CPMs while their driving RCMs are among the driest in the RCM ensemble, whereas CMCC and CNRM show the opposite pattern. After aggregation to ∼ 1000 km2, rank consistency improves slightly (4 of 7 chains). Overall, a CPM and its driving RCM do not necessarily share the same wet/dry rank within their respective ensembles, and this is more often the case for short-duration extremes than for longer-duration and daily extremes.
This analysis was extended to multiple event magnitudes by examining return periods of 2, 5, 10, 20, and 50 years, as well as mean annual maxima. The spatiotemporal bias patterns described above are consistent across all return levels (Fig. S6).
The strong 1 h area-dependence of biases of extreme precipitation observed here is mainly linked to area-dependent biases in λ and k parameters of the underlying SMEV distribution, whereas at 24 h both parameters remain comparatively scale-invariant with area (Fig. S7).
The catchment-based results (Fig. 8) are consistent with the moving-window analysis but exhibit greater scatter, as expected given the discrete nature of basins and their differing topographic settings. For 1 h–20-year extremes (Fig. 8a), precipitation bias increases with catchment area for both CPMs and RCMs, though the relationship is weak for CPMs (r2 = 0.14) and clearer for RCMs (r2 = 0.39). RCMs strongly underestimate precipitation in many small to medium-sized basins, whereas CPMs are closer to unity and more often shift to overestimation in larger basins. For 24 h–20-year extremes (Fig. 8b), the dependence on catchment area is weak for both CPMs (r2 = 0.01) and RCMs (r2 = 0.13), with most basins showing modest overestimation.
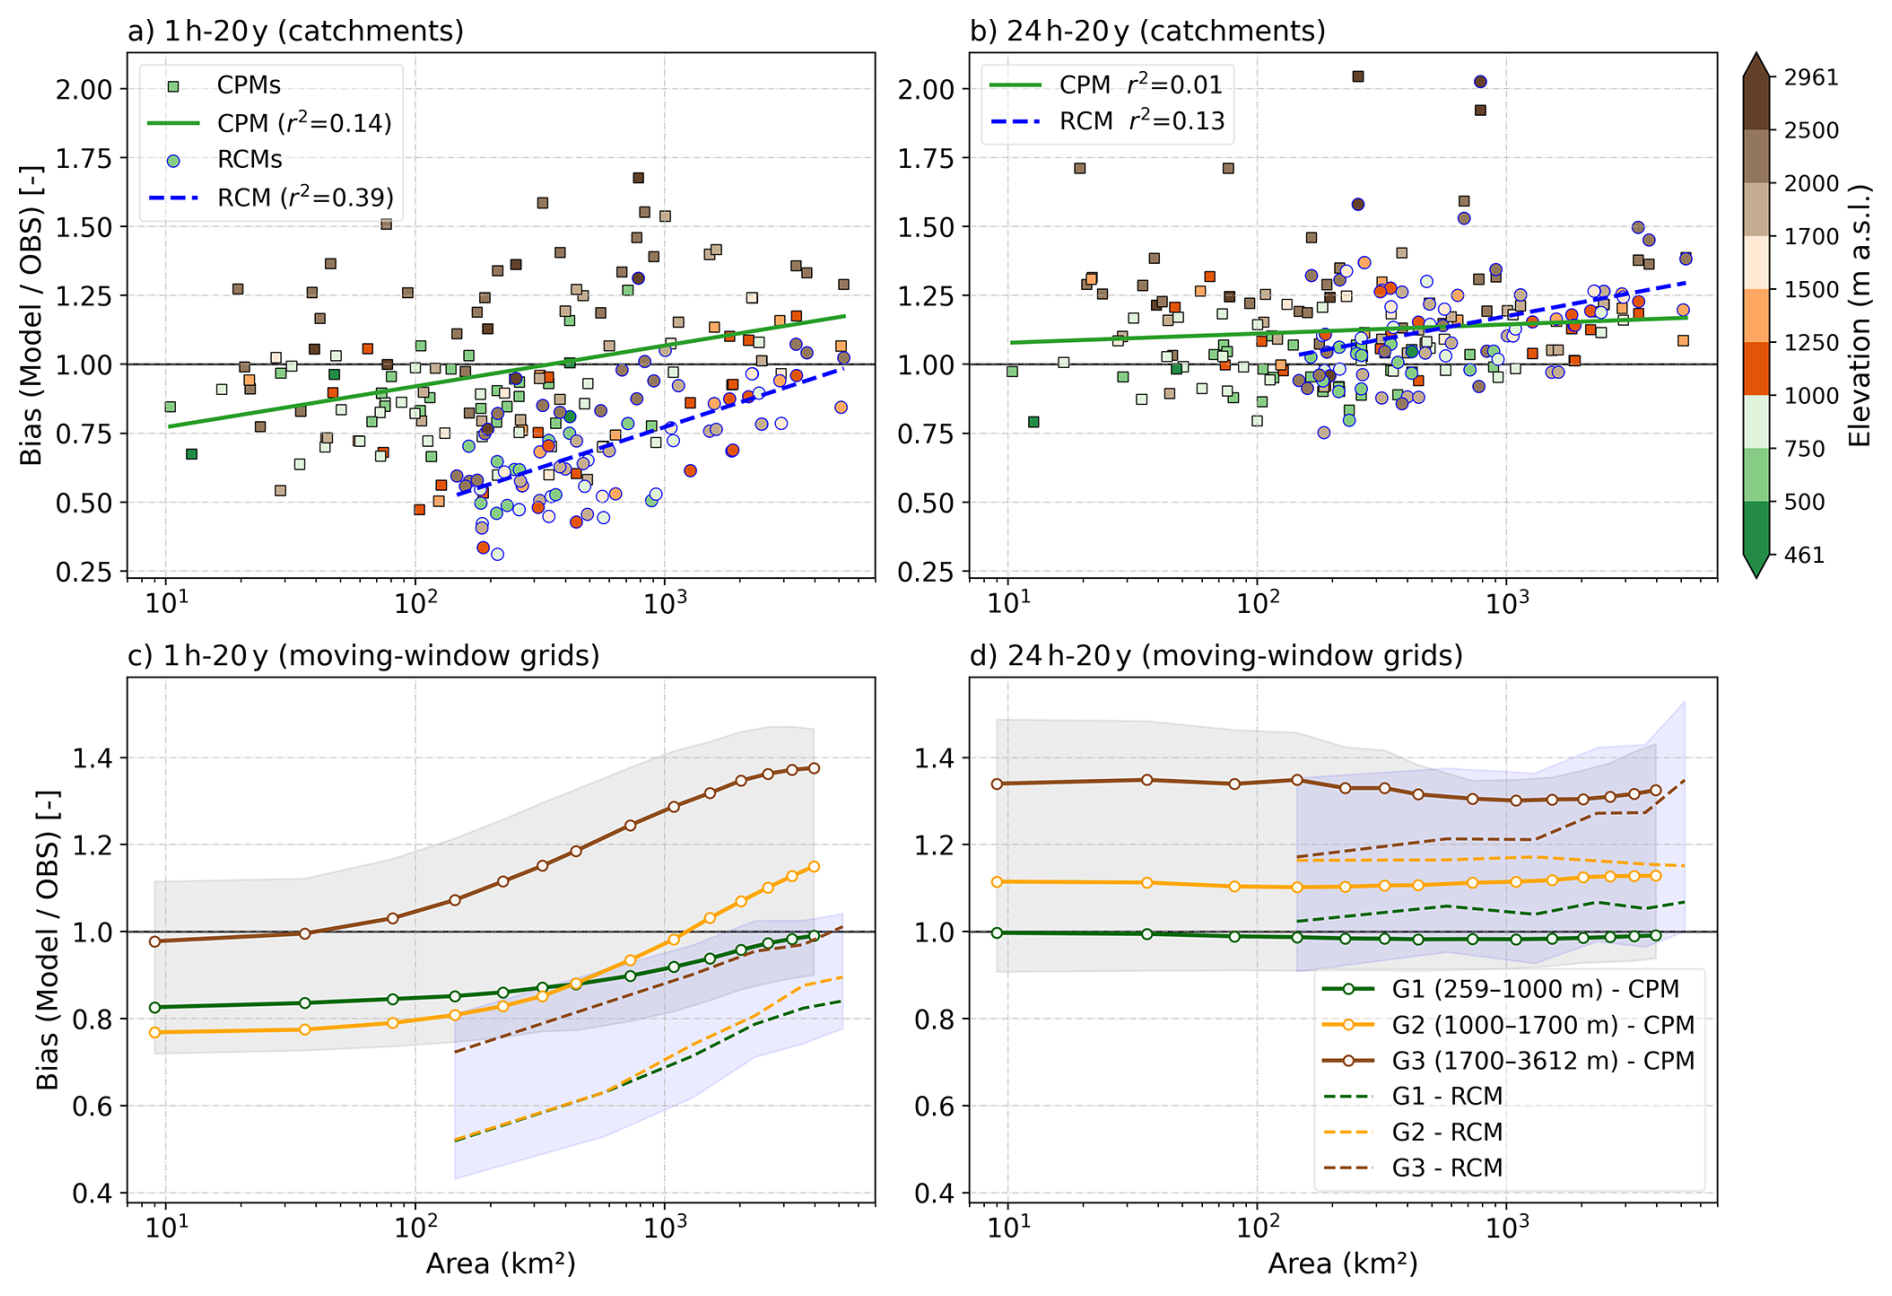
Figure 8Spatiotemporal scale and elevation dependence of CPM and RCM biases for 20-year extreme precipitation. Top row: catchment-based bias of CPM and RCM ensemble medians as a function of catchment area, for (a) 1 h and (b) 24 h return levels, computed across 143 Swiss catchments. Squares show CPM ensemble-median biases and circles show RCM ensemble-median biases; markers are colour-coded by the median catchment elevation. Solid green and blue lines denote the regression line fitted to the catchments' bias for CPMs and RCMs respectively. The bottom row shows moving-window grids stratified by elevation: regional-mean bias of the CPM (solid lines) and RCM (dashed lines) ensemble medians as a function of areal extent, for (c) 1 h–20-year and (d) 24 h–20-year return levels, stratified into three elevation bands: G1 (259–1000 m, green), G2 (1000–1700 m, orange), and G3 (1700–3612 m, brown). The upper and bottom bands of the shaded area (grey for CPMs and blue for RCMs) indicate the corresponding 75th and 25th quartiles of grid points values for the G3 and G1 respectively.
The elevation coloring shows that high-elevation catchments tend to have larger positive biases and include several strong outliers compared to low-elevation catchments. This pattern is confirmed to be more systematic when the moving-window analysis is stratified into three elevation bands. For 1 h–20-year return levels (Fig. 8c), CPM biases at low (G1) and mid (G2) elevations transition from underestimation (∼ 0.80) at the smallest areal scales to near-unity or modest overestimation at the largest areas. High-elevation biases (G3) instead start near unity at the smallest areas and grow progressively to ∼ 1.4 at the largest areas. The crossing of the G2 (mid) and G1 (low) curves around 100–1000 km2 shows that mid-elevation grids show a stronger dependence of bias with area, similar to G3. RCMs (dashed lines in Fig. 8c) show the same ordering across elevation bands but with stronger underestimation at all areal scales, consistent with the catchment-based results in Fig. 8a. For 24 h–20-year return levels (Fig. 8d), biases within each elevation band are approximately constant across the full range of areal scales, with G3 grids exhibiting a persistent overestimation of ∼ 1.3 and G1 cells remaining near unity. RCM biases follow the same elevation ordering.
3.4 Assessing the scale effects: spatial variability of extreme precipitation
To better explain the spatiotemporal scale dependence of the biases identified in our results, we examine two complementary quantities: (i) the evolution of the within-window coefficient of variation (CV) of annual maximum precipitation with increasing area, which quantifies how spatial heterogeneity changes with aggregation; and (ii) the areal reduction factor (ARF) of extreme return levels, which summarizes how the intensity of estimated return levels decreases as the averaging area increases.
The CV results show a consistent contrast between the datasets and short and long durations. For 1 h mean annual maximum precipitation (Fig. 9a), within-window CV increases with area for all datasets, but OBS shows much higher CV than the CPM ensemble median across all areas, meaning that observed extremes are more spatially scattered and heterogeneous than those simulated by CPMs. The RCM ensemble median shows the lowest CV. For 24 h duration (Fig. 9b), OBS and CPMs display very similar CV values, indicating a comparable degree of spatial organization of daily extremes, while RCMs show consistently lower CV because of their coarser resolution and more homogeneous fields.
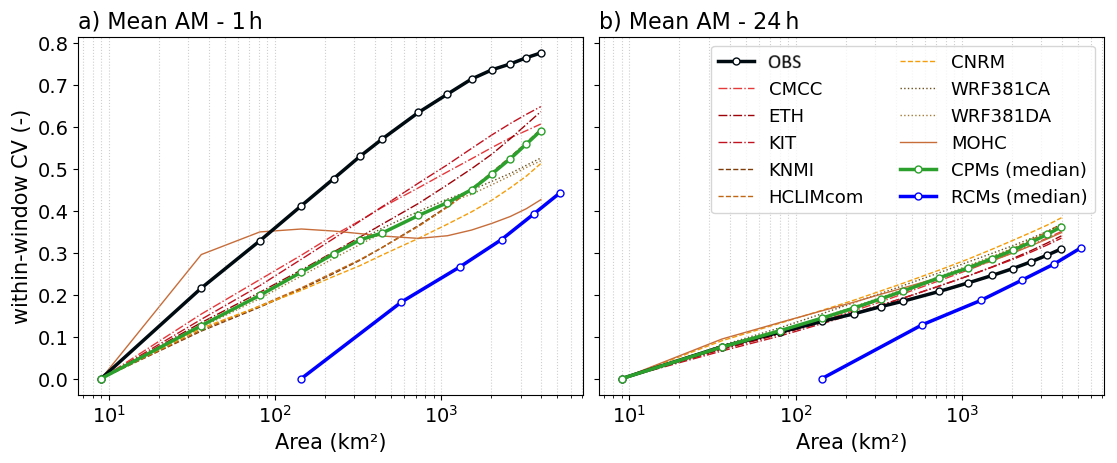
Figure 9Evolution of spatial variability of mean annual maximum precipitation (mean AM) with areal aggregation for 1 h (a) and 24 h (b) durations. The within-window coefficient of variation (CV) is shown for CombiPrecip (OBS, black line), individual CPM simulations (thin coloured lines), the CPM ensemble median (green line), and the RCM ensemble median (blue line). At 1 h, OBS displays substantially higher CV than CPMs and RCMs, indicating more heterogeneous small-scale extremes, whereas at 24 h CPMs converge toward OBS while RCMs retain lower CV due to their coarser spatial resolution.
The areal reduction factor for the 20-year return level provides a complementary view (Fig. 10). At 1 h duration (Fig. 10a), OBS shows the most rapid intensity decay with area, reaching ARF values near 0.35 at the largest aggregation scales. The CPM ensemble median decays more slowly than OBS, and individual CPMs span a band above the OBS curve, indicating that simulated 1 h extremes are more spatially coherent than observed ones. The RCM ensemble median exhibits an essentially parallel rate of decay to the CPM ensemble median over the range of common areal scales (above 144 km2), but is shifted toward larger areas because of the coarser RCM native grid. At 24 h duration (Fig. 10b), the three datasets decay at very similar rates, with OBS and the CPM ensemble median essentially overlapping; the RCM ensemble median just shifted to the right due to its resolution but follows a similar slope.
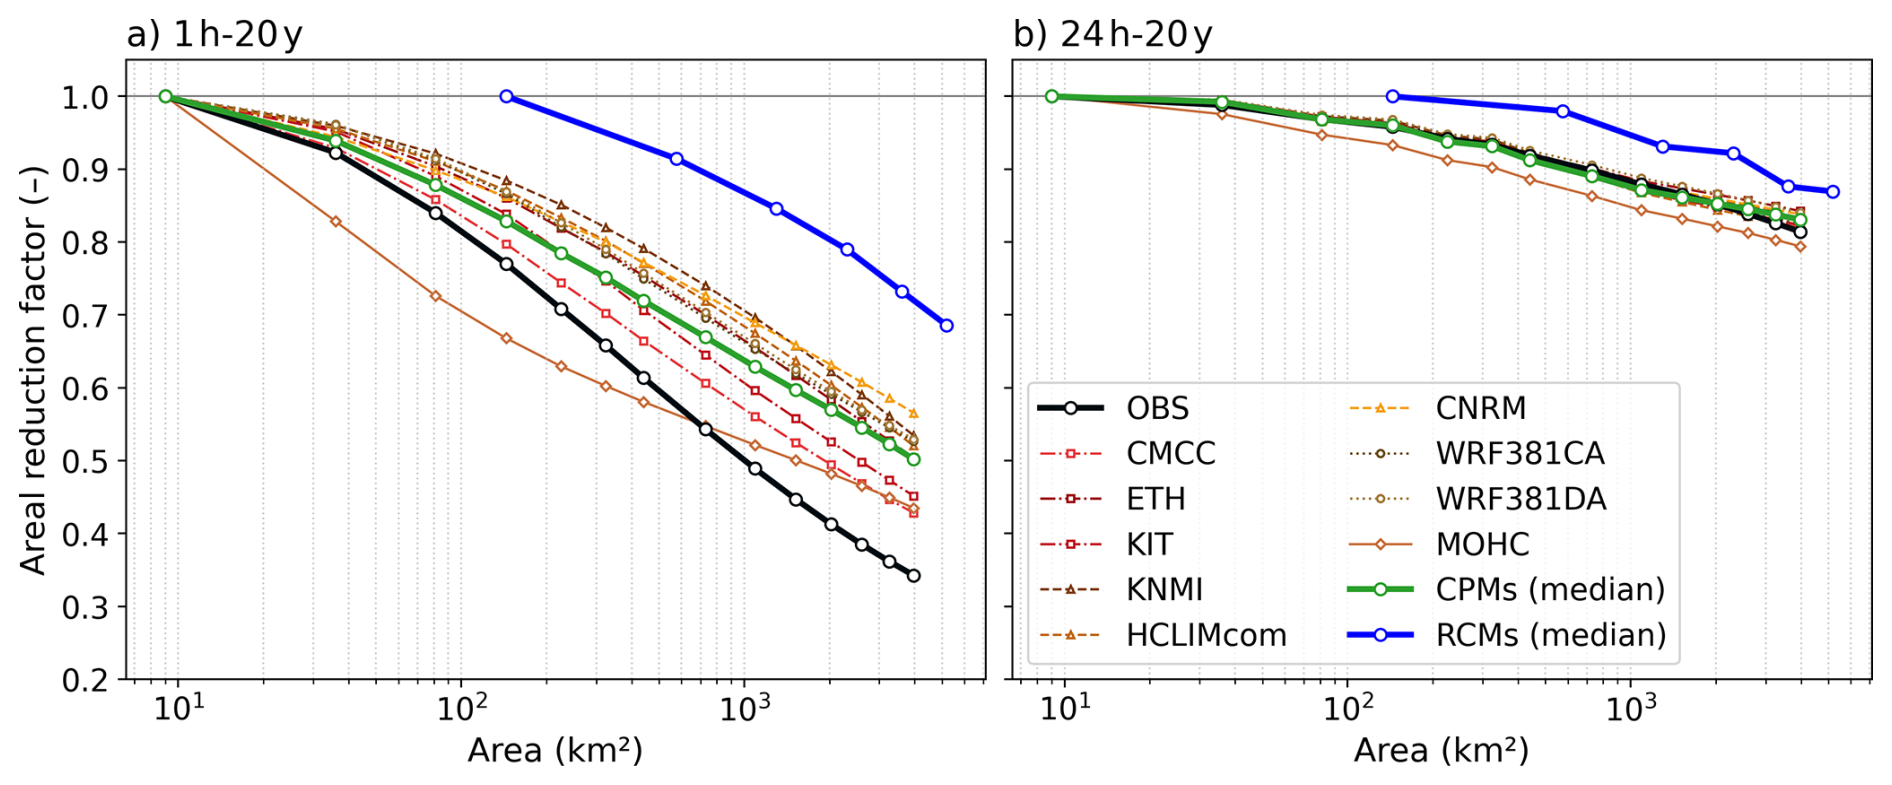
Figure 10Areal reduction factor (ARF) for 20-year extreme precipitation return levels as a function of areal extent, for (a) 1 h and (b) 24 h durations. ARF is defined as the ratio of the estimated areal extreme return level at area A to the corresponding return level at the native grid scale, normalised to unity at the smallest scale of each dataset. The black line shows CombiPrecip (OBS), thin coloured lines show individual CPM simulations, and the thick green and blue lines show the CPM and RCM ensemble medians, respectively.
This study evaluated how well a CORDEX-FPS CPM ensemble reproduces precipitation extremes over Switzerland when extremes are considered on the spatial and temporal scales used in hydrological practice. The key message is that the added value of CPMs over their driving RCMs is clearest for short duration precipitation (1–3 h), but it becomes much less distinct as precipitation duration and spatial extent increase. The sign and magnitude of model bias for short-duration extremes can change with areal aggregation. This behaviour is not a statistical artefact of the areal-aggregation or extreme-value method; rather, it reflects a physical inconsistency between models and observations in how extreme intensity and spatial variability evolve with aggregation, which is central for hydrological applications.
4.1 Added value of CPMs for the spatial structure of extremes
The observed 1 h extremes show strong small-scale heterogeneity and localized maxima tied to orography and convective storm organization, and CPM ensemble median reproduces these mesoscale gradients and regional maxima that are largely missing in the RCM ensemble (Fig. 2). This aligns with the known limitation of deep-convection parameterization in kilometre-to-tens-of-kilometre RCMs, and the improved representation of convective timing, organization and intensity in CPMs for sub-daily extremes (Ban et al., 2014; Kendon et al., 2012; Prein et al., 2015). Our results extend this evidence by showing that CPM added value remains evident when extremes are evaluated after areal averaging to catchment-like scales, which is the relevant quantity for many design and impact applications (Flamig et al., 2020).
At the same time, CPM member-to-member differences are large for short-duration extremes, indicating that conclusions based on a single configuration can be misleading. In our ensemble, COSMO-based models (ETH, KIT) systematically overestimate, while WRF configurations underestimate observed 1 h extremes across all areas. The COSMO wet bias is consistent with similar findings over Germany (Rybka et al., 2023). For 24 h extremes, differences between CPMs and RCMs are smaller. Daily accumulations are mainly driven by synoptic forcing and persistent orographic uplift, for which convection parameterization is less critical than at hourly scales (Ban et al., 2014; Kendon et al., 2012; Prein et al., 2015). This duration dependence is consistent with previous CPM evaluations over complex terrain (Ban et al., 2014; Fosser et al., 2015; Lucas-Picher et al., 2021).
4.2 Explaining scale-dependent biases at short duration
While CPMs improve the spatial structure of hourly precipitation extremes at native resolution, their biases vary with areal aggregation (Fig. 7). This scale dependence is physically meaningful, as spatial averaging reflects both sub-grid heterogeneity and how storm structure controls the decay of extremes with area (Breinl et al., 2020; De Michele et al., 2001; Svensson and Jones, 2010).
Two mechanisms explain this behavior. First, CombiPrecip shows stronger spatial heterogeneity at 1 h than CPM and RCM fields (Fig. 9a), indicating more localized and intermittent observed extremes. Second, observed 1 h extremes decrease with area more rapidly than modeled extremes (Fig. 10a). Consequently, the model-to-observation ratio increases with area, even when models underestimate at small scales. This overly coherent structure of short-duration extremes has been linked to limitations in microphysics, turbulence, and effective resolution in CPMs (Fosser et al., 2015; Prein et al., 2015), and these resolution-related limitations are particularly pronounced over regions of complex topography (Brunner et al., 2025). Here we show that this limitation directly produces scale-dependent biases with implications for catchment-scale hydrology.
For longer durations (6–24 h), the area dependence of extreme precipitation biases largely disappears, and CPM and RCM biases converge to a nearly constant positive offset. From a hydrological perspective, this convergence at 6–24 h is practically important because flood-generating precipitation durations tend to lengthen with catchment response time and spatial scale: short-lag flash-flood events in small basins are often associated with intense rainfall over only a few hours, whereas larger river-flood responses integrate precipitation over longer periods (Viglione and Blöschl, 2009). Consistent with this, European flash-flood analyses highlight characteristic response times of only a few hours for the affected small basins, underscoring the relevance of 1–3 h rainfall for the most rapidly responding headwaters and for hydro-geomorphic hazards such as debris flows (Borga et al., 2014; Marchi et al., 2010). At the same time, the near scale-invariant behaviour of bias of 6–24 h extreme precipitation suggests that, for longer-duration flood drivers, model errors are dominated more by an overall intensity offset than by mismatches in storm footprint or within-area intermittency.
4.3 Topography, elevation dependence, and observation uncertainty
In our results, Model/Observation biases show a clear topographic dependence, with strongest model overestimation in extreme precipitation occurring more often in high-elevation regions and catchments. This elevation dependence of CPM performance – and more generally, strong orographic control on bias and uncertainty in sub-daily extremes – has also been highlighted in some previous studies relying on station-based evaluation (Correa-Sánchez et al., 2025; Dallan et al., 2023).
Interpreting the elevation signal requires accounting for both modeling and observational factors. On the modeling side, kilometer-scale resolution improves the representation of convection and orographic forcing, but key processes in complex terrain – such as mountain–valley circulations, flow blocking, barrier jets, and microphysical responses to strong uplift – remain imperfectly resolved and can affect intensity and spatial extent (Pinty et al., 2001; Stuart et al., 2025). On the observational side, radar–gauge products in complex terrain suffer from well-known limitations, including beam shielding, vertical profile effects, clutter filtering, and range-dependent sampling, even after quality control and gauge adjustment (Germann et al., 2006; Sideris et al., 2014). Uncertainties are also higher during snowfall, for which radar quantitative precipitation estimates are typically less accurate than for liquid precipitation (Gugerli et al., 2021). In addition, gauge undercatch of solid precipitation can reach ∼ 4 %–50 %, depending on precipitation type, altitude, season, and region (Frei et al., 2008; Frei and Schär, 1998; La Barbera et al., 2002). As a result, part of the elevation signal likely reflects observational uncertainty rather than model error alone, particularly where large Model/OBS ratios coincide with known measurement limitations.
4.4 Limitations of this study
A main limitation of this study concerns the observational reference and the simulation period. CombiPrecip remains subject to terrain-relevant uncertainty in complex topography, particularly at higher elevations (Germann et al., 2006; Sideris et al., 2014). In addition, the CombiPrecip record (2005–2024) does not overlap with the CPM historical decade (1996–2005), meaning that differences between the two periods can influence the absolute magnitude of the estimated return levels and, therefore, the apparent Model/OBS bias. Part of this difference reflects shifts in large-scale circulation patterns active during each decade, which can leave a more visible signature in longer-duration (24 h) extremes that are tied to synoptic forcing, and a comparatively smaller one in localised hourly convective extremes (Haslinger et al., 2025). In addition, there is the uncertainty related to internal climate variability, which would remain a major source of uncertainty even for matched periods. For instance, even when driven by identical boundary conditions, RCM ensemble members can produce measurably different extreme-precipitation statistics (Alexandru et al., 2007), reflecting the inherent chaotic nature of the atmospheric system. This effect is particularly pronounced for sub-daily extremes, where small-scale uncertainties associated with moist convection grow rapidly and limit the predictability of short-duration precipitation (Judt, 2018). The 10-year length of the CPM simulations adds a further sampling uncertainty; while SMEV is designed to provide stable return-level estimates from short records (Dallan et al., 2024a; Marra et al., 2019), it reduces estimation uncertainty but cannot compensate for variability tied to large-scale climate modes. Observational analysis further suggest that heavy-precipitation intensities – especially at short durations (10 min to 3 h) – have increased in Switzerland in recent decades (Bauer and Scherrer, 2024), implying that potential non-stationarity may also contribute to differences between the two periods. These limitations are most relevant for interpreting absolute bias levels, whereas our main conclusions focus on relative behaviour across aggregation scales and durations (e.g., sign changes at 1–3 h and convergence toward scale-invariant biases at ≥ 6 h), which are expected to be less sensitive to the uncertainties discussed above.
This study examined how well convection-permitting models reproduce extreme precipitation over complex terrain across durations from 1 to 24 h and spatial scales from native resolution to several thousand square kilometres and the catchment scale over complex Alpine terrain. Using the radar–gauge merged CombiPrecip dataset as observational reference, we demonstrate that the added value of CPMs over their driving regional climate models (RCMs) is most pronounced for short durations (1–3 h) and small to intermediate spatial scales (10–1000 km2). At these scales, CPMs substantially improve the representation of the spatial organization and intensity of hourly extremes, whereas RCMs exhibit excessive spatial smoothing and a persistent underestimation of short-duration extremes even after aggregation, highlighting the intrinsic limitations of convection parameterization.
Importantly, biases in short-duration areal precipitation extremes are strongly scale dependent. CPM biases transition from underestimation at small spatial scales to near-unity and modest overestimation at larger areas. This behavior reflects the fact that observed 1 h extremes decay more rapidly with area than simulated extremes, indicating differences in storm intermittency and spatial variability between models and observations. In contrast, for longer durations (≥ 6 h), CPM and RCM biases converge toward a nearly scale-invariant, modest positive offset. This convergence suggests that at these timescales large-scale forcing dominates, reducing the relative importance of explicitly resolved convection and leading to similar responses to spatial aggregation across model types.
While our conclusions regarding absolute bias magnitudes must be interpreted in light of observational uncertainty – particularly in radar–gauge products over high-elevation regions and along the southern Alpine boundary – the relative performance differences between CPMs and RCMs remain robust. Both measurement limitations and model deficiencies likely contribute to residual discrepancies, but they do not obscure the clear scale- and duration-dependent structure of model performance identified here.
From a hydrological perspective, these findings have direct implications. CPMs are most beneficial in applications sensitive to sub-daily extremes and the spatial organization of precipitation, such as flash-flood risk, urban drainage design, and hydrological modelling of small to medium Alpine catchments (10–1000 km2). However, because CPM biases can change with area, quantifying scale-dependent biases is a necessary step before using CPM simulations to estimate flood risk across catchment scales. For longer durations (≥ 6 h) and large basins, the incremental advantage of CPMs over RCMs diminishes. In such contexts, bias-corrected RCMs may remain a pragmatic alternative, given their broader availability, longer simulation periods, larger ensembles, and substantially lower computational cost.
More broadly, our results underscore that model added value is not universal but conditional on temporal and spatial scale. Future work should therefore move beyond grid-point evaluations and systematically assess scale-aware performance metrics and ensemble behavior in complex terrain. Expanding multi-model CPM ensembles, extending simulation lengths, and improving observational constraints will be critical to reducing uncertainty in extreme precipitation projections. Ultimately, robust assessment of scale-dependent model behavior is essential for translating high-resolution climate simulations into reliable hydrological risk assessments and climate adaptation strategies.
Overall, while previous studies have examined scale-dependence biases in convection-parameterizing RCMs (Prein et al., 2016; Fantini et al., 2018), this study is the first to explore the scale-dependent performance of convection-permitting climate models, demonstrating the added value of CPMs over their driving RCMs in representing short-duration precipitation extremes at hydrologically relevant scales.
The hourly precipitation data of the CORDEX-FPS on Convection CPM ensemble are in the process of becoming available through the ESGF data nodes. The CombiPrecip (CPC) dataset used in this study was made available by Federal Office of Meteorology and Climatology MeteoSwiss. The codes used for the statistical model are freely available at https://doi.org/10.5281/zenodo.11934843 (Marra, 2024), and the codes for the tail test are freely available at https://doi.org/10.5281/zenodo.7234708 (Marra, 2022).
The supplement related to this article is available online at https://doi.org/10.5194/hess-30-4117-2026-supplement.
RA: writing – original draft, conceptualization, formal analysis, methodology, data curation, visualization. ED: writing – review and editing, conceptualization, methodology. PCA: writing – review and editing, methodology. RRW: writing – review and editing, methodology. FM: writing – review and editing, conceptualization, methodology. MIB: writing – review and editing, conceptualization, methodology, supervision. MB: writing – review and editing, conceptualization, methodology, supervision.
At least one of the (co-)authors is a member of the editorial board of Hydrology and Earth System Sciences. The peer-review process was guided by an independent editor, and the authors also have no other competing interests to declare.
Publisher's note: Copernicus Publications remains neutral with regard to jurisdictional claims made in the text, published maps, institutional affiliations, or any other geographical representation in this paper. The authors bear the ultimate responsibility for providing appropriate place names. Views expressed in the text are those of the authors and do not necessarily reflect the views of the publisher.
We acknowledge the WCRP-CORDEX-FPS on Convective phenomena at high resolution over Europe and the Mediterranean (FPSCONV-ALP3) for providing the CPM and RCM simulations, likewise, the authors acknowledge the availability of the hourly precipitation data of the CORDEX-FPS on Convection CPRCMs ensemble through the ESGF data nodes. We also thank the Federal Office of Meteorology and Climatology MeteoSwiss for providing the observational dataset (CombiPrecip).
ED was supported within the RETURN Extended Partnership and received funding from the European Union Next-Generation EU (National Recovery and Resilience Plan – NRRP, Mission 4, Component 2, Investment 1.3–D.D. 1243 2/8/2022, PE0000005). FM was supported by “The Geosciences for Sustainable Development” project (Budget Ministero dell'Università e della Ricerca–Dipartimenti di Eccellenza 2023–2027 C93C23002690001).
This paper was edited by Elena Toth and reviewed by Benjamin Poschlod and one anonymous referee.
Adinolfi, M., Raffa, M., Reder, A., and Mercogliano, P.: Evaluation and Expected Changes of Summer Precipitation at Convection Permitting Scale with COSMO-CLM over Alpine Space, Atmosphere, 12, 54, https://doi.org/10.3390/atmos12010054, 2020.
Alexandru, A., De Elia, R., and Laprise, R.: Internal Variability in Regional Climate Downscaling at the Seasonal Scale, Mon. Weather Rev., 135, 3221–3238, https://doi.org/10.1175/MWR3456.1, 2007.
Baldauf, M., Seifert, A., Förstner, J., Majewski, D., Raschendorfer, M., and Reinhardt, T.: Operational Convective-Scale Numerical Weather Prediction with the COSMO Model: Description and Sensitivities, Mon. Weather Rev., 139, 3887–3905, https://doi.org/10.1175/MWR-D-10-05013.1, 2011.
Ban, N., Schmidli, J., and Schär, C.: Evaluation of the convection-resolving regional climate modeling approach in decade-long simulations, J. Geophys. Res.-Atmos., 119, 7889–7907, https://doi.org/10.1002/2014JD021478, 2014.
Ban, N., Caillaud, C., Coppola, E., Pichelli, E., Sobolowski, S., Adinolfi, M., Ahrens, B., Alias, A., Anders, I., Bastin, S., Belušić, D., Berthou, S., Brisson, E., Cardoso, R. M., Chan, S. C., Christensen, O. B., Fernández, J., Fita, L., Frisius, T., Gašparac, G., Giorgi, F., Goergen, K., Haugen, J. E., Hodnebrog, Ø., Kartsios, S., Katragkou, E., Kendon, E. J., Keuler, K., Lavin-Gullon, A., Lenderink, G., Leutwyler, D., Lorenz, T., Maraun, D., Mercogliano, P., Milovac, J., Panitz, H.-J., Raffa, M., Remedio, A. R., Schär, C., Soares, P. M. M., Srnec, L., Steensen, B. M., Stocchi, P., Tölle, M. H., Truhetz, H., Vergara-Temprado, J., De Vries, H., Warrach-Sagi, K., Wulfmeyer, V., and Zander, M. J.: The first multi-model ensemble of regional climate simulations at kilometer-scale resolution, part I: evaluation of precipitation, Clim. Dynam., 57, 275–302, https://doi.org/10.1007/s00382-021-05708-w, 2021.
Barton, Y., Sideris, I. V., Raupach, T. H., Gabella, M., Germann, U., and Martius, O.: A multi‐year assessment of sub‐hourly gridded precipitation for Switzerland based on a blended radar – Rain‐gauge dataset, Int. J. Climatol., 40, 5208–5222, https://doi.org/10.1002/joc.6514, 2020.
Bauer, V. M. and Scherrer, S. C.: The observed evolution of sub-daily to multi-day heavy precipitation in Switzerland, Atmos. Sci. Lett., 25, e1240, https://doi.org/10.1002/asl.1240, 2024.
Belušić, D., de Vries, H., Dobler, A., Landgren, O., Lind, P., Lindstedt, D., Pedersen, R. A., Sánchez-Perrino, J. C., Toivonen, E., van Ulft, B., Wang, F., Andrae, U., Batrak, Y., Kjellström, E., Lenderink, G., Nikulin, G., Pietikäinen, J.-P., Rodríguez-Camino, E., Samuelsson, P., van Meijgaard, E., and Wu, M.: HCLIM38: a flexible regional climate model applicable for different climate zones from coarse to convection-permitting scales, Geosci. Model Dev., 13, 1311–1333, https://doi.org/10.5194/gmd-13-1311-2020, 2020.
Berthou, S., Kendon, E. J., Chan, S. C., Ban, N., Leutwyler, D., Schär, C., and Fosser, G.: Pan-European climate at convection-permitting scale: a model intercomparison study, Clim. Dynam., 55, 35–59, https://doi.org/10.1007/s00382-018-4114-6, 2020.
Borga, M., Stoffel, M., Marchi, L., Marra, F., and Jakob, M.: Hydrogeomorphic response to extreme rainfall in headwater systems: Flash floods and debris flows, J. Hydrol., 518, 194–205, https://doi.org/10.1016/j.jhydrol.2014.05.022, 2014.
Breinl, K., Müller-Thomy, H., and Blöschl, G.: Space–Time Characteristics of Areal Reduction Factors and Rainfall Processes, J. Hydrometeorol., 21, 671–689, https://doi.org/10.1175/JHM-D-19-0228.1, 2020.
Brunner, L., Poschlod, B., Dutra, E., Fischer, E. M., Martius, O., and Sillmann, J.: A global perspective on the spatial representation of climate extremes from km-scale models, Environ. Res. Lett., 20, 074054, https://doi.org/10.1088/1748-9326/ade1ef, 2025.
Caillaud, C., Somot, S., Alias, A., Bernard-Bouissières, I., Fumière, Q., Laurantin, O., Seity, Y., and Ducrocq, V.: Modelling Mediterranean heavy precipitation events at climate scale: an object-oriented evaluation of the CNRM-AROME convection-permitting regional climate model, Clim. Dynam., 56, 1717–1752, https://doi.org/10.1007/s00382-020-05558-y, 2021.
Caldas-Alvarez, A., Feldmann, H., Lucio-Eceiza, E., and Pinto, J. G.: Convection-parameterized and convection-permitting modelling of heavy precipitation in decadal simulations of the greater Alpine region with COSMO-CLM, Weather Clim. Dynam., 4, 543–565, https://doi.org/10.5194/wcd-4-543-2023, 2023.
Cetti, C., Buzzi, M., and Sprenger, M.: Climatology of Alpine north foehn, Scientific Report MeteoSwiss, 100, 76 pp., 2015.
Chan, S. C., Kendon, E. J., Fowler, H. J., Blenkinsop, S., Roberts, N. M., and Ferro, C. A. T.: The Value of High-Resolution Met Office Regional Climate Models in the Simulation of Multihourly Precipitation Extremes, J. Climate, 27, 6155–6174, https://doi.org/10.1175/JCLI-D-13-00723.1, 2014.
Chan, S. C., Kendon, E. J., Berthou, S., Fosser, G., Lewis, E., and Fowler, H. J.: Europe-wide precipitation projections at convection permitting scale with the Unified Model, Clim. Dynam., 55, 409–428, https://doi.org/10.1007/s00382-020-05192-8, 2020.
Coppola, E., Sobolowski, S., Pichelli, E., Raffaele, F., Ahrens, B., Anders, I., Ban, N., Bastin, S., Belda, M., Belusic, D., Caldas-Alvarez, A., Cardoso, R. M., Davolio, S., Dobler, A., Fernandez, J., Fita, L., Fumiere, Q., Giorgi, F., Goergen, K., Güttler, I., Halenka, T., Heinzeller, D., Hodnebrog, Ø., Jacob, D., Kartsios, S., Katragkou, E., Kendon, E., Khodayar, S., Kunstmann, H., Knist, S., Lavín-Gullón, A., Lind, P., Lorenz, T., Maraun, D., Marelle, L., Van Meijgaard, E., Milovac, J., Myhre, G., Panitz, H.-J., Piazza, M., Raffa, M., Raub, T., Rockel, B., Schär, C., Sieck, K., Soares, P. M. M., Somot, S., Srnec, L., Stocchi, P., Tölle, M. H., Truhetz, H., Vautard, R., De Vries, H., and Warrach-Sagi, K.: A first-of-its-kind multi-model convection permitting ensemble for investigating convective phenomena over Europe and the Mediterranean, Clim. Dynam., 55, 3–34, https://doi.org/10.1007/s00382-018-4521-8, 2020.
Correa-Sánchez, N., Dallan, E., Marra, F., Fosser, G., and Borga, M.: Orographic control on bias and uncertainty in extreme sub-daily precipitation simulations from a convection-permitting ensemble, J. Hydrol., 659, 133324, https://doi.org/10.1016/j.jhydrol.2025.133324, 2025.
Cortés-Hernández, V. E., Caillaud, C., Bellon, G., Brisson, E., Alias, A., and Lucas-Picher, P.: Evaluation of the convection permitting regional climate model CNRM-AROME on the orographically complex island of Corsica, Clim. Dynam., 62, 4673–4696, https://doi.org/10.1007/s00382-024-07232-z, 2024.
Dallan, E., Marra, F., Fosser, G., Marani, M., Formetta, G., Schär, C., and Borga, M.: How well does a convection-permitting regional climate model represent the reverse orographic effect of extreme hourly precipitation?, Hydrol. Earth Syst. Sci., 27, 1133–1149, https://doi.org/10.5194/hess-27-1133-2023, 2023.
Dallan, E., Borga, M., Fosser, G., Canale, A., Roghani, B., Marani, M., and Marra, F.: A Method to Assess and Explain Changes in Sub-Daily Precipitation Return Levels From Convection-Permitting Simulations, Water Resour. Res., 60, e2023WR035969, https://doi.org/10.1029/2023WR035969, 2024a.
Dallan, E., Marra, F., Fosser, G., Marani, M., and Borga, M.: Dynamical Factors Heavily Modulate the Future Increase of Sub-Daily Extreme Precipitation in the Alpine-Mediterranean Region, Earth's Future, 12, e2024EF005185, https://doi.org/10.1029/2024EF005185, 2024b.
De Michele, C., Kottegoda, N. T., and Rosso, R.: The derivation of areal reduction factor of storm rainfall from its scaling properties, Water Resour. Res., 37, 3247–3252, https://doi.org/10.1029/2001WR000346, 2001.
Estermann, R., Rajczak, J., Velasquez, P., Lorenz, R., and Schär, C.: Projections of Heavy Precipitation Characteristics Over the Greater Alpine Region Using a Kilometer–Scale Climate Model Ensemble, J. Geophys. Res.-Atmos., 130, e2024JD040901, https://doi.org/10.1029/2024JD040901, 2025.
Fantini, A., Raffaele, F., Torma, C., Bacer, S., Coppola, E., Giorgi, F., Ahrens, B., Dubois, C., Sanchez, E., and Verdecchia, M.: Assessment of multiple daily precipitation statistics in ERA-Interim driven Med-CORDEX and EURO-CORDEX experiments against high resolution observations, Clim. Dynam., 51, 877–900, https://doi.org/10.1007/s00382-016-3453-4, 2018.
Fisher, R. A. and Tippett, L. H. C.: Limiting forms of the frequency distribution of the largest or smallest member of a sample, Math. Proc. Cambridge, 24, 180–190, https://doi.org/10.1017/S0305004100015681, 1928.
Flamig, Z. L., Vergara, H., and Gourley, J. J.: The Ensemble Framework For Flash Flood Forecasting (EF5) v1.2: description and case study, Geosci. Model Dev., 13, 4943–4958, https://doi.org/10.5194/gmd-13-4943-2020, 2020.
Fosser, G., Khodayar, S., and Berg, P.: Benefit of convection permitting climate model simulations in the representation of convective precipitation, Clim. Dynam., 44, 45–60, https://doi.org/10.1007/s00382-014-2242-1, 2015.
Fosser, G., Gaetani, M., Kendon, E. J., Adinolfi, M., Ban, N., Belušić, D., Caillaud, C., Careto, J. A. M., Coppola, E., Demory, M.-E., De Vries, H., Dobler, A., Feldmann, H., Goergen, K., Lenderink, G., Pichelli, E., Schär, C., Soares, P. M. M., Somot, S., and Tölle, M. H.: Convection-permitting climate models offer more certain extreme rainfall projections, npj Clim. Atmos. Sci., 7, 51, https://doi.org/10.1038/s41612-024-00600-w, 2024.
Frei, C. and Schär, C.: A precipitation climatology of the Alps from high-resolution rain-gauge observations, Int. J. Climatol., 18, 873–900, https://doi.org/10.1002/(SICI)1097-0088(19980630)18:8<873::AID-JOC255>3.0.CO;2-9, 1998.
Frei, C., Germann, U., Fukutome, S., and Liniger, M.: Möglichkeiten und grenzen der niederschlagsanalysen zum hochwasser 2005, in: Ereignisanalyse Hochwasser 2005: Teil 2 – Analyse von Prozessen, Massnahmen und Gefahrengrundlagen, 15–32, https://www.meteoschweiz.admin.ch/service-und-publikationen/publikationen/berichte-und-bulletins/2008/ moeglichkeit-und-grenzen-der-niederschlagsanalyse-zum-hochwasser-2006.html (last access: 22 June 2026), 2008.
Fumière, Q., Déqué, M., Nuissier, O., Somot, S., Alias, A., Caillaud, C., Laurantin, O., and Seity, Y.: Extreme rainfall in Mediterranean France during the fall: added value of the CNRM-AROME Convection-Permitting Regional Climate Model, Clim. Dynam., 55, 77–91, https://doi.org/10.1007/s00382-019-04898-8, 2020.
Gabella, M., Speirs, P., Hamann, U., Germann, U., and Berne, A.: Measurement of Precipitation in the Alps Using Dual-Polarization C-Band Ground-Based Radars, the GPM Spaceborne Ku-Band Radar, and Rain Gauges, Remote Sens., 9, 1147, https://doi.org/10.3390/rs9111147, 2017.
Gericke, O. and Pietersen, J. P. J.: Estimation of areai reduction factors using daily rainfall data and a geographically centred approach, J. S. Afr. Inst. Civ. Eng., 62, 20–31, https://doi.org/10.17159/2309-8775/2020/v62n4a3, 2020.
Germann, U., Galli, G., Boscacci, M., and Bolliger, M.: Radar precipitation measurement in a mountainous region, Q. J. Roy. Meteor. Soc., 132, 1669–1692, https://doi.org/10.1256/qj.05.190, 2006.
Germann, U., Boscacci, M., Clementi, L., Gabella, M., Hering, A., Sartori, M., Sideris, I. V., and Calpini, B.: Weather Radar in Complex Orography, Remote Sens., 14, 503, https://doi.org/10.3390/rs14030503, 2022.
Ghaemi, E., Gabella, M., Foelsche, U., Sideris, I., and Nerini, D.: The effect of altitude on the uncertainty of radar-based precipitation estimates over Switzerland, Int. J. Remote Sens., 44, 2495–2517, https://doi.org/10.1080/01431161.2023.2203339, 2023.
Giorgetta, M. A., Jungclaus, J., Reick, C. H., Legutke, S., Bader, J., Böttinger, M., Brovkin, V., Crueger, T., Esch, M., Fieg, K., Glushak, K., Gayler, V., Haak, H., Hollweg, H., Ilyina, T., Kinne, S., Kornblueh, L., Matei, D., Mauritsen, T., Mikolajewicz, U., Mueller, W., Notz, D., Pithan, F., Raddatz, T., Rast, S., Redler, R., Roeckner, E., Schmidt, H., Schnur, R., Segschneider, J., Six, K. D., Stockhause, M., Timmreck, C., Wegner, J., Widmann, H., Wieners, K., Claussen, M., Marotzke, J., and Stevens, B.: Climate and carbon cycle changes from 1850 to 2100 in MPI-ESM simulations for the Coupled Model Intercomparison Project phase 5, J. Adv. Model. Earth Sy., 5, 572–597, https://doi.org/10.1002/jame.20038, 2013.
Gnedenko, B.: Sur La Distribution Limite Du Terme Maximum D'Une Serie Aleatoire, Ann. Math., 44, 423–453, https://doi.org/10.2307/1968974, 1943.
Gugerli, R., Guidicelli, M., Gabella, M., Huss, M., and Salzmann, N.: Multi-sensor analysis of monthly gridded snow precipitation on alpine glaciers, Adv. Sci. Res., 18, 7–20, https://doi.org/10.5194/asr-18-7-2021, 2021.
Haslinger, K., Breinl, K., Pavlin, L., Pistotnik, G., Bertola, M., Olefs, M., Greilinger, M., Schöner, W., and Blöschl, G.: Increasing hourly heavy rainfall in Austria reflected in flood changes, Nature, 639, 667–672, https://doi.org/10.1038/s41586-025-08647-2, 2025.
Hazeleger, W., Severijns, C., Semmler, T., Ştefănescu, S., Yang, S., Wang, X., Wyser, K., Dutra, E., Baldasano, J. M., Bintanja, R., Bougeault, P., Caballero, R., Ekman, A. M. L., Christensen, J. H., Van Den Hurk, B., Jimenez, P., Jones, C., Kållberg, P., Koenigk, T., McGrath, R., Miranda, P., Van Noije, T., Palmer, T., Parodi, J. A., Schmith, T., Selten, F., Storelvmo, T., Sterl, A., Tapamo, H., Vancoppenolle, M., Viterbo, P., and Willén, U.: EC-Earth: A Seamless Earth-System Prediction Approach in Action, B. Am. Meteorol. Soc., 91, 1357–1364, https://doi.org/10.1175/2010BAMS2877.1, 2010.
Hazeleger, W., Wang, X., Severijns, C., Ştefănescu, S., Bintanja, R., Sterl, A., Wyser, K., Semmler, T., Yang, S., Van Den Hurk, B., Van Noije, T., Van Der Linden, E., and Van Der Wiel, K.: EC-Earth V2.2: description and validation of a new seamless earth system prediction model, Clim. Dynam., 39, 2611–2629, https://doi.org/10.1007/s00382-011-1228-5, 2012.
Höge, M., Kauzlaric, M., Siber, R., Schönenberger, U., Horton, P., Schwanbeck, J., Floriancic, M. G., Viviroli, D., Wilhelm, S., Sikorska-Senoner, A. E., Addor, N., Brunner, M., Pool, S., Zappa, M., and Fenicia, F.: CAMELS-CH: hydro-meteorological time series and landscape attributes for 331 catchments in hydrologic Switzerland, Earth Syst. Sci. Data, 15, 5755–5784, https://doi.org/10.5194/essd-15-5755-2023, 2023.
Isotta, F. A., Frei, C., Weilguni, V., Perčec Tadić, M., Lassègues, P., Rudolf, B., Pavan, V., Cacciamani, C., Antolini, G., Ratto, S. M., Munari, M., Micheletti, S., Bonati, V., Lussana, C., Ronchi, C., Panettieri, E., Marigo, G., and Vertačnik, G.: The climate of daily precipitation in the Alps: development and analysis of a high-resolution grid dataset from pan-Alpine rain-gauge data, Int. J. Climatol., 34, 1657–1675, https://doi.org/10.1002/joc.3794, 2014.
Jenkinson, A. F.: The frequency distribution of the annual maximum (or minimum) values of meteorological elements, Q. J. Roy. Meteor. Soc., 81, 158–171, https://doi.org/10.1002/qj.49708134804, 1955.
Kendon, E. J., Roberts, N. M., Senior, C. A., and Roberts, M. J.: Realism of Rainfall in a Very High-Resolution Regional Climate Model, J. Climate, 25, 5791–5806, https://doi.org/10.1175/JCLI-D-11-00562.1, 2012.
Kendon, E. J., Ban, N., Roberts, N. M., Fowler, H. J., Roberts, M. J., Chan, S. C., Evans, J. P., Fosser, G., and Wilkinson, J. M.: Do Convection-Permitting Regional Climate Models Improve Projections of Future Precipitation Change?, B. Am. Meteorol. Soc., 98, 79–93, https://doi.org/10.1175/BAMS-D-15-0004.1, 2017.
Kendon, E. J., Prein, A. F., Senior, C. A., and Stirling, A.: Challenges and outlook for convection-permitting climate modelling, Philos. Trans. R. Soc. Math. Phys. Eng. Sci., 379, 20190547, https://doi.org/10.1098/rsta.2019.0547, 2021.
Keuler, K., Radtke, K., Kotlarski, S., and Lüthi, D.: Regional climate change over Europe in COSMO-CLM: Influence of emission scenario and driving global model, Meteorol. Z., 25, 121–136, https://doi.org/10.1127/metz/2016/0662, 2016.
Kuhlbrodt, T., Jones, C. G., Sellar, A., Storkey, D., Blockley, E., Stringer, M., Hill, R., Graham, T., Ridley, J., Blaker, A., Calvert, D., Copsey, D., Ellis, R., Hewitt, H., Hyder, P., Ineson, S., Mulcahy, J., Siahaan, A., and Walton, J.: The Low-Resolution Version of HadGEM3 GC3.1: Development and Evaluation for Global Climate, J. Adv. Model. Earth Sy., 10, 2865–2888, https://doi.org/10.1029/2018MS001370, 2018.
La Barbera, P., Lanza, L. G., and Stagi, L.: Tipping bucket mechanical errors and their influence on rainfall statistics and extremes, Water Sci. Technol., 45, 1–9, https://doi.org/10.2166/wst.2002.0020, 2002.
Leutwyler, D., Fuhrer, O., Lapillonne, X., Lüthi, D., and Schär, C.: Towards European-scale convection-resolving climate simulations with GPUs: a study with COSMO 4.19, Geosci. Model Dev., 9, 3393–3412, https://doi.org/10.5194/gmd-9-3393-2016, 2016.
Lucas-Picher, P., Argüeso, D., Brisson, E., Tramblay, Y., Berg, P., Lemonsu, A., Kotlarski, S., and Caillaud, C.: Convection -permitting modeling with regional climate models: Latest developments and next steps, WIREs Clim. Change, 12, https://doi.org/10.1002/wcc.731, 2021.
Lucas-Picher, P., Brisson, E., Caillaud, C., Alias, A., Nabat, P., Lemonsu, A., Poncet, N., Cortés Hernandez, V. E., Michau, Y., Doury, A., Monteiro, D., and Somot, S.: Evaluation of the convection-permitting regional climate model CNRM-AROME41t1 over Northwestern Europe, Clim. Dynam., 62, 4587–4615, https://doi.org/10.1007/s00382-022-06637-y, 2024.
Marchi, L., Borga, M., Preciso, E., and Gaume, E.: Characterisation of selected extreme flash floods in Europe and implications for flood risk management, J. Hydrol., 394, 118–133, https://doi.org/10.1016/j.jhydrol.2010.07.017, 2010.
Marra, F.: A test for the hypothesis: block maxima are samples from a parent distribution with Weibull tail, Zenodo [code], https://doi.org/10.5281/zenodo.7234708, 2022.
Marra, F.: A Unified Framework for Extreme Sub-daily Precipitation Frequency Analyses based on Ordinary Events - data & codes - v1.2, Zenodo [data set/code], https://doi.org/10.5281/zenodo.11934843, 2024.
Marra, F., Zoccatelli, D., Armon, M., and Morin, E.: A simplified MEV formulation to model extremes emerging from multiple nonstationary underlying processes, Adv. Water Resour., 127, 280–290, https://doi.org/10.1016/j.advwatres.2019.04.002, 2019.
Marra, F., Borga, M., and Morin, E.: A Unified Framework for Extreme Subdaily Precipitation Frequency Analyses Based on Ordinary Events, Geophys. Res. Lett., 47, https://doi.org/10.1029/2020GL090209, 2020.
Marra, F., Amponsah, W., and Papalexiou, S. M.: Non-asymptotic Weibull tails explain the statistics of extreme daily precipitation, Adv. Water Resour., 173, 104388, https://doi.org/10.1016/j.advwatres.2023.104388, 2023.
MeteoSwiss – Federal Office of Meteorology and Climatology: Climatology of heavy precipitation, https://www.meteoswiss.admin.ch/climate/the-climate-of-switzerland/records-and-extremes/climatology-of-heavy-precipitation.html(last access: 22 June 2026), 2025a.
MeteoSwiss – Federal Office of Meteorology and Climatology: CombiPrecip precipitation data, https://www.meteoswiss.admin.ch/dam/jcr:2691db4e-7253-41c6-a413-2c75c9de11e3/ProdDoc_CPC.pdf (last access: 22 June 2026), 2025b.
Nabat, P., Somot, S., Cassou, C., Mallet, M., Michou, M., Bouniol, D., Decharme, B., Drugé, T., Roehrig, R., and Saint-Martin, D.: Modulation of radiative aerosols effects by atmospheric circulation over the Euro-Mediterranean region, Atmos. Chem. Phys., 20, 8315–8349, https://doi.org/10.5194/acp-20-8315-2020, 2020.
Noël, B., van de Berg, W. J., van Meijgaard, E., Kuipers Munneke, P., van de Wal, R. S. W., and van den Broeke, M. R.: Evaluation of the updated regional climate model RACMO2.3: summer snowfall impact on the Greenland Ice Sheet, The Cryosphere, 9, 1831–1844, https://doi.org/10.5194/tc-9-1831-2015, 2015.
Panziera, L., Gabella, M., Germann, U., and Martius, O.: A 12-year radar-based climatology of daily and sub-daily extreme precipitation over the Swiss Alps, Int. J. Climatol., 38, 3749–3769, https://doi.org/10.1002/joc.5528, 2018.
Papalexiou, S. M. and Koutsoyiannis, D.: Battle of extreme value distributions: A global survey on extreme daily rainfall, Water Resour. Res., 49, 187–201, https://doi.org/10.1029/2012WR012557, 2013.
Papalexiou, S. M., AghaKouchak, A., and Foufoula-Georgiou, E.: A Diagnostic Framework for Understanding Climatology of Tails of Hourly Precipitation Extremes in the United States, Water Resour. Res., 54, 6725–6738, https://doi.org/10.1029/2018WR022732, 2018.
Pichelli, E., Coppola, E., Sobolowski, S., Ban, N., Giorgi, F., Stocchi, P., Alias, A., Belušić, D., Berthou, S., Caillaud, C., Cardoso, R. M., Chan, S., Christensen, O. B., Dobler, A., De Vries, H., Goergen, K., Kendon, E. J., Keuler, K., Lenderink, G., Lorenz, T., Mishra, A. N., Panitz, H.-J., Schär, C., Soares, P. M. M., Truhetz, H., and Vergara-Temprado, J.: The first multi-model ensemble of regional climate simulations at kilometer-scale resolution part 2: historical and future simulations of precipitation, Clim. Dynam., 56, 3581–3602, https://doi.org/10.1007/s00382-021-05657-4, 2021.
Pinty, J.-P., Cosma, S., Cohard, J.-M., Richard, E., and Chaboureau, J.-P.: CCN sensitivity of a warm precipitation event over fine scale orography with an advanced microphysical scheme, Atmos. Res., 59–60, 419–446, https://doi.org/10.1016/S0169-8095(01)00128-4, 2001.
Poncet, N., Lucas-Picher, P., Tramblay, Y., Thirel, G., Vergara, H., Gourley, J., and Alias, A.: Does a convection-permitting regional climate model bring new perspectives on the projection of Mediterranean floods?, Nat. Hazards Earth Syst. Sci., 24, 1163–1183, https://doi.org/10.5194/nhess-24-1163-2024, 2024.
Poschlod, B. and Koh, J.: Convection-Permitting Climate Models Can Support Observations to Generate Rainfall Return Levels, Water Resour. Res., 60, e2023WR035159, https://doi.org/10.1029/2023WR035159, 2024.
Powers, J. G., Klemp, J. B., Skamarock, W. C., Davis, C. A., Dudhia, J., Gill, D. O., Coen, J. L., Gochis, D. J., Ahmadov, R., Peckham, S. E., Grell, G. A., Michalakes, J., Trahan, S., Benjamin, S. G., Alexander, C. R., Dimego, G. J., Wang, W., Schwartz, C. S., Romine, G. S., Liu, Z., Snyder, C., Chen, F., Barlage, M. J., Yu, W., and Duda, M. G.: The Weather Research and Forecasting Model: Overview, System Efforts, and Future Directions, B. Am. Meteorol. Soc., 98, 1717–1737, https://doi.org/10.1175/BAMS-D-15-00308.1, 2017.
Prein, A. F., Langhans, W., Fosser, G., Ferrone, A., Ban, N., Goergen, K., Keller, M., Tölle, M., Gutjahr, O., Feser, F., Brisson, E., Kollet, S., Schmidli, J., Lipzig, N. P. M., and Leung, R.: A review on regional convection-permitting climate modeling: Demonstrations, prospects, and challenges, Rev. Geophys., 53, 323–361, https://doi.org/10.1002/2014RG000475, 2015.
Prein, A. F., Gobiet, A., Truhetz, H., Keuler, K., Goergen, K., Teichmann, C., Fox Maule, C., Van Meijgaard, E., Déqué, M., Nikulin, G., Vautard, R., Colette, A., Kjellström, E., and Jacob, D.: Precipitation in the EURO-CORDEX 0.11° and 0.44° simulations: high resolution, high benefits?, Clim. Dynam., 46, 383–412, https://doi.org/10.1007/s00382-015-2589-y, 2016.
Rajulapati, C. R., Papalexiou, S. M., Clark, M. P., and Pomeroy, J. W.: The Perils of Regridding: Examples using a Global Precipitation Dataset, J. Appl. Meteorol. Clim., 60, 1561–1573, https://doi.org/10.1175/JAMC-D-20-0259.1, 2021.
Rasmussen, S. H., Christensen, J. H., Drews, M., Gochis, D. J., and Refsgaard, J. C.: Spatial-Scale Characteristics of Precipitation Simulated by Regional Climate Models and the Implications for Hydrological Modeling, J. Hydrometeorol., 13, 1817–1835, https://doi.org/10.1175/JHM-D-12-07.1, 2012.
Roberts, M. J., Baker, A., Blockley, E. W., Calvert, D., Coward, A., Hewitt, H. T., Jackson, L. C., Kuhlbrodt, T., Mathiot, P., Roberts, C. D., Schiemann, R., Seddon, J., Vannière, B., and Vidale, P. L.: Description of the resolution hierarchy of the global coupled HadGEM3-GC3.1 model as used in CMIP6 HighResMIP experiments, Geosci. Model Dev., 12, 4999–5028, https://doi.org/10.5194/gmd-12-4999-2019, 2019.
Rockel, B., Will, A., and Hense, A.: The Regional Climate Model COSMO-CLM (CCLM), Meteorol. Z., 17, 347–348, https://doi.org/10.1127/0941-2948/2008/0309, 2008.
Rosin, T., Marra, F., and Morin, E.: Exploring patterns in precipitation intensity–duration–area–frequency relationships using weather radar data, Hydrol. Earth Syst. Sci., 28, 3549–3566, https://doi.org/10.5194/hess-28-3549-2024, 2024.
Rotunno, R. and Houze, R. A.: Lessons on orographic precipitation from the Mesoscale Alpine Programme, Q. J. Roy. Meteor. Soc., 133, 811–830, https://doi.org/10.1002/qj.67, 2007.
Rybka, H., Haller, M., Brienen, S., Brauch, J., Früh, B., Junghänel, T., Lengfeld, K., Walter, A., and Winterrath, T.: Convection-permitting climate simulations with COSMO-CLM for Germany: Analysis of present and future daily and sub-daily extreme precipitation, Meteorol. Z., 32, 91–111, https://doi.org/10.1127/metz/2022/1147, 2023.
Schär, C., Fuhrer, O., Arteaga, A., Ban, N., Charpilloz, C., Di Girolamo, S., Hentgen, L., Hoefler, T., Lapillonne, X., Leutwyler, D., Osterried, K., Panosetti, D., Rüdisühli, S., Schlemmer, L., Schulthess, T. C., Sprenger, M., Ubbiali, S., and Wernli, H.: Kilometer-Scale Climate Models: Prospects and Challenges, B. Am. Meteorol. Soc., 101, E567–E587, https://doi.org/10.1175/BAMS-D-18-0167.1, 2020.
Schulzweida, U.: CDO User Guide, Zenodo, https://doi.org/10.5281/ZENODO.7112925, 2022.
Sideris, I. V., Gabella, M., Erdin, R., and Germann, U.: Real-time radar–rain-gauge merging using spatio-temporal co-kriging with external drift in the alpine terrain of Switzerland, Q. J. Roy. Meteor. Soc., 140, 1097–1111, https://doi.org/10.1002/qj.2188, 2014.
Sørland, S. L., Brogli, R., Pothapakula, P. K., Russo, E., Van de Walle, J., Ahrens, B., Anders, I., Bucchignani, E., Davin, E. L., Demory, M.-E., Dosio, A., Feldmann, H., Früh, B., Geyer, B., Keuler, K., Lee, D., Li, D., van Lipzig, N. P. M., Min, S.-K., Panitz, H.-J., Rockel, B., Schär, C., Steger, C., and Thiery, W.: COSMO-CLM regional climate simulations in the Coordinated Regional Climate Downscaling Experiment (CORDEX) framework: a review, Geosci. Model Dev., 14, 5125–5154, https://doi.org/10.5194/gmd-14-5125-2021, 2021.
Stuart, S. J., Dean, S. M., Mackintosh, A. N., Sood, A., Gibson, P. B., Moore, S., and Kendon, E. J.: Precipitation Over Complex Mountain Terrain in a Convection-Permitting Regional Climate Model, J. Geophys. Res.-Atmos., 130, e2024JD042773, https://doi.org/10.1029/2024JD042773, 2025.
Svensson, C. and Jones, D. A.: Review of methods for deriving areal reduction factors, J. Flood Risk Manag., 3, 232–245, https://doi.org/10.1111/j.1753-318X.2010.01075.x, 2010.
Tocher, K. D. and Gumbel, E. J.: Statistical Theory of Extreme Values and Some Practical Applications, J. R. Stat. Soc. Ser. Gen., 118, p. 106, https://doi.org/10.2307/2342529, 1955.
Vidrio-Sahagún, C. T. and He, J.: Hydrological frequency analysis under nonstationarity using the Metastatistical approach and its simplified version, Adv. Water Resour., 166, 104244, https://doi.org/10.1016/j.advwatres.2022.104244, 2022.
Vidrio-Sahagún, C. T., He, J., and Pietroniro, A.: Improved Correction of Extreme Precipitation Through Explicit and Continuous Nonstationarity Treatment and the Metastatistical Approach, Water Resour. Res., 61, e2024WR037721, https://doi.org/10.1029/2024WR037721, 2025.
Viglione, A. and Blöschl, G.: On the role of storm duration in the mapping of rainfall to flood return periods, Hydrol. Earth Syst. Sci., 13, 205–216, https://doi.org/10.5194/hess-13-205-2009, 2009.
Vohnicky, P., Dallan, E., Marra, F., Fosser, G., and Borga, M.: Future precipitation extremes: Differential changes from point to catchment scale revealed by a convection-permitting model ensemble, J. Hydrol., 662, 133822, https://doi.org/10.1016/j.jhydrol.2025.133822, 2025.
Voldoire, A., Sanchez-Gomez, E., Salas Y Mélia, D., Decharme, B., Cassou, C., Sénési, S., Valcke, S., Beau, I., Alias, A., Chevallier, M., Déqué, M., Deshayes, J., Douville, H., Fernandez, E., Madec, G., Maisonnave, E., Moine, M.-P., Planton, S., Saint-Martin, D., Szopa, S., Tyteca, S., Alkama, R., Belamari, S., Braun, A., Coquart, L., and Chauvin, F.: The CNRM-CM5.1 global climate model: description and basic evaluation, Clim. Dynam., 40, 2091–2121, https://doi.org/10.1007/s00382-011-1259-y, 2013.
Weibull, W.: A Statistical Distribution Function of Wide Applicability, J. Appl. Mech., 18, 293–297, https://doi.org/10.1115/1.4010337, 1951.
Wilson, P. S. and Toumi, R.: A fundamental probability distribution for heavy rainfall, Geophys. Res. Lett., 32, 2005GL022465, https://doi.org/10.1029/2005GL022465, 2005.
Zorzetto, E., Canale, A., and Marani, M.: A Bayesian non-asymptotic extreme value model for daily rainfall data, J. Hydrol., 628, 130378, https://doi.org/10.1016/j.jhydrol.2023.130378, 2024.