the Creative Commons Attribution 4.0 License.
the Creative Commons Attribution 4.0 License.
 | 29 Jun 2026
Understanding changes in Iceland's streamflow dynamics in response to climate change
Hordur Bragi Helgason
Andri Gunnarsson
Óli G. B. Sveinsson
Bart Nijssen
The hydrological cycle in high-latitude regions is undergoing significant changes due to climate change. Iceland, with its long-term records from minimally disturbed catchments, provides a unique opportunity to study these changes. The country's heavy reliance on hydropower, without interconnections to other electricity markets, makes understanding these changes critical. We analyzed streamflow records from 25 gauges (1973–2023) and 37 gauges (1993–2023) in the LamaH-Ice dataset, alongside ERA5-Land reanalysis data, to assess climate-driven changes in annual, seasonal, and intra-annual flow regimes. Interannual variability remains high, with multi-year fluctuations strongly linked to the Arctic Oscillation. Significant warming has occurred in both periods, and precipitation has increased, with the most pronounced intensification in September. Precipitation has transitioned from a snowfall-dominated to a rainfall-dominated regime, with an abrupt shift around 2000. Over 1973–2023, statistically significant increases in annual discharge were observed in approximately one-third of catchments, while most others showed non-significant upward tendencies. Over 1993–2023, significant increases were limited to roughly one-seventh of catchments, although most others still trended upward. Seasonally, fall and winter showed the strongest and most widespread increases over the period 1973–2023, and the centroid of annual flows occurred significantly earlier. Over 1993–2023, spring and fall showed the largest increases. Summer trends were rarely significant but predominantly negative, especially in surface-fed rivers. In glaciated catchments, melt-season discharge increased over 1973–2023 but shifted toward negative tendencies over 1993–2023, consistent with a recent North Atlantic cooling anomaly and reduced glacier melt. Hydrological variability declined, with consistent reductions in coefficients of variation and flashiness. The proportion of baseflow in total discharge exhibited a coherent tendency toward increase, with significant rises at a minority of sites – more common over the longer record than in the shorter, more recent period. Across both periods, baseflow acted as a hydrological buffer, dampening flow declines in summer and moderating increases in winter and spring. These findings indicate that Iceland's hydrology is transitioning toward higher cool-season discharge and emerging summer reductions under a rainfall-dominated climate, with broader implications for reservoir operations and water resources management. This study enhances our understanding of Icelandic hydrology and contributes to global knowledge on climate-induced hydrological changes.
- Article
(10845 KB) - Full-text XML
-
Supplement
(4805 KB) - BibTeX
- EndNote


Anthropogenic climate warming, primarily driven by greenhouse gas emissions, has caused widespread environmental changes around the globe (IPCC, 2023). The Arctic has experienced particularly profound effects, with warming occurring at close to four times the rate of the global average between 1979 and 2021 (Rantanen et al., 2022). This has led to an intensification of the hydrological cycle in the region (Box et al., 2019; Rawlins and Karmalkar, 2024).
Since the late 19th century, Iceland has experienced significant warming, although this trend has not been continuous. Following early 20th-century warming and a mid-century cooling phase that lasted until the late 1970s, rapid warming resumed and continued through recent decades, averaging 0.47 °C per decade between 1980 and 2015 (Björnsson et al., 2018, 2023). Despite this significant warming, analyses of snow observations in Iceland have shown a significant increase in snow cover and snow depth in some regions of Iceland over the periods 1930–2021 and 2001–2021 (Eythorsson et al., 2023). This is attributed to increases in precipitation, as annual precipitation in Iceland increased by about 10 % between 1980–2015, with substantial variations between locations (Björnsson et al., 2018).
In addition to changes in weather and snow conditions, various other environmental factors in Iceland have undergone significant changes that impact streamflow dynamics. Glaciers have lost 18 % of their area and 16 % of their mass since 1890, with the most rapid mass loss occurring between 1994 and 2010 (Aðalgeirsdóttir et al., 2020). Since 2010, the pace of glacier net mass loss has reduced (Aðalgeirsdóttir et al., 2020). Soil temperatures in Iceland have increased, soil frost depth and duration have decreased (Petersen and Berber, 2018; Zaqout et al., 2023; Zaqout and Andradóttir, 2023), and permafrost is warming at a high rate and showing signs of degradation, with evidence of disappearance in some areas (Etzelmüller et al., 2023). Since the 1980s, increases in vegetation cover have been observed in the arctic, with increases particularly high in Iceland (Raynolds et al., 2015).
It is, however, still unclear how these changes have affected streamflow in Icelandic rivers. No recent comprehensive studies exist in the literature on how streamflow dynamics have changed in Iceland in the past decades. Jónsdóttir et al. (2006, 2008) performed trend analyses for two streamflow series for the period 1942–2002 and ten streamflow series for the period 1961–2000 to determine long-term changes in streamflow. Modest and statistically insignificant trends were found for mean annual and seasonal streamflow. For the longer period, a positive trend of 4 % per decade in annual streamflow was observed for one of the two rivers (Jónsdóttir et al., 2006). For the more recent period (1993–2023), no trends were found for annual streamflow. However, two out of ten stations showed a 6 %–7 % increase per decade for summer streamflow, which was attributed to colder temperatures in spring, delaying snowmelt into the summer. The magnitude of floods had a positive trend in the spring and a negative trend in the fall, and spring floods showed a trend towards later timing, though these findings were generally not deemed statistically significant. A key takeaway was that despite a substantial increase in precipitation, no corresponding increase was found in the flow of non-glacial rivers (Jónsdóttir et al., 2006). Wilson et al. (2010) analyzed trends in annual and seasonal streamflow in Icelandic rivers for 1961–2000 and found no significant trends in either annual or seasonal streamflow, confirming the findings by Jónsdóttir et al. (2006). Their analysis also showed no shift in the timing of the spring floods. Blöschl et al. (2017) examined the timing of the annual highest floods across Europe between 1960–2010 and showed that (spring) flooding in southwestern Iceland occurred later in the year, while flooding occurred earlier (or changed little) in the northeastern part of the country.
Crochet (2013) examined the sensitivity of ten river catchments to climate variability by comparing streamflow patterns during cold and warm years, as well as wet and dry years, using data from 1971–2006. The analysis revealed that streamflow seasonality is highly sensitive to temperature increases, manifesting as reduced snowpack, earlier snowmelt, and higher streamflow in winter, with decreased flow in summer for non-glaciated catchments.
In this study, we investigate the multiannual variability in Iceland's climate and analyze changes in streamflow, aiming to link these changes to shifts in hydro-meteorological drivers, catchment attributes, and changes in glacier extent. Unlike previous studies that analyzed only a limited number of streamflow stations, our study leverages a significantly larger observational network. The data we use is from the “LArge-SaMple Data for Hydrology and Environmental Sciences for Iceland” (LamaH-Ice) dataset (Helgason and Nijssen, 2024, 2025) which provides streamflow measurements from an extensive network of mostly undisturbed catchments, enabling a comprehensive study of changes in streamflow dynamics over recent decades due to climate change. We calculate trends for various climate and streamflow metrics while accounting for natural climate variability. Previous studies have demonstrated that Icelandic streamflow responds to large-scale atmospheric variability, particularly the Arctic Oscillation (AO) and, to a lesser extent, the North Atlantic Oscillation (NAO) (Jónsdóttir and Uvo, 2009). However, these analyses were based on relatively few stations and shorter time periods. Using the expanded LamaH-Ice dataset, we revisit these relationships to evaluate whether they continue to explain year-to-year fluctuations in streamflow across a broader and more recent observational record. Our research addresses three key questions: (1) How have precipitation, temperature, and streamflow varied interannually across Iceland since 1950, and what are the dominant patterns of long-term change? (2) To what extent can this variability be attributed to large-scale atmospheric circulation patterns (AO/NAO)? (3) Are there significant trends in annual, seasonal and subseasonal streamflow across Iceland over recent decades, and what meteorological or catchment-related factors explain these trends?
2.1 The hydrology of Iceland
Iceland, positioned in the North Atlantic, features a unique landscape shaped by glaciers that currently cover 10 % of the country, active volcanism, and distinctive hydrological characteristics. Geologically, Iceland is bisected by a volcanic rift zone, leading to varied bedrock conditions that significantly affect hydrological patterns. Rivers originating from areas with porous, young bedrock exhibit high baseflow, while those from regions with older, less permeable bedrock are primarily surface-fed. Despite the dominance of natural landscapes, with urban and agricultural areas comprising only a small fraction of the land, the hydrological system is complex. Rivers are categorized by their sources as glacial, direct-runoff, or spring-fed, although many receive contributions from multiple sources.
Streamflow regimes in Iceland exhibit pronounced seasonal variability. Streamflow is typically lowest during winter, when precipitation is largely stored as snow and ice and contributes little to immediate runoff, although groundwater-fed rivers maintain more stable discharge due to sustained baseflow contributions. High flows generally occur during spring and early summer due to snowmelt, with the snowmelt-driven seasonality becoming more pronounced at higher elevations. In glaciated catchments, an additional summer peak is driven by glacier melt, often extending elevated flows into late summer and early fall. Spatially, southern catchments tend to experience higher flows due to stronger precipitation forcing, whereas northern and interior catchments are more strongly influenced by snow accumulation and melt dynamics.
2.2 Climate variability and link to large-scale atmospheric patterns
Iceland's hydrology is profoundly influenced by its location, subject to frequent cyclones crossing the Atlantic from west to east and abundant precipitation, especially in winter. Iceland's climate is marked by high interannual variability, largely driven by broad-scale atmospheric circulation patterns. The Arctic Oscillation (AO) plays a significant role, with a strong polar vortex (positive AO) trapping cold air in the Arctic and leading to milder, wetter conditions in Iceland (Thompson and Wallace, 1998). The Icelandic Low (IL), a semi-permanent low-pressure system between Iceland and Greenland, significantly shapes the path of cyclones crossing the Atlantic. The North Atlantic Oscillation (NAO) index measures the pressure difference between the IL and the Azores High (Wanner et al., 2001). During a positive NAO phase, the IL intensifies, enhancing westerly winds that bring warmer, more humid air to Iceland, increasing precipitation, particularly in the south and west. Streamflow in Iceland from 1966 to 2004 has been shown to be correlated with the AO and the NAO, though the latter's influence is generally less significant (Jónsdóttir and Uvo, 2009). Studies have also identified a strong positive correlation between streamflow magnitude and the intensity of southerly winds at the 500 hPa level (Snorrason, 1990). Additionally, sea surface temperatures (SSTs) around Iceland further modulate surface air temperatures, with warmer SSTs increasing glacial melt and runoff in glacial rivers (Jónsdóttir and Uvo, 2009).
2.3 Data
We use streamflow measurements, atmospheric reanalysis data and catchment characteristics from the LamaH-Ice dataset, version 1.5 (Helgason and Nijssen, 2024, 2025). Most of the catchments in LamaH-Ice are unaffected by anthropogenic influence such as flow regulations, water withdrawals or diversions. The dataset thus enables a comprehensive study of changes in streamflow dynamics during the past decades due to climate change.
2.3.1 Streamflow measurements
We exclude streamflow data from gauges heavily influenced by anthropogenic activities (e.g. hydropower withdrawals) or natural changes, such as evolving catchment boundaries due to shifting river courses. However, gauges downstream of hydropower reservoirs are included in the analysis of annual average streamflow trends when the reservoirs do not significantly affect annual streamflow volumes. The locations of the streamflow gauges used in this study are shown in Fig. S29 in the Supplement, and Supplement Table S1 provides an overview of the gauges, including river names, gauge locations and missing data percentages. The table also provides three catchment attributes: catchment area, glacier percentage and the degree of anthropogenic impact.
The uncertainty in the streamflow observations is discussed in detail in the LamaH-Ice data description paper (Helgason and Nijssen, 2024). Streamflow measurements in Iceland are prone to interruptions (e.g., ice disturbances or instrument malfunctions), particularly during winter, which can reduce data availability and introduce additional uncertainty. Moreover, uncertainty in older streamflow periods is higher than in recent periods due to less advanced instrumentation. As a result, trends calculated for winter streamflow, as well as trends that place greater weight on the earlier parts of the observational record (e.g. the 1970s and 1980s), should be interpreted with greater caution. Trends derived from other seasons and more recent decades are therefore expected to be comparatively more robust.
While LamaH-Ice includes a pre-filtered version of the data that retains only high-quality observations, this study uses the full dataset, which contains periods that have been gap-filled by experts using auxiliary observations such as weather data or nearby gauges. However, some periods could not be reconstructed and remain missing. For the analysis of trends in streamflow magnitudes, we did not attempt to fill these remaining gaps. We allowed up to 10 % of daily data to be missing per year (or season) and calculated averages from the available data without filling missing values. If more than 10 % was missing, the corresponding year (or season) was removed entirely from the time series prior to trend estimation. Trends were therefore calculated only from the remaining valid annual or seasonal values. We then calculated trends for time series with at least 80 % temporal coverage in annual values between the defined start and end dates. The percentage of years excluded due to missing data for each gauge and analysis period is reported in Table S1. While removing years reduces the effective sample size and may affect the power of the significance test, the proportion of excluded years is generally small, such that the estimated trend direction and magnitude are unlikely to be strongly affected.
Some gauges represent nested sub-catchments of larger river systems. Specifically, gauges 46 (Jökulsá á Fjöllum at Upptyppingar) and 59 (Kreppa) are sub-catchments of gauge 45 (Jökulsá á Fjöllum at Grímsstaðir); gauge 86 (Tungnaá at Maríufoss) is nested within gauge 102 (Þjórsá at Þjórsártún); and gauges 8 (Brúará at Dynjandi), 36 (Hvítá at Fremstaver), and 79 (Sog at Ásgarður) are sub-catchments of gauge 98 (Ölfusá at Selfoss). Rather than exclude gauges 45, 98, and 102, we retain them in the analysis because they integrate substantial additional drainage areas downstream of their respective sub-catchments, and trends in sub-catchments can provide information about spatial variability in trends.
2.3.2 Meteorological time series and catchment attributes
Meteorological time series in LamaH-Ice are derived from the ERA5-Land reanalysis (Muñoz-Sabater et al., 2021), which is driven by the ERA5 reanalysis (Hersbach et al., 2020). ERA5-Land has a spatial resolution of 0.1°×0.1° (approximately 5×11 km over Iceland). We use time series for total precipitation, snowfall, and temperature for the catchments in LamaH-Ice. Catchment-average time series were computed by calculating an area-weighted mean of ERA5-Land grid cells intersecting each catchment polygon, including partially overlapping grid cells (Helgason and Nijssen, 2024). Trends in climate variables were calculated from these catchment-average time series.
Recent studies have evaluated ERA5-Land over glacierized regions. In the mountains of eastern Siberia, ERA5-Land reproduced temperature levels and trends from station data reliably (< 20 % trend error), while precipitation was found suitable mainly for trend analysis rather than absolute values (Titkova and Ananicheva, 2024). On the Tibetan Plateau, elevation-corrected ERA5-Land temperatures achieved high accuracy (R2≈0.9) and were successfully used to track glacier melt phenology trends over four decades (Li et al., 2025). Likewise, in the tropical Andes, validation against on-glacier stations showed strong performance for 2 m air temperature (r>0.8) and moderate skill for humidity (Bonshoms et al., 2022). These studies suggest that ERA5-Land provides robust temperature and trend information in glaciated terrain, although snow and precipitation variables should be interpreted cautiously or in a relative sense. As noted in the LamaH-Ice data description paper, ERA5-Land tends to underestimate precipitation in Iceland, particularly in coastal and mountainous regions, due to the underrepresentation of orographic enhancement in the reanalysis model.
To evaluate the reliability of ERA5-Land data for climate trend analysis in Iceland, we compared catchment-averaged ERA5-Land time series with observed station data and with time series from other regional reanalysis datasets. The results show that ERA5-Land accurately reproduces observed temperature variability and long-term trends, as evidenced by strong agreement with station data from Reykjavík over the 1973–2023 period (Fig. S2). Additionally, mean annual temperatures from ERA5-Land show strong correspondence with those from the higher-resolution CARRA reanalysis (Schyberg et al., 2020), reinforcing confidence in the dataset's representation of temperature patterns (Fig. S3). For precipitation, ERA5-Land and CARRA display consistent spatial patterns in trend direction across catchments (Fig. S4). While ERA5-Land tends to produce slightly stronger (more positive) precipitation trend magnitudes than CARRA, the overall agreement is robust (Pearson R= 0.88), indicating that ERA5-Land reliably captures spatial and temporal variations in precipitation across Iceland. A full description of the comparison methodology and results is provided in the Supplement (Sect. S2). It should be noted that in catchments with a substantial glacierized area, a large fraction of precipitation that falls in the glacier accumulation zone does not immediately contribute to streamflow. Instead, it becomes part of the glacier mass and may be released as runoff only after years or even decades.
Time series for total evaporation (ET) we use are also from the ERA5-Land reanalysis. The reanalysis uses the Carbon Hydrology-Tiled ECMWF Scheme for Surface Exchanges over Land (CHTESSEL) land surface model. ET is a model-derived diagnostic variable and is generally more uncertain than the meteorological forcing variables, and its trends should therefore be interpreted with caution. Land characteristics, such as glacier and vegetation cover, are represented by static masks based on satellite observations from the 1990s (Muñoz-Sabater et al., 2021). As a result, changes in glacier cover and vegetation are not reflected in ERA5-Land. The uncertainty in the ERA5-Land series is discussed in the LamaH-Ice data description paper (Helgason and Nijssen, 2024). The maps in Sect. 3 use a basemap shapefile from Hijmans (2015) and glacier outlines from Hannesdóttir et al. (2020).
We incorporate static catchment attributes from the LamaH-Ice dataset, which provide information on topography, climate, and hydrology, as well as land cover, vegetation, soils, geology, and glaciation. In addition, we use time series that describe temporal changes in glacier-covered areas within the catchments. Further details are available in the LamaH-Ice publication (Helgason and Nijssen, 2024). The AO and NAO indices were obtained from the NOAA Climate Prediction Center (NOAA CPC, 2024a, b).
2.4 Homogeneity of streamflow series
Streamflow measurement series may exhibit inhomogeneity, meaning their statistical properties, such as mean or variance, change over time due to factors like alterations in measurement practices or environmental conditions. To assess the homogeneity of the streamflow records in LamaH-Ice, we performed the standard Petitt test (Pettitt, 1979). Series identified as inhomogeneous were manually inspected for breaks in homogeneity that were either (1) linked to a documented change in measurement practices or to specific incidents that compromised data quality, or (2) distinctly observable in the data, and these breaks could not be accounted for by shifts in temperature or precipitation. The homogeneity analysis revealed that one time series needed to be omitted (Syðri-Bægisá river). The analysis is further described in the Supplement (Sect. S1).
2.5 Calculation of spring freshet timing, centroid of timing and peak flow timing
To calculate the timing of spring freshet and centroid of timing, complete and continuous series of streamflow were needed. Many methods have been used in the literature to fill gaps in streamflow records, ranging from simple linear interpolation to advanced statistical or hydrological modeling techniques (Dembélé et al., 2019). A commonly applied approach involves interpolation from analogue gauging stations (WMO, 2008). Instead of relying on data from nearby gauges, we opted to fill missing streamflow records using the inter-annual mean daily flow for the given gauge. This method leverages temporal averaging and scaling based on observed streamflow conditions. Specifically, for each missing value, a 31 d window (15 d before and after the target date) was used to extract observed values. A scaling factor was then calculated as the ratio of the median flow in this window to the mean daily flow over the same period. The missing value was subsequently estimated by applying this scaling factor to the mean flow for the same day of the year from other years. We used the median flow in the 31 d window instead of the mean, to minimize the influence of extreme values. We applied this method for all gaps with a duration of 60 d or less; longer gaps were not filled.
The centroid of timing was calculated as the day of the water year when 50 % of the total annual flow volume has passed the gauge. The timing of the onset of spring freshet was calculated using a method developed by Cayan et al. (2001) and adapted by Berge et al. (2021). This method tracks the accumulated difference from the average streamflow over a given water year. When the resulting curve reaches its lowest point, it indicates that the spring freshet has begun, and the current streamflow magnitude has surpassed the annual average. Catchments with significant groundwater contributions and without a clear spring freshet period were excluded from this analysis.
Calculating a trend in these metrics provides insight into how the timing of spring snowmelt and the annual flow mass has shifted over recent decades. Peak flow timing was determined as the day of the water year with the highest flow.
2.6 Calculation of trends
Autocorrelation, which is often present in streamflow records, may influence the ability to detect trends (Yue et al., 2002). We thus used the modified Mann-Kendall trend test (Hamed and Ramachandra Rao, 1998) to assess the significance of trends, with significance determined at p<0.05. Unlike the traditional Mann-Kendall test, which assumes independence among the observations, the modified version adjusts the variance of the test statistic to account for autocorrelation. We calculated the magnitude of trends using the Theil-Sen (TS) estimator (Sen, 1968; Theil, 1950), which is calculated as the median of the slope of lines connecting all data point pairs. This trend estimation method is commonly used in hydrological studies as it is less sensitive to outliers than other methods (e.g. linear regression) and suitable for skewed and heteroskedastic data. In our analysis, we refer to an increase or decrease only when the modified Mann–Kendall test indicates p<0.05. Otherwise, we state no significant trend. Where many sites share the same direction without site-level significance at most locations, we describe a directional tendency (non-significant), indicating coherent regional behavior without individual-site significance, and report the count of significant positive vs. significant negative trends.
We calculate trends for annual, seasonal and sub-seasonal averages. Annual trends are based on hydrological years, defined as the period from 1 October to 30 September. Seasons are defined as fall (September to November), winter (December to February), spring (March to May) and summer (June to August). In addition to the summer season, we define a glacial melt season as July to September to better isolate runoff originating from glacier ablation. While the conventional summer period includes both snowmelt and glacier melt, the July to September window reduces the influence of seasonal snowmelt. This separation allows for a clearer interpretation of glacier-specific contributions.
While annual and seasonal trend analyses are valuable for identifying long-term hydrological changes, they may overlook important shifts occurring at finer temporal scales. Sub-seasonal trends can provide valuable insights even when no significant annual or seasonal trends are detected. Moreover, when seasonal trends are present, this analysis helps pinpoint when changes occur in greater detail. For calculating sub-seasonal streamflow trends, we employ a 21 d rolling mean (21DRM) centered on each day in the series, enabling us to determine a trend for each day of the year. This approach aligns with prior research, which has explored moving windows of varying durations, including 3 d (Kim and Jain, 2010), 10 d (Skålevåg and Vormoor, 2021) and 30 d periods (Kormann et al., 2015). Our selection of a 21DRM balances the demand for a relatively high temporal precision against the challenges that arise as the averaging period decreases and data variability intensifies. For an in-depth explanation of the methodology, we direct readers to the study by Skålevåg and Vormoor (2021).
The high natural climatic variability in Iceland makes streamflow patterns and hydrological processes in Iceland highly dynamic, leading to significant fluctuations in precipitation, temperature, and runoff, on both an annual and decadal scale. As a result, trend analysis in such a variable environment is highly sensitive to the period used. Shorter periods may capture trends that are not representative of longer-term changes, while long periods can obscure shorter-term fluctuations that are critical to understanding streamflow dynamics. This inherent variability complicates the detection of robust trends and the attribution of observed changes to specific climate drivers. To investigate the sensitivity of the time periods chosen and to leverage the availability of streamflow data in Iceland, we calculate trends for two time periods: period 1, 1 October 1973 to 30 September 2023 (50 years) and period 2, 1 October 1993 to 30 September 2023 (30 years). Period 1 includes relatively few streamflow series (25), while more series extend back to 1993, allowing for a larger dataset in the period 2 analysis (37 series).
To explore potential drivers of the observed streamflow trends, we calculated Pearson correlation coefficients (R) between streamflow trend magnitudes and both meteorological trends and catchment characteristics (Figs. S19 to S28). Only statistically significant correlations (p<0.05) are reported. To aid in interpretation of this analysis, Figs. S14 to S18 show the cross-correlation between the catchment attributes. Because many catchment attributes co-vary (Figs. S14–S18), the reported correlations should be interpreted as indicative associations along shared physiographic gradients rather than as evidence of independent or causal effects of any single attribute.
2.7 Hydrological indices
In addition to trends in average streamflow, we analyze trends in several hydrological indices that characterize flow variability and runoff generation mechanisms. These include the standard deviation, coefficient of variation, flashiness index, and baseflow index (BFI). The flashiness index quantifies the frequency and magnitude of short-term fluctuations in streamflow and is defined as the sum of absolute day-to-day changes in streamflow divided by the total streamflow volume over the water year.
Baseflow separation was performed using the Lyne and Hollick digital filter following Ladson et al. (2013). The filter was applied to the full length of each streamflow record to minimize edge effects, using an alpha parameter of 0.925, three passes, and a 30 d reflection at the boundaries. The baseflow index was then calculated as the ratio of annual baseflow to annual total flow. We interpret the BFI as a relative indicator of groundwater contribution rather than an absolute measure, acknowledging that it may be influenced not only by catchment properties but also by prevailing climatic wetness conditions.
3.1 Multiannual variability in temperature, precipitation and streamflow
3.1.1 Multiannual variability and long-term changes in temperature and precipitation
Figure 1 shows the annual average temperature and precipitation over Iceland since the mid-20th century, based on the ERA5-Land reanalysis. While temperature and precipitation vary across the country, the use of averages in Fig. 1 helps simplify and interpret large-scale, multiannual variability in Iceland's weather conditions. Because precipitation in the ERA5-Land reanalysis is underestimated for Iceland (Helgason and Nijssen, 2024), we present it as percentage deviations from the mean rather than absolute amounts. Note that the trendlines in Fig. 1 provide a visual representation of overall long-term changes, while the trend analysis of streamflow and meteorological variables in Sect. 3.2 and 3.3 is based on different time periods.
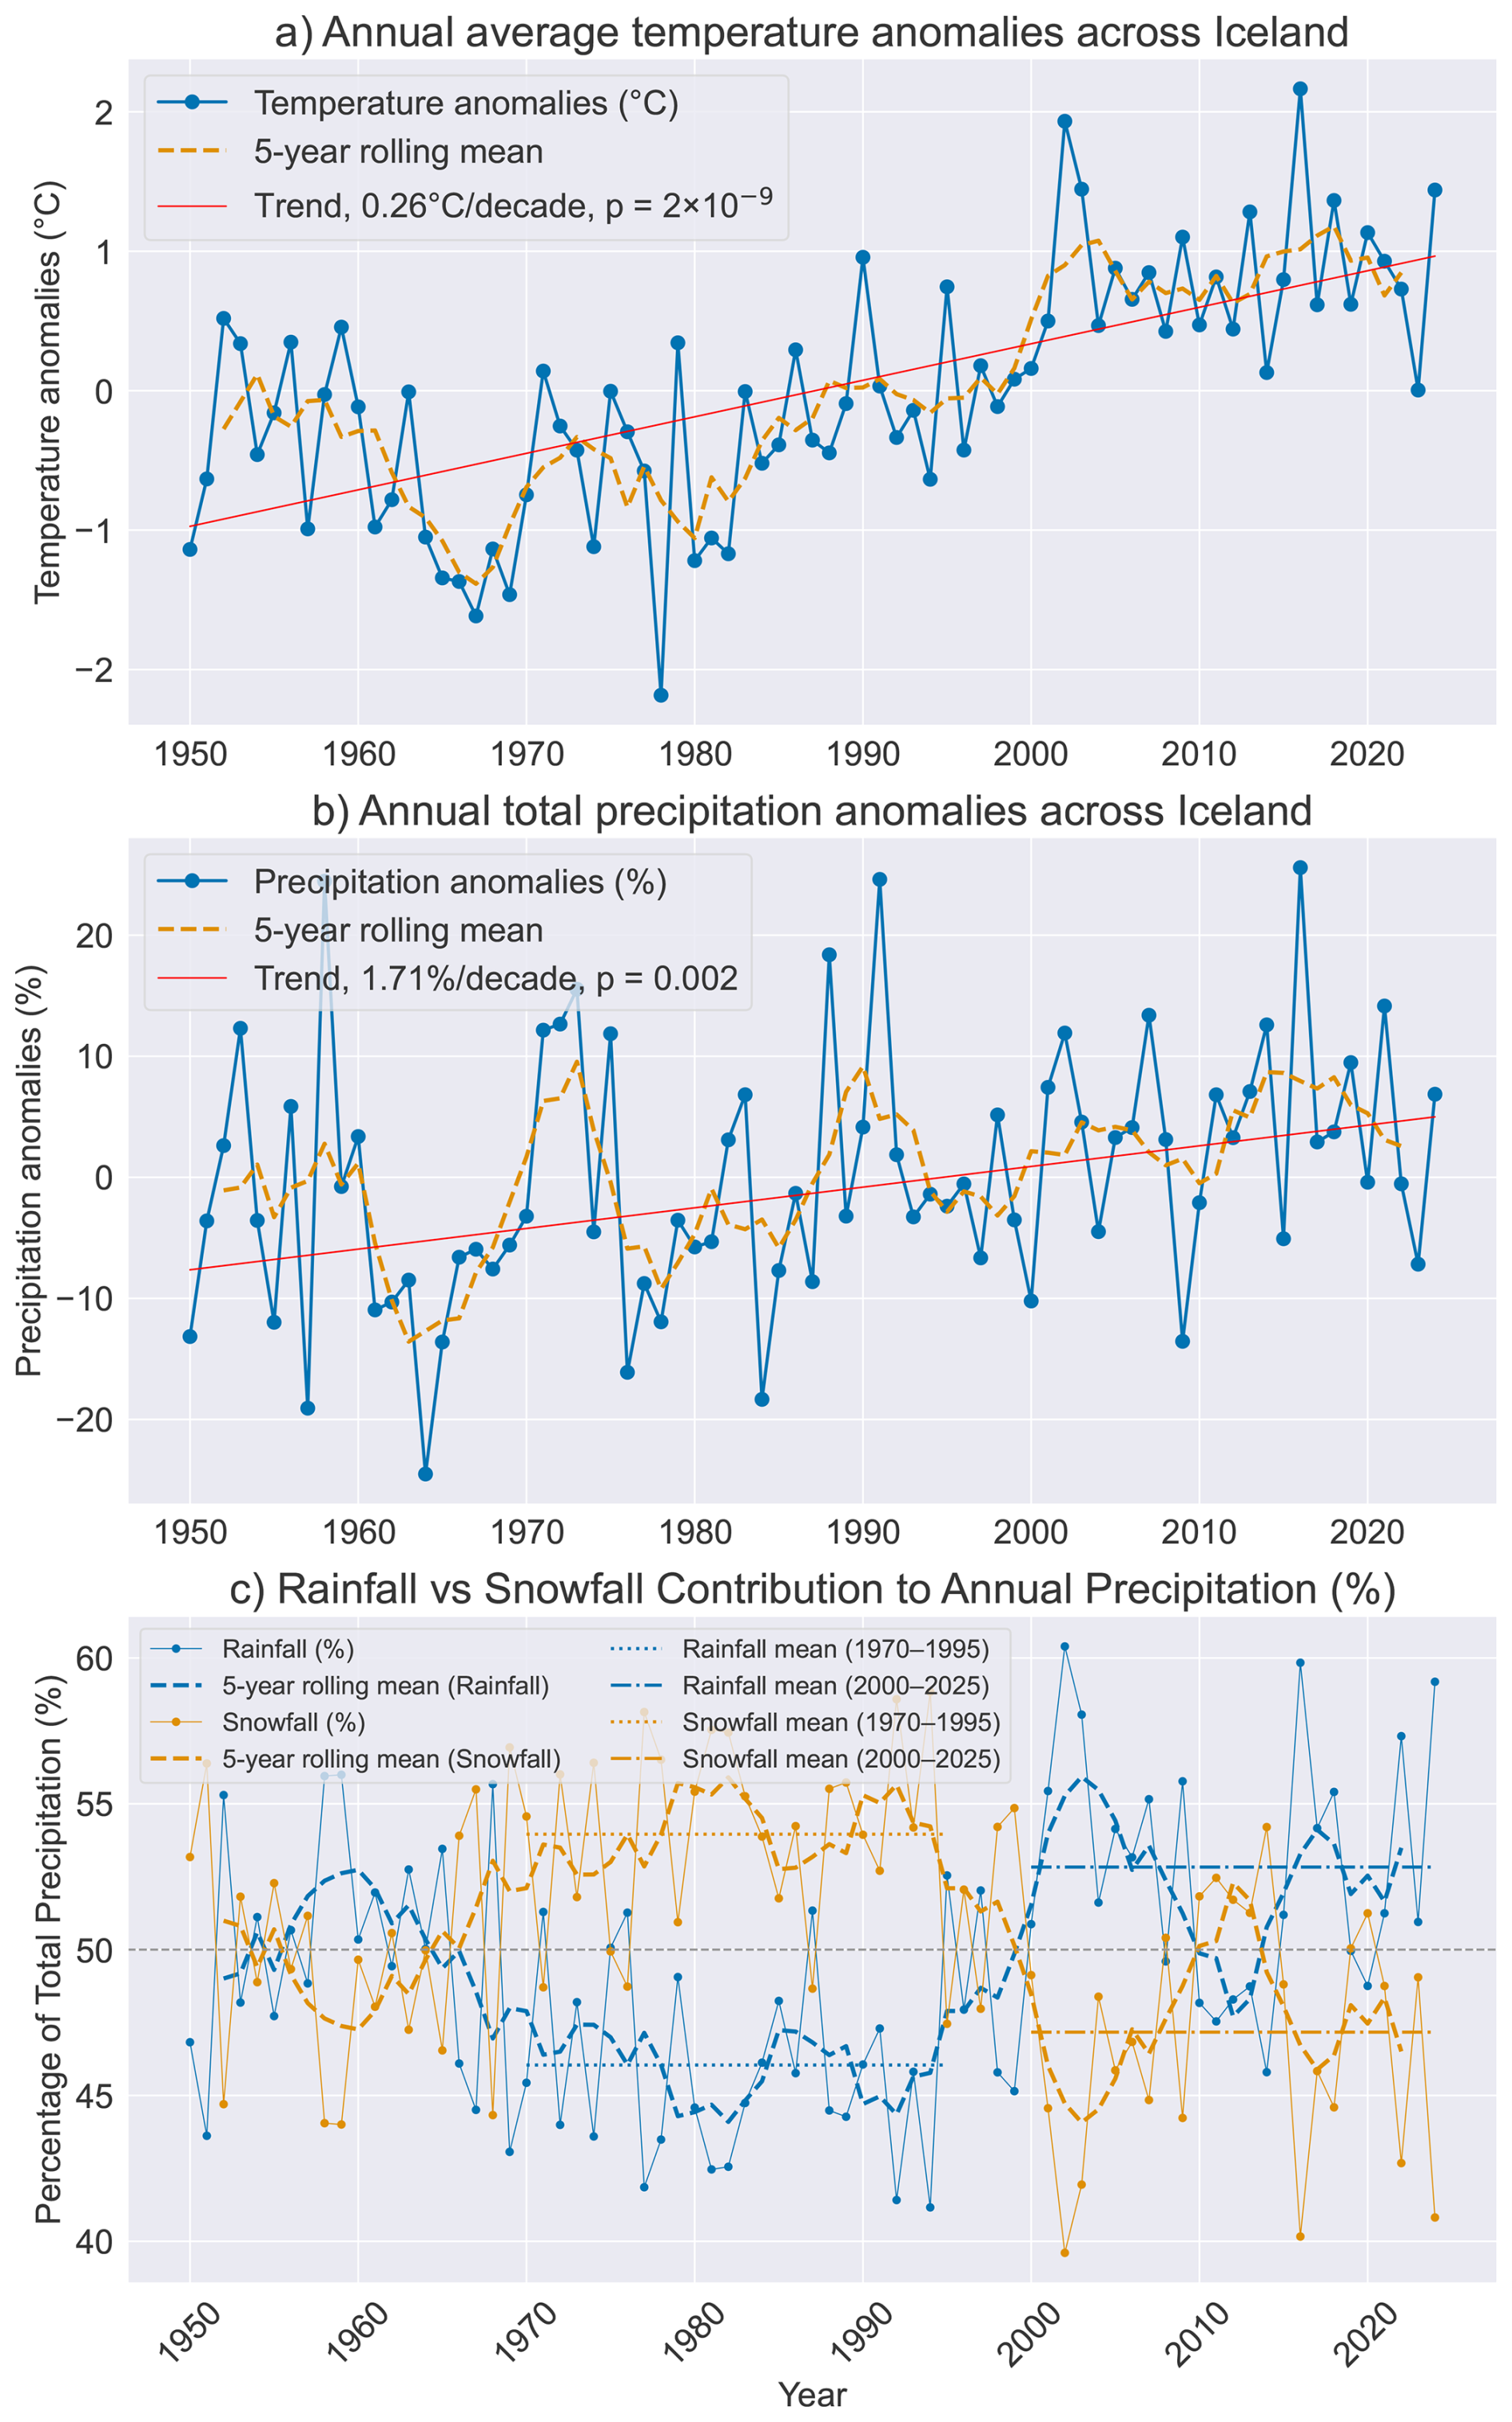
Figure 1Anomalies from the long-term mean (1950–2025) in annual average temperature (°C) and total precipitation (m), and precipitation partitioned into rainfall and snowfall over Iceland, derived from the ERA5-Land reanalysis. Averages are calculated for water years from 1 October 1950, to 30 September 2025. Solid lines represent water-year averages with circular markers for each year, while dashed lines show the 5-year centered rolling mean. Trendlines for temperature and precipitation are calculated based on annual values.
The temperature data reveals a clear warming trend over this period, with a long-term increase of 0.26 °C per decade (, Fig. 1a). A period of colder years is evident in the late 1960s, a time marked by substantial sea ice around Iceland, followed by a warming phase beginning in the 1980s. The 5-year rolling mean highlights this warming, with temperatures notably higher after 2000 compared to previous decades. However, the warming appears to have slowed in recent years. For the period 2000–2025, the Theil-Sen slope indicates a low trend of +0.11 °C per decade, and the Mann-Kendall test confirms that this trend is not statistically significant (p= 0.66).
Precipitation over Iceland exhibits significant interannual variability, characterized by distinct peaks and troughs throughout the study period. Despite this variability, a statistically significant long-term upward trend of 1.71 % per decade is evident. Shorter periods of sustained high or low precipitation are visible in the 5-year rolling average, which often align with fluctuations in the smoothed temperature average.
The 2023–2024 water year recorded the lowest temperature since the turn of the century and the second lowest precipitation (Fig. 1a and b). This deviation from the overall upward trend shows that short-term dips in precipitation can still occur, even against a backdrop of long-term increases. In contrast, the subsequent 2024–2025 water year was notably warmer and wetter. Although these two years are excluded from the trend analysis in later sections due to incomplete streamflow records, their contrasting hydroclimatic conditions provide a recent example of the variability discussed here.
The partitioning of precipitation into rainfall and snowfall (Fig. 1c) shows that snowfall contributed substantially to annual totals during 1970–1995, averaging 54 %. This declined to 47 % during 2000–2025, while the rainfall fraction increased from 46 % to 53 %. Over the full 1950–2025 period, the rainfall fraction exhibits a significant long-term upward trend of 0.58 percentage points per decade (Mann–Kendall p= 0.047). Notably, the transition toward rainfall dominance occurs in the late 1990s and becomes persistent after 2000, coinciding with rapid warming, after which rainfall has predominated in most years.
3.1.2 Multiannual variability in streamflow
Figure 2 illustrates the long-term variability in streamflow for Icelandic rivers with observational records dating back to before 1980. Streamflow anomalies are expressed relative to the mean over the 2000–2010 reference period, which was selected because complete observations are available for all included gauges during this decade, allowing for consistent comparison across catchments. Note that this reference period coincides with anomalously high flows in many glaciated catchments, such that negative anomalies before and after this interval are common. Distinct periods of streamflow variability are evident over the past several decades. The 1950s saw a high-flow period, followed by lower flows in the 1960s. Streamflow increased again during the 1970s, but the 1980s experienced another period of reduced flow. A brief high-flow period occurred in the early 1990s, after which streamflow declined until 2000. The 2000s marked a decade of high flows, particularly in glaciated catchments. After 2011, flows in glaciated rivers have been predominantly below the 2000–2010 mean, whereas most non-glaciated rivers have remained above.
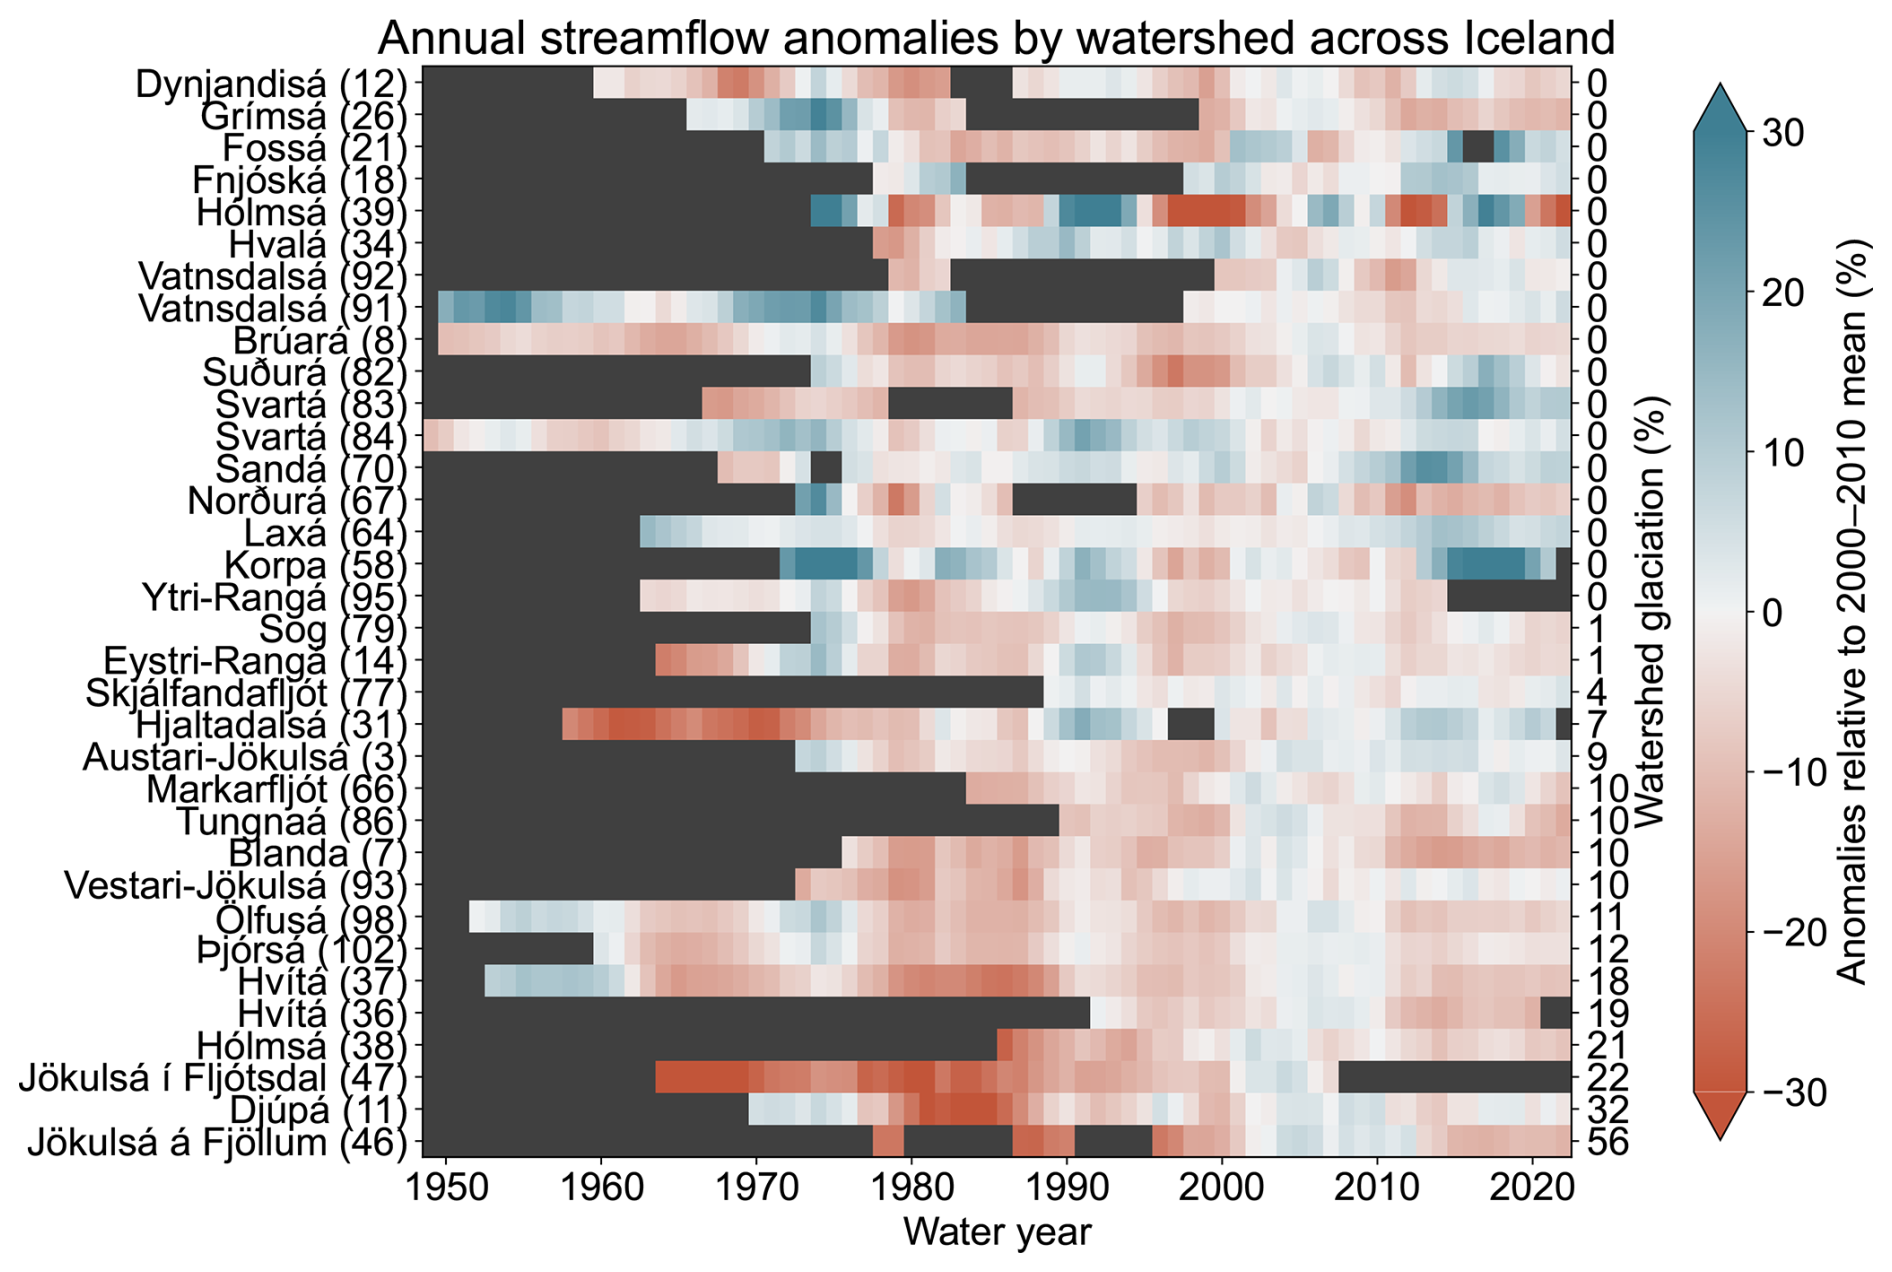
Figure 2Annual streamflow anomalies for Icelandic gauges with extended measurement records. Anomalies are expressed as percentages relative to each gauge's mean streamflow during the common reference period (1 October 2000 to 30 September 2010), allowing for direct comparison across catchments. A 5-year centered rolling average is applied to smooth short-term variability. The color scale indicates percentage anomalies, with red representing below-average flows and blue representing above-average flows relative to the reference period. The left y-axis lists river names and corresponding LamaH-Ice gauge IDs, while the right y-axis displays catchment glaciation percentages.
These streamflow patterns align closely with the temperature and precipitation trends shown in Fig. 1. The high-flow periods in the 1950s and early 1990s coincide with increased precipitation (Fig. 1b), while the elevated flows in glaciated catchments during the 2000s align with warmer temperatures (Fig. 1a). Enhanced glacier melt around 2010 was influenced by sub-glacial volcanic eruptions at Eyjafjallajökull (2010) and Grímsvötn (2011), during which ash and tephra deposition reduced glacier albedo and temporarily increased melt rates. In Fig. 2, this influence is reflected in sustained positive streamflow anomalies during the early 2010s in several highly glaciated rivers, including Jökulsá á Fjöllum and Djúpá, rather than as a distinct peak confined to individual years. The muted expression of this signal partly reflects the use of the 2000–2010 period as the anomaly reference, which already includes years of elevated glacier melt.
3.1.3 Correlation of streamflow with climate indices
Figure 3 presents the correlation between water-year average streamflow in Icelandic rivers and the Arctic Oscillation (AO) and North Atlantic Oscillation (NAO) climate indices. Streamflow with records dating back to before 1980 were used in the analysis (27 series). The streamflow series were normalized and de-trended before the correlation analysis. The climate indices, already in a normalized form, were de-trended.
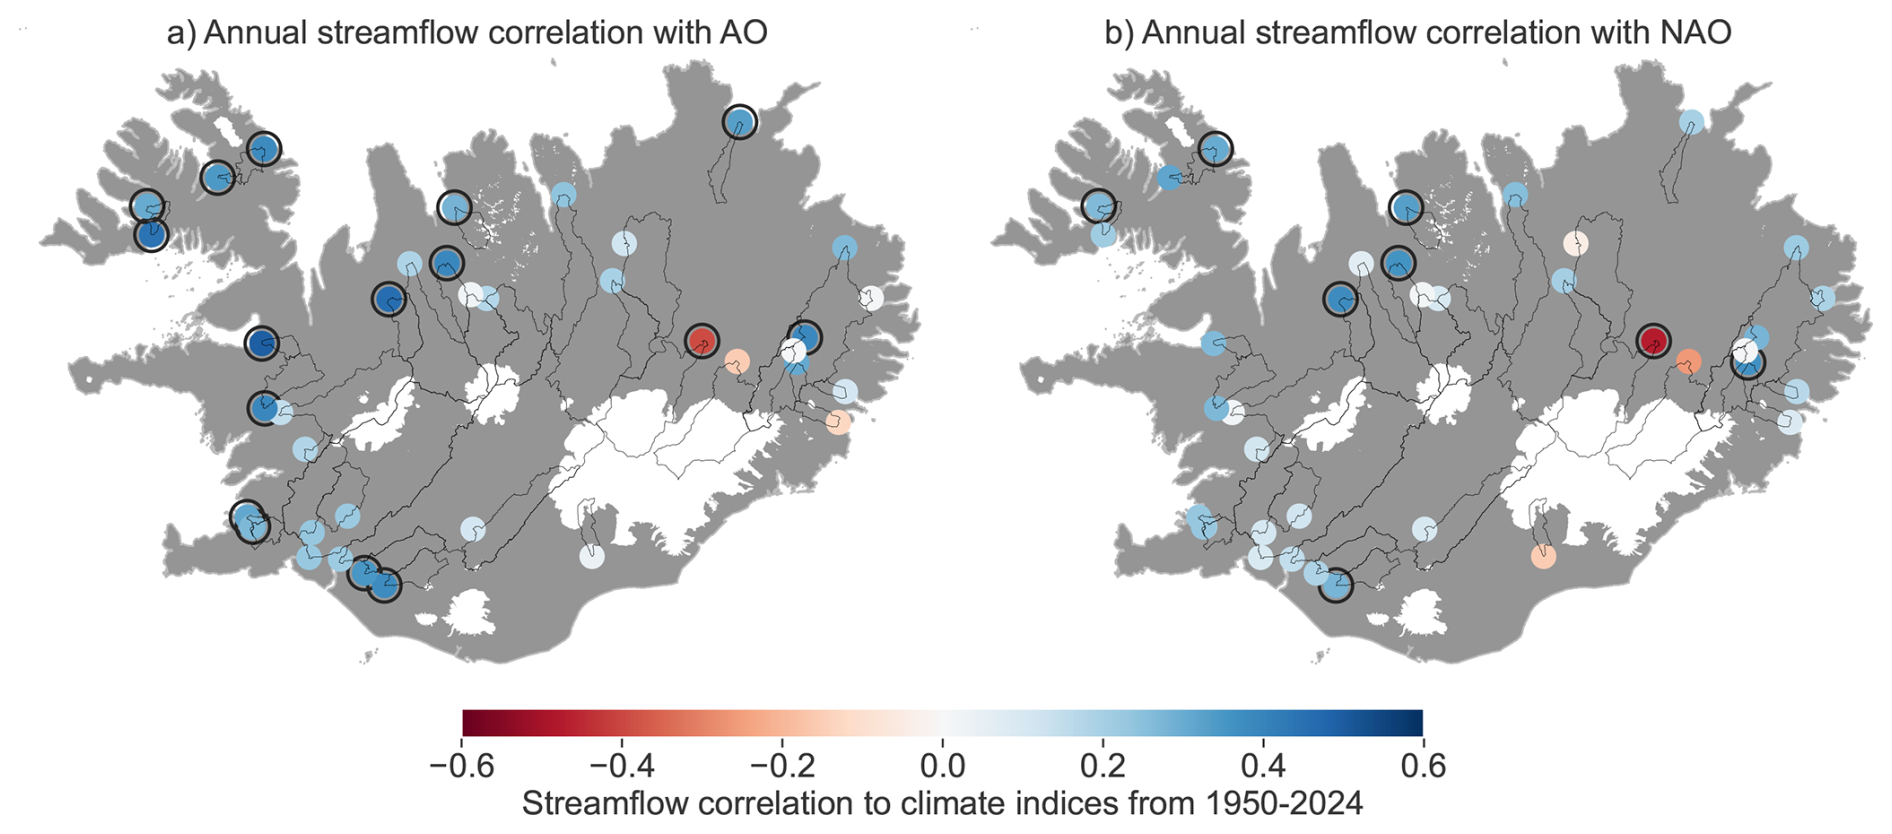
Figure 3Annual streamflow correlation with the Arctic Oscillation (AO) and North Atlantic Oscillation (NAO) climate indices for streamflow gauges in Iceland. Black circles around gauges indicate statistically significant correlations (p<0.05). The correlations were computed using Pearson's method, with the time series de-trended and normalized beforehand. The analysis covers the streamflow gauges with at least 30 years of data, with the number of years in each series varying across 42 gauges. The average time series length is 49.2 years. Basemap source: Hijmans (2015).
Figure 3a highlights the strong influence of the Arctic Oscillation (AO) on streamflow variability in Iceland, with significant positive correlations at 16 out of 42 gauges (hereafter shortened to 16/41). In comparison, Fig. 3b shows generally weaker but mostly positive correlations between streamflow and the North Atlantic Oscillation (NAO), with significant positive correlations observed at 7 gauges. This indicates that while the NAO's impact on streamflow is notable, it is less pronounced than that of the AO. These findings align with the results reported by Jónsdóttir and Uvo (2009). Rivers draining the three largest ice caps exhibit negative or near-zero correlations with both the AO and NAO. This pattern reflects that positive phases of these circulation modes enhance winter snowfall accumulation on glaciers, thereby reducing summer meltwater contributions to streamflow.
3.2 Trends in temperature, precipitation and evapotranspiration
We calculated annual and seasonal trends for catchment-averaged temperature, precipitation and evapotranspiration for all 107 catchments in LamaH-Ice. Note that trends in streamflow (Sect. 3.3) are only calculated for a selection of catchments with sufficient streamflow data coverage (as described in Sect. 2.3). Table S2 lists the average streamflow, temperature, and precipitation at each station for both period 1 and 2, and Fig. S30 illustrates the spatial distribution of the differences between the period averages. Period 2 is slightly wetter and warmer than period 1. Note that meteorological forcings are calculated as catchment averages and may smooth over locally diverging trends within large catchments, particularly for basins spanning strong elevation and climate gradients.
3.2.1 Annual trends
Annual trends for the periods 1973–2023 (period 1) and 1993–2023 (period 2) are displayed in Fig. 4. These trends are summarized in heatmaps in Fig. S1.
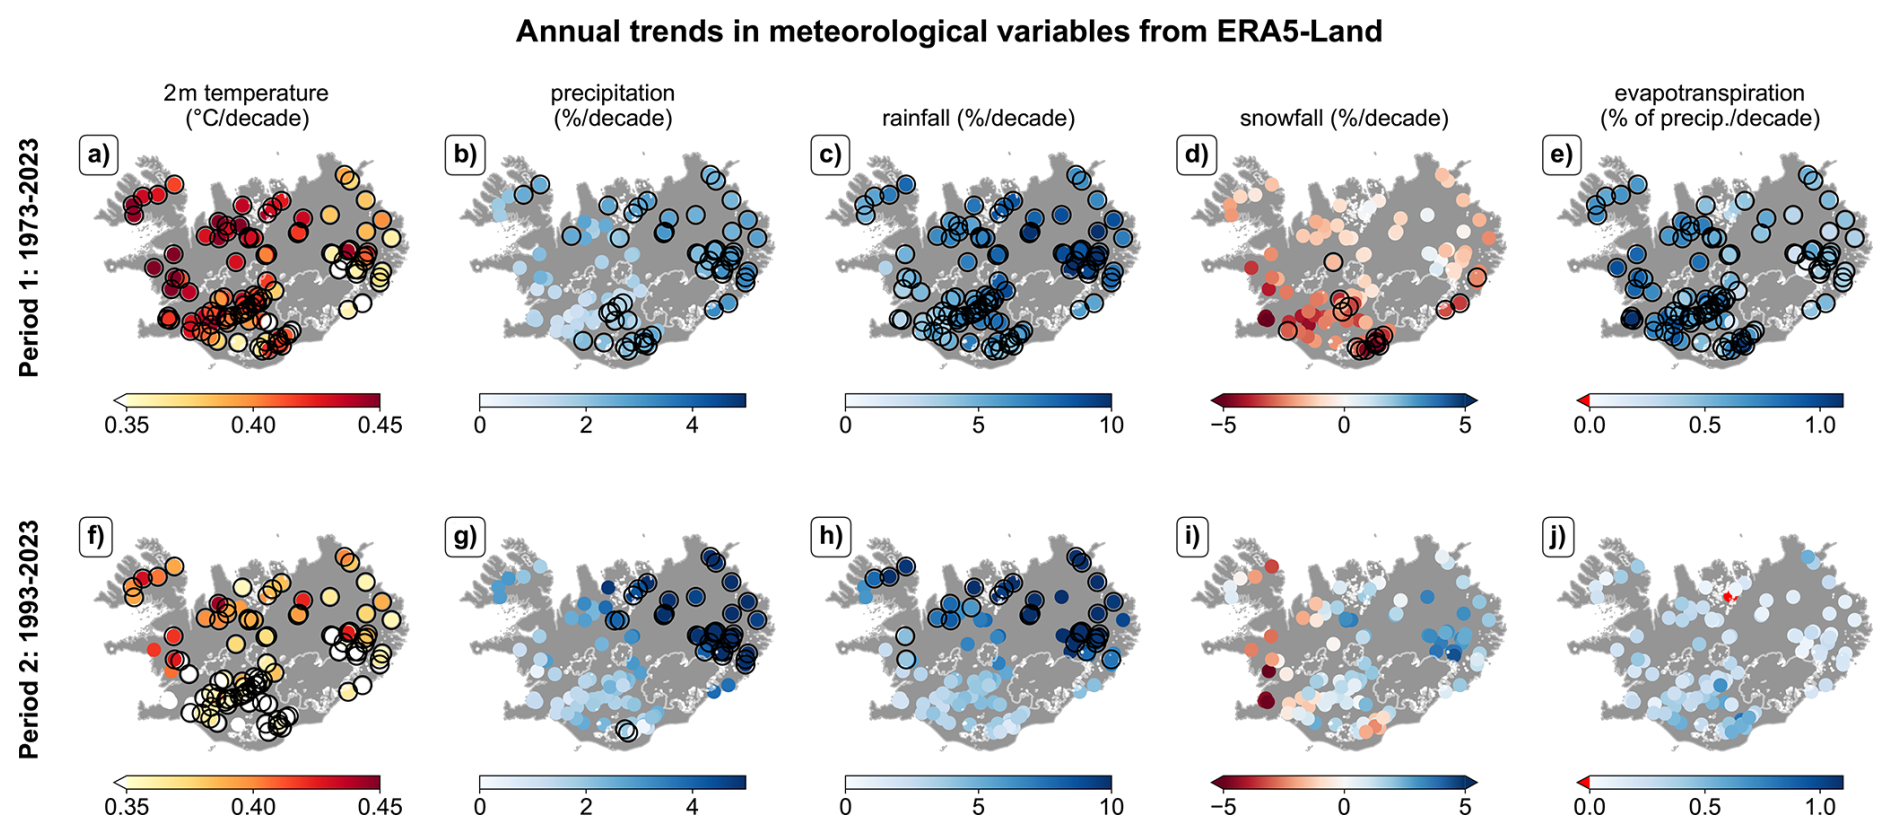
Figure 4Trends in catchment-average 2 m air temperature (a, f), precipitation (b, g), rainfall (c, h), snowfall (d, i) and evapotranspiration (e, j) from 1973–2023 and 1993–2023, with each point marking the streamflow gauge location. Evapotranspiration trends are shown as percentage of annual precipitation per decade. Black circles around gauge markers indicate statistically significant trends (p<0.05). Basemap source: Hijmans (2015).
Annual temperature trends show widespread and robust warming in both analysis periods (Fig. 4a, f). In period 1, all 107 catchments exhibit significant increases. In period 2, 95 catchments show significant warming. At the remaining 12 sites, no significant trend is detected, although all show a directional tendency toward increases (non-significant). Spatially, warming is strongest in the west during period 1 and in the north during period 2.
Annual precipitation increases are significant at 54/107 catchments in period 1 and at 35/107 in period 2 (Fig. 4b, g). At the remaining 53 and 72 sites, respectively, no significant change is detected, although all display a coherent but non-significant tendency toward increasing precipitation.
Rainfall (liquid precipitation) trends are significant at 105/107 catchments in period 1 and at 32/107 in period 2 (Fig. 4c, h). At the remaining 2 and 75 sites, respectively, no significant trend is observed, although all show a directional tendency toward increases (non-significant).
Snowfall trends are significant at 16/107 catchments in period 1, all of which show decreases (Fig. 4d). At the remaining 91 sites, no significant trend is detected; of these, 83 display a directional tendency toward decreasing snowfall and 8 toward increases (all non-significant). In period 2, no significant snowfall trends are detected. Directionally, however, 80/107 gauges trend upward and 27 downward (all non-significant).
Evapotranspiration (ET) increases significantly at 102/107 catchments in period 1 (Fig. 4e). In period 2, no significant ET trends are detected. However, 106/107 gauges show a tendency toward increasing ET, while one shows a decrease (all non-significant). At nearly all locations, ET changes correspond to less than 1 % of annual precipitation per decade. A comparison between precipitation and ET trends is provided in Fig. S5 and discussed further in Sect. 3.3.1.
3.2.2 Seasonal trends
Seasonal trends for 2 m air temperature and precipitation for periods 1 and 2 are shown in Fig. 5. During period 1, virtually all catchments exhibit significant warming in every season, with 107/107 sites in fall and winter, 106/107 in spring, and 105/107 in summer. Although warming is widespread, the median trend magnitude is largest in fall, followed by winter and summer, and weakest in spring (Fig. 5a). For precipitation (Fig. 5b), fall exhibits the clearest significant increases (79/107). Winter and spring show no significant trends at most sites, although the directional tendency is toward increases (non-significant). Summer displays a regional contrast, with significant increases confined to the northeast (2/107) and significant decreases in the southwest (2/107); all other sites show no significant trend.
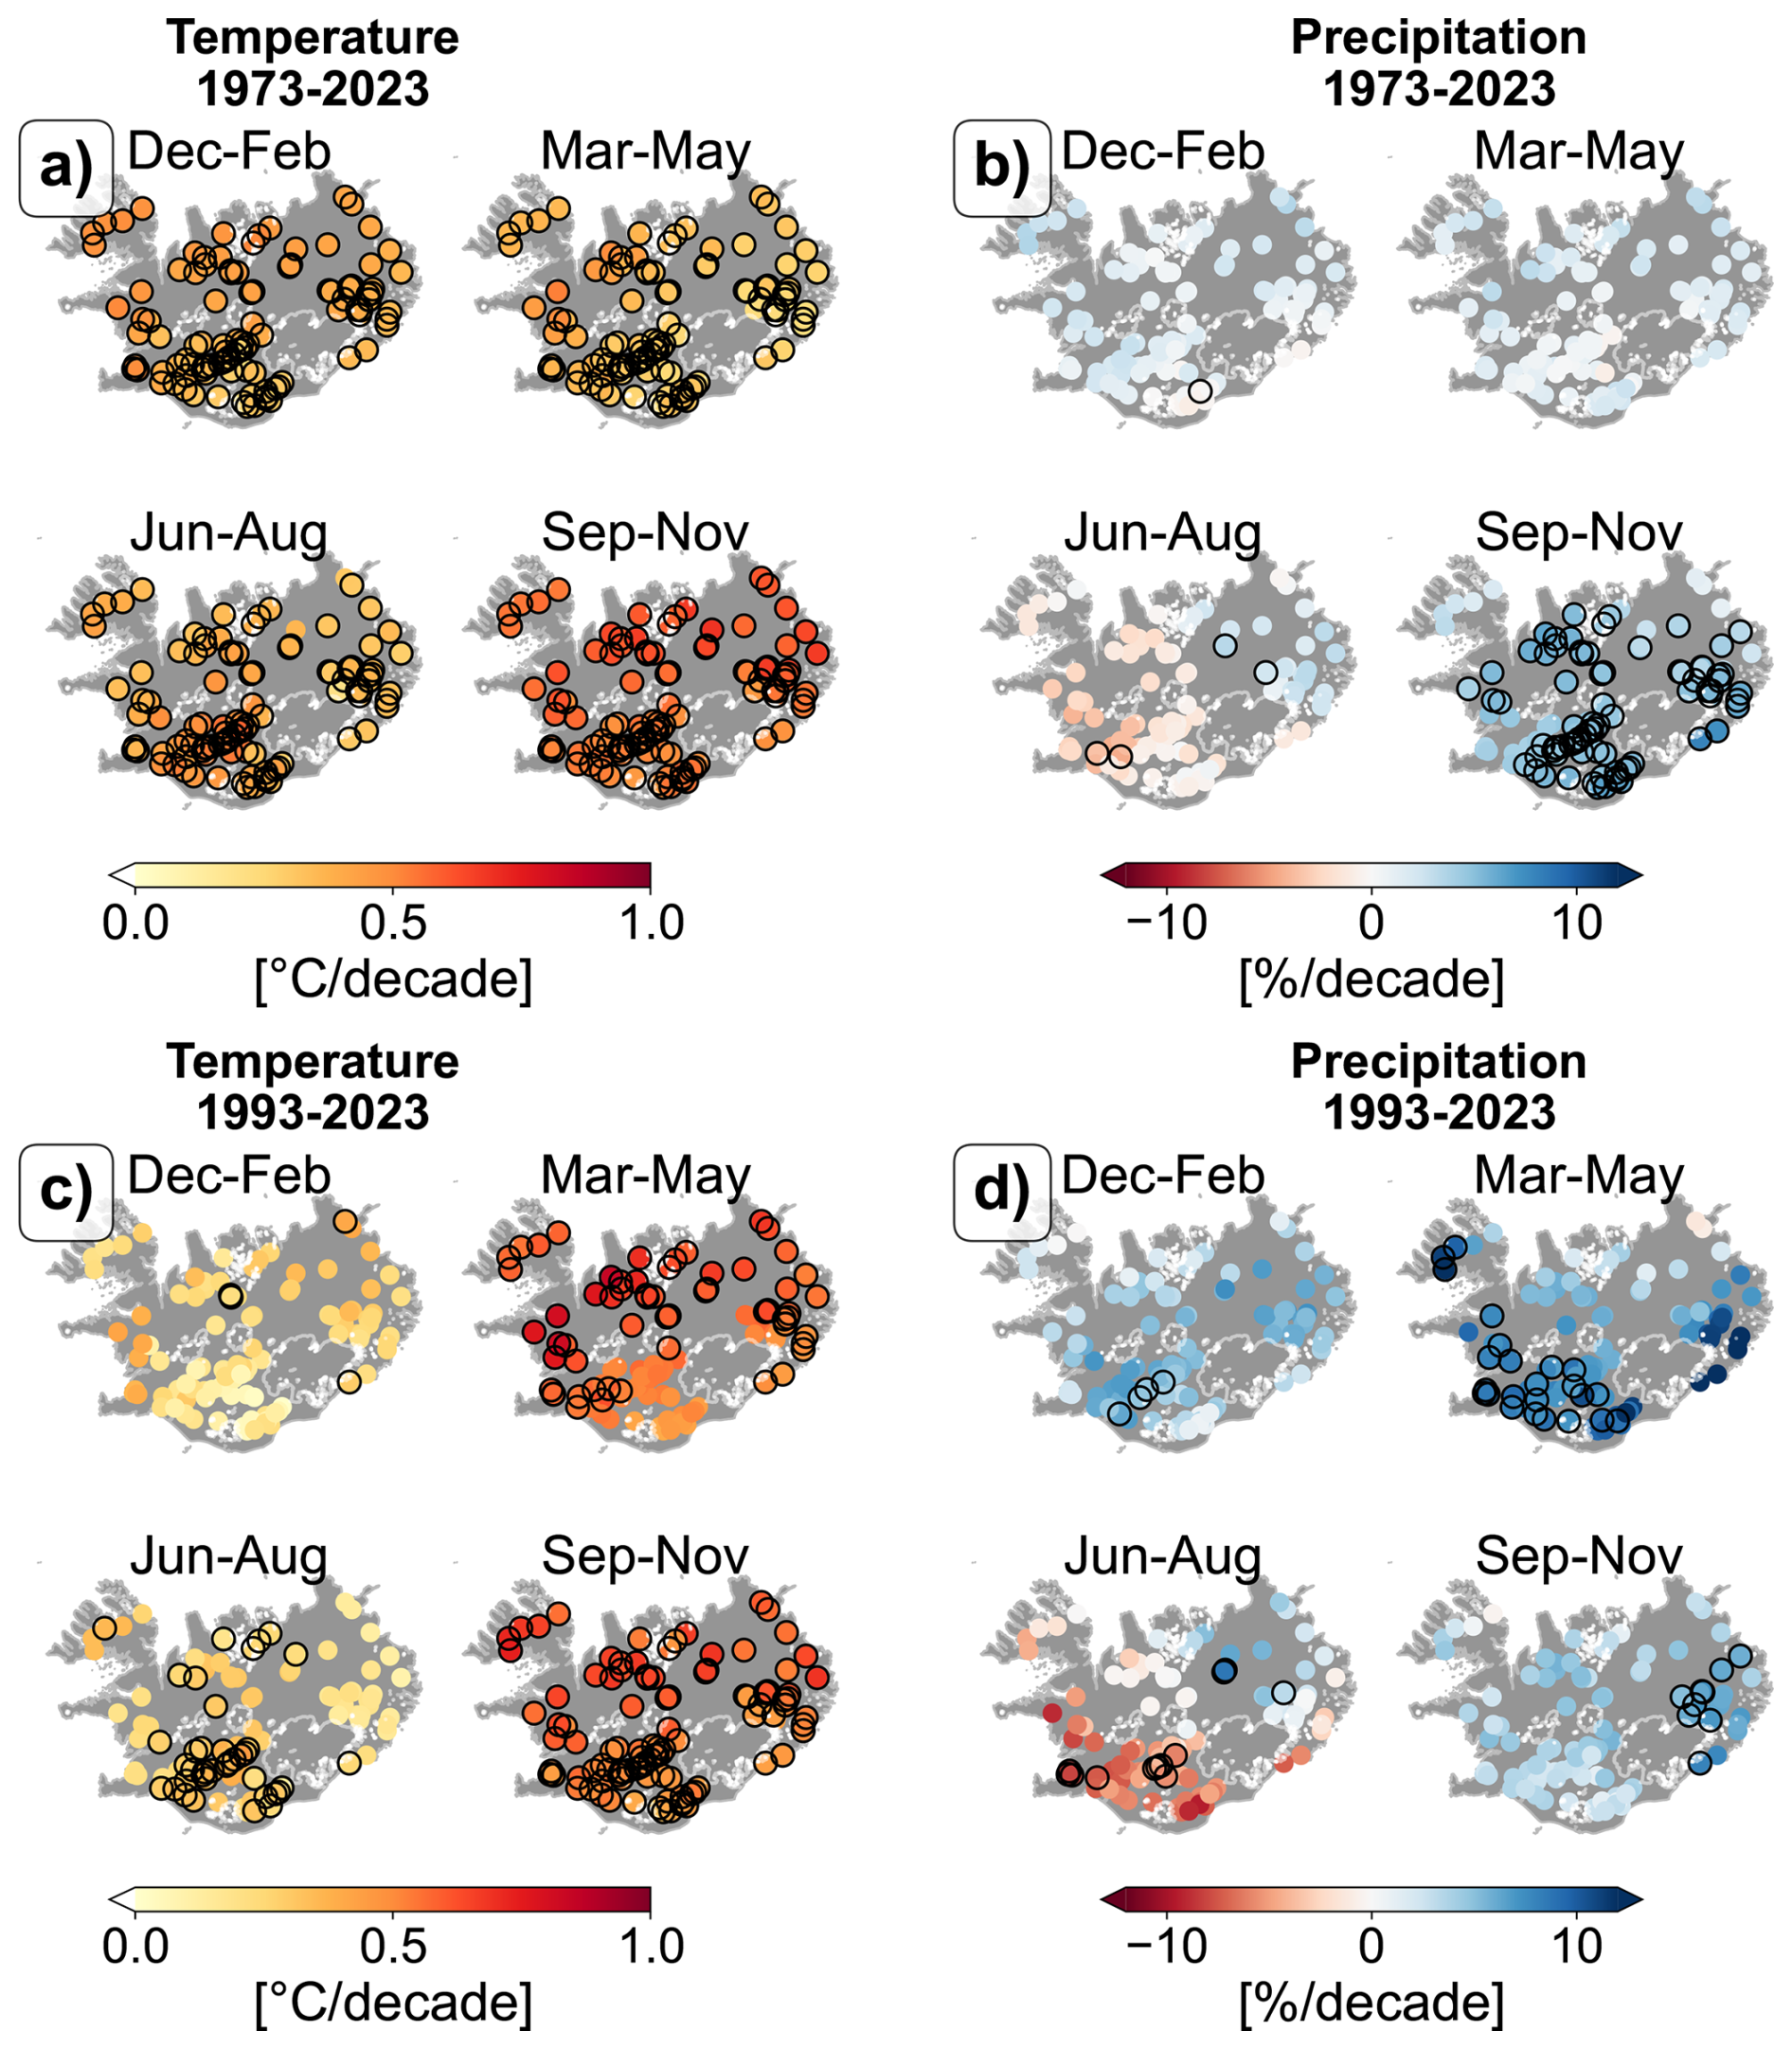
Figure 5Seasonal trends in catchment-average 2 m air temperature (a, c) and precipitation (b, d) from 1973–2023 and 1993–2023, with each point marking the streamflow gauge location. Black circles around gauge markers indicate statistically significant trends (p<0.05). Basemap source: Hijmans (2015).
During period 2, significant warming is concentrated in fall (105/107) and spring (60/107). Winter (4/107) and summer (38/107) each have relatively few significant warming trends, meaning that 103/107 and 69/107 sites respectively show no significant change – a sharp contrast to period 1, where almost all sites warmed significantly. For precipitation, spring shows the most widespread significant increases (25/107), especially in the southwest. Fall (9/107) and winter (4/107) also exhibit significant increases, though at fewer locations. Summer again displays significant decreases in the southwest (9/107), and significant increases in the northeast (2/107). Elsewhere, no significant trends are found, although a coherent regional tendency remains evident, with non-significant decreases in the southwest and non-significant increases in the northeast. A similar but weaker pattern was observed during period 1.
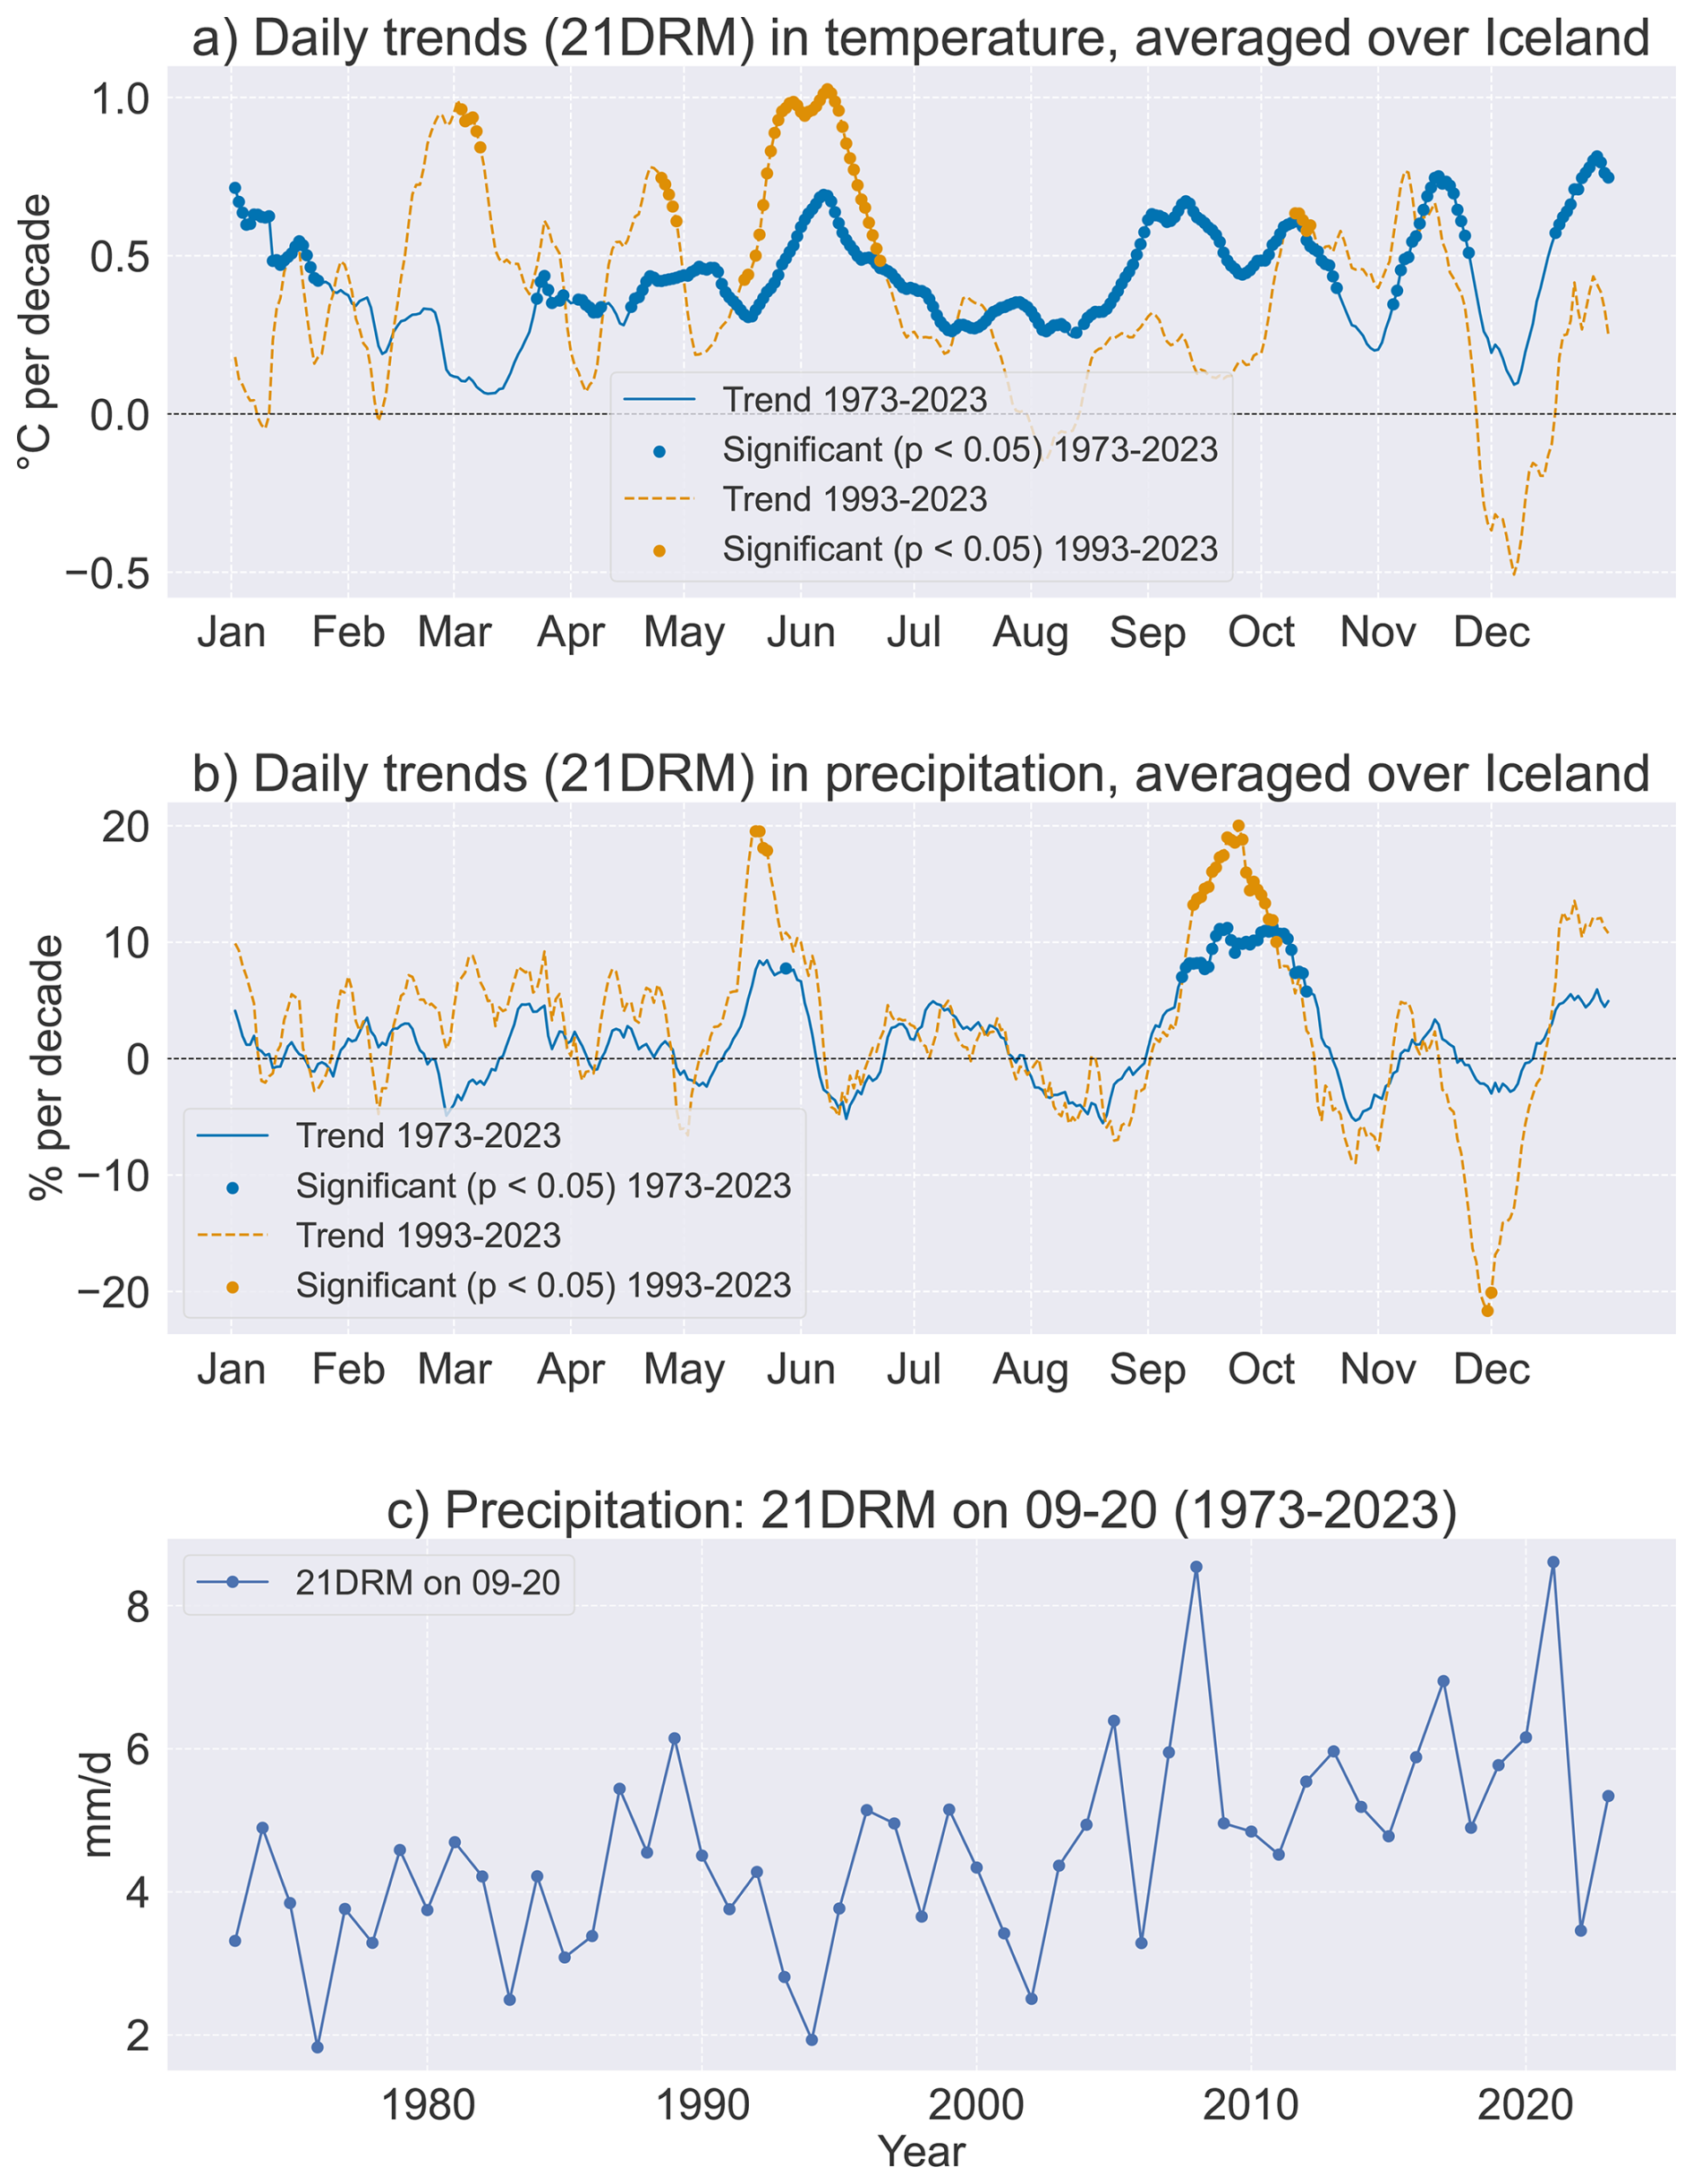
Figure 6Daily trends in 21 d rolling means of 2 m air temperature (a) and precipitation (b) from the ERA5-Land reanalysis, averaged over all Iceland, shown for the periods 1973 to 2023 (blue) and 1993 to 2023 (orange). Precipitation trends for 20 September (10 to 30 September) are highlighted separately in panel (c).
To better understand the intra-annual variability of these trends, Fig. 6 shows the average trend in 21DRM temperature and precipitation for all of Iceland for both study periods. The longer period (1973–2023) clearly shows a more consistent and widespread warming signal (Fig. 6a), with statistically significant increases occurring across most of the year. In contrast, significant warming during the shorter, more recent period (1993–2023) is confined to a few concentrated windows in late winter (March–April) and late spring (May–June).
For precipitation (Fig. 6b), statistically significant increases are noted in May for both periods, although only a few data points meet the threshold for significance. A consistent period of significant increases is observed in September and October. The daily precipitation values for 20 September (corresponding to the 21 d window from 10 to 30 September – Fig. 6c) confirm these trends, showing notable increases, particularly since the mid-2000s, emphasizing the validity of the observed upward trend in fall precipitation. The alternating positive/negative precipitation trend swings visible in Fig. 6b during non-significant periods arise from the high variability in day-specific trend estimates. These fluctuations should not be interpreted as real regime shifts but rather as statistical noise around near-zero long-term change.
In period 2, the highest sub-seasonal trends in temperature and precipitation are considerably stronger than the extremes in period 1, which could be due to an intensification of climatic extremes. Sub-seasonal trends in temperature and precipitation are shown for each catchment in Fig. S6.
Catchment area varies widely, ranging from a few square kilometers to more than 7000 km2 (Table S1). As a result, meteorological trends represent climate signals integrated over very different spatial scales. For large catchments, reported trends reflect an area-weighted average of potentially contrasting local changes, whereas smaller catchments are more directly representative of localized forcing. Consequently, spatial variability in trend magnitude and significance should be interpreted with this scale dependency in mind.
3.3 Trends in streamflow
Annual, seasonal, and sub-seasonal trends were calculated for streamflow records in LamaH-Ice with sufficient data coverage (Sect. 2.3), for the two periods, in the same manner as for the meteorological variables described in Sect. 3.2.
3.3.1 Annual and seasonal averaged streamflow
Figure 7 shows the annual and seasonal trends in streamflow for the gauges with sufficient data coverage for the two periods. Figure 8 shows a summary of these results in a heatmap. Figure S8 shows trends in annual and summer melt season streamflow for glacial rivers only. Figure S7 shows sub-seasonal trends in all rivers. Interpretation of spatial patterns in streamflow trends should consider catchment area, as trends in large basins integrate heterogeneous upstream responses, while trends in smaller basins reflect more localized hydroclimatic and hydrologic changes.
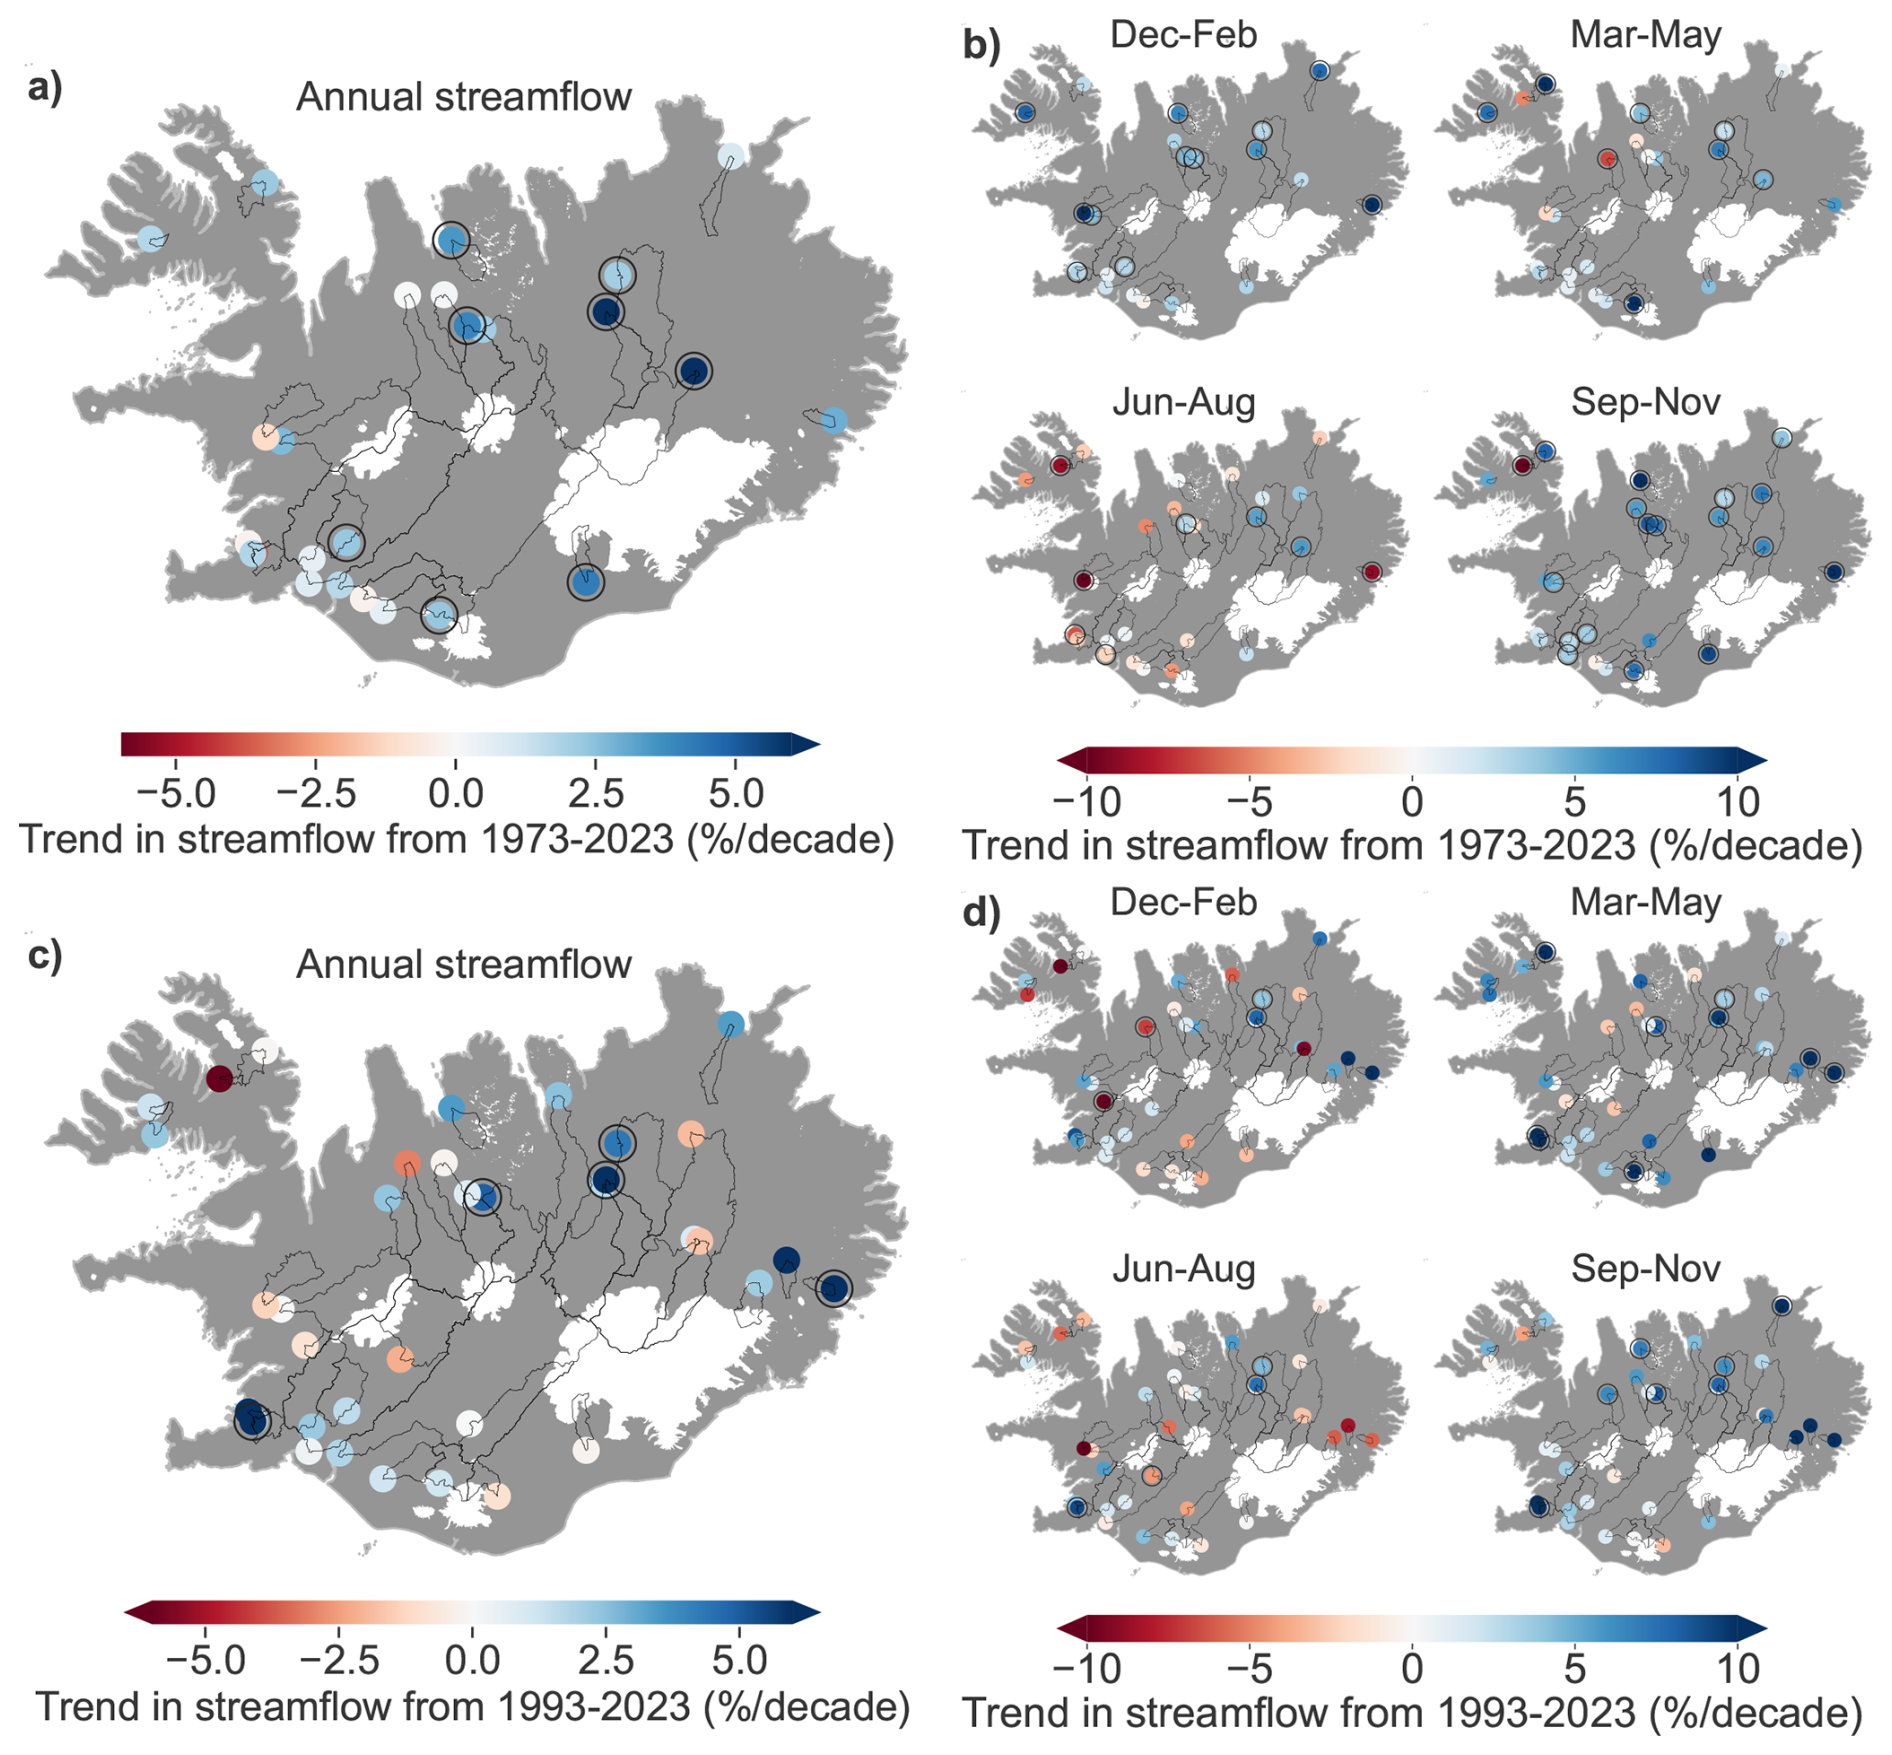
Figure 7Annual (a, c) and seasonal (b, d) trends in streamflow from 1973–2023 (a, b) and 1993–2023 (c, d). Black circles around gauge markers indicate statistically significant trends (p<0.05). Catchment outlines are shown for each gauge. Basemap source: Hijmans (2015).
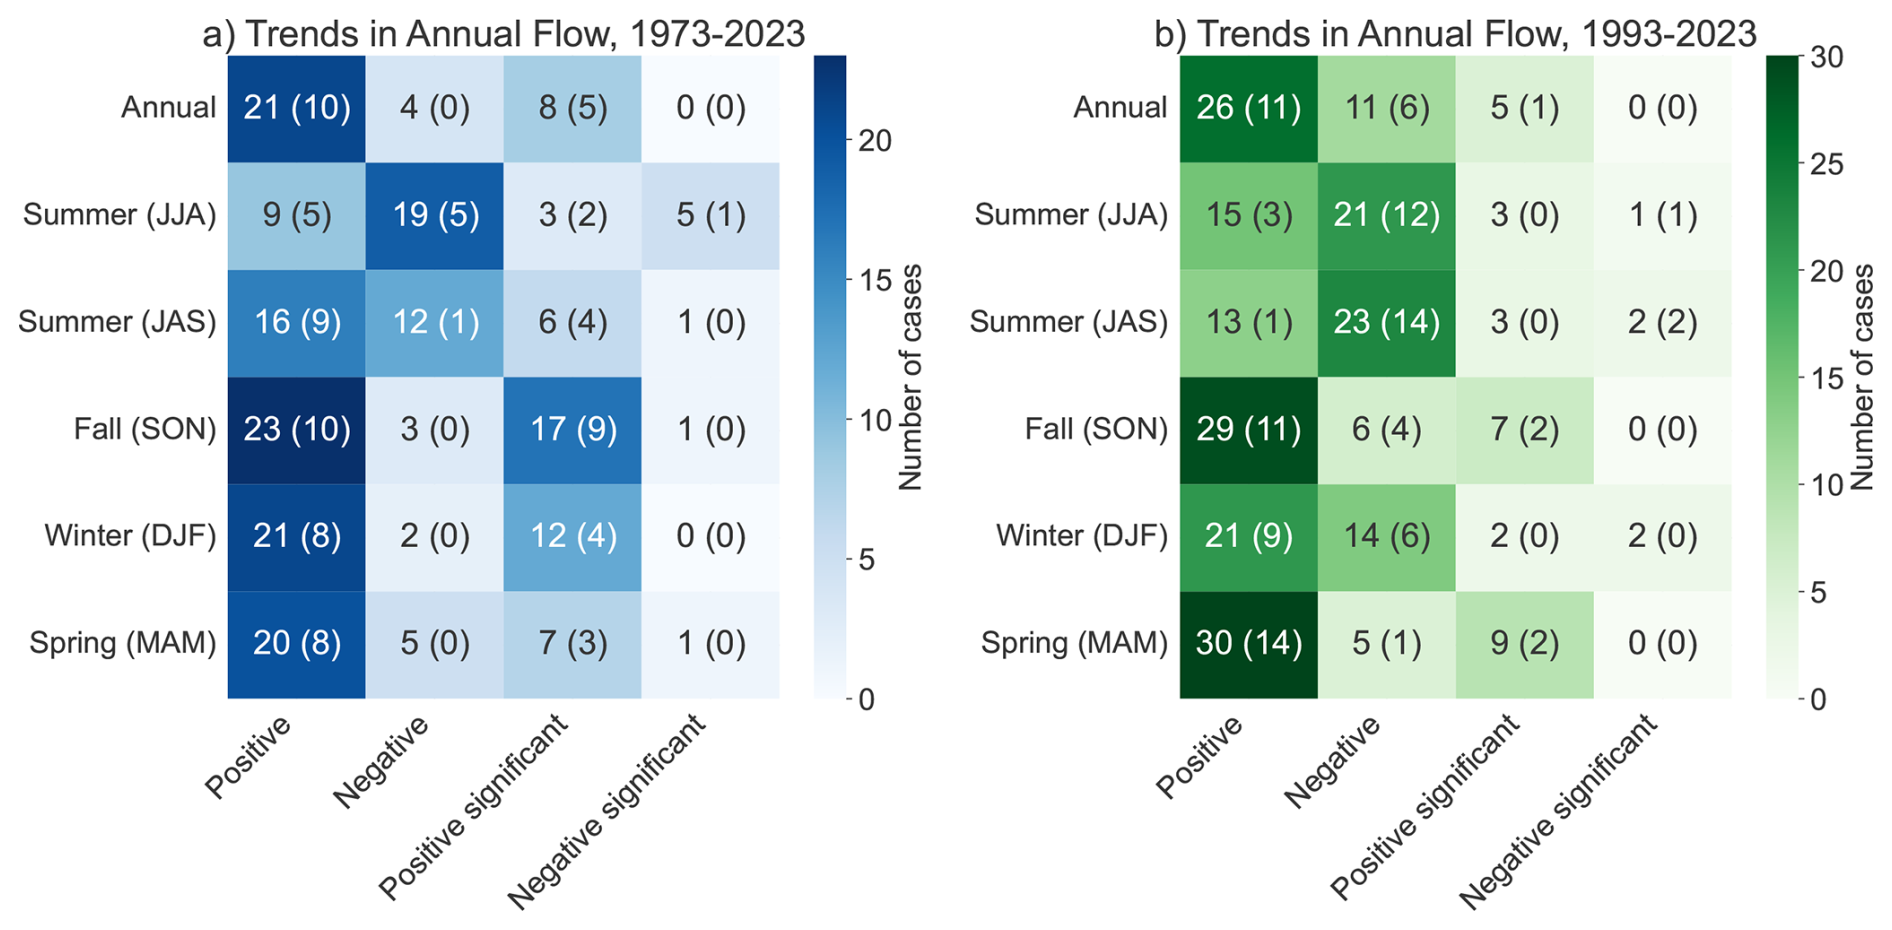
Figure 8Heatmaps showing a summary of the results from analysis of annual and seasonal trends in streamflow for the periods 1973–2023 (a) and 1993–2023 (b). The numbers in parentheses indicate the count of catchments with more than 5 % glaciation. Note that for the period 1973–2023, the 17 significant positive SON trends include two from the same glacial river (Jökulsá á Fjöllum river).
Period 1
Annual average streamflow during period 1 shows significant positive trends at 8/25 gauges (Figs. 7a and 8a). Out of the 17 remaining gauges, 13 display a directional tendency toward increasing flow, though not statistically significant. Theil–Sen trend magnitudes (across both significant and non-significant sites) range from 0.015 % to 6.07 % per decade. These trend magnitudes are highly correlated with the trend in rainfall (R= 0.72, Fig. S19). Further, they are also correlated with catchment mean elevation (R= 0.67) and vegetation extent (yearly maximum NDVI) (0.62) which are strongly interrelated (R= 0.79, Fig. S15). Despite the overall increase in streamflow, intra-annual variability is generally declining. This is reflected in reductions in both the coefficient of variation (CV) and flashiness index, with 10 and 7/23 gauges showing significant decreases, respectively (Figs. S10a and S11a). The baseflow index shows the opposite behavior, increasing at 7/23 gauges (Fig. S12). Across all three indices, more than half of the remaining gauges show the same directional tendency (declining CV and flashiness, increasing baseflow), although these changes are not statistically significant.
The seasonal analysis for period 1 (Figs. 7b and 8a) shows that fall has the strongest signal of change, with 17/26 gauges showing significant increases (16 if the nested Jökulsá á Fjöllum catchment is counted once). An additional six gauges have non-significant positive trends, indicating a broader directional tendency toward higher fall flows. These increases are moderately correlated with fall precipitation trends (R= 0.44, Fig. S23) and catchment mean elevation (R= 0.51). The strongest gains occur in September (Fig. S6).
In winter, 12/23 gauges exhibit significant increases, while nine additional gauges show non-significant positive trends. Across all gauges, proportional increases are larger in rivers with lower baseflow index (0.69, Fig. S20), consistent with more direct responses to rainfall and snowmelt in surface-fed systems.
In spring, 7/25 gauges show significant increases, while 13 more display non-significant positive trends. Across all gauges, trend magnitude declines with stronger warming and higher evapotranspiration (0.58 for temperature, 0.56 for total ET), suggesting that increased evaporative demand and plant water uptake may limit spring flow increases. Spring streamflow trends are significantly correlated with multiple, strongly interrelated soil properties (Figs. S17 and S21), including porosity, texture, rooting depth, and water holding capacity. These correlations reflect a broader soil storage and permeability gradient, indicating stronger spring flow increases in finer-textured, higher-storage catchments rather than an isolated influence of any single soil variable. The baseflow index increases significantly at 8 gauges, with a directional tendency toward increases at another 9 gauges, indicating enhanced subsurface contributions in more permeable catchments. Streamflow flashiness decreases significantly at 8 gauges and directionally at a further 9, showing a shift toward more buffered spring runoff.
In summer (JJA), 5/28 gauges show significant decreases, while 14 more have non-significant negative trends, indicating a predominantly downward tendency but weak overall confidence. Across all gauges, summer trend magnitude is negatively correlated with spring temperature trends (R= −0.49) and positively correlated with catchment mean elevation (R= 0.53, Fig. S22), suggesting that earlier or reduced snowmelt may influence lower summer flows. The correlation with baseflow index is strong (R= 0.71), and even stronger in rivers with less than 10 % glacial coverage (R= 0.82), indicating higher sensitivity in surface-fed systems. The summer baseflow index increases significantly at 14 gauges and directionally at 11 more.
Among glaciated rivers, 5/10 catchments exhibit significant positive annual streamflow trends, and 4/10 show significant increases in summer melt-season (JAS) (3/9 if the nested Jökulsá á Fjöllum catchment is counted once) flow. Directionally, all glaciated rivers trend positive annually and 9/10 trend positive in JAS. Five northern rivers show significant annual increases. In Vestari-Jökulsá (93) and Jökulsá á Fjöllum (46), which drain the Hofsjökull and Vatnajökull ice caps, these increases likely reflect a combination of enhanced glacier melt from warming and reduced snowfall, a glacier surge in Dyngjujökull around 2000, and lowered glacier albedo following the Eyjafjallajökull (2010) and Grímsvötn (2011) eruptions. Positive trends in Hjaltadalsá (31), Laxá (64), and Sandá (70) coincide with a period of high precipitation from 2012 to 2015.
Period 2
Significant positive annual streamflow trends occur at 7/37 gauges (19 %). At the remaining gauges, no significant change is detected, although the directional tendency is toward increases at many sites (26/37 positive overall). Theil–Sen magnitudes across all sites range from 0.03 % to 9.97 % per decade. Compared to period 1, significant trends in annual CV, flashiness, and baseflow index are less frequent in period 2. Nonetheless, a regionally coherent pattern remains, with most gauges showing decreasing CV and flashiness and increasing baseflow index (Figs. S10c–S12c).
In fall, statistically significant increases (7/35) are concentrated in the north and east (Fig. 7d). Directionally, 29 gauges show positive trends, with the strongest increases in late September and October (Fig. S7b). Fall streamflow trends correlate moderately with precipitation trends across all gauges (R= 0.41, Fig. S28).
In spring, 9/35 gauges show significant increases, and a further 21 display non-significant positive trends. Across all gauges, spring trend magnitude is negatively correlated with baseflow index (0.53, Fig. S26), indicating stronger increases in surface-fed than groundwater-fed systems. Increases peak in April and weaken in May, consistent with a potential shift in snowmelt timing (Fig. S7).
In summer (JJA), significant changes are limited, with one gauge showing a significant decrease and three showing significant increases (Fig. 7d). Among all sites, 21 exhibit negative and 15 positive trends, indicating mixed but generally weak directional signals. Across all gauges, summer trend magnitude correlates positively with baseflow index (R= 0.60, Fig. S27), indicating higher sensitivity to reductions in surface-fed systems. The baseflow index itself increases significantly at 6/36 gauges in summer, with a further 21 showing non-significant increases.
Across hydrologic indices, the baseflow index shows directional increases in most gauges across all seasons. Positive trends occur at 28/35 gauges annually, 27/36 in summer, 24/35 in fall, 27/35 in winter, and 27/35 in spring, with significant increases at 6, 6, 6, 3, and 5 gauges respectively. In fall, baseflow index trends correlate with soil attributes, consistent with enhanced thaw-related permeability. In winter, declines in flashiness correlate with soil characteristics (Fig. S25), suggesting shifts in infiltration and runoff dynamics.
Among glaciated rivers during the summer melt season (JAS), significant decreases are rare: 2/15 catchments show significant negative trends, although 12 out of the remaining 13 also trend negative but without statistical significance (Fig. 8). The three rivers draining northern Hofsjökull (Blanda, Vestari-Jökulsá, Austari-Jökulsá) behave differently, with Blanda showing weaker or negative trends compared to the other two (Fig. S8c–d), underscoring the influence of local catchment characteristics.
Figure S9d shows the relationship between July–August–September (JAS) streamflow trends and changes in glaciated area for glacial rivers (> 5 % glaciation) during period 2 (1993–2023). There is a significant positive correlation (r= 0.627, p= 0.016, n= 14) between glacier area loss and streamflow decline: rivers experiencing more glacier retreat exhibit stronger declining trends in melt season streamflow. This relationship underscores the critical role of glacier retreat in driving reduced summer flows in glaciated catchments in period 2.
Figure S5 compares precipitation and evapotranspiration (ET) trends to explore potential drivers of summer streamflow changes. Annually, precipitation increases exceed ET increases in both periods, and since ET in Iceland is energy-limited (Helgason and Nijssen, 2024), there is no clear dependence between changes in precipitation and ET. In period 1, both summer precipitation decreases and ET increases likely contributed to streamflow reductions. In period 2, ET changes are small, consistent with muted summer warming, while precipitation decreases are more pronounced. This suggests that precipitation decline is the more likely contributor among these two drivers, with earlier or reduced spring snowmelt likely also playing a role.
3.3.2 Trend in the timing of spring freshet onset, centroid of timing, and high/low flows
Figure 9 shows trends in the start of the spring freshet, centroid of timing, and peak flow timing for the two analysis periods. For both periods, trends in freshet onset are spatially variable, with no clear regional pattern. In period 1, only one gauge shows a statistically significant trend toward earlier freshet (Eystri Rangá, ID 14, Fig. 9a). In period 2, three gauges show significant earlier onset and one shows significant delays (Fig. 9d).
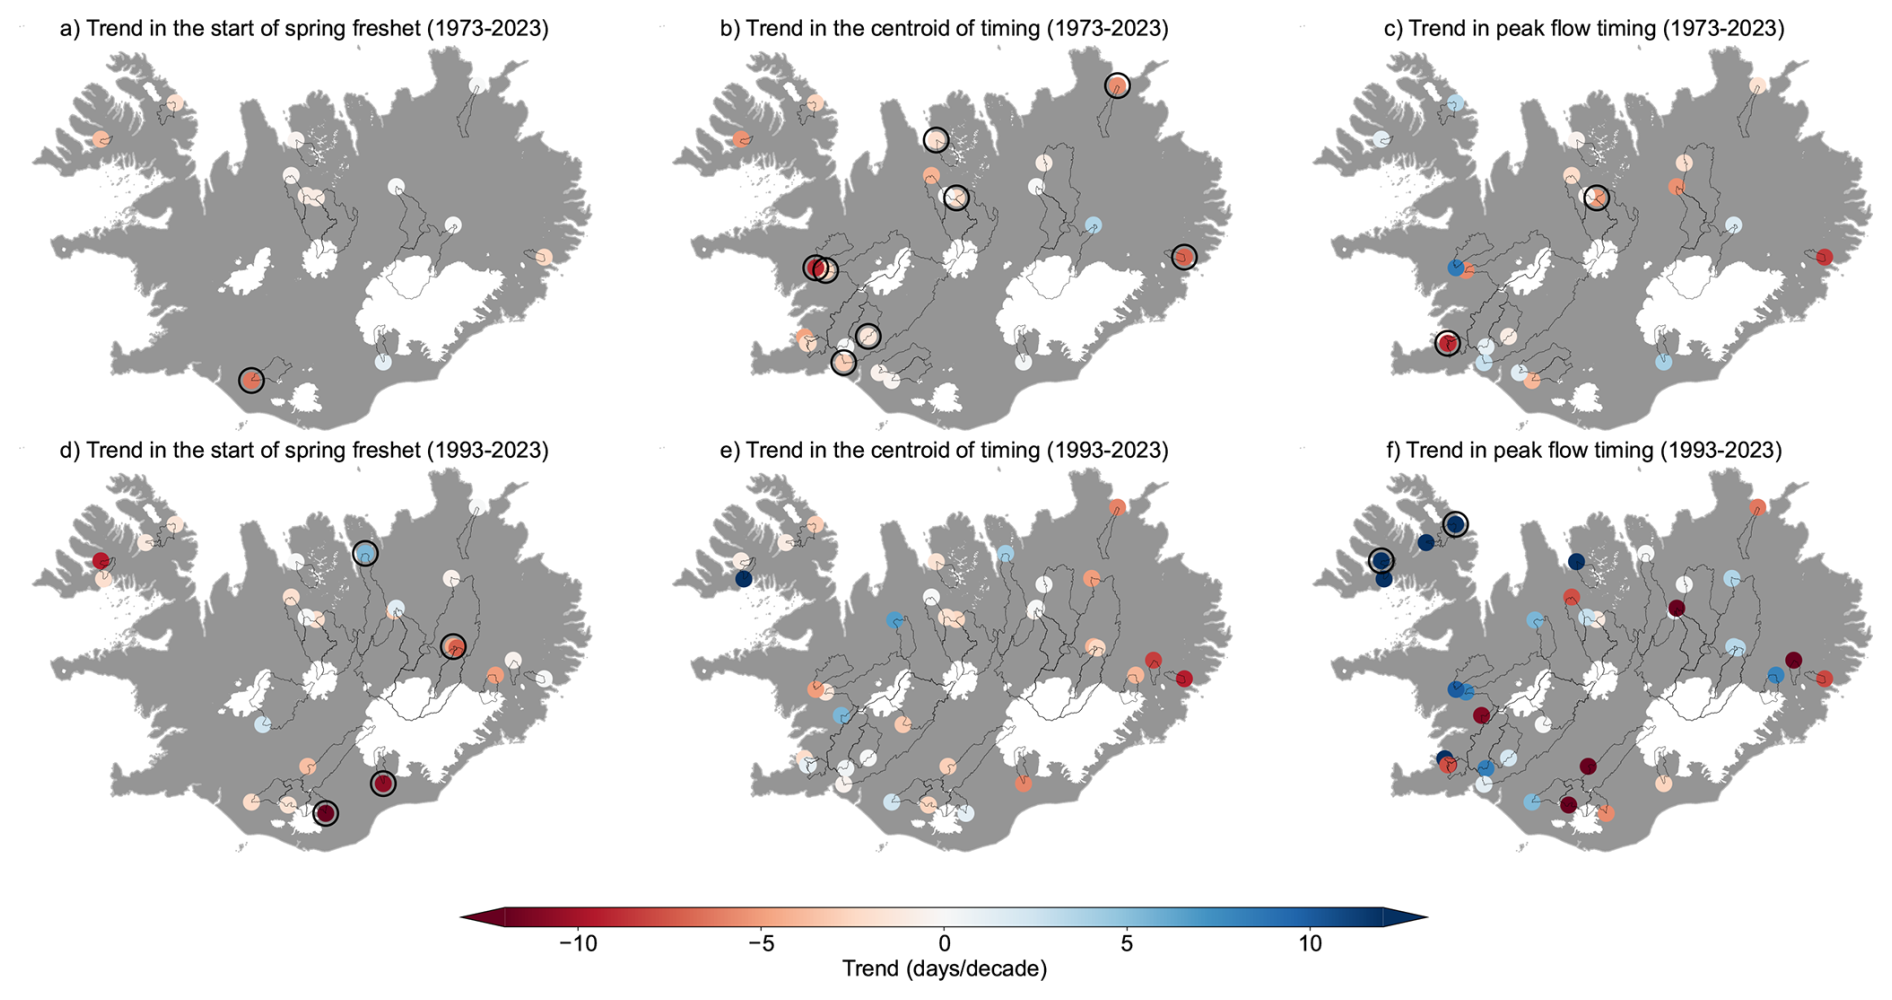
Figure 9Trends in the timing of the spring freshet, the centroid of timing and peak flow timing for two periods: 1973–2023 and 1993–2023. Panels (a), (b) and (c) show the trend in the start of spring freshet, the centroid of timing and peak flow timing, respectively, for 1973–2023. Panels (d), (e), and (f) display the trends for 1993–2023. Trends are expressed in days per decade, with red indicating earlier timing and blue indicating later timing. Black circles around gauge markers indicate statistically significant trends (p<0.05). Basemap source: Hijmans (2015).
Significant shifts in the centroid of annual flow timing are found in the longer period, with eight gauges showing earlier timing (Fig. 9b). Nine additional sites show non-significant tendencies toward earlier timing and two toward later timing. In period 2 (Fig. 9e), no significant trends are detected, although eastern gauges more consistently indicate earlier timing.
Peak flow timing shows mixed behavior across both periods. In period 2, two gauges in the Westfjords show statistically significant later peak timing, while the remaining two gauges in the region display positive but non-significant slopes (Fig. 9f), suggesting a potential regional delay that is partially supported statistically.
Trends in spring freshet timing and peak flow timing showed no statistically significant or physically meaningful correlations with catchment characteristics in either period. In contrast, centroid of timing trends exhibited notable relationships in period 1. Earlier centroid shifts were linked to surface-fed rivers, while shifts were smaller in groundwater-dominated catchments (R= 0.71), consistent with the buffering effect of baseflow. Earlier shifts were also associated with low-elevation catchments (R= 0.47). Increases in fall season precipitation likely contribute to this pattern, as rainfall at lower elevations enhances runoff generation early in the water year. Additionally, as temperatures rise, a greater proportion of precipitation falls as rain in low-elevation catchments, leading to increased winter flows and a further shift in the centroid of timing toward earlier in the year.
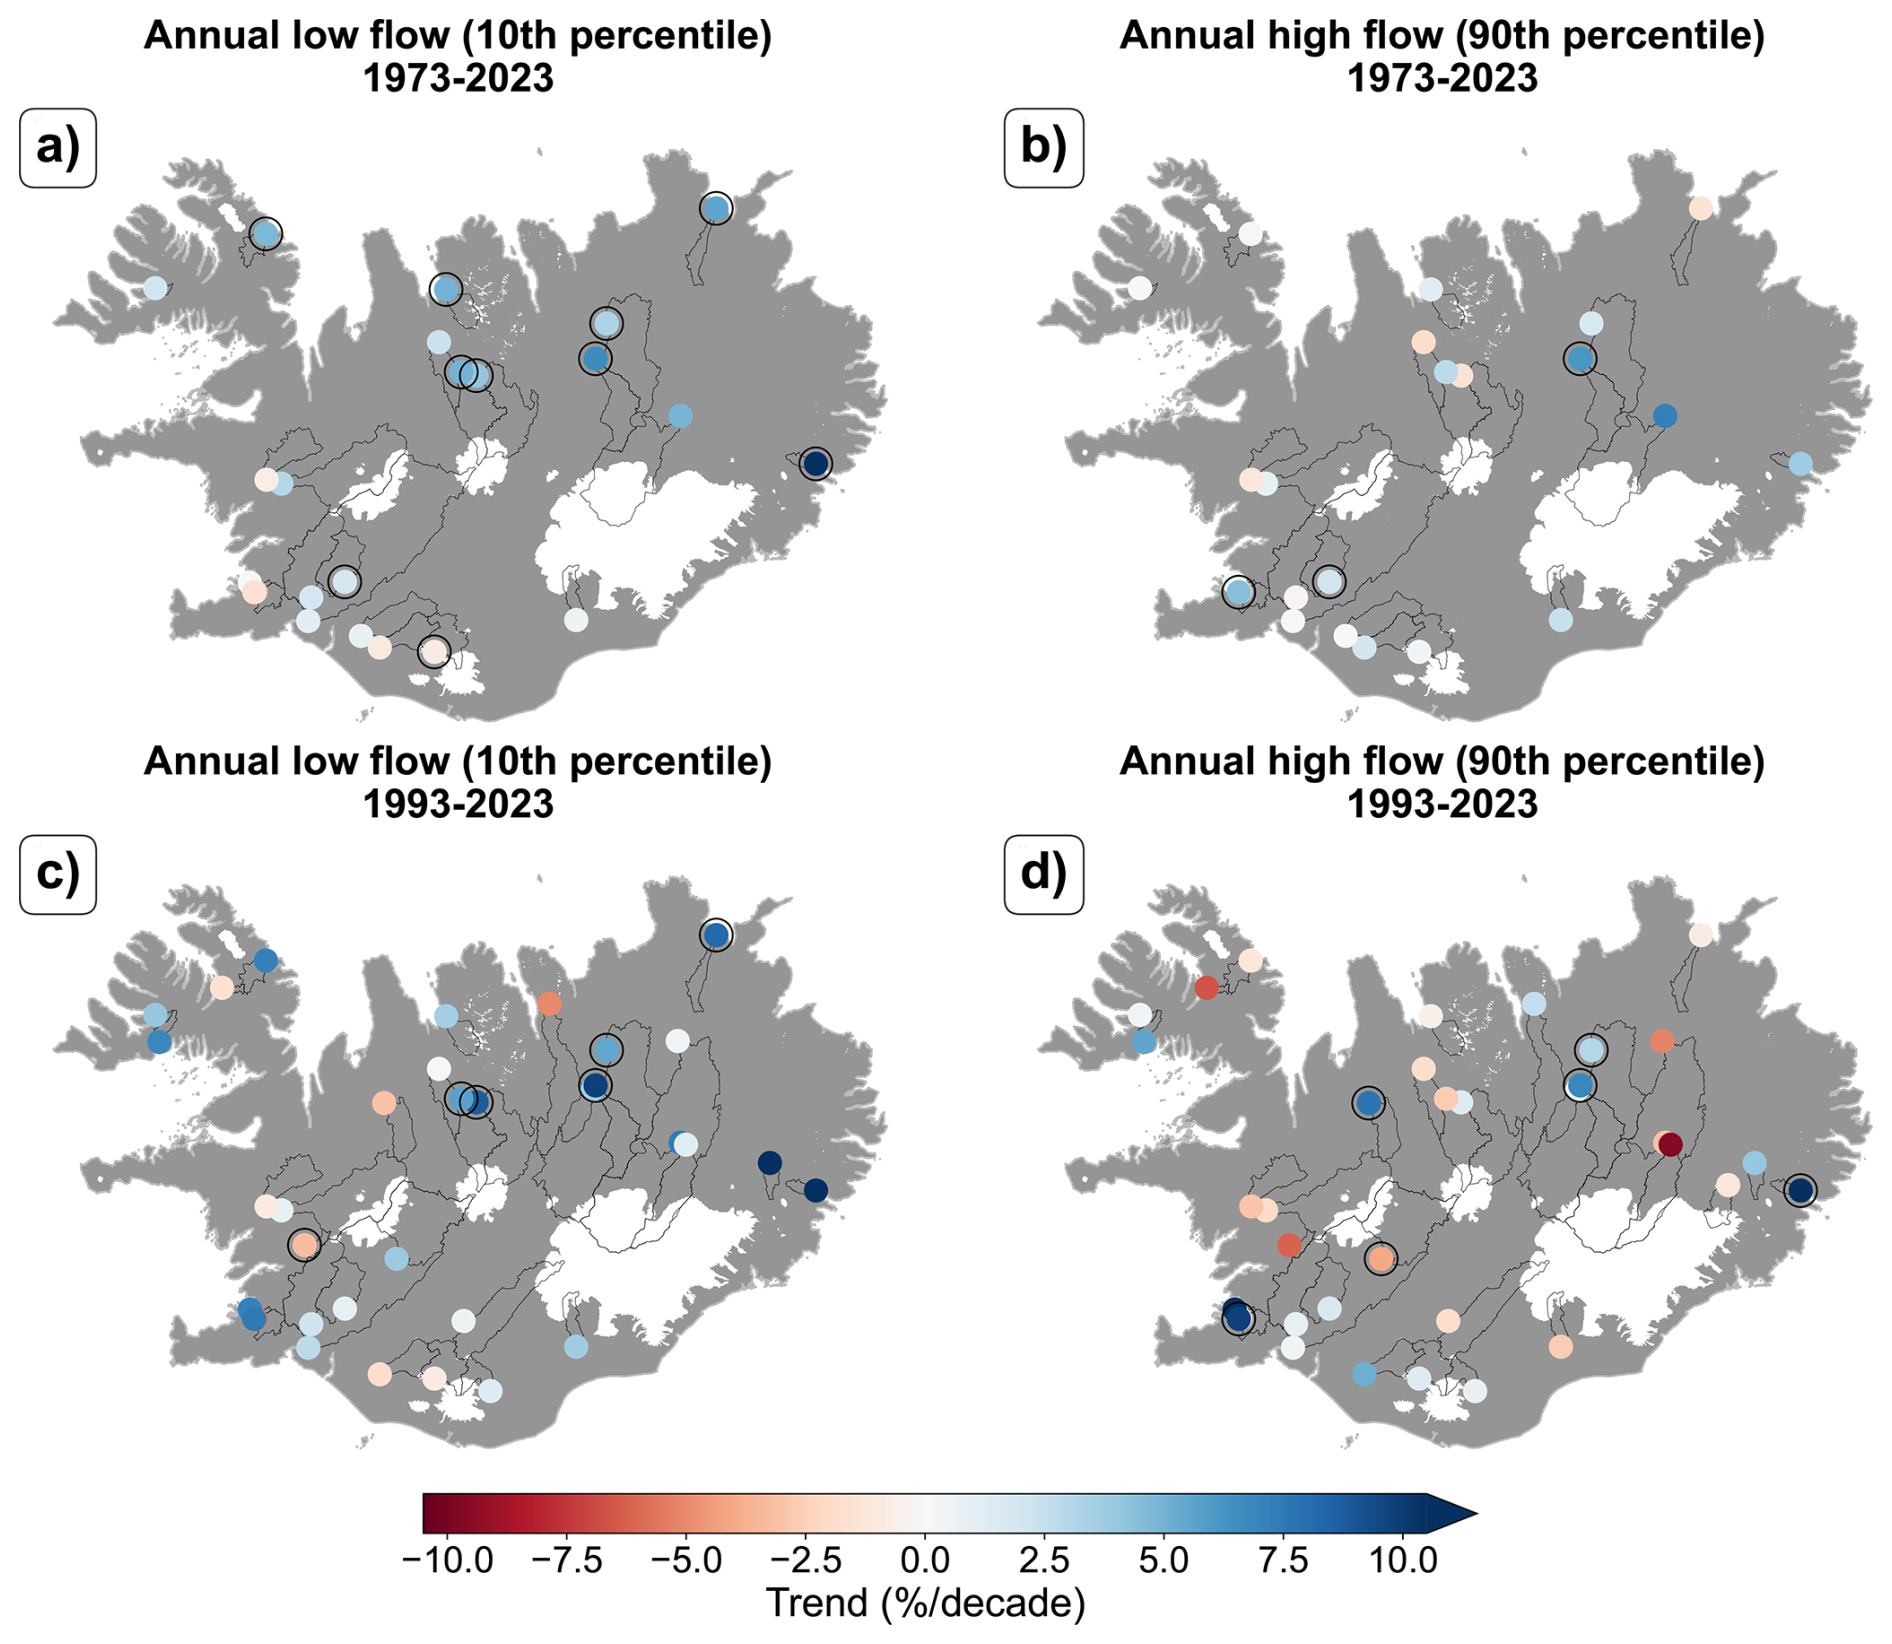
Figure 10Trends in annual high and low flows for period 1 and 2. Annual low (a, c) and high (b, d) flows in streamflow from 1973–2023 (a, b) and 1993–2023 (b, d). Low and high flows are defined as the 10th and 90th percentiles of annual flow. Black circles around gauge markers indicate statistically significant trends (p<0.05). Basemap source: Hijmans (2015).
To investigate the change in the magnitude of low flows and floods, we calculate trends in the annual 10th and 90th percentiles of daily flow (Fig. 10). Significant increases in annual low flows occur at 9/22 gauges in period 1 and at 5/34 in period 2, while significant decreases are rare (1 in each period). At all other gauges, no significant change is detected, although most slopes are directionally positive. Annual high flows show fewer significant changes: 3 significant increases and no significant decreases in period 1, and 5 increases and 1 decrease in period 2, with the remaining slopes non-significant.
Seasonal patterns follow a similar structure (Fig. S13). In period 1, low flows increase significantly in most seasons, while high flows show significant increases mainly in winter and fall, remaining mixed in spring and summer. In period 2, significant increases in low flows occur primarily in spring and fall, while winter and summer changes are mostly non-significant. Seasonal high-flow trends in period 2 are spatially variable with few significant results.
4.1 Multiannual variability in temperature, precipitation and streamflow in Iceland
Temperature, precipitation, and streamflow in Iceland exhibit pronounced multiannual variability, driven largely by broad-scale atmospheric patterns. For example, streamflow in Iceland shows significant correlations with the Arctic Oscillation (AO) index (Fig. 3). Fluctuations in streamflow reflect a complex interplay between precipitation, temperature, and glacier runoff, posing challenges for identifying long-term trends. Notably, streamflow in glaciated rivers increased significantly during the early 2000s, coinciding with an intense warming period and accelerated glacier melt. However, as the rate of warming has slowed in Iceland over the past decade, flows in most glaciated rivers have returned to near- or below-average levels. This aligns with glacier mass-balance measurements, which indicate a general slowdown in mass loss from 2011 onward compared to the rapid losses of the early 2000s (Aðalgeirsdóttir et al., 2020).
Glacier ablation has been shown to correlate with SSTs (Jónsdóttir and Uvo, 2009). Noël et al. (2022) attribute the reduced glacier mass loss after 2011 to the emergence of a regional cooling anomaly in the North Atlantic, southwest of Iceland, known as the “Blue Blob”. This anomaly has dampened warming rates in Iceland, thereby reducing glacier meltwater runoff rates. The cause of formation of the “Blue Blob” remains uncertain (Fan et al., 2024). Rahmstorf (2024) associates the `Blue Blob' with a weakening Atlantic Meridional Overturning Circulation (AMOC), interpreting it as a symptom of reduced ocean heat transport to the region. Long-term climate model simulations suggest that an AMOC shutdown may be more probable than previously assumed, with between 25 %–70 % of CMIP6 models progressing toward collapse depending on emission scenario (Drijfhout et al., 2025). While the timing remains deeply uncertain, such findings reinforce that observed SST anomalies around Iceland – such as the Blue Blob – may reflect early-stage circulation changes. Noël et al. (2022) project that the “Blue Blob” will continue to mitigate glacier mass loss until at least the mid-2050s, based on simulations using the Regional Atmospheric Climate Model driven by the Community Earth System Model under the high-end SSP5-8.5 emission scenario. However, reliance on a single model scenario limits the robustness of such a projection, as alternative pathways could yield differing outcomes. A recent study (Zanchettin and Rubino, 2024) documents accelerated warming of SSTs in the North Atlantic in recent years, which may signal changes in the extent or influence of the “Blue Blob” on regional climate patterns.
Overall, the strong variability in streamflow highlights the sensitivity of Icelandic hydrology to atmospheric and glaciological conditions. The findings emphasize the importance of integrating large-scale climatic influences, such as the AO and regional North Atlantic cooling, when interpreting multiannual variability and long-term streamflow trends in Iceland. These results align closely with findings by Jónsdóttir and Uvo (2009), who reported similar variability but based on data from fewer gauges.
4.2 Trends in meteorological drivers and streamflow
The pronounced multiannual variability described in the previous section provides important context for interpreting the long-term trends in both mean flows and intra-annual streamflow characteristics presented below.
4.2.1 Trends in meteorological drivers
Our analysis confirms that Iceland has undergone substantial hydroclimatic change over the past five decades, driven primarily by atmospheric warming and increases in precipitation, consistent with findings from previous studies (Eythorsson et al., 2023, Björnsson et al., 2023). Temperature trends are both spatially consistent and statistically robust, particularly over the longer 1973–2023 period, during which virtually all catchments show significant warming annually and across all seasons. The more recent period (1993–2023), however, reveals a more fragmented signal, with significant warming mostly confined to spring and fall.
Precipitation trends show greater spatial and seasonal variability than temperature but still exhibit a coherent long-term signal of increasing moisture supply. Annual precipitation rises at most locations in both periods, although fewer sites meet statistical significance during 1993–2023. When analyzed seasonally, fall is the dominant wetting season in the long record (1973–2023), while spring emerges as the leading season of increase in the shorter, more recent period (1993–2023), especially in the southwest. Winter and summer exhibit little consistent change in either period, showing only weak directional tendencies.
A particularly notable result is the sub-seasonal intensification of early fall wetting, with September showing pronounced upward trends. This pattern is clearly visible in both the catchment-scale trend analysis and the nationwide rolling mean composites. To the authors' knowledge, this increase in September precipitation has not been highlighted previously, although Gunnarsson et al. (2019) reported a modest increasing trend in September snow cover between 2000 and 2018.
Beyond increases in total precipitation, a more fundamental change concerns the phase in which precipitation is delivered. Long-term partitioning records indicate a transition from a predominantly snowfall-based to a rainfall-based precipitation regime, with an abrupt shift occurring in the early 2000s during a period of rapid atmospheric warming.
The spatial distribution of precipitation trends – with increases most consistently observed in the northeast, and weaker or even opposing tendencies in the southwest – echoes a long-recognised precipitation dipole in Iceland associated with preferred storm-track configurations (Rist, 1990). When extratropical cyclones pass south and east of Iceland, moisture advection favours the northeast, whereas tracks passing northwest of Iceland enhance precipitation on the south and west coasts. The persistence of stronger positive trends in the northeast in both study periods, and the emergence of a similar dipole in summer sub-seasonal trends, could therefore reflect a gradual shift in cyclone trajectories or seasonal blocking frequency. These storm-track configurations are closely linked to variability in large-scale circulation modes such as the AO and NAO, which modulate cyclone pathways and moisture transport toward Iceland. While attribution of circulation changes is beyond the scope of this study, the spatial coherence of these patterns suggests that shifting storm-tracks might play a role in shaping Iceland's evolving hydroclimate.
4.2.2 Trends in streamflow
Period 1: 1973–2023
Over the longer period, statistically significant increases were observed in one-third of the catchments, and most others exhibited upward tendencies even where statistical support was lacking. This increase can primarily be attributed to rising precipitation, as well as enhanced glacier melt in glaciated catchments. The strongest positive trends were observed in the northeastern part of the country, where precipitation increases were most pronounced (Fig. 4). Despite the overall upward shift in annual streamflow, within-year variability showed signs of weakening, with significant declines in variability metrics at a subset of sites and consistent directional decreases elsewhere.
Seasonal responses were strongest in fall, where significant increases were widespread across contrasting hydroclimatic settings, and most remaining catchments showed non-significant upward tendencies. These increases are consistent with rising fall precipitation and were most pronounced in early fall. Winter flows also increased at several sites, with broadly positive tendencies elsewhere, consistent with enhanced rainfall and snowmelt contributions under warmer winter conditions.
In contrast, summer displayed an emerging downward tendency. Significant decreases were confined to a portion of the streamflow gauges, yet non-significant reductions were common elsewhere, indicating a developing but still statistically uncertain pattern of seasonal drying. Correlation analyses showed that declines were more pronounced in surface-fed rivers, consistent with their reliance on transient rainfall and snowmelt inputs. Stronger reductions were associated with stronger spring warming, lower catchment elevation, and lower baseflow contributions, suggesting that earlier or diminished snowmelt and reduced groundwater buffering both contribute to emerging summer flow reductions. These tendencies align with declining summer precipitation and shorter snowpack persistence.
In glaciated catchments, significant increases in both annual and melt-season flows were evident at a portion of sites, while nearly all others exhibited non-significant increases. Enhanced meltwater contributions during this time are consistent with strong warming trends, with the period between 1973 and 2000 being much cooler than the period after 2000, as well as effects from volcanic eruptions and glacier dynamics. For example, eruptions at Eyjafjallajökull in 2010 and Grímsvötn in 2011 deposited ash on glaciers, reducing their albedo and temporarily increasing melt rates. Similarly, the Dyngjujökull surge in 2000 expanded the glacier at lower elevations, temporarily boosting summer flows in the Jökulsá á Fjöllum river. The positive trends over 1973–2023 are driven by the strong contrast between low flows before 2000 and elevated flows during the early-2000s melt period, even though flows declined again after 2010 (Fig. 2).
The influence of temperature on streamflow must be interpreted in a seasonally and catchment-specific context. In glacier-fed rivers during summer, higher temperatures tend to increase streamflow by enhancing meltwater production, as observed in the predominantly positive JAS trends over the 50-year period. However, the same warming can reduce streamflow in non-glacial or weakly glaciated basins by increasing evapotranspiration and depleting snow storage earlier in the season. This explains why summer trends diverge between glaciated and non-glaciated catchments, and why spring trends, although generally positive, are weaker in basins experiencing stronger warming or ET increases. Thus, temperature acts as both a supply-enhancing and supply-limiting driver, with the dominant mechanism shifting according to glacier cover, season, and moisture availability.
Low-flow conditions generally strengthened during this period, with several catchments showing significant increases and most others trending positively. High-flow responses were more variable and seldom significant, reflecting spatial differences in extreme precipitation and snow dynamics. Taken together, the dominant signal of period 1 is one of increasing fall and winter flows, increasing flows in glacial rivers, and emerging but mostly non-significant summer declines in surface-fed systems, accompanied by a gradual shift toward more buffered flow regimes.
Period 2: 1993–2023
In the more recent period, significant increases in annual streamflow were less widespread than in the longer-term analysis, although most catchments continued to show upward tendencies even where statistical confidence was limited. Spring and fall showed the most consistent increases, with statistically robust increases at select sites and broadly positive tendencies elsewhere, consistent with rising precipitation and enhanced recharge during the cool and shoulder seasons. Winter responses were weaker and more spatially variable, with directionally positive but generally non-significant changes in flow magnitude, suggesting that any increases during this season remain subtle.
In contrast, summer displayed an emerging downward tendency. Statistically robust reductions were confined to certain catchments, but non-significant declines were frequent elsewhere, particularly in surface-fed systems, suggesting that seasonal drying is developing even if not yet uniformly detectable.
Glaciated rivers exhibited a notable contrast with the longer-term behavior. While melt-season flows generally increased over 1973–2023, most glaciated catchments now exhibit directional declines, with statistically significant decreases at 2/14 sites. These declines are significantly correlated with glacier retreat, indicating that catchments with more glacier area loss experience stronger reductions in summer discharge. The unusually warm period in the early 2000s amplified meltwater contributions, but this was followed by a phase of relative cooling after 2011, during which meltwater production diminished. This cooling, combined with the reduction in glacierized area, contributed to the absence of sustained increases in recent decades. However, the relationship between glacier change and streamflow response remains complex and varies among glacier types; the coexistence of both mountain glaciers and large ice caps adds further heterogeneity through differing meltwater storage capacities and drainage dynamics.
Additionally, both the coefficient of variation and flashiness index show declining trends over the 30- and 50-year periods, indicating a general reduction in within-year streamflow variability.
4.2.3 Trends in baseflow index and its role in modulating seasonal flow responses
Significant increases in baseflow index were observed at 7 of 23 gauges in period 1 and 6 of 35 gauges in period 2. At most remaining sites, baseflow index trends were positive but did not reach statistical significance. This indicates a coherent directional tendency toward higher baseflow contributions across catchments, despite limited site-level significance. Over the longer period, increases were most pronounced in spring and summer, whereas fall and winter exhibited more mixed behavior. In the more recent period, positive but mostly non-significant baseflow index trends persisted across all seasons, suggesting a more gradual or spatially variable adjustment in runoff partitioning. Correlations between trends in baseflow index and soil attributes in fall and spring imply that reduced soil frost may be enhancing subsurface connectivity at certain locations, thereby dampening short-term flow variability (Evans et al., 2020).
Across both periods, the relationship between catchment baseflow index and streamflow trends is consistent but varies seasonally. In summer, groundwater-fed rivers (high baseflow index) show weaker declines or more stable flows, indicating that baseflow buffers against drying, while surface-fed rivers experience stronger reductions. In winter and spring, the opposite pattern is observed: surface-fed rivers respond more directly to rainfall and snowmelt inputs and therefore exhibit larger proportional increases, whereas groundwater-dominated systems show smaller trend magnitudes. For period 1, earlier centroid shifts were linked to surface-fed rivers, while shifts were smaller in groundwater-dominated catchments (R= 0.71), consistent with the buffering effect of baseflow. In both periods, the baseflow index itself tends to increase, and its correlation with soil properties suggests that reduced frost and enhanced infiltration are strengthening subsurface flow pathways. Overall, baseflow acts as a buffering mechanism, limiting streamflow sensitivity to meteorological forcing, while surface-fed systems drive the strongest trend signals.
4.2.4 Comparisons with previous studies
Past studies of streamflow trends in Iceland reported small or insignificant trends, despite increases in precipitation (Jónsdóttir et al., 2006, 2008). Our study uses a larger dataset than has been done before, and our results show significant positive trends in annual and seasonal streamflow in many rivers, particularly over the last 50 years. While a large majority of annual trends are positive (21 out of 25 streamflow stations), eight stations show statistically significant increases in streamflow for the period 1973–2023. The same holds true for 5/37 for the period 1993–2023. Our analysis shows that the timing of the spring freshet has not systematically shifted, consistent with the findings of Wilson et al. (2010) for the period 1961–2000. Blöschl et al. (2017) reported later occurrence of annual flood peaks in southwestern Iceland between 1960 and 2010, while timing in northeastern regions was stable or earlier, as noted in the introduction. In contrast to Blöschl et al. (2017), we do not detect a clear trend in the timing of annual peak flows. This difference likely reflects a combination of differing study periods and data coverage, as our analysis includes additional gauges and extends beyond 2010, encompassing more recent hydroclimatic conditions.
Our findings align with previous studies that showed a strong correlation between streamflow in Iceland and the AO (Jónsdóttir and Uvo, 2009). We provide new insights into sub-seasonal trends and identify increases in September and October precipitation and streamflow, which have not been reported before.
In the context of northern regions, our findings are consistent with studies that show increases in precipitation and streamflow (Box et al., 2019; Stahl et al., 2010). Other Arctic and sub-Arctic regions have observed rising winter flows due to increasing temperatures and/or precipitation (e.g. Skålevåg and Vormoor, 2021).
For glaciated rivers, our results showed positive long-term streamflow trends (1973–2023) but negative or insignificant recent (summer) trends (1993–2023). This contrast reflects a transition from a high-melt period in the early 2000s to reduced glacier runoff after 2010. As illustrated in Fig. 2, exceptionally high flows around 2000 elevate the long-term trend, whereas the post-2010 decline dominates the shorter-period analysis.
In regions with predominantly small or receding glaciers, several studies report declining glacier runoff as ice areas shrink - suggesting that “peak water” has already passed (e.g. Switzerland: van Tiel et al., 2026; western North America: Frans et al., 2018; Moore et al., 2020). By contrast, studies from more extensively glacierized basins typically report increasing summer flows under warming conditions (Svalbard: van Pelt et al., 2019; Greenland: Trusel et al., 2018). Although our results indicate increasing glacial river flows over the full 50-year period, the emergence of negative or near-zero summer flow trends during the past 30 years appears to stem partly from glacier area loss in some catchments, but mainly from regional cooling anomalies and a recent slowdown in glacier mass loss. To our knowledge, such a pattern has not been documented in other heavily glacierized regions that have not yet reached peak meltwater conditions, highlighting a unique regional hydrological response.
This study set out to (i) characterize interannual variability and long-term changes in hydroclimate and streamflow across Iceland, (ii) assess the role of large-scale atmospheric circulation in driving this variability, and (iii) identify and explain trends in annual, seasonal, and sub-seasonal streamflow. With respect to interannual variability and its large-scale drivers, we find large year-to-year variability in streamflow and its main meteorological controls, with pronounced multi-year fluctuations that closely track the Arctic Oscillation in many rivers, confirming that atmospheric circulation remains a dominant control on hydrologic variability at these timescales. Over the study period, Iceland has warmed and become wetter, with a significant long-term increase in the rainfall fraction of precipitation. With respect to long-term trends in streamflow, our analysis reveals the following key patterns:
-
Annual streamflow. Significant increases occurred at 8/25 gauges (1973–2023) and 7/37 gauges (1993–2023); elsewhere there was no significant trend, though most sites showed non-significant upward tendencies.
-
Seasonal streamflow. Fall shows the most consistent and widespread significant increases (1973–2023: 17/26; 1993–2023: 7/35), with winter also increasing significantly in 1973–2023 (12/23) and spring in 1993–2023 (9/35). Summer displays few significant changes but a broader non-significant tendency toward lower flows, especially in surface-fed rivers.
-
Glaciated rivers. Over 1973–2023, annual and melt-season (JAS) flows generally increased (significant at 5/10 and 3/9 gauges, respectively). Over 1993–2023, JAS flows tended to decrease, but significant declines were limited (2/14 gauges), consistent with a recent North Atlantic cooling anomaly that reduced meltwater production. These decreases were correlated with glacial area loss.
-
Timing metrics. We find no island-wide significant shift in the onset of spring freshet; the centroid of timing advanced significantly at 8 gauges in 1973–2023, consistent with increased fall–winter runoff. The centroid of timing showed no significant shifts in 1993–2023. Peak flow timing changes were mixed and seldom significant.
-
Within-year variability and baseflow. Streamflow became less variable over time, with consistent declines in both annual variability and flashiness. At the same time, the proportion of baseflow in total discharge increased in most catchments, particularly over the longer period, while the more recent period showed a directional but less statistically robust shift. These patterns are consistent with reduced soil frost and gradually strengthening subsurface flow pathways.
These findings show where hydrologic changes in Iceland are statistically robust and where they remain directional but not significant. Despite strong year-to-year variability, the persistence of cool-season increases suggests that long-term hydroclimatic forcing is beginning to outweigh natural fluctuations.
The observed increase in fall–winter streamflow at many sites supports revisiting seasonal reservoir operating rules to balance increased winter generation opportunities with storage targets for spring. Conversely, managers should prepare for more frequent low flow conditions in summer in surface-fed systems despite few significant trends to date, given consistent negative tendencies and mechanistic support (reduced summer precipitation and earlier/decreased snowmelt).
Investigating the relationship between streamflow and a broader set of climate indices, SSTs, and other large-scale atmospheric patterns could provide valuable insights into the climate drivers of streamflow variability, and potentially improve seasonal prediction skill. Additionally, an analysis of streamflow periodicity could help identify cycles that contribute to long-term variability. The ERA5-Land atmospheric reanalysis data uses static glacier and vegetation masks. To better understand the drivers of changing hydrological conditions in Iceland, a hydrological reanalysis using a process-based model that incorporates dynamic vegetation and glaciers would be beneficial. Such an approach could clarify the impacts of receding glaciers, changing glacier geometries, and expanding vegetation cover on streamflow patterns. Modeling soil-freeze thaw dynamics could clarify the role of reduced ground frost in the observed increases in baseflows.
The code used in this study was developed by the authors and is publicly available on GitHub (https://github.com/hhelgason/iceland-hydro-trends, last access: 27 April 2026). A citable archived version of the code is available on Zenodo: https://doi.org/10.5281/zenodo.19800449 (Helgason, 2026).
Streamflow observations and meteorological time series used in this study are part of the LamaH-Ice dataset, version 1.5 (Helgason and Nijssen, 2025), which is available for download on HydroShare (https://doi.org/10.4211/hs.705d69c0f77c48538d83cf383f8c63d6).
The supplement related to this article is available online at https://doi.org/10.5194/hess-30-3979-2026-supplement.
HBH and BN designed the study. HBH performed the data analysis and wrote the manuscript. BN, ÓGBS and AG reviewed the results and the manuscript and provided consultations and contributions throughout the work.
The contact author has declared that none of the authors has any competing interests.
Publisher's note: Copernicus Publications remains neutral with regard to jurisdictional claims made in the text, published maps, institutional affiliations, or any other geographical representation in this paper. The authors bear the ultimate responsibility for providing appropriate place names. Views expressed in the text are those of the authors and do not necessarily reflect the views of the publisher.
This article is part of the special issue “Northern hydrology in transition – impacts of a changing cryosphere on water resources, ecosystems, and humans (TC/HESS inter-journal SI)”. It is not associated with a conference.
The authors thank the reviewers for their constructive comments, which improved this manuscript. The authors are particularly grateful to Lena M. Tallaksen for her exceptionally thorough and insightful feedback over three rounds of review, which substantially strengthened the paper. The authors also thank David Gustafsson for handling the manuscript. The authors used OpenAI's ChatGPT to assist with language refinement during manuscript preparation. All scientific content, structure, and interpretation were developed by the authors. ChatGPT was employed to improve grammar, clarity, and flow in select sentences and paragraphs. All AI-assisted text was critically reviewed, revised, and finalized by the authors, who take full responsibility for the content of the manuscript.
This paper was edited by David Gustafsson and reviewed by Lena M. Tallaksen and one anonymous referee.
Aðalgeirsdóttir, G., Magnússon, E., Pálsson, F., Thorsteinsson, T., Belart, J. M. C., Jóhannesson, T., Hannesdóttir, H., Sigurðsson, O., Gunnarsson, A., Einarsson, B., Berthier, E., Schmidt, L. S., Haraldsson, H. H., and Björnsson, H.: Glacier Changes in Iceland From ∼1890 to 2019, Front. Earth Sci.-Lausanne, 8, https://doi.org/10.3389/feart.2020.523646, 2020.
Berge, V., Sarrazin, L., Arsenault, R., and Brissette, F.: Streamflow Assessment Toolkit for Changing Conditions, CEATI Report No. T202700-0433, Montreal, QC, Canada, 2021, https://my.ceati.com/research/blta6662929f1ca90c7/reader/a303b3a5-70a0-4ba6-b1ab-b7353a3d70dc?page=7 (access restricted, last access: 26 March 2026), 2021.
Björnsson, H., Sigurðsson, B., Davíðsdóttir, B., Ólafsson, J., Ástþórsson, Ó., Ólafsdóttir, S., Baldursson, T., and Jónsson, T.: Climate Change in Iceland.Third Assessment Report of the Scientific Committee on Climate Change, Icelandic Meteorological Office, Reykjavik, Iceland, ISBN 978-9935-9414-0-4, https://www.vedur.is/media/loftslag/Skyrsla-loftslagsbreytingar-2018-Vefur-NY.pdf (last access: 27 April 2026), 2018.
Björnsson, H., Ólafsdóttir, A. H., Sigurðsson, B. D., Katrínardóttir, B., Davíðsdóttir, B., Gunnarsdóttir, G., Aðalgeirsdóttir, G. Th., Sigurðsson, G. M., Ögmundardóttir, H., Pétursdóttir, H., Bárðarson, H., Heiðmarsson, S., and Matthíasdóttir, T.: The Scope and Consequences of Global Climate Change in Iceland, Fourth Assessment Report of the Scientific Committee on Climate Change, Icelandic Meteorological Office, Reykjavik, Iceland, ISBN 978-9935-9414-3-5, 2023.
Blöschl, G., Hall, J., Parajka, J., Perdigão, R. A. P., Merz, B., Arheimer, B., Aronica, G. T., Bilibashi, A., Bonacci, O., Borga, M., Čanjevac, I., Castellarin, A., Chirico, G. B., Claps, P., Fiala, K., Frolova, N., Gorbachova, L., Gül, A., Hannaford, J., Harrigan, S., Kireeva, M., Kiss, A., Kjeldsen, T. R., Kohnová, S., Koskela, J. J., Ledvinka, O., Macdonald, N., Mavrova-Guirguinova, M., Mediero, L., Merz, R., Molnar, P., Montanari, A., Murphy, C., Osuch, M., Ovcharuk, V., Radevski, I., Rogger, M., Salinas, J. L., Sauquet, E., Šraj, M., Szolgay, J., Viglione, A., Volpi, E., Wilson, D., Zaimi, K., and Živković, N.: Changing climate shifts timing of European floods, Science, 357, 588–590, 2017.
Bonshoms, M., Ubeda, J., Liguori, G., Körner, P., Navarro, Á., and Cruz, R.: Validation of ERA5-Land temperature and relative humidity on four Peruvian glaciers using on-glacier observations, J. Mt. Sci., 19, 1849–1873, https://doi.org/10.1007/S11629-022-7388-4, 2022.
Box, J. E., Colgan, W. T., Christensen, T. R., Schmidt, N. M., Lund, M., Parmentier, F. J. W., Brown, R., Bhatt, U. S., Euskirchen, E. S., Romanovsky, V. E., Walsh, J. E., Overland, J. E., Wang, M., Corell, R. W., Meier, W. N., Wouters, B., Mernild, S., Mård, J., Pawlak, J., and Olsen, M. S.: Key indicators of Arctic climate change: 1971–2017, Environ. Res. Lett., 14, 045010, https://doi.org/10.1088/1748-9326/AAFC1B, 2019.
Cayan, D. R., Kammerdiener, S. A., Dettinger, M. D., Caprio, J. M., and Peterson, D. H.: Changes in the onset of spring in the western United States, Bu. Am. Meteorol. Soc., 82, 399–416, 2001.
Crochet, P.: Sensitivity of Icelandic river basins to recent climate variations, Jokull, 2013, 71–104, https://doi.org/10.33799/JOKULL2013.63.071, 2013.
Dembélé, M., Oriani, F., Tumbulto, J., Mariéthoz, G., and Schaefli, B.: Gap-filling of daily streamflow time series using Direct Sampling in various hydroclimatic settings, J. Hydrol.-Amst., 569, 573–586, https://doi.org/10.1016/J.JHYDROL.2018.11.076, 2019.
Drijfhout, S., Angevaare, J. R., Mecking, J., van Westen, R. M., and Rahmstorf, S.: Shutdown of northern Atlantic overturning after 2100 following deep mixing collapse in CMIP6 projections, Environ. Res. Lett., 20, 094062, https://doi.org/10.1088/1748-9326/ADFA3B, 2025.
Etzelmüller, B., Isaksen, K., Czekirda, J., Westermann, S., Hilbich, C., and Hauck, C.: Rapid warming and degradation of mountain permafrost in Norway and Iceland, The Cryosphere, 17, 5477–5497, https://doi.org/10.5194/tc-17-5477-2023, 2023.
Evans, S. G., Yokeley, B., Stephens, C., and Brewer, B.: Potential mechanistic causes of increased baseflow across northern Eurasia catchments underlain by permafrost, Hydrol. Process., 34, 2676–2690, https://doi.org/10.1002/HYP.13759, 2020.
Eythorsson, D., Gardarsson, S. M., Gunnarsson, A., and Sveinsson, O. G. B.: Observed and predicted trends in Icelandic snow conditions for the period 1930–2100, The Cryosphere, 17, 51–62, https://doi.org/10.5194/tc-17-51-2023, 2023.
Fan, Y., Chan, D., Zhang, P., and Li, L.: Disagreement on the North Atlantic Cold Blob Formation Mechanisms among Climate Models, J. Climate, 37, 4061–4078, https://doi.org/10.1175/JCLI-D-23-0654.1, 2024.
Frans, C., Istanbulluoglu, E., Lettenmaier, D. P., Fountain, A. G., and Riedel, J.: Glacier Recession and the Response of Summer Streamflow in the Pacific Northwest United States, 1960–2099, Water Resour. Res., 54, 6202–6225, https://doi.org/10.1029/2017WR021764, 2018.
Gunnarsson, A., Garðarsson, S. M., and Sveinsson, Ó. G. B.: Icelandic snow cover characteristics derived from a gap-filled MODIS daily snow cover product, Hydrol. Earth Syst. Sci., 23, 3021–3036, https://doi.org/10.5194/hess-23-3021-2019, 2019.
Hamed, K. H. and Ramachandra Rao, A.: A modified Mann-Kendall trend test for autocorrelated data, J. Hydrol.-Amst., 204, 182–196, https://doi.org/10.1016/S0022-1694(97)00125-X, 1998.
Hannesdóttir, H., Sigurðsson, O., Þrastarson, R. H., Guðmundsson, S., Belart, J. M. C., Pálsson, F., Magnússon, E., Víkingsson, S., Kaldal, I., and Jóhannesson, T.: A national glacier inventory and variations in glacier extent in Iceland from the Little Ice Age maximum to 2019, Jökull, https://doi.org/10.33799/jokull2020.70.001, 2020.
Helgason, H.: hhelgason/iceland-hydro-trends: v1.0.0 (v1.0.0), Zenodo [code], https://doi.org/10.5281/zenodo.19800449, 2026.
Helgason, H. and Nijssen, B.: LamaH-Ice: LArge-SaMple Data for Hydrology and Environmental Sciences for Iceland, v1.5, HydroShare [data set], https://doi.org/10.4211/hs.705d69c0f77c48538d83cf383f8c63d6, 2025.
Helgason, H. B. and Nijssen, B.: LamaH-Ice: LArge-SaMple DAta for Hydrology and Environmental Sciences for Iceland, Earth Syst. Sci. Data, 16, 2741–2771, https://doi.org/10.5194/essd-16-2741-2024, 2024.
Hersbach, H., Bell, B., Berrisford, P., Hirahara, S., Horányi, A., Muñoz-Sabater, J., Nicolas, J., Peubey, C., Radu, R., Schepers, D., Simmons, A., Soci, C., Abdalla, S., Abellan, X., Balsamo, G., Bechtold, P., Biavati, G., Bidlot, J., Bonavita, M., De Chiara, G., Dahlgren, P., Dee, D., Diamantakis, M., Dragani, R., Flemming, J., Forbes, R., Fuentes, M., Geer, A., Haimberger, L., Healy, S., Hogan, R. J., Hólm, E., Janisková, M., Keeley, S., Laloyaux, P., Lopez, P., Lupu, C., Radnoti, G., de Rosnay, P., Rozum, I., Vamborg, F., Villaume, S., and Thépaut, J. N.: The ERA5 global reanalysis, Q. J. Roy. Meteor. Soc., 146, 1999–2049, https://doi.org/10.1002/QJ.3803, 2020.
Hijmans, R.: Boundary, Iceland 2015, University of California, Berkeley. Museum of Vertebrate Zoology, https://earthworks.stanford.edu/catalog/stanford-xz811fy7881 (last access: 9 September 2022), 2015.
IPCC: Climate Change 2023 Synthesis Report. Contribution of Working Groups I, II and III to the Sixth Assessment Report of the Intergovernmental Panel on Climate Change, edited by: Core Writing Team, Lee, H., and Romero, J., IPCC, Geneva, Switzerland, 35–115, https://doi.org/10.59327/IPCC/AR6-9789291691647, 2023.
Jónsdóttir, J. F. and Uvo, C. B.: Long-term variability in precipitation and streamflow in Iceland and relations to atmospheric circulation, Int. J. Climatol., 29, 1369–1380, https://doi.org/10.1002/JOC.1781, 2009.
Jónsdóttir, J. F., Jónsson, P., and Uvo, C. B.: Trend analysis of Icelandic discharge, precipitation and temperature series, Nord. Hydrol., 365–376, https://doi.org/10.2166/nh.2006.020, 2006.
Jónsdóttir, J. F., Uvo, C. B., and Clarke, R. T.: Trend analysis in Icelandic discharge, temperature and precipitation series by parametric methods, Hydrol. Res., 39, 425–436, 2008.
Kim, J. S. and Jain, S.: High-resolution streamflow trend analysis applicable to annual decision calendars: A western United States case study, Climatic Change, 102, 699–707, https://doi.org/10.1007/S10584-010-9933-3, 2010.
Kormann, C., Francke, T., and Bronstert, A.: Detection of regional climate change effects on alpine hydrology by daily resolution trend analysis in Tyrol, Austria, J. Water Clim. Change, 6, https://doi.org/10.2166/wcc.2014.099, 2015.
Ladson, A. R., Brown, R., Neal, B., and Nathan, R.: A standard approach to baseflow separation using the Lyne and Hollick filter, Australian Journal of Water Resources, 17, 25–34, https://doi.org/10.7158/W12-028.2013.17.1, 2013.
Li, Z., Guo, W., Wang, Y., Zhang, Y., Zhang, S., Zhu, X., and Xu, N.: Glacier melting phenology changes in the Tibetan Plateau from 1981 to 2020, Catena-Amst., 257, 109199, https://doi.org/10.1016/J.CATENA.2025.109199, 2025.
Moore, R. D., Pelto, B., Menounos, B., and Hutchinson, D.: Detecting the Effects of Sustained Glacier Wastage on Streamflow in Variably Glacierized Catchments, Front. Earth Sci.-Lausanne, 8, 507257, https://doi.org/10.3389/FEART.2020.00136, 2020.
Muñoz-Sabater, J., Dutra, E., Agustí-Panareda, A., Albergel, C., Arduini, G., Balsamo, G., Boussetta, S., Choulga, M., Harrigan, S., Hersbach, H., Martens, B., Miralles, D. G., Piles, M., Rodríguez-Fernández, N. J., Zsoter, E., Buontempo, C., and Thépaut, J.-N.: ERA5-Land: a state-of-the-art global reanalysis dataset for land applications, Earth Syst. Sci. Data, 13, 4349–4383, https://doi.org/10.5194/essd-13-4349-2021, 2021.
NOAA CPC: National Oceanic and Atmospheric Administration Climate Prediction Center: Monthly Arctic Oscillation (AO) Index, https://www.cpc.ncep.noaa.gov/products/precip/CWlink/daily_ao_index/monthly.ao.index.b50.current.ascii (last access: 25 November 2024), 2024a.
NOAA CPC: National Oceanic and Atmospheric Administration Climate Prediction Center: Monthly North Atlantic Oscillation (NAO) Index, https://www.cpc.ncep.noaa.gov/products/precip/CWlink/pna/norm.nao.monthly.b5001.current.ascii (last access: 25 November 2024), 2024b.
Noël, B., Aðalgeirsdóttir, G., Pálsson, F., Wouters, B., Lhermitte, S., Haacker, J. M., and van den Broeke, M. R.: North Atlantic Cooling is Slowing Down Mass Loss of Icelandic Glaciers, Geophys. Res. Lett., 49, e2021GL095697, https://doi.org/10.1029/2021GL095697, 2022.
Petersen, G. N. and Berber, D.: Jarðvegshitamælingar á Íslandi – Staða núverandi kerfis og framtíðarsýn (e. Soil Temperature Measurements in Iceland – State of the Current System and Future Outlook), Icelandic Meteorological Office, Reykjavík, 2018. ISSN 1670-8261, https://www.vedur.is/media/vedurstofan-utgafa-2018/VI_2018_009_rs.pdf (last access: 28 March 2026), 2018.
Pettitt, A. N.: A Non-Parametric Approach to the Change-Point Problem, J. R. Stat. Soc. Ser. C-App., 28, 126–135, https://doi.org/10.2307/2346729, 1979.
Rahmstorf, S.: Is the Atlantic overturning circulation approaching a tipping point?, Oceanography, 37, 16–29, https://doi.org/10.5670/oceanog.2024.501, 2024.
Rantanen, M., Karpechko, A. Y., Lipponen, A., Nordling, K., Hyvärinen, O., Ruosteenoja, K., Vihma, T., and Laaksonen, A.: The Arctic has warmed nearly four times faster than the globe since 1979, Commun. Earth Environ., 3, 1–10, https://doi.org/10.1038/s43247-022-00498-3, 2022.
Rawlins, M. A. and Karmalkar, A. V.: Regime shifts in Arctic terrestrial hydrology manifested from impacts of climate warming, The Cryosphere, 18, 1033–1052, https://doi.org/10.5194/tc-18-1033-2024, 2024.
Raynolds, M., Magnússon, B., Metúsalemsson, S., and Magnússon, S. H.: Warming, sheep and volcanoes: Land cover changes in Iceland evident in satellite NDVI trends, Remote Sens.-Basel, 7, 9492–9506, https://doi.org/10.3390/rs70809492, 2015.
Rist, S.: Vatns er þörf, Bókaútgáfa Menningarsjóðs, Reykjavík, Iceland, https://lbs.leitir.is/permalink/354ILC_ALM/1e6r2ve/alma990003588830106893 (last access: 28 March 2026), 1990.
Schyberg, H., Yang, X., Køltzow, M. A. Ø., Amstrup, B., Bakketun, Å., Bazile, E., Bojarova, J., Box, J. E., Dahlgren, P., Hagelin, S., Homleid, M., Horányi, A., Høyer, J., Johansson, Å., Killie, M. A., Körnich, H., Le Moigne, P., Lindskog, M., Manninen, T., Nielsen Englyst, P., Nielsen, K. P., Olsson, E., Palmason, B., Peralta Aros, C., Randriamampianina, R., Samuelsson, P., Stappers, R., Støylen, E., Thorsteinsson, S., Valkonen, T., and Wang, Z. Q.: Arctic regional reanalysis on single levels from 1991 to present, Copernicus Climate Change Service (C3S) Climate Data Store (CDS) [data set], https://doi.org/10.24381/cds.713858f6, 2020.
Sen, P. K.: Estimates of the regression coefficient based on Kendall's tau, J. Am. Stat. Assoc., 63, 1379–1389, https://doi.org/10.2307/2285891, 1968.
Skålevåg, A. and Vormoor, K.: Daily streamflow trends in Western versus Eastern Norway and their attribution to hydro-meteorological drivers, Hydrol. Process., 35, e14329, https://doi.org/10.1002/HYP.14329, 2021.
Snorrason, A.: Hydrologic variability and general circulation of the atmosphere, in: XV Nordisk Hydrologisk Konferens (NHK-90, Kalmar, Sweden, 29 July–1 August 1990), National Energy Authority (Orkustofnun), Reykjavík, OS-90027/VOD-02, http://hdl.handle.net/10802/20334 (last access: 28 March 2026), 1990.
Stahl, K., Hisdal, H., Hannaford, J., Tallaksen, L. M., van Lanen, H. A. J., Sauquet, E., Demuth, S., Fendekova, M., and Jódar, J.: Streamflow trends in Europe: evidence from a dataset of near-natural catchments, Hydrol. Earth Syst. Sci., 14, 2367–2382, https://doi.org/10.5194/hess-14-2367-2010, 2010.
Theil, H.: A rank-invariant method of linear and polynomial regression analysis. I, II, III, Nederl. Akad. Wetensch. Proc., 53, 386–392, 521–525, 1397–1412, 1950.
Thompson, D. W. J. and Wallace, J. M.: The Arctic oscillation signature in the wintertime geopotential height and temperature fields, Geophys. Res. Lett., 25, 1297–1300, https://doi.org/10.1029/98GL00950, 1998.
Titkova, T. B. and Ananicheva, M. D.: Using ERA5-Land Reanalysis and Data from Weather Stations in the Mountainous Regions of Russia to Assess Changes in the Glacial Systems of Eastern Siberia and the Far East, Izvestiya, Atmospheric and Oceanic Physics, 60, S227–S239, https://doi.org/10.1134/S0001433824701214, 2024.
Trusel, L. D., Das, S. B., Osman, M. B., Evans, M. J., Smith, B. E., Fettweis, X., McConnell, J. R., Noël, B. P. Y., and van den Broeke, M. R.: Nonlinear rise in Greenland runoff in response to post-industrial Arctic warming, Nature, 564, 104–108, https://doi.org/10.1038/S41586-018-0752-4, 2018.
van Pelt, W., Pohjola, V., Pettersson, R., Marchenko, S., Kohler, J., Luks, B., Hagen, J. O., Schuler, T. V., Dunse, T., Noël, B., and Reijmer, C.: A long-term dataset of climatic mass balance, snow conditions, and runoff in Svalbard (1957–2018), The Cryosphere, 13, 2259–2280, https://doi.org/10.5194/tc-13-2259-2019, 2019.
van Tiel, M., Huss, M., Zappa, M., Jonas, T., and Farinotti, D.: Swiss glacier mass loss during the 2022 drought: persistent streamflow contributions amid declining melt water volumes, Hydrol. Earth Syst. Sci., 30, 23–43, https://doi.org/10.5194/hess-30-23-2026, 2026.
Wanner, H., Brönnimann, S., Casty, C., Gyalistras, D., Luterbacher, J., Schmutz, C., Stephenson, D. B., and Xoplaki, E.: North Atlantic oscillation – Concepts and studies, Surv. Geophys., 22, 321–381, https://doi.org/10.1023/A:1014217317898, 2001.
Wilson, D., Hisdal, H., and Lawrence, D.: Has streamflow changed in the Nordic countries? – Recent trends and comparisons to hydrological projections, J. Hydrol.-Amst., 394, 334–346, https://doi.org/10.1016/j.jhydrol.2010.09.010, 2010.
WMO: World Meteorological Organization: Manual on Low-flow Estimation and Prediction. Operational Hydrology Report No. 50. WMO-No. 1029, ISBN 978-92-63-11029-9, 2008.
Yue, S., Pilon, P., Phinney, B., and Cavadias, G.: The influence of autocorrelation on the ability to detect trend in hydrological series, Hydrol. Process., 16, 1807–1829, https://doi.org/10.1002/HYP.1095, 2002.
Zanchettin, D. and Rubino, A.: Accelerated North Atlantic surface warming reshapes the Atlantic Multidecadal Variability, Commun. Earth Environ., 5, 1–10, https://doi.org/10.1038/s43247-024-01804-x, 2024.
Zaqout, T. and Andradóttir, H. Ó.: Impact of climate change on soil frost and future winter flooding, in: Novatech 2023: 11e Conférence internationale sur l'eau dans la ville, https://hal.science/hal-04176935v1 (last access: 28 March 2026), 2023.
Zaqout, T., Andradóttir, H. Ó., and Sörensen, J.: Trends in soil frost formation in a warming maritime climate and the impacts on urban flood risk, J. Hydrol.-Amst., 617, 128978, https://doi.org/10.1016/J.JHYDROL.2022.128978, 2023.