the Creative Commons Attribution 4.0 License.
the Creative Commons Attribution 4.0 License.
 | 23 Jun 2026
From salinity to nanoplastics: redefining safe yield in strip-island aquifers under emerging contaminant threats
Chunxiang Ma
Shaobo Gao
Jian Luo
Nanoplastic contamination is emerging as a significant threat to groundwater security on small islands, where freshwater lenses serve as primary water supplies. Existing groundwater management frameworks are largely based on salinity intrusion and do not account for the distinct transport behavior of nanoplastics. This study formulates a multi-physics numerical model incorporating variable-density groundwater flow, salt transport, and nanoplastic migration processes to investigate nanoplastic transport in idealized strip-island aquifers under pumping conditions. The model is calibrated using laboratory-scale data and evaluated at the field scale. Results show that nanoplastic migration is controlled not only by advection–dispersion processes but also by particle-specific interactions, leading to transport dynamics fundamentally different from those of dissolved salts. In particular, the higher effective dispersivity of nanoplastics causes earlier breakthrough at extraction wells and the formation of broader contaminant transition zones. Pronounced scale effects are observed: while laboratory simulations exhibit rapid upward coning and contamination, field-scale simulations indicate attenuated coning and stabilization over substantially longer timeframes. Sensitivity analysis identifies nanoplastic dispersivity as the dominant parameter influencing well contamination risk. These findings demonstrate that safe extraction strategies based solely on salinity thresholds may underestimate contamination risks and that well placement and pumping design must account for nanoplastic transition zones. The study provides a process-based framework for adapting groundwater management to emerging nanoplastic pollution in vulnerable island environments.
- Article
(5075 KB) - Full-text XML
-
Supplement
(4775 KB) - BibTeX
- EndNote


Islands host nearly 10 % of the global population and cover approximately 6.7 % of the Earth's terrestrial surface (Sayre et al., 2019). On many small islands, limited surface water availability makes groundwater a critical resource for local communities (Dose et al., 2014). Notably, numerous Pacific islands rely on shallow freshwater lenses – buoyant bodies of freshwater overlying saltwater in highly permeable aquifers – as their primary water supply (Sharan et al., 2021; White and Falkland, 2010). The formation, stability, and morphology of these lenses result from the interplay between density contrasts and multiple external factors, including climate, geological structures, and anthropogenic activities such as groundwater pumping and subsurface barrier installation (Alsumaiei and Bailey, 2018; Ketabchi et al., 2014; Tang et al., 2021, 2022; Yan et al., 2021; Yang et al., 2025; Gao et al., 2025; Zheng et al., 2025). Excessive pumping readily induces saline upconing, degrades water quality, and threatens long-term water security (Abdoulhalik and Ahmed, 2018; Dagan and Bear, 1968; Houben and Post, 2017; Werner et al., 2009).
Beyond salinity intrusion, nanoplastic contamination has emerged as an additional and largely unaddressed threat to island groundwater systems. Microplastics are pervasive environmental pollutants detected in marine environments, soils, and groundwater worldwide (Koelmans et al., 2022; Koutnik et al., 2021; Li et al., 2018; Ren et al., 2021; Thompson et al., 2024). Oceanic concentrations continue to rise due to plastic persistence and ongoing inputs (Isobe et al., 2019). Nanoplastics, which are generated through the fragmentation of larger plastic debris and microplastics, may occur at even higher particle-number concentrations, with coastal waters often exhibiting higher levels than open-ocean regions (ten Hietbrink et al., 2025). Emerging evidence indicates that seawater intrusion facilitates the transport of microplastics into coastal aquifer systems (Chen et al., 2024). Because island aquifers are completely surrounded by seawater, freshwater lenses are particularly vulnerable to marine-sourced nanoplastic contamination (Fig. 1).
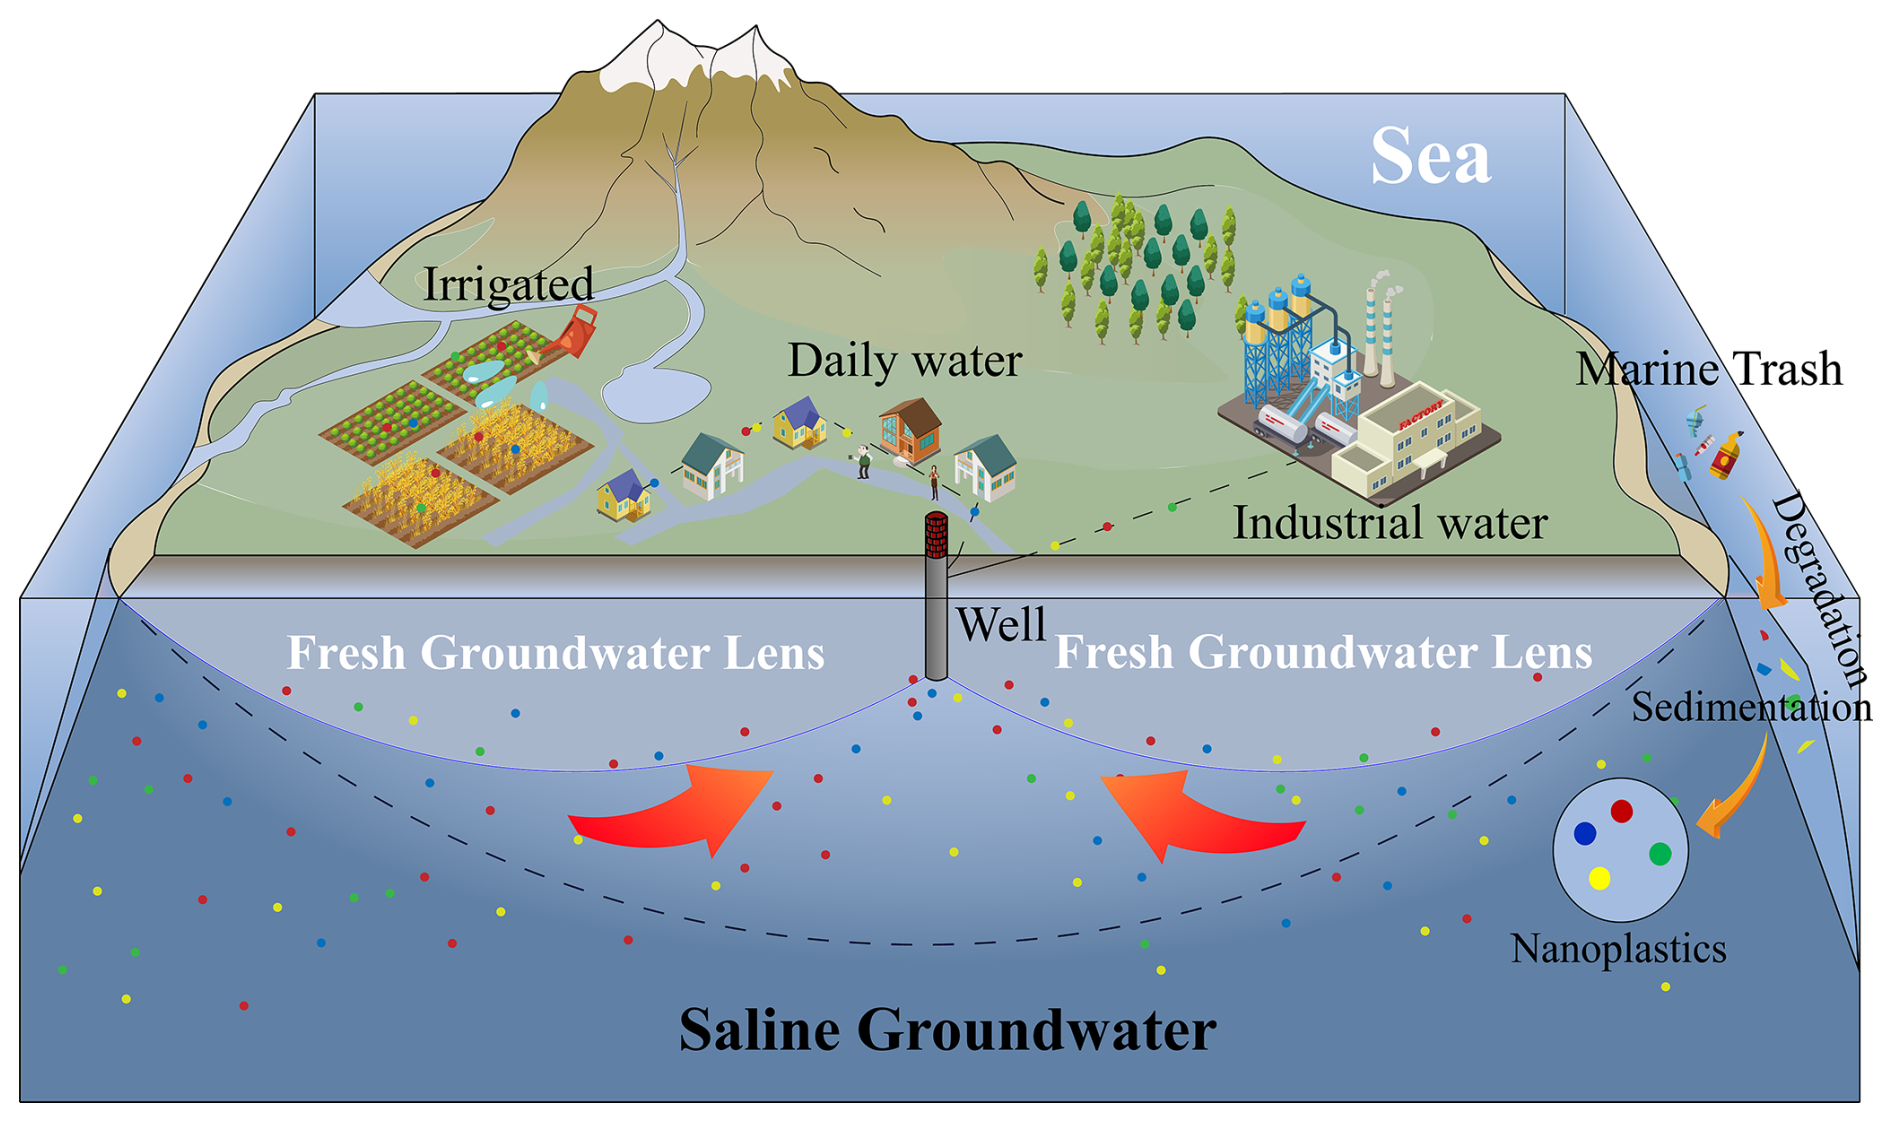
Figure 1Schematic diagram of freshwater lenses and nanoplastic contaminant distribution in an idealized strip-island aquifer under groundwater extraction.
The maximum safe extraction rate for freshwater lenses is typically estimated using analytical solutions that assume a sharp interface between freshwater and seawater (Muskat, 1938). Such approaches are widely used in two-dimensional strip-island models to determine the pumping threshold at which the saline interface reaches the well screen (Tang et al., 2020, 2021, 2024). While computationally efficient, these models neglect hydrodynamic dispersion and the development of a brackish transition zone, which can be extensive in highly permeable island aquifers (Coulon et al., 2022; Babu et al., 2020). Consequently, current safe-yield assessments often overlook realistic mixing processes and contaminant transport within the transition zone, potentially underestimating water-quality risks.
Transport processes of nanoplastics in porous media differ fundamentally from those of dissolved solutes. Early modeling efforts adapted classical advection–dispersion equations with simple adsorption terms (Babakhani et al., 2017), but subsequent studies have demonstrated that the migration of microplastics and nanoplastics involves additional mechanisms such as adsorption–desorption, clogging, interception, and aggregation (Liu et al., 2025; Yuan et al., 2024). Importantly, nanoplastic dispersion coefficients depend on particle size and flow velocity (Wang and Sedighi, 2023). Under pumping conditions that induce upward coning flow fields, these properties suggest that nanoplastics may migrate toward extraction wells more rapidly than dissolved salts and form a broader or earlier contaminant transition zone (Wang and Sedighi, 2023; Alkindi et al., 2011; Lee et al., 2017). Traditional sharp-interface and salinity-based intrusion models fail to capture this behavior, which has remained largely unexplored in island freshwater lens studies.
Taken together, there are two critical gaps that are interdependent and collectively undermine reliable groundwater management. First, existing safe-yield models oversimplify the freshwater–seawater transition zone by neglecting dispersion-driven mixing. This oversimplification is further exacerbated when combined with the poorly characterized transport of nanoplastics, which exhibit unique migration dynamics that cannot be captured by traditional solute models. Second, the distinct migration behavior of nanoplastics under pumping-induced coning remains poorly understood. Current modeling frameworks, largely derived from solute transport theory, do not adequately capture transient nanoplastic breakthrough or particle-specific transport dynamics.
To address these gaps, this study develops a coupled numerical model that integrates variable-density groundwater flow, salt transport, and nanoplastic migration in island aquifers. This study aims to: (1) quantify marine-derived nanoplastic accumulation in freshwater extraction wells under pumping conditions; (2) assess how nanoplastic transport, especially enhanced dispersivity, alters the maximum safe extraction rate compared to traditional salinity-based thresholds; and (3) evaluate the sensitivity of nanoplastic migration and associated risks to key hydrogeological parameters and operational factors. By incorporating nanoplastic transport parameters derived from laboratory column experiments and conducting simulations at both laboratory and field scales, this work provides critical insights for adjusting groundwater management strategies to safeguard island freshwater resources in the face of emerging nanoplastic pollution.
2.1 Mathematical model
To simplify the problem and enhance computational tractability, the following key assumptions are adopted based on established modeling practices in coastal aquifer studies (Stoeckl and Houben, 2012; Yao et al., 2019): (i) the aquifer is homogeneous and isotropic; (ii) fluid density depends solely on groundwater salinity, with thermal effects considered negligible; (iii) the density of nanoplastic particles is assumed to be approximately equal to that of water, which is representative of neutrally buoyant or aged nanoplastic particles; (iv) the saturated zone is initially saturated with seawater, and rainfall infiltration is spatially uniform and temporally constant; (v) groundwater flow is simulated within a two-dimensional vertical profile of the strip island, leveraging the geometric symmetry of the idealized domain; and (vi) tidal influences are neglected, and constant head boundary conditions are imposed at the seawater interface.
This study presents an integrated numerical framework that extends a variable-density groundwater flow model for the unsaturated–saturated zone by incorporating salinity and nanoplastic transport modules. The nanoplastic transport model combines advective–dispersive transport with nanoplastic adsorption mechanisms. The resulting framework simultaneously simulates variable-density groundwater flow, dissolved salt transport, and nanoplastic migration via coupled advection–dispersion and adsorption processes. Governing equations for the variable-density flow and salinity transport components are available in the Sect. S1 in the Supplement.
Research suggests that nanoplastic transport is primarily influenced by particle movement and physical/physicochemical interactions with porous media surfaces (Al Harraq and Bharti, 2022; Ranjan et al., 2023; Ren et al., 2022; Waldschläger and Schüttrumpf, 2020). Particle movement is described in the equations as advection, diffusion and dispersion effects, while physicochemical interactions with porous media are characterized by mechanisms such as adhesion and detachment, straining on aggregates and individual particles, blockage, and maturation. The subsurface transport of nanoplastic particles is governed by an advection–dispersion equation, a framework established for nanoplastic migration that captures advection, dispersion, and adsorption processes (Liu et al., 2025):
where Cnp represents the concentration of nanoplastics in groundwater [M L−3], ρb denotes the bulk density of the aquifer medium [M L−3], s is the mass of nanoplastics attached per unit mass of solid [M M−1], Dnp is the hydrodynamic dispersion coefficient of nanoplastics [L2 T−1], and f is the source-sink term []. Katt is the first-order colloidal attachment coefficient [T−1], parameter λ represents the strain capacity of porous media [M M−1], Kdet is the first-order colloidal detachment coefficient [T−1], and Krip is the ripening kinetic rate coefficient [].
The adhesion of nanoplastics in porous media is described by the following governing equation:
where ψb denotes the adhesion state of nanoplastics in porous media [–], and smax represents the maximum mass of nanoplastics that can be retained per unit mass of porous medium [M M−1].
The variation in hydraulic conductivity as a function of porosity is characterized by the following relationship (Zheng, 2014):
where K is the hydraulic conductivity of the porous medium [L T−1], K0 is the hydraulic conductivity of the initial porous medium [L T−1], and θ0 is the porosity of the initial water-bearing medium [–].
The approximate analytical solution derived by Tang et al. (2021) describes the critical pumping rate preventing brine intrusion when pumping wells are located in the idealized strip island's central region. The theoretical maximum safe extraction rate is expressed as:
where ω is the infiltration rate at the upper surface of the unsaturated zone [L T−1], ρs is the seawater density [M L−3], ρf is the freshwater density [M L−3], d is the distance from the well to the lower boundary of the unsaturated zone [L], W is the half width of the idealized strip island [L], xm is the distance from the well to the centre of the idealized strip island[L].
Table 1Numerical Simulation Parameters for Variable-Density Flow and Nanoplastic Transport (Laboratory and Field Scales).
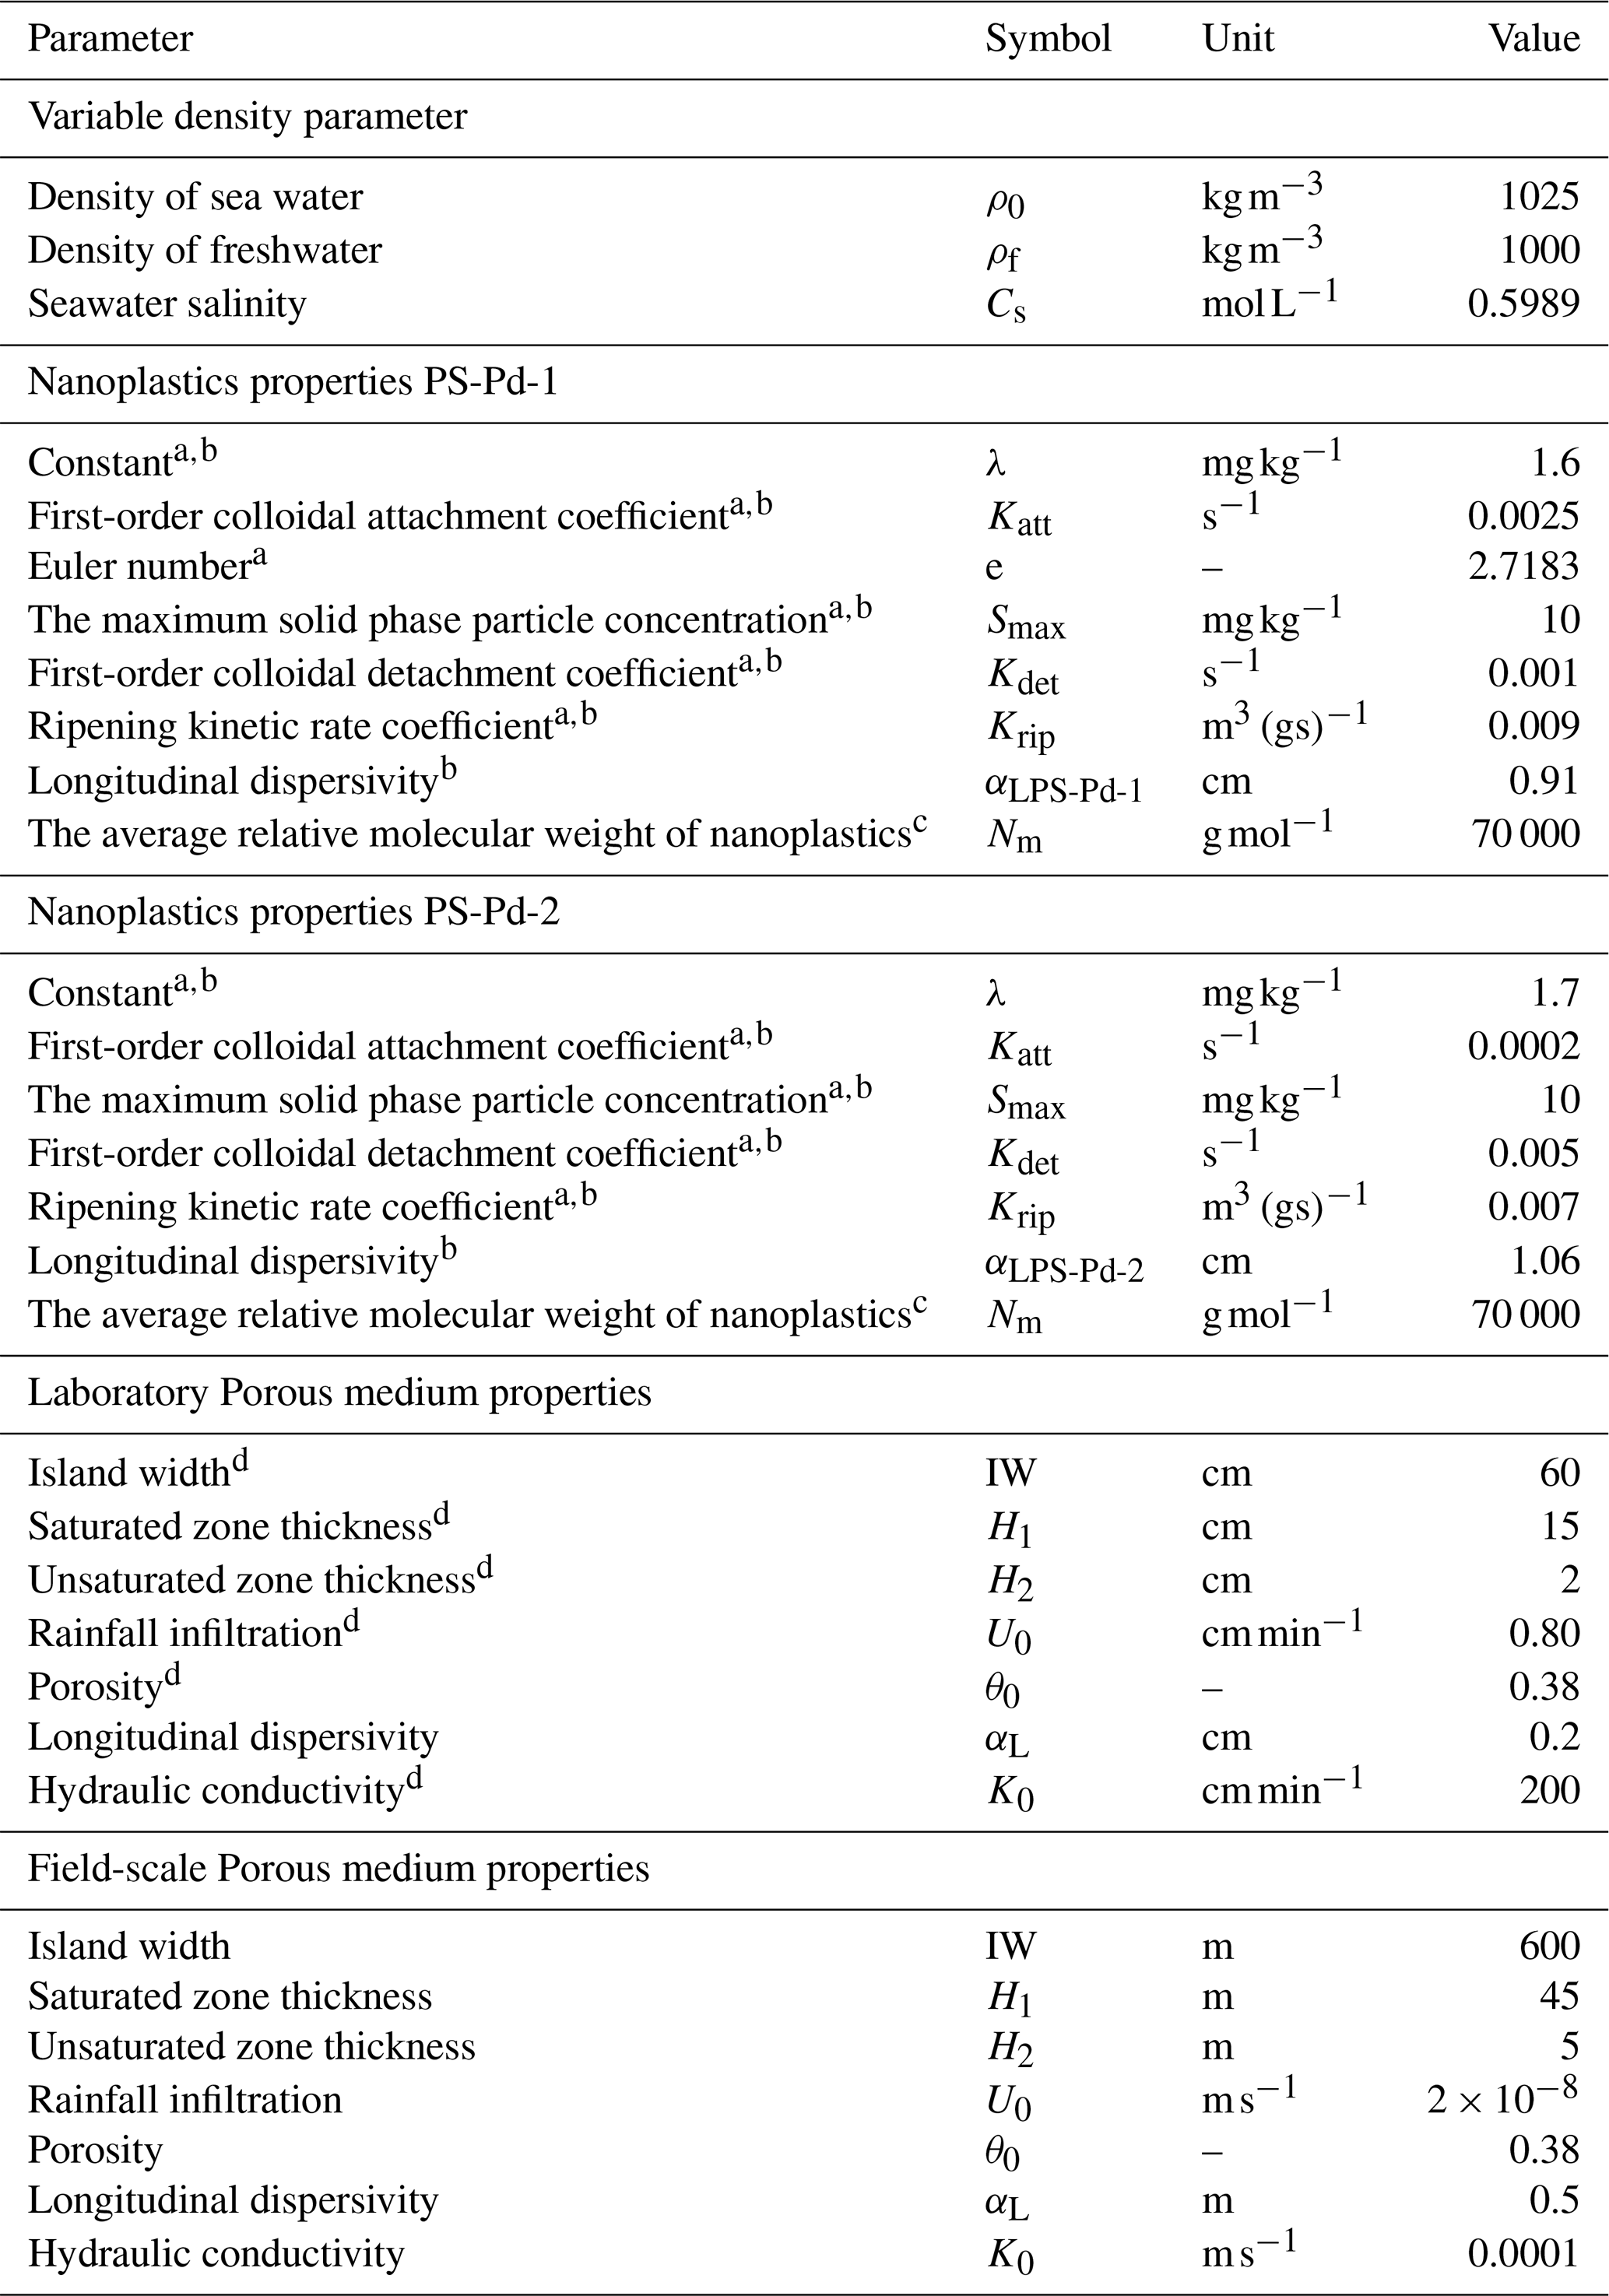
a Data from Liu et al. (2025). b Data inversion was performed based on the experimental data. c Data from Singh et al. (2025). d Experimental water pumping scenario from Tang et al. (2021).
2.2 Numerical Solution
The numerical simulation investigates the migration behavior of nanoplastics under pumping conditions in an idealized strip-island aquifer. The laboratory-scale model domain (60 cm × 17 cm) was constructed following the configuration established by Tang et al. (2021) (Fig. S4 in the Supplement), while a field-scale model (600 m × 50 m) was developed to assess field-level transport phenomena. Key simulation parameters are provided in Table 1. Model parameters calibrated from laboratory-scale experiments were extrapolated to the field scale assumed for the modeling study to evaluate the consistency of nanoplastic migration patterns across scales. At the ocean boundary, a constant head (Dirichlet) condition was imposed with a specified hydraulic head (H1) and a salt concentration of 34.7 g L−1; tidal influences were neglected. A constant flux (Neumann) condition was applied to the upper boundary, representing recharge at a rate U0. Figure 2 shows a vertical cross-section of a typical freshwater lens in an idealized island under single-well pumping conditions. Additional aquifer properties are summarized in Table 1.
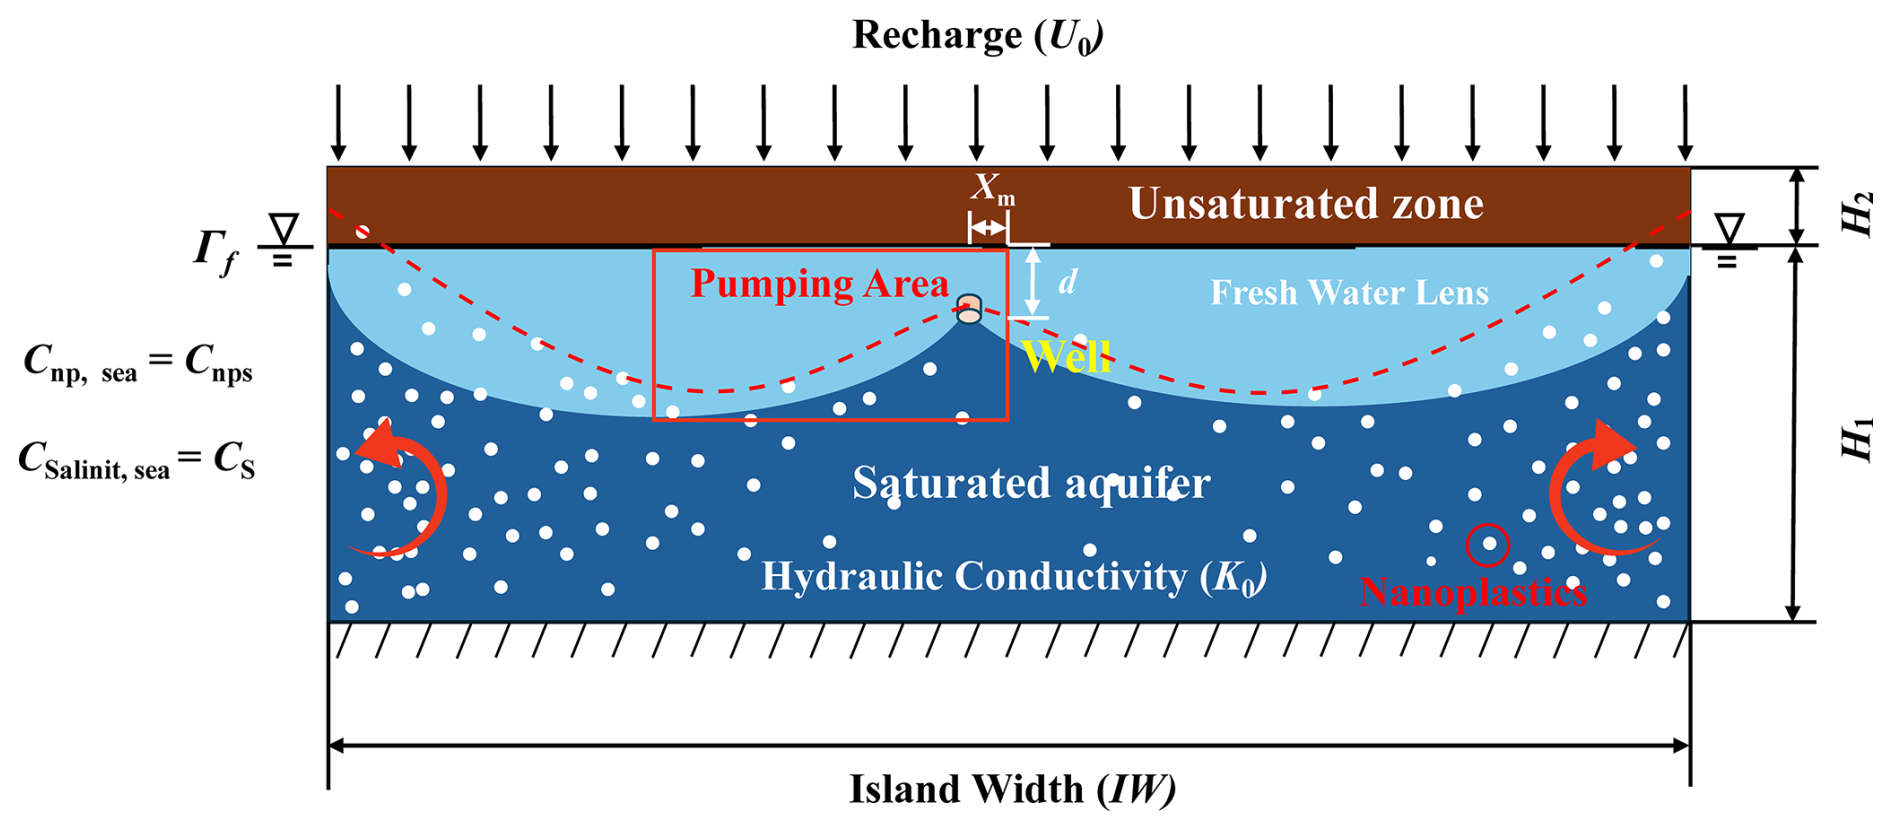
Figure 2Conceptual model of nanoplastic pollution in an idealized strip-island aquifer with central pumping. The model depicts an unsaturated zone (height H2) over a saturated zone (height H1). Freshwater lenses are shown in light blue and saline groundwater in dark blue. Key parameters include island width (IW), continuous recharge (U0), seawater salinity (Cs), and seawater nanoplastic concentration (Cnps).
The coupled governing equations for variable-density saturated groundwater flow and solute transport were solved numerically via COMSOL Multiphysics, with boundary conditions prescribed accordingly. The system of equations was solved iteratively using a preconditioned conjugate gradient (PCG) method with a relative tolerance of 1 × 10⁻⁴. Initial time steps of 0.001 s and 0.001 d were adopted for the transient analyses.
The computational domain for the laboratory-scale model was discretized into 63 928 triangular elements and 32 350 nodes, with a maximum element diameter of 2 mm. For the field-scale model, the domain was discretized into 30 000 quadrilateral elements and 30 651 nodes, with a maximum element diameter of 1 m. The selected mesh sizes, in conjunction with the hydrodynamic dispersion parameters, conformed to the Péclet number criterion to minimize numerical dispersion and ensure solution stability (Voss and Provost, 2002):
where Pe1 is the Péclet number in laboratory-scale [–], Pe2 is the Péclet number in field-scale [–], ΔL1 is the grid length in laboratory-scale [L], ΔL2 is the grid length in field-scale [L], v1 is flow velocity in laboratory-scale [L T−1], v2 is flow velocity in field-scale [L T−1], D1 is diffusion coefficient in laboratory-scale [L2 T−1], D2 is diffusion coefficient in field-scale [L2 T−1], αL1 is the longitudinal dispersivity in laboratory-scale [L], αL2 is the Longitudinal dispersivity in field-scale [L].
Stabilization times for laboratory and field simulations were determined using a convergence criterion: the system was considered stable when the relative change in wellhead salinity and nanoplastic concentration was less than 1 % over three consecutive time steps.
A continuous rainfall-driven model was developed to simulate freshwater lens dynamics and well extraction in an idealized island aquifer. The simulation comprises two distinct hydraulic phases: Phase I involves the formation of a stable freshwater lens under continuous rainfall infiltration and seawater intrusion; Phase II initiates groundwater extraction via a single pumping well, leading to the development of a stable saline upconing zone. In the laboratory-scale setup, the horizontal distance xm from the pumping well to the island center was set to 0, 2.5, 5, 7.5, 10, 12.5, 15, 17.5, and 20 cm. The vertical distance d from the well screen to the base of the saturation zone was defined as 0, 5, 10, 12, 15, 18, 20, and 25 mm. Hydraulic conductivity K0 values were assigned as 150, 175, 200, 225, and 250 cm min−1, with corresponding recharge rates U0 of 0.6, 0.7, 0.8, 0.9, and 1.0 cm min−1. For the field-scale scenario, the pumping well was positioned at a horizontal distance xm = 5 m from the island center, corresponding to a central well location. The hydraulic conductivity K0 was set to 1 × 10⁻⁴ m s−1, with a recharge rate U0 = 2 × 10⁻⁸ m s−1 (Tang et al., 2021).
2.3 Evaluation Indicators
Nanoplastic concentrations at the wellhead were monitored to evaluate the impacts of nanoplastics on island freshwater lens development projects. The seawater–freshwater interface of the freshwater lens was designated as 0.347 g L−1, corresponding to 1 % seawater salinity. Contemporary laboratory investigations typically utilize nanoplastic concentrations ranging from 10 µg L−1 to 100 mg L−1. Owing to constraints associated with nanoplastic preparation protocols and detection capabilities, the migration parameters of nanoplastics in this study were derived under an initial concentration of 10 mg L−1. Nanoplastics at 100–500 µg L−1 can exert widespread toxicity to marine organisms including bivalves, sea urchins, algae, and bacteria (Gonçalves and Bebianno, 2021). Adopting the 1 % seawater salinity threshold as a reference for nanoplastic concentrations facilitates comparisons of migration patterns between nanoplastics and dissolved salts under freshwater extraction scenarios in idealized strip-shaped islands, while incorporating the biological toxicity of nanoplastics as a critical constraint.
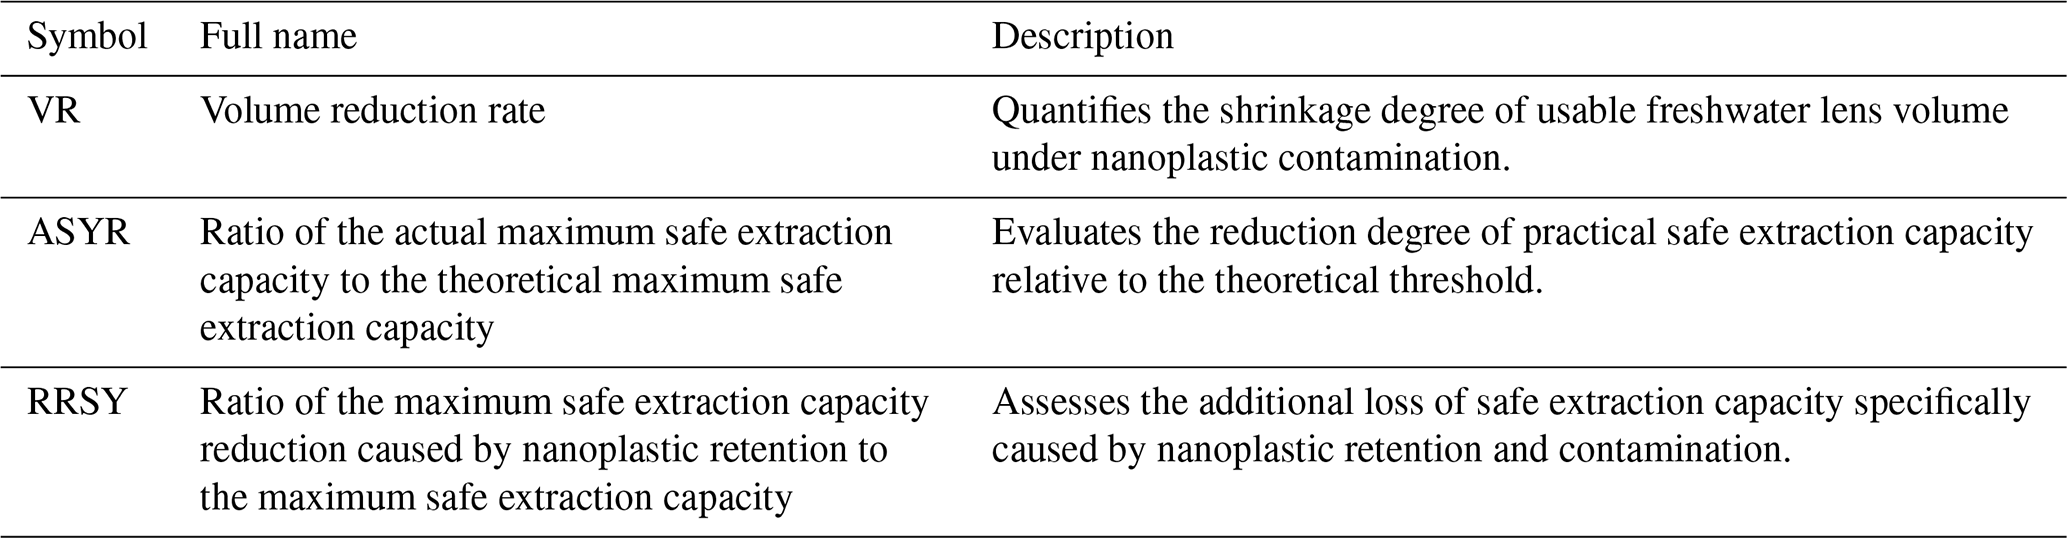
Concurrently, the distribution of nanoplastics within freshwater lenses is characterized by comparing the volume reduction rate (VR) of freshwater lenses over a given time period:
where Vw represents the volume of freshwater lenses surrounded by nanoplastics pollution [L3], V0 represents the volume of freshwater lenses surrounded by saline water [L3].
Accounting for the implications of the transition zone theory for groundwater pumping practices, the following indicator is defined: the ratio of the actual maximum safe extraction capacity to the theoretical maximum safe extraction capacity (ASYR):
where represents the actual maximum safe extraction volume [L3 T−1], represents the theoretical maximum safe extraction volume [L3 T−1]
Taking into account the potential reduction in groundwater extraction capacity induced by nanoplastic contamination, the following indicator is defined: the ratio of the maximum safe extraction capacity reduction caused by nanoplastic retention to the maximum safe extraction capacity (RRSY):
where QSmaxrepresents the maximum safe extraction volume without nanoplastic influence [L3 T−1].
Table 2 provides a systematic description of the representative roles of the three evaluation metrics used in this paper.
2.4 Model Calibration
This study examined the migration patterns of two synthetic nanoplastics (PS-Pd-1 and PS-Pd-2) that exhibit contrasting hydrophobicity. The detailed synthesis protocols are available in Supplement (the Sect. S2). To ensure model accuracy, migration parameters for nanoplastics in quartz sand (Table 1) were validated using column experiment data from Liu et al. (2025). The experimental setup and methodology are detailed in Sect. S3 and Fig. S1, with calibration processes and results illustrated in Figs. S2 and S3. The primary objective was to quantify how differential nanoplastic-solid phase interactions influence contamination levels in freshwater lenses (Amirmoshiri et al., 2020; Wang et al., 2021). As summarized in Table 1, PS-Pd-1 exhibits strong solid-phase adsorption capacity, whereas PS-Pd-2 demonstrates weaker adsorption. Given potential scale-dependence in nanoplastic transport parameters, current research remains largely focused on laboratory-scale investigations (Johnson, 2020; Li et al., 2021; Liu et al., 2025).
A single-well extraction scheme was implemented in the central region of an idealized strip island aquifer. The maximum safe extraction rate, calculated based on sharp-interface theory, served as the baseline scenario. However, the applicability of this theoretical maximum for island freshwater lenses requires critical re-evaluation, as previous sharp-interface analytical and numerical studies have largely neglected the transition zone formed by salinity dispersion and diffusion – a factor addressed in only limited corrections (Coulon et al., 2022). To determine a more accurate maximum safe extraction rate, a series of numerical simulations with predefined pumping rates were conducted to calibrate both laboratory-scale and field-scale conceptual models.
Although Tang et al. (2021) provided preliminary numerical validation via Fig. S4a and b, their simulations omitted the effects of the unsaturated zone and the salinity transition zone. In contrast, our validation-based simulations (Fig. S4c and d), which incorporate the unsaturated zone and employ dispersion parameters consistent with Chen et al. (2024a), indicate that the 1 % salinity contour exceeds the well bottom elevation by 2.03 m. This signifies that pumping-induced salinity surpasses regulatory thresholds, necessitating a reduction in extraction volume.
The relationship between well salinity and the extraction volume ratio (actual to theoretical) in numerical simulations is illustrated in Fig. 3. Results confirm that the presence of the unsaturated and transition zones reduces the extraction capacity to 50 %–60 % of the theoretical maximum (). Specifically, under laboratory conditions, the maximum safe extraction capacity decreased to 61 % and 53 % of for shallow (d = 0 cm) and deep (d = 1.5 cm) extraction scenarios, respectively (Fig. 3a). Corresponding field-scale simulations showed reductions to 57 % and 51 % of for shallow (d = 0 m) and deep (d = 15 m) extraction. The temporal evolution of well salinity during freshwater lens re-stabilization (Fig. 3b) further demonstrates that salinity stabilization occurs within 12 min at the laboratory scale but requires approximately 4.5 years at the field scale, highlighting significant temporal disparities influenced by scale effects.
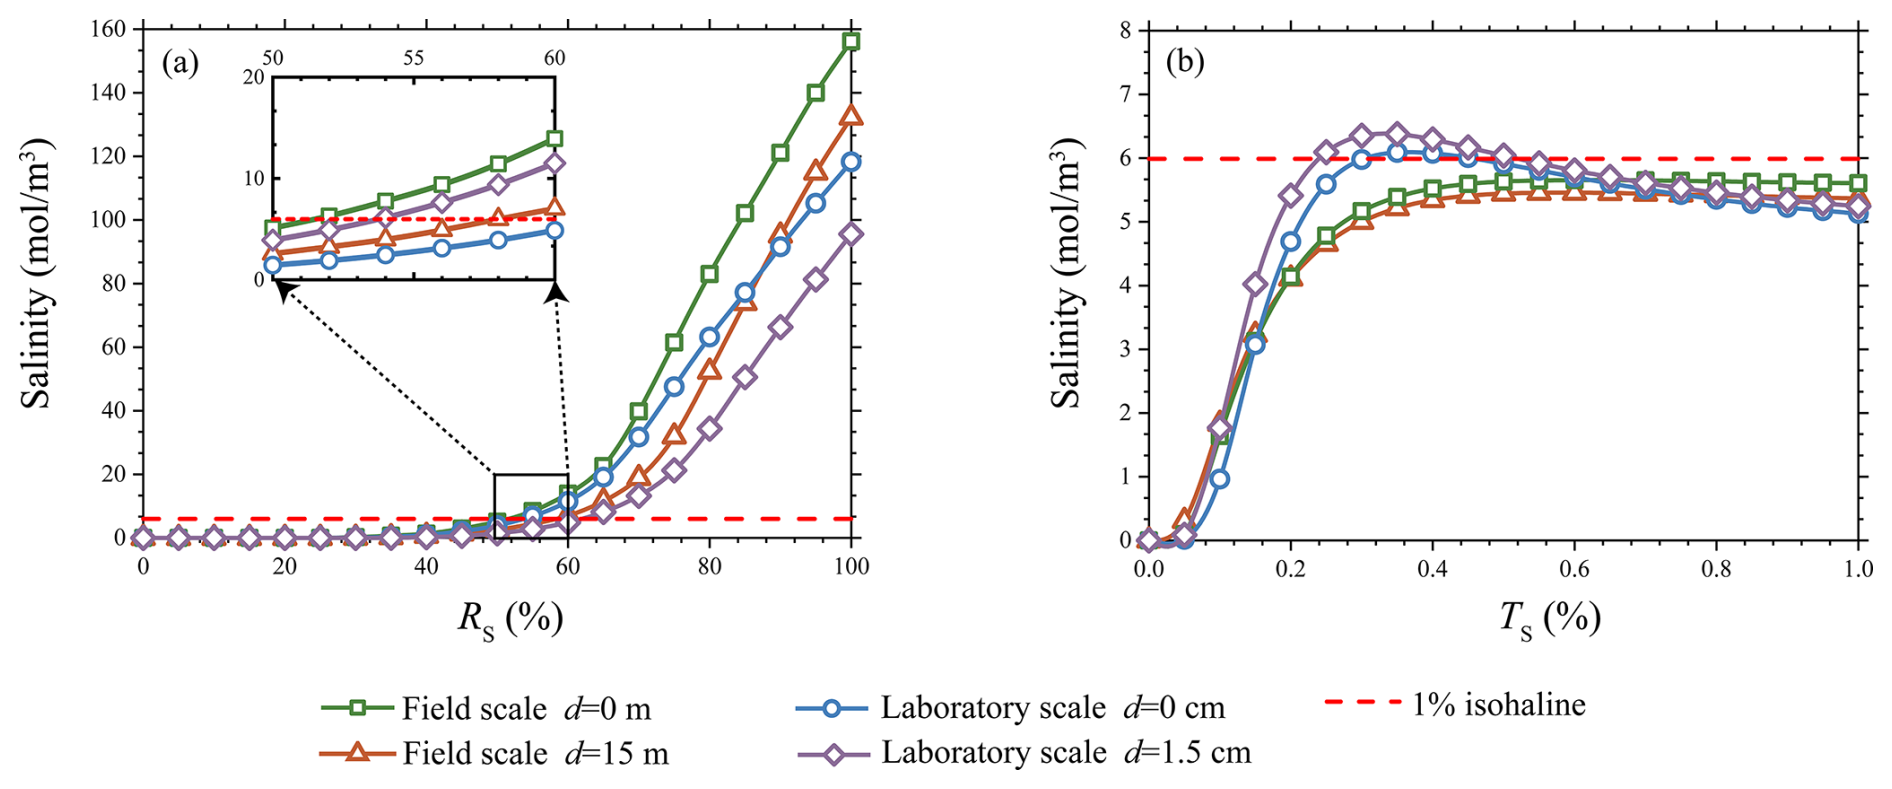
Figure 3Variations in well salinity as a function of the ratio of extraction volume to theoretical maximum (RS) and the ratio of time to theoretical equilibrium time (TS) during pumping at different depths in numerical simulations , measured at both field and laboratory scales: (a) Well salinity versus extraction volume, with the magnified region indicating the extraction volume range where well concentration approaches the 1 % isohaline; (b) Temporal concentration variations for wells with salinity near the 1 % isohaline in panel (a).
3.1 Distribution Patterns of Nanoplastics Under Pumping Conditions
Hydrophobic nanoplastics (NPs) were selected as the primary research focus of this study. Section S4 and Fig. S5 demonstrate that hydrophobic nanoplastic particles exhibit higher mobility and pose more significant hazards than hydrophilic counterparts under simulated single-well pumping conditions.
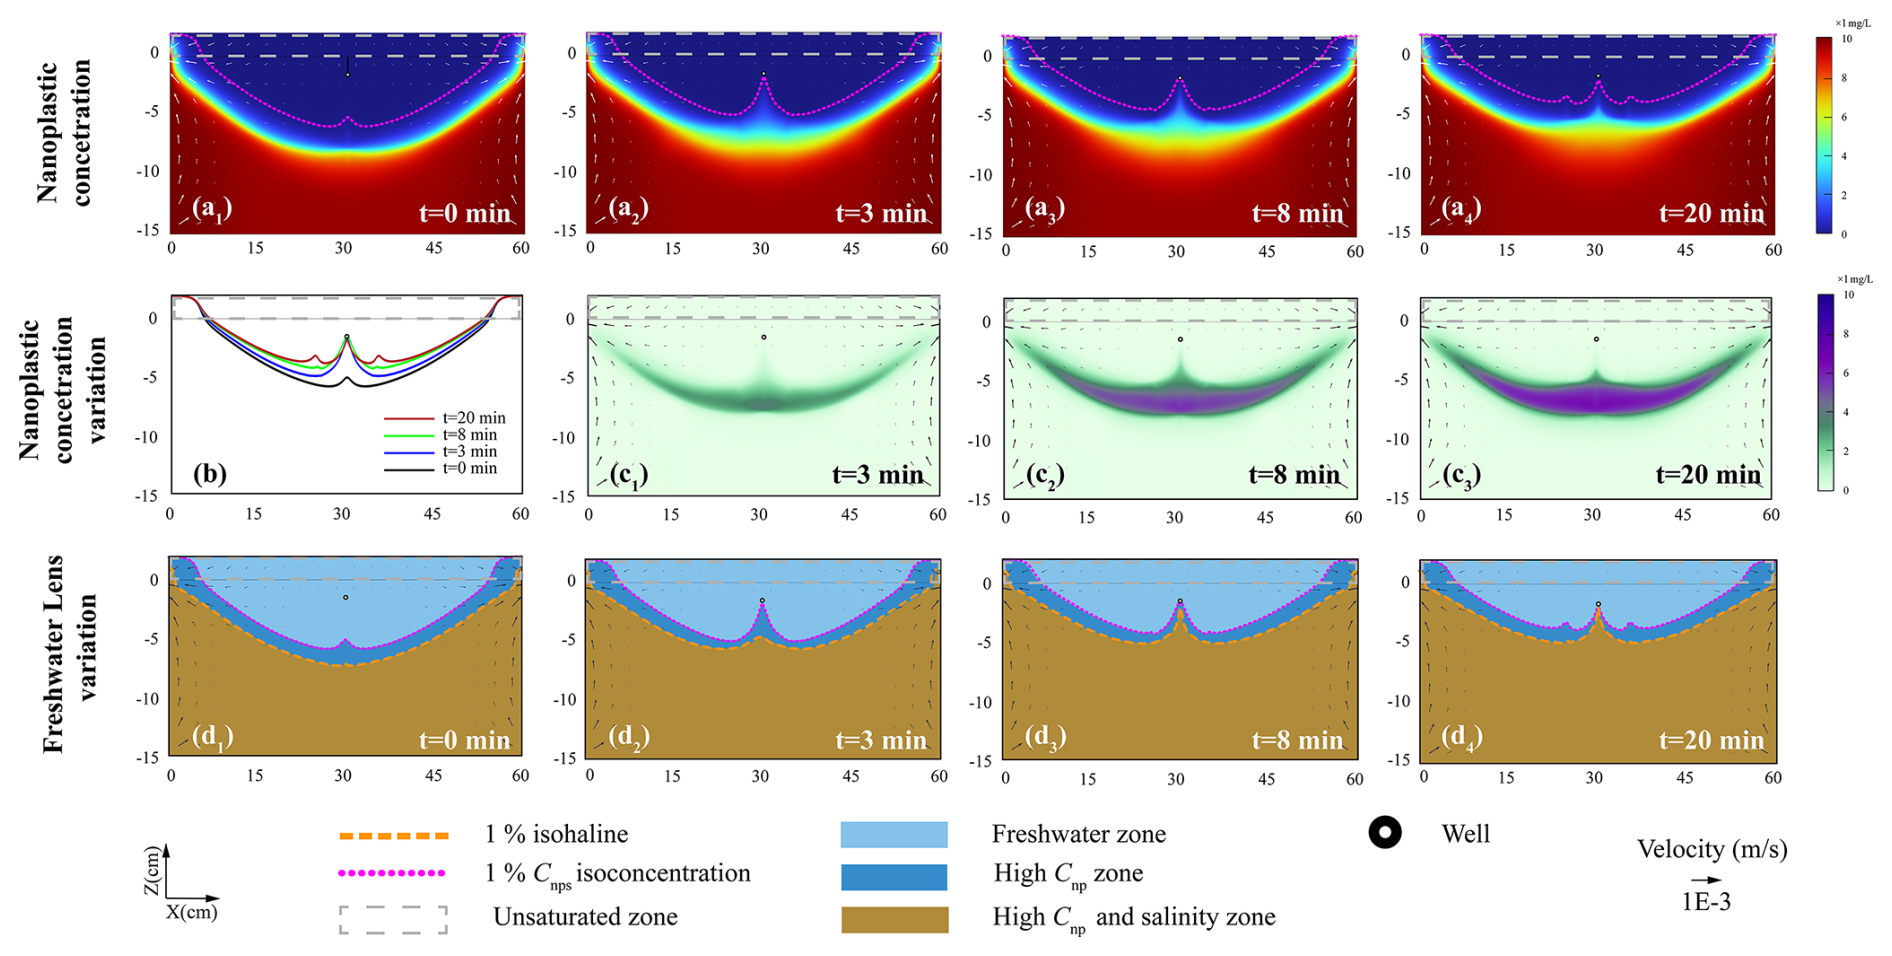
Figure 4Distribution and concentration dynamics of PS-Pd-2 hydrophobic nanoplastics and corresponding freshwater lens alterations at the laboratory scale (60 cm × 17 cm) during pumping (RS = 53 %) in numerical simulations: (a1–a4) freshwater lenses demarcated by the 1 % isoconcentration line of PS-Pd-2 hydrophobic nanoplastics at 0, 3, 8 and 20 min post-pumping, (b) temporal variation of the 1 % Cnps isoconcentration line, (c1–c3) net concentration variations relative to the baseline (0 min) at 3, 8 and 20 min post-pumping, (d1–d4) spatial offset between the 1 % isohaline and 1 % Cnps isoconcentration line around the freshwater lens.
Figure 4a1–a4 illustrates an “upper cone” phenomenon in nanoplastic concentrations during pumping, analogous to that of salinity. Figure 4a1 reveals that highly dispersive nanoplastics may form anomalous distributions in the central banded region of the island – a zone previously referred to as the “stagnation zone” (Wang et al., 2023). Nearshore aquifers on both sides of the island undergo intense convection, driven by groundwater discharge to the sea and seawater intrusion induced by density currents. At the laboratory scale, this convective zone spans approximately 10 cm; at the field scale, it extends to around 100 m, where groundwater Darcy velocities exceed 1 × 10⁻³ m s−1. In contrast, velocities within the central “stagnation zone” remain below 1 × 10⁻⁸ m s−1. This zone is dominated by weak convection, with material transport in groundwater primarily governed by dispersion and interactions with the solid phase.
Figure 4b presents dynamic nanoplastic isoconcentration lines at the wellhead, where concentrations first increase and then decrease – indicating that wellhead nanoplastics are influenced by the “stagnation zone”. The discrepancy in migration behavior between nanoplastics and dissolved solutes stems primarily from their distinct physicochemical properties: as colloidal particles, nanoplastic migration is regulated not only by advection–dispersion but also by particle-medium interactions (e.g., adsorption–desorption, clogging, and filtration). Figure 4c1–c3 depicts variations in nanoplastic concentrations. Considering the nanoplastic concentration threshold resulted in an additional 37.48 % reduction in the usable freshwater lens area, while the maximum depth of freshwater zones affected by nanoplastic contamination increased by 0.030 m.
Figure 4d1–d4 compares the distribution patterns of salinity and nanoplastics, revealing that nanoplastics exceeding 1 % of the critical nanoplastic concentration (Cnps) are concentrated within freshwater lens layers. With the disappearance of the original “stagnation zone”, a new flow field transition zone is formed, triggering the emergence of a new “stagnation zone”. The proportion of the freshwater lens occupied by the nanoplastic transition zone (dark blue areas in Fig. 4d1–d4) increased from 30.27 % to 41.24 %. Compared to dissolved solutes, nanoplastics possess larger hydrodynamic diameters and unique surface properties, leading to distinctive migration patterns in porous media.
Figure 5a presents the vertical concentration profile of nanoplastics at the wellhead, further validating the aforementioned mechanism. Prior to pumping initiation, the nanoplastic transition zone was situated 0.07–0.10 m below the well bottom. Following pumping initiation, the transition zone underwent a rapid upward migration and expansion to 0.02 m below the well bottom. Thirty minutes post-pumping, although the transition zone exhibited a slight recession, a stable transition zone was maintained at 0.06 m below the well bottom, while a new steep transition zone formed at 0.03 m. Nanoplastic concentrations at the wellhead increased markedly within the first 4 min, started to decline after 8 min, stabilized at 30 min post-pumping, and ultimately converged with the concentration trends of chloride (Cl−), indicating that solute and colloidal transport are governed primarily by convection. The observed transport behavior can be interpreted through the lens of effective dispersion parameters. In porous media transport modeling, the macroscopic dispersion coefficient in advection–dispersion equations serves as an effective parameter that implicitly captures the integrated effects of various pore-scale processes, including particle-pore interactions, flow path tortuosity, and temporary retention at pore throats. While these microscopic processes are not explicitly resolved in the current continuum-scale model, their integrated effects are reflected in the calibrated dispersion parameters.
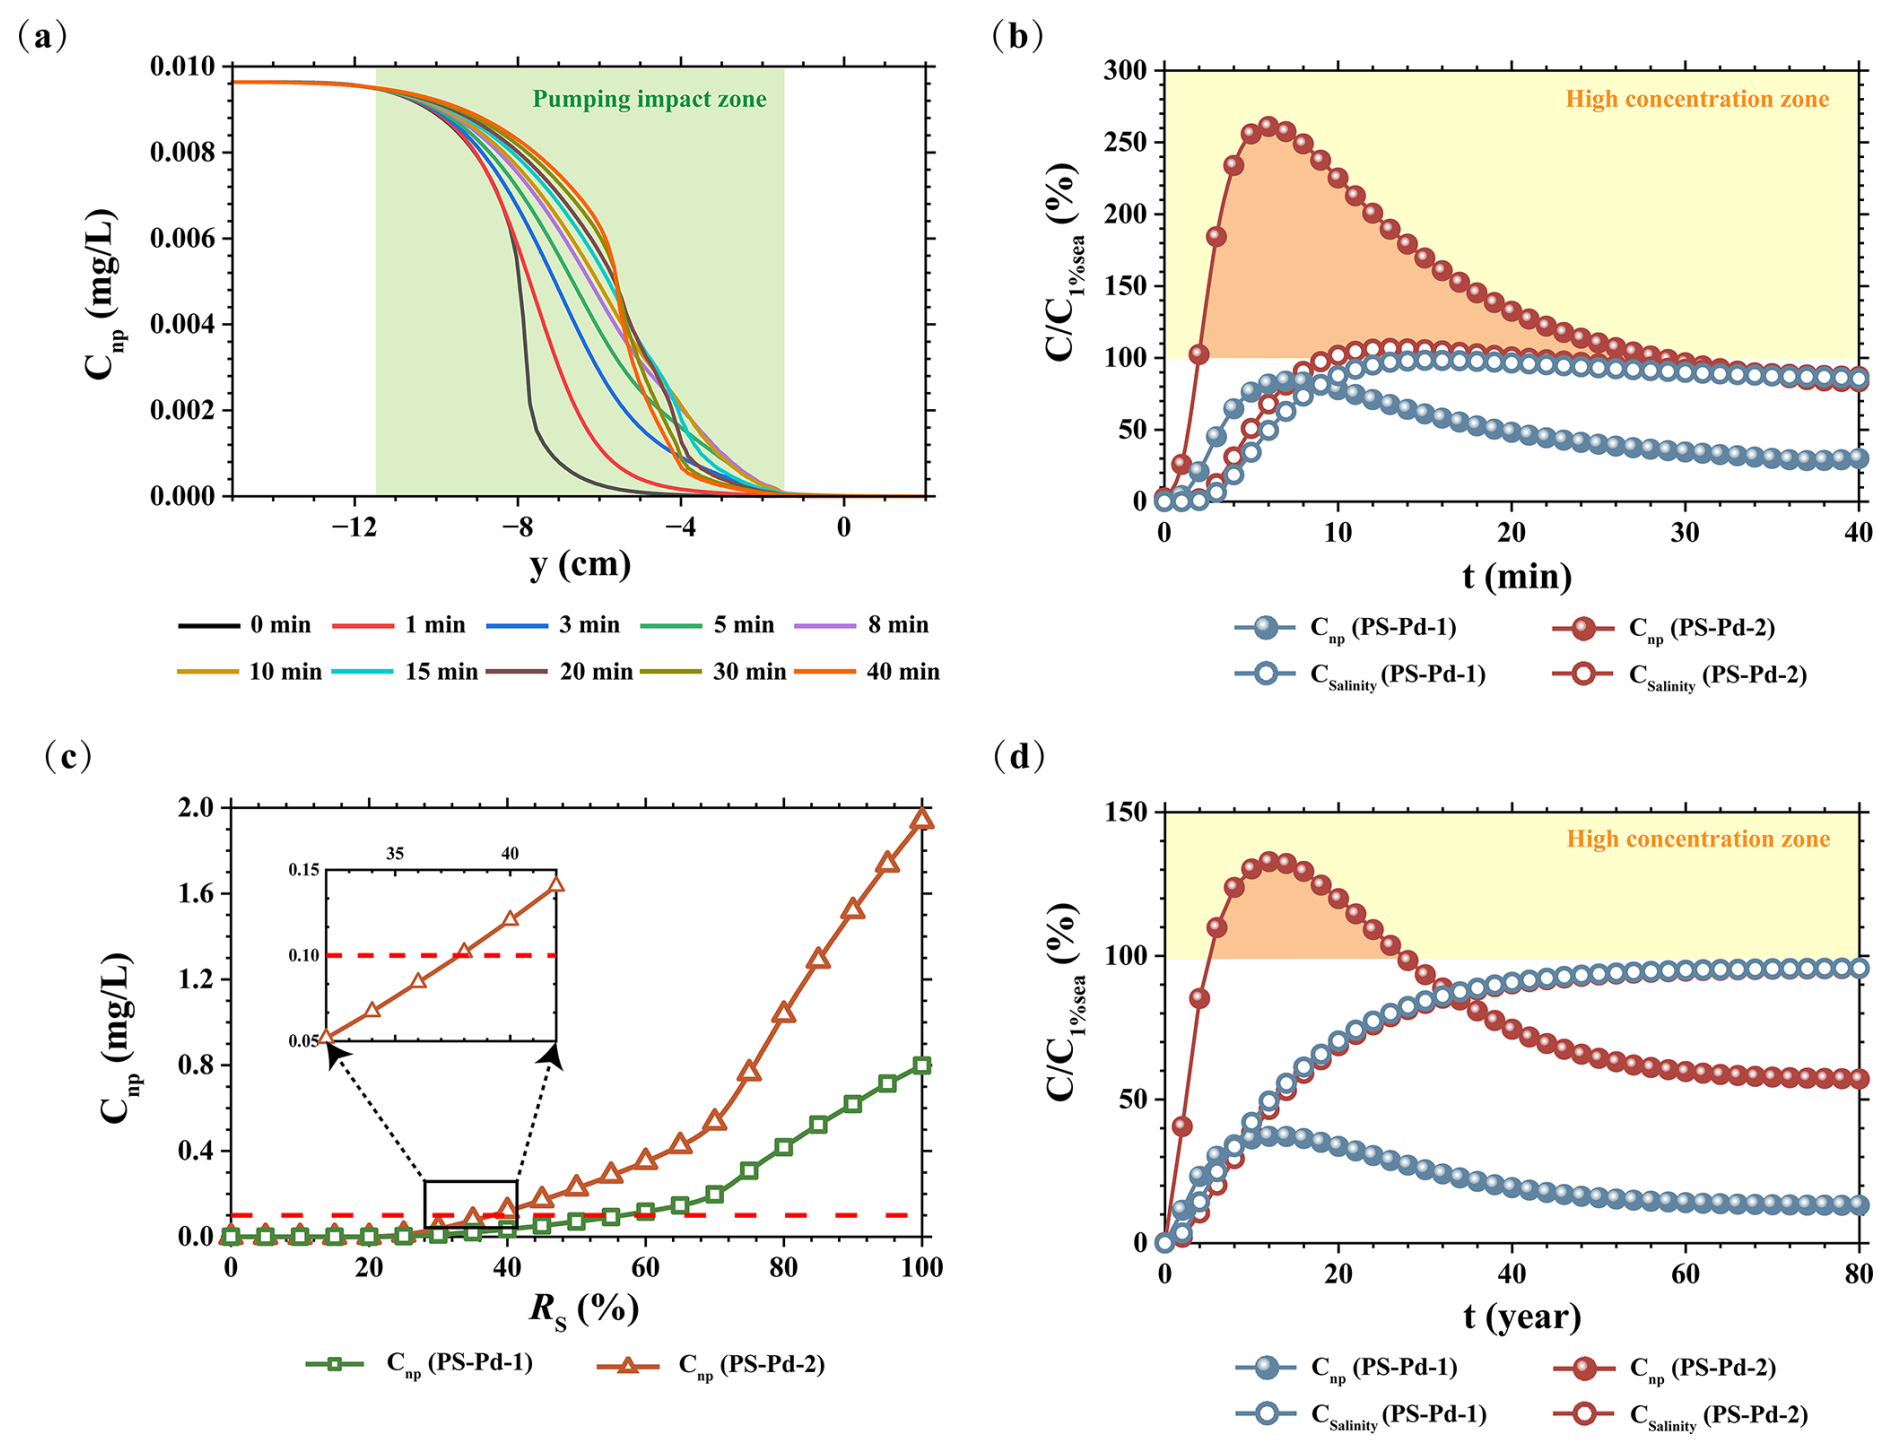
Figure 5Concentration dynamics at laboratory and field scales and their responses to pumping rate adjustments in numerical simulations: (a) 1 % Cnps isoconcentration line variation along the central axis (x = 30 cm) at laboratory scale; (b) Temporal variations in salinity and nanoplastic concentrations for hydrophilic and hydrophobic nanoplastics at laboratory scale; (c) Well nanoplastic concentration as a function of pumped volume-to-theoretical maximum ratio (RS) for groundwater nanoplastics of distinct hydrophilic-hydrophobic properties; (d) Temporal variations in well salinity and nanoplastic concentrations for hydrophilic and hydrophobic nanoplastics at field scale.
Figure 5b illustrates the temporal concentration variations of hydrophilic and hydrophobic nanoplastics, both of which exhibit an initial increase followed by a subsequent decrease. During the initial pumping phase (0–6 min), high-concentration nanoplastics in the immediate vicinity of the well were the primary fraction extracted by pumping, leading to a sharp concentration increase to a peak of 2.489 % Cnps. With prolonged pumping (6–32 min), peripheral groundwater with relatively low nanoplastic concentrations gradually entered the pumping-affected zone. The original stagnation zone was reconfigured under the influence of pumping, with new stagnation zones emerging on both sides of the well. The system eventually attained a state of dynamic equilibrium after 32 min of pumping, with nanoplastic concentrations stabilizing at a steady level. Notably, salinity variations under distinct contamination scenarios involving hydrophilic and hydrophobic nanoplastics also influenced this process. This phenomenon is hypothesized to originate from an approximate 40 % reduction in hydraulic conductivity, which is induced by the solid-phase enrichment of hydrophilic nanoplastics in specific central regions of the study domain.
With respect to the distinct distribution characteristics of wellborne hydrophobic nanoplastics presented in Fig. 5b, which diverge from those of salinity, the application of a 1 % concentration threshold to nanoplastics (consistent with the salinity threshold) results in wellhead nanoplastic concentrations exceeding this criterion for more than 80 % of the duration prior to the attainment of a stable system state. To mitigate the adverse impacts of the extensive dispersion of hydrophobic nanoplastics on the quality of pumped groundwater, Fig. 5c shows the relationships between wellhead nanoplastic concentrations and cumulative pumped water volume for hydrophilic and hydrophobic nanoplastics. Under the theoretical maximum safe pumping rate, hydrophobic nanoplastics accumulate at the wellhead to a concentration of 1.939 mg L−1 during the initial pumping phase. To reduce the initial wellhead nanoplastic concentrations to below the 1 % Cnps threshold, the actual maximum safe pumping rate must be further reduced to 37 % of the theoretical maximum safe pumping rate. Figure 5d indicates that a similar phenomenon is observable in wellhead nanoplastic concentrations at the field scale, where nanoplastics at such concentrations are still rapidly entrained into the pumping well – indicating that the enrichment mechanism driven by high nanoplastic dispersibility remains valid at the field scale. High-concentration nanoplastic influxes at the wellhead persisted from years 5 to 28 at the field scale. Conversely, nanoplastic concentrations in the upper cone region are comparatively lower, with those in the island's pumping wells reaching only 1.329 % Cnps. A detailed elucidation of the underlying mechanisms for this phenomenon is presented in Sect. 3.2.
3.2 Scale Effects on Nanoplastic Transport
In field-scale simulations, the background concentration of hydrophobic nanoplastics was set to 1 µg L−1 (Cnps). Dispersion parameters were adjusted based on scaling-up experience (Gelhar et al., 1992), with the corresponding simulation results presented in Fig. 6. Figure 6a1 shows that following stabilization of the freshwater lens, the 90 %–10 % Cnps transition zone in the central island region thickened to more than 10 m, yet no prominent dispersion-driven upward cone formed in the island's core area. Scale effects exert their influence primarily in two aspects: with increasing scale, the heterogeneity of the aquifer medium becomes more complex, which may mask the unique migration behavior of nanoplastics. Additionally, streamline curvature is reduced and flow velocity distributions are more homogeneous at larger scales, thereby reducing the influence of local streamline curvature on particle migration.
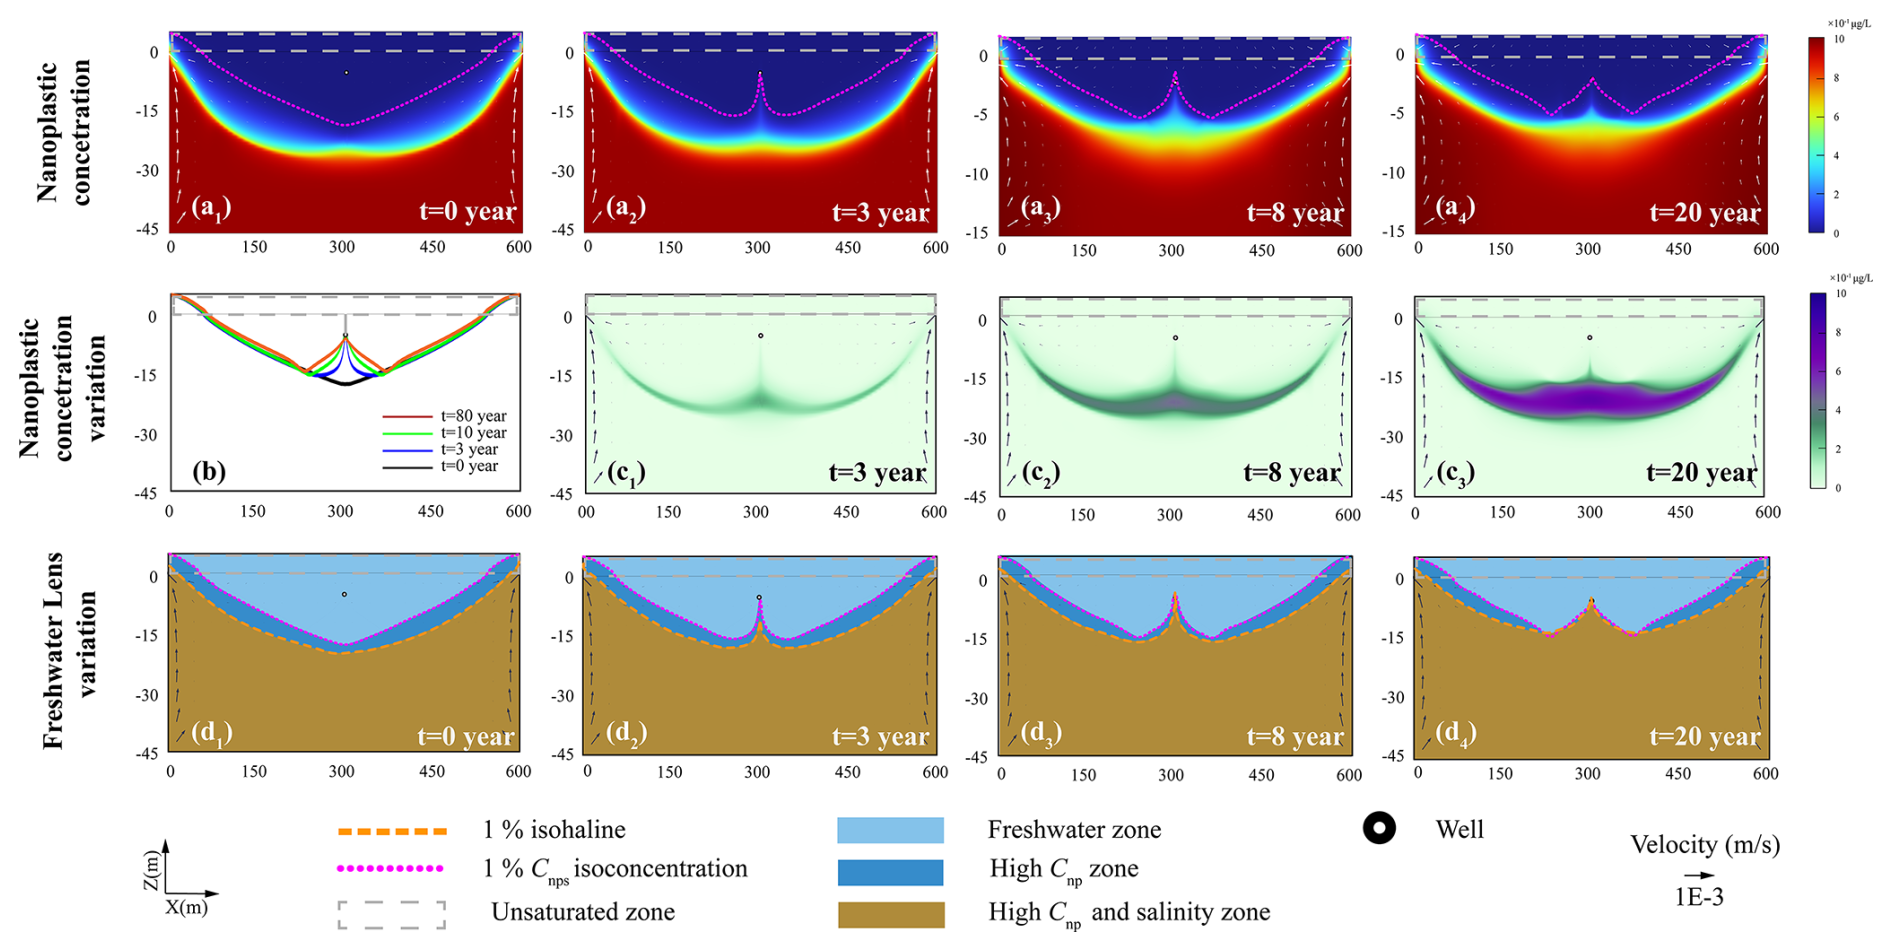
Figure 6Hydrophobic nanoplastic concentration dynamics and corresponding freshwater lens alterations at field scale (600 m = 50 m) during pumping (RS = 51 %) in numerical simulations: (a1–a4) Freshwater lenses demarcated by the 1 % PS-Pd-2 nanoplastic isoconcentration line at 0, 3, 8 and 20 years post-pumping; (b) 1 % Cnps isoconcentration line variation; (c1–c3) Net nanoplastic concentration variations relative to the initial time point (0ỹear) at 3, 8 and 20 years post-pumping; (d1–d4) Spatial offset between the 1 % isohaline and 1 % Cnps isoconcentration line around the freshwater lens.
Upon pumping initiation at the field scale, the depth of the freshwater lens decreased from 20.168 to 13.785 m, while the maximum depth of the freshwater lens encircled by nanoplastics decreased from 17.943 to 14.610 m. Figure 6c1–c3 depicts variations in nanoplastic concentration within the lens: the volumetric fraction of nanoplastics occupying the freshwater lens decreased from 31.48 % to 23.40 %, a trend that deviates from the increasing pattern observed at the laboratory scale. Figure 6d1–d4 reveals the existence of a ∼ 3 m-thick residual nanoplastic-bearing layer within the freshwater lens, with concentrations at 1 %–5 % of the nanoplastic concentration in seawater. Upon stabilization of pumping, the transition zone migrated upward toward the lateral high-velocity discharge zones but no new upward cone was generated. At the field scale, the enhancement of nanoplastic dispersion relative to solute dispersion was no longer pronounced, a phenomenon likely due to improved flow stability and inherent scale effects. In addition, the residence time of colloidal filtration and entrainment processes is extended at this scale, which may consequently modify the final spatial distribution of nanoplastics.
3.3 Sensitivity Analysis
Four factors were selected for analysis, with the VR,ASYR, and RRSY metrics employed to evaluate nanoplastic contamination in freshwater and freshwater lenses, as well as its implications for pumping operations.
Figure 7a1 and b1 demonstrates that nanoplastic dispersivity exhibits a significant correlation with VR, and nanoplastic dispersivity exerts a notable influence on pumping efficiency. When nanoplastic dispersivity is lower than that of solutes, the distribution range of nanoplastics closely approximates that of solutes, resulting in a narrow transition zone, while is exclusively governed by salinity. When nanoplastic dispersivity equals that of solutes, the nanoplastic-constrained freshwater lens zone nearly overlaps with the salinity-defined freshwater lens zone. As dispersivity increases to 10 times that of solutes, the volume of freshwater lenses decreases by approximately 30 %. When the effective dispersivity of nanoplastics exceeds 17 times that of dissolved salts, the expanded dispersion range causes the 1 % Cnps isoconcentration line to cover the wellhead area. The high sensitivity of nanoplastic behavior to dispersivity stems from their particulate nature: nanoplastics migrate not only via hydraulic dispersion but also through mechanisms such as Brownian motion, gravitational settling, and media interception. High dispersivity reflects the selective migration capacity of nanoplastics within complex pore structures, which is closely associated with their surface properties and hydrodynamic characteristics.
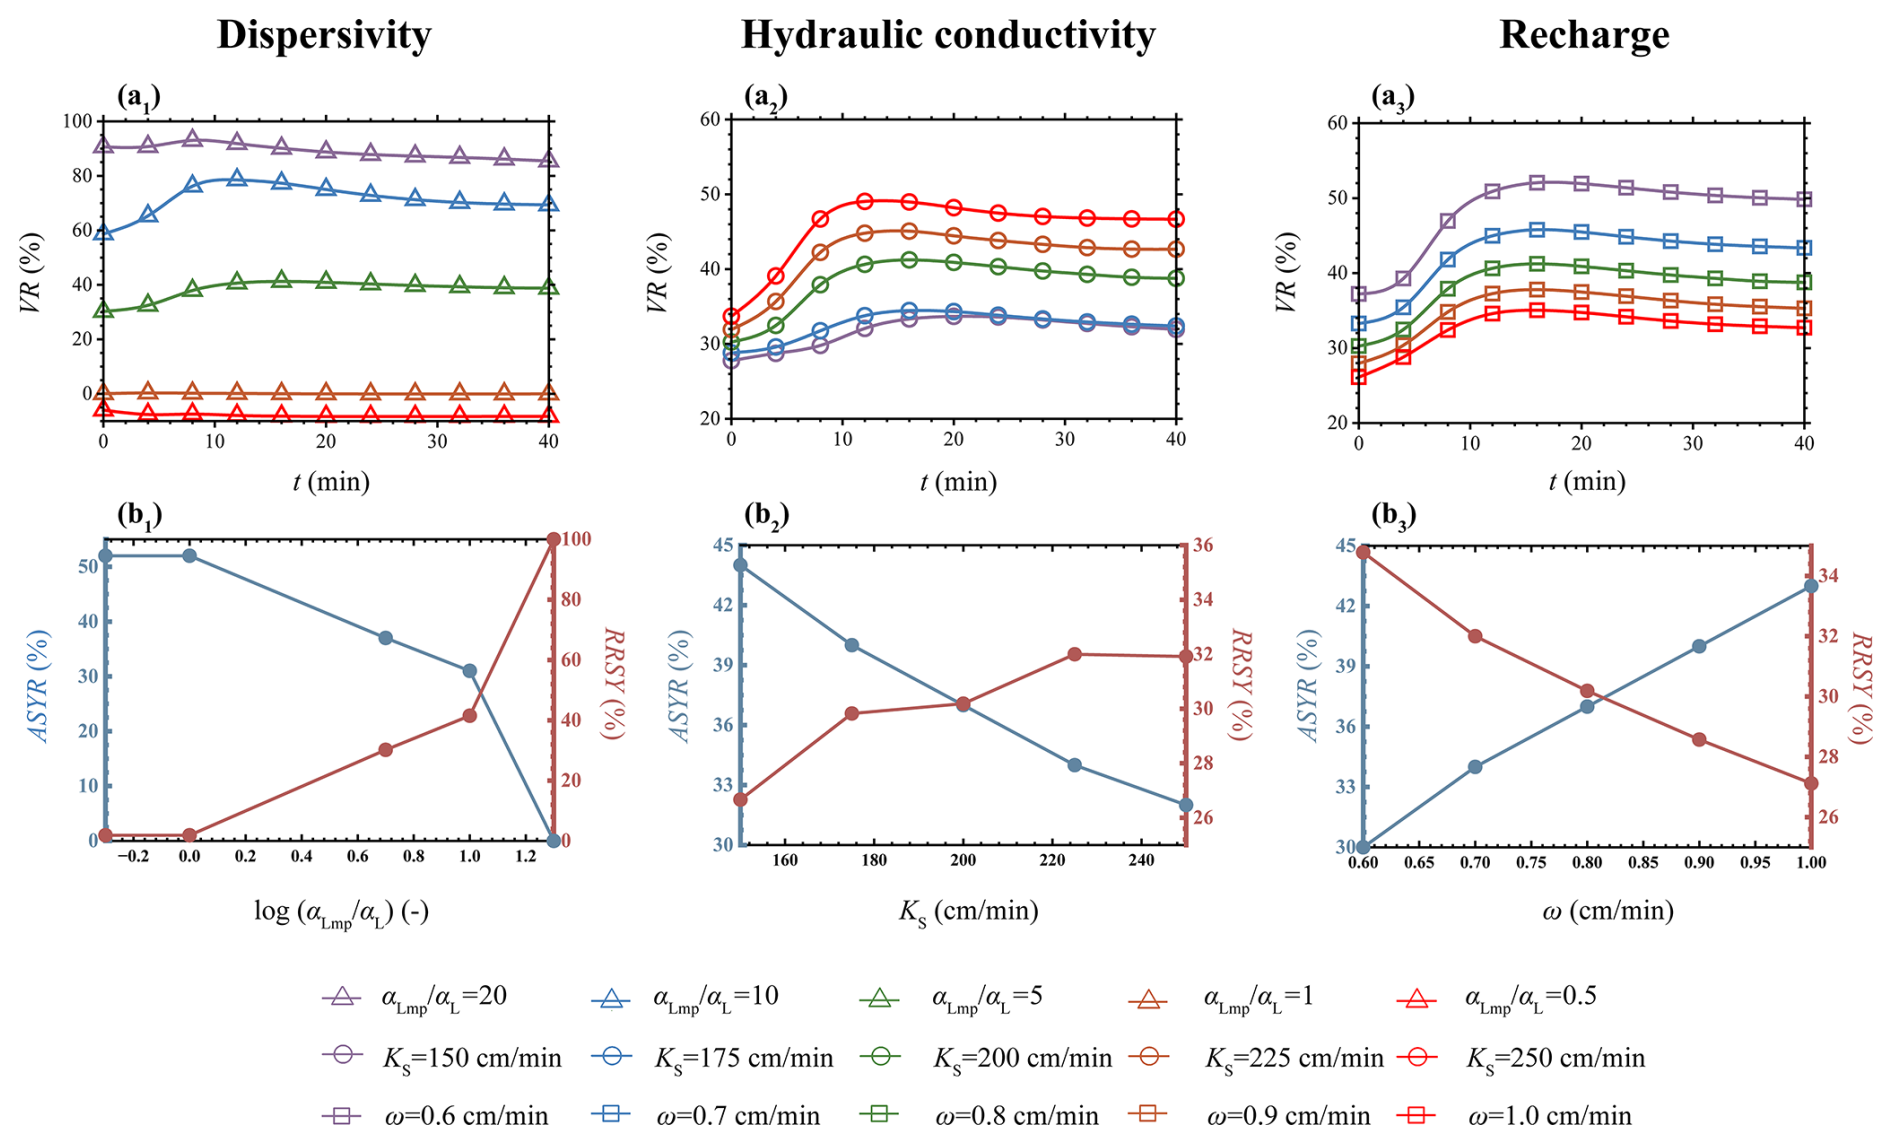
Figure 7The volume reduction rate of freshwater lenses (VR), the ratio of actual maximum safe extraction capacity to theoretical maximum safe extraction capacity (ASYR), and the ratio of maximum safe extraction capacity reduction due to nanoplastic retention to maximum safe extraction capacity (RRSY) versus (a1–a3) dispersivity, (b1–b3) hydraulic conductivity, and (c1–c3) recharge rate in numerical simulations.
Figure 7a2 and b2 reveals that VR gradually increases with rising hydraulic conductivity. At a hydraulic conductivity of 250 cm min−1, 46.68 % of the freshwater lens area is occupied by high-concentration nanoplastics. Under pumping conditions, both high hydraulic conductivity and high-permeability media result in a significant reduction in the usable portion of freshwater lens layers surrounded by nanoplastics. Aquifer hydraulic conductivity is another critical parameter regulating solute migration and retention. Previous studies have demonstrated that higher hydraulic conductivities result in reduced freshwater lens volumes and correspondingly decreased groundwater availability (Bailey and Jenson, 2014; Cui et al., 2021; Gao et al., 2025). The spatial distribution and magnitude of freshwater lenses surrounded by nanoplastics are consistent with these findings. High hydraulic conductivity accelerates freshwater discharge on both sides of the island, reducing the area where freshwater lenses can maintain equilibrium. For nanoplastics, increased hydraulic conductivity enhances flow velocity and convective transport capacity, thereby facilitating their intrusion into freshwater lenses.
Recharge rates were used to represent effective rainfall infiltration on the island. Figure 7a3 shows that recharge significantly reduces the spatial distribution density of nanoplastics within freshwater lenses, with this effect being pronounced both before and after pumping. Increased recharge leads to a decrease in VR; when recharge rises to 1.0 cm min−1, VR declines to 33 %. Conversely, when recharge drops below 0.65 cm min−1, the final variation in VR also weakens, suggesting that nanoplastic concentrations are more difficult to mitigate with increased pumping intensity. Figure 7b3 illustrates that enhanced recharge reduces the volume occupied by high-concentration nanoplastics in freshwater lenses, significantly increasing exploitable freshwater volume and alleviating the impact of nanoplastics on maximum safe pumping rates. Previous studies indicate that the volume and thickness of island freshwater lenses are positively correlated with precipitation (Zheng et al., 2025). The “flushing effect” of recharge on nanoplastic distribution likely operates through two mechanisms: first, recharge acts as the main source of freshwater storage in lenses. As the freshwater lens area expands, the thick transition zone formed by hydrophobic nanoplastics remains unaffected by convection and maintains a constant thickness, leading to a reduced proportion of nanoplastics despite unchanged total volume. Second, increased recharge may expand the strong convection zones on both sides of the seawater boundary, shrinking the central “stagnation zone” and thereby relatively weakening dispersion effects.
Among the analyzed media and environmental conditions, dispersivity emerges as the key parameter governing nanoplastic retention behavior in freshwater lenses, with high dispersivity exerting the most pronounced inhibitory effect on .
Figure 8a and b present the theoretically derived maximum safe pumping rate near the freshwater lens center (Tang et al., 2021) and the actual maximum safe pumping rate, respectively. Under standard pumping conditions, the presence of a transition zone reduces the effective area of the freshwater lens by 16.12 % and its thickness by 7.77 m. The position of pumping wells directly influences pumping rates: as the distance from the central region increases, pumping rates decrease linearly, as expressed in Eq. (5). Simulation results demonstrate that the maximum safe pumping rate of freshwater lenses does not exhibit a perfect linear correlation with the distance from the surface central axis. During shallow pumping, higher rates may even be achieved near the coastal sides due to the low-velocity zone in the center. Under salinity-based constraints, the actual maximum safe pumped volume occurs at the pumping point (xm = 20 cm, y = 0 cm), corresponding to approximately two-thirds of the half-width of the island from the central axis, with a pumping rate of 2.667 × 10⁻⁵ kg s−1 (200 % of the theoretical value). At the center, the rate decreases to 2.480 × 10⁻⁵ kg s−1, equivalent to 62 % of the theoretical value. Under idealized strip-shaped island hydrodynamic conditions, seawater infiltrates from both bottom sides, forming an outflow zone at the top of the coastline, with a “stagnation zone” emerging in the island center – a phenomenon confirmed in previous studies. Owing to the slow, predominantly vertical flow in the central region, residual brackish water persists and disperses upward primarily via vertical dispersion. Thus, for single-well pumping projects on small idealized strip-shaped islands, central pumping may not be optimal, whereas lateral single-well operations can yield higher freshwater outputs. For deep pumping, given that freshwater lenses on such islands are approximately semicircular, deeper pumping is feasible near the center.
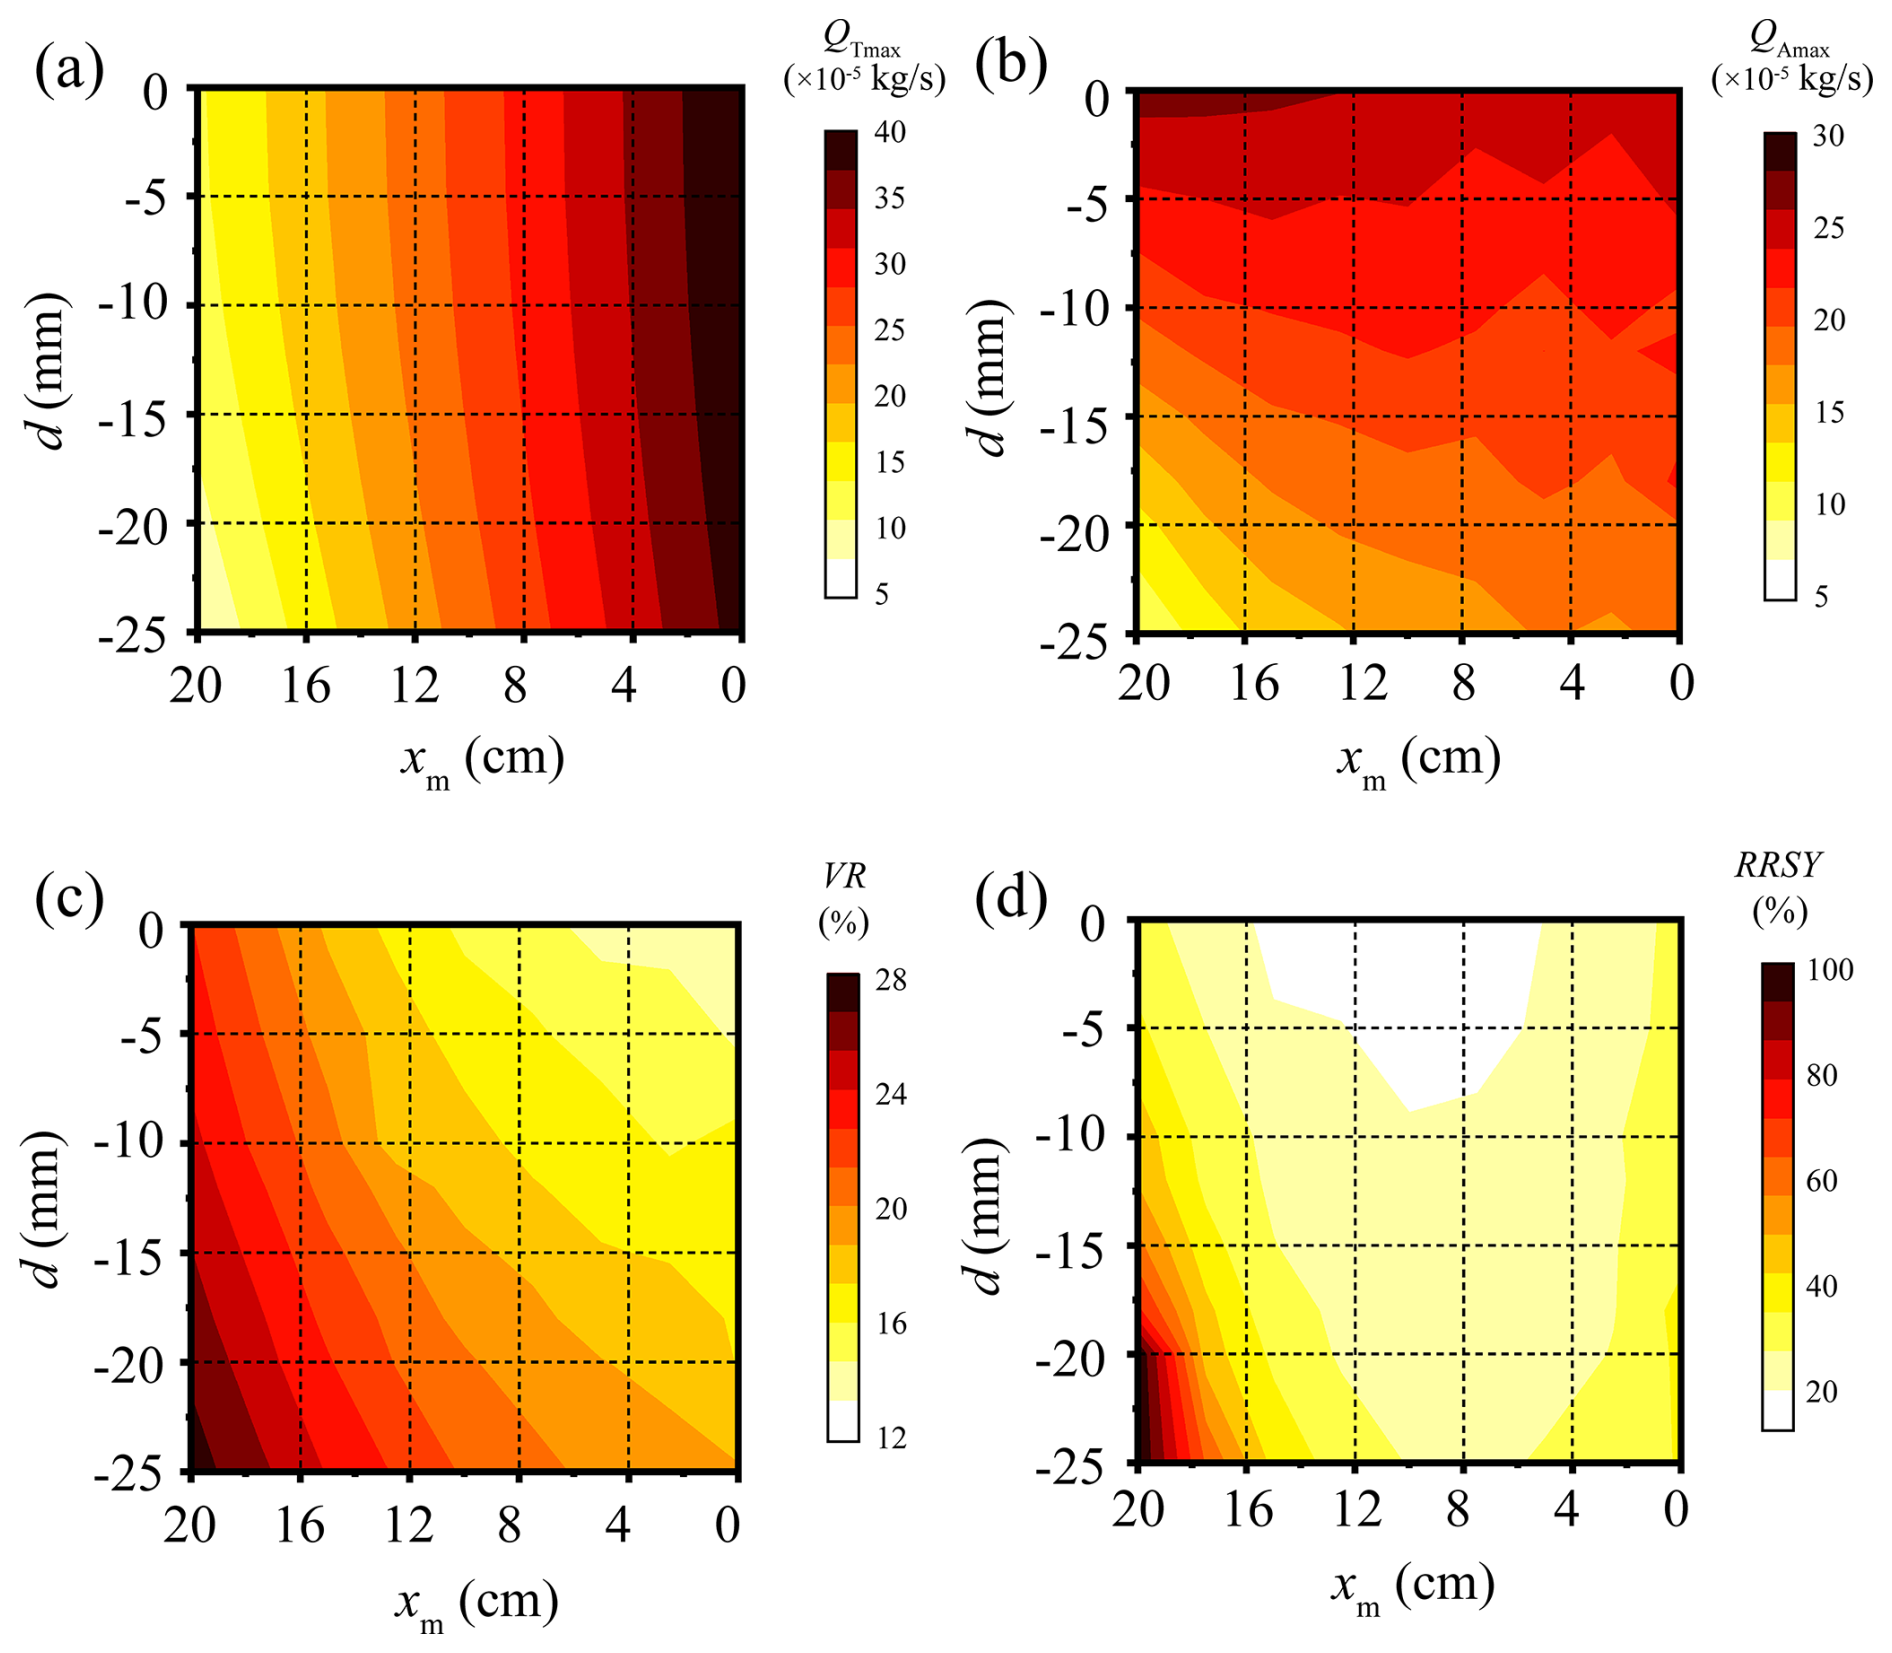
Figure 8Effects of pumping depth (d) and horizontal distance from the island center (xm) on (a) theoretical maximum safe extraction rate (), (b) actual maximum safe extraction rate (), (c) freshwater lens volume reduction rate (VR), and (d) reduction ratio of safe yield caused by nanoplastic retention (RRSY) in the idealized strip-island aquifer.
Figure 8c illustrates that nanoplastic concentration constraints reduce freshwater lens volume by 13 %–28 %, with more significant reductions in areas farther from the island's surface central axis, attributed to the uneven distribution of the nanoplastic transition zone. With respect to the reduction in maximum safe pumping rates, Fig. 8d demonstrates the decline in pumped volumes at the island center when nanoplastic concentration limits are considered. Centered at the pumping point (xm = 10 cm, y = 0 cm), the maximum safe pumped volume gradually decreases with increasing distance from this center due to nanoplastic concentration restrictions. Near the seawater boundary, the transition zone completely covers the area within 10 cm of the shoreline. Under the 1 % Cnps concentration limit, regions deeper than 25 mm are designated as non-exploitable zones. This phenomenon arises because the nanoplastic transition zone is relatively extended in the island's central region. Certain central regions exhibit pathway advantages, facilitating faster nanoplastic accumulation into wells. Near the seawater boundary, exploitable volumes decrease due to the influence of seawater nanoplastic source concentrations. Consequently, the combined effect of these two factors results in the highest exploitable volumes occurring in the upper regions near the central axis.
This study established a coupled variable-density groundwater flow and transport model to explore nanoplastic migration in the freshwater lenses of idealized strip islands under pumping scenarios. By integrating laboratory-calibrated parameters with field-scale simulations, we identified fundamental differences between nanoplastic and traditional solute transport processes and evaluated their implications for groundwater management in island aquifers. Key conclusions are summarized as follows:
-
Nanoplastic transport differs fundamentally from dissolved salt transport within the freshwater lenses of idealized strip-island aquifers during groundwater pumping. In contrast to dissolved salts, whose behavior is mainly regulated by advection and dispersion, nanoplastics are further affected by particle-specific processes, such as adsorption–desorption, clogging, and filtration. The higher effective dispersivity leads to earlier breakthrough at extraction wells and the development of broader contaminant transition zones compared to salinity alone under pumping-induced upconing conditions in coastal island aquifers.
-
Transport behavior exhibits strong scale dependence in strip-island freshwater lens systems under pumping stress. Laboratory-scale simulations showed rapid contamination and prominent “upper cone” formation within minutes, whereas field-scale simulations demonstrated attenuated upward coning and much longer stabilization times on the order of years. This contrast highlights the importance of multi-scale modeling when extrapolating experimental results to real-world island aquifers subject to freshwater extraction and seawater intrusion.
-
Dispersivity is the dominant control on nanoplastic risk for pumping wells tapping freshwater lenses in strip-island coastal aquifers. Among the evaluated parameters, nanoplastic dispersivity exerts the strongest influence on contaminant accumulation in extraction wells, with hydraulic conductivity and recharge rates playing secondary but important roles. When nanoplastic dispersivity exceeds approximately 17 times that of dissolved solutes, the contaminant plume can fully envelop the well screen. Under such conditions, the actual maximum safe extraction rate is reduced to approximately 37 % of the theoretical maximum () – after accounting for the fact that the salinity transition zone alone already limits extraction to about 50 % of .
-
Well placement strategies must account for nanoplastic transition zones. Traditional guidelines based solely on salinity intrusion may not minimize contamination risks. Simulations suggest that central pumping locations are not always optimal; lateral well placement can increase freshwater yield, although the optimal position depends on whether salinity or nanoplastic concentration is used as the limiting criterion.
Several simplifying assumptions were adopted in this study, including homogeneous aquifer properties, idealized boundary conditions, and limited representation of nanoplastic diversity. In practice, aquifer heterogeneity, tidal fluctuations and storm events may further influence the groundwater flow field and, consequently, the transport of substances. Furthermore, the diverse properties of environmental nanoplastics such as particle size distribution, aging state and surface chemistry will also bring additional impacts on their migration. In addition, only two types of synthetic nanoplastics were considered in this study, whereas natural systems contain a broader and more complex spectrum of particles. Despite these limitations, the present study establishes a mechanistic framework for evaluating nanoplastic transport in coastal freshwater lenses. By coupling variable-density flow with particle-specific transport processes and quantifying impacts on safe extraction thresholds, this study provides clear practical implications for well design, pumping optimization, and groundwater management on small islands. Future research should perform heterogeneous aquifer simulations, consider dynamic tidal and sea-level rise scenarios, and adopt more realistic natural micro/nanoplastic properties to further improve prediction accuracy and practical applicability for water security in plastic-polluted coastal environments.
The data of this study can be found in Ma (2026, https://doi.org/10.5281/zenodo.19150343).
The supplement related to this article is available online at https://doi.org/10.5194/hess-30-3789-2026-supplement.
TYZ: Conceptualization, Writing-Original Draft, Methodology, Resources, Writing-Review and Editing, Funding acquisition, Supervision. CXM: Investigation, Software, Writing-Original Draft, Writing-Review and Editing, Visualization, Data Curation, Conceptualization. SBG: Methodology, Formal Analysis, Investigation, Visualization, Writing-Review and Editing. JL: Writing-Review and Editing, Methodology, Supervision, Conceptualization.
The contact author has declared that none of the authors has any competing interests.
Publisher's note: Copernicus Publications remains neutral with regard to jurisdictional claims made in the text, published maps, institutional affiliations, or any other geographical representation in this paper. The authors bear the ultimate responsibility for providing appropriate place names. Views expressed in the text are those of the authors and do not necessarily reflect the views of the publisher.
The authors would like to thank Heng Dai, Lisa Appel and two anonymous reviewers for their valuable and constructive comments.
This research has been supported by the National Natural Science Foundation of China (grant no. 42422207), the Taishan Scholar Foundation of Shandong Province (grant no. tsqn202408078), and the China Postdoctoral Science Foundation (grant no. GZC20250290).
This paper was edited by Heng Dai and reviewed by two anonymous referees.
Abdoulhalik, A. and Ahmed, A. A.: Transient investigation of saltwater upconing in laboratory-scale coastal aquifer, Estuar. Coast. Shelf S., 214, 149–160, https://doi.org/10.1016/j.ecss.2018.09.024, 2018.
Al Harraq, A. and Bharti, B.: Microplastics through the Lens of Colloid Science, ACS Environmental Au, 2, 3–10, https://doi.org/10.1021/acsenvironau.1c00016, 2022.
Alkindi, A., Al-Wahaibi, Y., Bijeljic, B., and Muggeridge, A.: Investigation of longitudinal and transverse dispersion in stable displacements with a high viscosity and density contrast between the fluids, J. Contam. Hydrol., 120–121, 170–183, https://doi.org/10.1016/j.jconhyd.2010.06.006, 2011.
Alsumaiei, A. A. and Bailey, R. T.: Quantifying threats to groundwater resources in the Republic of Maldives Part I: Future rainfall patterns and sea-level rise, Hydrol. Process., 32, 1137–1153, https://doi.org/10.1002/hyp.11480, 2018.
Amirmoshiri, M., Zhang, L., Puerto, M. C., Tewari, R. D., Bahrim, R. Z. B. K., Farajzadeh, R., Hirasaki, G. J., and Biswal, S. L.: Role of Wettability on the Adsorption of an Anionic Surfactant on Sandstone Cores, Langmuir, 36, 10725–10738, https://doi.org/10.1021/acs.langmuir.0c01521, 2020.
Babakhani, P., Bridge, J., Doong, R. A., and Phenrat, T.: Continuum-based models and concepts for the transport of nanoparticles in saturated porous media: A state-of-the-science review, Adv. Colloid Interfac., 246, 75–104, https://doi.org/10.1016/j.cis.2017.06.002, 2017.
Babu, R., Park, N., and Nam, B.: Regional and well-scale indicators for assessing the sustainability of small island fresh groundwater lenses under future climate conditions, Environ. Earth Sci., 79, 47, https://doi.org/10.1007/s12665-019-8773-3, 2020.
Bailey, R. T. and Jenson, J. W.: Effects of Marine Overwash for Atoll Aquifers: Environmental and Human Factors, Groundwater, 52, 694–704, https://doi.org/10.1111/gwat.12117, 2014.
Chen, G., Zou, Y., Xiong, G., Wang, Y., Zhao, W., Xu, X., Zhu, X., Wu, J., Song, F., and Yu, H.: Microplastic transport and ecological risk in coastal intruded aquifers based on a coupled seawater intrusion and microplastic risk assessment model, J. Hazard. Mater., 480, 135996, https://doi.org/10.1016/j.jhazmat.2024.135996, 2024.
Chen, Q., Zhang, L., Shen, C., and Lu, C.: Effects of groundwater pumping on pore water flow and salt transport in tide-controlled unconfined coastal aquifers, Hydrol. Process., 38, e15261, https://doi.org/10.1002/hyp.15261, 2024a.
Coulon, C., Lemieux, J. M., Pryet, A., Bayer,P., Young, N. L., and Molson, J.: Pumping Optimization Under Uncertainty in an Island Freshwater Lens Using a Sharp-Interface Seawater Intrusion Model, Water Resour. Res., 58, e2021WR031793, https://doi.org/10.1029/2021WR031793, 2022.
Cui, X., Zhu, C., Hu, M., Wang, R., and Liu, H.: Permeability of porous media in coral reefs, B. Eng. Geol. Environ., 80, 5111–5126, https://doi.org/10.1007/s10064-020-02082-5, 2021.
Dagan, G. and Bear, J.: Solving The Problem Of Local Interface Upconing In A Coastal Aquifer By The Method Of Small Perturbations, J. Hydraul. Res., 6, 15–44, https://doi.org/10.1080/00221686809500218, 1968.
Dose, E. J., Stoeckl, L., Houben, G. J., Vacher, H. L., Vassolo, S., Dietrich, J., and Himmelsbach, T.: Experiments and Modeling of Freshwater Lenses in Layered Aquifers: Steady State Interface Geometry, J. Hydrol., 509, 621–630, https://doi.org/10.1016/j.jhydrol.2013.10.010, 2014.
Gao, C., Zheng, T., Chang, Q., Zheng, X., Song, X., and Luo, J.: Dynamics of Irregular Freshwater Lenses Evolution in Thin Aquifers of Reclaimed Circular Islands, Water Resour. Res., 61, e2024WR038880, https://doi.org/10.1029/2024WR038880, 2025.
Gelhar, L. W., Welty, C., and Rehfeldt, K. R.: A critical review of data on field-scale dispersion in aquifers, Water Resour. Res., 28, 1955–1974, https://doi.org/10.1029/92WR00607, 1992.
Gonçalves, J. M. and Bebianno, M. J.: Nanoplastics impact on marine biota: A review, Environ. Pollut., 273, 116426, https://doi.org/10.1016/j.envpol.2021.116426, 2021.
Houben, G. and Post, V. E. A.: The first field-based descriptions of pumping-induced saltwater intrusion and upconing, Hydrogeol. J., 25, 243–247, https://doi.org/10.1007/s10040-016-1476-x, 2017.
Isobe, A., Iwasaki, S., Uchida, K., and Tokai, T.: Abundance of non-conservative microplastics in the upper ocean from 1957 to 2066, Nat. Commun., 10, 417, https://doi.org/10.1038/s41467-019-08316-9, 2019.
Johnson, W. P.: Quantitative Linking of Nanoscale Interactions to Continuum-Scale Nanoparticle and Microplastic Transport in Environmental Granular Media, Environ. Sci. Technol., 54, 8032–8042, https://doi.org/10.1021/acs.est.0c01172, 2020.
Ketabchi, H., Mahmoodzadeh, D., Ataie-Ashtiani, B., Werner, A. D., and Simmons, C. T.: Sea-level rise impact on fresh groundwater lenses in two-layer small islands, Hydrol. Process., 28, 5938–5953, https://doi.org/10.1002/hyp.10059, 2014.
Koelmans, A. A., Redondo-Hasselerharm, P. E., Nor, N. H. M., de Ruijter, V. N., Mintenig, S. M., and Kooi, M.: Risk assessment of microplastic particles, Nature Reviews Materials, 7, 138–152, https://doi.org/10.1038/s41578-021-00411-y, 2022.
Koutnik, V. S., Leonard, J., Alkidim, S., DePrima, F. J., Ravi, S., Hoek, E. M. V., and Mohanty, S. K.: Distribution of microplastics in soil and freshwater environments: Global analysis and framework for transport modeling, Environ. Pollut., 274, 116552, https://doi.org/10.1016/j.envpol.2021.116552, 2021.
Lee, J., Rolle, M., and Kitanidis, P.: Longitudinal dispersion coefficients for numerical modeling of groundwater solute transport in heterogeneous formations, J. Contam. Hydrol., 212, 41–54, https://doi.org/10.1016/j.jconhyd.2017.09.004, 2017.
Li, J., Liu, H., and Paul Chen, J.: Microplastics in freshwater systems: A review on occurrence, environmental effects, and methods for microplastics detection, Water Res., 137, 362–374, https://doi.org/10.1016/j.watres.2017.12.056, 2018.
Li, M., Zhang, M., Rong, H., Zhang, X., He, L., Han, P., and Tong, M.: Transport and deposition of plastic particles in porous media during seawater intrusion and groundwater-seawater displacement processes, Sci. Total Environ., 781, 146752, https://doi.org/10.1016/j.scitotenv.2021.146752, 2021.
Liu, X., Zhao, R., Liu, M., Zheng, T., Hao, Y., Wang, C., Liu, L., Zhao, Y., Liu, Z., Dai, Y., Yue, T., Zhao, J., Wang, Z., and Xing, B.: Transport of eco-corona coated nanoplastics in coastal sediments, Water Res., 284, 123893, https://doi.org/10.1016/j.watres.2025.123893, 2025.
Ma: Data Availability for HESS, Zenodo [data set], https://doi.org/10.5281/zenodo.19150343, 2026.
Muskat, M.: The flow of homogeneous fluids through porous media, Soil Sci., 46, 169, https://journals.lww.com/soilsci/fulltext/1938/08000/the_flow_of_homogeneous_fluids_through_porous.8.aspx (last access: 21 March 2026), 1938.
Ranjan, V. P., Joseph, A., Sharma, H. B., and Goel, S.: Preliminary investigation on effects of size, polymer type, and surface behaviour on the vertical mobility of microplastics in a porous media, Sci. Total Environ., 864, 161148, https://doi.org/10.1016/j.scitotenv.2022.161148, 2023.
Ren, Z., Gui, X., Xu, X., Zhao, L., Qiu, H., and Cao, X.: Microplastics in the soil-groundwater environment: Aging, migration, and co-transport of contaminants – A critical review, J. Hazard. Mater., 419, 126455, https://doi.org/10.1016/j.jhazmat.2021.126455, 2021.
Ren, Z., Gui, X., Xu, X., Zhao, L., Qiu, H., Wang, X., and Cao, X.: Weathering of microplastics and their enhancement on the retention of cadmium in coastal soil saturated with seawater, J. Hazard. Mater., 440, 129850, https://doi.org/10.1016/j.jhazmat.2022.129850, 2022.
Sayre, R., Noble, S., Hamann, S., Smith, R., Wright, D., Breyer, S., Butler, K., Van Graafeiland, K., Frye, C., Karagulle, D., Hopkins, D., Stephens, D., Kelly, K., Basher, Z., Burton, D., Cress, J., Atkins, K., Van Sistine, D. P., Friesen, B., Allee, R., Allen, T., Aniello, P., Asaad, I., Costello, M. J., Goodin, K., Harris, P., Kavanaugh, M., Lillis, H., Manca, E., Muller-Karger, F., Nyberg, B., Parsons, R., Saarinen, J., Steiner, J., and Reed, A.: A new 30 meter resolution global shoreline vector and associated global islands database for the development of standardized ecological coastal units, J. Oper. Oceanogr., 12, S47–S56, https://doi.org/10.1080/1755876X.2018.1529714, 2019.
Sharan, A., Lal, A., and Datta, B.: A review of groundwater sustainability crisis in the Pacific Island countries: Challenges and solutions, J. Hydrol., 603, 127165, https://doi.org/10.1016/j.jhydrol.2021.127165., 2021.
Singh, A., Chauhan, A., and Gaur, R.: A comprehensive review on the synthesis, properties, environmental impacts, and chemiluminescence applications of polystyrene (PS), Discover Chemistry, 2, 47, https://doi.org/10.1007/s44371-025-00125-y, 2025.
Stoeckl, L. and Houben, G.: Flow dynamics and age stratification of freshwater lenses: Experiments and modeling, J. Hydrol., 458–459, 9–15, https://doi.org/10.1016/j.jhydrol.2012.05.070., 2012.
Tang, Y., Rathore, S., Lu, C., and Luo, J.: Development of Groundwater Lens for Transient Recharge in Strip Islands, J. Hydrol., 590, 125209, https://doi.org/10.1016/j.jhydrol.2020.125209, 2020.
Tang, Y., Yan, M., Wang, X., Lu, C., and Luo, J.: Experimental and modeling investigation of pumping from a fresh groundwater lens in an idealized strip island, J. Hydrol., 602, 126734, https://doi.org/10.1016/j.jhydrol.2021.126734, 2021.
Tang, Y., Lu, C., and Luo, J.: An Analytical solution for groundwater lens pumping in a three-dimensional rectangular island, J. Hydrol., 617, 128928, https://doi.org/10.1016/j.jhydrol.2022.128928, 2022.
Tang, Y., Lu, C., and Luo, J.: Optimizing groundwater pumping in small island groundwater lenses: An analytical approach, J. Hydrol., 629, 130579, https://doi.org/10.1016/j.jhydrol.2023.130579, 2024.
ten Hietbrink, S., Materić, D., Holzinger, R., Groeskamp, S., and Niemann, H.: Nanoplastic concentrations across the North Atlantic, Nature, 643, 412–416, https://doi.org/10.1038/s41586-025-09218-1, 2025.
Thompson, R. C., Courtene-Jones, W., Boucher, J., Pahl, S., Raubenheimer, K., and Koelmans, A. A.: Twenty years of microplastic pollution research – what have we learned?, Science, 386, eadl2746, https://doi.org/10.1126/science.adl2746, 2024.
Voss, C. and Provost, A. M.: SUTRA: A model for 2D or 3D saturated-unsaturated, variable-density ground-water flow with solute or energy transport, Report Rep. 2002-4231, U.S. Geological Survey, https://doi.org/10.3133/wri024231, 2002.
Waldschläger, K. and Schüttrumpf, H.: Infiltration Behavior of Microplastic Particles with Different Densities, Sizes, and Shapes – From Glass Spheres to Natural Sediments, Environ. Sci. Technol., 54, 9366–9373, https://doi.org/10.1021/acs.est.0c01722, 2020.
Wang, R., Shu, L., Zhang, R., and Ling, Z.: Determination of Exploitable Coefficient of Coral Island Freshwater Lens Considering the Integrated Effects of Lens Growth and Contraction, Water, 15, 890, https://doi.org/10.3390/w15050890, 2023.
Wang, X., Bolan, N., Tsang, D. C. W., Sarkar, B., Bradney, L., and Li, Y.: A review of microplastics aggregation in aquatic environment: Influence factors, analytical methods, and environmental implications, J. Hazard. Mater., 402, 123496, https://doi.org/10.1016/j.jhazmat.2020.123496, 2021.
Wang, Z. and Sedighi, M.: Dispersion properties of nanoplastic spheres in granular media at low Reynolds numbers, J. Contam. Hydrol., 259, 104244, https://doi.org/10.1016/j.jconhyd.2023.104244, 2023.
Werner, A. D., Jakovovic, D., and Simmons, C. T.: Experimental observations of saltwater up-coning, J. Hydrol., 373, 230–241, https://doi.org/10.1016/j.jhydrol.2009.05.004, 2009.
White, I. and Falkland, T.: Management of freshwater lenses on small Pacific islands, Hydrogeol. J., 18, 227–246, https://doi.org/10.1007/s10040-009-0525-0, 2010.
Yan, M., Lu, C., Werner, A. D., and Luo, J.: Analytical, Experimental, and Numerical Investigation of Partially Penetrating Barriers for Expanding Island Freshwater Lenses, Water Resour. Res., 57, e2020WR028386, https://doi.org/10.1029/2020WR028386, 2021.
Yang, J., Wang, Q., Heidbüchel, I., Xu, T., and Lu, C.: Cut-off walls alter nitrogen loads and fluxes in small islands, J. Hydrol., 647, 132266, https://doi.org/10.1016/j.jhydrol.2024.132266, 2025.
Yao, Y., Andrews, C., Zheng, Y., He, X., Babovic, V., and Zheng, C.: Development of Fresh Groundwater Lens in Coastal Reclaimed Islands, J. Hydrol., 573, 365–375, https://doi.org/10.1016/j.jhydrol.2019.03.062, 2019.
Yuan, C., Hu, L., Ren, Z., Xu, X., Gui, X., Gong, X., Wu, R., Sima, J., and Cao, X.: Marine Microplastics Enhance Release of Arsenic in Coastal Aquifer during Seawater Intrusion Process, J. Hazard. Mater., 475, 134804, https://doi.org/10.1016/j.jhazmat.2024.134804, 2024.
Zheng, T.: Numerical Analysis of Modeling Concepts for Salt Precipitation and Porosity – Permeability Evolution during Brine Evaporation, M.Eng. thesis, University of Stuttgart, https://paperzz.com/doc/6923243 (last access: 21 March 2026), 2014.
Zheng, T., Meng, Y., Meng, X., Gao, S., Zhang, L., Zhang, B., Liu, T., and Luo, J.: Influence of time-space variability of rainfall infiltration recharge on fresh groundwater lens, Physics of Fluids, 37, 036623, https://doi.org/10.1063/5.0253940, 2025.