the Creative Commons Attribution 4.0 License.
the Creative Commons Attribution 4.0 License.
 | 16 Jun 2026
Continental-scale prediction of hydrologic signatures and processes
Ryoko Araki
Anne Holt
John C. Hammond
Admin Husic
Gemma Coxon
Understanding how dominant hydrologic processes and their drivers vary across diverse continental-scale landscapes is critical for hydrologic modeling and water management applications. Our research addresses this question by synthesizing large-sample watershed datasets, Caravan and GAGES-II, and developing random forest models to identify patterns in hydrologic function. We assessed dominant processes by examining hydrologic signatures – summary indicators of watershed function derived from hydroclimatic time series and random forest models across 14 146 gauged United States watersheds. The results reveal clear continental-scale gradients in hydrologic processes, including baseflow, overland flow, storage, and water balance losses. Our map of dominant processes highlights, for example, the transition from baseflow to fast responses and back to baseflow along the elevation gradient from the Appalachian spine, through the Piedmont, to the Eastern Coastal Plain; a distinct outer ring around the Great Lakes region; and sharp contrasts between coastal and inland processes in the West. Variable importance analysis from random forest models show that processes in the western U.S. are primarily controlled by climate, whereas in the eastern U.S., soil, geology, and topography play larger roles, with distinct human influences apparent in urban areas. Our approach of estimating dominant processes and their drivers facilitates extending process knowledge from research watersheds to the continental scale, assessing current hydrological understanding, and evaluating hydrological model structures.
- Article
(8495 KB) - Full-text XML
-
Supplement
(5867 KB) - BibTeX
- EndNote


Estimating the contributions of different hydrologic processes to streamflow generation at a continental scale is essential for flood forecasting and water resources management. Optimal management strategies, including the design of grey and green infrastructure, differ depending on which processes dominate hydrological response (Oswald et al., 2023; Thompson et al., 2020), which vary substantially by regional environmental conditions (Blöschl, 2006; Paola et al., 2006; Penna, 2024). Understanding how water is partitioned, stored, and transported through different parts of the terrestrial systems is a fundamental question in the hydrologic sciences (Brooks et al., 2015). To simulate a diverse set of processes at large-scale, a new generation of hydrologic models with flexible and heterogeneous structures has emerged (Clark et al., 2015; Frame et al., 2025; Johnson et al., 2023). However, despite these technological advances, we still lack an estimate of dominant hydrologic processes controlling streamflow generation at continental scales (McMillan et al., 2025; Reinecke et al., 2025). Developing this understanding is a critical step toward unified hydrologic theory (Sivapalan, 2005) and can provide a blueprint for robust model development and informed decision making.
Previous efforts to map multiple hydrologic processes at continental scales are scarce. Most large-scale studies have focused on one process. For example, Buchanan et al. (2018) assessed the likelihood of infiltration excess flow occurrence by comparing whether rainfall intensity exceeds saturated hydraulic conductivity, finding that saturation excess dominates across the contiguous United States (U.S.), while infiltration excess is regionally likely in the central U.S. Similarly, studies on baseflow indices have shown their strong dependence on climatic and soil properties (Beck et al., 2013; Xie et al., 2024), and Fang and Shen (2017) quantified the runoff-storage connectivity through correlations between anomalies in streamflow gauge and satellite water storage observations, highlighting large-scale interactions among groundwater table, soil thickness, topography, and snow. In contrast, studies that examined multiple processes have been typically focused on a single or small groups of watersheds. A study in Alaska shows that the use of multiple streamflow statistics can help distinguish and assign hydrologic regions (Barnhart et al., 2022). One of the few studies to holistically investigate storm runoff generation at continental scales (Wu et al., 2021) demonstrates that large-sample analysis aligns with previous conceptual understanding of runoff mechanisms across landscapes (Dunne, 1978) while highlighting the roles of precipitation volume and geology. Model-aided studies have simulated global patterns of multiple indices: water partitioning into green and blue water, streamflow response elasticity to rainfall, and streamflow flashiness (Ji et al., 2025), U.S.-wide indices for water balance seasonality (Berghuijs et al., 2014). Another model-based approach has involved inferring hydrologic processes through parameter sensitivity analysis (Hay et al., 2023). These synthesis studies present promising descriptions of spatial patterns and directions for future progress toward a holistic understanding of runoff generation mechanisms, which still remains elusive.
Much of the research for generalizing watershed function has focused on summarizing flow regimes (Dettinger and Diaz, 2000; Lane et al., 2017; Lee et al., 2015; Lins, 1997) and predicting shifts in flow regime under future climate (Brunner et al., 2020; Hodgkins et al., 2024). Many studies cluster streamflow gauges using flow indices that target general (Almagro et al., 2024; Ariano and Ali, 2025; Mosley, 1981; Wu et al., 2021), intermittent (Sauquet et al., 2021), or seasonal streamflow patterns (Dhungel et al., 2016; Haines et al., 1988; Kennard et al., 2010). However, most of these studies aim to define the similarity of flow regimes rather than the underlying runoff generation processes. Furthermore, the results from clustering approaches are constrained to gauged locations and lack spatial coherence, making it challenging to extrapolate to ungauged watersheds.
To estimate watershed processes in ungauged locations, hydrologists have conventionally used maps derived from physiographic datasets. For example, in the United States context, the Environmental Protection Agency's Ecoregions (Omernik, 1987, 2004), an ecosystem classification based on the physical and biotic characteristics, is a common reference when discussing hydrologic processes (Falcone et al., 2010). Other classifications include the United States Geological Survey's Water Resources Regions (Seaber et al., 1987) based on streamflow networks, Hydrologic Landscape Regions (Santhi et al., 2008; Winter, 2001; Wolock, 2003a) based on physiographic and climatic datasets, and the United States Department of Agriculture's Hydrologic Soil Groups (Web Soil Survey, 2025) based on soil surveys. Nevertheless, regionalization based on physiographic data often fails to capture the full variability of watershed function (Ali et al., 2012; Oudin et al., 2008) because hydrologic processes can differ even among physiographically similar watersheds (McMillan et al., 2014). Capturing watershed processes at a continental scale calls for a scalable method to draw information from hydroclimatic datasets. To date, no studies have attempted to develop comprehensive maps of runoff generation processes based on streamflow observations that can effectively capture watersheds' functions.
Hydrologic signatures are metrics that quantify hydrologically-relevant dynamics, and offer a promising way to infer watershed processes with minimal data requirements (McMillan, 2021). Hydrologic signature calculations require only widely-available datasets, such as streamflow and precipitation, and can be related to various watershed processes, such as runoff generation and water storage dynamics (McMillan, 2020; Wlostowski et al., 2021). Using hydrologic signatures, expert knowledge, and landscape characteristics, Fenicia and McDonnell (2022) inferred dominant runoff processes and developed perceptual models at the regional scale; and Pechlivanidis and Arheimer (2015) mapped process differences at the national scale in India. Hydrologic signatures can capture the functional streamflow responses to climatic forcings and can discriminate different processes across landscapes (Araki et al., 2022; Gnann et al., 2020, 2021b; Janssen and Ameli, 2021). This enables a signature-based exploration of the relationship between landscape form and function (Bracken et al., 2013; Sivapalan, 2005).
Watershed attributes describe the physical characteristics of watersheds, which can be used to identify the drivers of hydrologic processes and to transfer hydrological knowledge to ungauged locations (Tarasova et al., 2023). The link between watershed attributes and signatures of streamflow response can be explored via machine learning approaches on large watershed samples. Regional and global applications include studies in the U.S. (Addor et al., 2018; Janssen and Ameli, 2021; Wu et al., 2021), Australia (Trancoso et al., 2017), Zimbabwe (Mazvimavi et al., 2005), Brazil (Almagro et al., 2024), Europe (Rudlang et al., 2025; Kuentz et al., 2017), and globally (Beck et al., 2015). Across all studies, climate emerged as the primary control on signatures. Non-climatic factors (i.e., landscape attributes), such as soil, geology, vegetation cover, and topography, had weak or limited predictive power. However, substantial evidence from field-based studies shows that landscape forms are a primary control of watershed function (Angermann et al., 2017; Fan et al., 2019; Jackisch et al., 2017; Jefferson et al., 2010; Lohse and Dietrich, 2005; Pfister et al., 2017; Zimmer and Gannon, 2018).
Weak predictive power of non-climatic drivers can be attributed to lack of high-resolution, accurate landscape attributes that describe regionally important processes (Gnann et al., 2021b; Tarasova et al., 2023). For example, wetlands are key regulators of low flows in the U.S. (Worland et al., 2018) and have been left out of previous studies (Addor et al., 2018). Similarly, weathering and glaciation have primary impacts on baseflow storage and generation (Neff et al., 2005; Tague and Grant, 2004), but rock permeability and porosity predictors did not clearly capture the relationship (Wu et al., 2021). Coarse spatial resolution, or limited quality and consistency of global datasets may reduce their predictive power (do Nascimento et al., 2025; Beck et al., 2015). Additionally, large-sample studies across broad climatic gradients may be obscuring the influences of landscape attributes. Regional analysis can mitigate this effect and elucidate the non-climatic drivers; for example, regional random forest models have revealed physiographic and anthropogenic controls on flow regimes (Almagro et al., 2024; Hammond et al., 2021). However, smaller regional sample sizes may limit prediction accuracy if datasets only provide tens of watersheds per region (Willard et al., 2024).
Lastly, the quality of signatures can compromise data-driven model performance and interpretation for process understanding. Examples include the sensitivity of flow duration curve slope to measurement errors (McMillan et al., 2017), the sensitivity of signatures to rating curve uncertainties (Westerberg et al., 2016), lack of process representativeness (McMillan et al., 2022), and inaccurate parameterization of storm separation algorithms (McMillan et al., 2023). Minimizing the impact of signature uncertainty is important for differentiating different regional watershed functionalities (Westerberg et al., 2016).
This study presents the first hydrologic processes map for the contiguous United States (CONUS). We synthesized hydrologic signatures as process indicators, going beyond pattern identification from single signatures. We hypothesize that signature combinations can represent six key hydrologic processes (McMillan, 2020; McMillan et al., 2022): baseflow and storage, water balance and seasonal flow variability, and saturation and infiltration excess overland flow. Using random forest models, we demonstrate the explanatory power of landscape metrics to predict hydrologic signatures and their regional variations, and thus the underlying processes, across CONUS.
We address the limitations of previous studies in predicting hydrologic signatures. First, we improved the quality of non-climatic attributes by: (i) incorporating new geological and wetland landscape attributes that have demonstrated strong connections to baseflow processes (Holt and McMillan, 2025); and (ii) utilizing watershed attributes from GAGES-II datasets (Falcone, 2011), derived from survey-based and higher-resolution products. Second, we interpret random forests using Shapley values (Shapley, 1953) following Husic et al. (2025), as well as permutation importance values within a regional model-building approach, following Hammond et al. (2021), which extends prior work to elucidate the regional contributions of non-climatic, landscape attributes to hydrologic processes. Furthermore, our work assessed 14 146 U.S. watersheds and was trained on 10 261 watersheds, nearly ten times more sample watersheds than previous studies; we leverage the Caravan and GAGES-II – the most extensive open-source large-sample datasets currently available (Falcone, 2011; Kratzert et al., 2023). Third, we utilize a set of hydrologic signatures proven robust across large-sample watershed studies and have a clear connection to critical-zone processes (McMillan et al., 2022), with their parameters further tuned to local storm characteristics. With these improvements, we expand watershed coverage and uncover more detailed spatial patterns of watershed processes than previously possible, using widely-available hydroclimatic datasets and physiographic attributes.
We used two primary sources of streamgages and watershed attribute data to expand the number of samples: Caravan v1.5 (Kratzert et al., 2023, 2024) and U.S. Geological Survey GAGES-II (Falcone, 2011; Falcone et al., 2010). See Fig. 1 for the spatial distribution of the study watersheds. Caravan is an open-source dataset of global watersheds; its CONUS subset consists of 9234 watersheds sourced from CAMELS-US (Addor et al., 2017) and HYSETS (Arsenault et al., 2020). GAGES-II is a geospatial dataset of 9067 watersheds in the United States, selected for their quality to characterize natural and altered flow regimes.
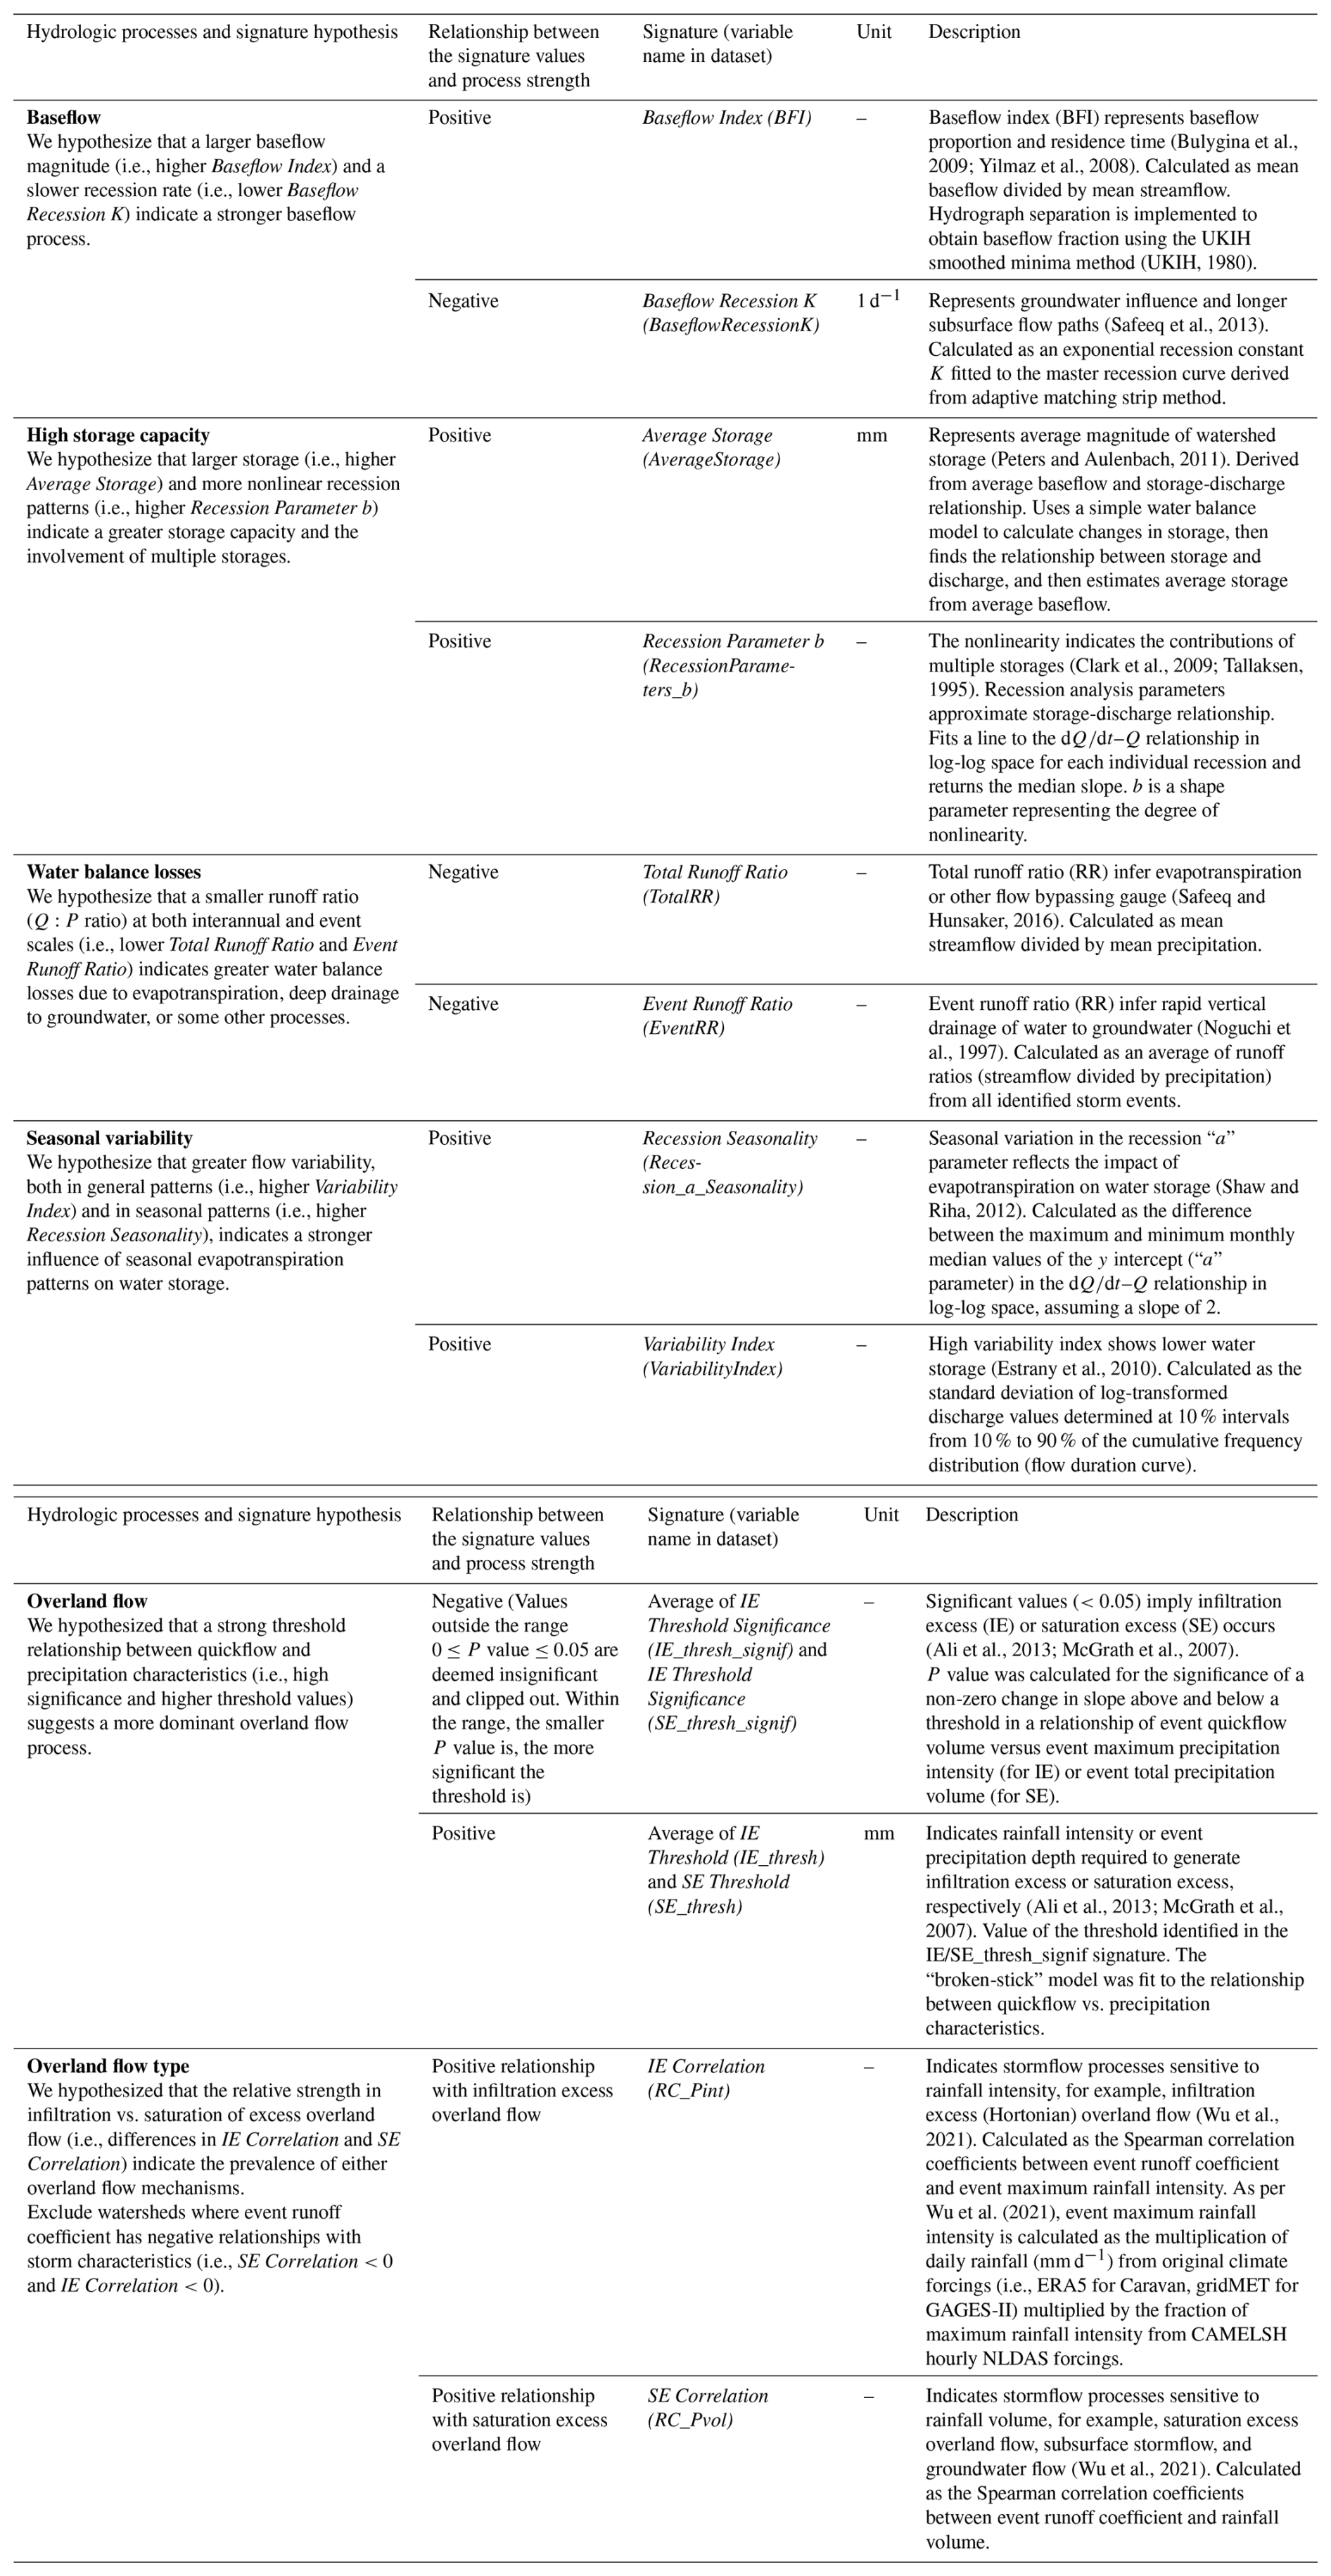
Table 1Hydrologic signatures used for building process hypotheses. The signature descriptions are adapted from McMillan et al. (2022).
2.1 Hydroclimatic dataset
We calculated hydrologic signatures listed in Table 1 using daily hydroclimatic timeseries data from watersheds within the contiguous United States (CONUS). For Caravan watersheds, we used U.S. Geological Survey (USGS) streamflow measurements paired with daily ERA5-Land forcings provided. For the GAGES-II watersheds, we obtained the USGS streamflow records (U.S. Geological Survey, 2025) using the dataRetrieval package (DeCicco et al., 2018) and gridMET forcings from Wieczorek et al. (2023). For calculating infiltration excess overland flow signatures of Wu et al. (2021; “RC_Pint”), we used the hourly precipitation from the North American Land Data Assimilation System 2 (NLDAS-2; Xia et al., 2012) provided through CAMELSH: a Large-Sample Hourly Hydrometeorological Dataset and Attributes at Watershed-Scale for CONUS (Tran, 2025; Tran et al., 2025).
2.2 Watershed attributes
We combined watershed attributes from three sources: (1) Caravan, (2) GAGES-II, and (3) geologic age and wetland attributes (Holt and McMillan, 2025). We added average geologic age and isolated wetland fraction metrics because of their strong link to baseflow processes, which were missing from previous large-sample analyses (Holt and McMillan, 2025). From the Caravan and Holt and McMillan (2025) attribute sets, we excluded binary or categorical attributes, monthly climate variables, uninformative attributes for the CONUS context (e.g., permafrost extent, gross domestic product), and highly correlated attributes (Spearman's rho >0.8 or ; see Sect. S1 in the Supplement). Where available, Caravan attributes were substituted with GAGES-II attributes, as described in Sect. 3.2 and Table S1 in the Supplement. Table 2 lists the 23 attributes used in the random forest analysis. The purpose of merging Caravan and GAGES-II dataset is to maximize the sample size of watersheds and better capture regional hydrologic variability (see Table S1 and Fig. S1 in the Supplement for the watershed coverage across datasets).
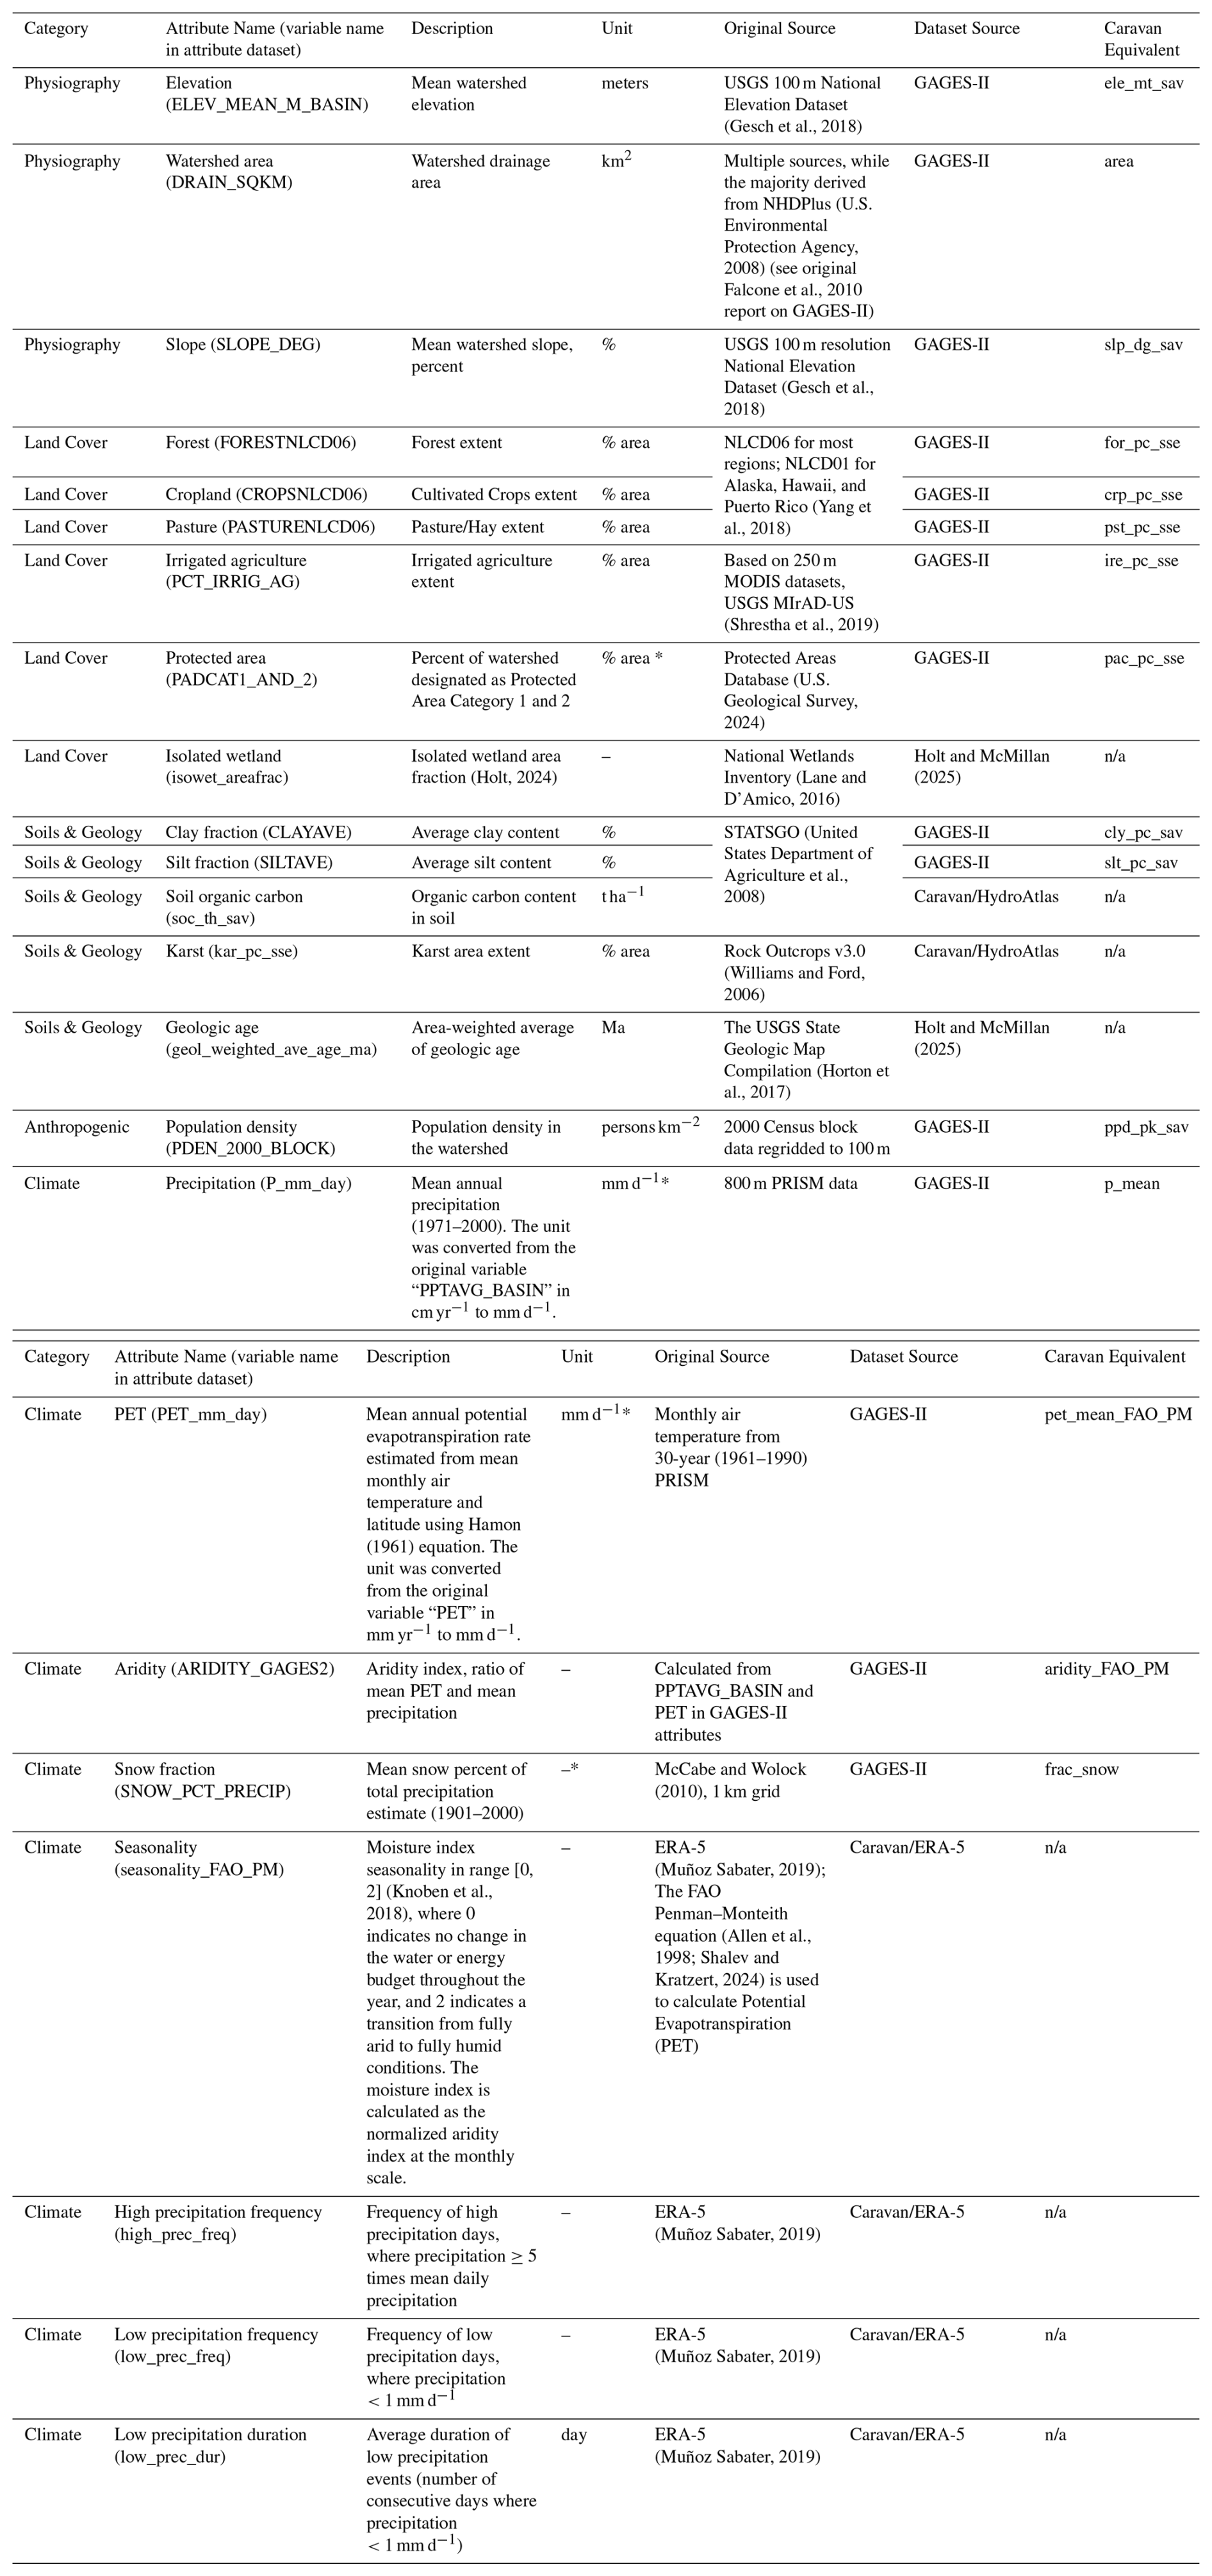
Table 2Landscape attributes used in training the random forest model. Descriptions are adapted from Falcone (2011), Falcone et al. (2010), Holt and McMillan (2025), Kratzert et al. (2023), Linke et al. (2019). For predictions, when certain attributes are unavailable, equivalent attributes are substituted (e.g., Caravan equivalents are used when predicting signatures for watershed samples available only in Caravan). The combinations are detailed in Table S1. An asterisk (*) in the unit column indicates that the landscape attribute unit from GAGES-II was converted to the Caravan equivalent (Fig. S14 shows the comparison). “n/a” stands for not applicable.
We analyzed 14 146 gauged U.S. watersheds; our map of processes was based on observational data from 10 261 gauged sites and extended using random forest predictions to an additional 3885 watersheds. See Table S1, Figs. S1 and S2 for an overview of the datasets used and the workflow.
3.1 Calculating hydrologic signatures
A total of 12 signatures (four baseflow and groundwater signatures, four water balance and seasonality-related signatures, and four overland flow signatures) were used to characterize hydrologic dynamics (see Table 1). The signatures were selected based on their reliability in representing processes (McMillan et al., 2022). We calculated signatures using the TOSSH toolbox (Gnann et al., 2021a) and tuned the parameters for event separation for each hydroclimatic region (see Tables S2, S4).
We filtered out watersheds from our signature calculations based on quality criteria for watershed area and snow used by previous studies, and on the timeseries length needed for signatures to stabilize. First, we removed watersheds from our analysis with uncertain topographic boundaries, showing high discrepancies (>25 %) in the estimated drainage area between GAGES-II and Caravan datasets. Errors of <20 % are possible due to differences in watershed delineation tools or missing small tributaries (Ray, 2018). Second, for overland flow signature analysis, we excluded snow-dominated watersheds (>20 % snow fraction of total precipitation; a >30 % criterion were used in McMillan et al., 2022, and Wu et al., 2021); this is because our overland flow signatures can be heavily influenced by periods with no flow response due to snow or frozen conditions. Third, we excluded watersheds with less than 5 years of streamflow observation record, and those with over 30 % missing daily data over the period where streamflow was recorded (yielding at least three years of available data). Studies suggest that temporal hydrologic variability is adequately captured with 3 to 5 years of data (Refsgaard and Storm, 1990; Klemeš, 1986; Merz and Blöschl, 2009).
3.2 Training random forest models and predicting hydrologic signatures
We developed random forest models to examine potential drivers of hydrologic processes. Random forest models have been widely used for this task (Eng and Wolock, 2022; Lapides et al., 2023; Zipper et al., 2021) for their interpretability, relatively low computational demands, and robustness to multi-collinearity (Addor et al., 2018). For each signature, we constructed a random forest model to predict its values based on watershed attributes using the caret R package (Kuhn, 2008; R Core Team, 2024). Each model used 500 trees with the optimal number of features randomly resampled at each split, selected by minimizing root mean squared error (RMSE) through 10-fold cross-validation.
Only the signatures calculated from quality-controlled streamflow records (as described in Sect. 3.1) were used for training. Training on all Caravan watersheds yielded R2<0.4 for many of the signatures, so we limited the training samples to the 4748 Caravan watersheds with streamflow gauge IDs overlapping with GAGES-II to attain model performance comparable to previous studies (see Sect. S2). When a gauged watershed was present in both datasets, we prioritized CAMELS over HYSETS, and Caravan over GAGES-II. This is to ensure the broader applicability of our method across different countries, as Caravan is available at global scale. This yielded a total 14 146 watersheds for signature analysis (overview in Table S1).
We then used the trained model to predict hydrologic signatures for 3885 watersheds where observations did not meet data quality standards as described in Sect. 3.1. Previous study (do Nascimento et al., 2025) and our preliminary experiments (Sect. S2) showed improved model performance when the watershed attributes were derived from higher-resolution datasets based on detailed field surveys, such as in GAGES-II and Holt and McMillan (2025). Therefore, we used GAGES-II attributes and when unavailable, used the coarser resolution Caravan attributes (see Table S1).
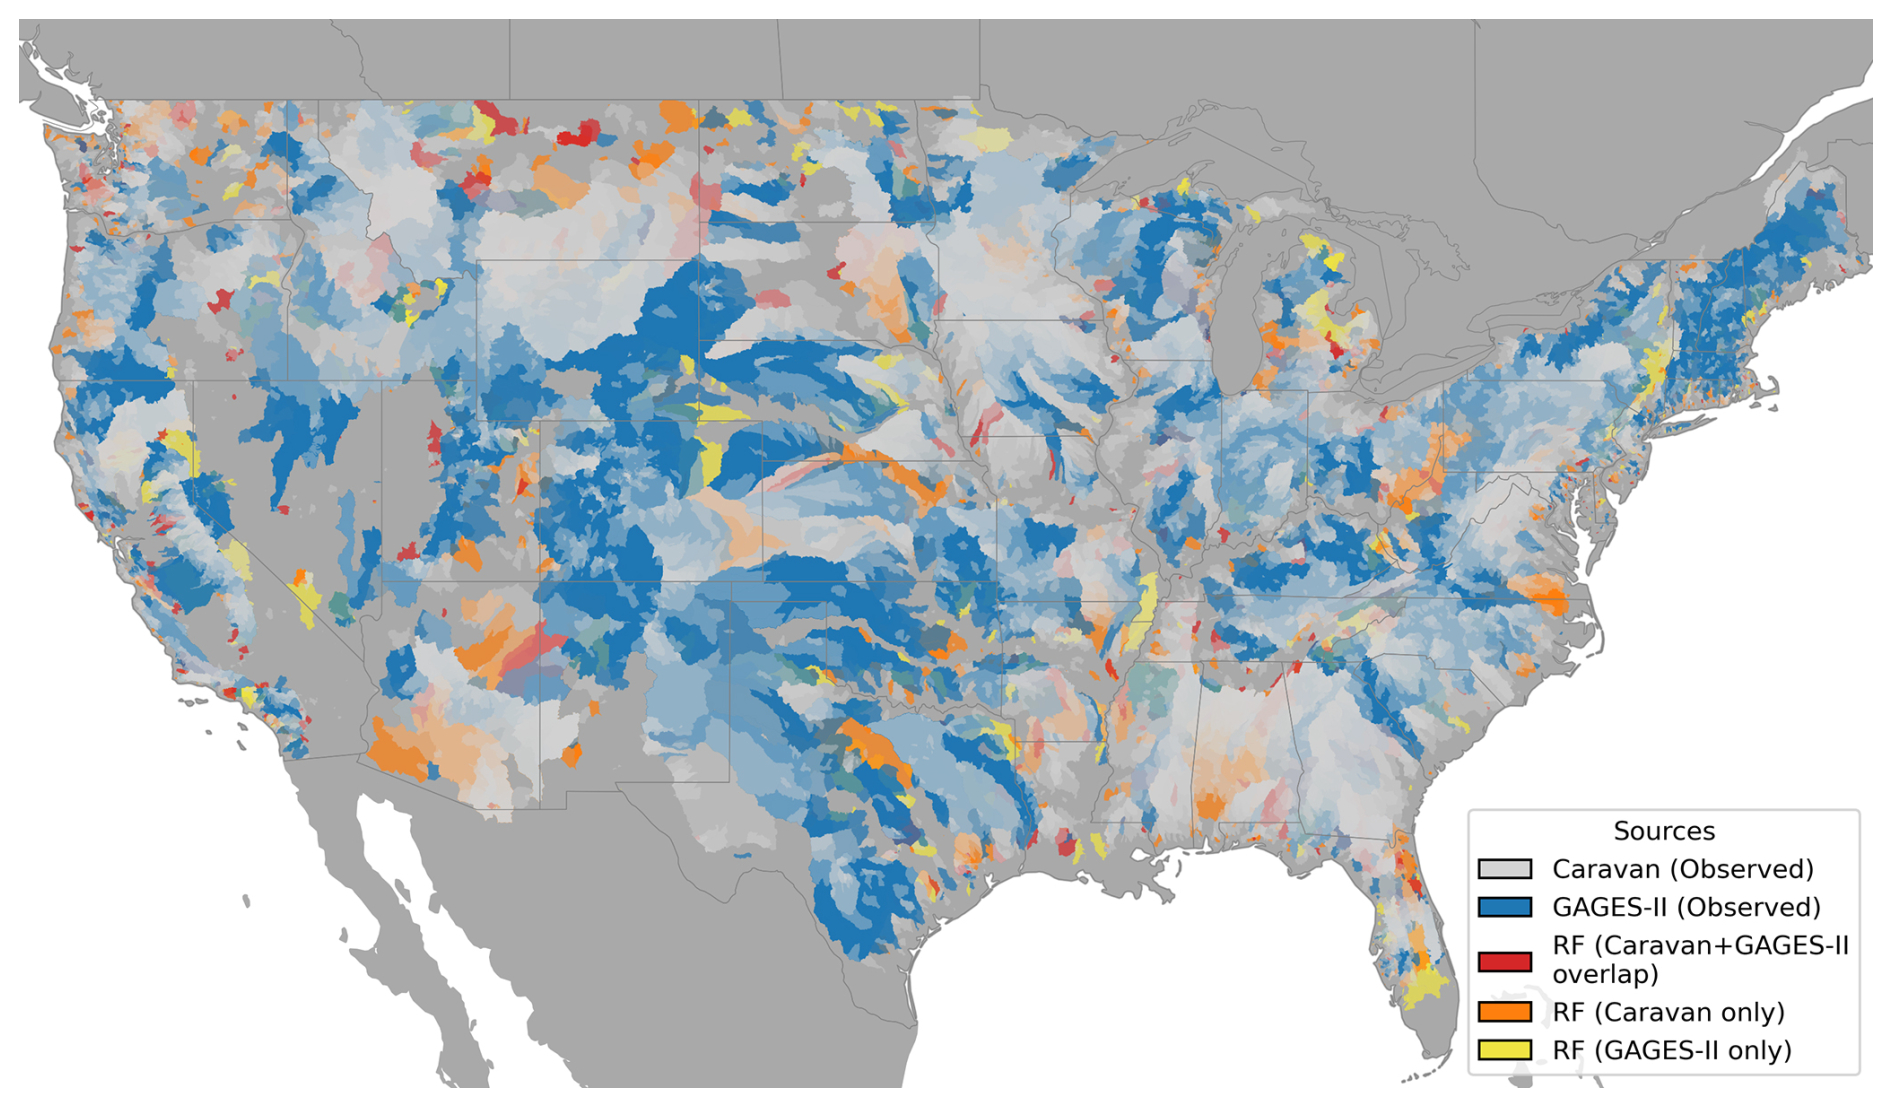
Figure 1Method used to obtain hydrologic signatures. Signatures are derived either from observed data (“Observed”: Caravan samples, n=7465; GAGES-II samples, n=2807; total n=10 261) or predicted using random forest models (“RF”; n=3885). Predicted samples are categorized as: “Caravan + GAGES-II overlap” (present in both the Caravan and GAGES-II datasets; n=618), “Caravan only” (exclusive to Caravan; n=2424), and “GAGES-II only” (exclusive to GAGES-II; n=843). State boundaries are indicated by grey lines.
3.3 Interpretation of hydrologic signatures as process descriptors
We combined signatures calculated from observed streamflow data and predicted with random forest models to develop a comprehensive map of processes for watersheds across the U.S. (Fig. 1). A bivariate space of hydrologic signatures was used to infer process dominance. For each selected process, we used the two signatures most strongly related to the process inferred from previous work (Bolotin and McMillan, 2024; McMillan, 2020; McMillan et al., 2022; Wu et al., 2021). Each signature was categorized based on the quantiles of signatures, from low (0 %–25 %), mid-low (25 %–50 %), mid-high (50 %–75 %), to high (75 %–100 %). When both of the two target signatures had mid-high (50 %–75 %) or high (75 %–100 %) values, we interpreted this as indicative of process dominance. This bivariate matrix can highlight the complexity of hydrologic processes where two signatures do not necessarily show the same trends.
The process hypotheses tested are described in Table 1 and cover six major hydrologic processes: baseflow, watershed storage, water balance, seasonal variability, overland flow dominance, and its type. Baseflow sustains discharge across seasons and reflects groundwater connectivity, while overland flow drives stormflow and influences flood peaks. Storage governs buffering and recession dynamics, and water balance losses through evapotranspiration and deep percolation determine how much precipitation is converted to streamflow. Together, these processes span the continuum from slow to fast hydrologic response and integrate both vertical and lateral fluxes, making them essential for hydrologic theory and modelling (Bergström, 1992; Kirchner, 2009; Berghuijs et al., 2014).
3.4 Interpretation of process drivers using Shapley values
We quantified feature importance using Shapley values (Shapley, 1953), which provide a robust and consistent measure to interpret random forest models (Lundberg et al., 2018). Shapley values represent the average marginal contribution of a feature (i.e., a landscape attribute) to a prediction, given the effects from all combinations of the considered features. Shapley values allow for local and global interpretation of machine learning model predictions, helping to uncover site-specific and generalizable linkages between hydrology and landscape features (Husic et al., 2025). We used the interpretable machine learning (iml) R package (Molnar et al., 2018) to calculate Shapley values over the training data.
To evaluate the regional effects of watershed attributes, we computed summary statistics on Shapley values. Shapley values are site-specific: is the Shapley value calculated for an attribute x for a signature y at location i. Summing the Shapley values across watershed attributes x at a single location gives the deviation of the predicted signature value yi at location i from the mean signature value across all sites. To compare effects of a landscape attribute x across sites, we normalize Shapley values by the total absolute contribution from all attributes at a site i; this gives a metric for the relative contribution of an attribute x to signature y at site i as:
where A is the set of all watershed attributes, and |⋅| denotes the absolute value. To investigate which types of landscape characteristics are influential, we classified the watershed attributes into five categories (see Table 2), namely, topography, land-cover, soil & geology, human alteration, and climate.
Then, the average relative contribution of category k for signature y at location i, , is calculated as:
where Ck is the set of watershed attributes belonging to category k, and K is the number of categories (in our case, five).
3.5 Interpretation of process drivers using permutation importance
To further evaluate locally important watershed attributes, we computed permutation importance, which measures the change in model performance when a feature (i.e., a landscape attribute) is removed. Prior work has shown that permutation importance derived from random forest models trained on regional samples is more effective than a continental approach for identifying physiographic, landscape controls on hydrologic responses, as it allows assessment under consistent climate conditions (Almagro et al., 2024; Hammond et al., 2021; Holt and McMillan, 2025). Therefore, we calculated permutation importance as the average changes in mean squared error (MSE), normalized by its standard deviation using the caret R package (Kuhn, 2008), from random forest models trained on regional watershed samples. Six climate regions were defined using a Gaussian mixture model in Scikit-learn (Pedregosa et al., 2011) based on relevant Caravan, GAGES-II, and Hammond et al. (2023) climate attributes (Table S4), and separate random forest models were trained for each region. Figure S4 shows the identified climate regions
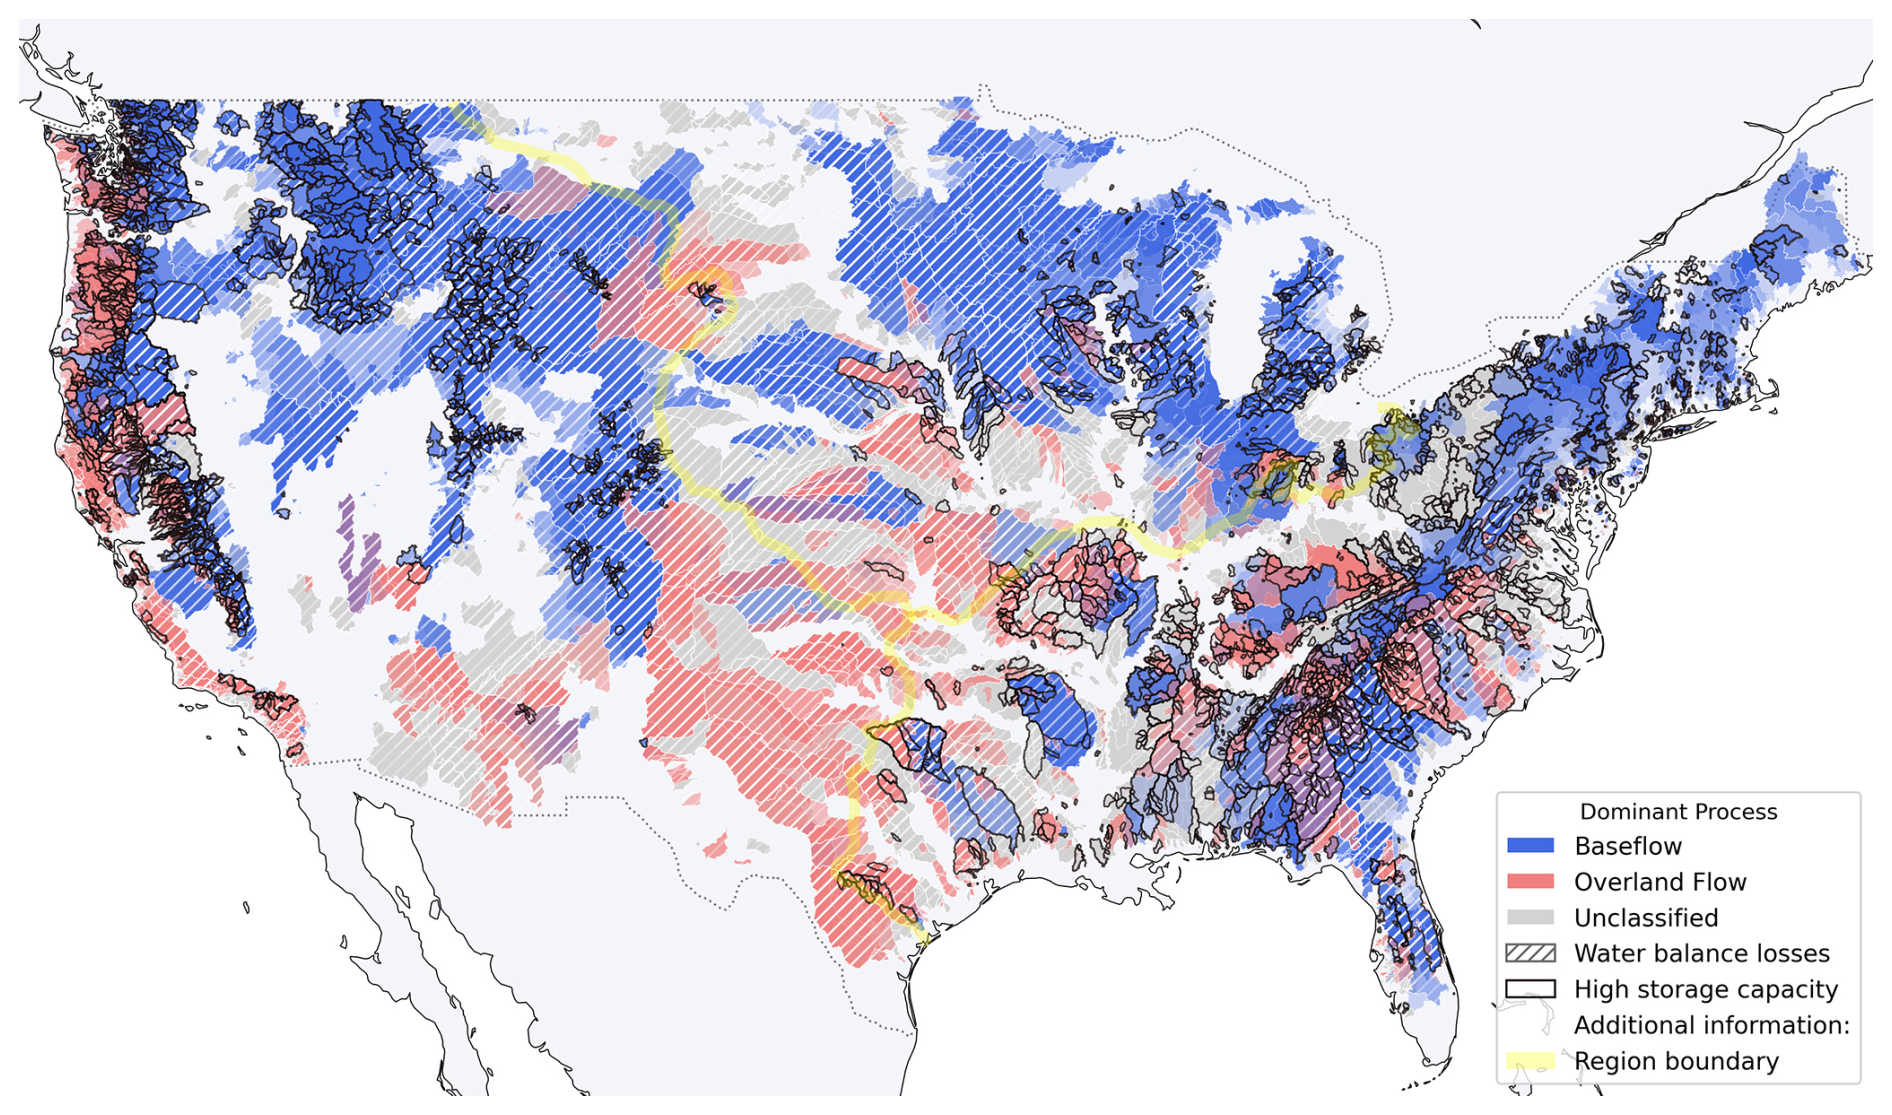
Figure 2Map of dominant processes estimated based on our hypothesis (defined in Table 1 and Sect. 3.3). Note that when baseflow and overland flow both occur, their colors are overlaid to give purple hues. “Unclassified” means a watershed is deemed neither baseflow- nor overland-low-dominant. “Region boundary” indicates the areas described in Sect. 4.2.1–4.2.3 (East and South (bottom right), Midwest and Central, West and Southwest (left in the figure)).
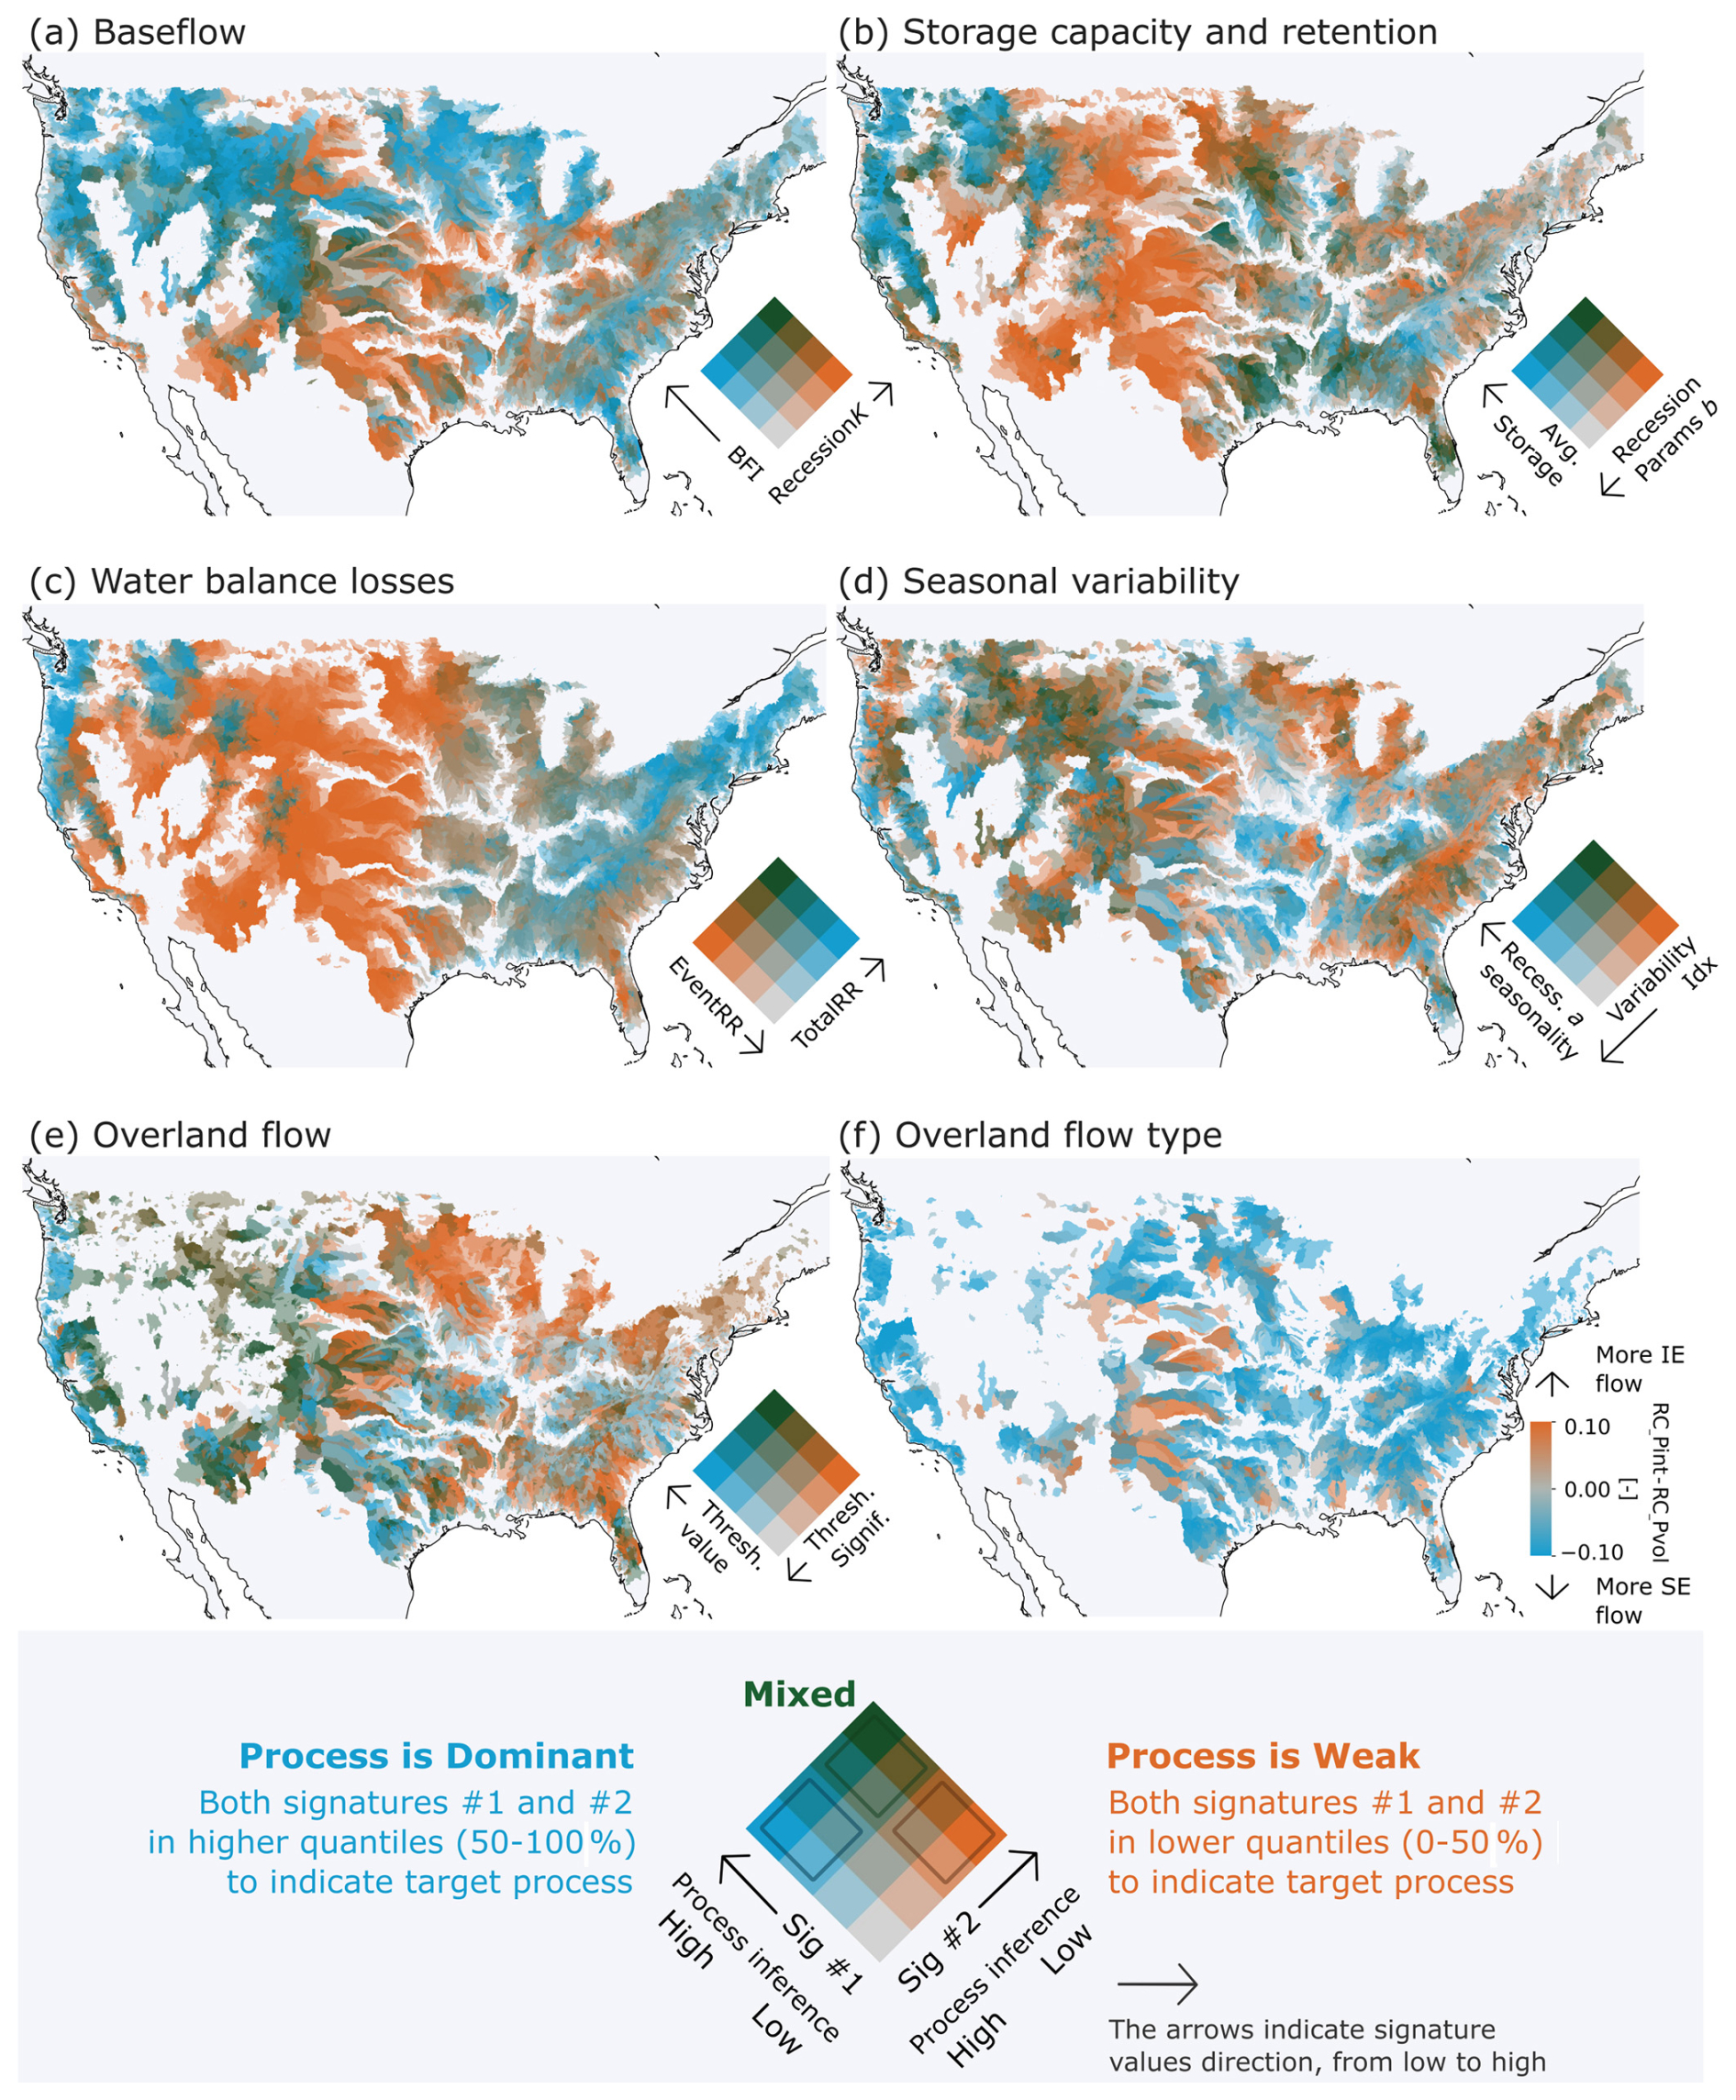
Figure 3Hydrologic signatures of each process hypothesis, shown in bivariate maps (a–e). See the legend at the bottom for explanation. The high-process quantile from (a) is used to infer “Baseflow” in Fig. 2; from (b) to infer “High storage capacity”; from (c) to infer “Water balance losses”; and from (e) to infer “Overland flow”. Panel (f) shows the differences between the two signatures related to infiltration-excess (IE) flow and saturation-excess (SE) flow (i.e., values of IE Correlation (RC_Pint) minus SE Correlation (PC_Pvol). In the overland flow panels (e) and (f), watersheds dominated by snow (i.e., where more than 20 % of annual total precipitation falls as snow) are not shown. For the overland flow type pane (f), watersheds are not shown when the correlations between the event runoff coefficient and both rainfall characteristics (i.e., storm rainfall volume and maximum intensity) are negative. For maps of each signature value, see Figs. S5 and S6. See Table 1 for signature names' abbreviations.
4.1 Mapping dominant processes across the contiguous U.S.
Figures 2 and 3 show the maps of dominant processes derived from the hypotheses outlined in Table 1. Figure 2 presents the signature of each process hypothesis in a bivariate map. Figure 3 provides a summary, displaying the four primary hydrologic processes when it is deemed dominant (i.e. both signatures are in the mid-high (50 %–75 %) or high (75 %–100 %) quantiles). Together, these maps highlight distinct regional patterns in hydrologic processes across the study area. The following sections examine these patterns in greater detail by region: the East and South. (Sect. 4.2.1), the Midwest and Central (Sect. 4.2.2), and the West and Southwest (Sect. 4.2.3). See Fig. 4 for the geographic features used to describe regional hydrologic processes.
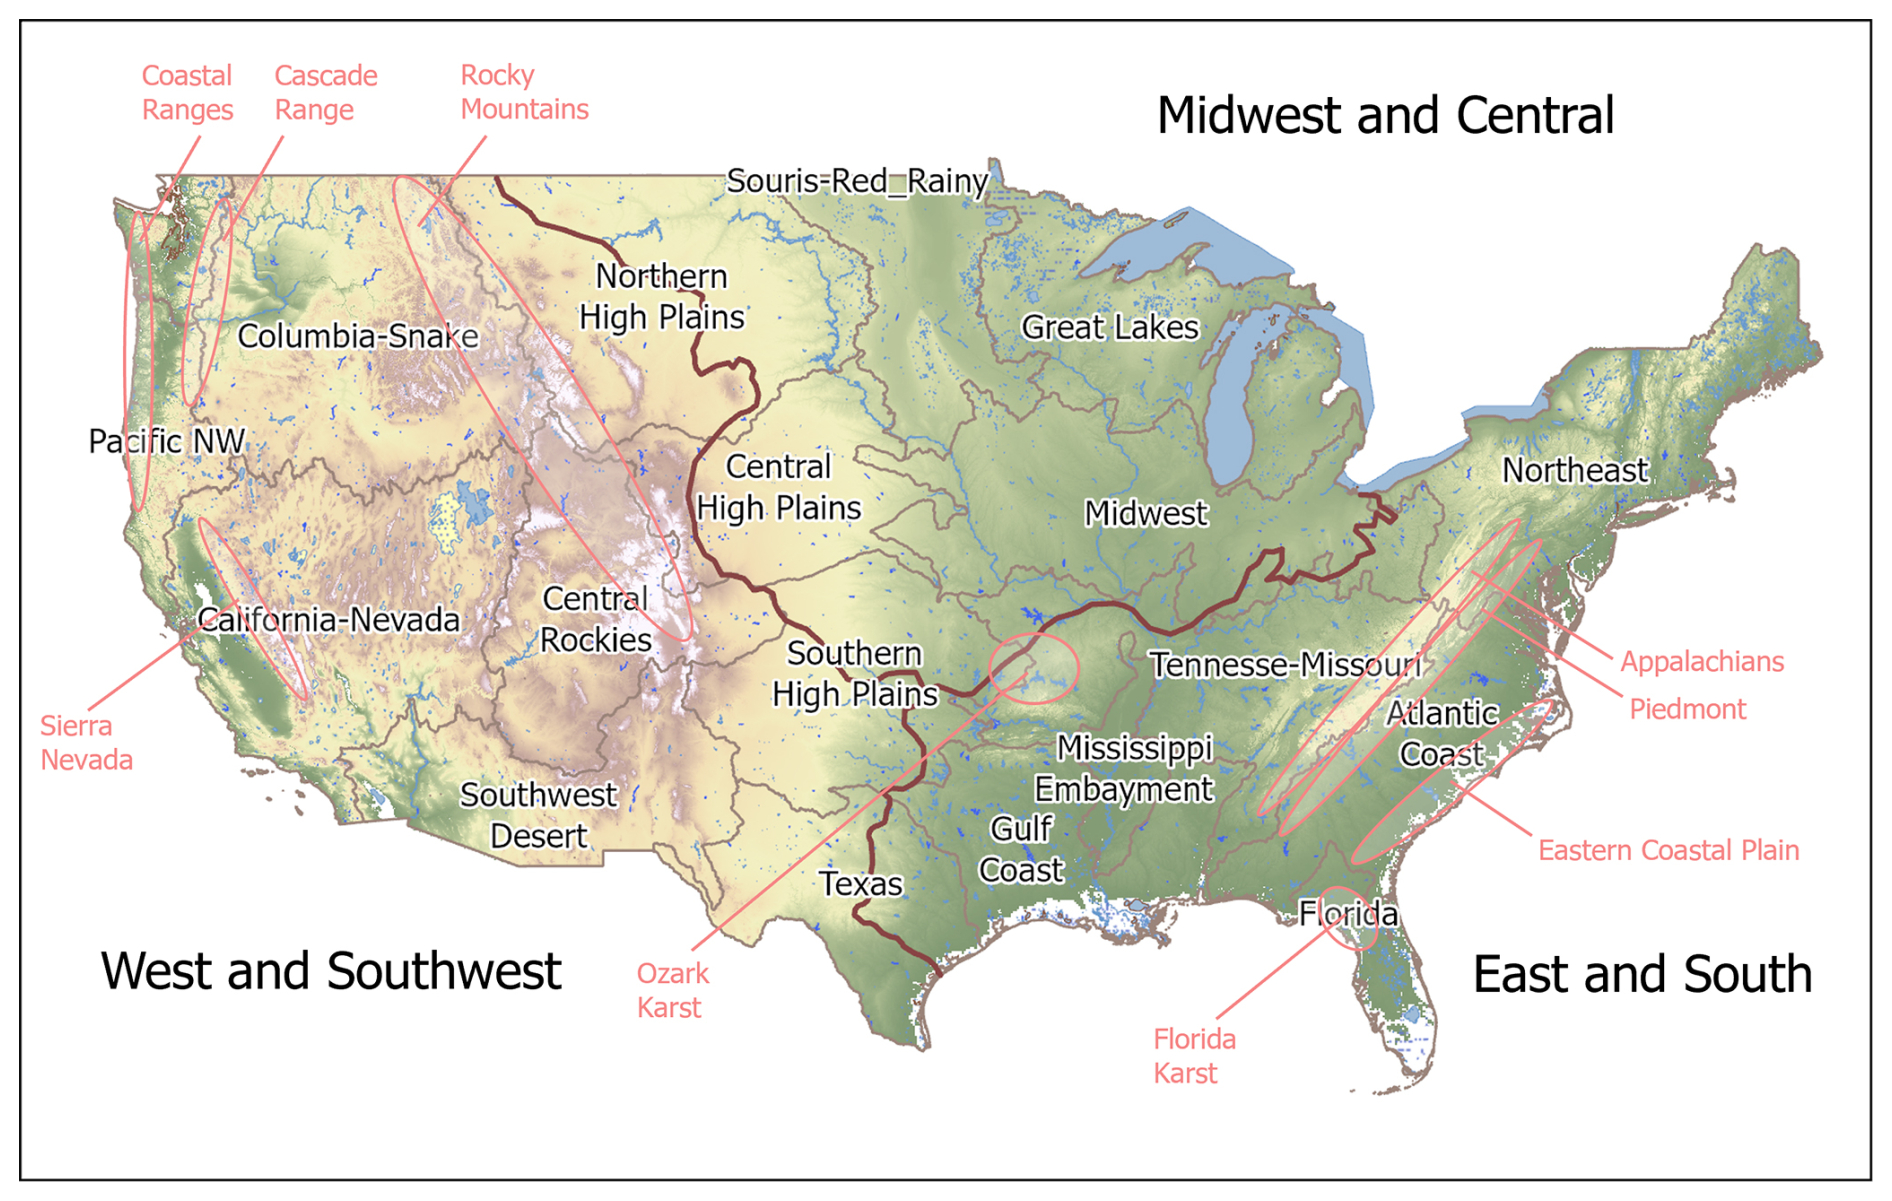
Figure 4Map of the contiguous United States showing (i) areas described in Sect. 4.2.1–4.2.3 (East and South, Midwest and Central, West and Southwest; bolded brown line) (ii) geographical boundaries used for the USGS National Water Availability Assessment (Qi and Mason, 2023; Stets et al., 2025; Van Metre et al., 2020) (beige line) (iii) topographic and geological features named in the text (pink annotations).
4.2 Spatial patterns of hydrologic processes inferred from signatures
4.2.1 Region 1: East and South
This humid region has moderate to high precipitation (1000–1500 mm yr−1; calculated based on the 10th and 90th percentiles of sample watershed attributes), with low precipitation seasonality except in Florida. Temperatures vary widely from snow-dominated areas in the NorthEast to subtropical areas in Florida, with mean annual temperature ranging from 7–19 °C (Fig. S7). The landscape is old with deeply weathered soils and characterized by predominantly low-lying elevation (mean watershed elevation ranges between 40–600 m), though there is a primary elevation gradient from the Appalachian Mountains and Piedmont to the Eastern coastal plains, with peaks exceeding 1000 m (Fig. S11). In Fig. 3, signature values show that these climate and landscape conditions produce slowly-varying, baseflow-dominated flow regimes and mid-quantile signature values showing a lack of hydrologic extremes. Runoff ratios (Total Runoff Ratio and Event Runoff Ratio; Fig. 3c) are moderate or high and seasonal variability in flow and recessions is moderate to low. Storage capacity (Average Storage) is overall moderate, but recession shapes (Recession Parameter b) are variable (Fig. 3b). Evidence for overland flow is weak with saturation excess prevailing when it occurs (Fig. 3e,f).
The gradient along the geographical transect from the Appalachian spine to the Eastern coastal plain is apparent in several processes. The Appalachians have strong baseflow influence, shown by high baseflow index and slow recessions (Fig. 3a). Nonlinear recessions (high Recession Parameter b; Fig. 3b) indicate multiple groundwater reservoirs supplying baseflow. In contrast, the Piedmont has lower baseflows and fast recessions, relating to lower storage. The Eastern coastal plain, especially towards the South, has high baseflow and moderate to slow recessions (Fig. 3a). Linear recessions suggest a single dominant groundwater reservoir supplying baseflow in this sandy, coastal plain aquifer (Fig. 3b). Lower runoff ratios in the coastal plains indicate losses to deep groundwater including offshore discharge, especially in Florida's karst area (Figs. 3c, S9). The karst area stands out for its high dynamic storage and seasonality in recessions. Saturation excess dominates overland flow in the Coastal plain (Fig. 3f), although evidence for overland flow is weak (Fig. 3e) in contrast to a previous study (Wieczorek and LaMotte, 2010) that suggests the Florida panhandle has the highest fraction of saturation excess overland flow in the US.
In inland areas such as the valleys of the Tennessee-Missouri region, baseflow is moderate and recessions are relatively fast (Fig. 3a). The Gulf Coast region has lower baseflow and faster, linear recessions. Infiltration excess flow largely occurs in the narrow ocean margin of the Gulf Coast region but does not extend far inland (Fig. 3f). Exceptions to the area's fast runoff occur in the Ozark Mountains and the west of the Mississippi embayment where limited areas of high baseflow and slow recessions occur.
4.2.2 Region 2: MidWest and Central
The landscape of the Midwest and Central region is dominated by the gradient from recently-glaciated, sandy, forested watersheds of the Great Lakes region, to the poorly-drained, clay-rich but highly developed for agriculture and populated region of the Souris-Red-Rainy and Midwest regions. Across the Midwest and Central area, mean watershed elevation ranges from 200 to 700 m, and mean annual precipitation varies from 500 to 1000 mm. Moving west into the Central and Northern High Plain regions, elevation gradually increases, precipitation decreases, and population density decreases (Figs. S11, S7, S10). The region experiences mean annual temperatures between 6 to 13 °C. The absence of major topographic barriers results in a continental climate characterized by intense thunderstorms in summer and heavy snowfall in winter.
Signature values show that storage capacity is moderate throughout the Midwest (Fig. 3b). Storage in this region is provided by a moderate snowpack and high depth to bedrock (Fig. S8). Most of the region was previously glaciated, leaving a thick layer of glacial drift. The soil texture is graded from coarse and sandy around the Great Lakes to clay-rich further South and West, forming a distinctive outer ring around the Great Lakes region (Miller and White, 1998; Fig. S9). Following this gradient, there is no significant evidence for overland flow around the Great Lakes, changing to stronger evidence further South-West (Fig. 3e, f). Some occurrence of infiltration excess is consistent with evidence of this process from Midwest agricultural watersheds (Abban et al., 2014; Davis et al., 2014; Wilson et al., 2012). Streamflow seasonality follows the same gradient (Fig. 3d), with low seasonality around the Great Lakes where sandy aquifers sustain discharge year-round, and higher seasonality further SouthWest (Miller and White, 1998; Fig. 3d). A second gradient occurs in the MidWest from West to East, following precipitation and aridity gradients (Fig. S7). In the west, high aridity leads to high water balance losses to ET and low runoff coefficients at the annual and event scale (Fig. 3c).
4.2.3 Region 3: West and Southwest
The landscape of the West and Southwest region is dominated by the mountain ranges of the Coastal Ranges, Cascades, Sierra Nevada and Rocky Mountains, with mean watershed elevation ranging from 400 to over 2700 m. Dense populations in the coastal cities give way to sparsely populated inland areas. The climate exhibits strong gradients. The Pacific Northwest and Sierra Nevada mountain ranges receive substantial amount of precipitation than interior, with mean annual precipitation ranging from 460 to over 2100 mm yr−1 across the region. The region shows a north-south temperature gradient with coastal moderation. Mean annual temperature ranges from 2 °C in northern and high mountain areas to over 20 °C in inland southern desert regions (Fig. S7). Precipitation patterns follow Mediterranean or semi-arid climates characterized by winter precipitation peaks and dry summers.
High baseflows with slow recession are prevalent across most of the Western region, where deep snowpacks drive sustained baseflow processes (Figs. 3a, S8; Barnhart et al., 2016; Tague and Grant, 2009). Inland areas tend to have faster recessions while retaining high baseflows, while coastal areas – where snow is rare – have lower baseflow while retaining slow recessions. The Southwest desert contrasts with the rest of the region, having low baseflows and fast recessions typical of the arid or semi-arid climate with water tables far below the land surface (Goodrich et al., 1997). Storage capacity and retention follow the same gradient from high in the Pacific Northwest to low in the South-East, but the high storage region is more constrained to the Rocky, Cascade and Sierra Nevada mountains (Fig. 3b). Water balance patterns contrast the pattern still further, with only the high mountains having high runoff ratios in contrast to low ratios throughout the remainder of the Western U.S. (Fig. 3c) Seasonal variability in processes is higher in the South (primarily California) where the seasonal Mediterranean climate pattern occurs with hot, dry summers and cool, wet winters (Figs. 3d, S6).
Processes in the coastal margin are markedly different from those inland. The moderating influence of the coast is strongly apparent in storage capacity (Fig. 3b): the northern Coast Ranges have lower average storage compared to high storage inland areas, while the southern coastal band has higher storage compared to low storage inland areas. Overland flows are strongly indicated all along the coast, but more weakly inland (Fig. 3e). Most overland flow favors saturation excess, although inland watersheds of the Southwest desert show areas of infiltration excess (Fig. 3f).
4.3 Inferred climate and landscape drivers of hydrologic processes
In this section, we interpret the random forest models to understand which aspects of climate and landscape are most important in controlling hydrologic processes in different regions of the U.S. We hypothesize that variable importance statistics from Shapley and permutation analysis reflect the relative importance of hydrologic process drivers. Random forest models performed reasonably well (R2>0.4) for most signatures (Fig. 5), consistent with previous studies using similar model setups (Addor et al., 2018; Beck et al., 2015; Bolotin and McMillan, 2024; Kuentz et al., 2017). Performance was higher for baseflow, water balance loss, and seasonality signatures, but lower for overland flow signatures. Figure S12 presents the regional model performances for each signature.
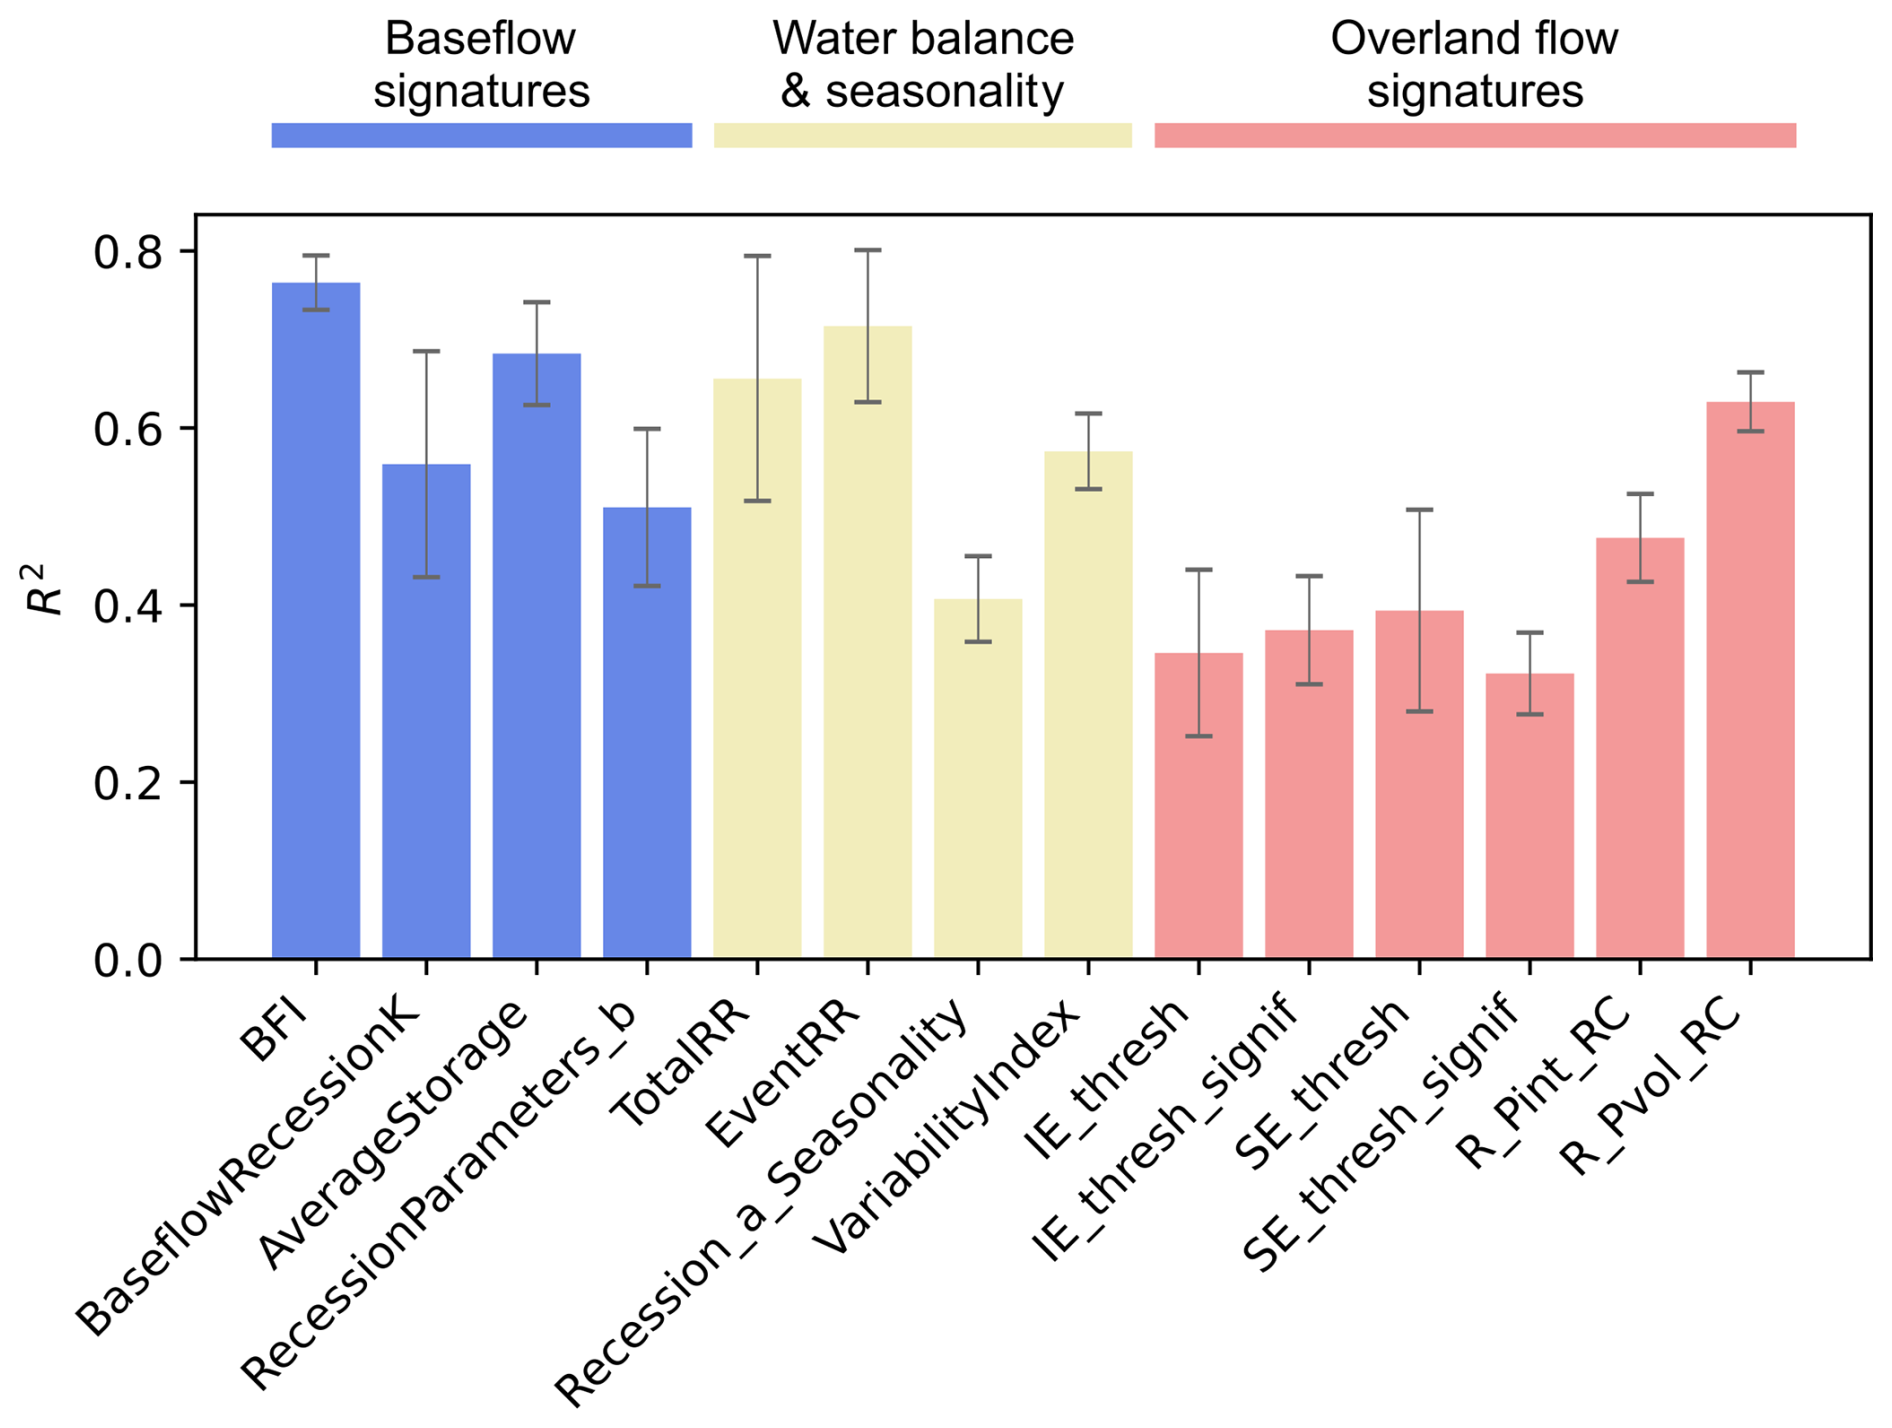
Figure 5Ten-fold cross-validation performance of the random forest model trained on 4748 CONUS-samples, where gauge IDs overlapped with Caravan and GAGES-II. Bars show the average R2 between observed and predicted signatures, with error bars representing the standard deviation. See Table 1 for signature definitions.
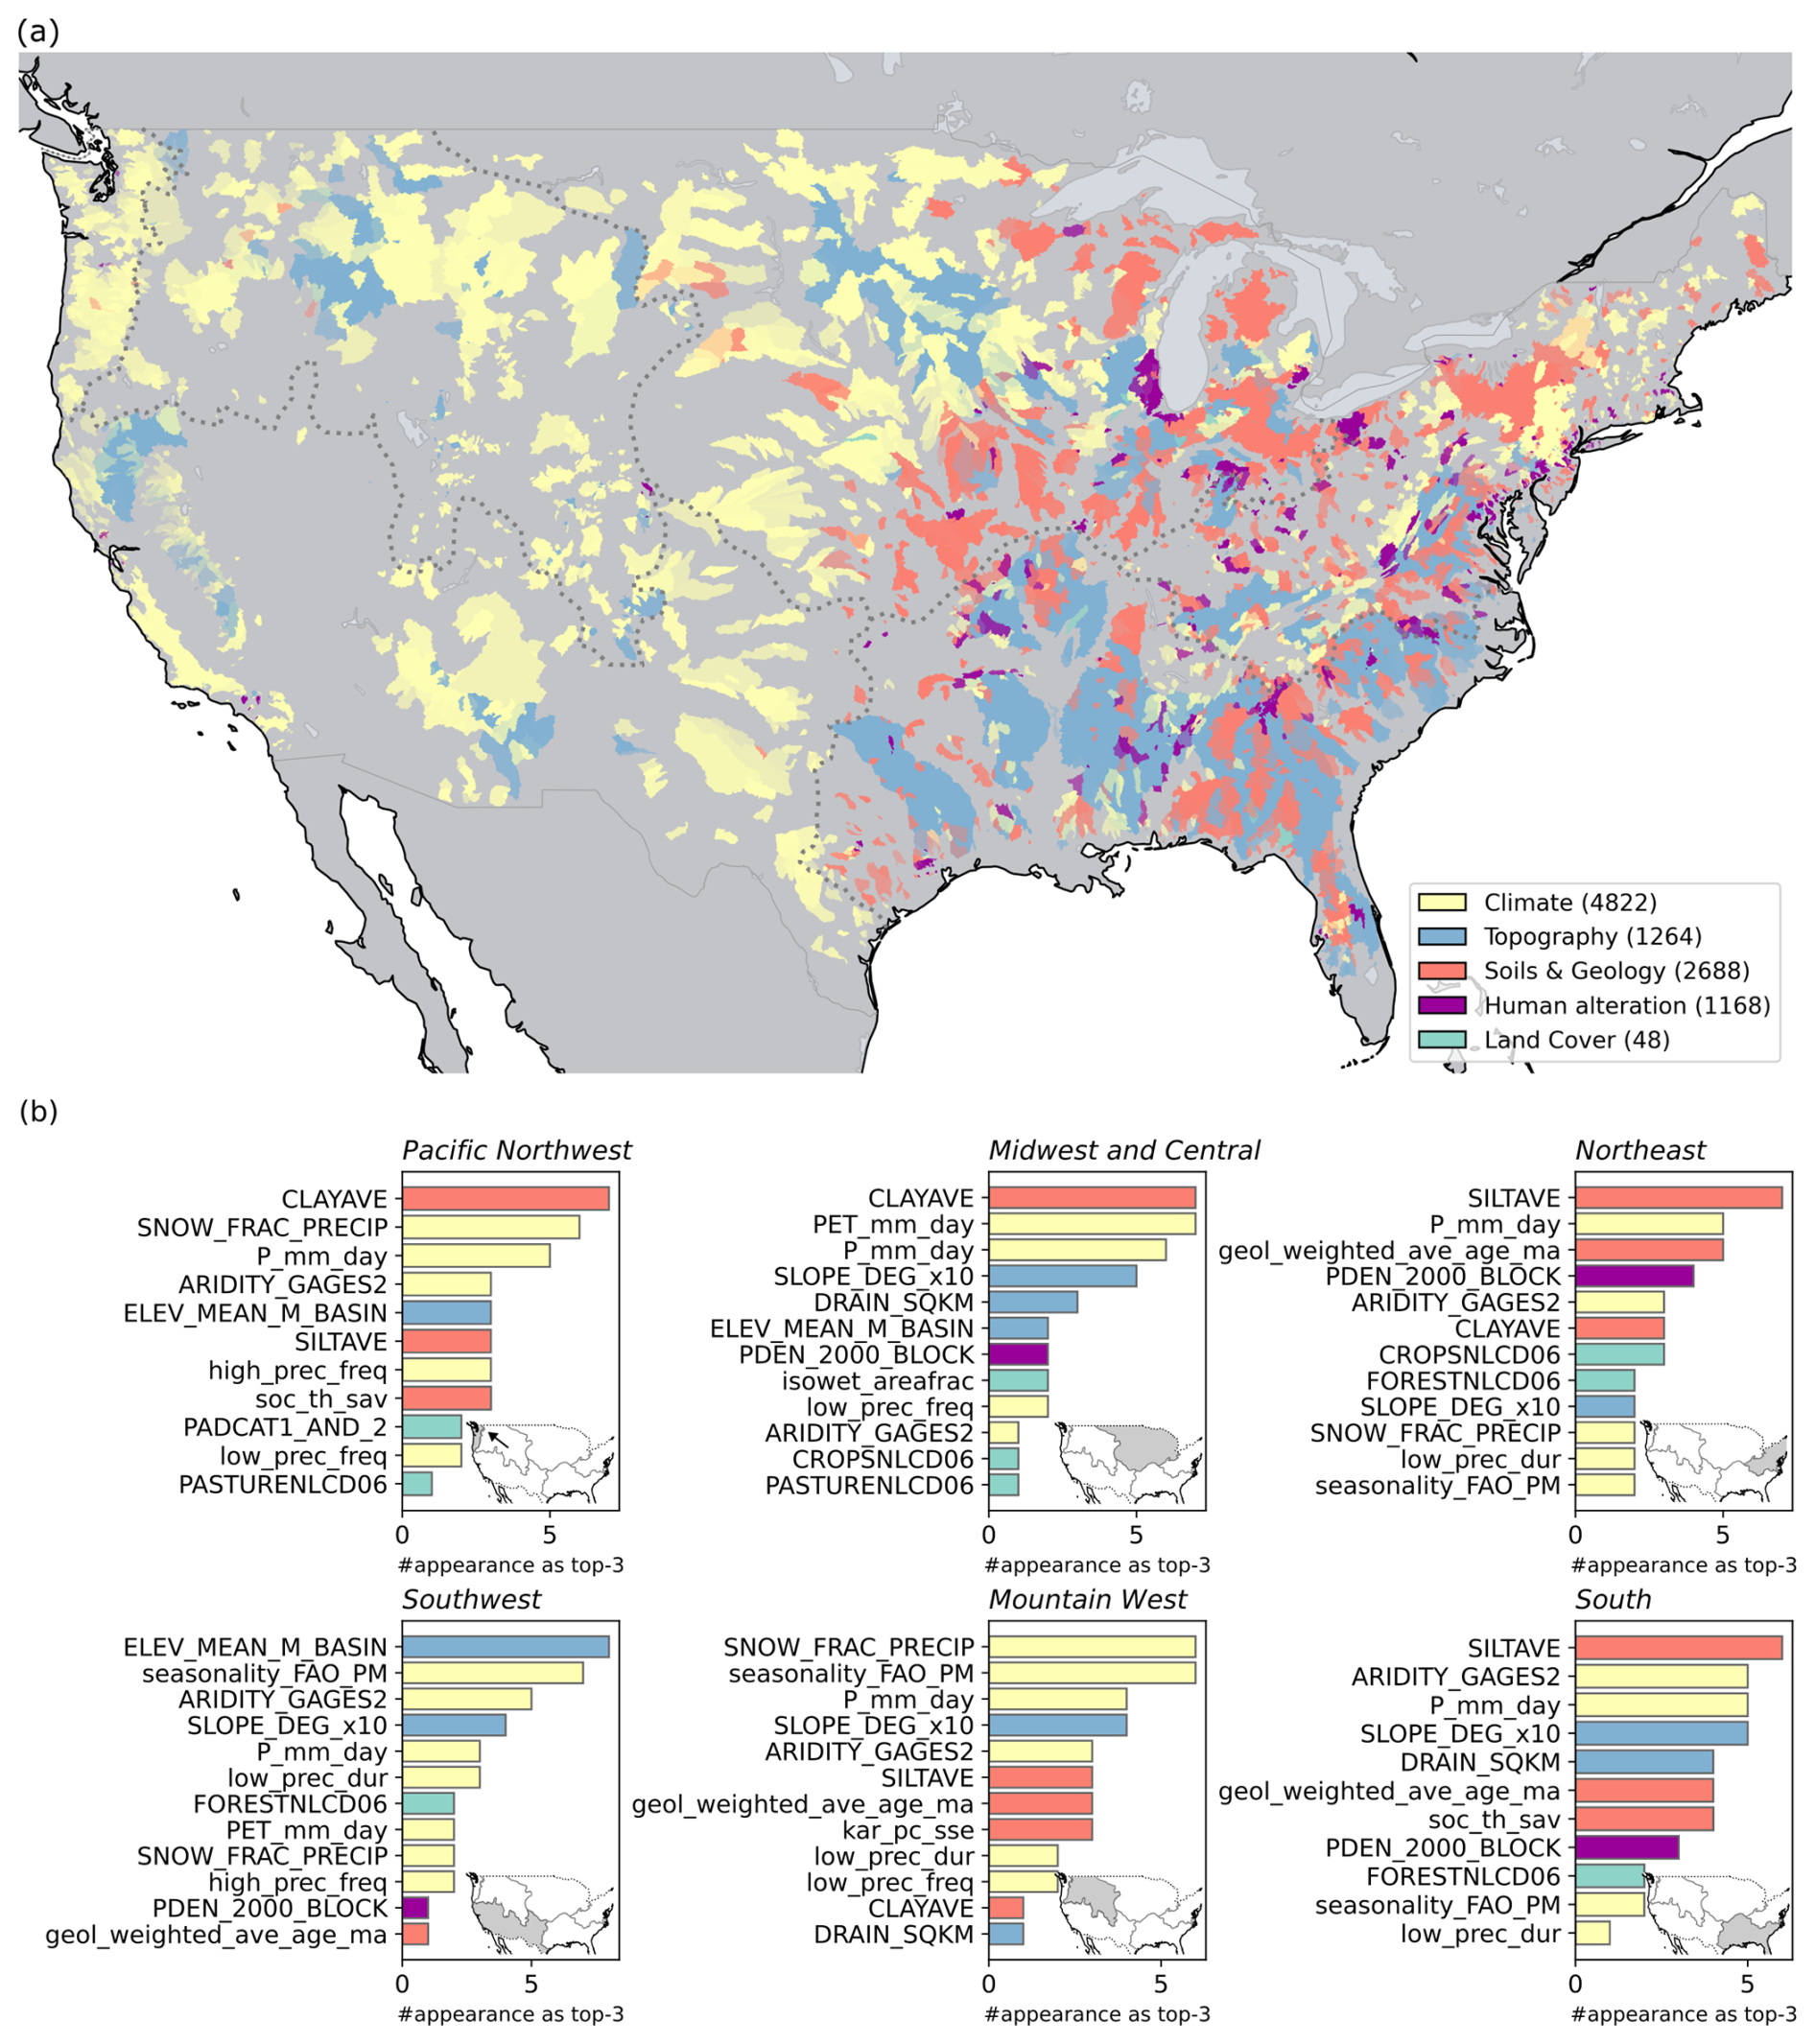
Figure 6(a) The landscape attribute category that contributes most to hydrologic responses was identified based on the average relative contribution of each category, (derived from Shapley values; see Sect. 3.4). For each watershed, the most important category k was determined using the median of across all hydrologic signatures. Results are displayed for the watershed samples included in the random forest training. Numbers in the legend indicate the frequency that each category was identified as the most important. (b) Frequency of watershed attributes ranked among the top three most important variables in permutation importance (IncMSE %) across all signatures in six U.S. climate regions. The x axis indicates how many times each attribute appeared in the top three. See Sect. 3.4 and Table 2 for attribute names.
Figure 6 provides an overview of variable importance results: Figure 6a focuses on spatial patterns, showing the landscape attribute category that has the strongest contribution to predictions of signatures and processes for each watershed, calculated using aggregated Shapley values; Fig. 6b provides deeper insights into the ranking of landscape attributes, ordered by permutation importance, for predicting signatures in each region. Figure S13 complements Fig. 6a by showing the importance of landscape attribute categories in each region, based on permutation importance.
4.3.1 Region 1: East and South
In the East and South, a wide variety of landscape attribute categories dominate process predictions, including topography, soils and geology, climate and human alteration (Fig. 6). Climate attributes dominate in cooler areas in the Northeast and along the Appalachian spine, while topography attributes dominate on the Eastern coastal plain. Along the Gulf Coast, either climate or soils and geology may dominate. Human alteration attributes dominate clusters of watersheds around cities including New York, Philadelphia, Washington D.C., Raleigh and Atlanta.
Overall, and particularly for signatures relating to storage and water balance in the East and South Region (Total Runoff Ratio, Event Runoff Ratio, Recession seasonality, Average Storage, Recession Parameter b), the random forest models show that climate drivers are less important than in the rest of the U.S., and soils and geology, topography, and land cover drivers are more important (Figs. 6, S13). Human influence (population density) is a more important driver here than in other regions across most signatures, consistent with large areas of high population (Fig. S10). In addition to the major cities, highly developed areas of Western Florida show anomalous areas of low baseflow, as do developed Piedmont areas (Zimmer and Gannon, 2018).
In the NorthEast, across all signatures, the drivers that most often appeared in the top three controls of random forest performance were Silt fraction, Precipitation, Geologic age and Population density – representing the effects of geology, soils, climate and human development (Fig. 6b). Climate characteristics appear more often for signatures related to water balance and overland flow. In the South, Silt fraction, Aridity, Precipitation and Slope occur most often, representing gradients in elevation and soils from the Appalachians to the coastal plain and into Florida (Figs. S9, S13).
4.3.2 Region 2: MidWest and Central
In the Midwest and Central area, a wide variety of landscape attribute categories dominate process predictions, including topography, soils and geology, climate and human alteration, showing strong spatial patterns (Fig. 6). Soils and geology attributes dominate in the Great Lakes region, and in the arc of clay-rich soils in the High Plains and Midwest regions (Fig. S9). A mixture of climate and topography attributes dominate in the Souris-Red-Rainy region. Human alteration attributes dominate in clusters of watersheds around Chicago, Detroit and Cleveland.
Overall in the Midwest and Central area, the random forest models show that land cover and topography drivers are more important than in the rest of the U.S., while climate drivers are less important. Across all signatures, the drivers that most often appeared in the top three controls of random forest performance were Clay fraction, PET, Precipitation and Slope – representing the effects of soils, climate and topography (Fig. 6); this is consistent with the gradual variation in signatures' spatial patterns accompanying gradients in glacial drift and climate in this region, as discussed in Sect. 4.2.2. Despite the flat topography of the region, several topographic attributes appear in the top ten, perhaps reflecting the effect of unusual topographic features such as the driftless area. Land cover metrics (wetland, cropland, pasture) were secondary drivers, appearing for signatures related to storage and overland flow.
The impact of climate is spread between multiple drivers: PET, Precipitation, Low precipitation frequency and Aridity. Climate drivers in the Midwest and Central area show multiple distinct spatial patterns, with aridity and low precipitation metrics showing an east-west gradient, temperature and PET having a north-south gradient, and precipitation and seasonality having a Northwest-Southeast gradient (Figs. S7, S8). Thus, each part of the Midwest and Central area has a unique holistic climate combination. Climate patterns differ distinctly from the NorthEast-Southwest pattern of the soils and land cover.
4.3.3 Region 3: West and Southwest
In the West, climate attributes dominate process predictions across most watersheds in the Pacific Northwest and Mountain West (Figs. 6a, S7). Some mountain areas have dominant topographic attributes, and topography drivers are more important in the Southwest region compared to the wider U.S.. Climate properties that appear most often include Snow fraction, Precipitation, Aridity and Seasonality (Fig. 6b: regions Pacific Northwest, Southwest, Mountain West). These attributes describe the primary climatic features of the West and Southwest U.S., which are governed by precipitation and aridity gradients from North to South, and from coasts to inland (Fig. S7). Inland mountain chains influence flow regimes by providing spring snowmelt and mountain block recharge, among the many influences of topography on hydrologic processes (Gnann et al., 2025). These controls are demonstrated by the importance of snow fraction alongside topographic attributes, elevation and slope. Soil control on runoff process is seen by the importance of clay fraction in the Pacific Northwest, reflecting Oregon's common clay soils (Miller and White, 1998).
This study creates comprehensive maps of hydrologic processes across the contiguous United States by using machine learning to analyze streamflow signatures and connecting these signatures to dominant watershed processes. The analysis from over 10 000 watersheds shows distinct regional patterns in estimated hydrologic processes and its potential drivers. These process maps provide novel information for selecting appropriate hydrologic models across large domains and help hydrologists anticipate how watersheds will respond to environmental changes such as altered climate or land use. In the following sections, we discuss how these maps provide new benchmarks (Sect. 5.1), inform hydrologic modelling (Sect. 5.2), and outline directions for future work (Sect. 5.3).
5.1 New benchmark maps of process understanding over large domains
Our results build on previous work to map hydrologic processes and drivers. Our map of baseflow process importance shows similar patterns to previous studies into baseflow and groundwater contribution to streamflow (Beck et al., 2013; Santhi et al., 2008; Xie et al., 2024). As with those studies, our approach of using observations and machine learning methods provides finer detail than can be estimated using statistical interpolation or by hydrologic or climate models. By combining multiple recent datasets, we increase the number of observations used in our analysis. In our study, we used >10 000 observed watershed data within CONUS, representing a substantial advancement compared to the >600 to >3000 observation samples used in previous studies (Addor et al., 2018; Beck et al., 2013, 2015; Janssen and Ameli, 2021; Wu et al., 2021). Our analysis therefore provides a new benchmark, offering the most comprehensive coverage and highest spatial characterization of hydrologic processes across the contiguous United States to date. While larger datasets have been analyzed elsewhere, for example, >8000 watersheds (Santhi et al., 2008), >23 000 watersheds (Xie et al., 2024), those efforts focused exclusively on baseflow index. Beck et al. (2013) found sometimes differing drivers of baseflow index and recession slope despite their close connection: by using bivariate plots, we could more clearly highlight regions where patterns of these two signatures diverge. Those areas include the Pacific Northwest coast with lower baseflow index but slow recessions, and the central high plains with high baseflow index but fast recessions.
Previous studies investigated patterns of overland flow generation across the U.S. using soil maps and rainfall intensity (Buchanan et al., 2018) streamflow signatures (Wu et al., 2021) and modeling approaches (Wolock, 2003b). Like us, Buchanan et al. (2018) and Wu et al. (2021) found infiltration excess runoff important throughout the high plains, and saturation excess in the valleys of the Tennessee-Missouri region, and a mixture of saturation and infiltration excess in the Southwestern U.S. Substantial overland flow occurs in Southwest chaparral systems (Valeron and Meixner, 2010), and although deep groundwater tables suggest infiltration excess, we found a mixture of mechanisms. This may reflect vegetation shifting the inferred overland flow mechanism toward saturation excess. Infiltration excess is inferred when overland flow is related to storm intensity rather than storm size. In arid and semi-arid catchments, vegetation can locally increase infiltration capacity and soil water retention, reducing the extent of infiltration excess overland flow (Stein et al., 2021). Additionally, where smaller storms are intercepted by canopies, signatures may incorrectly attribute the runoff to saturation excess rather than infiltration excess. However, our results are supported by global studies that show saturation excess is always more common than infiltration excess even in arid regions, as saturation excess is generated in riparian zones and topographic convergence areas where water tables are higher (McMillan et al., 2025).
By mapping and categorizing the primary drivers of runoff processes, we can untangle which physical characteristics drive the hydrologic response in each region. In the East and South, soil, geology, and topography emerged as primary drivers, which is consistent with regional hydrologic process knowledge. Topography is important in the Appalachian Piedmont, where wide and wet valley bottoms generate fast responses (Zimmer and Gannon, 2018). Soils are important along the Gulf Coast where clay-rich soils promote infiltration-excess overland flow (Miller, 1999; Fig. S9), producing mixed storage and water balance signatures despite deep bedrock (Fig. S8) and semi-consolidated sand aquifers; and on the Eastern Coastal Plain where sandy soils, seasonal flooding, and wetlands likely support a single dominant groundwater reservoir supplying baseflow (Fig. 3b; Holt and McMillan, 2025; Hupp, 2000). The machine learning approach is especially powerful for this purpose, as multiple landscape attributes often contribute simultaneously to the hydrologic response.
Our maps of primary drivers based on Shapley values extend previous work to analyze the drivers of hydrologic signatures. For example, Addor et al. (2018; their Fig. 3) show that climate (aridity, seasonality, snow fraction) is the primary driver across most signatures, with topography (elevation, slope) and land cover (forest, leaf area index) being secondary drivers. Figure 6a similarly shows climate and topography as dominant, but adds spatial information to show that, for example, climate is dominant in the mountainous western U.S., but soils and geology dominate the Midwest and much of the Northeastern U.S. Geological age, a recently-proposed attribute to summarize watershed geology, was often in the top random forest attributes (Holt and McMillan, 2025). This highlights the need and opportunity for development of new landscape attributes that characterize the subsurface, echoing the call by Tarasova et al. (2023) and do Nascimento et al. (2025).
In four of the six regions, soil texture, particularly silt or clay fraction, was identified as a recurring primary driver (Fig. 6b), though their roles differ by context. In the Northeast, silt dominates variable importance; silt is found in glacial till layer and supports high water storage and baseflow (Shanley et al., 2015) while facilitating subsurface stormflow under wet conditions (Detty and McGuire, 2010). In the South, despite silt being identified as a primary driver, clay is the dominant soil texture in many areas (Miller and White, 1998); in the Mississippi embayment, extensive confining units of clay and silt separate aquifers and control the groundwater flow (Renken, 1998; Clark et al., 2011). These two cases suggest that Shapley or permutation-based methods may not fully separate correlated variables due to their treatment of joint variable distributions, and high clay content may be implicitly captured through the absence of silt in regional analyses.
5.2 Informing model selection and evaluation
Our results support hydrological modeling by enabling hydrologists to check whether key processes in a watershed are well-represented by a candidate model prior to application. A wide range of hydrologic models with differing process representations, structures and complexities are available (Knoben et al., 2020). Hydrologists must make choices on whether to include simulations of additional processes such as snowpack or deep groundwater, and the complexity required such as including energy balance at the land surface. Our maps of hydrologic processes provide a pre-screening tool to match hydrological models with appropriate process representations to regions. This approach aims to reduce model structural errors by discouraging use of models ill-suited to the dominant processes (e.g., using a bucket model in overland flow-dominated regions).
Many previous studies have assessed preferred model structure in individual research watersheds, often using in-depth data analysis to ensure that modeled processes are consistent with observed processes (e.g. Hrachowitz et al., 2014; Kavetski and Fenicia, 2011). This study provides a method to support transparent model justification in applied studies without the resources to conduct model structure investigations, and to upscale model structure decisions to large domains. For example, if selecting models from the MARRMoT toolbox (Knoben et al., 2020), models for regions of dominant overland flow should include saturation excess and/or infiltration excess pathways, and models for regions of complex storage and retention should include multiple parallel groundwater reservoirs. The ability to choose appropriate models for thousands of watersheds is needed for new, flexible model frameworks such as the U.S. Next-Generation National Water Model Framework (Cosgrove et al., 2024; Johnson et al., 2023; Ogden et al., 2026). Our observation-based method complements previous large-domain model-based methods that use analysis of model sensitivities (Markstrom et al., 2016) and performance (Prieto et al., 2021; Spieler et al., 2020) Therefore, where hydrologists seek to evaluate models against process representation, this study offers an opportunity to enhance model benchmarking frameworks by adding process realism as a metric.
5.3 Limitations and future work
The hydrologic process maps produced by this study are limited to the contiguous U.S. Recent streamflow observation datasets offer the opportunity to extend this method to other regions or globally. Such datasets include the community Caravan dataset (Kratzert et al., 2023), and the international dataset of watersheds with limited human influences, Reference Observatory of Basins for International hydrological climate change detection (ROBIN; Turner et al., 2025). If extending the method globally, caution is advised with scaling, in order to represent different ranges of signature values in different regions. In this study, we plotted signature values as quantiles based on the U.S. distribution, but other countries may have very different signature distributions (McMillan et al., 2022). Therefore, watershed processes that are considered important in a U.S. context, may be considered less important in a global context. Further, some regions of the U.S. are excluded or poorly represented in the dominant process maps presented in this paper, due to a low spatial coverage of USGS stream gages. For example, there are significant gaps in the arid southwest where perennial streamflow is rare (Kiang et al., 2013; Krabbenhoft et al., 2022). In such regions there is a need for alternative process-mapping methods that do not rely on streamflow records.
Hydrological signatures in this study are long-term averages of the multi-year streamflow dynamics, which may not fully capture temporal variability in watershed processes. Future studies should account for long-term hydroclimatic changes (Hobeichi et al., 2022; Gudmundsson et al., 2025), as well as inter-annual variability (Vogel et al., 1994) and seasonal variations in watershed function (Payn et al., 2012; Gomi et al., 2008). Another complication is that hydrologic signatures are often confounded by multiple processes (McMillan, 2020, 2023), whether driven by natural flow dynamics or impaired by human activities. For example, water abstraction by reservoirs reduces downstream flow variability and increases water balance deficits (Salwey et al., 2023; Veldkamp et al., 2017), but changes in vegetation or climate could induce similar effects. Disentangling these impacts remains challenging without testing narrower hypotheses about watershed function, incorporating expert knowledge, or having detailed information about human interventions. In this study, we partially mitigated this issue by using multiple signatures to characterize processes, and by representing human alteration through population density, which showed strong explanatory power for the signatures. Nevertheless, considerable effort is still needed to isolate the combined impacts of multiple processes, as well as the effects of urban development and agricultural practices on flow dynamics (Grantham et al., 2022) for improving the large-scale application of signatures.
A limitation of this study that would become more apparent at a global scale is the quality of precipitation, streamflow, and attribute data. A previous study noted issues with limited quality and consistency of the global attribute data for soils and geology that reduced their predictive power (Beck et al., 2015). Continental scales necessitate the use of gridded precipitation products, but in areas with low density of observations these products may be insufficient to analyze localized, flashy processes such as infiltration excess flow (McMillan et al., 2023). In small, headwater watersheds, precipitation grid size may be large compared to watershed area, and headwaters are also underrepresented in streamflow observations (Golden et al., 2025). Additionally, errors in watershed boundary delineation would affect signatures that use drainage area to normalize flow, such as runoff ratio (Total Runoff Ratio, Event Runoff Ratio) and water balance (Average Storage). In snowy areas, signature values can be compromised because liquid water inputs to the watershed come from snowmelt rather than directly from precipitation. In our study, we excluded snow-dominated watersheds for signatures related to overland flow, as these require event-scale surface water input that are particularly affected by frozen or snowmelt conditions. Products such as NLDAS3 (Case et al., 2025) or surface water inputs considering rain-on-snow and snowmelt (Hammond, 2024; Hammond and Kampf, 2020) may provide future abilities to estimate overland flow processes in snow areas using estimates of hourly snow accumulation and melt. While our study used potential evapotranspiration (PET) information in only one signature (Average Storage), uncertainty in PET is a major issue of global datasets and needs to be addressed (Clerc-Schwarzenbach et al., 2024; Destouni and Zarei, 2024) before this approach can be expanded to a variety of (eco)hydrologic processes.
A further limitation is the extent to which continental scale maps of dominant processes can be validated. Large-domain signature datasets can be evaluated for data quality, for interpolation quality using cross-validation, and compared with previous datasets. However, it is more difficult to determine how accurately signatures relate to processes over large domains. Research watersheds offer “ground truth” points at which processes are already well understood (Penna, 2024). Previous studies used a handful of U.S. critical zone observatory watersheds for evaluation (McMillan et al., 2022). However, the large number of past and present research watersheds across the globe offer an interesting future opportunity for wider-scale validation of process mapping techniques (McMillan et al., 2025; Sebestyen et al., 2025). Similarly, validation of process drivers remains challenging. While Shapley values and permutation importance provide explanatory power for random forest models, they have some limitations. Both metrics characterize model interactions within a given dataset; therefore, the variety of processes covered in the dataset matters, and data or model uncertainties may propagate into the interpretations (Husic, 2025). Shapley values do not capture joint distributional effects among multiple interacting variables (Lundberg and Lee, 2017). Developing an explanatory framework that maximizes both model performance and interpretability remains an ongoing research area in hydrology (Robert Maier et al., 2024; Willard et al., 2024).
A fundamental question in hydrology is how hydrologic processes are organized over large scales, and how they are controlled by climate and landscape (Blöschl et al., 2019). In this study, we contribute towards answering this question by mapping hydrologic processes and their drivers across the contiguous U.S. Our approach used hydrologic signatures to describe streamflow dynamics, and connected these dynamics to dominant processes in the associated watersheds using established relationships between signatures and watershed processes. We analyzed 14 146 gauged U.S. watersheds; our map of processes was based on observational data from 10 261 gauged sites and extended using random forest predictions to an additional 3885 watersheds with insufficient record length or completeness. Our method enables knowledge transfer from gauged basins with well-established conceptual models to ungauged or poorly instrumented watersheds.
Our results comprise maps of hydrologic process importance across the contiguous U.S., including baseflow, overland flow, water storage, seasonal variation and water balance processes. Using interpretable machine learning methods, we create maps of process drivers that explain which climate and landscape attributes are dominant in controlling hydrologic processes in each watershed and each region. We find clear patterns at the continental scale in hydrologic processes, with infiltration excess overland flow dominating the high plains., saturation excess flow prevalent in the valleys of the Tennessee-Missouri region, and varying baseflow contributions across regions. The novelty of this study is in demonstrating that incorporating more detailed landscape attribute elucidates non-climate variables as dominant controls on hydrologic processes, even with a large sample across multiple climate regions. Specifically, the results showed that climate primarily controls hydrologic processes in the western U.S., while soils and geology dominate in the Great Lakes region, topography controls processes in the Southeast, and human influences are most important around large cities across the East.
Our findings extend and generalize process understanding from research watersheds to large domains, revealing regional heterogeneity within broader physiographic provinces that are often treated as hydrologically uniform. Hydrologic process maps provide essential support for new, large-domain model frameworks that must select model structure across thousands of watersheds. These maps enable hydrologists to select models that adequately represent the dominant processes of a watershed. Identification of dominant processes in each region further enables hydrologists to anticipate streamflow response to environmental change, by identifying which processes are most sensitive to shifts in driving variables. Such analysis has the potential to support scenario testing for future land use or climate, to guide selection of green and grey infrastructure compatible with dominant processes, and to inform risk assessments for regions prone to flash flooding, streamflow depletion, or altered seasonal flow regimes.
Code used for analysis is available at https://doi.org/10.5281/zenodo.20185650 (Araki et al., 2026) and as a continuously updated version via GitHub at https://github.com/RY4GIT/signature-prediction (last access: 5 June 2026) and at https://github.com/RY4GIT/Wetland_GeologicAge_Attributes (last access: 5 June 2026). Caravan attributes for GAGES-II only watersheds were calculated using https://github.com/kratzert/Caravan (Kratzert et al., 2023). Hydrologic signatures are calculated using TOSSH toolbox https://github.com/TOSSHtoolbox/TOSSH (Gnann et al., 2021a).
The hydrologic signature datasets, derived from observed data and predicted using random forest models, are deposited at https://doi.org/10.5281/zenodo.20185650 (Araki et al., 2026). The datasets are visualized and accessible as interactive maps at https://ry4git.github.io/maps/sig-prediction.html (last access: 10 June 2026) for demonstration purposes. The Caravan Version 1.5 dataset is available at https://doi.org/10.5281/zenodo.10968468 (Kratzert et al., 2024), which contains streamflow, meteorological data, watershed boundaries and attributes. GAGES-II attributes are available at https://doi.org/10.5066/P96CPHOT (Falcone, 2011), and time series of meteorological data for GAGES-II locations are available from https://doi.org/10.5066/P98IG8LO (Wieczorek et al., 2023) and https://doi.org/10.5066/P9JWJPNC (Hammond, 2024). CAMELSH hourly NLDAS forcings are available at https://doi.org/10.5281/zenodo.15066778 (Tran and Kim, 2025) and https://doi.org/10.5281/zenodo.15070091 (Tran et al., 2025).
The supplement related to this article is available online at https://doi.org/10.5194/hess-30-3647-2026-supplement.
RA: conceptualization, data curation, formal analysis, investigation, methodology, software, visualization, writing - original draft preparation, writing – review and editing. AHo: conceptualization, data curation, methodology, software, writing – review and editing. JCH: data curation, formal analysis, methodology, writing – original draft preparation, writing – review and editing. AHu: formal analysis, investigation, methodology, writing – original draft preparation, writing – review and editing. GC: investigation, writing – review and editing. HKM: funding acquisition, project administration, conceptualization, formal analysis, investigation, methodology, writing – original draft preparation, writing – review and editing, supervision.
At least one of the (co-)authors is a member of the editorial board of Hydrology and Earth System Sciences. The peer-review process was guided by an independent editor, and the authors also have no other competing interests to declare.
Publisher's note: Copernicus Publications remains neutral with regard to jurisdictional claims made in the text, published maps, institutional affiliations, or any other geographical representation in this paper. The authors bear the ultimate responsibility for providing appropriate place names. Views expressed in the text are those of the authors and do not necessarily reflect the views of the publisher.
We thank Sebastian Gnann for the development of the TOSSH toolbox and for the collaborative discussions around my pull requests, Yueling Ma for helpful input on interpretable Machine Learning methods during a conference, and Andy Wood for valuable feedback about anthropogenic impacts on streamflow patterns and signatures. The bivariate map was inspired by a blogpost written by Muhammad Mohsin Raza on their website DataWim. We thank Roy Sando and Scott Hamshaw for helpful feedback on the earlier version of the manuscript. We appreciate the computing support provided by the IT team at the Department of Geography, San Diego State University, and the General Research IT (GRIT) team at the University of California, Santa Barbara. Any use of trade, firm, or product names is for descriptive purposes only and does not imply endorsement by the U.S. government.
Ryoko Araki, Anne Holt, Hilary K. McMillan were supported by the NSF Hydrologic Sciences Program, Division of Earth Sciences (Award Number 2124923). Araki acknowledges support from the Shida Scholarship Program. Coxon was supported by a UKRI Future Leaders Fellowship (grant no. MR/V022857/1).
This paper was edited by Albrecht Weerts and reviewed by two anonymous referees.
Abban, B., Papanicolaou, A. N., Cowles, M. K., and Wilson, C. G.: Examining Seasonal Trends in Sediment Source Contributions in an Intensely Cultivated Midwestern Sub-Watershed Using Bayesian Unmixing, in: World Environmental and Water Resources Congress 2014, World Environmental and Water Resources Congress 2014, Portland, Oregon, 1453–1463, https://doi.org/10.1061/9780784413548.146, 2014.
Addor, N., Newman, A. J., Mizukami, N., and Clark, M. P.: The CAMELS data set: catchment attributes and meteorology for large-sample studies, Hydrol. Earth Syst. Sci., 21, 5293–5313, https://doi.org/10.5194/hess-21-5293-2017, 2017.
Addor, N., Nearing, G., Prieto, C., Newman, A. J., Le Vine, N., and Clark, M. P.: A ranking of hydrological signatures based on their predictability in space, Water Resour. Res., 54, 8792–8812, https://doi.org/10.1029/2018WR022606, 2018.
Ali, G., Tetzlaff, D., Soulsby, C., McDonnell, J. J., and Capell, R.: A comparison of similarity indices for catchment classification using a cross-regional dataset, Adv. Water Resour., 40, 11–22, https://doi.org/10.1016/j.advwatres.2012.01.008, 2012.
Ali, G., Oswald, C. J., Spence, C., Cammeraat, E. L. H., McGuire, K. J., Meixner, T., and Reaney, S. M.: Towards a unified threshold-based hydrological theory: necessary components and recurring challenges: INVITED COMMENTARY, Hydrol. Process., 27, 313–318, https://doi.org/10.1002/hyp.9560, 2013.
Allen, R. G., Pereira, L. S., Raes, D., and Smith, M.: Crop Evapotranspiration – Guidelines for Computing Crop Water Requirements, in: FAO Irrigation and drainage paper 56, Food and Agriculture Organization of the United Nations, Rome, Italy, 1998.
Almagro, A., Meira Neto, A. A., Vergopolan, N., Roy, T., Troch, P. A., and Oliveira, P. T. S.: The Drivers of Hydrologic Behavior in Brazil: Insights From a Catchment Classification, Water Resour. Res., 60, https://doi.org/10.1029/2024WR037212, 2024.
Angermann, L., Jackisch, C., Allroggen, N., Sprenger, M., Zehe, E., Tronicke, J., Weiler, M., and Blume, T.: Form and function in hillslope hydrology: characterization of subsurface flow based on response observations, Hydrol. Earth Syst. Sci., 21, 3727–3748, https://doi.org/10.5194/hess-21-3727-2017, 2017.
Araki, R., Branger, F., Wiekenkamp, I., and McMillan, H. K.: A signature-based approach to quantify soil moisture dynamics under contrasting land-uses, Hydrol. Process., 36, e14553, https://doi.org/10.1002/hyp.14553, 2022.
Araki, R., Holt, A., Hammond, J., Husic, A., Coxon, G., and McMillan, H.: Dataset and source codes for Araki et al. (2026) “Continental-scale prediction of hydrologic signatures and processes” (v1.0), Zenodo [code and data set], https://doi.org/10.5281/zenodo.20185650, 2026.
Ariano, S. and Ali, G.: From river flow regime diversity to proxies for hydrologic homogeneity a Canada-wide case study, Sci. Rep., 15, 16743, https://doi.org/10.1038/s41598-025-00244-7, 2025.
Arsenault, R., Brissette, F., Martel, J.-L., Troin, M., Lévesque, G., Davidson-Chaput, J., Gonzalez, M. C., Ameli, A., and Poulin, A.: A comprehensive, multisource database for hydrometeorological modeling of 14,425 North American watersheds, Sci. Data, 7, 243, https://doi.org/10.1038/s41597-020-00583-2, 2020.
Barnhart, T. B., Molotch, N. P., Livneh, B., Harpold, A. A., Knowles, J. F., and Schneider, D.: Snowmelt baseflow contributions: A comparison of methods using nested catchments in the Colorado River basin, Water Resour. Res., 52, 4524–4548, 2016.
Barnhart, T. B., Farmer, W. H., Hammond, J. C., Sexstone, G. A., Curran, J. H., Koch, J. C., and Driscoll, J. M.: Evaluating hydrologic region assignment techniques for ungaged basins in Alaska, USA, River Res. Appl., 38, 1569–1584, https://doi.org/10.1002/rra.4028, 2022.
Beck, H., Dijk, A., Miralles, D., Jeu, R. A. M., Bruijnzeel, L., McVicar, T., and Schellekens, J.: Global patterns in base flow index and recession based on streamflow observations from 3394 catchments, Water Resour. Res., 49, 7843–7863, https://doi.org/10.1002/2013WR013918, 2013.
Beck, H. E., De Roo, A., and van Dijk, A. I.: Global maps of streamflow characteristics based on observations from several thousand catchments, J. Hydrometeorol., 16, 1478–1501, 2015.
Berghuijs, W. R., Sivapalan, M., Woods, R. A., and Savenije, H. H. G.: Patterns of similarity of seasonal water balances: A window into streamflow variability over a range of time scales, Water Resour. Res., 50, 5638–5661, https://doi.org/10.1002/2014WR015692, 2014.
Bergström, S.: The HBV Model: Its Structure and Applications,Swedish Meteorological and Hydrological Institute (SMHI), Hydrology, Norrköping, 35 pp., https://www.smhi.se/download/18.38e7941719209b36a1fb2c4/1728367395288/RH_4.pdf (last access: 10 June 2026), 1992.
Blöschl, G.: Hydrologic synthesis: Across processes, places, and scales, Water Resour. Res., 42, https://doi.org/10.1029/2005wr004319, 2006.
Blöschl, G., Bierkens, M. F. P., Chambel, A. et al.: Twenty-three unsolved problems in hydrology (UPH) – a community perspective, Hydrol. Sci. J., 64, 1141–1158, https://doi.org/10.1080/02626667.2019.1620507, 2019.
Bolotin, L. A. and McMillan, H.: A hydrologic signature approach to analysing wildfire impacts on overland flow, Hydrol. Process., 38, https://doi.org/10.1002/hyp.15215, 2024.
Bracken, L. J., Wainwright, J., Ali, G. A., Tetzlaff, D., Smith, M. W., Reaney, S. M., and Roy, A. G.: Concepts of hydrological connectivity: Research approaches, pathways and future agendas, Earth-Sci. Rev., 119, 17–34, https://doi.org/10.1016/j.earscirev.2013.02.001, 2013.
Brooks, P. D., Chorover, J., Fan, Y., Godsey, S. E., Maxwell, R. M., McNamara, J. P., and Tague, C.: Hydrological partitioning in the critical zone: Recent advances and opportunities for developing transferable understanding of water cycle dynamics: CRITICAL ZONE HYDROLOGY, Water Resour. Res., 51, 6973–6987, https://doi.org/10.1002/2015wr017039, 2015.
Brunner, M. I., Melsen, L. A., Newman, A. J., Wood, A. W., and Clark, M. P.: Future streamflow regime changes in the United States: assessment using functional classification, Hydrol. Earth Syst. Sci., 24, 3951–3966, https://doi.org/10.5194/hess-24-3951-2020, 2020.
Buchanan, B., Auerbach, D. A., Knighton, J., Evensen, D., Fuka, D. R., Easton, Z., Wieczorek, M., Archibald, J. A., McWilliams, B., and Walter, T.: Estimating dominant runoff modes across the conterminous United States, Hydrol. Process., 32, 3881–3890, https://doi.org/10.1002/hyp.13296, 2018.
Bulygina, N., McIntyre, N., and Wheater, H.: Conditioning rainfall-runoff model parameters for ungauged catchments and land management impacts analysis, Hydrol. Earth Syst. Sci., 13, 893–904, https://doi.org/10.5194/hess-13-893-2009, 2009.
Case, J. L., Mocko, D. M., Hain, C. R., Maina, F. Z., Whitney, K. M., Kumar, S. V., Wade, R. A., Locke, K. A., and White, K. D.: NLDAS-3: Next-Generation Land Data Assimilation System to Support North American Water-Informed Decisions, in: 2025 National Soil Moisture Workshop, Fort Collins, CO, 3–5 June 2025, https://ntrs.nasa.gov/citations/20250005424 (last access: 5 June 2026), 2025.
Clark, B. R., Hart, R. M., and Gurdak, J. J.: Groundwater availability of the Mississippi embayment, U.S. Geological Survey, Reston, Virginia, https://doi.org/10.3133/pp1785, 2011.
Clark, M., Rupp, D., Woods, R., Meerveld, H., Peters, N., and Freer, J.: Consistency between hydrological models and field observations: linking processes at the hillslope scale to hydrological responses at the watershed scale, Hydrol. Process., 23, 311–319, https://doi.org/10.1002/HYP.7154, 2009.
Clark, M., Nijssen, B., Lundquist, J., Kavetski, D., Rupp, D., Woods, R., Freer, J., Gutmann, E., Wood, A., Brekke, L., Arnold, J., Gochis, D., and Rasmussen, R.: A unified approach for process-based hydrologic modeling: 1. Modeling concept, Water Resour. Res., 51, 2498–2514, https://doi.org/10.1002/2015WR017198, 2015.
Clerc-Schwarzenbach, F., Selleri, G., Neri, M., Toth, E., van Meerveld, I., and Seibert, J.: Large-sample hydrology – a few camels or a whole caravan?, Hydrol. Earth Syst. Sci., 28, 4219–4237, https://doi.org/10.5194/hess-28-4219-2024, 2024.
Cosgrove, B., Gochis, D., Flowers, T., Dugger, A., Ogden, F., Graziano, T., Clark, E., Cabell, R., Casiday, N., Cui, Z., Eicher, K., Fall, G., Feng, X., Fitzgerald, K., Frazier, N., George, C., Gibbs, R., Hernandez, L., Johnson, D., Jones, R., Karsten, L., Kefelegn, H., Kitzmiller, D., Lee, H., Liu, Y., Mashriqui, H., Mattern, D., McCluskey, A., McCreight, J. L., McDaniel, R., Midekisa, A., Newman, A., Pan, L., Pham, C., RafieeiNasab, A., Rasmussen, R., Read, L., Rezaeianzadeh, M., Salas, F., Sang, D., Sampson, K., Schneider, T., Shi, Q., Sood, G., Wood, A., Wu, W., Yates, D., Yu, W., and Zhang, Y.: NOAA's National Water Model: Advancing operational hydrology through continental-scale modeling, J. Am. Water Resour. Assoc., 60, 247–272, https://doi.org/10.1111/1752-1688.13184, 2024.
Davis, C. A., Ward, A. S., Burgin, A. J., Loecke, T. D., Riveros-Iregui, D. A., Schnoebelen, D. J., Just, C. L., Thomas, S. A., Weber, L. J., and St. Clair, M. A.: Antecedent Moisture Controls on Stream Nitrate Flux in an Agricultural Watershed, J. Environ. Qual., 43, 1494–1503, https://doi.org/10.2134/jeq2013.11.0438, 2014.
DeCicco, L. A., Hirsch, R. M., Lorenz, D., Watkins, D., and Michael Johnson, J.: dataRetrieval, U.S. Geological Survey, https://doi.org/10.5066/P9X4L3GE, 2018.
Destouni, G. and Zarei, M.: Water and climate interplay on land in comparative datasets: Revealing unrealistic major drying bias of climate reanalysis over Africa and the world, AGUFM, 2024, H54B–05, 2024.
Dettinger, M. D. and Diaz, H. F.: Global characteristics of stream flow seasonality and variability, J. Hydrometeorol., 1, 289–310, https://doi.org/10.1175/1525-7541(2000)001<0289:gcosfs>2.0.co;2, 2000.
Detty, J. M. and McGuire, K. J.: Threshold changes in storm runoff generation at a till-mantled headwater catchment, Water Resour. Res., 46, https://doi.org/10.1029/2009wr008102, 2010.
Dhungel, S., Tarboton, D. G., Jin, J., and Hawkins, C. P.: Potential effects of climate change on ecologically relevant streamflow regimes: Climate change and streamflow regimes, River Res. Appl., 32, 1827–1840, https://doi.org/10.1002/rra.3029, 2016.
do Nascimento, T. V. M., Rudlang, J., Gnann, S., Seibert, J., Hrachowitz, M., and Fenicia, F.: How do geological map details influence the identification of geology-streamflow relationships in large-sample hydrology studies?, Hydrol. Earth Syst. Sci., 29, 7173–7200, https://doi.org/10.5194/hess-29-7173-2025, 2025.
Dunne, T.: Field studies of hillslope flow processes, in: Hillslope hydrology, vol. 9, edited by: Kirkby, M. J., John Wiley & Sons, Inc., 227–293, https://doi.org/10.18172/cig.1099, 1978.
Eng, K. and Wolock, D. M.: Evaluation of machine learning approaches for predicting streamflow metrics across the conterminous United States, U.S. Geological Survey, 2022–5058, https://doi.org/10.3133/sir20225058, 2022.
Estrany, J., Garcia, C., and Batalla, R. J.: Hydrological response of a small mediterranean agricultural catchment, J. Hydrol. (Amst.), 380, 180–190, https://doi.org/10.1016/j.jhydrol.2009.10.035, 2010.
Falcone, J.: GAGES-II: Geospatial Attributes of Gages for Evaluating Streamflow, U.S. Geological Survey [data set], https://doi.org/10.5066/P96CPHOT, 2011.
Falcone, J. A., Carlisle, D. M., Wolock, D. M., and Meador, M. R.: GAGES: A stream gage database for evaluating natural and altered flow conditions in the conterminous United States, Ecology, 91, 621–621, https://doi.org/10.1890/09-0889.1, 2010.
Fan, Y., Clark, M., Lawrence, D. M., Swenson, S., Band, L. E., Brantley, S. L., Brooks, P. D., Dietrich, W. E., Flores, A., Grant, G., Kirchner, J. W., Mackay, D. S., McDonnell, J. J., Milly, P. C. D., Sullivan, P. L., Tague, C., Ajami, H., Chaney, N., Hartmann, A., Hazenberg, P., McNamara, J., Pelletier, J., Perket, J., Rouholahnejad-Freund, E., Wagener, T., Zeng, X., Beighley, E., Buzan, J., Huang, M., Livneh, B., Mohanty, B. P., Nijssen, B., Safeeq, M., Shen, C., Verseveld, W., Volk, J., and Yamazaki, D.: Hillslope hydrology in global change research and Earth system modeling, Water Resour. Res., 55, 1737–1772, https://doi.org/10.1029/2018wr023903, 2019.
Fang, K. and Shen, C.: Full-flow-regime storage-streamflow correlation patterns provide insights into hydrologic functioning over the continental US, Water Resour. Res., 53, 8064–8083, https://doi.org/10.1002/2016wr020283, 2017.
Fenicia, F. and McDonnell, J. J.: Modeling streamflow variability regional scale: (1) perceptual model development through signature analysis, J. Hydrology, 605, https://doi.org/10.1016/j.jhydrol.2021.127287, 2022.
Frame, J. M., Araki, R., Bhuiyan, S. A., Bindas, T., Rapp, J., Bolotin, L., Deardorff, E., Liu, Q., Haces-Garcia, F., Liao, M., Frazier, N., and Ogden, F. L.: Machine learning for a heterogeneous water modeling framework, J. Am. Water Resour. Assoc., 61, https://doi.org/10.1111/1752-1688.70000, 2025.
Gesch, D. B., Evans, G. A., Oimoen, M. J., and Arundel, S.: The National Elevation Dataset, USGS Earth Resources Observation and Science Center, https://pubs.usgs.gov/publication/70201572 (last access: 5 June 2026), 2018.
Gnann, S., Baldwin, J. W., Cuthbert, M. O., Gleeson, T., Schwanghart, W., and Wagener, T.: The influence of topography on the global terrestrial water cycle, Rev. Geophys., 63, e2023RG000810, https://doi.org/10.1029/2023rg000810, 2025.
Gnann, S. J., Howden, N. J. K., and Woods, R. A.: Hydrological signatures describing the translation of climate seasonality into streamflow seasonality, Hydrol. Earth Syst. Sci., 24, 561–580, https://doi.org/10.5194/hess-24-561-2020, 2020.
Gnann, S. J., Coxon, G., Woods, R. A., Howden, N. J. K., and McMillan, H. K.: TOSSH: A Toolbox for Streamflow Signatures in Hydrology, Environ. Model. Softw., 138, 104983, https://doi.org/10.1016/j.envsoft.2021.104983, 2021a (code available at: https://github.com/TOSSHtoolbox/TOSSH, last access: 5 June 2026).
Gnann, S. J., McMillan, H. K., Woods, R. A., and Howden, N. J. K.: Including Regional Knowledge Improves Baseflow Signature Predictions in Large Sample Hydrology, Water Resour. Res., 57, e2020WR028354, https://doi.org/10.1029/2020WR028354, 2021b.
Golden, H. E., Christensen, J. R., McMillan, H. K., Kelleher, C. A., Lane, C. R., Husic, A., Li, L., Ward, A. S., Hammond, J., Seybold, E. C., Jaeger, K. L., Zimmer, M., Sando, R., Jones, C. N., Segura, C., Mahoney, D. T., Price, A. N., and Cheng, F.: Advancing the science of headwater streamflow for global water protection, Nat. Water, 1–11, https://doi.org/10.1038/s44221-024-00351-1, 2025.
Gomi, T., Sidle, R. C., Ueno, M., Miyata, S., and Kosugi, K.: Characteristics of overland flow generation on steep forested hillslopes of central Japan, J. Hydrol., 361, 275–290, https://doi.org/10.1016/j.jhydrol.2008.07.045, 2008.
Goodrich, D. C., Lane, L. J., Shillito, R. M., Miller, S. N., Syed, K. H., and Woolhiser, D. A.: Linearity of basin response as a function of scale in a semiarid watershed, Water Resour. Res., 33, 2951–2965, https://doi.org/10.1029/97wr01422, 1997.
Grantham, T. E., Carlisle, D. M., Howard, J., Lane, B., Lusardi, R., Obester, A., Sandoval-Solis, S., Stanford, B., Stein, E. D., Taniguchi-Quan, K. T., Yarnell, S. M., and Zimmerman, J. K. H.: Modeling functional flows in California's rivers, Front. Environ. Sci., 10, https://doi.org/10.3389/fenvs.2022.787473, 2022.
Gudmundsson, L., Brunner, M. I., Döll, P., Fluet-Chouinard, E., Frolova, N., Gosling, S. N., Hirabayashi, Y., Kireeva, M. B., Liu, X., Müller Schmied, H., Magritskiy, D., Slater, L. J., Stein, L., Tramblay, Y., Wang, K., Wasko, C., Yamazaki, D., and Zhou, X.: Past and future change in global river flows, Nat. Rev. Earth Environ., 7, 7–23, https://doi.org/10.1038/s43017-025-00745-z, 2025.
Haines, A., Finlayson, B., and McMahon, T.: A global classification of river regimes, Appl. Geogr., 8, 255–272, https://doi.org/10.1016/0143-6228(88)90035-5, 1988.
Hamon, W. R.: Estimating Potential Evapotranspiration, in: American Society of Civil Engineers, 107–120, https://doi.org/10.1061/taceat.0008673, 1961.
Hammond, J. C.: Daily time series of surface water input from rainfall, rain on snow, and snowmelt for the Conterminous United States from 1990 to 2023, as well as annual series of input seasonality, precipitation seasonality, and average rainfall, rain on snow, and snowmelt rates, U.S. Geological Survey [data set], https://doi.org/10.5066/P9JWJPNC, 2024.
Hammond, J. C. and Kampf, S. K.: Subannual streamflow responses to rainfall and snowmelt inputs in snow-dominated watersheds of the western United States, Water Resour. Res., 56, https://doi.org/10.1029/2019wr026132, 2020.
Hammond, J. C., Zimmer, M., Shanafield, M., Kaiser, K., Godsey, S. E., Mims, M. C., Zipper, S. C., Burrows, R. M., Kampf, S. K., Dodds, W., Jones, C. N., Krabbenhoft, C. A., Boersma, K. S., Datry, T., Olden, J. D., Allen, G. H., Price, A. N., Costigan, K., Hale, R., Ward, A. S., and Allen, D. C.: Spatial patterns and drivers of nonperennial flow regimes in the contiguous United States, Geophys. Res. Lett., 48, https://doi.org/10.1029/2020gl090794, 2021.
Hammond, J. C., Sexstone, G. A., Putman, A. L., Barnhart, T. B., Rey, D. M., Driscoll, J. M., Liston, G. E., Rasmussen, K. L., McGrath, D., Fassnacht, S. R., and Kampf, S. K.: High resolution SnowModel simulations reveal future elevation-dependent snow loss and earlier, flashier surface water input for the upper Colorado river basin, Earths Future, 11, https://doi.org/10.1029/2022ef003092, 2023.
Hay, L. E., LaFontaine, J. H., Van Beusekom, A. E., Norton, P. A., Farmer, W. H., Regan, R. S., Markstrom, S. L., and Dickinson, J. E.: Parameter estimation at the conterminous United States scale and streamflow routing enhancements for the National Hydrologic Model infrastructure application of the Precipitation-Runoff Modeling System (NHM-PRMS), U.S. Geological Survey [data set], 6–B10, 50 p., https://doi.org/10.3133/tm6B10, 2023.
Hobeichi, S., Abramowitz, G., Ukkola, A. M., De Kauwe, M., Pitman, A., Evans, J. P., and Beck, H.: Reconciling historical changes in the hydrological cycle over land, Npj Clim. Atmos. Sci., 5, 17, https://doi.org/10.1038/s41612-022-00240-y, 2022.
Hodgkins, G. A., Renard, B., Whitfield, P. H., Laaha, G., Stahl, K., Hannaford, J., Burn, D. H., Westra, S., Fleig, A. K., Araújo Lopes, W. T., Murphy, C., Mediero, L., and Hanel, M.: Climate driven trends in historical extreme low streamflows on four continents, Water Resour. Res., 60, https://doi.org/10.1029/2022wr034326, 2024.
Holt, A.: New Predictors for Hydrologic Signatures: Wetlands and Geologic Age Across Continental Scales, San Diego State University, United States – California, https://digitalcollections.sdsu.edu/do/1260b4f2-c336-4aed-86c2-a26a3c107b7c (last access: 5 June 2026), 2024.
Holt, A. and McMillan, H.: New predictors for hydrologic signatures: Wetlands and geologic age across continental scales, Hydrol. Process., 39, https://doi.org/10.1002/hyp.70080, 2025.
Horton, J. D., San Juan, C. A., and Stoeser, D. B.: The State Geologic Map Compilation (SGMC) geodatabase of the conterminous United States, https://doi.org/10.3133/ds1052, 2017.
Hrachowitz, M., Fovet, O., Ruiz, L., Euser, T., Gharari, S., Nijzink, R., Freer, J., Savenije, H. H. G., and Gascuel-Odoux, C.: Process consistency in models: The importance of system signatures, expert knowledge, and process complexity, Water Resour. Res., 50, 7445–7469, https://doi.org/10.1002/2014wr015484, 2014.
Hupp, C. R.: Hydrology, geomorphology and vegetation of Coastal Plain rivers in the south-eastern USA, Hydrol. Process., 14, 2991–3010, 2000.
Husic, A.: Game theory for catchment science, ESS Open Archive [data set], https://doi.org/10.22541/essoar.173924202.27840286/v1, 2025.
Husic, A., Hammond, J., Price, A. N., and Roundy, J. K.: Interrogating process deficiencies in large-scale hydrologic models with interpretable machine learning, Hydrol. Earth Syst. Sci., 29, 4457–4472, https://doi.org/10.5194/hess-29-4457-2025, 2025.
Jackisch, C., Angermann, L., Allroggen, N., Sprenger, M., Blume, T., Tronicke, J., and Zehe, E.: Form and function in hillslope hydrology: in situ imaging and characterization of flow-relevant structures, Hydrol. Earth Syst. Sci., 21, 3749–3775, https://doi.org/10.5194/hess-21-3749-2017, 2017.
Janssen, J. and Ameli, A. A.: A hydrologic functional approach for improving large-sample hydrology performance in poorly gauged regions, Water Resour. Res., 57, https://doi.org/10.1029/2021wr030263, 2021.
Jefferson, A., Grant, G. E., Lewis, S. L., and Lancaster, S. T.: Coevolution of hydrology and topography on a basalt landscape in the Oregon Cascade Range, USA, Earth Surf. Process., 35, 803–816, https://doi.org/10.1002/esp.1976, 2010.
Ji, H., Song, Y., Bindas, T., Shen, C., Yang, Y., Pan, M., Liu, J., Rahmani, F., Abbas, A., Beck, H., Lawson, K., and Wada, Y.: Distinct hydrologic response patterns and trends worldwide revealed by physics-embedded learning, arXiv [preprint], https://doi.org/10.48550/arXiv.2504.10707, 2025.
Johnson, J. M., Fang, S., Sankarasubramanian, A., Rad, A. M., Kindl da Cunha, L., Jennings, K. S., Clarke, K. C., Mazrooei, A., and Yeghiazarian, L.: Comprehensive analysis of the NOAA National Water Model: A call for heterogeneous formulations and diagnostic model selection, J. Geophys. Res., 128, https://doi.org/10.1029/2023jd038534, 2023.
Kavetski, D. and Fenicia, F.: Elements of a flexible approach for conceptual hydrological modeling: 2. Application and experimental insights, Water Resour. Res., 47, https://doi.org/10.1029/2011wr010748, 2011.
Kennard, M. J., Pusey, B. J., Olden, J. D., Mackay, S. J., Stein, J. L., and Marsh, N.: Classification of natural flow regimes in Australia to support environmental flow management: Classification of natural flow regimes in Australia, Freshw. Biol., 55, 171–193, https://doi.org/10.1111/j.1365-2427.2009.02307.x, 2010.
Kiang, J. E., Stewart, D. W., Archfield, S. A., Osborne, E. B., and Eng, K.: A national streamflow network gap analysis (No. 2013-5013), US Geological Survey, http://pubs.usgs.gov/sir/2013/5013/ (last access: 5 June 2026), 2013.
Kirchner, J. W.: Catchments as simple dynamical systems: Catchment characterization, rainfall-runoff modeling, and doing hydrology backward, Water Resour. Res., 45, https://doi.org/10.1029/2008WR006912, 2009.
Klemeš, V.: Operational testing of hydrological simulation models, Hydrol. Sci. J., 31, 13–24, https://doi.org/10.1080/02626668609491024, 1986.
Knoben, W. J. M., Woods, R. A., and Freer, J. E.: A quantitative hydrological climate classification evaluated with independent streamflow data, Water Resour. Res., 54, 5088–5109, https://doi.org/10.1029/2018wr022913, 2018.
Knoben, W. J. M., Freer, J. E., Peel, M. C., Fowler, K. J. A., and Woods, R. A.: A brief analysis of conceptual model structure uncertainty using 36 models and 559 catchments, Water Resour. Res., 56, e2019WR025975, https://doi.org/10.1029/2019wr025975, 2020.
Krabbenhoft, C. A., Allen, G. H., Lin, P., Godsey, S. E., Allen, D. C., Burrows, R. M., DelVecchia, A. G., Fritz, K. M., Shanafield, M., Burgin, A. J., Zimmer, M. A., Datry, T., Dodds, W. K., Jones, C. N., Mims, M. C., Franklin, C., Hammond, J. C., Zipper, S., Ward, A. S., Costigan, K. H., Beck, H. E., and Olden, J. D.: Assessing placement bias of the global river gauge network, Nat. Sustain., 5, 586–592, https://doi.org/10.1038/s41893-022-00873-0, 2022.
Kratzert, F., Nearing, G., Addor, N., Erickson, T., Gauch, M., Gilon, O., Gudmundsson, L., Hassidim, A., Klotz, D., Nevo, S., Shalev, G., and Matias, Y.: Caravan – A global community dataset for large-sample hydrology, Sci. Data, 10, 61, https://doi.org/10.1038/s41597-023-01975-w, 2023 (code available at: https://github.com/kratzert/Caravan, last access: 5 June 2026).
Kratzert, F., Nearing, G., Addor, N., Erickson, T., Gauch, M., Gilon, O., Gudmundsson, L., Hassidim, A., Klotz, D., Nevo, S., Shalev, G., and Matias, Y.: Caravan – A global community dataset for large-sample hydrology (1.4), Zenodo [data set], https://doi.org/10.5281/zenodo.10968468, 2024.
Kuentz, A., Arheimer, B., Hundecha, Y., and Wagener, T.: Understanding hydrologic variability across Europe through catchment classification, Hydrol. Earth Syst. Sci., 21, 2863–2879, https://doi.org/10.5194/hess-21-2863-2017, 2017.
Kuhn, M.: Building predictive models in R using the caret package, J. Stat. Softw., 28, 1–26, https://doi.org/10.18637/JSS.V028.I05, 2008.
Lane, B. A., Dahlke, H. E., Pasternack, G. B., and Sandoval-Solis, S.: Revealing the Diversity of Natural Hydrologic Regimes in California with Relevance for Environmental Flows Applications, J. Am. Water Resour. Assoc., 53, 411–430, https://doi.org/10.1111/1752-1688.12504, 2017.
Lane, C. R. and D'Amico, E.: Identification of putative geographically isolated wetlands of the conterminous United States, J. Am. Water Resour. Assoc., 52, 705–722, https://doi.org/10.1111/1752-1688.12421, 2016.
Lapides, D. A., Zipper, S., and Hammond, J. C.: Identifying hydrologic signatures associated with streamflow depletion caused by groundwater pumping, Hydrol. Process., 37, https://doi.org/10.1002/hyp.14877, 2023.
Lee, D., Ward, P., and Block, P.: Defining high-flow seasons using temporal streamflow patterns from a global model, Hydrol. Earth Syst. Sci., 19, 4689–4705, https://doi.org/10.5194/hess-19-4689-2015, 2015.
Linke, S., Lehner, B., Ouellet Dallaire, C., Ariwi, J., Grill, G., Anand, M., Beames, P., Burchard-Levine, V., Maxwell, S., Moidu, H., Tan, F., and Thieme, M.: Global hydro-environmental sub-basin and river reach characteristics at high spatial resolution, Sci. Data, 6, 283, https://doi.org/10.1038/s41597-019-0300-6, 2019.
Lins, H. F.: Regional streamflow regimes and hydroclimatology of the United States, Water Resour. Res., 33, 1655–1667, https://doi.org/10.1029/97WR00615, 1997.
Lohse, K. A. and Dietrich, W. E.: Contrasting effects of soil development on hydrological properties and flow paths, Water Resour. Res., 41, https://doi.org/10.1029/2004wr003403, 2005.
Lundberg, S. and Lee, S.-I.: A unified approach to interpreting model predictions, arXiv [preprint], https://doi.org/10.48550/arXiv.1705.07874, 2017.
Lundberg, S. M., Erion, G. G., and Lee, S.-I.: Consistent individualized feature attribution for tree ensembles, arXiv [preprint], https://doi.org/10.48550/arXiv.1802.03888, 2018.
Markstrom, S. L., Hay, L. E., and Clark, M. P.: Towards simplification of hydrologic modeling: identification of dominant processes, Hydrol. Earth Syst. Sci., 20, 4655–4671, https://doi.org/10.5194/hess-20-4655-2016, 2016.
Mazvimavi, D., Meijerink, A. M. J., Savenije, H. H. G., and Stein, A.: Prediction of flow characteristics using multiple regression and neural networks: A case study in Zimbabwe, Phys. Chem. Earth, 30, 639–647, https://doi.org/10.1016/j.pce.2005.08.003, 2005.
McCabe, G. J. and Wolock, D. M.: Long-Term Variability in Northern Hemisphere Snow Cover and Associations with Warmer Winters, Climatic Change, 99, 141–153, https://doi.org/10.1007/s10584-009-9675-2, 2010.
McGrath, G. S., Hinz, C., and Sivapalan, M.: Temporal dynamics of hydrological threshold events, Hydrol. Earth Syst. Sci., 11, 923–938, https://doi.org/10.5194/hess-11-923-2007, 2007.
McMillan, H.: Linking hydrologic signatures to hydrologic processes: A Review, Hydrol. Process., 34, 1393–1409, https://doi.org/10.1002/hyp.13632, 2020.
McMillan, H., Gueguen, M., Grimon, E., Woods, R., Clark, M., and Rupp, D. E.: Spatial variability of hydrological processes and model structure diagnostics in a 50 km2 catchment, Hydrol. Process., 28, 4896–4913, https://doi.org/10.1002/hyp.9988, 2014.
McMillan, H., Westerberg, I., and Branger, F.: Five guidelines for selecting hydrological signatures, Hydrol. Process., 31, 4757–4761, https://doi.org/10.1002/hyp.11300, 2017.
McMillan, H., Araki, R., Bolotin, L., Kim, D.-H., Coxon, G., Clark, M., and Seibert, J.: Global patterns in observed hydrologic processes, Nat. Water, https://doi.org/10.1038/s44221-025-00407-w, 2025.
McMillan, H. K.: A review of hydrologic signatures and their applications, WIREs Water, 8, https://doi.org/10.1002/wat2.1499, 2021.
McMillan, H. K., Gnann, S. J., and Araki, R.: Large scale evaluation of relationships between hydrologic signatures and processes, Water Resour. Res., 58, https://doi.org/10.1029/2021wr031751, 2022.
McMillan, H., Coxon, G., Araki, R., Salwey, S., Kelleher, C., Zheng, Y., Knoben, W., Gnann, S., Seibert, J., and Bolotin, L.: When good signatures go bad: Applying hydrologic signatures in large sample studies, Hydrol. Process., 37, https://doi.org/10.1002/hyp.14987, 2023.
Merz, R. and Blöschl, G.: A regional analysis of event runoff coefficients with respect to climate and catchment characteristics in Austria, Water Resour. Res., 45, https://doi.org/10.1029/2008WR007163, 2009.
Miller, D. A. and White, R. A.: A conterminous United States multilayer soil characteristics dataset for regional climate and hydrology modeling, Earth Interact., 2, 1–26, https://doi.org/10.1175/1087-3562(1998)002<0001:acusms>2.3.co;2, 1998.
Miller, J. A.: Ground water atlas of the United States: Introduction and national summary (No. 730-A), U.S. Geological Survey, A1–A15, https://doi.org/10.3133/ha730A, 1999.
Molnar, C., Bischl, B., and Casalicchio, G.: iml: An R package for Interpretable Machine Learning, J. Open Source Softw., 3, 786, https://doi.org/10.21105/joss.00786, 2018.
Mosley, M. P.: Delimitation of New Zealand hydrologic regions, J. Hydrol. (Amst.), 49, 173–192, https://doi.org/10.1016/0022-1694(81)90211-0, 1981.
Muñoz Sabater, J.: ERA5-Land monthly averaged data from 1950 to present, Copernicus Climate Change Service (C3S) Climate Data Store (CDS) [data set], https://doi.org/10.24381/cds.68d2bb30, 2019.
Neff, B., Day, S., Piggott, A., and Fuller, L. M.: Base flow in the Great Lakes Basin, U.S. Geological Survey Scientific Investigations Report 2005-5217, iv, 23 p., https://doi.org/10.3133/sir20055217, 2005.
Noguchi, S., Nik, A. R., Yusop, Z., Tani, M., and Sammori, T.: Rainfall-runoff responses and roles of soil moisture variations to the response in tropical Rain Forest, Bukit Tarek, peninsular Malaysia, J. Forest Res., 2, 125–132, https://doi.org/10.1007/bf02348209, 1997.
Ogden, F. L., Jennings, K., Clark, E. P., Coon, E., Cosgrove, B., da Cunha, L. K., Farthing, M. W., Flowers, T., Frame, J. M., Frazier, N. J., Garrett, J. L., Graziano, T. M., Hughes, J. D., Johnson, J. M., McDaniel, R., Moulton, J. D., Peckham, S. D., Salas, F. R., Savant, G., Viger, R., and Wood, A.: The NextGen water resources modeling Framework: Community innovation at the intersection of hydrologic, data and computer sciences, J. Am. Water Resour. Assoc., 62, https://doi.org/10.1111/1752-1688.70089, 2026.
Omernik, J. M.: Ecoregions of the conterminous United States, Ann. Assoc. Am. Geogr., 77, 118–125, 1987.
Omernik, J. M.: Perspectives on the nature and definition of ecological regions, Environ. Manage., 34 Suppl 1, S27–38, https://doi.org/10.1007/s00267-003-5197-2, 2004.
Oswald, C. J., Kelleher, C., Ledford, S. H., Hopkins, K. G., Sytsma, A., Tetzlaff, D., Toran, L., and Voter, C.: Integrating urban water fluxes and moving beyond impervious surface cover: A review, J. Hydrol. (Amst.), 618, 129188, https://doi.org/10.1016/j.jhydrol.2023.129188, 2023.
Oudin, L., Andréassian, V., Perrin, C., Michel, C., and Le Moine, N.: Spatial proximity, physical similarity, regression and ungaged catchments: A comparison of regionalization approaches based on 913 French catchments, Water Resour. Res., 44, https://doi.org/10.1029/2007WR006240, 2008.
Paola, C., Foufoula-Georgiou, E., Dietrich, W. E., Hondzo, M., Mohrig, D., Parker, G., Power, M. E., Rodriguez-Iturbe, I., Voller, V., and Wilcock, P.: Toward a unified science of the Earth’s surface: Opportunities for synthesis among hydrology, geomorphology, geochemistry, and ecology, Water Resour. Res., 42, https://doi.org/10.1029/2005wr004336, 2006.
Payn, R. A., Gooseff, M. N., and McGlynn, B. L.: Exploring changes in the spatial distribution of stream baseflow generation during a seasonal recession, Water Resour. Res., 48, https://doi.org/10.1029/2011WR011552, 2012.
Pechlivanidis, I. G. and Arheimer, B.: Large-scale hydrological modelling by using modified PUB recommendations: the India-HYPE case, Hydrol. Earth Syst. Sci., 19, 4559–4579, https://doi.org/10.5194/hess-19-4559-2015, 2015.
Pedregosa, F., Varoquaux, G., Gramfort, A., Michel, V., Thirion, B., Grisel, O., Blondel, M., Prettenhofer, P., Weiss, R., Dubourg, V., Vanderplas, J., Passos, A., Cournapeau, D., Brucher, M., Perrot, M., and Duchesnay, E.: Scikit-learn: Machine Learning in Python, J. Mach. Learn. Res., 12, 2825–2830, 2011.
Penna, D.: A recipe for why and how to set up and sustain an experimental catchment, Hydrol. Process., 38, https://doi.org/10.1002/hyp.15163, 2024.
Peters, N. E. and Aulenbach, B. T.: Water storage at the Panola mountain research watershed, Georgia, USA: Water storage at pmrw, Hydrol. Process., 25, 3878–3889, https://doi.org/10.1002/hyp.8334, 2011.
Pfister, L., Martínez-Carreras, N., Hissler, C., Klaus, J., Carrer, G. E., Stewart, M. K., and McDonnell, J. J.: Bedrock geology controls on catchment storage, mixing, and release: A comparative analysis of 16 nested catchments, Hydrol. Process., 31, 1828–1845, https://doi.org/10.1002/hyp.11134, 2017.
Prieto, C., Kavetski, D., Le Vine, N., Álvarez, C., and Medina, R.: Identification of dominant hydrological mechanisms using Bayesian inference, multiple statistical hypothesis testing, and flexible models, Water Resour. Res., 57, https://doi.org/10.1029/2020wr028338, 2021.
Qi, S. L. and Mason, C. A.: Data used to prioritize the selection of river basins for intensive monitoring and assessment by the U.S. Geological Survey, U.S. Geological Survey [data set], https://doi.org/10.5066/P98194QR, 2023.
Ray, L. K.: Limitation of automatic watershed delineation tools in coastal region, Ann. GIS, 24, 261–274, https://doi.org/10.1080/19475683.2018.1526212, 2018.
R Core Team: R: A Language and Environment for Statistical Computing, R Foundation for Statistical Computing, Vienna, Austria, https://www.R-project.org/ (last access: 5 June 2026), 2024.
Refsgaard, J. C. and Storm, B.: Construction, Calibration And Validation of Hydrological Models, in: Distributed Hydrological Modelling, Water Science and Technology Library, edited by: Abbott, M. B. and Refsgaard, J. C., vol. 22, Springer, Dordrecht, 41–54, https://doi.org/10.1007/978-94-009-0257-2_3, 1990.
Reinecke, R., Stein, L., Gnann, S., Andersson, J. C. M., Arheimer, B., Bierkens, M., Bonetti, S., Güntner, Kollet, S., Mishra, S., Moosdorf, N., Nazari, S., Pokhrel, Y., Prudhomme, C., Schewe, J., Shen, C., and Wagener, T.: Uncertainties guide global water model advancement, WIREs Water, 12, https://doi.org/10.1002/wat2.70025, 2025.
Renken, R. A.: Ground Water Atlas of the United States: Segment 5, Arkansas, Louisiana, Mississippi, Hydrologic Atlas 730, 28 pp., U.S. Geological Survey, https://doi.org/10.3133/ha730F, 1998.
Robert Maier, H., Rosa Taghikhah, F., Nabavi, E., Razavi, S., Gupta, H., Wu, W., Radford, D. A. G., and Huang, J.: How much X is in XAI: Responsible use of “Explainable” artificial intelligence in hydrology and water resources, J. Hydrol. X, 25, 100185, https://doi.org/10.1016/j.hydroa.2024.100185, 2024.
Rudlang, J. M., do Nascimento, T. V. M., van der Ent, R., Fenicia, F., and Hrachowitz, M.: Climate and landscape jointly control Europe's hydrology, EGUsphere [preprint], https://doi.org/10.5194/egusphere-2025-6372, 2025.
Safeeq, M. and Hunsaker, C. T.: Characterizing runoff and water yield for headwater catchments in the southern Sierra Nevada, J. Am. Water Resour. Assoc., 52, 1327–1346, https://doi.org/10.1111/1752-1688.12457, 2016.
Safeeq, M., Grant, G. E., Lewis, S. L., and Tague, C. L.: Coupling snowpack and groundwater dynamics to interpret historical streamflow trends in the western United States: COUPLING SNOWPACK AND GROUNDWATER DYNAMICS TO INTERPRET STREAMFLOW, Hydrol. Process., 27, 655–668, https://doi.org/10.1002/hyp.9628, 2013.
Salwey, S., Coxon, G., Pianosi, F., Singer, M. B., and Hutton, C.: National‐scale detection of reservoir impacts through hydrological signatures, Water Resour. Res., 59, e2022WR033893, https://doi.org/10.1029/2022wr033893, 2023.
Santhi, C., Allen, P. M., Muttiah, R. S., Arnold, J. G., and Tuppad, P.: Regional estimation of base flow for the conterminous United States by hydrologic landscape regions, J. Hydrol. (Amst.), 351, 139–153, https://doi.org/10.1016/j.jhydrol.2007.12.018, 2008.
Sauquet, E., Shanafield, M., Hammond, J. C., Sefton, C., Leigh, C., and Datry, T.: Classification and trends in intermittent river flow regimes in Australia, northwestern Europe and USA: A global perspective, J. Hydrol. (Amst.), 597, 126170, https://doi.org/10.1016/j.jhydrol.2021.126170, 2021.
Seaber, P. R., Kapinos, F. P., and Knapp, G. L.: Hydrologic unit maps, US Geological Survey [data set], https://doi.org/10.3133/wsp2294, 1987.
Sebestyen, S. D., Shanley, J. B., Blume, T., Duncan, J. M., Jones, J., Segura, C., and Mast, M. A.: Introduction to the special issue on research and observatory catchments, Hydrol. Process., 39, https://doi.org/10.1002/hyp.70069, 2025.
Shalev, G. and Kratzert, F.: Caravan MultiMet: Extending Caravan with multiple weather nowcasts and forecasts, arXiv [preprint], https://doi.org/10.48550/arXiv.2411.09459, 2024.
Shanley, J. B., Sebestyen, S. D., McDonnell, J. J., McGlynn, B. L., and Dunne, T.: Water's Way at Sleepers River watershed – revisiting flow generation in a post-glacial landscape, Vermont USA, Hydrol. Process., 29, 3447–3459, https://doi.org/10.1002/hyp.10377, 2015.
Shapley, L. S.: 17. A Value for n-Person Games, in: Contributions to the Theory of Games (AM-28), Volume II, edited by: Kuhn, H. W. and Tucker, A. W., Princeton University Press, Princeton, 307–318, https://doi.org/10.1515/9781400881970-018, 1953.
Shaw, S. B. and Riha, S. J.: Examining individual recession events instead of a data cloud: Using a modified interpretation of –Q streamflow recession in glaciated watersheds to better inform models of low flow, J. Hydrol. (Amst.), 434–435, 46–54, https://doi.org/10.1016/j.jhydrol.2012.02.034, 2012.
Shrestha, D., Howard, D., and Benedict, T. D.: Moderate Resolution Imaging Spectroradiometer (MODIS) irrigated Agriculture datasets for the conterminous United States (MIrAD-US), U.S. Geological Survey [data set], https://doi.org/10.5066/P9NA3EO8, 2019.
Sivapalan, M.: Pattern, process and function: Elements of a unified theory of hydrology at the catchment scale, in: Encyclopedia of Hydrological Sciences, Wiley, Chichester, UK, https://doi.org/10.1002/0470848944.hsa012, 2005.
Spieler, D., Mai, J., Craig, J. R., Tolson, B. A., and Schütze, N.: Automatic model structure identification for conceptual hydrologic models, Water Resour. Res., 56, https://doi.org/10.1029/2019wr027009, 2020.
Stein, L., Clark, M. P., Knoben, W. J., Pianosi, F., and Woods, R. A.: How do climate and catchment attributes influence flood generating processes? A large-sample study for 671 catchments across the contiguous USA, Water Resour. Res., 57, e2020WR028300, https://doi.org/10.1029/2020WR028300, 2021.
Stets, E. G., Archer, A. A., Degnan, J. R., Erickson, M. L., Gorski, G., Medalie, L., and Scholl, M. A.: The National integrated water availability assessment, U.S. Geological Survey, https://doi.org/10.3133/pp1894A, 2025.
Tague, C. and Grant, G. E.: A geological framework for interpreting the low-flow regimes of Cascade streams, Willamette River Basin, Oregon: GEOLOGICAL FRAMEWORK FOR LOW-FLOW REGIMES, Water Resour. Res., 40, https://doi.org/10.1029/2003wr002629, 2004.
Tague, C. and Grant, G. E.: Groundwater dynamics mediate low-flow response to climate warming in snow-dominated alpine regions, Water Resour. Res., 45, 2009.
Tallaksen, L. M.: A review of baseflow recession analysis, J. Hydrol., 165, 349–370, https://doi.org/10.1016/0022-1694(94)02540-R, 1995.
Tarasova, L., Gnann, S., Yang, S., Hartmann, A., and Wagener, T.: Catchment characterization: Current descriptors, knowledge gaps and future opportunities, Earth Sci. Rev., 252, 104739, https://doi.org/10.1016/j.earscirev.2024.104739, 2023.
Thompson, J. M., Hathaway, J. M., Perfect, E., and Schwartz, J. S.: The effect of stormwater infiltration and surrounding built infrastructure on local groundwater dynamics: a case study for regenerative stormwater conveyances, Sustain. Resilient Infrastruct., 1–11, https://doi.org/10.1080/23789689.2020.1772636, 2020.
Tran, V. N.: CAMELSH: A Large-Sample Hourly Hydrometeorological Dataset and Attributes at Watershed-Scale for Contiguous United States [data set], Zenodo, https://doi.org/10.5281/zenodo.15070091, 2025.
Tran, V. N. and Kim, T.: CAMELSH: A Large-Sample Hourly Hydrometeorological Dataset and Attributes at Watershed-Scale for Contiguous United States, Zenodo [data set], https://doi.org/10.5281/zenodo.15066778, 2025.
Tran, V. N., Xu, D., Van Nguyen, T., Kim, T., and Ivanov, V. Y.: CAMELSH: A large-sample hourly hydrometeorological dataset and attributes at watershed-scale for CONUS, Sci. Data, 12, 1307, https://doi.org/10.1038/s41597-025-05612-6, 2025.
Trancoso, R., Phinn, S., McVicar, T., Larsen, J., and McAlpine, C.: Regional variation in streamflow drivers across a continental climatic gradient, Ecohydrology, 10, e1816, https://doi.org/10.1002/eco.1816, 2017.
Turner, S., Hannaford, J., Barker, L. J., Suman, G., Killeen, A., Armitage, R., Chan, W., Davies, H., Griffin, A., Kumar, A., Dixon, H., Albuquerque, M. T. D., Almeida Ribeiro, N., Alvarez-Garreton, C., Amoussou, E., Arheimer, B., Asano, Y., Berezowski, T., Bodian, A., Boutaghane, H., Capell, R., Dakhaoui, H., Daňhelka, J., Do, H. X., Ekkawatpanit, C., El Khalki, E. M., Fleig, A. K., Fonseca, R., Giraldo-Osorio, J. D., Goula, A. B. T., Hanel, M., Horton, S., Kan, C., Kingston, D. G., Laaha, G., Laugesen, R., Lopes, W., Mager, S., Rachdane, M., Markonis, Y., Medeiro, L., Midgley, G., Murphy, C., O'Connor, P., Pedersen, A. I., Pham, H. T., Piniewski, M., Renard, B., Saidi, M. E., Schmocker-Fackel, P., Stahl, K., Thyer, M., Toucher, M., Tramblay, Y., Uusikivi, J., Venegas-Cordero, N., Visessri, S., Watson, A., Westra, S., and Whitfield, P. H.: ROBIN: Reference observatory of basins for international hydrological climate change detection, Sci. Data, 12, 654, https://doi.org/10.1038/s41597-025-04907-y, 2025.
UKIH: UK Institute of Hydrology (Great Britain), Low Flow Studies Reports, Institute of Hydrology, https://nora.nerc.ac.uk/id/eprint/9093 (last access: 5 June 2026), 1980.
United States Department of Agriculture, Soil Survey Staff, and Natural Resources Conservation, U.S. General Soil Map (STATSGO), Web Soil Survey, https://sdmdataaccess.sc.egov.usda.gov (last access: 5 June 2026), 2008.
U.S. Environmental Protection Agency: National Hydrography Dataset Plus (NHDPlus), USEPA, USGS, and Horizon Systems Corporation, https://www.epa.gov/waterdata/nhdplus-national-hydrography-dataset-plus (last access: 5 June 2026), 2008.
U.S. Geological Survey (USGS): Gap Analysis Project (GAP): Protected Areas Database of the United States (PAD-US) 4, U.S. Geological Survey [data set], https://doi.org/10.5066/P96WBCHS, 2024.
U.S. Geological Survey: USGS Water Data for the Nation, U.S. Geological Survey National Water Information System Database [data set], https://doi.org/10.5066/F7P55KJN, 2025.
Valeron, B. and Meixner, T.: Overland flow generation in chaparral ecosystems: temporal and spatial variability, Hydrol. Process., 24, 65–75, https://doi.org/10.1002/hyp.7455, 2010.
Van Metre, P. C., Qi, S., Deacon, J., Dieter, C., Driscoll, J. M., Fienen, M., Kenney, T., Lambert, P., Lesmes, D., Mason, C. A., Mueller-Solger, A., Musgrove, M., Painter, J., Rosenberry, D., Sprague, L., Tesoriero, A. J., Windham-Myers, L., and Wolock, D.: Prioritizing river basins for intensive monitoring and assessment by the US Geological Survey, Environ. Monit. Assess., 192, 458, https://doi.org/10.1007/s10661-020-08403-1, 2020.
Veldkamp, T. I. E., Wada, Y., Aerts, J. C. J. H., Döll, P., Gosling, S. N., Liu, J., Masaki, Y., Oki, T., Ostberg, S., Pokhrel, Y., Satoh, Y., Kim, H., and Ward, P. J.: Water scarcity hotspots travel downstream due to human interventions in the 20th and 21st century, Nat. Commun., 8, 15697, https://doi.org/10.1038/ncomms15697, 2017.
Vogel, R. M., Member, J., and Asce, N. M.: Flow-duration curves. I: New interpretation and confidence intervals, https://bpb-us-e1.wpmucdn.com/sites.tufts.edu/dist/a/4406/files/2019/04/flowDuration1.pdf (last access: 5 June 2026), 1994.
Web Soil Survey: http://websoilsurvey.nrcs.usda.gov/, last access: 11 May 2025.
Westerberg, I. K., Wagener, T., Coxon, G., McMillan, H. K., Castellarin, A., Montanari, A., and Freer, J.: Uncertainty in hydrological signatures for gauged and ungauged catchments, Water Resour. Res., 52, 1847–1865, https://doi.org/10.1002/2015WR017635, 2016.
Wieczorek, M. E. and LaMotte, A. E.: Attributes for NHDPlus Catchments (Version 1.1) for the Conterminous United States: Average Saturation Excess-Overland Flow, 2002, U.S. Geological Survey [data set], https://doi.org/10.3133/dds49026, 2010.
Wieczorek, M. E., Staub, L. E., Wnuk, K. C., and Hafen, K. C.: Data-Driven Drought Prediction Project Model Inputs for Upper and Lower Colorado Portions of the National Hydrologic Geo-Spatial Fabric version 1.1 and Select U.S. Geological Survey Streamgage Basins (ver. 2.0, July 2025), U.S. Geological Survey [data set], https://doi.org/10.5066/P98IG8LO, 2023.
Willard, J. D., Ciulla, F., Weierbach, H., Kumar, V., and Varadharajan, C.: Evaluating deep learning approaches for predictions in unmonitored basins with continental-scale stream temperature models, arXiv [preprint], https://doi.org/10.48550/arXiv.2410.19865, 2024.
Williams, P. W. and Ford, D. C.: Global distribution of carbonate rocks, Zeitschrift für Geomorphologie Suppl, 147, 1–2, 2006.
Wilson, C. G., Papanicolaou, A. N. T., and Denn, K. D.: Partitioning fine sediment loads in a headwater system with intensive agriculture, J. Soils Sediments, 12, 966–981, https://doi.org/10.1007/s11368-012-0504-2, 2012.
Winter, T. C.: The Concept of Hydrologic Landscapes, JAWRA Journal of the American Water Resources Association, 37, 335–349, https://doi.org/10.1111/j.1752-1688.2001.tb00973.x, 2001.
Wlostowski, A. N., Molotch, N., Anderson, S. P., Brantley, S. L., Chorover, J., Dralle, D., Kumar, P., Li, L., Lohse, K. A., Mallard, J. M., McIntosh, J. C., Murphy, S. F., Parrish, E., Safeeq, M., Seyfried, M., Shi, Y., and Harman, C.: Signatures of Hydrologic Function Across the Critical Zone Observatory Network, Water Resour. Res., 57, e2019WR026635, https://doi.org/10.1029/2019wr026635, 2021.
Wolock, D. M.: Hydrologic landscape regions of the United States, US Geological Service, U.S. Geological Survey, https://doi.org/10.3133/ofr03145, 2003a.
Wolock, D. M.: Infiltration-excess overland flow estimated by TOPMODEL for the conterminous United States (No. 2003-310), US Geological Survey, https://doi.org/10.3133/ofr03310, 2003b.
Worland, S. C., Farmer, W. H., and Kiang, J. E.: Improving predictions of hydrological low-flow indices in ungaged basins using machine learning, Environ. Model. Softw., 101, 169–182, https://doi.org/10.1016/j.envsoft.2017.12.021, 2018.
Wu, S., Zhao, J., Wang, H., and Sivapalan, M.: Regional patterns and physical controls of streamflow generation across the conterminous United States, Water Resour. Res., 57, e2020WR028086, https://doi.org/10.1029/2020wr028086, 2021.
Xia, Y., Mitchell, K., Ek, M., Sheffield, J., Cosgrove, B., Wood, E., Luo, L., Alonge, C., Wei, H., Meng, J., Livneh, B., Lettenmaier, D., Koren, V., Duan, Q., Mo, K., Fan, Y., and Mocko, D.: Continental-scale water and energy flux analysis and validation for the North American Land Data Assimilation System project phase 2 (NLDAS-2): 1. Intercomparison and application of model products, J. Geophys. Res.-Atmos., 117, https://doi.org/10.1029/2011JD016048, 2012.
Xie, J., Liu, X., Jasechko, S., Berghuijs, W. R., Wang, K., Liu, C., Reichstein, M., Jung, M., and Koirala, S.: Majority of global river flow sustained by groundwater, Nat. Geosci., 17, 770–777, https://doi.org/10.1038/s41561-024-01483-5, 2024.
Yang, L., Jin, S., Danielson, P., Homer, C., Gass, L., Bender, S. M., Case, A., Costello, C., Dewitz, J., Fry, J., Funk, M., Granneman, B., Liknes, G. C., Rigge, M., and Xian, G.: A new generation of the United States National Land Cover Database: Requirements, research priorities, design, and implementation strategies, ISPRS J. Photogramm. Remote Sens., 146, 108–123, https://doi.org/10.1016/j.isprsjprs.2018.09.006, 2018.
Yilmaz, K. K., Gupta, H. V., and Wagener, T.: A process-based diagnostic approach to model evaluation: Application to the NWS distributed hydrologic model, Water Resour. Res., 44, https://doi.org/10.1029/2007wr006716, 2008.
Zimmer, M. A. and Gannon, J. P.: Run-off processes from mountains to foothills: The role of soil stratigraphy and structure in influencing run-off characteristics across high to low relief landscapes, Hydrol. Process., 32, 1546–1560, https://doi.org/10.1002/hyp.11488, 2018.
Zipper, S. C., Hammond, J. C., Shanafield, M., Zimmer, M., Datry, T., Jones, C. N., Kaiser, K. E., Godsey, S. E., Burrows, R. M., Blaszczak, J. R., Busch, M. H., Price, A. N., Boersma, K. S., Ward, A. S., Costigan, K., Allen, G. H., Krabbenhoft, C. A., Dodds, W. K., Mims, M. C., Olden, J. D., Kampf, S. K., Burgin, A. J., and Allen, D. C.: Pervasive changes in stream intermittency across the United States, Environ. Res. Lett., 16, 084033, https://doi.org/10.1088/1748-9326/ac14ec, 2021.