
the Creative Commons Attribution 4.0 License.
the Creative Commons Attribution 4.0 License.
 | 26 May 2026
Technical note: An innovative monitoring approach to measure spatio-temporal throughfall patterns in forests
Lea Dedden
Markus Weiler
Throughfall in forests is spatially highly heterogeneous creating distinct patterns that persist over time and propagate into the soil. Despite its importance for forest ecohydrological processes, experimentally derived high-quality datasets describing spatio-temporal throughfall dynamics at fine temporal and spatial resolution are still scarce. The majority of studies were unable to measure throughfall at high temporal and/or spatial resolution because of extensive sampling efforts, especially in forests with complex structures. We present a novel, innovative and modular throughfall monitoring system for continuous, automated measurement of throughfall either as isolated canopy throughfall and as integrated throughfall (total throughfall reduced by litter interception). Without removing the water, the system allows to quantify the spatio-temporal throughfall variability at both intra-event and intra-stand levels. The network captures spatial throughfall patterns and their temporal persistence across rainfall events of varying size during leafed and non-leafed periods. The throughfall monitoring network features 60 self-built, cost effective throughfall samplers, with four throughfall collection compartments and tipping bucket units each connected to a newly developed microcontroller board enabling fully automated, low-maintenance operation during rainfall events. The network, collecting data since the winter of 2024/2025, is setup in a stratified sampling pattern among four forest plots of Beech, Douglas fir, Silver fir, and mixed trees in a mature temperate forest in Germany. Data from a four-week observation period in the spring of 2025 are included in this study to showcase the potential of this approach. The data support the networks' ability to capture small-range spatio-temporal throughfall patterns across the study area.
- Article
(6288 KB) - Full-text XML
- BibTeX
- EndNote


Rainfall reaching the tree canopy of a forest partitions into interception, stemflow and throughfall. In complex forest ecosystems interception fluxes comprise of canopy (Ic), understory (Iu) and forest floor interception (Il). The below canopy precipitation comprises stemflow (SF) and the throughfall components canopy drip (TFc), understory throughfall (TFu) and percolation of forest floor litter (Jl) (see Fig. 1). Canopy drip throughfall is the largest water input fraction in most forest ecosystems exhibiting high spatial heterogeneity due to redistribution within the tree canopy (Levia et al., 2011). Understory throughfall from secondary vegetation can further enhance this spatial variability. The emerging spatio-temporal patterns result in variable throughfall input to the forest floor which is depleted at some points (Holwerda et al., 2006; Keim et al., 2006) and can exceed even open rainfall at other points (Lloyd and Marques, 1988; Siegert et al., 2016).
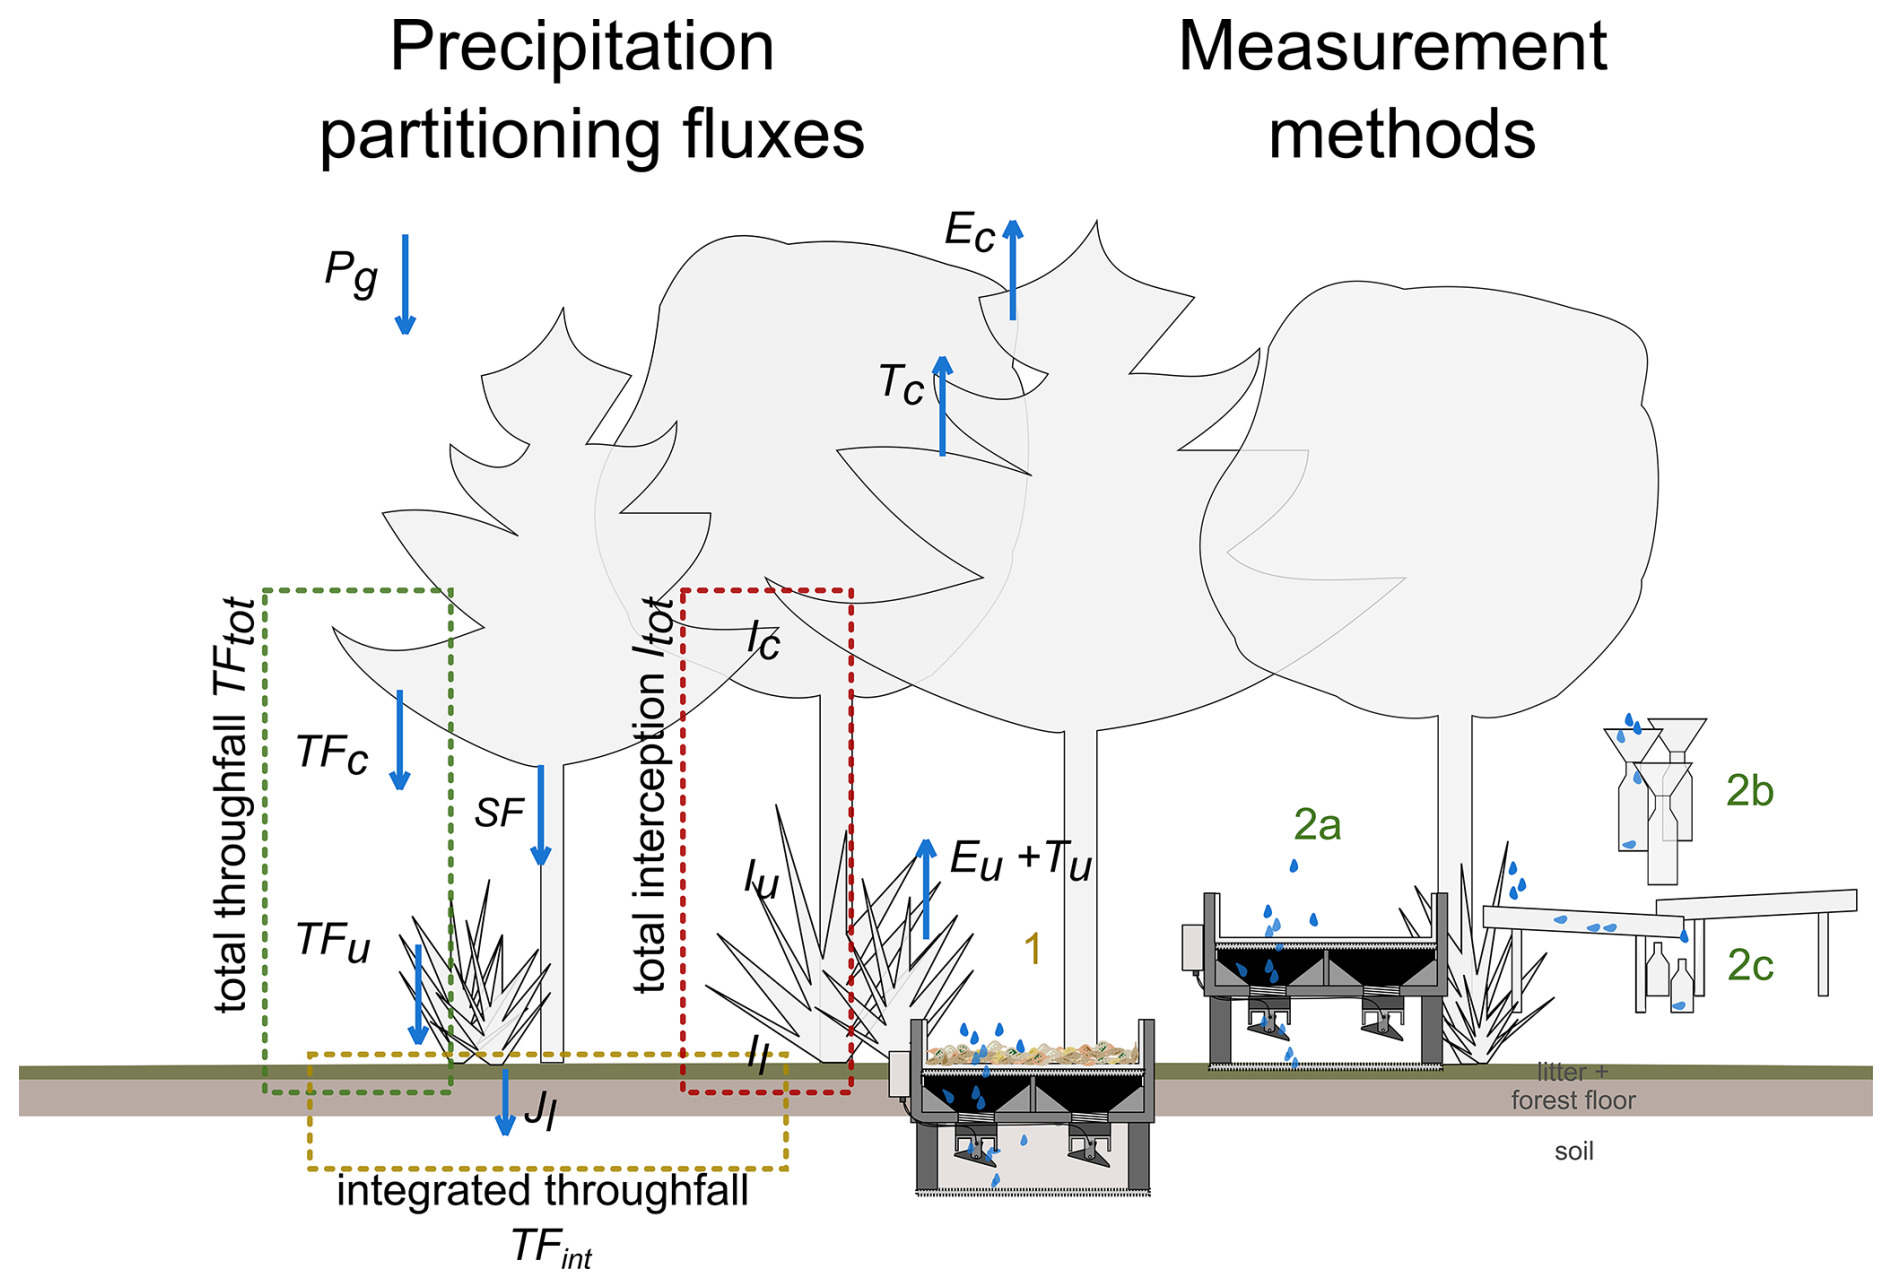
Figure 1Schematic overview of precipitation partitioning in a forest (left) and throughfall measurement methods (right). (1) shows the FluxIT sampler with litter inlay measuring integrated throughfall Jl, (2a)–(2c) show methods for canopy throughfall measurements TFc: the FluxIT sampler without litter inlay (2a), funnel (2b) and trough (2c) collectors.
Pronounced spatially heterogeneous pattern may persist over time and propagate through forest floor percolation further into the soil (Fischer-Bedtke et al., 2023; Schume et al., 2003; Shachnovich et al., 2008; Zimmermann et al., 2009) influencing the forest water balance – in particular near-surface hydrological processes. Throughfall flux components also act as nutrient pathways from the canopy to the ground (Zimmermann et al., 2008a) and are linked to biogeochemical processes and plant-water availability near the forest floor (Dalsgaard, 2007; Raat et al., 2002).
The main controls for the spatio-temporal variability of throughfall are vegetation structure and composition (Staelens et al., 2006b; Zimmermann et al., 2008a), topography (Siegert et al., 2016) and regional meteorology including precipitation (Levia and Frost, 2006; Raat et al., 2002; Siegert et al., 2016). Rainfall partitioning in forests illustrated in Fig. 1 can be described by (adapted from Carlyle-Moses, 2004)
with Pg= gross precipitation, Itot= total interception, TFtot= total throughfall and SF = stemflow (all in mm). Total vegetation interception and throughfall are given by
with Ic= canopy interception, Iu= understory interception and Il= litter interception and TFc= canopy throughfall and TFu= understory throughfall (all in mm). These components combine into the integrated (or net) flux of litter percolation (see coloured grouping in Fig. 1), defined as
with Jl= litter percolation or “integrated throughfall” (in mm). Litter percolation describes the amount of total throughfall that – reduced by vegetation and litter interception losses – percolates from the forest floor litter to infiltrate into the soil (Gerrits et al., 2010) and/or generate biomat flow in the litter layer (Bachmair and Weiler, 2026). Litter percolation is hereafter referred to as integrated throughfall, litter refers to the forest floor uppermost litter layer (see Sect. 2.2).
1.1 Experimental throughfall measurement approaches: potentials and limitations
The crucial role of interception storage on the one side and throughfall as the major water flux from the forest canopy to the soil shown in Fig. 1 has motivated a broad range of experimental studies dedicated to the challenging task of accurately estimating throughfall volumes and intensities, solute inputs and the spatio-temporal variability of throughfall (Keim et al., 2005; Levia and Frost, 2003, 2006; Link et al., 2004; Pypker et al., 2005). The last three decades have seen a rise in interest as research has begun to examine spatio-temporal throughfall patterns across different ecosystems, vegetation structures, and spatial scales, as well as the intricate relationship to biotic and abiotic controls (Bialkowski and Buttle, 2015; Levia et al., 2019; Staelens et al., 2006b). The principle measurement approach of most studies characterize three components: the collector type, the sampling size and the sampling design (Zimmermann and Zimmermann, 2014). Throughfall samplers are either individual funnels (approx. 500 cm2 orifice) or troughs (several meter long and several square meter orifice; both see Fig. 1) arranged in a stratified or random design. Sample sizes range from tens to hundreds of samplers supplemented by a nearby rain gauge for gross precipitation measurements. Readings are either continuous or at an event basis or a larger interval.
- a.
Sample size. Substantial effort has been made to obtain the most accurate throughfall estimates (Carlyle-Moses et al., 2014; Crockford and Richardson, 2000; Thimonier, 1998). The frequently used method of Kimmins (1973) uses the coefficient of variation to calculate the number of required collectors (sample size) to measure representative throughfall averages for a given confidence interval and precision (at pre-set small mean TF errors) (Carlyle-Moses, 2004; Lloyd and Marques, 1988; Rodrigo and Àvila, 2001). The required sample sizes are often large and not feasible for experimental setups. The deployment of roving samplers – contrary to samplers at fixed locations – increases the number of sampling locations through relocation (Kimmins, 1973; Link et al., 2004; Lloyd and Marques, 1988; Rodrigo and Àvila, 2001; Ziegler et al., 2009) and thereby reduces the sample size, but can only be used to estimate long-term averages.
- b.
Sampler type. The quality of the throughfall measurement is determined by the type of collector (trough or funnel) in addition to the sample size. The collector efficiency depends on spatial throughfall structure: funnel sampler generally offer high spatial resolution (Zimmermann et al., 2010) and may capture very short-range variation (few cm) or throughfall dripping edges. Troughs are quite efficient for small sample sizes reducing random errors, integrating outliers and covering large areas below the canopy. Samplers are often limited to measure one particular throughfall flux, e.g. canopy throughfall (TFc) due to their collector and installation in the field.
- c.
Sampling design. According to Thimonier (1998) and Zimmermann et al. (2010), the sampling strategy or design is more important than the sample size or type of sampler. For example a random distribution can avoid clustering, assure representative sampling and support geostatistical analysis approaches (Metzger et al., 2017; Zimmermann et al., 2009). In terms of measurement frequency, automated or manual readings define the temporal and spatial resolution of the data and consequently its scope of application. The absence of a consensus on reference standard devices and schemes for throughfall measurements is emphasized by the substantial body of research with varying experimental and analytical approaches (Levia and Frost, 2006; Llorens and Domingo, 2007; Zimmermann and Zimmermann, 2014). Different choices of spatial scales, measurement setups and ecosystems under study limit the comparability and transferability of study findings (Crockford and Richardson, 2000; Lloyd and Marques, 1988). Zimmermann et al. (2016) showed that existing measurement schemes are frequently not optimally matched to the system under study, omitting relevant factors such as the study area extent. Mismatches between required theory and practical feasibility (Thimonier, 1998; Zimmermann and Zimmermann, 2014) can produce large errors in the data (Kimmins, 1973; Thimonier, 1998; Zimmermann et al., 2010).
Throughfall is most variable at small scales (Wullaert et al., 2009) and varies as function of canopy complexity, tree density and precipitation magnitude (Rodrigo and Àvila, 2001; Staelens et al., 2006a). Measurements at the event or even intra-event scale and with a large sample size are recommended in order to investigate throughfall variability (Staelens et al., 2006b) and temporal stability of throughfall patterns (Fischer-Bedtke et al., 2023; Keim et al., 2005; Staelens et al., 2006a; Zimmermann et al., 2010). However, individual rain events are rarely observed at high temporal resolution (Staelens et al., 2008) and spatio-temporal analysis of throughfall typically rely on measurement schemes of a low number of events (Raat et al., 2002; Staelens et al., 2006a) typically missing intra-event variability.
1.2 Experimental throughfall measurement approaches: new directions
To address the outlined challenges, high quality throughfall data are needed, collected with appropriate measurement designs and devices (Germer et al., 2006; Levia and Frost, 2006; Zimmermann et al., 2009; Zimmermann and Zimmermann, 2014). In order to observe small-scale variability at the individual tree level and to representatively cover entire stand vegetation structures at high spatial resolution, these schemes should ideally have large number of samplers with adequately sized samplers at fixed locations (Fischer-Bedtke et al., 2023; Metzger et al., 2017; Zimmermann et al., 2010). Only measurements at high temporal resolution on intra-event scale allow to investigate canopy storage, interception changes and temporal stability of spatial throughfall patterns (Keim et al., 2005; Zimmermann and Zimmermann, 2014). Ideally, these schemes integrate automated and continuous measurement devices that collect long-term high quality data which meet the requirements for the analysis of seasonality effects (Zimmermann et al., 2008b) and long-term changes of throughfall spatio-temporal patterns (Link et al., 2004). Flexible and configurable sampling designs further expand research opportunities by enabling measurements of both frequently and rarely observed throughfall flux components and their interdependencies. Together, such approaches enhance understanding of throughfall controls including rainfall regimes, canopy interception variability and links to near-surface hydrological processes (Blume et al., 2022; Zimmermann et al., 2008a, b). Furthermore, high quality measurements also support more reliable modelling of watershed water fluxes, providing better insights into water losses and yields of forested areas (Crockford and Richardson, 2000; Zimmermann et al., 2008b).
In this technical note, we present a novel monitoring system for throughfall flux components with flexible application options that allow throughfall to be measured either in isolation or in an integrated manner across e.g. forest ecosystems of varying vegetation complexity. The presented system was implemented in forest plots of pure Beech, pure Douglas fir, pure Silver fir and mixed Beech and Douglas fir stands. The presented system comprises a network of 60 ground-level tipping bucket samplers with 240 individual collection compartments, enabling quantification of isolated or integrated throughfall spatio-temporal variability on an intra-event and intra-stand scale. The automated, continuous measurements generate long-term time series at a high spatio-temporal resolution with moderate maintenance requirements and minimal disturbance to near-surface hydrological processes. These data support investigations of spatial species-specific throughfall patterns, their temporal persistence and long-term changes.
The study aims are to (i) design a throughfall sampler with flexible application options that enables continuous, automated and minimally invasive measurement of integrated or isolated throughfall, (ii) develop a sampling scheme that accurately captures e.g. the variability of integrated throughfall across plots of different tree compositions; and (iii) implement the sampling scheme at the study site of a temperate, mature forest stand.
2.1 Throughfall monitoring system
The sampler and tipping bucket unit presented in this Section constitute the principle design of the throughfall monitoring system named “FluxIT sampler” (Flux of Integrated Throughfall sampler). The FluxIT sampler setup is modifiable in various ways to measure throughfall fluxes either in isolated or integrated manner according to respective research objectives and ecosystem under study. In this section, the sampler and tipping bucket unit designs are presented (Sect. 2.1.1 and 2.1.2). A detailed overview of application options and corresponding sampler modifications (Sect. 2.1.3) is followed by a description of the samplers set up in a throughfall measurement network (Sect. 2.3).
2.1.1 Sampler design
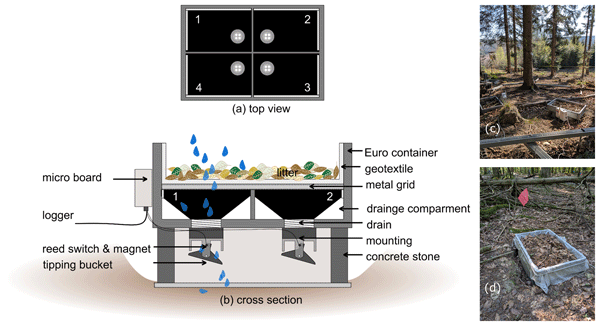
The throughfall sampler depicted in Fig. 2 uses a rectangular, solid plastic container (60 × 40 × 20 cm, Euro container) divided into four equal trough drainage compartments. Each compartment, with a 600 cm2 collection area, collects and funnels throughfall water to a separate tipping bucket unit for water flux measurement. The container's inner walls are lined with water and UV-resistant pond liner, clamped by aluminium ledgers to create sufficient slope for water drainage. Additionally, the aluminium ledgers serve as mounts for a detachable metal grid and geotextile (Fig. 2) that filters the throughfall to prevent clogging of the tipping bucket. The pond liner is attached to an opening at the bottom exit of the container with a commercial sink drain in each compartment. A nylon mesh filter keeps small particles out of the drain.
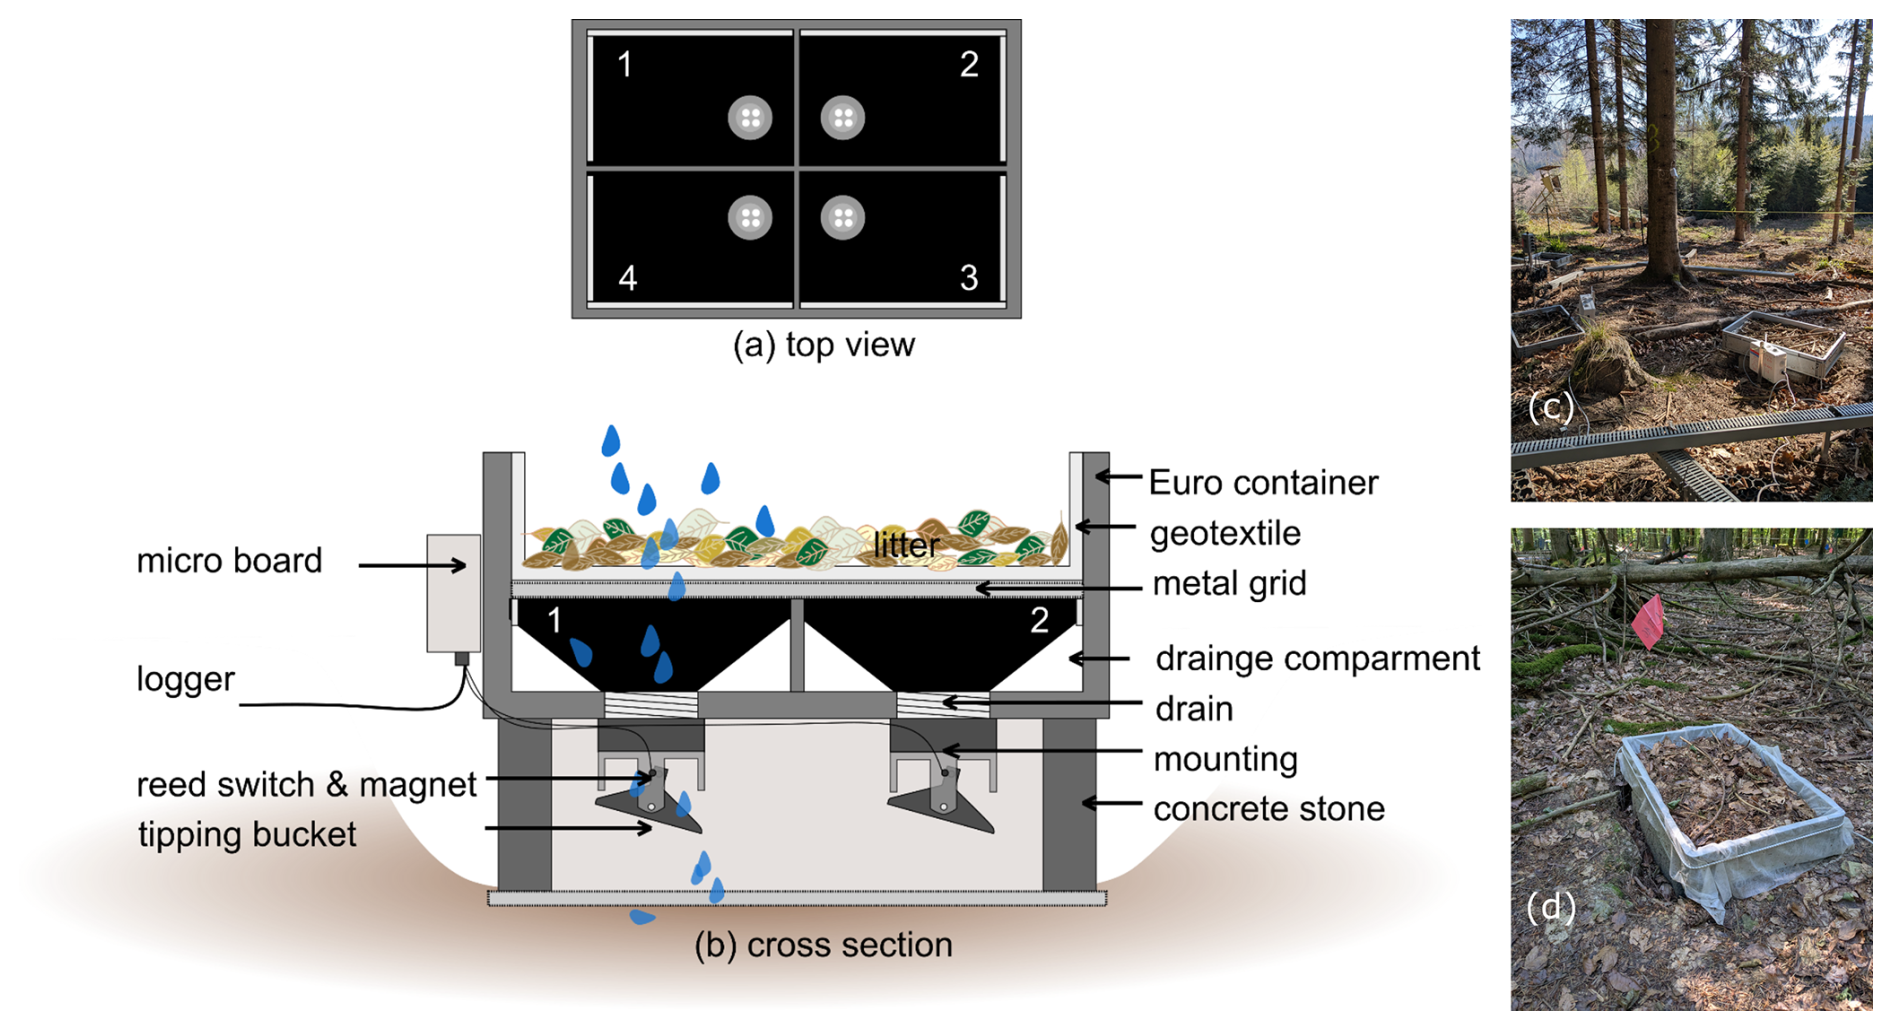
Figure 2Design of FluxIT sampler with four equal drainage compartments (top view), each equipped with single tipping bucket units for measurement (cross section). Photographs (c) and (d) show samplers installed at two locations in the field, at a moment of configuration II for measurements of integrated throughfall with litter in the samplers.
The tipping bucket units (see Sect. 2.1.2) are fastened to the drain treads underneath the container. Prior to installation, topsoil of 30 cm depth was removed at each sampler location. Metal grids and porous concrete stone frames (25 × 25 × 20 cm) with hollow centres were placed into the excavations to serve as sampler mountings. The throughfall samplers are positioned on top of these levelled stone frames. This setup creates a flat, sturdy mounting that prevents animal intrusion and allows the tipping buckets to tip freely (Fig. 2) releasing the quantified water fluxes to the soil below. Although excavation of a 25 × 25 cm area inevitably introduces local soil disturbance, this intervention is performed only once and provides a stable, levelled, and long-term secure mounting for the sampler and its tipping units. Routine maintenance (e.g. exchange of tipping buckets) thereafter requires only lifting or tilting the sampler sideways. Unlike the typical large troughs, this design is minimally invasive to near-surface hydrological processes and tree water supply. Water is not redirected into a larger funnel- and collection system but instead is released in situ and near-realtime to the soil. This makes it possible to install sensors close by for the direct measurement of other soil processes, such as water content or matric potential, at a distance of up to 0.5 m. Positioning the containers at ground level minimizes measurement inaccuracies e.g. wind-induced undercatch. Alternative installation approaches with reduced soil disturbance are addressed in Sect. 2.1.3.
2.1.2 Tipping bucket units
The 3D-printed tipping buckets consist of two parts: a mounting with a reed switch and threaded top, and a tipping bucket with a magnet on top (Fig. 2). The tipping bucket is attached to the mounting by a stainless-steel pin. Both components are made from durable and chemically resistant PETG, with the inner surfaces of the tipping bucket units ironed reducing water adhesion and rewetting effects. For further information on the design and implementation of the tipping bucket unit see Paulsen and Weiler (2025). A 3 mm diameter pipe inside the mounting channels water from the drain to the tipping bucket, guaranteeing a maximum flow rate that cannot be exceeded. During very high intensity rainfalls, the drainage compartments can store and buffer up to 1 L of excessive water. Tipping buckets with a defined volume of 2.7 mL alternately fill up with water, tip to empty and thereby move the magnet past the reed switch. This mechanism triggers the reed switch to sense out short electric pulses. The pulses are recorded by the micro board as tip counts per defined time interval. Counted tips are converted to water volumes and divided by collection area of the integrated throughfall sampler compartments to calculate the integrated throughfall depth (mm) for every compartment.
The micro boards were designed as a cost-effective solution for continuous, automated measurement of integrated throughfall water volumes. They each accommodate 4 pulse count inputs and an extension for four additional pulse count inputs. A micro controller (AVR SAMD21) is used to realize the pulse inputs as interrupts, guaranteeing that no pulses are missed. Two steps are involved in debouncing the tipping bucket units: each reed switch has a resistance capacitor filter linked to reduce bouncing. Laboratory tests with debouncing tipping bucket units produced 500–800 ms as ideal timeout settings preventing erroneous double tips” while still capturing all pulses for tested maximum rainfall intensity of less than 90 mm h−1. The micro board is connected to a Campbell Scientific CR350 data logger via SDI-12 data communication, logging at 15 min intervals. Any other SDI-12 logger could be used as well. A mini-USB port offers direct connection to a computer. For detailed descriptions on the micro board hardware and programming please refer to Paulsen and Weiler (2025).
2.1.3 Application options of throughfall sampler
The FluxIT sampler setup is modular and can be adapted to respective research objectives and ecosystems under study.
Two primary configurations are distinguished:
-
Configuration I. Alternative to traditional methods measuring isolated throughfall fluxes e.g. canopy throughfall (TFc) with or without understory throughfall (TFu).
-
Configuration II. Novel method measuring integrated throughfall fluxes e.g. litter percolation (Jl).
The height of the sampler is adjustable to enable these configurations. Mounted on a simple stainless-steel frame above understory vegetation and without any inlay, the sampler measures canopy throughfall (TFc) (see (2a) in Fig. 1) in a manner comparable to traditional trough- or funnel systems (configuration I). Installed at ground level, the sampler captures integrated canopy and understory throughfall (TFc + TFu). With a litter layer- defined here as the uppermost forest floor layer of unfragmented leaves and needles (definition see Sect. 2.2) – placed or naturally accumulating onto the sampler's metal grid and geotextile (Fig. 2), the sampler operates as a novel device for measuring litter percolation at high spatio-temporal resolution. This application allows to investigate the less frequently observed flux of litter percolation and the effect of litter interception that reduces throughfall to the fraction of water percolating towards deeper layers of forest floor and soil (Gerrits et al., 2007; Paulsen and Weiler, 2025).
Only the loose, uppermost, unfragmented fresh litter is placed in the sampler initially; as litter fragments and accumulates over time, percolation time may increase. The samplers can be emptied e.g. annually or sub-annually. In all configurations, the quantified water can also be sampled beneath the tipping buckets for water quality analysis. Adding litter into the samplers has the practical benefit of lowering measurement errors since the organic material prevents splash out of the sampler and functioning as an additional litter trap (Fig. 2). For less invasive field installation, the porous concrete stone frames can be replaced by PCV pipes, requiring only an excavation of 4 times 10 cm in diameter and 20 cm depth. Freely swinging, automatically levelled tipping buckets are also feasible and would reduce the requirement of a precisely levelled sampler mounting. Both container and tipping bucket unit sizes are flexible and adaptable to the study purpose and monitored system. Euro-containers are available in a wide range of dimensions.
2.2 Site description
The integrated throughfall samplers are part of an ecohydrological sensor network located at the ECOSENSE forest research site (Fig. 3) near Ettenheim (48.2685° N, 7.8782° E), between the Upper Rhine Valley and the Black Forest in south western Germany. The ECOSENSE forest research site monitors forest ecosystem dynamics such as carbon and water flux dynamics in space and time with a wide range of established measurement technologies and newly developed sensors (Tesch et al., 2025). The elevation of the research site ranges from 480 to 500 m a.s.l., the climate is temperate-humid (Köppen Cfb) with mean annual precipitation of 1120 mm and mean annual temperature 9.5 °C in reference period 1961–1990 (Landesanstalt für Umwelt Baden-Württemberg, 2024). Occasional summer drought can occur (year 2003 and 2018). The northern part of the research site is located on Cambisols over Triassic Buntsandstein, while the southern part features Pseudogley soils over Triassic Muschelkalk (Werner et al., 2024). The forest floor, defined as the upper most forest soil layer of fragmented and unfragmented organic material above the mineral soil layer (LOf & Oh), averages 10 cm in thickness and is classified as moder (Landesamt für Geologie, Rohstoffe und Bergbau Baden-Württemberg, 2024). The litter layer (L) of < 2 cm thickness consists of loose, uppermost, unfragmented fresh litter including leaves and needles.
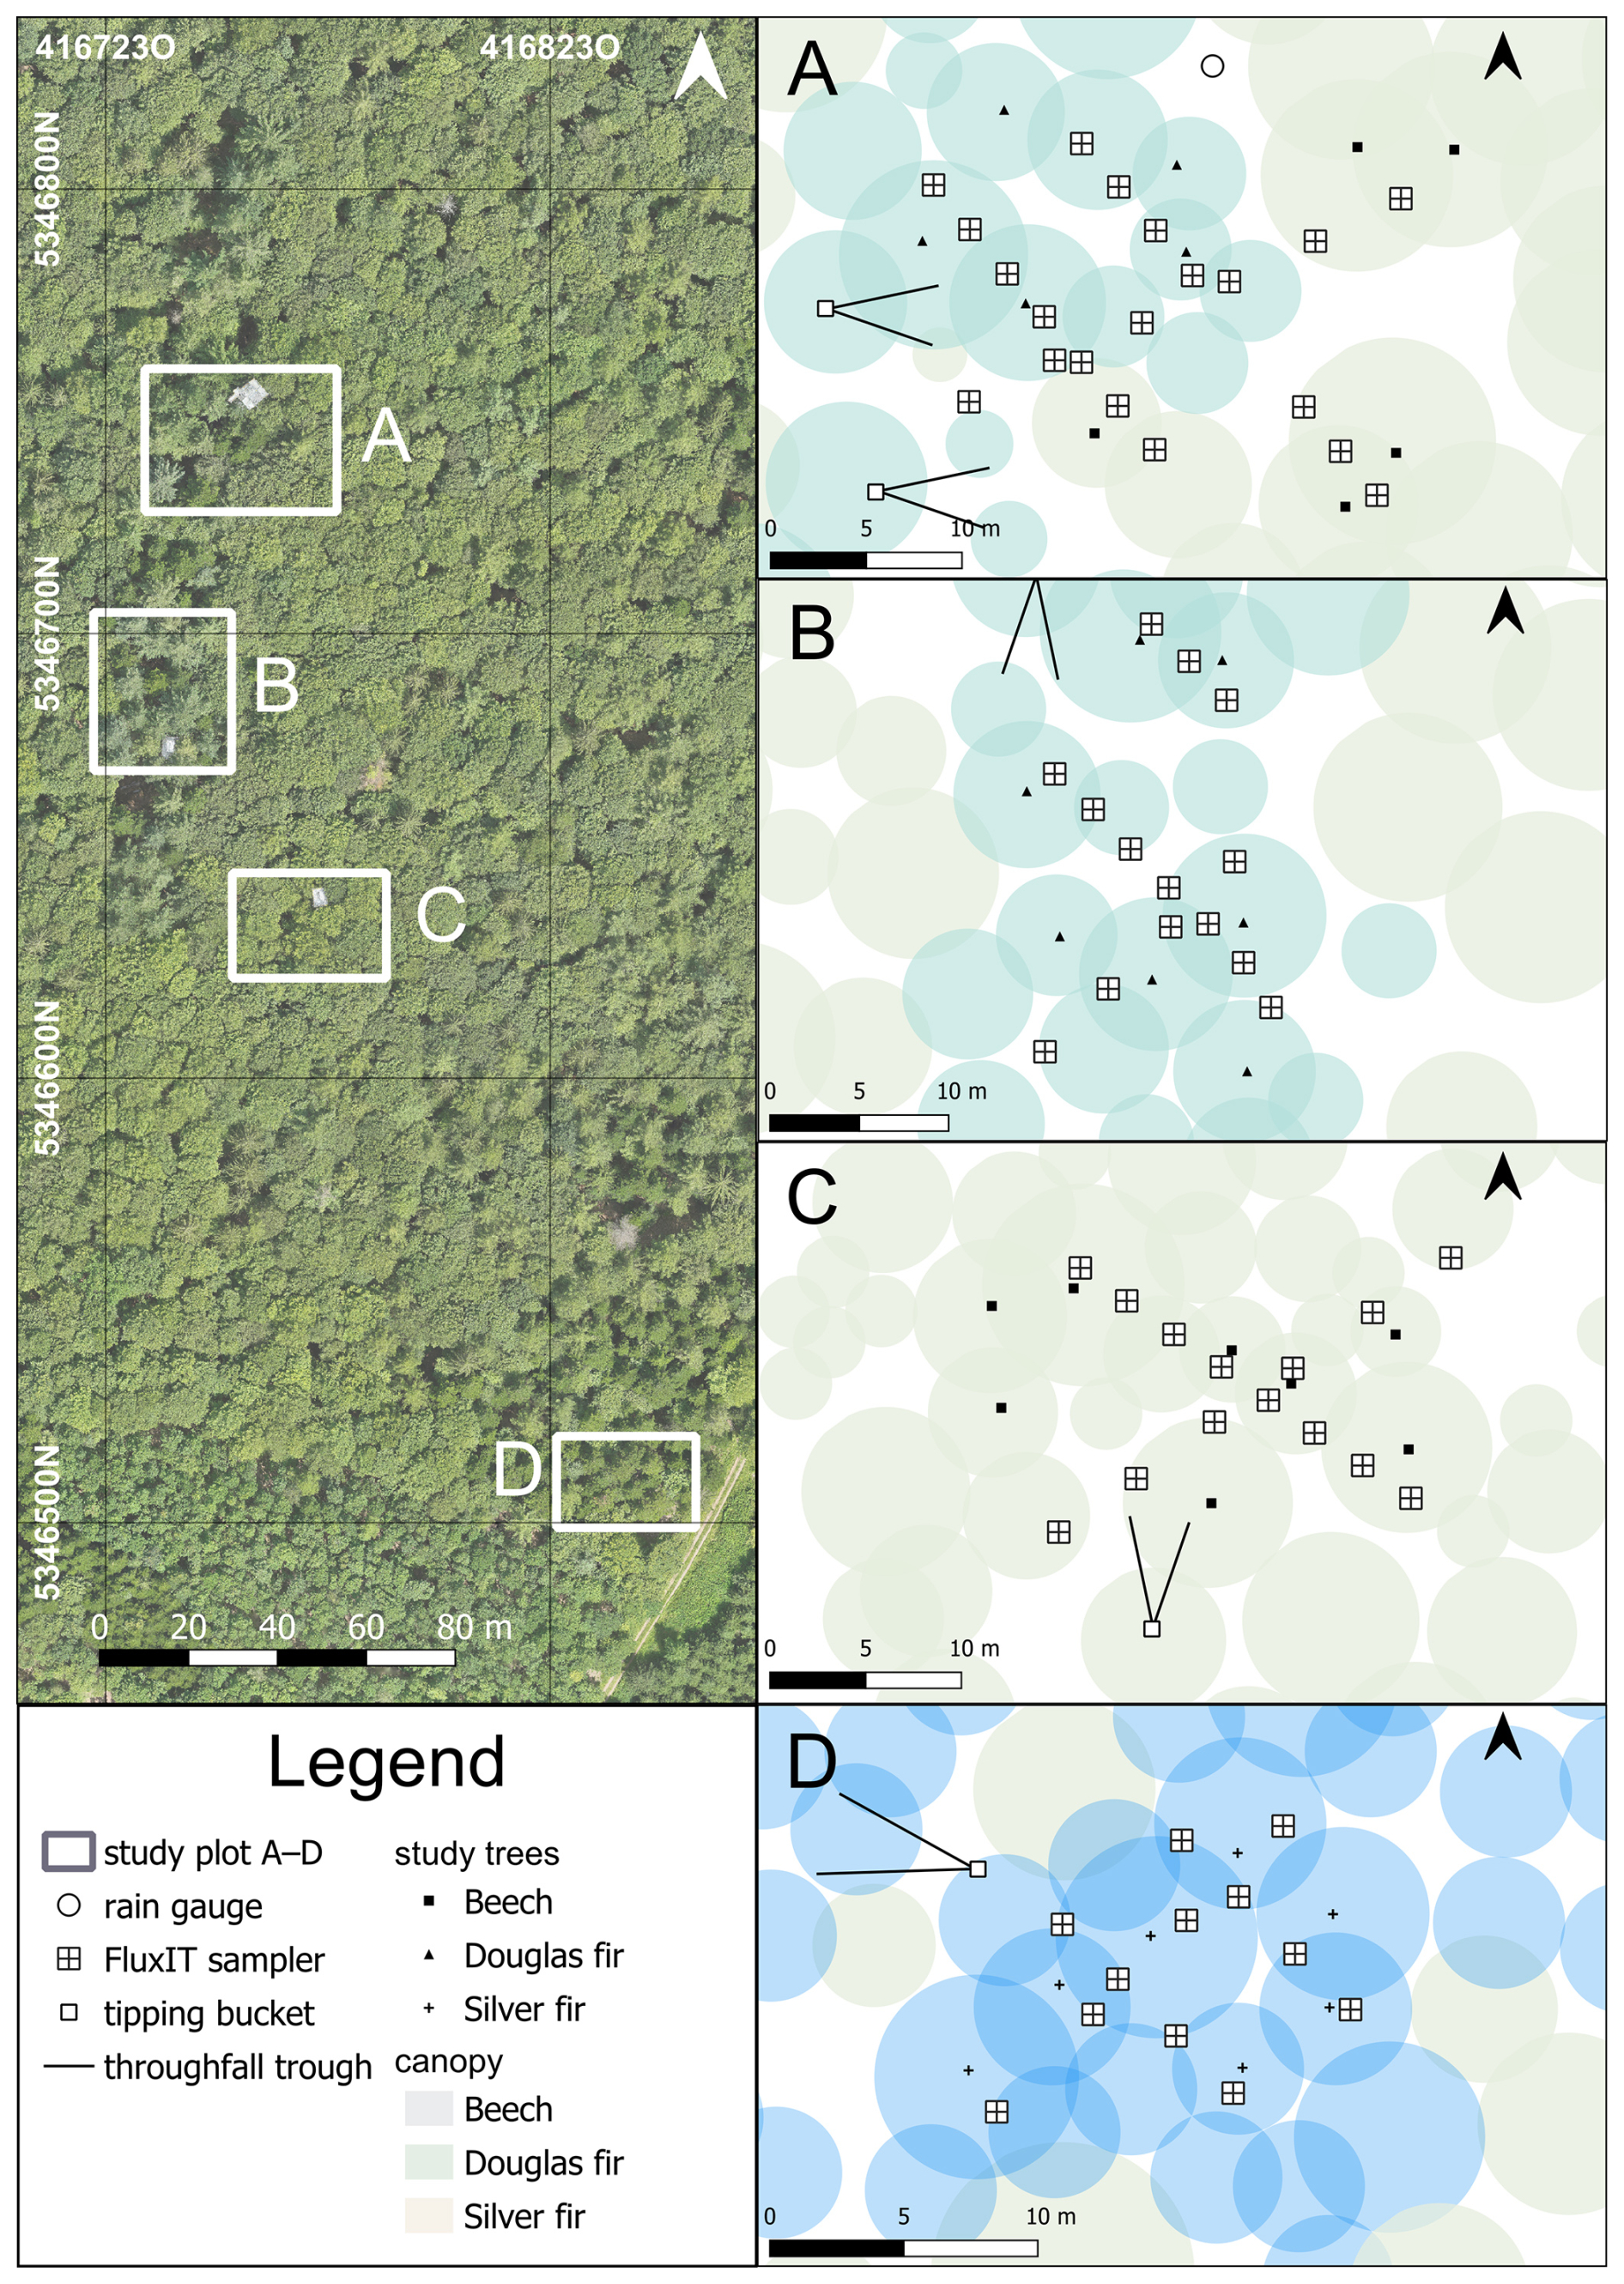
Figure 3ECOSENSE forest research site near Ettenheim, Germany. To the right the integrated throughfall measurement network of each study plot (A)–(D) with mixed Beech and Douglas fir (A), pure Douglas fir (B), pure Beech (C) and pure Silver fir (D). Image: M. Gassilloud
The research site is covered by a European Beech-dominated mixed forest managed for timber production. In addition to Beech trees (Fagus sylvatica), the stand is composed by patches of Silver fir (Abies alba) and Douglas fir (Pseudotsuga menziesii), aged approximately 80, 60 and 50 years, respectively (Landesamt für Geoinformation und Landentwicklung Baden-Württemberg, 2025). Individual spruce and oak trees (Werner et al., 2024) complement the average tree density of 500 trees ha−1. With the exception of a few younger 10–20 m tall Beech and Silver fir trees, there is no understorey vegetation, and the overstorey reaches heights of 25–35 m. The study area shown in Fig. 3 was divided into four subplots: a mixed Beech & Douglas fir plot (A), pure Douglas fir (B) and pure Beech (C) in direct vicinity on a plateau and a Silver fir plot (D) located 200 m southeast on a gentle southeastern slope (Fig. 3). Each subplot is approx. 400 m2 large and includes 7–10 selected “measurement trees” of comparable age and height.
2.3 Throughfall measurement network
The throughfall measurement network of 60 integrated throughfall samplers is installed in a stratified design of perpendicular transects across the four plots (Fig. 3A–D). This distribution supports measurements below various canopy positions, including stem closeness, canopy centre, and canopy edge, and prevents clustering while guaranteeing coverage of the variance of the forest structure (Holwerda et al., 2006; Link et al., 2004). The network design combines a model-based and a design-based component as suggested by Zimmermann and Zimmermann (2014) to account for objective assessment of uncertainty together with purposive measurement such as for interest in distribution across the entire area. The sampler design of four neighbouring trough and tipping bucket units adds measurement points in direct vicinity (model-based component). This supports outlier detection and is favourable for geostatistical analysis approaches improving variogram estimation (Voss et al., 2016; Zimmermann et al., 2009). The distribution of the samplers on transects with 3 and 5 m spacing in NW–SE and NE–SW orientation (design-based) ensures an unbiased estimate of spatial mean throughfall. Furthermore, variably spaced transects also support to apply geostatic approaches like variograms and enable the estimation of short- and long range throughfall variability including anisotropy (Schume et al., 2003). The sampler range in distances of 1–10 m to surrounding tree stems. Beginning in December 2024, continuous integrated throughfall measurements of the first installed integrated throughfall samplers were conducted. Regular maintenance has been performed on all samplers.
Figure 3 also depicts complementary measurements of the network: five traditional throughfall trough collectors positioned at random within each study plot, and two rain gauges for gross precipitation complement the setup. The trough collectors consist of two V-shaped stainless-steel troughs of 0.3 m2 receiving area and a length of 3 m installed 1 m a.g.l. at an 45° angle relative to each other. The troughs channel collected water into a tipping bucket rain gauge (Rain collector II 7852, Davis Instruments, resolution 0.2 mm) covered by a nylon mesh. Gross precipitation is measured with tipping bucket rain gauges (YOUNG Tipping bucket rain gauge 52 202, resolution 0.1 mm). They were placed at on opening located at 200 m distance from plots mounted 1 m a.g.l. and above the canopy at 47 m height installed on a measurement tower located at the centre of the mixed plot (Fig. 3). Precipitation data were wind-corrected according to Kochendorfer et al. (2017). LAI values are derived from hemispherical photographs and validated by litter trap. They are available for two dates immediately before and after the measurement period for the Mixed, Beech and Douglas fir plots from Lotz et al. (2026).
3.1 Calibration of the tipping bucket unit
Every individual tipping bucket unit was calibrated in the laboratory to determine single tip volumes. 3D-printed inflow regulation plugs were screwed onto PET laboratory bottles of 100 mL and plugged upside down into the drains of each compartment dripping at maximum rate of 0.67 mL s−1 (Bialkowski and Buttle, 2015; Levia et al., 2019; Staelens et al., 2006b). For all tipping buckets the average tipping bucket volume is 2.87 mL (SD = ±0.36) resulting in a resolution of 0.05 mm tip−1 and an accuracy of 4.4 % calculated as mean relative error of measurements to mean tip volume (2.87 mL). The tip resolution and accuracy are comparable with or even exceeds other commercial tipping bucket rain gauges (e.g. HOBO 0.2 mm resolution with 1 % accuracy; YOUNG 0.1 mm resolution with 2 % accuracy; DAVIS 0.2 mm with 4 % accuracy). Four different 3D printers (Bamboo Lab P1P, Original Prusa i3 MK2, Raise3D Pro2, Ultimaker4) were used to manufacture the 240 tipping buckets in order to speed up the manufacturing process. The calibration results in Fig. 4 show differences in the median tip volumes between 2.71 and 3.14 mL and average tipping bucket weights between 9.3 to 11.1 g across the print batches, despite the use of identical CAD input files. These variations start with varying printer accuracies and subsequently propagate into the tipping bucket volume measurements. Because of undercatch effects, the average tip volume from calibration decreases with the weight of the tipping bucket. Distinct boxplot IQRs of the print batches of 0.2 mL (black) to 0.5 mL (transparent) (Fig. 4) show the variability of within-batch precision of the individual printers. The calibration results highlight the importance of individual calibration for each tipping bucket unit and the need for regular field calibration to assure continuous high data quality. Integrated throughfall volumes and according depths were derived from tip counts of tipping bucket units as following:
with xpulse= counted tips, the individual calibration coefficient ccalibration= 2.21 to 3.69 mL and a collection area of Acollection= 600 cm2.
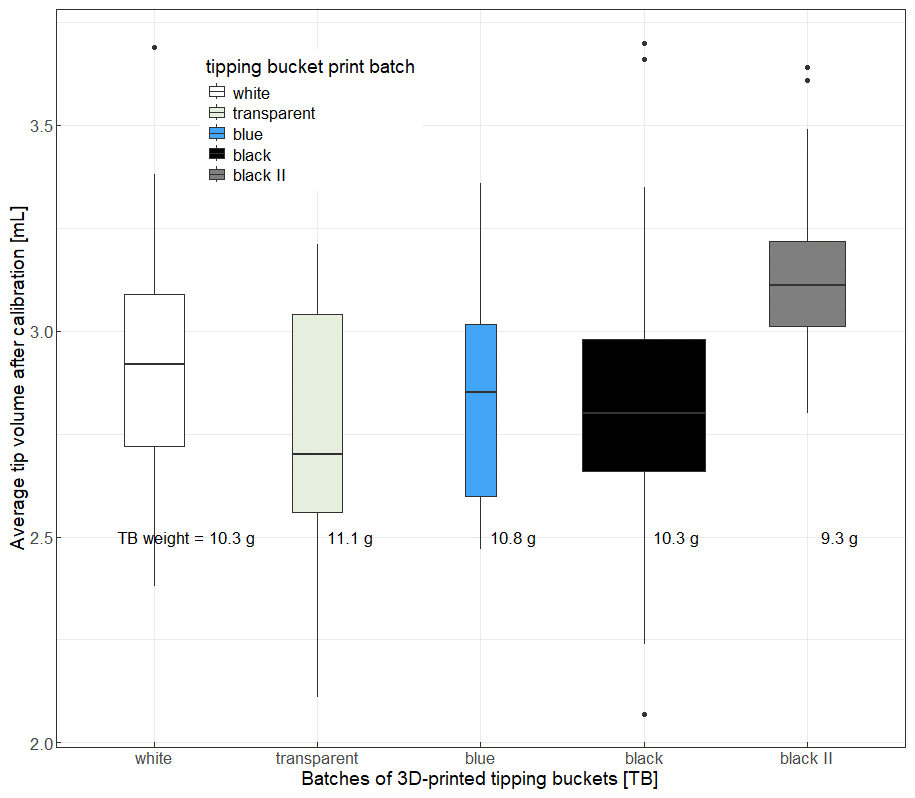
Figure 4Calibration of 240 tipping bucket units with boxplots showing average tip volumes of tipping bucket units from five 3D-printing batches (batches defined by filament colours white, transparent, blue, black I & II).
3.2 Spatio-temporal dynamics of integrated throughfall from measurement period in spring 2025
3.2.1 Separation of precipitation events and development of event throughfall coefficient
The dataset included in this technical note originates from an early measurement period in which unfragmented litter was retained inside the samplers (configuration II) and the samplers were installed at ground level. Effectively, litter percolation (Jl) was measured as an integrated flux of over- and understory throughfall (TFc + TFu) reduced by litter interception (Il). The event separation and development of throughfall coefficient are based on integrated throughfall data (Jl); however, the approach is transferable to datasets derived from isolated throughfall (TFc) measurements.
Continuous in situ integrated throughfall (Jl) data from all four subplots were available starting 2 April 2025. The corresponding time series of wind-corrected (Kochendorfer et al., 2017) hourly gross precipitation (Pg) from the tower station was separated for individual rainfall events and validated against ground station precipitation data. Events were defined as periods of continuous hourly Pg≥ 0.1 mm with a maximum of one hour Pg≤ 0.1 mm in between and a minimal total event Pg≥ 2.5 mm. An event ends when Pg≤ 0.1 mm for two consecutive hours or more. When applied to the integrated throughfall data, the event separation accounts for throughfall and litter percolation up to two hours post-event. The observed data showed that this time frame is well suited as most integrated throughfall events ended 2 h after precipitation cessation. “Last drips” recorded several hours past the event were not included. Water amounts from these periods were marginal and negligible.
To express event integrated throughfall depths as ratios of event gross precipitation (Pg), throughfall coefficients (cTF) were developed for each of the separated precipitation events. Analogous to the runoff coefficient (e.g. Blume et al., 2007 or Savenije, 1996), the event throughfall coefficient cTFdescribes the total event throughfall depth at a given location (a tipping bucket unit) as a fraction of total event gross precipitation. The metric facilitates comparison of throughfall fluxes across the four plots and indicates how Pg is redistributed by forest vegetation, specifically the percentages of Pg lost to interception and infiltrating into the soil. For a precipitation event i at a location j (tipping bucket unit), the throughfall coefficient is defined as
with event gross precipitation and TFij= event throughfall (both in mm). Depending on the sampler configuration (configuration I or II), cTF describes either isolated canopy throughfall (TFc) or integrated throughfall (Jl) expressed as a fraction of gross precipitation.
3.2.2 Throughfall variability of an example event
The selected example of a moderate precipitation event occurring 17 April 2025 (total event Pg= 11.2 mm, 23 h, max. intensity of 1 mm h−1) originates from an early measurement period in which litter was retained inside the samplers (configuration II). Effectively, litter percolation was measured as an integrated flux of throughfall reduced by litter interception. Figure 5 illustrates the spatio-temporal variability of integrated throughfall (Jl) of 80 selected tipping bucket units at the four forest stands of Beech, Douglas fir, Silver fir and mixed trees. The median total event integrated throughfall (Jl) of the selected tipping bucket units per plot is highest at the Beech plot with Jl= 11.1 mm followed by the Douglas fir and mixed plot (Jl= 10.4 and 9.8 mm). The Silver fir plot has the lowest median with Jl= 5.9 mm. Throughout the event, the cumulative integrated throughfall curves of selected tipping bucket units as well as their medians follow the overall trend of gross precipitation (Fig. 5, upper panels). Measurement locations (tipping bucket units) across the Beech and Douglas fir plot show a higher spatial heterogeneity in integrated throughfall depth then at the Silver fir and mixed plot. Heat maps in Fig. 5 (lower panels) visualize the intra-stand spatio-temporal variability of integrated throughfall: General spatio-temporal patterns resemble among plots with Jl ranging from 0 to 3 mm h−1 across measurement points of few meters' distance. At several sampling locations across all plots integrated throughfall during the event is low but steady with consistent hourly Jl< 0.3 mm h−1 and an event Jl< 6 mm. Early-stage integrated throughfall during the first hours of the event is lower than precipitation (approx. 50 % Pg). Increasing precipitation intensity on 17 April 2025 at 02:00 to 07:00 LT appears to translate after canopy redistribution (TFc+ TFu) and litter modulation (Il) into increasing integrated throughfall intensities during these hours. These periods of Pg≥ 0.75 mm h−1 (17 April 2025, 02:00 to 07:00 and 17:00 LT) generate peaks (≥ 3 mm h−1) at some locations in the Silver, Douglas fir- and Beech plot. However, the majority of tipping bucket units in all four plots record integrated throughfall up to 1 mm h−1. In particular, the first 2 and the last 4 h of the event characterize low percolation depths in line with small gross precipitation depths.
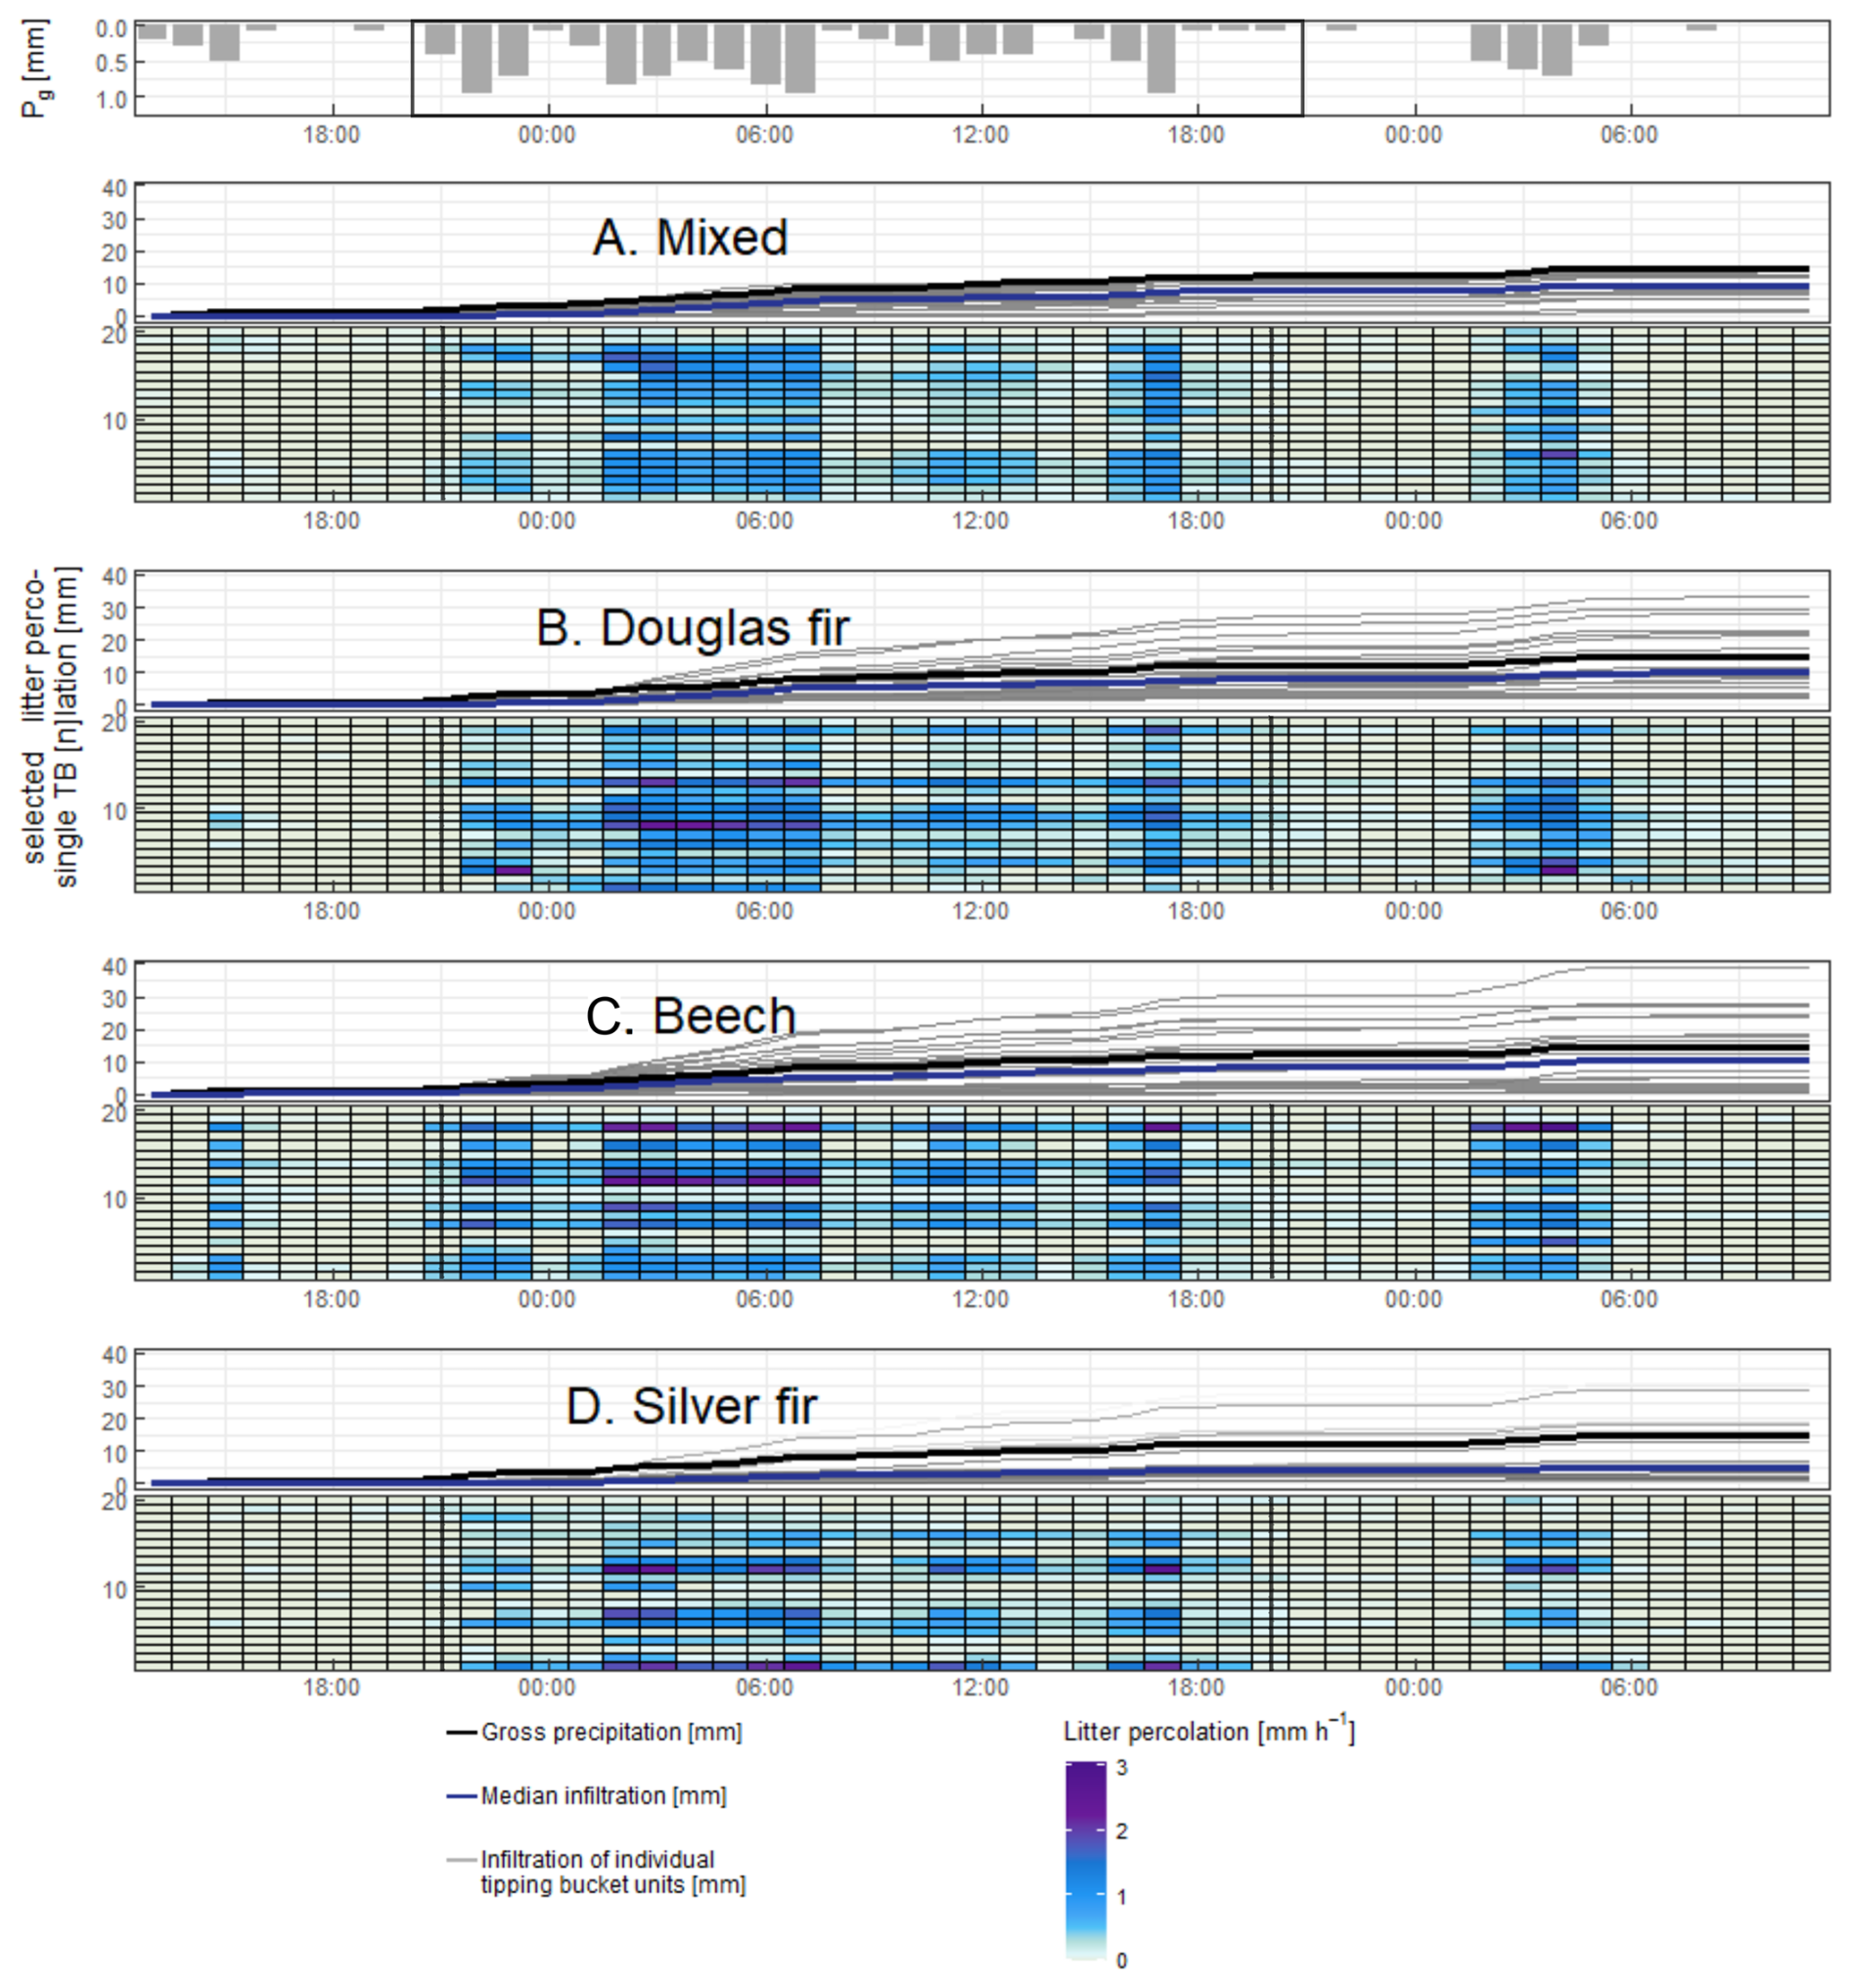
Figure 5Spatio-temporal variability of Jl during an event on 17 April 2025 (Pg = 11.2 mm, 23 h) at four subplots Mixed (A), Douglas fir (B), Beech (C) and Silver fir (D) at the ECOSENSE research site. Black lines and box indicate the event (start to end).
3.2.3 Integrated throughfall variability of observation period
Figure 6 compares the measured integrated throughfall (litter percolation, Jl) for selected events (total event Pg≥ 2.5 mm) that occurred during a two-week period end of April 2025, when foliage was already well developed. The total event precipitation ranged between 3.2 and 11.2 mm, with durations between 4 to 23 h. Comparing the events, the median throughfall coefficients (cTF) for Jl increase with total Pg for the Douglas fir, Mixed and less pronounced for the Silver fir plot. In contrast, throughfall coefficients of the Beech plot show no distinct relationship to event precipitation magnitude. Events of duration ≥ 10 h (event 2 & 6) show larger variability in Jl across the single plots than events of duration ≤ 10 h (event 1, 3, 4, 5). This increased heterogeneity is reflected in larger interquartile ranges (IQRs of 0.9 to 1 for cTF) for event 2 at Beech and Douglas fir plot. It is accompanied by several locations with a cTF up to 3.8 (scatter) and a large number of locations with low or no percolation measured. For events 1 & 6 of equal precipitation depths (approx. Pg= 7 mm) but different duration (4 to 11 h), the median cTF values are similar for all species groups. However, the longer event 6 characterizes a stronger variability of Jl shown by the large IQR of Beech, Douglas fir and mixed boxplot quartiles expanding from 0 to 0.9 cTF. In contrast, the shorter event 1 appears to produce spatially comparably homogenous Jl (comparably narrow IQRs of < 0.5 cTF with shorter upper whiskers and few locations of zero total event throughfall). Event-specific differences in integrated throughfall must also be interpreted in light of antecedent wetness conditions and phenological changes. The mean leaf area index (LAI) varied between 11 April 2025 and 8 May 2025 due to the ongoing growing season in April 2025. Mean LAI increases from 3.79 to 5.2 at the Beech plot and from 4.55 to 4.86 at the Mixed plot, while it decreases from 6.18 to 4.64 at the Douglas fir plot. These temporal and inter-plot differences in LAI likely influenced interception and throughfall redistribution and should be considered when comparing cTF across events and species.
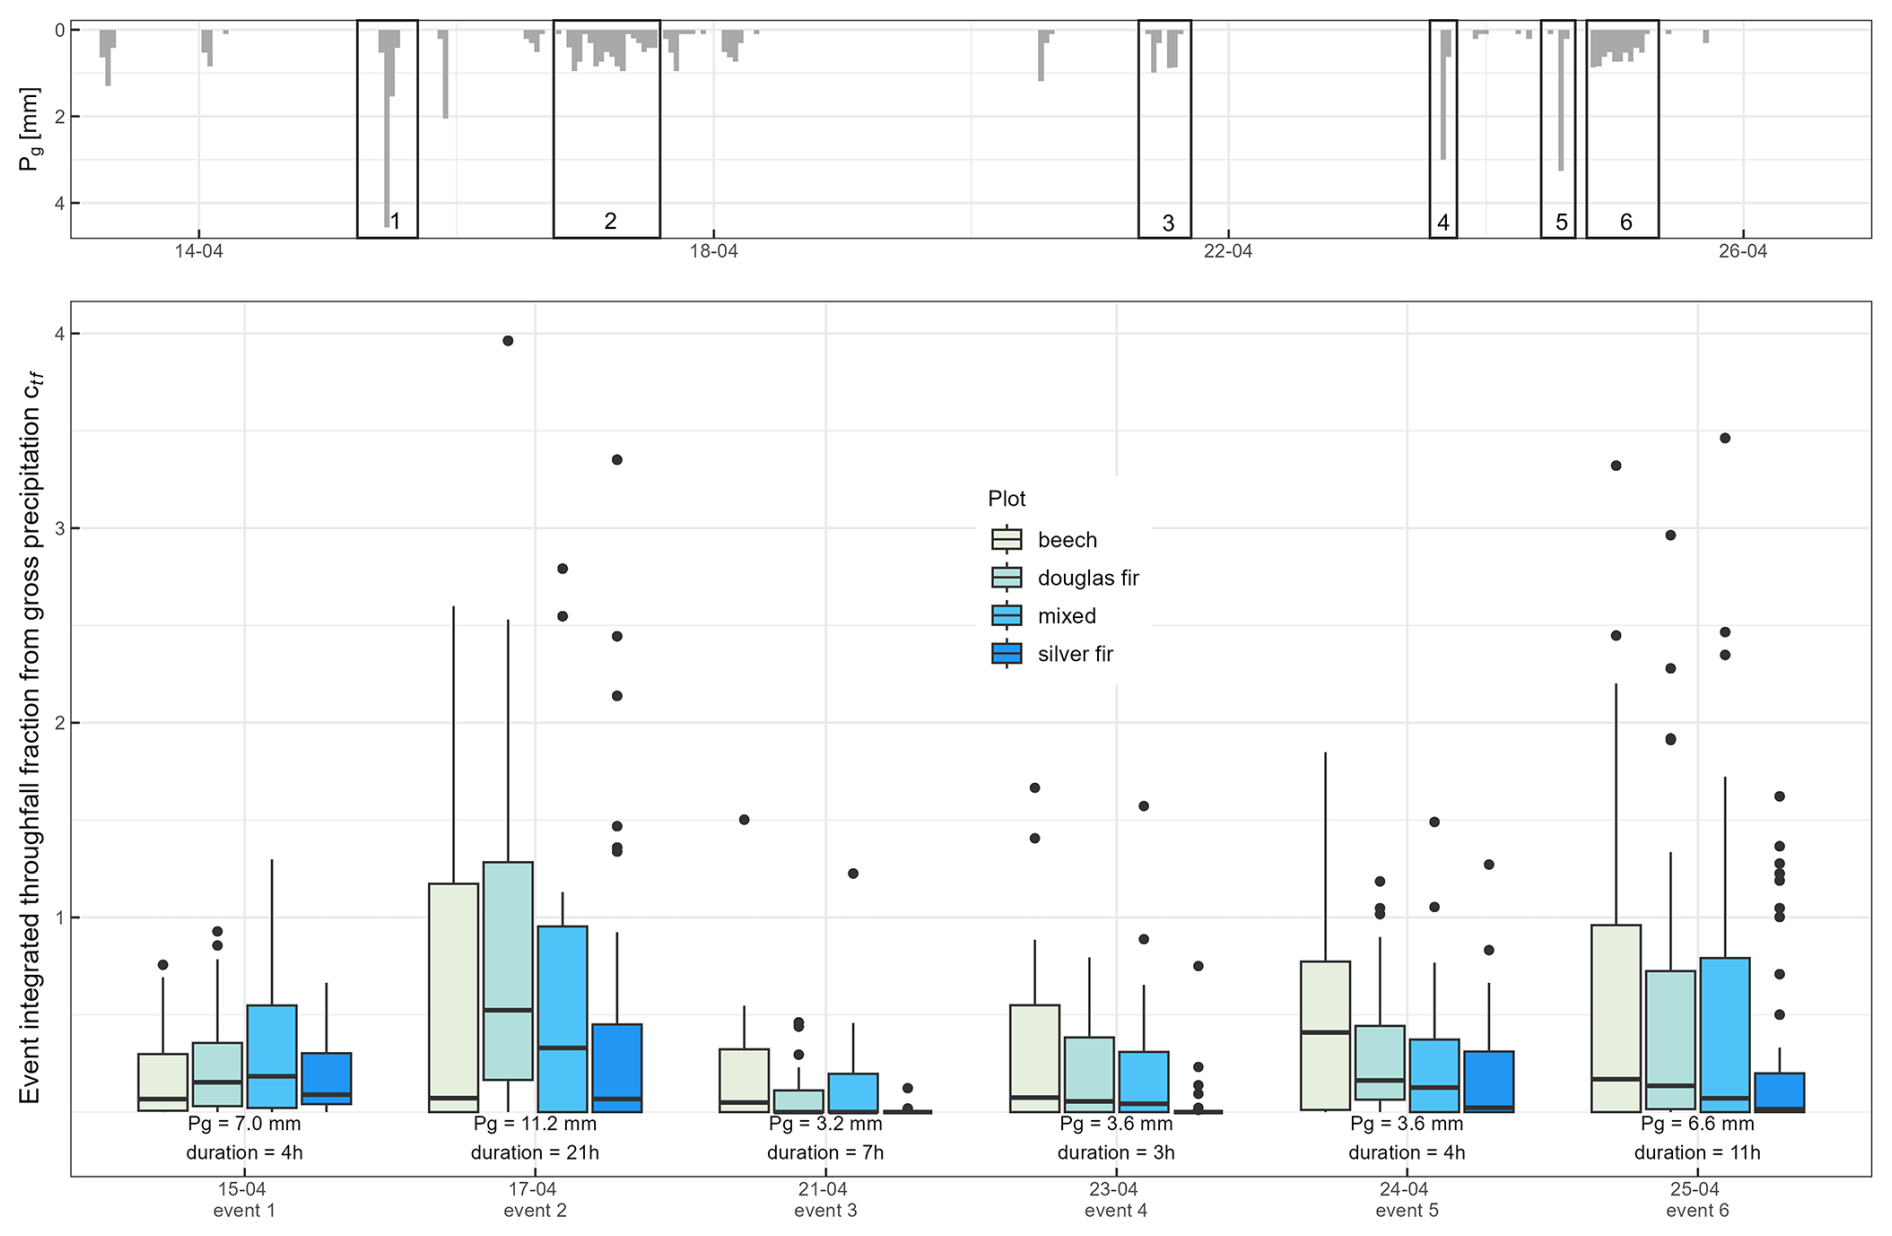
Figure 6Event integrated throughfall measured by the sampler network during two weeks in spring 2025; boxplots show total event integrated throughfall at the four subplots in relation to event Pg for all events Pg > 2.5 mm. Black boxes indicate events 1–6.
4.1 Performance of integrated throughfall measurement sampler
The dataset included to this technical note originates an early measurement period in which in falling leaves and the unfragmented uppermost litter were retained inside the samplers (configuration II). This configuration is particularly robust, requires moderate maintenance and provides a novel method to measure the less frequently observed flux of integrated throughfall (Jl) at high spatio-temporal resolution.
Data obtained with this configuration in Figs. 5 and 6 demonstrate the capability of the FluxIT sampling network to capture spatio-temporal flux dynamics of throughfall components emerging from precipitation partitioning. The samplers measured continuously for all events of the observed period (Fig. 6), showing a consistent performance. Pronounced spatial small-scale heterogeneity of integrated throughfall within and between plots was captured, as illustrated by heat maps of Fig. 5 and event-based throughfall coefficients ranging from 0 to 1 cTF (Fig. 6). Despite modulation by litter, the distinct patterns of depleted or augmented integrated throughfall positions were evident at the level of individual tipping bucket units (heat maps Fig. 5). Differences of Jl among neighbouring collection compartments highlight the small-scale variability and validate the sampler (compartment) support.
Sampling of small precipitation events remains an experimental challenge due to high spatial heterogeneity emerging from interception processes and generally small water amounts. Small events require large sampling sizes (Levia and Frost, 2003; Price and Carlyle-Moses, 2003; Rodrigo and Àvila, 2001), prior studies suggested > 200 samplers to measure throughfall from small precipitation events (Zimmermann et al., 2010). Although this technical note includes events of total Pg> 2.5 mm (see Fig. 6), several smaller events- mostly under pre-wetted conditions – were successfully recorded by a substantial fraction of tipping bucket units, demonstrating the networks' capacity to capture events of Pg< 2.5 mm.
Configured for isolated throughfall measurements (configuration I), the monitoring system and derived data are directly comparable to traditional throughfall measurement approaches. The FluxIT system provides a flexible, cost-effective alternative that enables the deployment of a large sampler size (60 sampler units, total collection area of 11.4 m2) (Fig. 3 right-side panels) comparable to large-scale trough systems (Germer et al., 2006; Mużyło et al., 2012; van Stan et al., 2017).
The separation of each sampler into four sub-compartments increases the number of measurement points while retaining a relatively small individual collection area of 600 cm2. Installed as a monitoring network across the four forest plots (Fig. 3 right-side panels), the samplers cover the full range of stand variability without integrating short-range variability in large collection units. Consequently, the approach is comparable with short-range spatial throughfall variability measurement approaches of e.g. Carlyle-Moses (2004), Gerrits et al. (2010) or Macinnis-Ng et al. (2012).
The network further benefits from automated, continuous readings of 240 tipping bucket units, a feature rarely realized for a large sampler size (n<50) (Mużyło et al., 2012; Staelens et al., 2008; van Stan et al., 2017) and suited for investigation small-scale spatio-temporal variability. The automated sampling of 240 tipping bucket units considerably reduce the sampling effort compared to manual sampling approaches of similar sampler sizes (Fischer-Bedtke et al., 2023; Metzger et al., 2017; Zimmermann et al., 2009). The samplers are insensible to wind and the measured water infiltrating into the soil enables nearby soil moisture measurements or even water quality measurements. The reduced logistical and financial costs enables monitoring beyond typical time frames of several weeks (Klos et al., 2014; Raat et al., 2002), vegetation period (Cisneros Vaca et al., 2018; Molina et al., 2019; Su et al., 2019) or one to two years (Holwerda et al., 2006; Mużyło et al., 2012; Siegert et al., 2019).
4.2 Limitation of further research directions
This technical note introduces the FluxIT monitoring network and illustrates selected application options; it does not constitute a comprehensive interception study. The presented dataset is limited in temporal extent and is not directly comparable to traditional throughfall studies based solely on isolated canopy throughfall. A forthcoming, dedicated throughfall study will include an expanded dataset collected during the 2025 vegetation period and measurements under sampler configuration I (isolated throughfall TFc, see Sect. 2.1.1 and 2.1.3) combined with lysimeter, stemflow and trough-based throughfall measurements. We then address the here described limitations in a detailed investigation of spatio-temporal patterns of isolated throughfall, their temporal persistence, intra-event dynamics and controls.
Under configuration II, measured integrated throughfall reflects combined effects of canopy and understory redistribution as well as litter interception. Although litter modulates throughfall patterns, the observed spatial variability in Jl (Sect. 3.2.3 & Fig. 6) was pronounced, with some locations recording zero or negligible Jl while others exceeded 250 % Pg (Fig. 6). The spatial variability of throughfall from canopy drip and understory vegetation across the plots appears to be sufficiently strong to (partially) persist the modulation by the thin, homogenous, unfragmented, uppermost litter layer. Consequently, the observed variability in integrated throughfall (litter percolation after litter interception) likely reflects, at least in part, canopy throughfall pattern and thereby underlines the systems' ability to depict small-scale spatio-temporal dynamics.
Even though the heat maps of example event (Fig. 5) demonstrates the samplers' capability to depict temporal integrated throughfall variability, its remains to further investigation how the measured integrated throughfall reflect the rain intensity profile of the event with partly lagged, attenuated or depleted peaks (Dunkerley, 2015).
The measurements may not only reflect strong spatio-temporal variability of interception fluxes as a result of precipitation redistribution and funnelling within canopy and litter (Carlyle-Moses and Lishman, 2015; Holwerda et al., 2006; Zimmermann et al., 2009). Zero throughfall records may inform about a blocked tipping bucket unit, but may also represent valid, valuable information of strongly depleted or absent throughfall (Levia et al., 2019). Likewise, highly elevated, throughfall might correspond to a dripping edge position but could also arise from technical issues e.g. an unlevelled sampler or the displacement of the litter inlay (result is direct throughfall measurement without litter interception). The field application and manual construction of the samplers introduce potential sources of error e.g. water leakage from the tipping bucket units or material failure. These uncertainties are addressed with regular maintenance and calibration carried out in particular before and after large events or during periods of freeze, snow or heat stress. In addition, the collected data undergo a quality control which includes also precipitation and air temperature data and flags suspicious measurements (e.g. throughfall without precipitation or snow melt). As the dataset expands, the distinction between valuable information and measurement errors will improve.
Integrated throughfall generally ceased within approximately 2 h after the event.Occasional single tips recorded (approx. 0.05 mm each) 3 h or later were typically attributed to minor additional rainfall input rather than delayed litter percolation. Laboratory tests using site-specific litter support these observations, showing percolation durations of max. 1.5 h under both dry and pre-wetted conditions. Nevertheless, future analyses will test different event separation thresholds of 4–8 h using the extended dataset.
While previous throughfall studies report larger events (> 5 mm) are generally associated with larger throughfall volumes, reduced spatial variability (Raat et al., 2002) and consequently precipitation-controlled, small events (< 5 mm) were found to be more strongly controlled by vegetation properties such as canopy storage capacity (Gerrits et al., 2010). Only the extended dataset comprising diverse precipitation events throughout multiple seasons will clarify controls of throughfall fluxes and their contribution to spatio-temporal variability. Preliminary comparisons (Fig. 6 event 1 & 6) suggest that event duration, intensity, and antecedent wetness influence integrated throughfall variability. The role of “within event” evaporation (Crockford and Richardson, 1990), canopy and and litter storage dynamics, and species-specific effects remains to be quantified.
4.3 Perspective modifications for the FluxIT sampler monitoring network
Beyond the two primary configurations presented (Sect. 2.1.3), the following modifications of the FluxIT sampler are feasible.
All components – including drainage compartments volume and size, pipe diameter and tipping bucket volumes – can be flexibly adapted using modular Euro-containers and 3D-printing parts. The selected dimensions of this setup were selected to match prevailing rainfall intensities at the study site but can be scaled to accommodate more extreme rainfall regimes. This scalability supports the application of this monitoring approach to drier or wetter climates and to different vegetation types. The system is not only relevant for (complexly structured) forest ecosystems, but may be advantageous for vegetation types such as grasslands or shrubland, where below-canopy precipitation sampling remains challenging.
Alternative mounting on stainless-steel frames or PVC pipes proposed in Sect. 2.1.3 allow flexible positioning to isolate e.g. understory vegetation influence. These options are less invasive than porous concrete stone frames and reduce potential alteration of flow paths and soil disturbance around the samplers. In order to further investigate spatio-temporal throughfall heterogeneity or the less frequently observed litter interception dynamics, the presented throughfall measurement samplers (Sect. 2.1.1 and 2.1.2) can be extended to fully equipped mini-lysimeter (Gerrits et al., 2007; Paulsen and Weiler, 2025). To achieve this, every sampler requires two load cells positioned beneath the short sides of the container on e.g. a stainless-steel frame. Micro boards and software can be updated accordingly, see Paulsen and Weiler (2025).
Tipping bucket rain gauges implemented in this setup (Sects. 2.1.1 and 3.1) are widely used for quantifying precipitation, throughfall or stemflow due to their simple principle of operation and cost-effectiveness. However, they suffer from systematic non-linear measurement errors depending on precipitation intensity (Marsalek, 1981; WMO, 2021–2025). In particular measurements of low and high intensities are prone to errors. In our case, the sampler design partially mitigates this issue. The pipes connecting the drainage compartments to the tipping bucket units have an inner diameter of 3 mm, which limits the inflow rate. During high-intensity rainfalls incoming water is collected in the sampler, funnelled and temporally stored in the four drainage compartments that function as a buffer emptying at 0.4 L min−1. To evaluate under- and overestimation for lower and higher intensities, we conducted a dynamic calibration on a subset of the tipping bucket units (n = 10). At highest tested rainfall intensity of 120 mm h−1, in average 27.83 tips per 100 mL were recorded. Using the mean tip volume from static calibration (2.87 mL), this indicates an undercatch of approximately 23 % at very high intensity rainfalls. During 1.5 years of observation, rainfall intensities at the field site exceeded 120 mm h−1 for 11 min (0.015 % of total rainfall duration in 1.5 years) and 40 mm h−1 for 2.4 h (0.2 % of total rain duration). The resulting total underestimation from extreme events is less then 0.05 %, which we consider acceptable. The recently collected, larger dataset from the 2025 vegetation period will enable the evaluation of over- and underestimation of the tipping bucket units for rainfall events of varying intensities. Furthermore, correction functions will be considered to address this issue for the throughfall measurement sampler e.g. Colli et al. (2013), Shimizu et al. (2018) and Stagnaro et al. (2016).
The presented FluxIT monitoring network at the ECOSENSE forest research site provides a robust, flexible, and high-resolution approach for quantifying throughfall fluxes in forest ecosystems. It enables automated, continuous measurements of spatio-temporal throughfall flux dynamics across subplots of pure Beech, pure Douglas fir, pure Silver fir and mixed trees. Comprising 60 samplers with a total of 240 collection compartments and tipping bucket units, the network achieves a high spatial resolution at tree-scale while capturing the full range of throughfall variability across the plots through a stratified sampling design.
The presented example data from an observation period in spring 2025 demonstrate the system measures continuously events of all magnitudes with sensitivity to short-range spatial throughfall heterogeneity and temporal trends during events. Furthermore, the samplers are able to capture both integrated throughfall (litter percolation after litter interception) and, in alternative configurations, isolated fluxes such as canopy throughfall small-scale spatio-temporal variability within and across forest plots. The network complements conventional throughfall and stemflow measurements and offers as a flexible, modular system a novel method to monitor less frequently measured fluxes such as litter percolation. With its automated, minimally invasive operation at low maintenance it considerably reduces the sampling effort compared to manual sampling methods making it well-suited for throughfall monitoring over several years. The growing dataset of high-resolution throughfall measurements from plots of coniferous and deciduous trees will enable the detailed analysis of species-specific throughfall dynamics, the within-plot variability and temporal stability of patterns. It will also provide the basis for investigating how spatial throughfall patterns propagate through percolation into soil water content patterns. Data from longer operation periods will furthermore support the investigation of seasonality effects and forest age-related changes (increasing canopy complexity) on throughfall and integrated throughfall. Ultimately, the network and generated data contribute to our understanding of precipitation partitioning in forests especially the role of vegetation structure shaping throughfall and interception processes.
Sampler hardware construction guidance and micro board software are available https://doi.org/10.60493/5azv5-g9q83 (Dedden and Weiler, 2026). Data are available upon request.
LD and MW designed the integrated throughfall measurement setup. LD conducted the field set-up and measurements with support of the team of Hydrology named in the Acknowledgements. LD analyzed the data and drafted the first version of this manuscript with contributions from MW.
At least one of the (co-)authors is a member of the editorial board of Hydrology and Earth System Sciences. The peer-review process was guided by an independent editor, and the authors also have no other competing interests to declare.
Publisher's note: Copernicus Publications remains neutral with regard to jurisdictional claims made in the text, published maps, institutional affiliations, or any other geographical representation in this paper. The authors bear the ultimate responsibility for providing appropriate place names. Views expressed in the text are those of the authors and do not necessarily reflect the views of the publisher.
This research was conducted within the ECOSENSE project DFG SFB 1537/1, University of Freiburg. We thank Heinke Paulsen, Jonas Schwarz, and Delon Wagner (Chair of Hydrology, University of Freiburg) for their contribution to hard- and software design and the student assistants Jo, Anna, Lars, Julian, Lucas, Nina and Elias for their participation in sampler manufacturing and field work. We thank Salim Soltani and Teja Kattenborn (Chair of Sensor-based Geoinformatics, University of Freiburg) for their contribution of LAI time series.
This research has been supported by the Deutsche Forschungsgemeinschaft (grant no. SFB 1537/1 ECOSENSE).
This open-access publication was funded by the University of Freiburg.
This paper was edited by Mariano Moreno de las Heras and reviewed by two anonymous referees.
Bachmair, S. and Weiler, M.: New Dimensions of Hillslope Hydrology, in: Forest Hydrology and Biogeochemistry, edited by: Levia, D., Carlyle-Moses, D., and Tanaka, T., Ecological Studies, 216, Springer, Dordrecht., https://doi.org/10.1007/978-94-007-1363-5_23, 2011.
Bialkowski, R. and Buttle, J. M.: Stemflow and throughfall contributions to soil water recharge under trees with differing branch architectures, Hydrol. Process., 29, 4068–4082, https://doi.org/10.1002/hyp.10463, 2015.
Blume, T., Zehe, E., and Bronstert, A.: Rainfall–runoff response, event-based runoff coefficients and hydrograph separation, Hydrolog. Sci. J., 52, 843–862, https://doi.org/10.1623/hysj.52.5.843, 2007.
Blume, T., Schneider, L., and Güntner, A.: Comparative analysis of throughfall observations in six different forest stands: Influence of seasons, rainfall- and stand characteristics, Hydrol. Process., 36, https://doi.org/10.1002/hyp.14461, 2022.
Carlyle-Moses, D.: Throughfall, stemflow, and canopy interception loss fluxes in a semi-arid Sierra Madre Oriental matorral community, J. Arid Environ., 58, 181–202, https://doi.org/10.1016/S0140-1963(03)00125-3, 2004.
Carlyle-Moses, D. E. and Lishman, C. E.: Temporal persistence of throughfall heterogeneity below and between the canopies of juvenile lodgepole pine (Pinus contorta), Hydrol. Process., 29, 4051–4067, https://doi.org/10.1002/hyp.10494, 2015.
Carlyle-Moses, D. E., Lishman, C. E., and McKee, A. J.: A preliminary evaluation of throughfall sampling techniques in a mature coniferous forest, J. Forestry Res., 25, 407–413, https://doi.org/10.1007/s11676-014-0468-8, 2014.
Cisneros Vaca, C., Ghimire, C., and van der Tol, C.: Spatial Patterns and Temporal Stability of Throughfall in a Mature Douglas-fir Forest, Water, 10, 317, https://doi.org/10.3390/w10030317, 2018.
Colli, M., Lanza, L. G., and Chan, P. W.: Co-located tipping-bucket and optical drop counter RI measurements and a simulated correction algorithm, Atmos. Res., 119, 3–12, https://doi.org/10.1016/j.atmosres.2011.07.018, 2013.
Crockford, R. H. and Richardson, D. P.: Partitioning of rainfall in a eucalypt forest and pine plantation in southeastern australia: I throughfall measurement in a eucalypt forest: Effect of method and species composition, Hydrol. Process., 4, 131–144, https://doi.org/10.1002/hyp.3360040204, 1990.
Crockford, R. H. and Richardson, D. P.: Partitioning of rainfall into throughfall, stemflow and interception: effect of forest type, ground cover and climate, Hydrol. Process., 14, 2903–2920, https://doi.org/10.1002/1099-1085(200011/12)14:16/17<2903::AID-HYP126>3.0.CO;2-6, 2000.
Dalsgaard, L.: Above and below Ground Gaps: The Effects of a Small Canopy Opening on Throughfall, Soil Moisture and Tree Transpiration in Suserup Skov, Denmark, Ecol. Bull., 81–102, http://www.jstor.org/stable/20113341 (last access: 10 April 2026), 2007.
Dedden, L. and Weiler, M.: Technical note: An innovative monitoring approach to measure spatio-temporal throughfall patterns in forests (Version v1), FreiData [software], https://doi.org/10.60493/5azv5-g9q83, 2026.
Dunkerley, D.: Percolation through leaf litter: What happens during rainfall events of varying intensity?, J. Hydrol., 525, 737–746, https://doi.org/10.1016/j.jhydrol.2015.04.039, 2015.
Fischer-Bedtke, C., Metzger, J. C., Demir, G., Wutzler, T., and Hildebrandt, A.: Throughfall spatial patterns translate into spatial patterns of soil moisture dynamics – empirical evidence, Hydrol. Earth Syst. Sci., 27, 2899–2918, https://doi.org/10.5194/hess-27-2899-2023, 2023.
Germer, S., Elsenbeer, H., and Moraes, J. M.: Throughfall and temporal trends of rainfall redistribution in an open tropical rainforest, south-western Amazonia (Rondônia, Brazil), Hydrol. Earth Syst. Sci., 10, 383–393, https://doi.org/10.5194/hess-10-383-2006, 2006.
Gerrits, A. M. J., Savenije, H. H. G., Hoffmann, L., and Pfister, L.: New technique to measure forest floor interception – an application in a beech forest in Luxembourg, Hydrol. Earth Syst. Sci., 11, 695–701, https://doi.org/10.5194/hess-11-695-2007, 2007.
Gerrits, A. M. J., Pfister, L., and Savenije, H. H. G.: Spatial and temporal variability of canopy and forest floor interception in a beech forest, Hydrol. Process., 24, 3011–3025, https://doi.org/10.1002/hyp.7712, 2010.
Holwerda, F., Scatena, F. N., and Bruijnzeel, L. A.: Throughfall in a Puerto Rican lower montane rain forest: A comparison of sampling strategies, J. Hydrol., 327, 592–602, https://doi.org/10.1016/j.jhydrol.2005.12.014, 2006.
Keim, R. F., Skaugset, A. E., and Weiler, M.: Temporal persistence of spatial patterns in throughfall, J. Hydrol., 314, 263–274, https://doi.org/10.1016/j.jhydrol.2005.03.021, 2005.
Keim, R. F., Skaugset, A. E., and Weiler, M.: Storage of water on vegetation under simulated rainfall of varying intensity, Adv. Water Resour., 29, 974–986, https://doi.org/10.1016/j.advwatres.2005.07.017, 2006.
Kimmins, J. P.: Some Statistical Aspects of Sampling Throughfall Precipitation in Nutrient Cycling Studies in British Columbian Coastal Forests, Ecology, 54, 1008–1019, https://doi.org/10.2307/1935567, 1973.
Klos, P. Z., Chain-Guadarrama, A., Link, T. E., Finegan, B., Vierling, L. A., and Chazdon, R.: Throughfall heterogeneity in tropical forested landscapes as a focal mechanism for deep percolation, J. Hydrol., 519, 2180–2188, https://doi.org/10.1016/j.jhydrol.2014.10.004, 2014.
Kochendorfer, J., Rasmussen, R., Wolff, M., Baker, B., Hall, M. E., Meyers, T., Landolt, S., Jachcik, A., Isaksen, K., Brækkan, R., and Leeper, R.: The quantification and correction of wind-induced precipitation measurement errors, Hydrol. Earth Syst. Sci., 21, 1973–1989, https://doi.org/10.5194/hess-21-1973-2017, 2017.
Landesamt für Geoinformation und Landentwicklung Baden-Württemberg: Geoportal Baden-Württemberg: Digitaler Luftbildatlas (Kartenviewer), https://www.geoportal-bw.de (last access: 10 April 2026), 2025.
Landesamt für Geologie, Rohstoffe und Bergbau Baden-Württemberg: b135 Braunerde, Parabraunerde-Braunerde und Braunerde-Parabraunerde aus lösslehmhaltiger b135 Fließerde über Fließerde aus Buntsandstein-Material auf z. T. tiefgründig zersetztem Ton- und Sandstein des Oberen Buntsandsteins, https://media.lgrb-bw.de/link/bod3200/b135.pdf (last access: 10 April 2026), 2024.
Landesanstalt für Umwelt Baden-Württemberg: Klimaatlas: Klima der Vergangenheit (Kartenviewer), https://www.klimaatlas-bw.de/kartenviewer-vergangenheit (last access: 10 April 2026), 2024.
Levia, D. F. and Frost, E. E.: A review and evaluation of stemflow literature in the hydrologic and biogeochemical cycles of forested and agricultural ecosystems, J. Hydrol., 274, 1–29, https://doi.org/10.1016/S0022-1694(02)00399-2, 2003.
Levia, D. F. and Frost, E. E.: Variability of throughfall volume and solute inputs in wooded ecosystems, Prog. Phys. Geog., 30, 605–632, https://doi.org/10.1177/0309133306071145, 2006.
Levia, D. F., Carlyle-Moses, D., and Tanaka, T.: Forest Hydrology and Biogeochemistry, Springer, Dordrecht, 216, https://doi.org/10.1007/978-94-007-1363-5, 2011.
Levia, D. F., Nanko, K., Amasaki, H., Giambelluca, T. W., Hotta, N., Iida, S., Mudd, R. G., Nullet, M. A., Sakai, N., Shinohara, Y., Sun, X., Suzuki, M., Tanaka, N., Tantasirin, C., and Yamada, K.: Throughfall partitioning by trees, Hydrol. Process., 33, 1698–1708, https://doi.org/10.1002/hyp.13432, 2019.
Link, T. E., Unsworth, M., and Marks, D.: The dynamics of rainfall interception by a seasonal temperate rainforest, Agr. Forest Meteorol., 124, 171–191, https://doi.org/10.1016/j.agrformet.2004.01.010, 2004.
Llorens, P. and Domingo, F.: Rainfall partitioning by vegetation under Mediterranean conditions. A review of studies in Europe, J. Hydrol., 335, 37–54, https://doi.org/10.1016/j.jhydrol.2006.10.032, 2007.
Lloyd, C. and Marques F., A. O.: Spatial variability of throughfall and stemflow measurements in Amazonian rainforest, Agr. Forest Meteorol., 42, 63–73, https://doi.org/10.1016/0168-1923(88)90067-6, 1988.
Lotz, S., Kattenborn, T., Frey, J., Soltani, S., Göritz, A., Jaksztat, T., and Katal, N.: Litter vs. Lens: Evaluating LAI from Litter Traps and Hemispherical Photos Across View Zenith Angles and Leaf Fall Phases, Biogeosciences, 23, 1949–1963, https://doi.org/10.5194/bg-23-1949-2026, 2026.
Macinnis-Ng, C. M. O., Flores, E. E., Müller, H., and Schwendenmann, L.: Rainfall partitioning into throughfall and stemflow and associated nutrient fluxes: land use impacts in a lower montane tropical region of Panama, Biogeochemistry, 111, 661–676, https://doi.org/10.1007/s10533-012-9709-0, 2012.
Marsalek, J.: Calibration of the tipping-bucket raingage, J. Hydrol., 53, 343–354, https://doi.org/10.1016/0022-1694(81)90010-X, 1981.
Metzger, J. C., Wutzler, T., Dalla Valle, N., Filipzik, J., Grauer, C., Lehmann, R., Roggenbuck, M., Schelhorn, D., Weckmüller, J., Küsel, K., Totsche, K. U., Trumbore, S., and Hildebrandt, A.: Vegetation impacts soil water content patterns by shaping canopy water fluxes and soil properties, Hydrol. Process., 31, 3783–3795, https://doi.org/10.1002/hyp.11274, 2017.
Molina, A. J., Llorens, P., Garcia-Estringana, P., Moreno de Las Heras, M., Cayuela, C., Gallart, F., and Latron, J.: Contributions of throughfall, forest and soil characteristics to near-surface soil water-content variability at the plot scale in a mountainous Mediterranean area, Sci. Total Environ., 647, 1421–1432, https://doi.org/10.1016/j.scitotenv.2018.08.020, 2019.
Mużyło, A., Llorens, P., and Domingo, F.: Rainfall partitioning in a deciduous forest plot in leafed and leafless periods, Ecohydrology, 5, 759–767, https://doi.org/10.1002/eco.266, 2012.
Paulsen, H. and Weiler, M.: Technical note: A weighing forest floor grid lysimeter, Hydrol. Earth Syst. Sci., 29, 2309–2319, https://doi.org/10.5194/hess-29-2309-2025, 2025.
Price, A. and Carlyle-Moses, D.: Measurement and modelling of growing-season canopy water fluxes in a mature mixed deciduous forest stand, southern Ontario, Canada, Agr. Forest Meteorol., 119, 69–85, https://doi.org/10.1016/S0168-1923(03)00117-5, 2003.
Pypker, T. G., Bond, B. J., Link, T. E., Marks, D., and Unsworth, M. H.: The importance of canopy structure in controlling the interception loss of rainfall: Examples from a young and an old-growth Douglas-fir forest, Agr. Forest Meteorol., 130, 113–129, https://doi.org/10.1016/j.agrformet.2005.03.003, 2005.
Raat, K. J., Draaijers, G. P. J., Schaap, M. G., Tietema, A., and Verstraten, J. M.: Spatial variability of throughfall water and chemistry and forest floor water content in a Douglas fir forest stand, Hydrol. Earth Syst. Sci., 6, 363–374, https://doi.org/10.5194/hess-6-363-2002, 2002.
Rodrigo, A. and Àvila, A.: Influence of sampling size in the estimation of mean throughfall in two Mediterranean holm oak forests, J. Hydrol., 243, 216–227, https://doi.org/10.1016/S0022-1694(00)00412-1, 2001.
Savenije, H. H.: The runoff coefficient as the key to moisture recycling, J. Hydrol., 176, 219–225, https://doi.org/10.1016/0022-1694(95)02776-9, 1996.
Schume, H., Jost, G., and Katzensteiner, K.: Spatio-temporal analysis of the soil water content in a mixed Norway spruce (Picea abies (L.) Karst.)–European beech (Fagus sylvatica L.) stand, Geoderma, 112, 273–287, https://doi.org/10.1016/S0016-7061(02)00311-7, 2003.
Shachnovich, Y., Berliner, P. R., and Bar, P.: Rainfall interception and spatial distribution of throughfall in a pine forest planted in an arid zone, J. Hydrol., 349, 168–177, https://doi.org/10.1016/j.jhydrol.2007.10.051, 2008.
Shimizu, T., Kobayashi, M., Iida, S., and Levia, D. F.: A generalized correction equation for large tipping-bucket flow meters for use in hydrological applications, J. Hydrol., 563, 1051–1056, https://doi.org/10.1016/j.jhydrol.2018.06.036, 2018.
Siegert, C. M., Levia, D. F., Hudson, S. A., Dowtin, A. L., Zhang, F., and Mitchell, M. J.: Small-scale topographic variability influences tree species distribution and canopy throughfall partitioning in a temperate deciduous forest, Forest Ecol. Manag., 359, 109–117, https://doi.org/10.1016/j.foreco.2015.09.028, 2016.
Siegert, C. M., Drotar, N. A., and Alexander, H. D.: Spatial and Temporal Variability of Throughfall among Oak and Co-occurring Non-oak Tree Species in an Upland Hardwood Forest, Geosciences, 9, 405, https://doi.org/10.3390/geosciences9100405, 2019.
Staelens, J., an de Schrijver, Verheyen, K., and Verhoest, N. E.: Spatial variability and temporal stability of throughfall water under a dominant beech (Fagus sylvatica L.) tree in relationship to canopy cover, J. Hydrol., 330, 651–662, https://doi.org/10.1016/j.jhydrol.2006.04.032, 2006a.
Staelens, J., an de Schrijver, Verheyen, K., and Verhoest, N. E. C.: Spatial variability and temporal stability of throughfall deposition under beech (Fagus sylvatica L.) in relationship to canopy structure, Environ. Pollut., 142, 254–263, https://doi.org/10.1016/j.envpol.2005.10.002, 2006b.
Staelens, J., an de Schrijver, Verheyen, K., and Verhoest, N. E. C.: Rainfall partitioning into throughfall, stemflow, and interception within a single beech (Fagus sylvatica L.) canopy: influence of foliation, rain event characteristics, and meteorology, Hydrol. Process., 22, 33–45, https://doi.org/10.1002/hyp.6610, 2008.
Stagnaro, M., Colli, M., Lanza, L. G., and Chan, P. W.: Performance of post-processing algorithms for rainfall intensity using measurements from tipping-bucket rain gauges, Atmos. Meas. Tech., 9, 5699–5706, https://doi.org/10.5194/amt-9-5699-2016, 2016.
Su, L., Xie, Z., Xu, W., and Zhao, C.: Variability of throughfall quantity in a mixed evergreen-deciduous broadleaved forest in central China, J. Hydrol. Hydromech., 67, 225–231, https://doi.org/10.2478/johh-2019-0008, 2019.
Tesch, J., Kühnhammer, K., Wagner, D., Christen, A., Dormann, C., Frey, J., Grote, R., Kattenborn, T., Sulzer, M., Wallrabe, U., Weiler, M., Werner, C., Baghbani, S., Brzozon, J., Comella, L. M., Dedden, L., Dumberger, S., Frey, Y., Gassilloud, M., Gerach, T., Göritz, A., Haberstroh, S., Klüppel, J., Kremer, L., Kreuzwieser, J., Lee, H., Maack, J., Müller, J., Prucker, O., Rajak, S. K., Rühe, J., Rupitsch, S. J., Schack-Kirchner, H., Scharinger, C., Shinde, U., Steinmann, T., Stock, C., and Strack, J.: The ECOSENSE forest: A distributed sensor and data management system for real-time monitoring of ecosystem processes and stresses, EGUsphere [preprint], https://doi.org/10.5194/egusphere-2025-4979, 2025.
Thimonier, A.: Measurement of Atmospheric Deposition Under Forest Canopies: Some Recommendations for Equipment and Sampling Design, Environ. Monit. Assess., 52, 353–387, https://doi.org/10.1023/A:1005853429853, 1998.
van Stan, J. T., Coenders-Gerrits, M., Dibble, M., Bogeholz, P., and Norman, Z.: Effects of phenology and meteorological disturbance on litter rainfall interception for a Pinus elliottii stand in the Southeastern United States, Hydrol. Process., 31, 3719–3728, https://doi.org/10.1002/hyp.11292, 2017.
Voss, S., Zimmermann, B., and Zimmermann, A.: Detecting spatial structures in throughfall data: The effect of extent, sample size, sampling design, and variogram estimation method, J. Hydrol., 540, 527–537, https://doi.org/10.1016/j.jhydrol.2016.06.042, 2016.
Werner, C., Wallrabe, U., Christen, A., Comella, L., Dormann, C., Göritz, A., Grote, R., Haberstroh, S., Jouda, M., Kiese, R., Koch, B., Korvink, J., Kreuzwieser, J., Lang, F., Müller, J., Prucker, O., Reiterer, A., Rühe, J., Rupitsch, S., Schack-Kirchner, H., Schmitt, K., Stobbe, N., Weiler, M., Woias, P., and Wöllenstein, J.: ECOSENSE – Multi-scale quantification and modelling of spatio-temporal dynamics of ecosystem processes by smart autonomous sensor networks, RIO, 10, https://doi.org/10.3897/rio.10.e129357, 2024.
World Meteorological Organization (WMO): Guide to meteorological instruments and methods of observation, https://library.wmo.int/idurl/4/41650 (last access: 10 April 2026), 2021–2025.
Wullaert, H., Pohlert, T., Boy, J., Valarezo, C., and Wilcke, W.: Spatial throughfall heterogeneity in a montane rain forest in Ecuador: Extent, temporal stability and drivers, J. Hydrol., 377, 71–79, https://doi.org/10.1016/j.jhydrol.2009.08.001, 2009.
Ziegler, A. D., Giambelluca, T. W., Nullet, M. A., Sutherland, R. A., Tantasarin, C., Vogler, J. B., and Negishi, J. N.: Throughfall in an evergreen-dominated forest stand in northern Thailand: Comparison of mobile and stationary methods, Agr. Forest Meteorol., 149, 373–384, https://doi.org/10.1016/j.agrformet.2008.09.002, 2009.
Zimmermann, A. and Zimmermann, B.: Requirements for throughfall monitoring: The roles of temporal scale and canopy complexity, Agr. Forest Meteorol., 189–190, 125–139, https://doi.org/10.1016/j.agrformet.2014.01.014, 2014.
Zimmermann, A., Germer, S., Neill, C., Krusche, A. V., and Elsenbeer, H.: Spatio-temporal patterns of throughfall and solute deposition in an open tropical rain forest, J. Hydrol., 360, 87–102, https://doi.org/10.1016/j.jhydrol.2008.07.028, 2008a.
Zimmermann, A., Zimmermann, B., and Elsenbeer, H.: Rainfall redistribution in a tropical forest: Spatial and temporal patterns, Water Resour. Res., 45, https://doi.org/10.1029/2008WR007470, 2009.
Zimmermann, A., Voss, S., Metzger, J. C., Hildebrandt, A., and Zimmermann, B.: Capturing heterogeneity: The role of a study area's extent for estimating mean throughfall, J. Hydrol., 542, 781–789, https://doi.org/10.1016/j.jhydrol.2016.09.047, 2016.
Zimmermann, B., Zehe, E., Hartmann, N. K., and Elsenbeer, H.: Analyzing spatial data: An assessment of assumptions, new methods, and uncertainty using soil hydraulic data, Water Resour. Res., 44, https://doi.org/10.1029/2007WR006604, 2008b.
Zimmermann, B., Zimmermann, A., Lark, R. M., and Elsenbeer, H.: Sampling procedures for throughfall monitoring: A simulation study, Water Resour. Res., 46, https://doi.org/10.1029/2009WR007776, 2010.