the Creative Commons Attribution 4.0 License.
the Creative Commons Attribution 4.0 License.
 | 21 May 2026
Simulating carbon fluxes in boreal catchments: WSFS-Vemala model development and key insights
Marie Korppoo
Inese Huttunen
Markus Huttunen
Maiju Narikka
Jari Silander
Tom Jilbert
Martin Forsius
Pirkko Kortelainen
Niina Kotamäki
Cintia Uvo
Anna-Kaisa Ronkanen
Lakes and streams play an important role in the global carbon cycle through carbon sedimentation and evasion. The development of carbon processes in the water quality model WSFS-Vemala (Vemala) presents a significant advancement in simulating carbon dynamics, particularly in capturing both total organic (TOC) and inorganic (TIC) carbon processes and their contributions to carbon retention and emissions through a river/lake network. The model was tested in the Vantaanjoki catchment, located in southern Finland and covering an area of 1680 km2. The model's ability to simulate TOC and TIC loading across various land use and soil types aligns closely with reported literature values. The addition of organic acids to the total alkalinity definition improved pH simulations and thus the simulation of CO2 emissions in the acidic and organic rich waters of Finland. Annual CO2 emissions of 25 gC m−2 yr−1 were simulated from lake Tuusulanjärvi, the largest lake in the catchment, and 223–260 gC m−2 yr−1 from the river network, while only 3 gC m−2 yr−1 was simulated as organic carbon burial in the lake sediments. The model's performance in estimating CO2 emissions shows a good correlation with established ranges for lakes as well as a good correlation with TOC and TIC loads across the river network. The inclusion of sedimentation and mineralization processes in the lake carbon budget underlines the necessity of accounting for both organic and inorganic pathways in carbon modelling. This improved representation of the carbon cycling in Vemala, linked with the phytoplankton growth and nutrient cycling, allows to distinguish between carbon losses to the atmosphere and long-term carbon storage in the sediments of inland waters. Overall, the enhanced Vemala model provides a robust foundation for understanding carbon cycling and supporting sustainable, integrated water resource management and scenario assessments from sub-catchments to the national scale.
- Article
(9818 KB) - Full-text XML
- BibTeX
- EndNote


Addressing the global challenge of climate change requires both mitigation and adaptation strategies, supported by high-quality observational data and advanced computational models. A critical aspect of this effort is understanding the processes that govern carbon (C) dynamics within catchments, including accumulation, sequestration, release, and transport. The intricate interplay between eutrophication and carbon accumulation/release in aquatic ecosystems remains a subject of limited understanding, posing challenges to effective river basin management (Ward et al., 2017). The importance of C budget estimates for comprehensive river basin management plans cannot be overstated, as it plays a crucial role in evaluating the effectiveness of carbon-related interventions. Lakes and rivers play a pivotal role in transporting, capturing and releasing dissolved organic carbon (DOC) and dissolved inorganic carbon (DIC) from terrestrial sources (Cole et al., 2007; Rantakari, 2010; Mendonça et al., 2017; Tranvik et al., 2018; Amora-Nogueira et al., 2022; Algesten et al., 2003; Allesson et al., 2022). At the global scale, catchment flux from land to sea of DOC is equivalent to DIC (Hope et al., 1994) and freshwater systems are supersaturated in CO2 (Cole et al., 1994). In contrast, boreal environments are typically characterised by higher DOC than DIC fluxes. Specifically for the Baltic Sea, DOC represents up to 80 % of the carbon export from land (Räike et al., 2016).
In boreal rivers and lakes, DOC constitutes the dominant fraction of total organic carbon (TOC). Mattsson et al. (2005) reported that, on average, 94 % of TOC in Finnish rivers occurs in a dissolved form. Extensive peatlands, forested catchments, and cold and humid climatic conditions promote the mobilisation and export of organic carbon, resulting in humic and DOC-rich waters. A strong relationship between DOC concentration in lake water and CO2 supersaturation has been observed (Sobek et al., 2005), especially in forested and humic systems (Rantakari and Kortelainen, 2008). As humic lakes are widespread in boreal regions (Kortelainen, 1993), they may significantly influence regional carbon gas emissions (Rantakari and Kortelainen, 2008; Kortelainen et al., 2006; Forsius et al., 2017). Holmberg et al. (2023) estimated, using area-specific empirical emission coefficients, that greenhouse gas (GHG) emissions from lakes and rivers in Finland currently are about 13.4 TgCO2eq yr−1 or about 9 % of total Finnish GHG emissions to the atmosphere. DIC in freshwater is composed of three main species: bicarbonate (HCO), carbonate (CO) and dissolved carbon dioxide (H2CO3 or CO2aq.) and is primarily derived from rock weathering and mineralisation of organic carbon. Due to the equilibrium reactions in the carbonate system, speciation of DIC is tightly linked to pH. Therefore, pH impacts on dissolved CO2 concentration and thus CO2 emissions through the water-atmosphere interface (Jarvie et al., 2017). Boreal catchments in Finland are characterised by silicate lithologies or non-carbonate bedrocks (Kortelainen et al., 2006) leading to inorganic carbon being mostly dissolved and low buffer capacity of the freshwater (low alkalinity and pH) that enhances the availability of dissolved CO2 for evasion (Tranvik et al., 2009).
Recent developments in mathematical modeling of river basin biogeochemistry include the integration of DOC dynamics (e.g. INCA-C (Futter et al., 2007), SWAT-C (Qi et al., 2020)). However, DIC dynamics have been omitted from most models, despite the potential value of adding such processes to quantify carbon emissions from aquatic ecosystems (e.g. Jarvie et al., 2017; Marescaux et al., 2020). The THINCARB model (Jarvie et al., 2017) calculates DIC (HCO, CO and H2CO3) and the excess partial pressure of carbon dioxide in a water sample based on pH and alkalinity measurements available in the Harmonised Monitoring Scheme of Great Britain. Marescaux et al. (2020) added an inorganic carbon module to the process-based biogeochemical model pyNuts-Riverstrahler model to quantify CO2 emissions from the whole hydrographic network of the Seine catchment. In both models, alkalinity is calculated based primarily on the carbonate system. However, in low carbonate alkalinity regions with high DOC concentrations, organic acid anions can increase alkalinity (Hruska et al., 2003). Moreover, in acidic and organic rich waters such as found in boreal regions, the buffering capacities of the carbonate system are lower, which increases the sensitivity of calculated CO2 concentrations and emissions (Abril et al., 2015).
The WSFS-Vemala model (Vemala; Huttunen et al., 2016), is a water quality and nutrient load model system developed by the Finnish Environment Institute (Syke) for Finnish watersheds. Vemala is operative and widely utilized in Finland in planning the implementation of the Water Framework Directive (WFD; 2000/60/EC) by the regional ELY Centres (Centres for Economic Development, Transport and the Environment in Finland) for both inland waters (Huttunen et al., 2016) and coastal waters (Lignell et al., 2025). While nutrient cycling is well incorporated into this model (Korppoo et al., 2017), regarding both terrestrial and aquatic processes, the same level of detail is lacking for C. This omission leaves a significant gap in our ability to support environmental permitting decisions, manage carbon related activities, and deepen our understanding of carbon dynamics. A pivotal aspect that demands exploration is the connection between nutrients and carbon, especially in the context of reducing nutrient loading in aquatic environments. If we reduce nutrient pollution without understanding its effect on carbon, we might unintentionally increase carbon emissions or miss opportunities to store carbon in aquatic systems. This connection is key for designing better environmental policies and carbon management strategies.
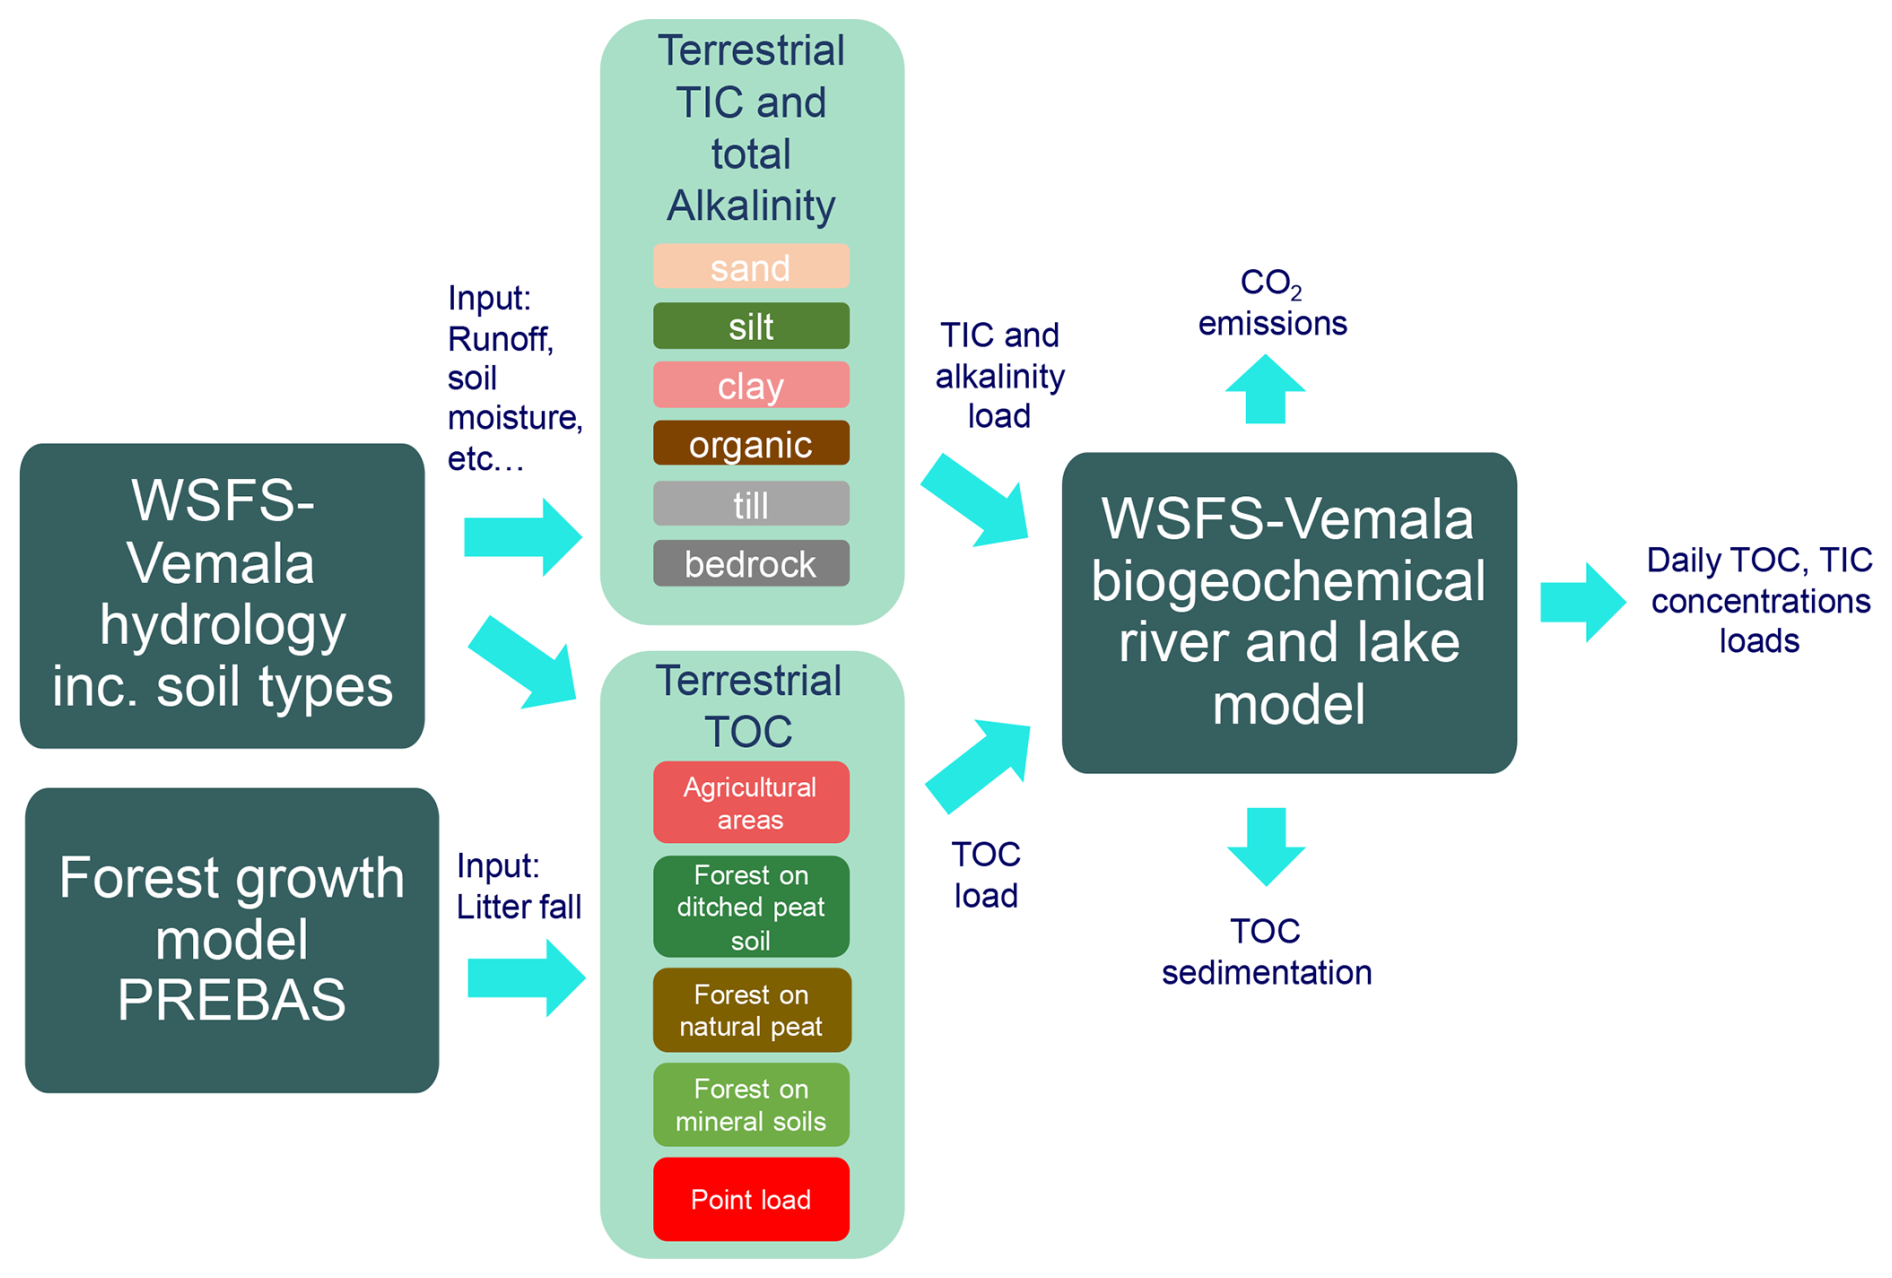
In this paper, we quantify carbon losses through the river and lake network by modelling total carbon (TC) processes including both total organic carbon (TOC) and total inorganic carbon (TIC) in the terrestrial and aquatic environments of Lake Tuusulanjärvi (5.9 km2) and the entire Vantaanjoki catchment (1680 km2), a Finnish river basin flowing to the Baltic Sea. For this purpose, we developed the TOC terrestrial model, based on Vemala-N model (Huttunen et al., 2016) and INCA-C model (Futter et al., 2007). The model represents two carbon storages in the soil linked to soil types and land uses (Fig. 1), and uses annual litter fall (Minunno et al., 2019) and initial C storage in soil to allow for the simulation of DOC load transported from the soil and into the river network. Moreover, we developed the leaching of TIC using alkalinity as a proxy based on soil types to simulate the effect of rock weathering on TIC leaching (Fig. 1). Finally, we added TIC as a variable in the existing Vemala biogeochemical submodel (Korppoo et al., 2017; Fig. 3) and the processes affecting TIC in the water column including phytoplankton growth, TOC mineralization from water and sediments, and pH and alkalinity effects on the CO2 emissions across the water-air interface. The total alkalinity in the model was defined as carbonate and organic alkalinity to improve the representation of pH and therefore the simulation of CO2 concentrations in the water column in organic rich waters.
This improved representation of the carbon cycling in Vemala, linked with the phytoplankton growth and nutrient cycling will allow us to specify the carbon losses in the catchment including the distinction between carbon losses to the atmosphere and long-term carbon storage in the sediments. Our aim is to quantitatively predict the importance of carbon losses at the scale of the whole aquatic ecosystem. For this purpose, we first assess the model's performance in the Vantaanjoki catchment in southern Finland by comparing the results to the observed daily total organic and inorganic carbon loads and to literature values. In a second step, we focus on the simulation of carbon sequestration in and emissions from the largest lake in the basin (Tuusulanjärvi) and the river network at a daily/annual time step. Finally, we run a sensitivity analysis of the model to examine how variations in mineralisation rates, phytoplankton growth and CO2 air-water transfer rates affect carbon losses from the aquatic ecosystem. This analysis will help to identify the most influential processes and improve our understanding of carbon dynamics in the system.
2.1 Vemala hydrological submodel
A semi-distributed process-based hydrological model (WSFS: Watershed Simulation and Forecasting System; Kolhinen et al., 2026), is included in Vemala (Fig. 1). The spatial simulation unit in runoff simulations is a sub-catchment, called third level sub-catchment, with a mean size of 60 km2 (Catchment areas, Syke, 2025a, Fig. A1). For surface water routing and water quality simulations, these sub-catchments are divided into a fourth level of detail (Fig. A1) to take into account the variation of characteristics affecting hydrology and nutrient and carbon loading. Small brook or fourth level sub-catchments are defined by a river width greater than 2 m (Metadata: Shoreline10 from Syke and National Land Survey of Finland, NLS). The median size of the catchments in Vemala is 0.8 km2 with 80 % of the catchments smaller than 2 km2 (WSFS-Vemala, Syke, 2025f).
The unsaturated soil layer is represented by a 2-layer soil moisture model (surface and sub-surface), and a soil saturated layer characterizing groundwater. Water infiltrates from the surface layer to the sub-surface layer if the soil moisture content exceeds field capacity. The sub-surface layer produces the main part of the runoff to rivers and lakes and of the percolation to the groundwater (Jakkila et al., 2014). Runoff is produced from the surface layer only when the ground is frozen. Vemala simulates 40 different land-use and soil type combinations based on national soil (Natural Resources Institute Finland and Geological Survey of Finland, 2025) and land cover datasets (Corine land cover 2018, Syke, 2025b). This description enables the simulation of hydrological processes that vary on mineral and organic soils, accounting for distinct hydraulic conductivities and water holding properties of mineral and peat soils. Finnish soil maps (Natural Resources Institute Finland and Geological Survey of Finland, 2025; Fig. 2c) are used for soil type distribution. Specifically, six soil types organic, clay, till, silt, sand, and rocky soils have been used as input to the model for each small brook catchment. Corine Land Cover data (Syke, 2025b; Fig. 2b) was used to classify each small brook catchment into land use classes field, forested, bog, or built areas. This classification is essential for simulating evapotranspiration accurately.
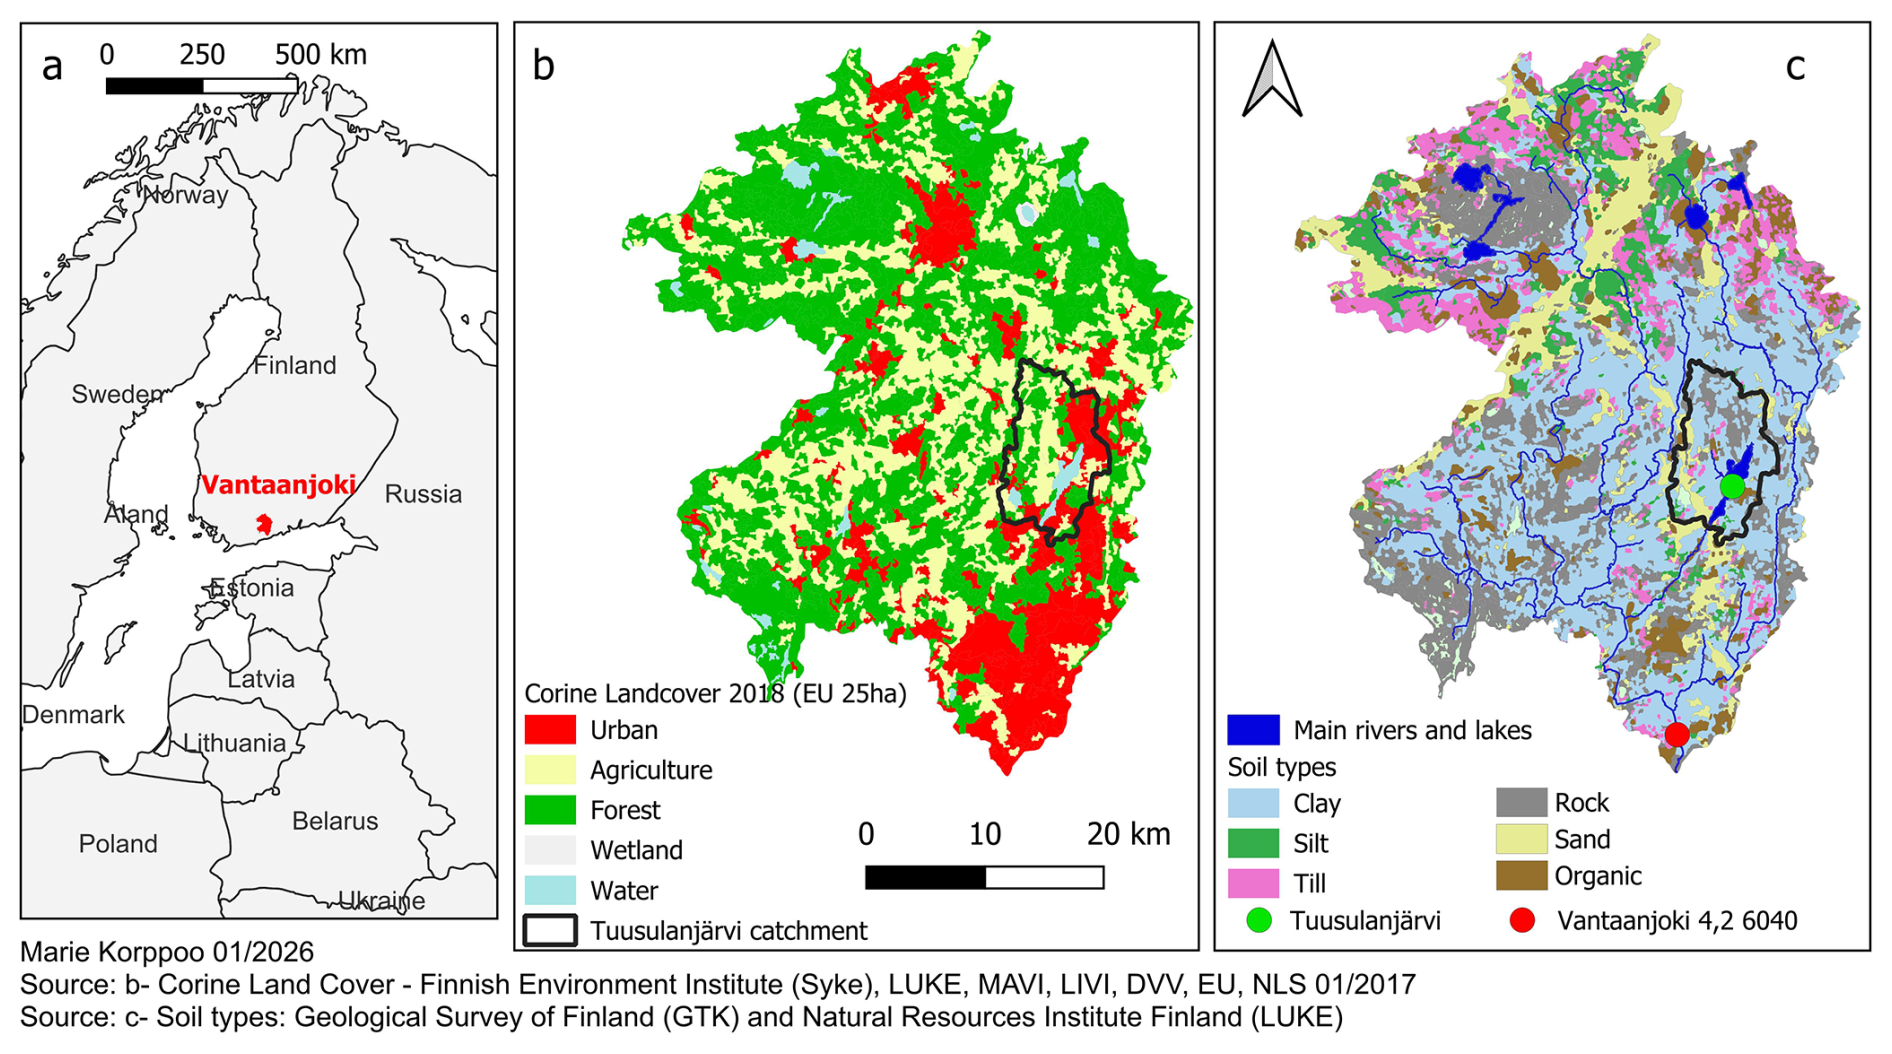
Figure 2(a) Vantaanjoki catchment in red in the European map; (b) land cover in Vantaanjoki catchment; (c) soil types in Vantaanjoki catchment.
There are considerable differences in hydrological conditions and organic carbon content in mineral and peat soils, leading to different TOC leaching patterns. These differences have been considered both in the hydrological and the terrestrial TOC process-based models (Fig. 1). In peat soils, shallow groundwater can contribute the most to runoff through baseflow, especially during prolonged dry periods (Mozafari et al., 2023). Shallow water tables with small range of fluctuation are characteristic for peat soils. Shallow groundwater can have significantly higher DOC concentrations than deep groundwater. This pattern probably results from occurrence and movement of shallow groundwater through the organic-rich surficial deposits (Gibson et al., 2000). By definition, peat soils contain more organic matter (>40 %, Lemola et al., 2018) than mineral soils, and SOC (solid organic C) vertical distribution is different in mineral and peat soils. In mineral soils the SOC content generally decreases with depth, whereas in organic soils it increases with depth (Hiederer, 2009).
2.2 Terrestrial carbon submodels
Vemala TOC terrestrial model (Fig. 1) builds on Vemala-N model (Huttunen et al., 2016) and INCA-C model (Futter et al., 2007). The model represents two C storages in the soil: SOC and DOC. These pools are defined separately for different soil types and land use classes. The main inputs to the model are annual litter fall and the initial C storage in soil. Carbon exchanges between the SOC and DOC pools are represented through the following processes:
-
SOC can be disassociated into DOC, and DOC can be reassimilated into SOC.
-
Both SOC and DOC can be mineralized
-
DOC is transported from soil to water through subsurface runoff and baseflow.
The model distinguishes six land use and soil type combinations: agriculture on clay, coarse and peat soils, forest on mineral soils and on ditched peatlands as well as natural peat soils. Carbon mass balance of SOC and DOC storages for two soil layers (unsaturated soil layer and groundwater layer) is simulated daily. DOC produced in the unsaturated layer is percolated to the groundwater layer. Percolation is simulated in the hydrological model for each combination of land use and soil type class separately. Leaching of DOC (kg−1 ha−1 d−1) is calculated as follows: mass of DOC in layers (kg ha−1) is divided by soil moisture or groundwater storage (mm) to obtain the simulated concentration. DOC concentration is then multiplied by daily runoff (mm d−1) from each soil layer to obtain the DOC load (kg ha−1 d−1) transported out from each layer (Eqs. 1 and 2):
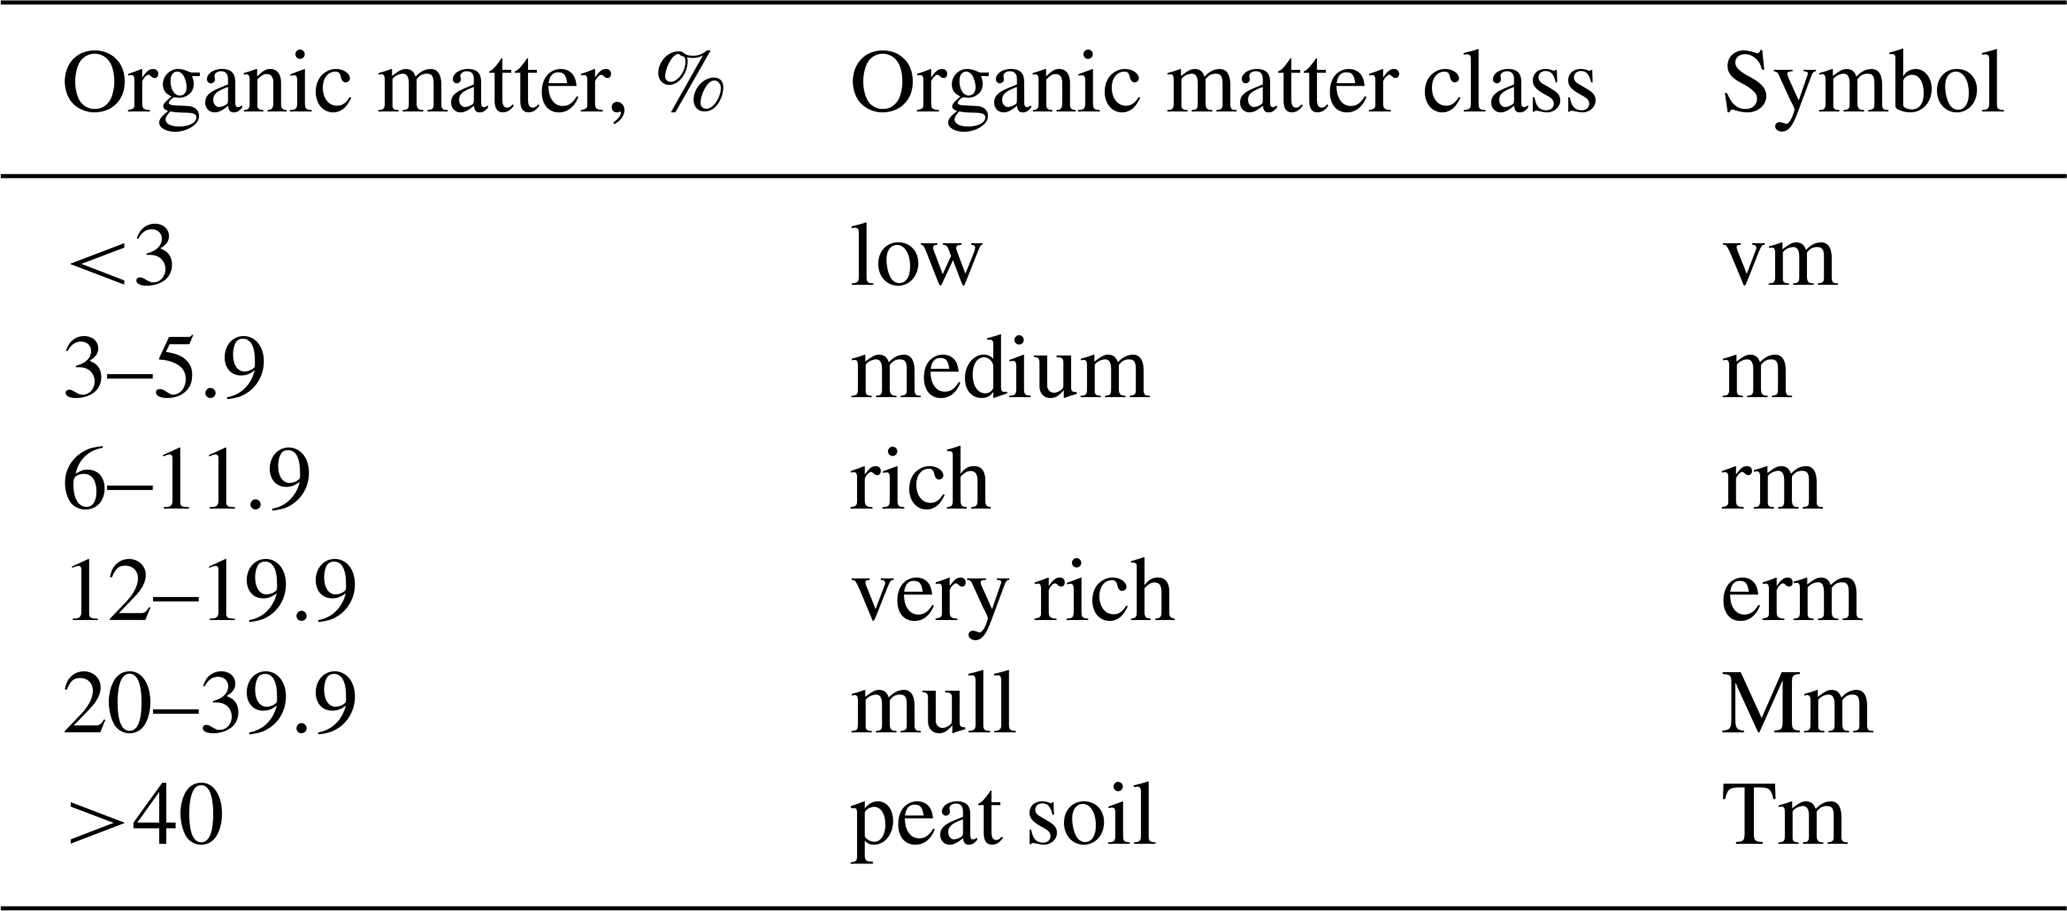
With, cfmoisture and cfgw the plant unavailable water and groundwater adjustment parameters, which are manually calibrated for each land use/soil texture class. At the national scale, the spatial variability in the input data has been considered in the TOC model. Methodology of the calculation of the initial C content in agricultural soils is given in Appendix B and is based on field parcel data from soil laboratory Viljavuuspalvelu oy which contains soil organic matter (SOM) class (vm – low, m – medium, rm – rich, erm – very rich, mm – mull, Tm – peat soil; Table B1). Initial C content in mineral forest soils is based on Finnish multisource national forest inventory data (Mäkisara et al., 2016). Simulated initial C content decreases exponentially with the soil layer depth in mineral soils (Wen et al., 2020), whereas in peat soils carbon content is constant with depth. Annual litter fall data for forests is obtained from PREBAS model results for 16×16 m grids for all Finland and added to the soils in Vemala TOC model as daily input during autumn months. PREBAS combines carbon acquisition through photosynthesis, tree growth and soil carbon processes (Minunno et al., 2019). DOC production rates for peat soils are based on Laurén et al. (2019), and temperature dependency coefficient Q10 values, that describes relative change of C release rate under a 10° change in soil temperature, are calibrated. Soil temperature is simulated based on simulation of the energy flux between air, snow and soil layers, and distribution of energy to freeze the soil frost or to change soil temperature in the soil layers. DOC loads simulated by the TOC terrestrial model are calibrated against TOC observations in inland waters. TOC is mostly under a dissolved form (Mattsson et al., 2005) in Finnish rivers. Therefore, TOC is assumed to be fully dissolved and represents DOC in Vemala.
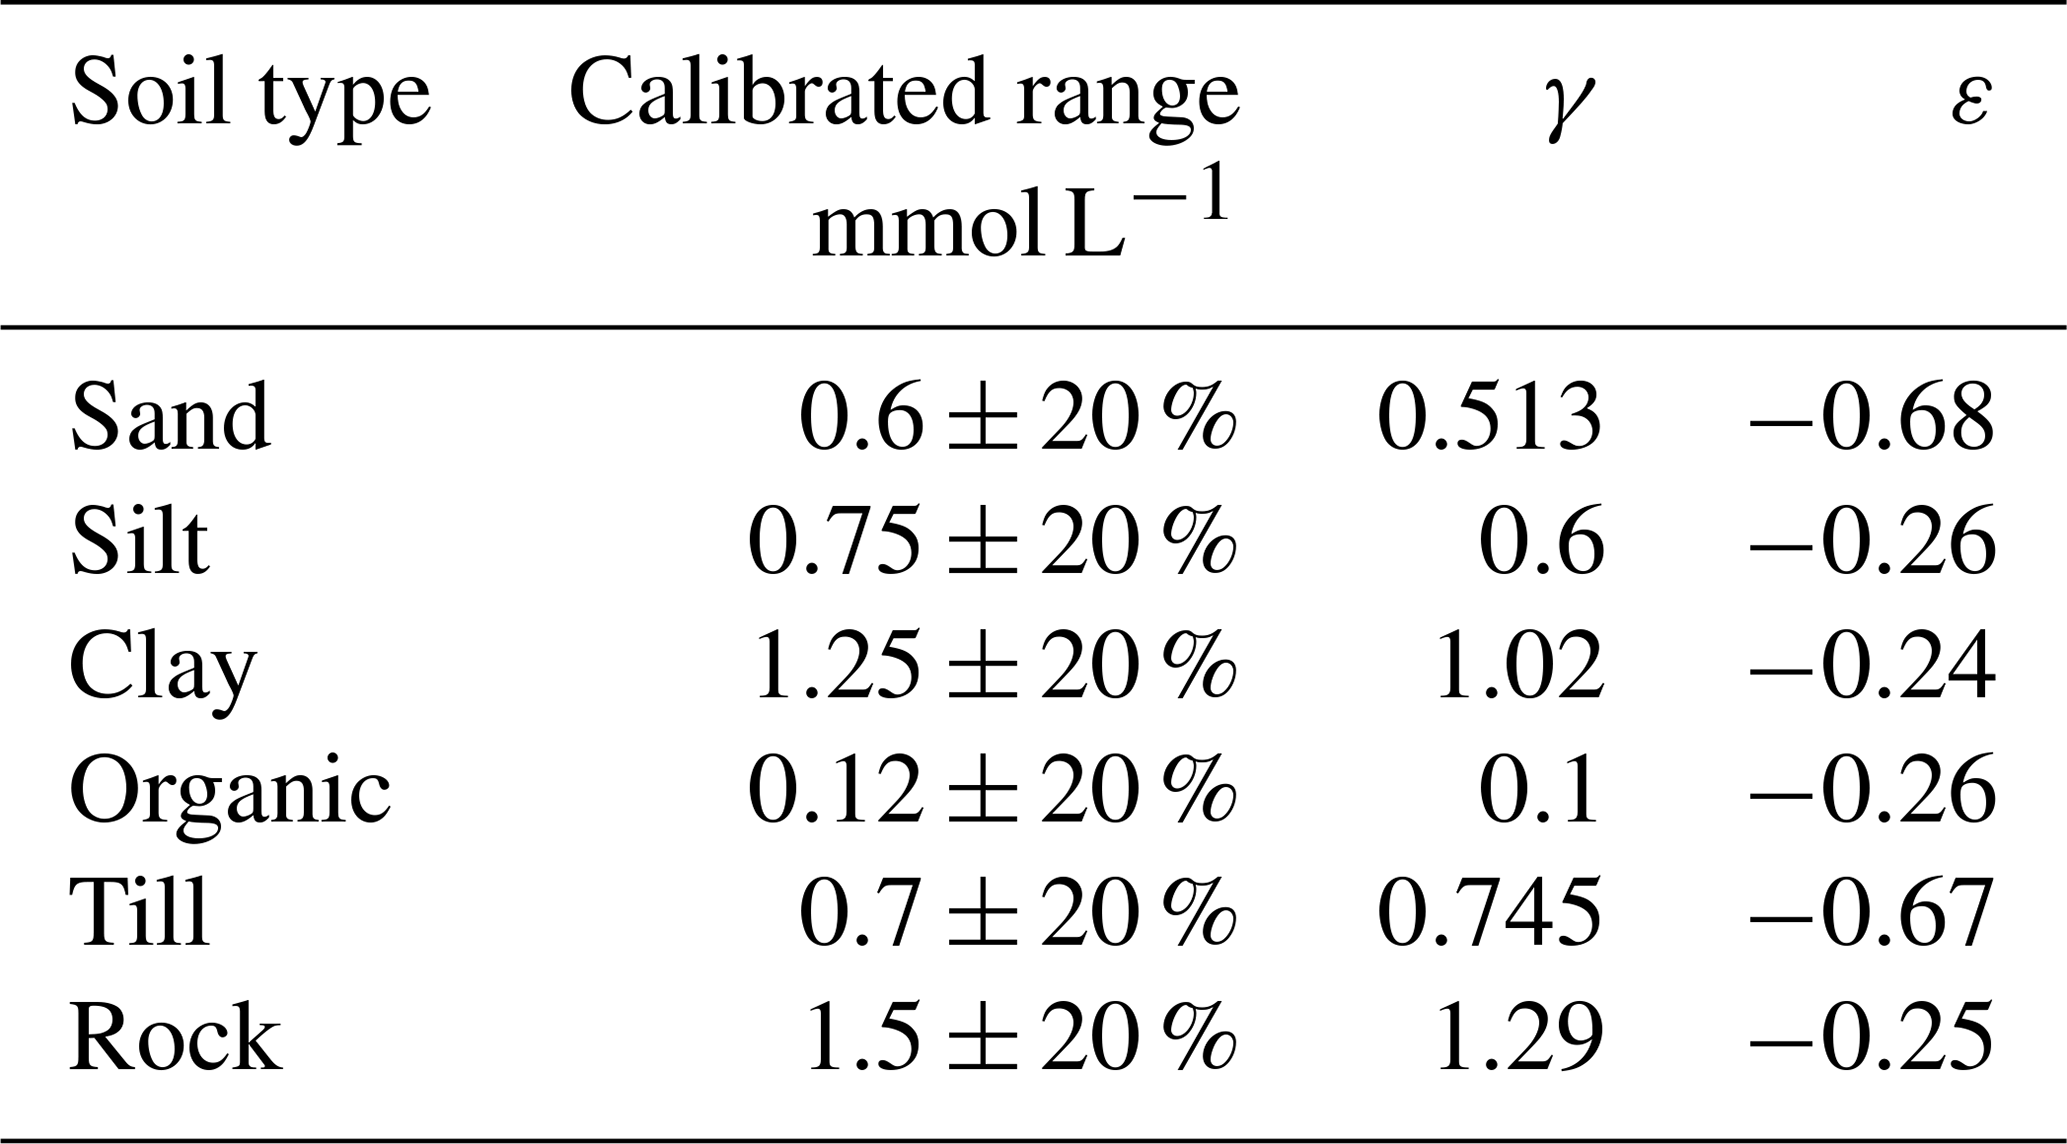
Vemala TIC terrestrial model development (Fig. 1) is based on a regression model between TIC concentration, using alkalinity as a proxy, and runoff per soil type. TIC is assumed to be fully dissolved and thus represents DIC. The alkalinity load per soil type (Alkn,load, mol d−1) is calibrated with runoff from each soil type (qrn) in the catchment area (Eq. 3):
with γn and εn the alkalinity coefficients for each soil type (n). Negative alkalinities are excluded from this model. The range of alkalinities per soil types was defined using the mean values measured by Korkka-Niemi (2001) from well waters in Finland and a variation of ±20 % from the mean values (Table 1).
Table 1Calibrated parameters for the simulation of alkalinity in the Vantaanjoki catchment.
2.3 Aquatic biogeochemical submodel
The Vemala biogeochemical submodel (Korppoo et al., 2017) simulating the co-impact of nitrogen and phosphorus on algal growth and therefore eutrophication, was developed to couple organic carbon to inorganic carbon processes and simulate total carbon cycling. The aim is to simulate organic carbon long-term sedimentation or sequestration and CO2 emissions to the air separately within the aquatic ecosystem (Fig. 3). The new state variables are TIC, alkalinity and pH. TIC represents the sum of three fractions (CO2, HCO, CO), TOC the sum of four fractions (DOCH3, DOCH, DOCH2− and DOC3−; Hruska et al., 2003), and pH the hydrogen ions H+ (Eq. 4):
The processes affecting C and simulated in Vemala are mineralisation that transforms TOC into TIC, photosynthesis that consumes TIC for algal growth, lysing, grazing and viruses that release TOC to the water, algal sedimentation as TOC, TOC compaction in the sediments representing long-term sedimentation, and exchange of CO2 through the water-air interface (Fig. 3). In Finnish waters, most of the TOC is dissolved (Kortelainen et al., 2006; Mattsson et al., 2005) and thus direct sedimentation of TOC is neglected in the model and TOC is considered equivalent to DOC. However, TOC sedimentation happens through phytoplankton settling, thus feeding the sediments with organic matter. Other processes linked to DOC sedimentation are omitted from the model at this point.
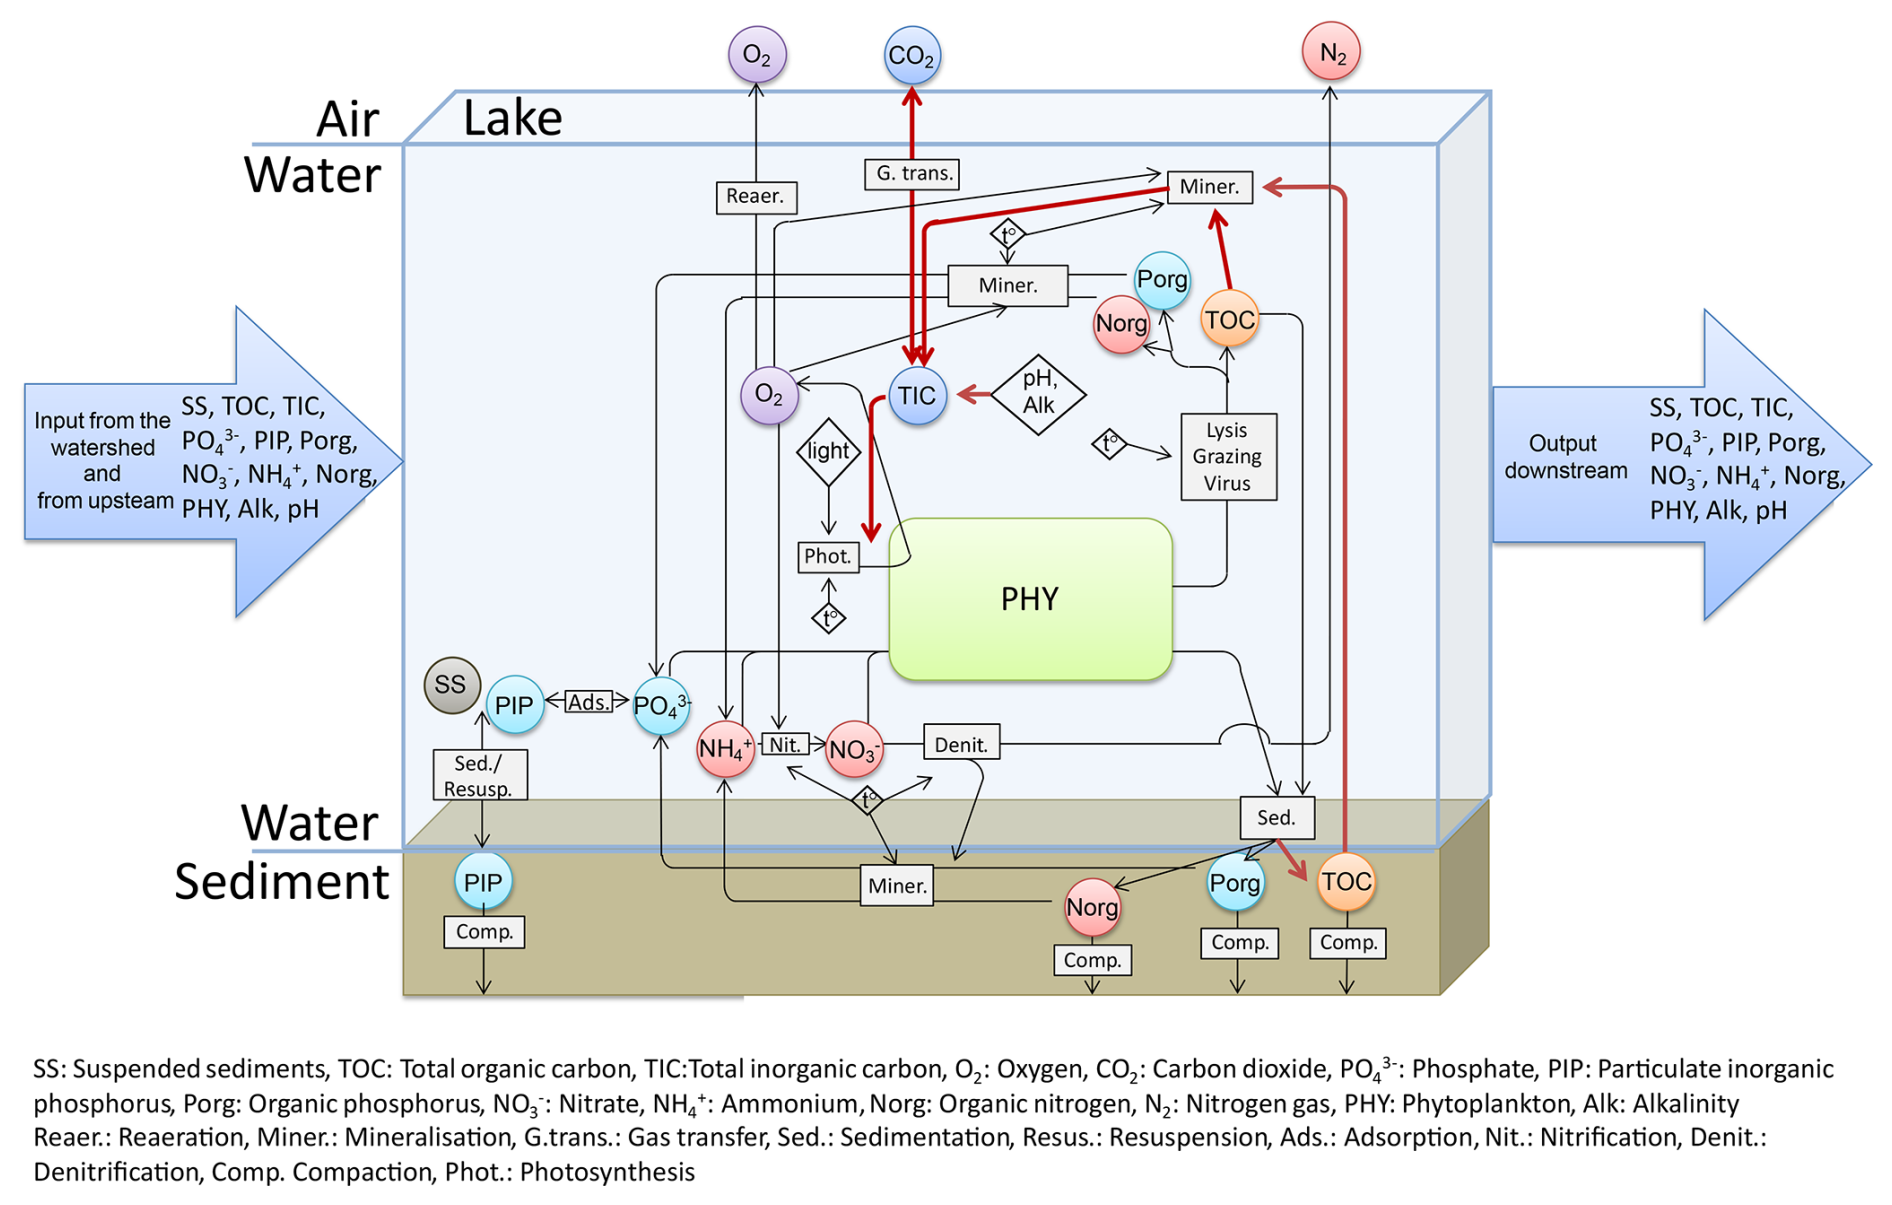
Figure 3Vemala biogeochemical model including the inorganic carbon cycling with new processes shown on the figure in red. Adapted from Korppoo et al. (2017).
The availability of TIC for release to the atmosphere depends on pH, alkalinity and TOC. pH models consider the acidity of the main acids in the water. The simple structure of pH models in freshwater use carbonate, oxide ions and protons to define the alkalinity (e.g. Munhoven, 2020; Marescaux et al., 2020). However, this type of model proved too simplistic for Finnish waters with high DOC and low concentrations of inorganic carbon (Abril et al., 2015). Hruska et al. (2003) quantified the acidity of dissolved organic carbon using three dissociation constants (pKa1 = 3.04, pKa2 = 4.51, pKa3 = 6.46, Fig. C1) and a site density, which represents the number of carboxylic groups per milligram of DOC, of 10.2 ± 0.6 microequiv mg−1 of DOC for Swedish experimental sites. The pH buffering by DOC is thus significant in the pH range of 3.5–6.5. DOC can thus be simplified to a triprotic model with four fractions. DOCH3 is omitted from this model as it is outside the range of pH for natural freshwaters. The resultant alkalinity definition in this model can be expressed in terms of TIC and TOC as we consider the total C fully dissolved in Finnish waters as (Eq. 5):
With α1 and α2 the respective proportion of HCO and CO ions in TIC (mmol L−1) and β1, β2 and β3 the respective proportion of DOCH, DOCH2− and DOC3− ions in TOC (mmol L−1). OH− (mmol L−1) and H+ (mmol L−1) are the concentrations of hydroxide ions and protons and Alk refers to alkalinity (mmol L−1). The proportion of CO2 compared to TIC in the water depends on pH, alkalinity and TOC. This equilibrium between TOC, TIC, Alk and pH is solved using the Newton-Raphson algorithm after reformulating Eq. (5) to solve for [H+] using a polynomial equation as in Munhoven (2013) (Appendix C: pH model). Once pH is determined, CO2 concentration in the water is calculated. The CO2 gas exchange rate (, in mgC m−2 d−1) at the water-atmosphere interface is calculated using (Eq. 6):
with the concentration of CO2 in the water column (CO2, mgC m−3) and at equilibrium with the atmospheric CO2 (CO2atm, mgC m−3; Eq. (12)) and the gas transfer rate at the water-atmosphere interface (m d−1, Eq. 7):
with k600 the transfer velocity (Eq. 9 for the transfer velocity in a lake or Eq. 10 for the transfer velocity in a river) for the Schmidt number (cm h−1), Schmidt is the Schmidt number for CO2 (Eq. 8) and zice the fraction of the lake covered by ice. This equation assumes that ice works as a cap on lakes impeding the exchange of gas at the water-atmosphere interface.
with Tc the temperature in Celsius (Wanninkhof, 1992).
k600lake is the transfer velocity for the Schmidt number 600 (cm h−1) for CO2 and xwind the wind speed at 10 m height (m s−1) from Jonsson et al. (2008) for lakes.
with vel the water velocity (cm s−1) and k600river the transfer velocity for the Schmidt number 600 (cm h−1) for rivers up to a width of 100 m (Eq. 10, Alin et al., 2011).
The atmospheric concentration of CO2 has steadily increased in the past decades (Fig. C2). Data from the ICOS website (Integrated Carbon Observation System ICOS RI, licensed under CC4BY) allowed the modelling of the daily CO2 concentration in the atmosphere (Eq. 11, r2=0.89).
with pCO2, the atmospheric CO2 (in ppm) as simulated based on the Hyytiälä and Pallas stations in Finland, Year is the simulation year and Date is the day of the year (1–365).
In which CO2atm is the CO2 concentration at saturation in the water (mgC m−3) and Ko the solubility of CO2 in the water (molC kg−1 atm−1), Mc the molar mass of carbon (12 gC mol−1) and patm the atmospheric pressure and pCO2 the atmospheric concentration of CO2 (Eq. 11), and dens the density of the water as a function of the temperature (Chen and Millero, 1976).
2.4 Calibration and validation
The Vemala calibration process used a modification of the direct search Hooke-Jeeves optimisation algorithm as described in Huttunen et al. (2016) and considers both loads and concentrations during parameter optimisation. The model was calibrated over the period January 2004 to December 2023, while the period January 1990 to December 2003 was used for the validation of the model. The Nash-Sutcliffe criterion (NSE, Nash and Sutcliffe, 1970) was used to evaluate the model performance for loads; the NSE values were calculated separately for the calibration and validation. The NSE coefficient ranges from −∞ to 1. A coefficient of 1 corresponds to a perfect match between simulated and observed loads, while a coefficient of 0 presents a model that is as accurate as the mean of the observed data. To evaluate the performance of the model in terms of concentrations the coefficient of determination for linear regression (r2, Krause et al., 2005) and the percent bias (PBIAS, Gupta et al., 1999) were calculated.
Vemala calibration is a process starting with the calibration of first the hydrological submodel followed by the terrestrial submodels and ending with the biogeochemical submodel. Vemala TOC model is calibrated in two steps: first, there is a manual calibration of parameters for each of the six land use classes against annual TOC exports reported in literature. Table D1 shows the annual exports of TOC used in guiding the manual calibration. However, it is very hard to find national scale TOC export values because TOC export highly variates depending on soil types, vegetation and along a South-North gradient in Finland. Export equations by Finér et al. (2021) are used for forests on mineral soils and peatlands, however these equations only consider the South-North gradient. The second step of the calibration is an automatic calibration of two parameters – coefficients for adjusting DOC production rates for upper and lower soil layer. Vemala TIC terrestrial model is calibrated via the alkalinity proxy. Alkalinity calibration is done automatically with two parameters for each soil type (γn and εn in Eq. 3) at the Vantaanjoki catchment scale using all the alkalinity observations over the period 2004–2023 (Fig. 5b). Finally, water quality observation points monitored regularly in the catchment are used in the calibration of the biogeochemical model (Korppoo et al., 2017).
2.5 Sensitivity analysis
The biogeochemical deterministic model developed in this study is built on well-known enzyme-catalysed reactions (e.g. Michaelis-Menten) that focus on simulating the limiting reactions of the system affected by environmental conditions (e.g. light, temperature, flow). The range of parameters used in this application have been described in Korppoo et al. (2017) and are based on experimental measures or range from the literature. In this study, we run a sensitivity analysis of the latest processes added to the model in this development and affecting carbon cycling: mineralisation that transforms TOC into TIC, phytoplankton growth that through photosynthesis consumes TIC and through phytoplankton mortality releases TOC to the water, and exchange of CO2 through the water-air interface. To evaluate the model's responsiveness to these processes, we varied the associated parameters by ±20 % around their calibrated values. This approach allows us to assess the robustness of the model and identify which processes exert the greatest influence on carbon loss from the aquatic system.
3.1 Description of the Study site – Vantaanjoki catchment
The Vantaanjoki catchment covers 1680 km2 in southern Finland (Fig. 2a), just north of the city of Helsinki and includes Tuusulanjärvi lake (Fig. 2b and c). The river flows southwards and discharges into the Gulf of Finland. For model purposes, Vantaanjoki is divided into 48 third-level sub-catchments which are further subdivided into 989 small brook catchments with average size of 148 ha (e.g. Fig. A1). Land cover is dominated by forests on mineral soils (50 %). Forests on peat soils account for 7 % of the area, agricultural fields for 22 %, and lakes for 3%. Urban areas cover the remaining 18 % of the catchment (Corine Land Cover 2018, Syke, 2025b, and and Peatland drainage status, Syke, 2025d, Fig. 2b). The soil types are distributed between north and south with northern areas characterized by sand/till/silt/organic mostly covered by forests while the south is defined by clay overlay allowing for more agriculture to take place. Overall, clay is the main soil type (37 %) followed by rock, sand and till (22 %, 12 % and 11 %, respectively) while organic soils and silt both cover 8 % of the total catchment area (Fig. 2c). The average rainfall over the 10 year period 2014–2023 is 720 mm. In southern Finland hydrology is characterized by the highest flow peaks occurring in spring during snowmelt and in autumn when rainfall is more abundant.
Tuusulanjärvi catchment area is 91 km2 of which 50 % is covered by clay, 21 % by rock and 12 % by till (Fig. 2c). Lake coverage accounts for another 9 % of the area, while forest (33 %), agriculture (31 %) and urban (27 %) areas are equally distributed (Fig. 2b). Tuusulanjärvi Lake itself covers 5.9 km2 and has a volume of 18 million m3 with a retention time of over 200 d and is the largest lake in the Vantaanjoki catchment. The lake is hypereutrophic (Schönach et al., 2018).
3.2 Monitoring data
The WSFS-Vemala model is developed and applied using long-term hydrological and water quality observations from national monitoring programmes maintained by the Finnish Environment Institute (Syke). Discharge data are obtained from the HYDRO dataset (Syke, 2025c), which consists of continuous flow measurements from gauging stations across Finland. Water quality data, including total organic carbon, total inorganic carbon, alkalinity, pH, nitrogen, phosphorus and phytoplankton are obtained from the VESLA dataset (Syke, 2025e), which is based on routine grab sampling and laboratory analyses following standardized national protocols. Sampling frequency typically ranges from monthly to seasonal, depending on site and variable.
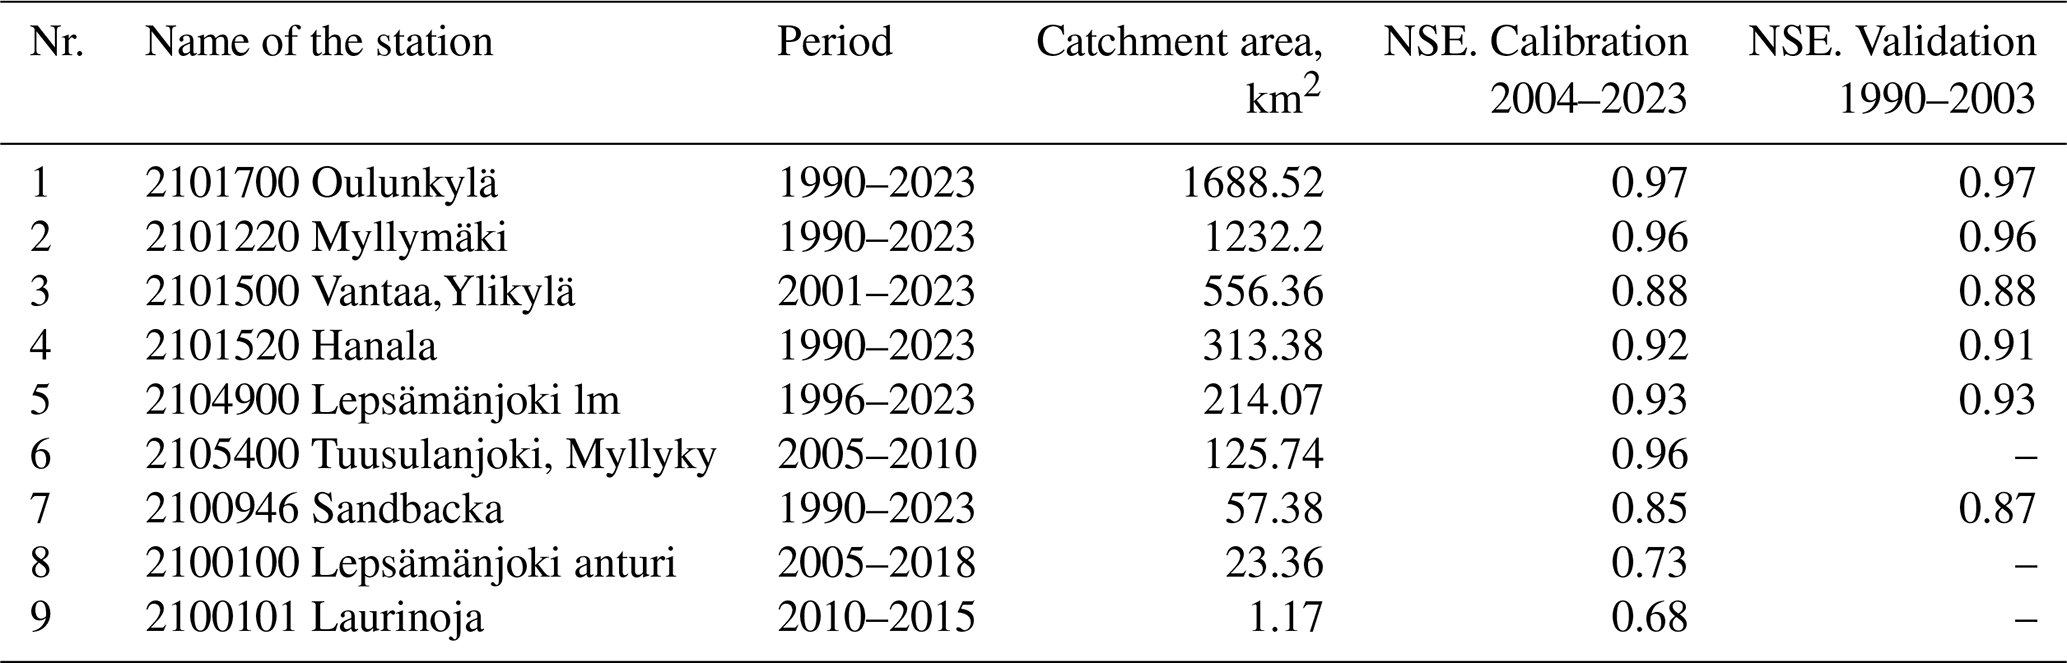
For Vantaanjoki catchment, nine discharge stations and ten lake water level stations are used for the runoff parameter calibration of the hydrological model in Vantaanjoki catchment (Table 2). Because lakes cover only a small fraction of the catchment area and are relatively small in size, the discharge observations are given greater weight in the calibration process. The calibration is performed by minimizing the difference between daily simulated and observed discharge in all points simultaneously. The points with larger discharge get higher weight in the optimization function.
Table 2Discharge observations used for model calibration and validation, and NSE values for calibration and validation periods.
Both TOC observations and TOC calculated from CODMn observations were used in model calibration and validation. TOC data were estimated from CODMn data that correlates well with TOC in Finland (Kortelainen, 1993). As TOC data for rivers and lakes are scarce and CODMn have been more often analysed, this approach enables to use larger datasets and improved model performance. Equation (13) is fitted for Vantaanjoki catchment with CODMn and TOC observations from 1990–2022 (VESLA dataset, Syke, 2025e).
TIC observations (mgC L−1) were scarce all over Finland and thus alkalinity (Alk in mmol L−1) measurements were used as a proxy using the expression (Rantakari and Kortelainen, 2008 with an r2=0.95, Eq. 14):
TOC and TIC are measured on unfiltered samples in Finland, while DOC and DIC are very rarely sampled. Water quality observation points monitored regularly in the catchment are used in the calibration of the Vemala model. Vantaa 4,2 6040 is the most frequently monitored water quality observation point downstream of the catchment with 15 or more observations per year (Fig. 5a). Based on the observations available in the VESLA dataset (Syke, 2025e); over the period 1990–2023, the mean (± standard deviation) total phosphorus, total nitrogen, TOC and TIC concentrations were 102 µg L−1 (±61), 2.3 mg L−1 (±0.9), 12.3 mg L−1 (±3.5) and 10 mg L−1 (±2.7) respectively and for alkalinity and pH the averages were 0.79 (±0.23) and 7.27 (±0.28). The ecological status of Vantaanjoki and Tuusulanjärvi is considered satisfactory (Syke).
Additionally, samples were collected from the main tributaries and outlet of the Tuusulanjärvi lake during 2023. The samples were analysed at the MetropoliLab Oy for total organic carbon (SFS-EN 1484:1997), total inorganic carbon (SFS-EN 1484:1997), pH (SFS 3021:1979) and alkalinity (VYH87).
4.1 River basin scale results
4.1.1 Discharge
Table 2 shows the discharge observation points used for model calibration, validation and NSE values for both periods. NSE for calibration period varies between 0.68–0.97, and for validation period between 0.87–0.97. The model can simulate reasonably well observation points on small and medium-sized catchment areas. Figure 4a shows the daily simulated and observed discharge at Vantaanjoki Oulunkylä station (2004–2023) with a NSE = 0.97 for the calibration period. Water level observations of unregulated lakes are used to calibrate the lake rating curve parameters. For regulated lakes, such as Tuusulanjärvi, outflow (Fig. 4b) and water level measurements, provide an estimate of “observed” inflow to the lake, which is used in runoff parameter calibration.
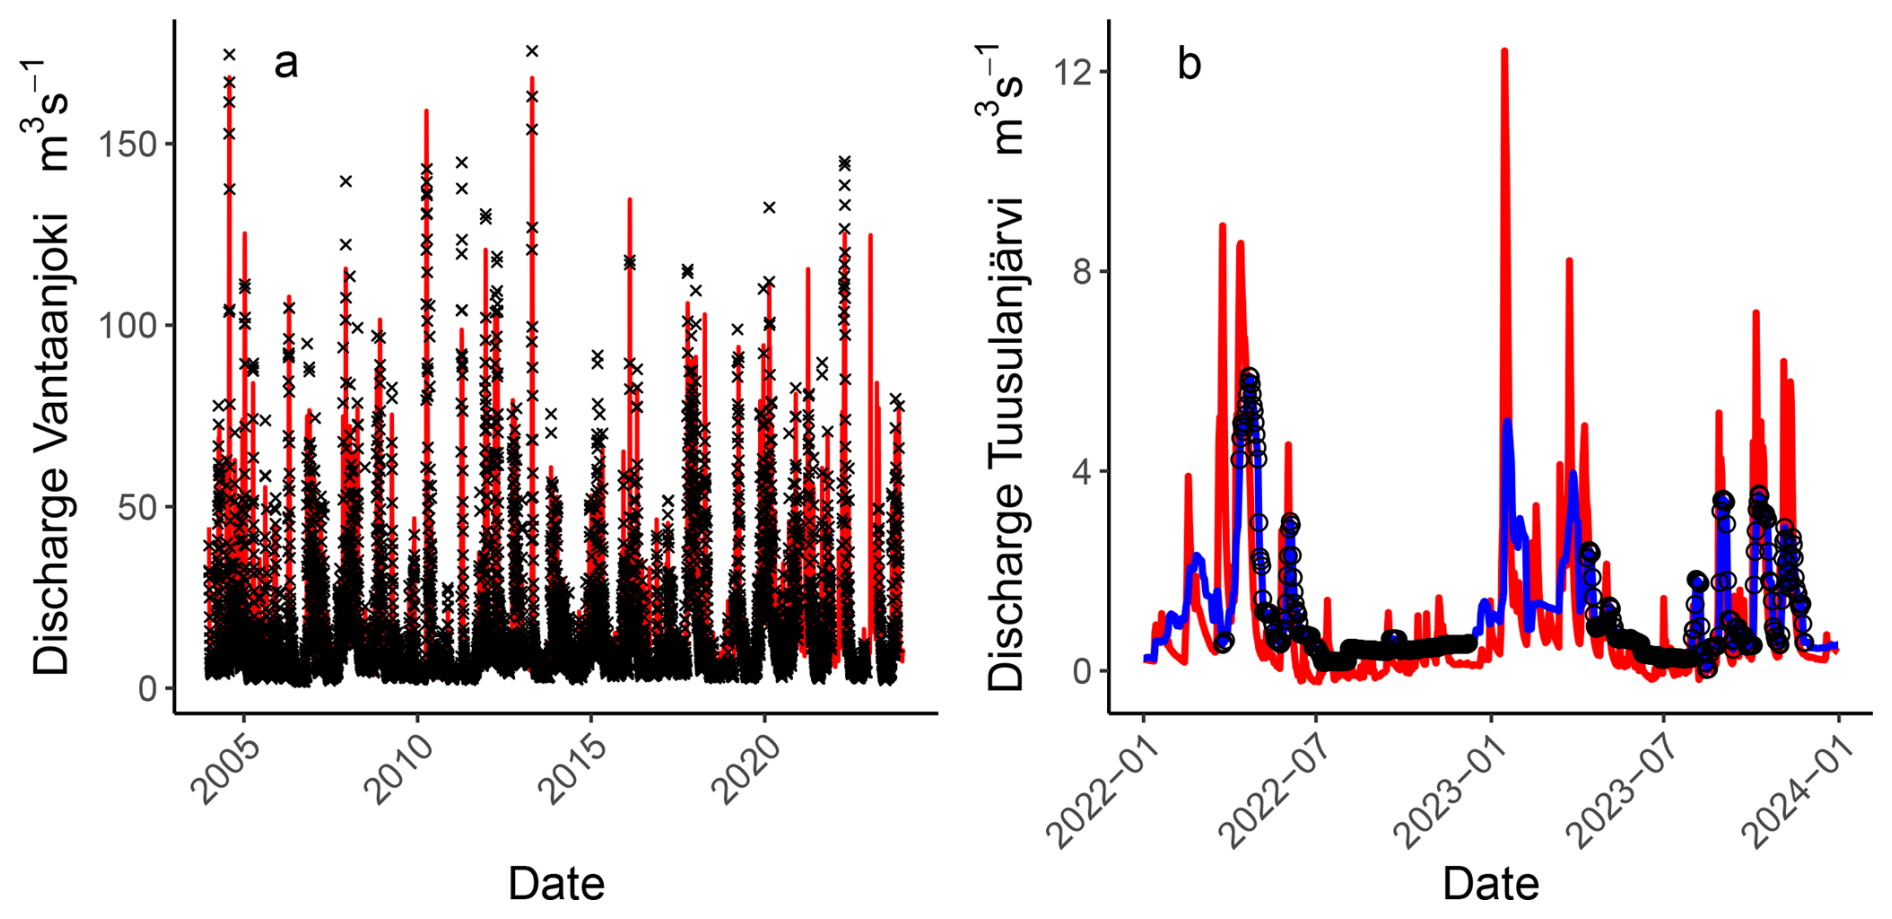
Figure 4(a) Simulated (red line) and observed (black cross) discharges at Vantaanjoki outlet for calibration period 2004–2023. (b) Simulated inflow (red line), observed outflow (black circle) and simulated outflow (blue line) of Tuusulanjärvi for calibration period 2022–2023.
4.1.2 Total organic carbon
TOC concentrations in Finland using both TOC observations and CODMn observations as a proxy (Eq. 13) range between 0.1–480 mg L−1, with a mean and median of 12.5 and 9.8 mgC L−1 respectively, based on 106 512 observations available after 2000 from the VESLA dataset (Syke, 2025e). The TOC concentrations in Vantaanjoki (13.1 mgC L−1) and Tuusulanjärvi (9.8 mgC L−1) are around the national mean and median respectively.
Vemala TOC model simulates the source apportionment of the TOC loading as well as spatial distribution of gross TOC loading for each small brook catchment. Figure 5a shows the simulated TOC specific loading spatial distribution, which depends on soil and land use classes. There are higher TOC loading areas in Vantaanjoki upstream sub-catchments, where relatively more peat soils are located. Simulated TOC specific loading from forests on drained peat soils is 9.2 tC km−2 yr−1, natural peat soils: 7.8 tC km−2 yr−1, forests on mineral soils: 3.6 tC km−2 yr−1 and agriculture on mineral soils: 3.0 tC km−2 yr−1. Even if the highest TOC specific loading is from peat soils, the highest source of TOC is forests on mineral soils (62 %) as they cover the largest area in Vantaanjoki catchment. Vemala performed well in terms of TOC daily loads at the Vantaanjoki outlet observation point, with a NSE of 0.65 for the calibration period (2004–2023), and 0.79 for the validation period (1990–2003) (Table 3), as well as for the simulation of TOC daily concentrations (r2=0.89 for both periods and pBIAS between 7 % and 16 %, Table 4 and Fig. 6).
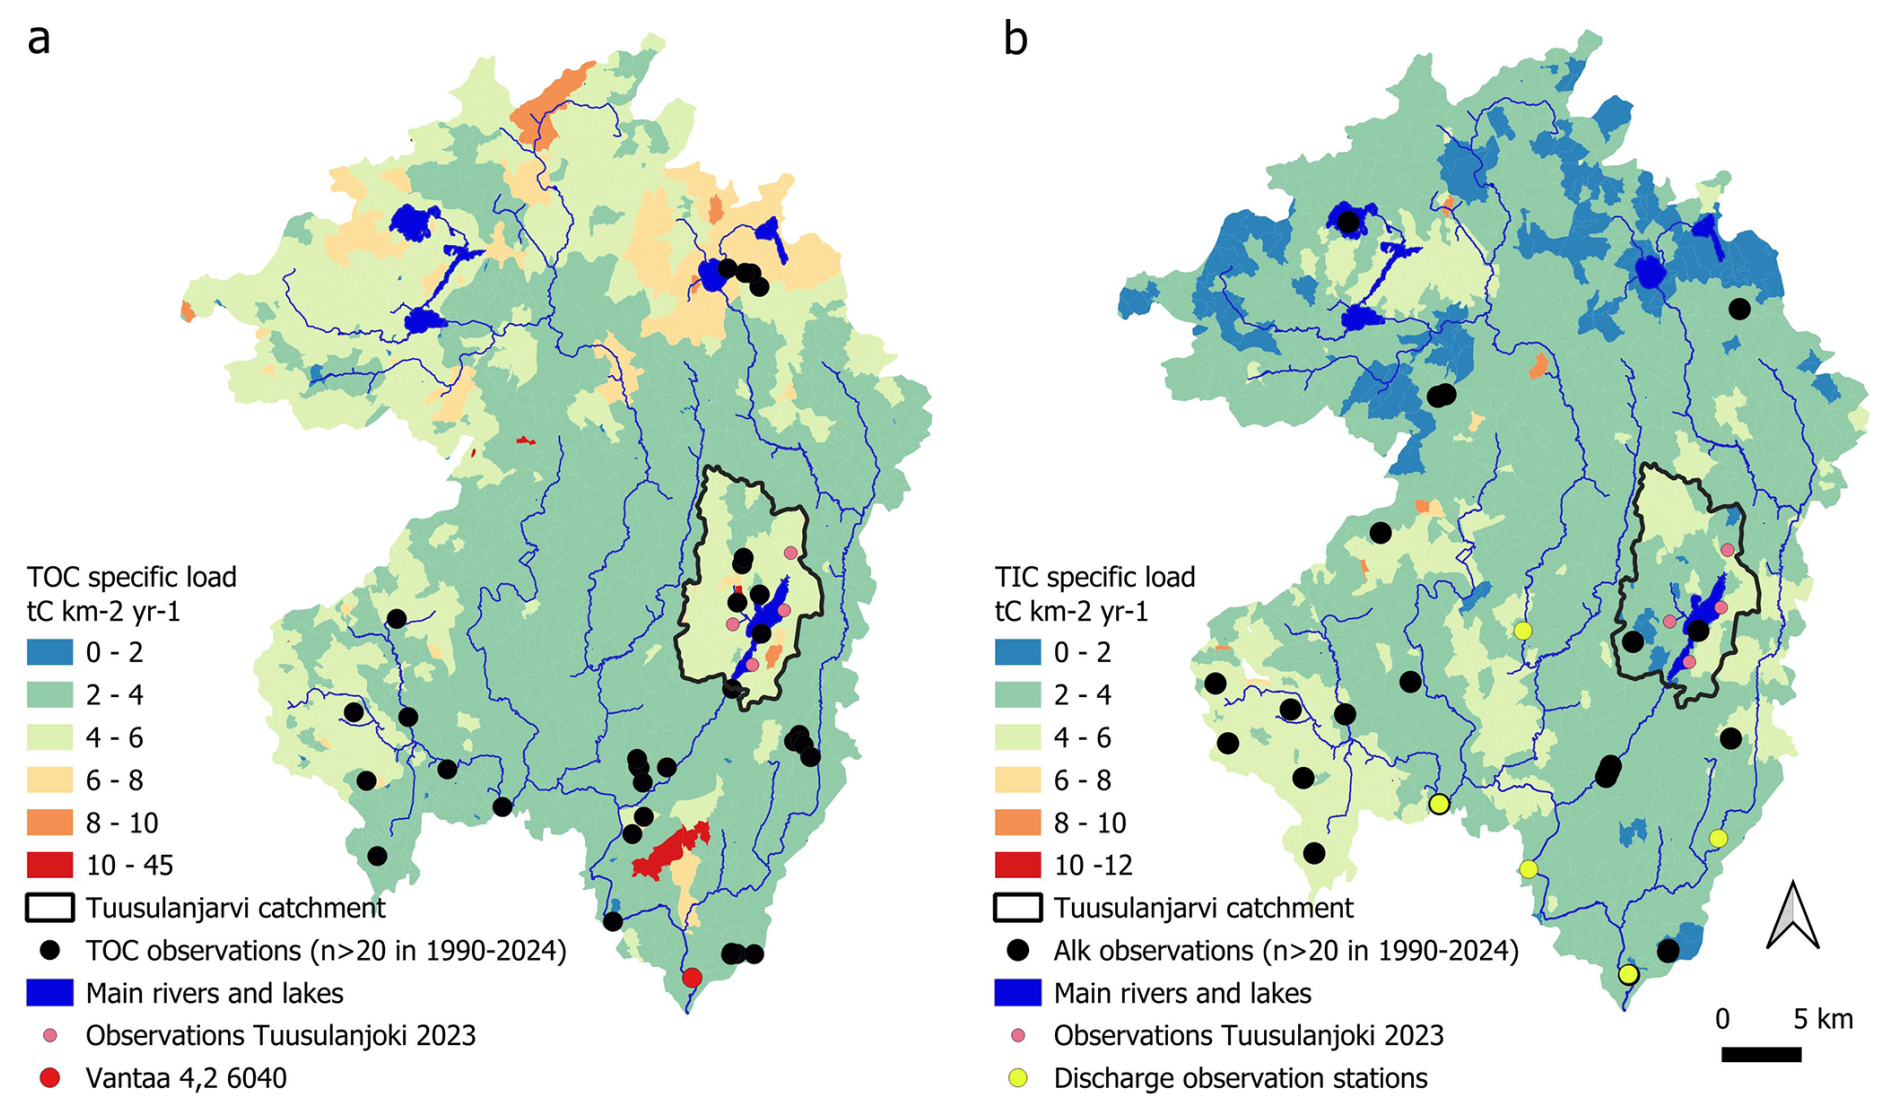
Figure 5(a) Simulated TOC specific loading (tC km−2 yr−1) in Vantaanjoki, and TOC observation points, >20 observations for the period 1990–2023 (b) Simulated TIC specific loading (tC km−2 yr−1) in Vantaanjoki, and alkalinity observation points, >20 observations for the period 1990–2023. Source: WSFS-Vemala/Finnish Environment Institute (Syke, 2025f).
Table 3Nash-Sutcliffe criterion of the WSFS-Vemala water quality simulations and number of observations in parenthesis of carbon and nutrient loading at the outlet of Tuusulanjärvi (Tuusulanjärvi luusua 1) and at the outlet of Vantaanjoki (Vantaa 4,2 6040) over the calibration (2004–2023) and validation (1990–2003) periods with total organic carbon (TOC in tC d−1), total inorganic carbon in the water (TIC in tC d−1) , alkalinity (Alk in mol d−1), pH, total phosphorus (TP, kgP d−1) and total nitrogen (TN, tN d−1).
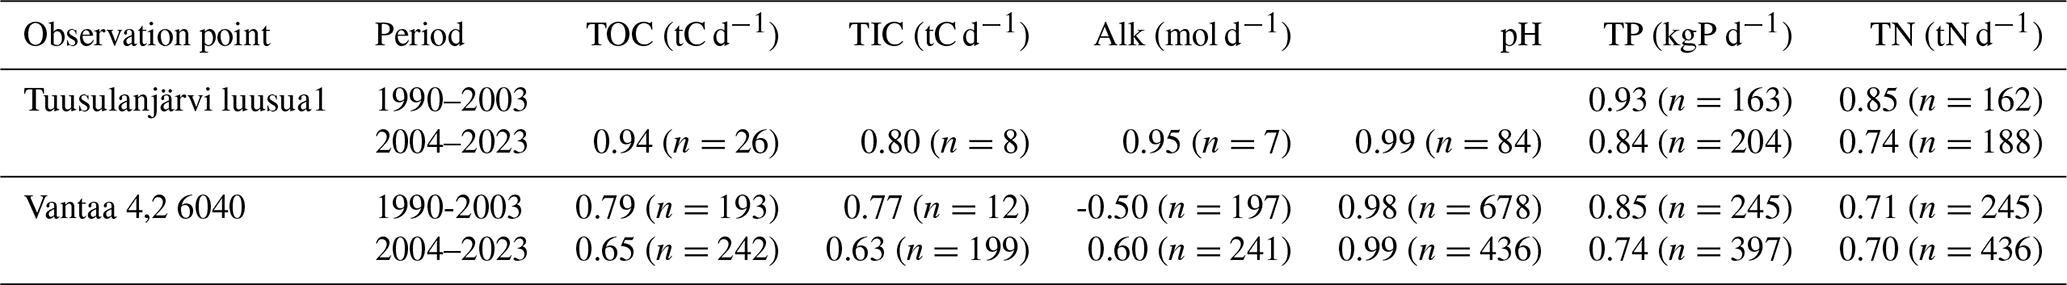
Table 4The model performance statistics (r2, n = number of observations and pBIAS) for carbon and nutrient concentrations, alkalinity and pH at Tuusulanjärvi and Vantaanjoki outlets (Vantaa 4,2 6040) during the calibration (2004–2023) and validation (1990–2003) periods. Variables include total organic carbon (TOC, mgC L−1), total inorganic carbon (TIC, mgC L−1), alkalinity (Alk, mmol L−1), pH, total phosphorus (TP, µg L−1) and total nitrogen (TN, mg L−1).
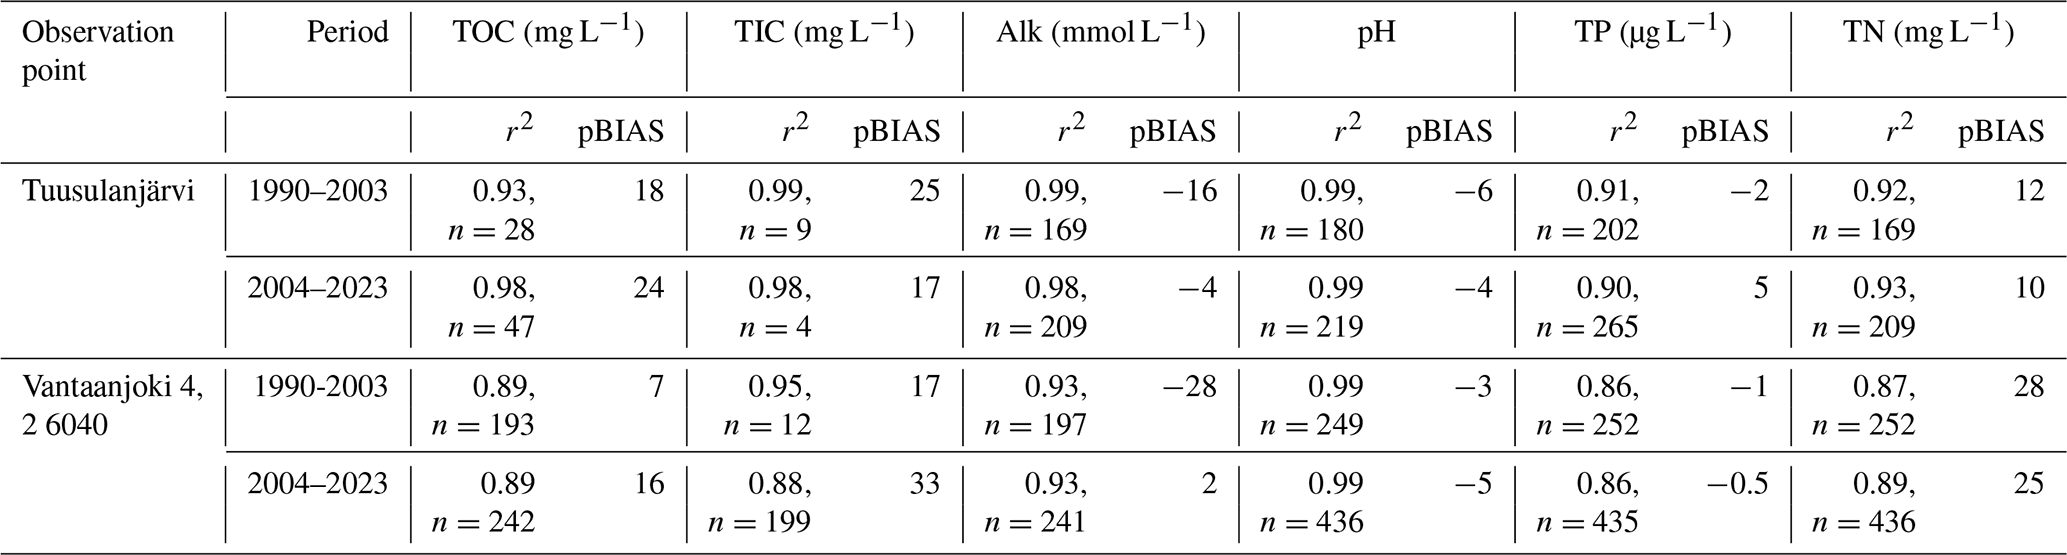
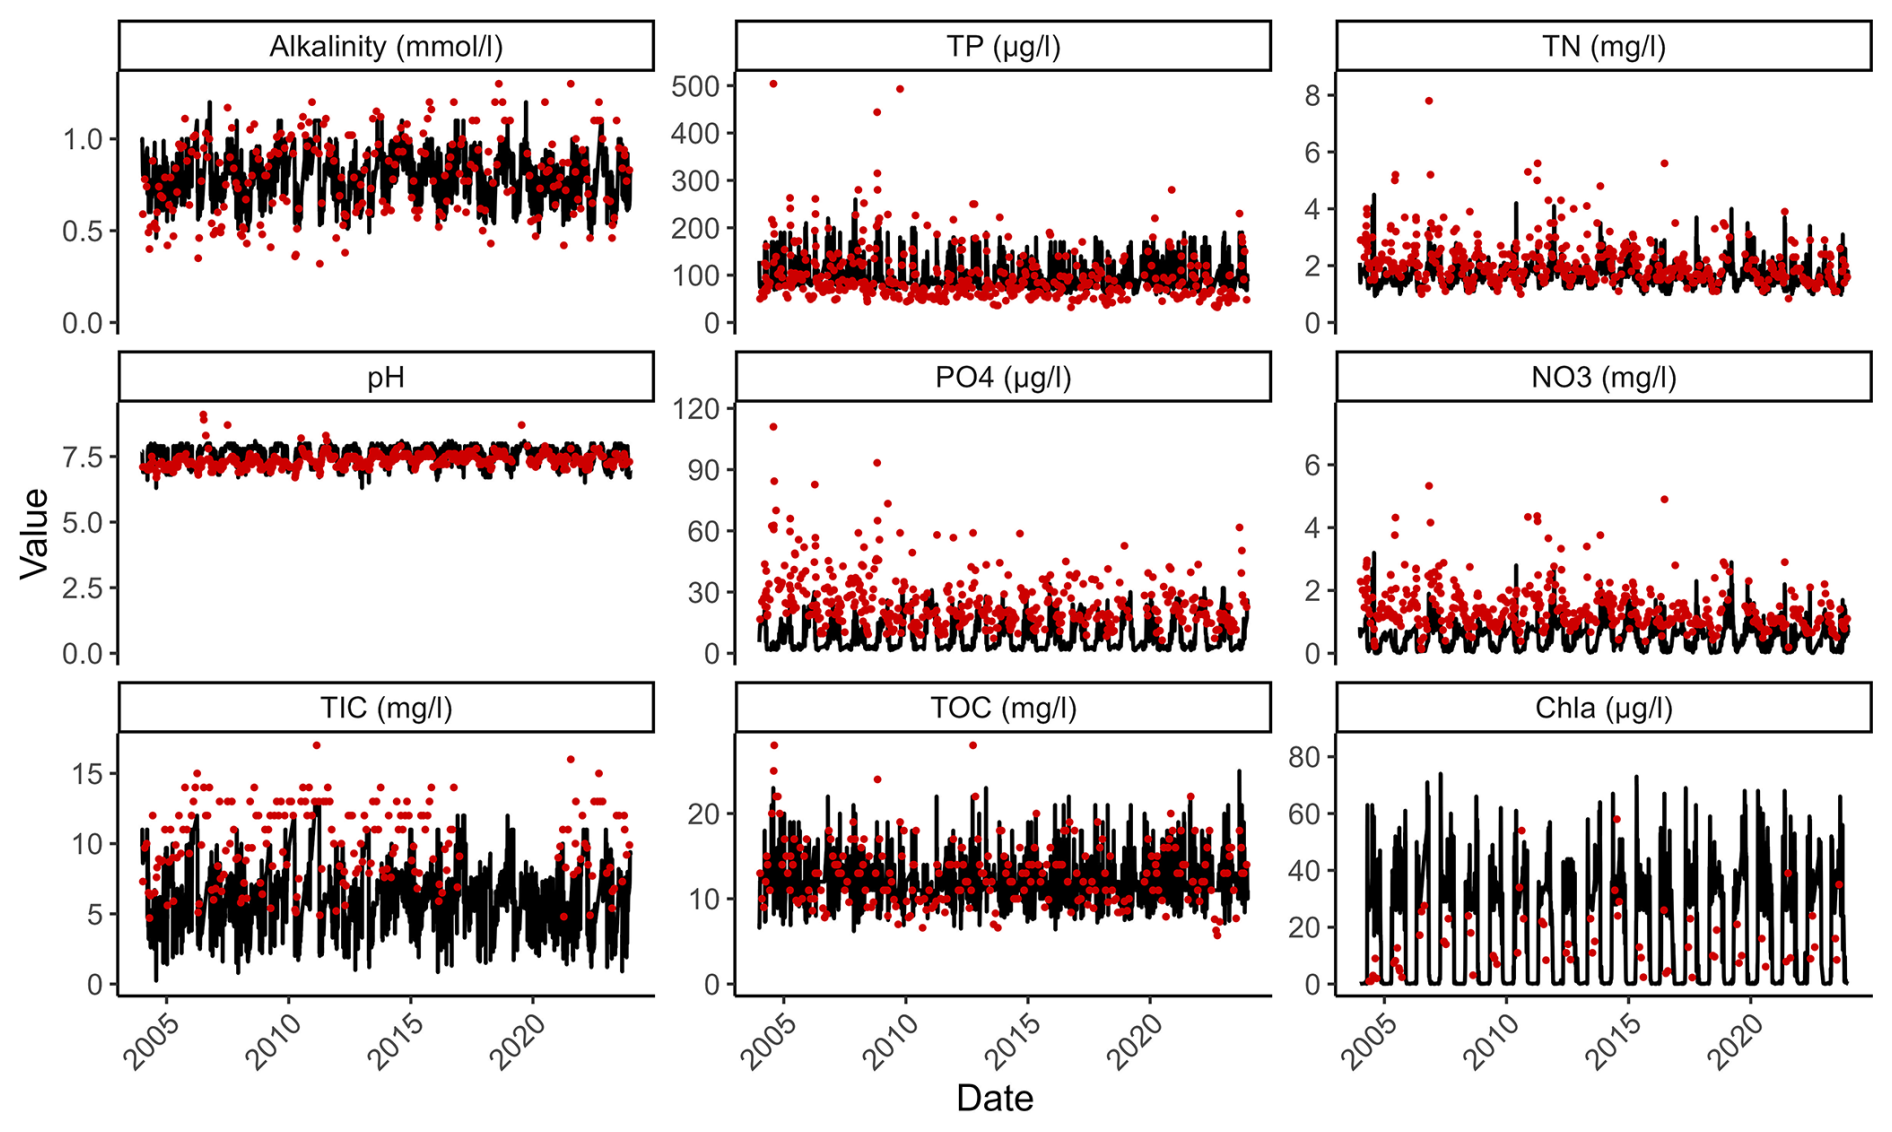
Figure 6Water quality in Vantaa 4,2 6040 over the period 2004–2023 with observations (red dots) and simulations (black line) for alkalinity (mmol L−1), pH, total inorganic carbon (TIC, mg L−1), total phosphorus (TP, µg L−1), phosphate (PO4, µg L−1), total organic carbon (TOC, mg L−1), total nitrogen (TN, mg L−1), nitrate (NO3, mg L−1) and phytoplankton (Chl a, µg L−1).
4.1.3 Total inorganic carbon
TIC concentrations in Finland using alkalinity observations as a proxy (Eq. 14) range between 0.1–85 mgC L−1, with a mean and median of 3.9 and 2.4 mgC L−1 respectively, using 23 508 observations available after 2000 from VESLA dataset (Syke, 2025e). The TIC concentrations in Vantaanjoki (9.7 mgC L−1) and Tuusulanjärvi (8.5 mgC L−1) are more than double the national mean.
Vemala simulates rock weathering and the resulting alkalinity, and thus TIC (Eq. 14), from various soil types. There are 12 observation points for alkalinity in Vantaanjoki with more than 20 observations over the period 1990–2023 (Fig. 5b). The highest alkalinity is calibrated as coming from rock and clay soils at runoff higher than 0.5 mm, while for lower runoff, sand and till are contributing the most to alkalinity (Table 1). Figure 5b shows the spatial distribution of simulated TIC specific loading in Vantaanjoki catchment ranging from 1–7 tC km−2 yr−1 depending on soil types.
For the alkalinity daily loads at the Tuusulanjärvi outlet observation point, NSE was 0.95 for the calibration period (2004–2023), and for Vantaanjoki outlet NSE was 0.60 for the calibration period and was negative for the validation period (Table 3). The alkalinity daily concentrations were well simulated compared to the observations (r2=0.93–0.99); however, alkalinity was overestimated in the validation period (pBIAS between −16 % and −28 %) in Vantaanjoki and Tuusulanjärvi (Table 4). The discrepancy in the results of alkalinity is explained by an increased alkalinity in Vantaanjoki over the calibration period with an average alkalinity of 0.8 mmol L−1 (Fig. 6) compared to the validation period with an average of 0.62 mmol L−1. TIC daily concentrations showed a strong correspondence with the observations (r2=0.88–0.99 for both periods), however TIC concentrations were underestimated in both periods (pBIAS between 17 % and 33 %, Table 4 and Fig. 6).
4.1.4 River basin carbon budget
The catchment annual loads of TOC can be compared to estimates derived from the monitoring data and an averaging method for the period 1991–2020 (HELCOM PLC database, HELCOM, 2025). The average net annual loading at the outlet of Vantaanjoki over the period 1991–2020 was 5974 tC yr−1 in Vemala and 7098 tC yr−1 in the estimation. Vemala underestimated the annual TOC loading estimates by on average −16 % over the period with a range from −33 % to +25 % with the largest underestimation in the wet years 2012 and 2017. In 2012, only two samples have been recorded in October and November with high values (28 and 22 mgC L−1). These peaks in concentrations are underestimated in Vemala; however, it is possible that the averaging method overestimates the loading when using the interpolation method with too few values for the autumn loading.
The annual terrestrial average TC loads (gross loading) for the Vantaanjoki catchment were 11 210 tC yr−1 and 12 870 tC yr−1 respectively for the validation and calibration period. The annual average loading to the Sea (net loading) for TC was 8730 and 9675 tC yr−1 respectively for the validation and calibration periods with about 66 % being TOC loading and 34 % TIC loading. The model simulated a retention/release of carbon through the river and lake network of 2480 and 2715 tC yr−1 respectively for the validation and calibration periods or about 22 % of the terrestrial total carbon reaching the aquatic ecosystem. About half of the loss occurs in the lakes of the catchment (1030 tC yr−1) that cover a total area of 37 km2 (sizes range from 0.001–5.9 km2). If we consider a river network area of 6.5 km2, based on the geometry of river stretches, defined in the Finnish basemap (Metadata: Shoreline10, Syke and NLS, 2025e) with a discharge larger than 0.05 m3 s−1 (WSFS-Vemala, Syke, 2025f), the resulting CO2 emission rate is between 223–260 gC m−2 yr−1 in the river network itself.
4.2 Lake processes
4.2.1 Tuusulanjärvi tributaries
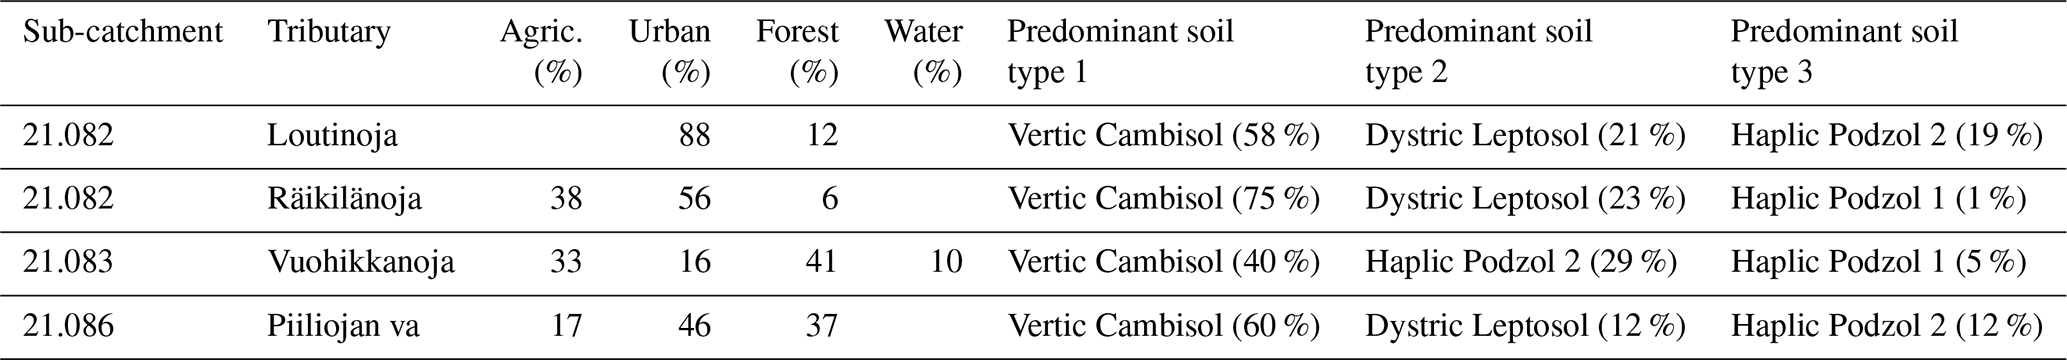
The alkalinity in the various tributaries of Tuusulanjärvi monitored over the year 2023 can be divided into two groups, one presenting a lower alkalinity around 0.5–0.7 mmol L−1 throughout the year and one presenting an alkalinity increasing during the summer months up to around 2 mmol L−1 or TIC concentrations up to 27 mgC L−1 (Fig. 7). High TIC summer concentrations are related to a large proportion of clay and rock in the catchments with up to 98 % in Räikilänoja 0.1 (Table D2). Vuohikkaanoja 1.0 on the other hand, which has only 40 % of rock and up to 29 % of sand presents low alkalinity and TIC concentrations throughout the year. Vemala results represent well the variability of TIC seasonal concentrations based on soil types in the upstream catchments (Fig. 7).
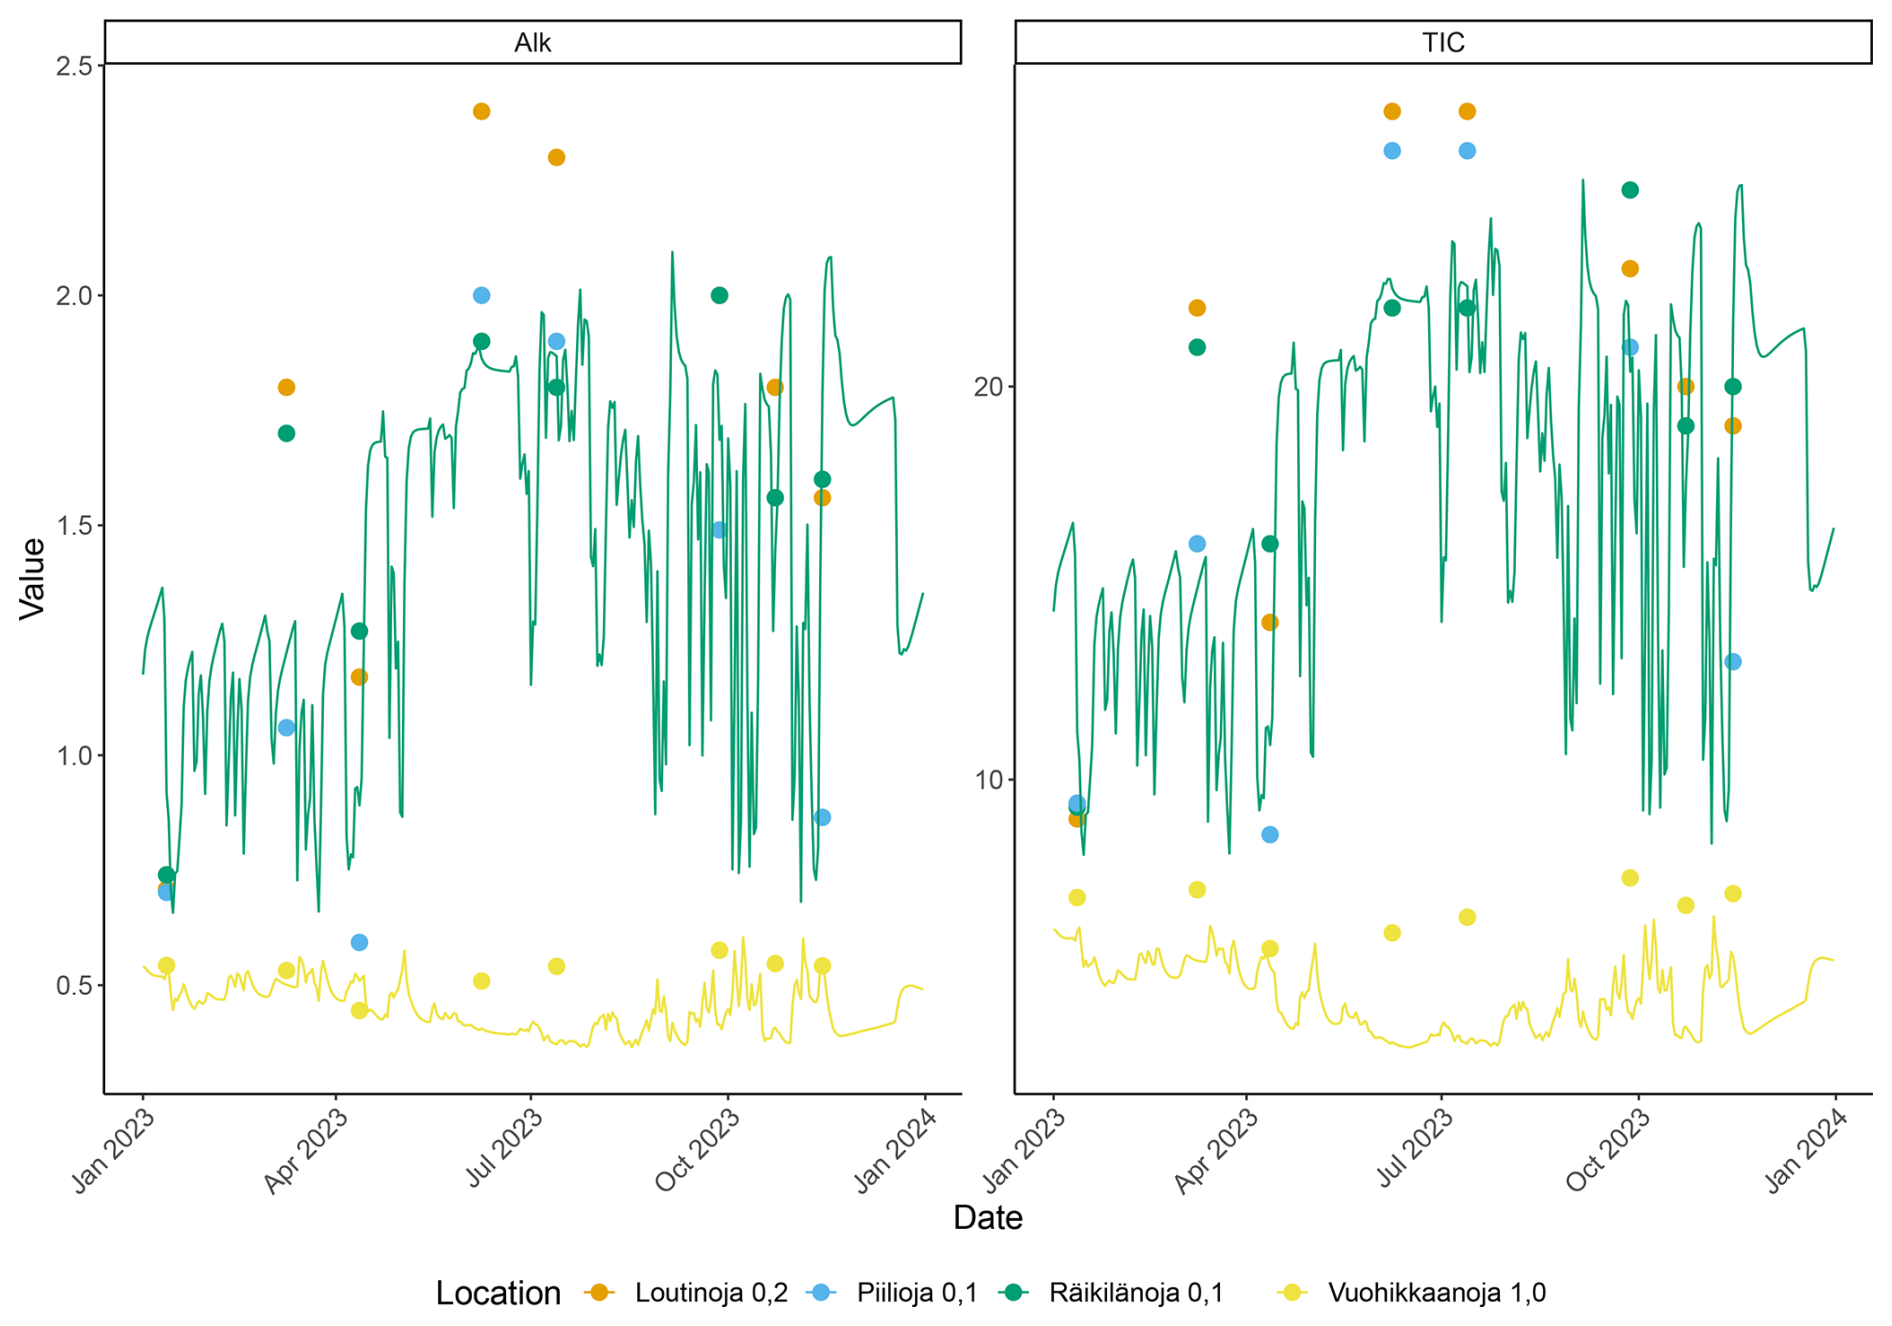
Figure 7Observations (dots) and Vemala simulations (lines) of water quality variables in the rivers upstream Tuusulanjärvi in 2023 (Alk = alkalinity in mmol L−1, TIC = total inorganic carbon in mg L−1), monitored by the ELY Centres (Centres for Economic Development, Transport and the Environment in Finland).
4.2.2 Water quality of Tuusulanjärvi
Tuusulanjärvi is a hypereutrophic lake presenting chlorophyll-a values up to a 100 µg L−1 during the summer (VESLA, Syke). Vemala simulates well carbon (TOC, TIC, alkalinity, pH), nutrients (TN, nitrate (NO3), TP, phosphate (PO4)) and Chlorophyll-a (Chl a) concentrations in Tuusulanjärvi lake compared with observations (Tuusulanjärvi syvänne 1–2 m depth, Fig. 8 and Table 4) over the calibration period with both the inter and intra annual levels well represented. The concentrations in Tuusulanjärvi are well simulated with r2 higher than 0.90 for all variables (Table 4), although some variables are underestimated like TIC (pBIAS between 17 % and 25 %) and TOC (pBIAS between 18 % and 24 %) (Table 4 and Fig. 8). The annual increase in TIC concentrations in the spring can be associated with the accumulation of CO2 in the water over the winter period due to ice cover preventing the exchange of CO2 gas at the water-air interface. However, as noted in the simulation of alkalinity at the outlet of the Vantaanjoki catchment, the increase in alkalinity in the later period of the calibration is visible from an average of 0.65 (2004–2012) to 0.75 (2013–2023). This increase cannot be explained by rainfall and discharge alone as the model simulates well the discharge in the catchment over both periods. A slight increase in pH can also be noted in the Tuusulanjärvi observations over the validation period, possibly due to the recovery to acidification or changes in soil weathering rates, unlike in the modelled results of pH. The model also simulates well the carbon and nutrients loads at the outlet of Tuusulanjärvi (Tuusulanjärvi luusua 1, Table 3) over the calibration and validation periods with NSE values higher than 0.74 for TOC, TIC, alkalinity, pH, TP and TN (Table 3).
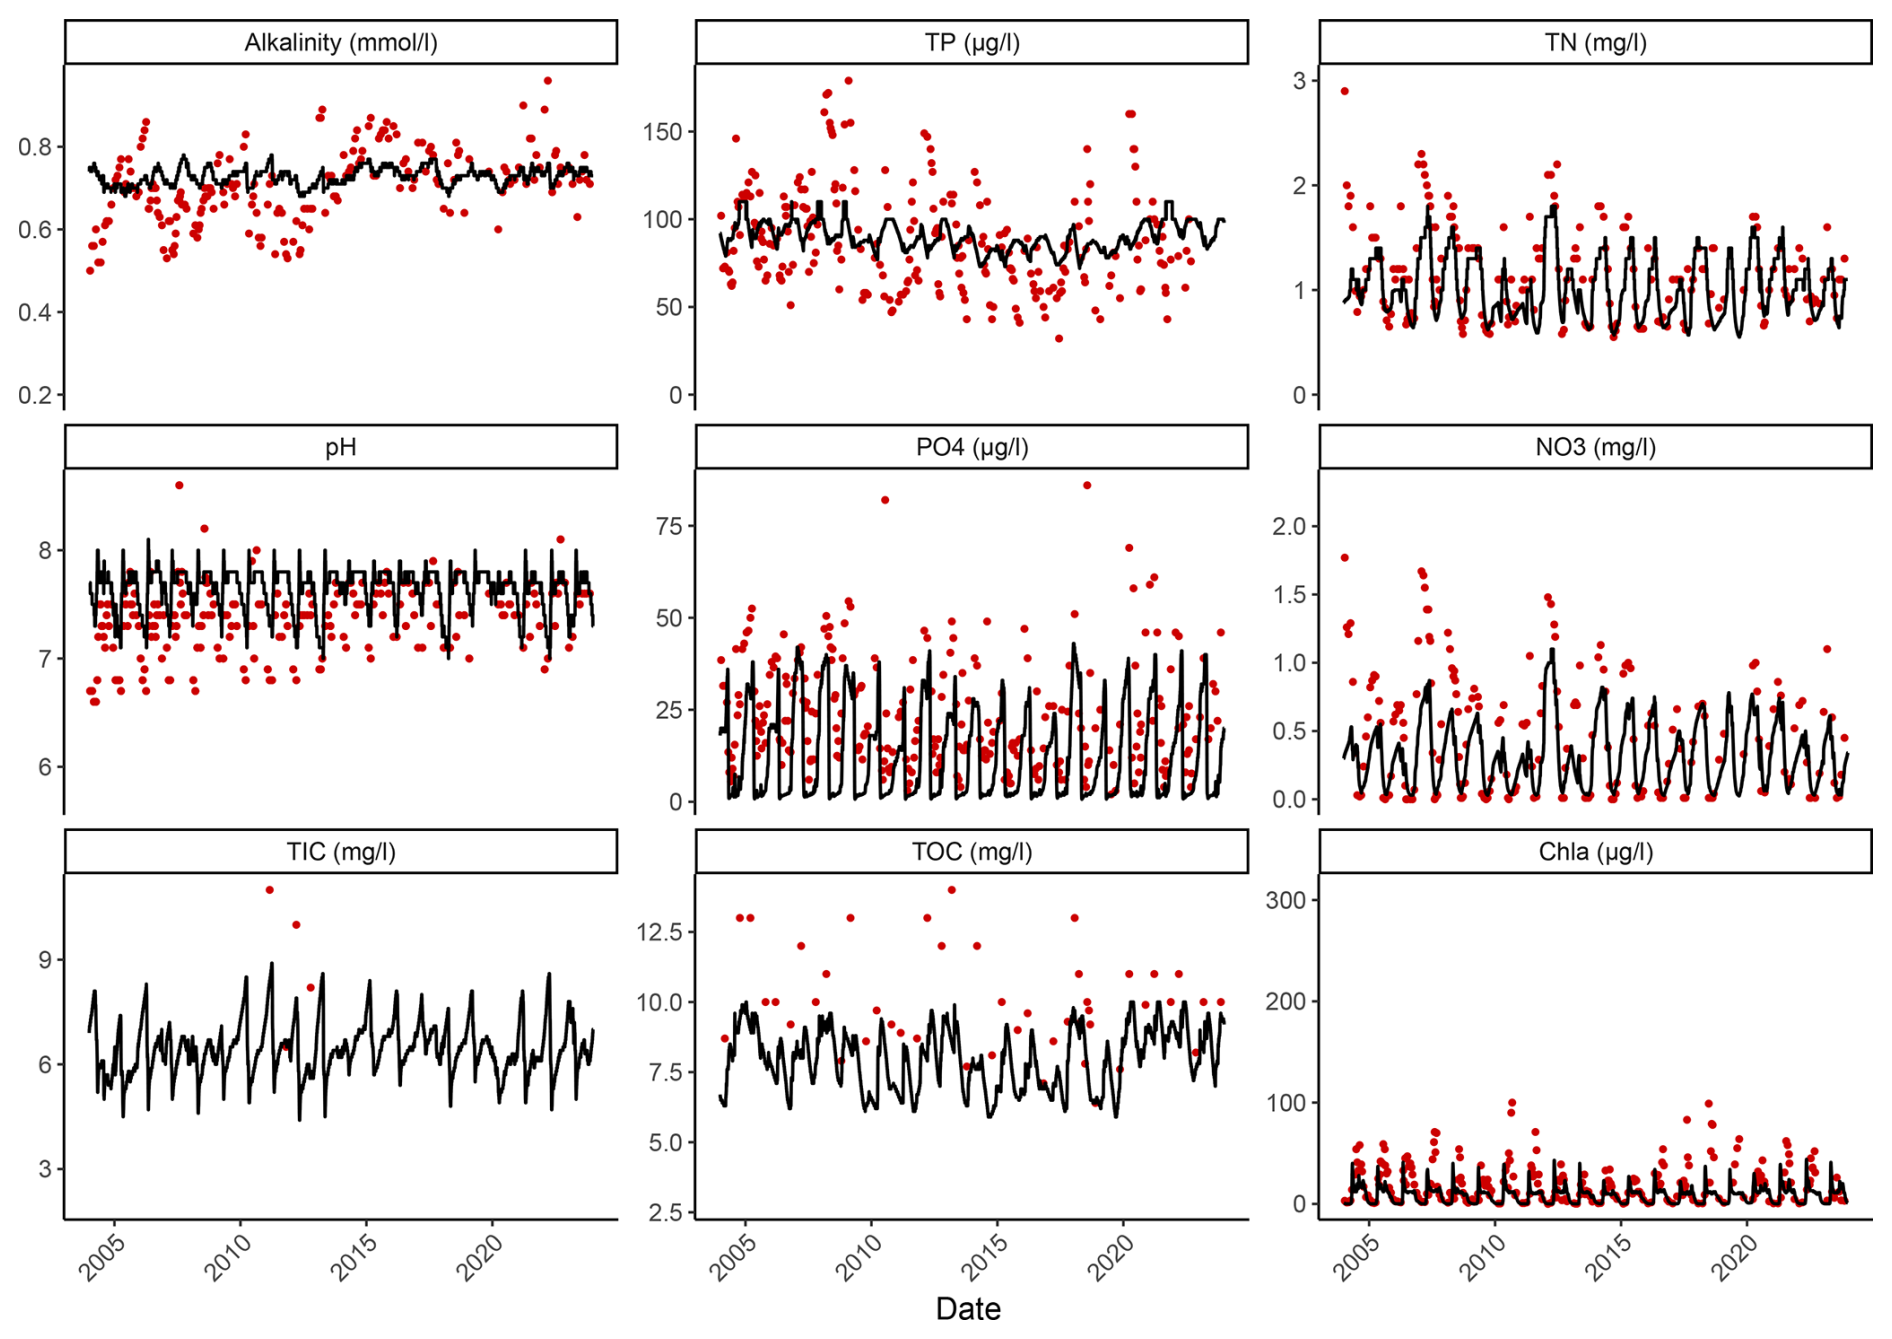
Figure 8Water quality in Tuusulanjärvi over the period 2004–2023 with observations (red dots) and simulations (black line) for alkalinity (mmol L−1), pH, total inorganic carbon (TIC, mg L−1), total phosphorus (TP, µg L−1), phosphate (PO4, µg L−1), total organic carbon (TOC, mg L−1), total nitrogen (TN, mg L−1), nitrate (NO3, mg L−1) and phytoplankton (Chl a, µg L−1).
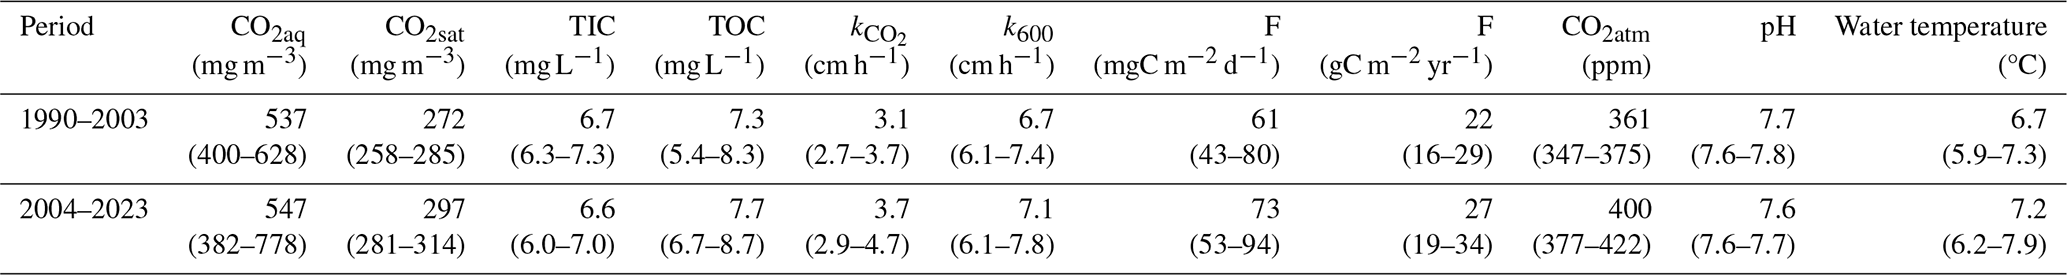
The average annual CO2 emissions (22–27 gC m−2 yr−1) simulated by Vemala have increased between 1990–2003 and 2004–2023 along with an increase of CO2 dissolved in the water from 537 to 547 mgC m−3 (Table 5). This result can mainly be explained by higher water temperature, lower pH and higher wind speeds in the second period with a k600 increasing from 6.7 to 7.1 cm h−1. The increase in the atmospheric CO2 from 362 to 400 ppm (Eq. 11) does not counterbalance the effect of wind, temperature and pH on the CO2 emissions between the periods (Table 5).
Table 5Annual average CO2 in the water (CO2aq in ppm), CO2 at saturation (CO2sat in ppm), total inorganic carbon in the water (TIC in mgC L−1), total organic carbon in the water (TOC in mgC L−1), CO2 transfer velocity at water temperature ( cm h−1) and at 20 °C (k600 in cm h−1), average daily (F in mgC m−2 d−1) and annual (F in gC m−2 yr−1) CO2 emissions to the atmosphere, atmospheric CO2 (CO2atm in ppm) and pH averaged over the calibration period 2004–2023 and validation period 1990–2003 as simulated by Vemala in Tuusulanjärvi.
4.2.3 Carbon emissions and long-term sedimentation
A simplified representation of the simulated average annual total carbon budget for the Tuusulanjärvi lake over the period 1990–2023 (Fig. 9) shows that most of the carbon (74 %) is flowing downstream of the lake (475 tC yr−1). However, a significant amount of carbon is released to the atmosphere annually (net emissions: 23 % or 147 tC yr−1 or 25 gC m−2 yr−1) while a smaller portion is sedimented on the long-term (3 % or 20 tC yr−1 or 3 gC m−2 yr−1). From the total carbon losses, TOC losses (108 tC yr−1) represent 30 % of the incoming TOC loading while TIC losses (65 tC yr−1) represent 24 % of the TIC loading to the lake. Primary production (PP) in the lake represents 200 tC yr−1, which is larger than the amount of CO2 net emissions from the lake. The PP is either sedimented (82 tC yr−1) or returned to the water as TOC (respiration, 105 tC yr−1) or exported as phytoplankton downstream (8 tC yr−1) before being mineralised back into TIC.
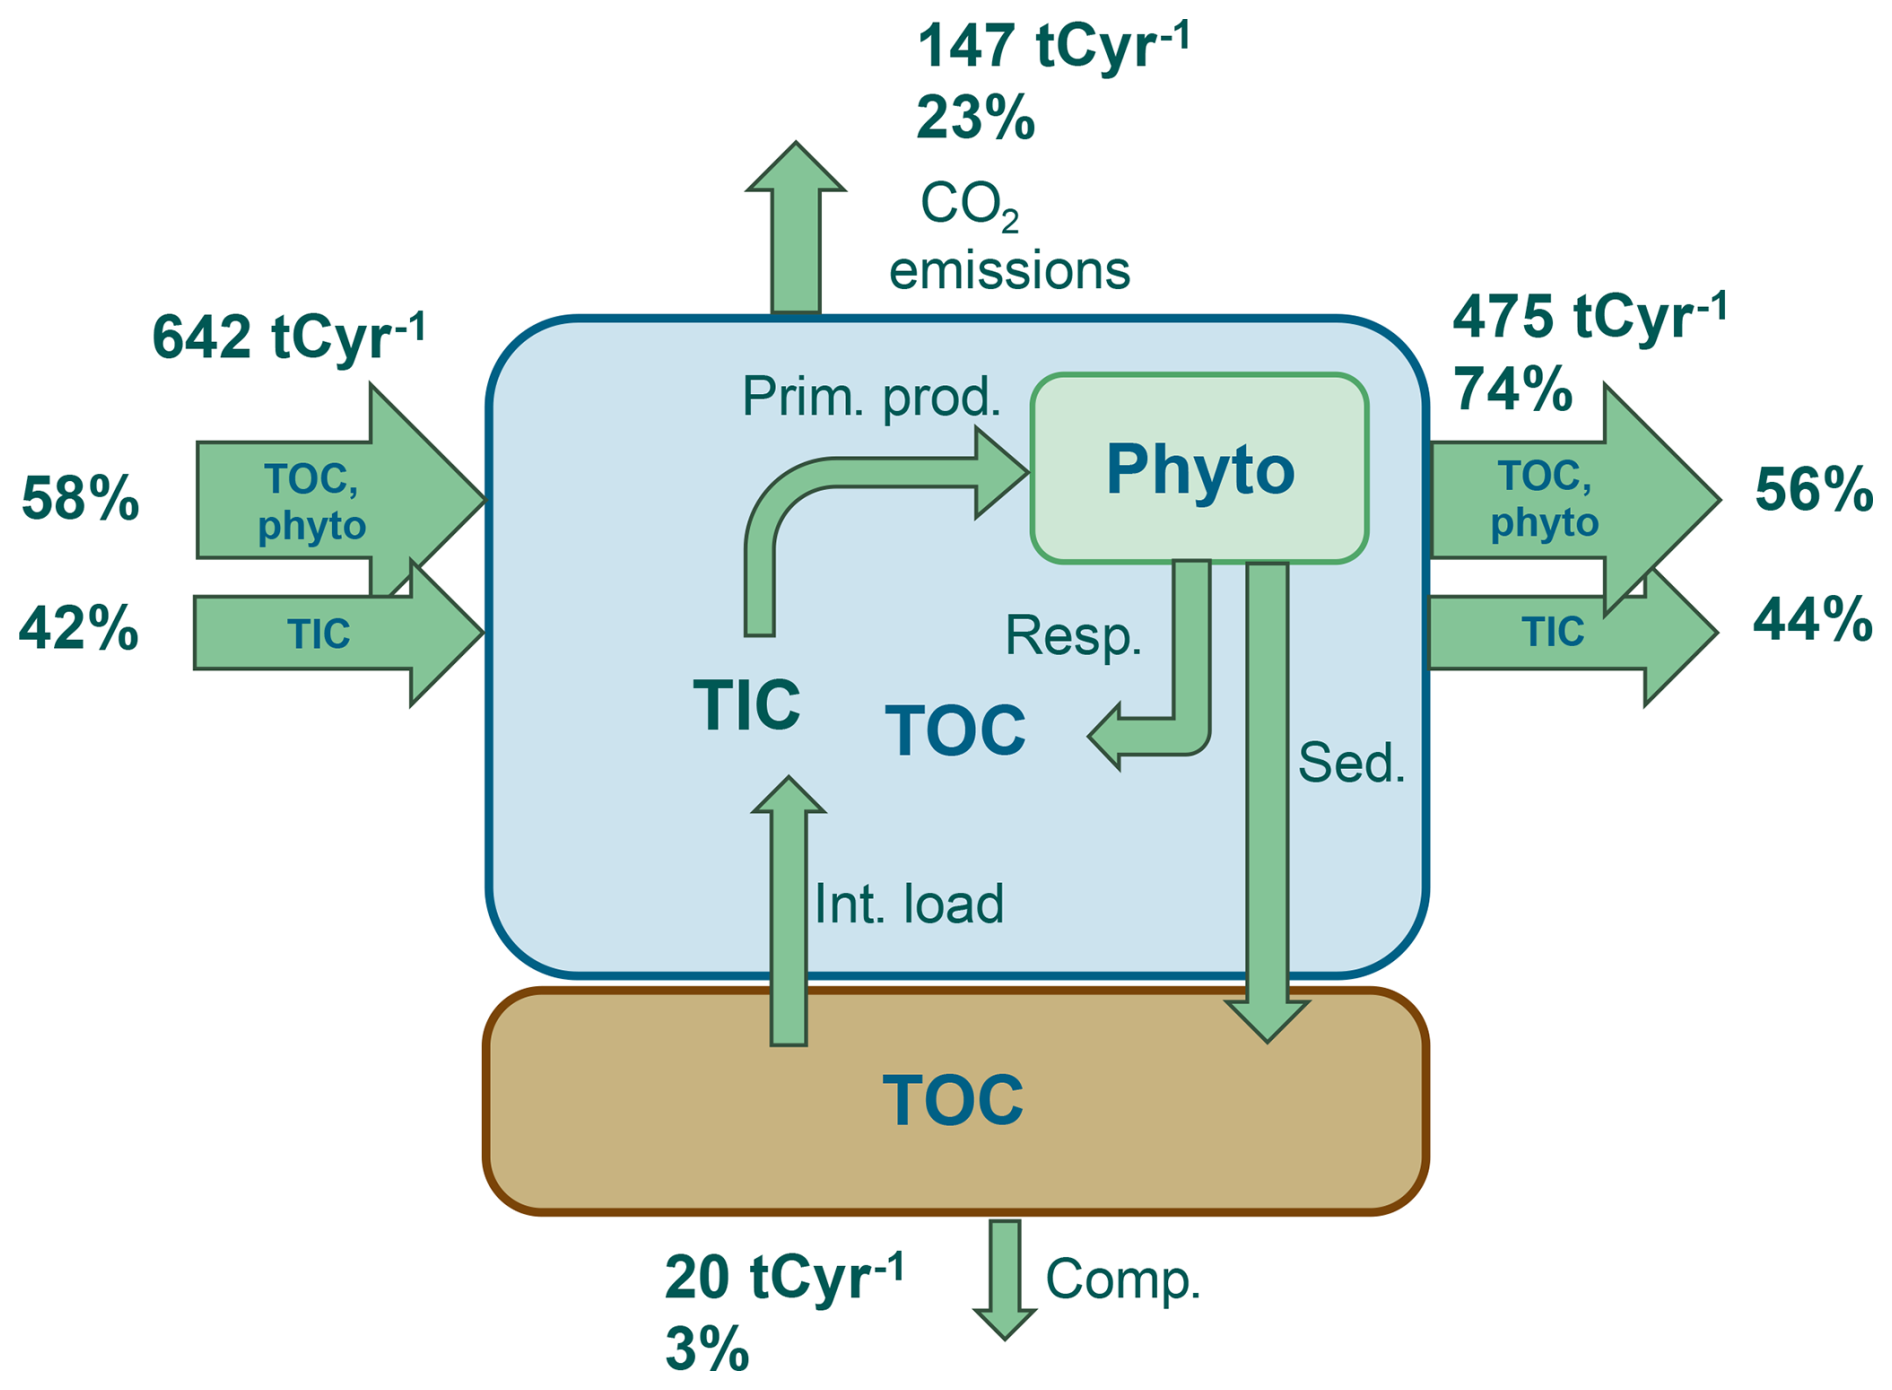
Figure 9Carbon budget simulated by WSFS-Vemala in Tuusulanjärvi over the period 1990–2023 with TIC (total inorganic carbon), TOC (total organic carbon), phyto (phytoplankton), Prim.prod. (primary production), Resp. (respiration), Sed. (sedimentation), Comp. (burial), Int. load (internal loading).
4.2.4 Sensitivity analysis
The simulations of Tuusulanjärvi water quality for the period 2004–2023 show low sensitivity to a ±20 % change in the CO2 transfer coefficient across the water-atmosphere interface. The resulting variations in TIC ranged from −0.6 % to +1.3 %, in TOC by approximately ±0.1 %, and in CO2 emissions by 0.3 %–2 % (Fig. 10). Similarly, a ±20 % change in phytoplankton growth rates had minimal impact on model outputs: TIC varied between 0.0 % and +0.3 %, TOC between −0.5 % and +0.5 %, and CO2 emissions increased by +0.8 % to +2 %. However, the new model is more sensitive to changes in mineralisation rates. A ±20 % variation in the mineralisation rate resulted in CO2 emissions changing by −7 % to +8 %. TOC concentrations were even more responsive, showing an opposite effect with changes of −8 % to +10 %, while TIC concentrations were moderately affected, varying between −3.5 % and +3 %.
A long-term goal for Vemala model development is to be able to simulate TOC and TIC leaching and transport at the national scale, involving model applications on all types of land use/soil classes and over a wide range of climatic conditions. This is important especially in a lake abundant country such as Finland, where carbon processes in a large number of lakes will be affected by changing climate and human actions including the implementation of water and climate related policies. Subsequent changes in carbon release and sedimentation in inland waters could then be added to estimates of the national carbon balance and formal GHG reporting processes.
5.1 TOC
In Vantaanjoki, the simulated TOC specific loading for different land use/soil classes compares well with values reported in the literature. Vemala simulates 3 tC km−2 yr−1 TOC load from agriculture on mineral soils, which is in line with Manninen et al. (2018) who reported 2.5–5.2 tC km−2 yr−1 DOC load from cultivated fields on mineral soils. The DOC load has been reported to increase with increasing topsoil carbon content (Manninen et al., 2018). Vemala simulates a TOC load of 3.6 tC km−2 yr−1 from forests on mineral soils, which corresponds with Rantakari et al. (2010) findings 2.3–4.0 tC km−2 yr−1 of TOC load from forests on upland soils. TOC load from peat soils varies over a wide range depending on whether it is natural or drained, nutrient rich or oligotrophic and of the thermal gradient from south to north. Mean simulated TOC load for Vantaanjoki catchment from natural and drained peat soils were 7.8 and 9.2 tC km−2 yr−1 respectively, which are lower than 10.1 and 16.8 tC km−2 yr−1 calculated by export coefficient equations based on temperature sums for Vantaanjoki (Finér et al., 2021).
There is an increasing trend in both simulated and observed TOC concentrations in Tuusulanjärvi for the period 1990–2023. Observed mean TOC concentrations in 1990's has increased by 16 % for the decade 2010–2020. The increasing TOC trends in various waterbody types, streams, lakes, rivers and coastal waters, has also been reported in Finland by Räike et al. (2024). According to Räike et al. (2024), the main reasons for increasing trends of TOC transport to waterbodies are decrease in acid sulphate deposition, increase in temperature, runoff, tree biomass and management of drained peatlands. According to the Yasso07 model simulations, total litter fall input to the forest soils has increased by about 10 % since 1990's (Lehtonen and Heikkinen, 2016). Although, there is practically no new peatland drainage being carried out in Finland; remedial drainage is still conducted, and previously drained peatlands continue to be managed for forestry, both of which contribute to increased TOC leaching. Already performed peatland drainage has possibly a long-term effect on increasing TOC trends (Nieminen et al., 2021).
5.2 TIC and alkalinity
Vemala performs well in simulating the loads of TIC, alkalinity and pH over both the calibration and validation periods with NSE higher than 0.6 at the outlets of Tuusulanjärvi and Vantaanjoki. There is however, one exception, with the NSE calculated for alkalinity over the validation period being negative (−0.5). In Tuusulanjärvi and Vantaanjoki, the observed alkalinity increase between the calibration and validation periods can be partly explained by an increased buffer capacity of freshwaters following a decrease in acid deposition (e.g. Vuorenmaa, 2007; de Wit et al., 2016) from the late 1980s onwards. Sulphate deposition load declined significantly by 60 %–70 % over the period 1986–2003 in southern Finland (Vuorenmaa, 2007). In addition, soil weathering rates are sensitive to increasing temperatures, with predicted increases in alkalinity and pH of Finnish surface waters under climate change scenarios (Aherne et al., 2012). The Vemala model simulates alkalinity as a conservative tracer and therefore does not consider the above secular changes due to acid deposition and temperature. Moreover, it omits the impact of nitrification, denitrification and other processes affecting alkalinity as implemented in other carbon models (e.g. Marescaux et al., 2020). The importance of these processes on the overall alkalinity model would however be limited with findings from Marescaux et al. (2020) showing a contribution to alkalinity export from instream processes of less than 4 %. At this stage of the model development, it is thus justified to simulate alkalinity in the river network as a tracer. Vemala must rely on variables with national coverage for its development at the national scale, however observed TIC dataset (VESLA, Syke) is very limited. Thus, alkalinity that is well correlated with TIC and is supported by comprehensive monitoring data across Finland is a good proxy to simulate TIC in Finland.
The TIC loading at the outlet of the catchment is well simulated, although TIC concentrations overall are underestimated in Vemala. In Tuusulanjärvi, some of the tributaries are presenting an increased TIC concentration in the summer up to 27 mgC L−1, while others present a low concentration throughout the year. In our model, TIC input loading is associated with rock weathering using alkalinity and soil types rather than accounting for mineralisation of organic carbon in the soil. TIC load from bedrock and clay soils is higher than from coarse soils (sand and silt) as analysed from well waters in Finland (Korkka-Niemi, 2001). Elevated summer concentrations can be explained by elevated groundwater flow, point sources from urban areas or wastewater treatment plants. Runoff from agricultural land may increase DIC loading compared to forested land due to liming. In Sweden, Humborg et al. (2010) estimated that 4 % of the carbonate and bicarbonate export to the sea in Sweden was from pollution, mainly from liming of agricultural land, which covers 8 % of Sweden. However, it is difficult to assess the extent of the liming effect on agricultural land on the stream water pH and thus inorganic C dissolved in the water (Huotari et al., 2013). Point sources of TIC are not included in this model nor is the mineralisation process producing DIC in the soil at this stage of the model development. Overall, the simplified representation of TIC loading based on soil types and runoff in Vemala represents well the variability of TIC loading between different catchments as well as the intra-annual variability of TIC concentrations, even though the overall loading is underestimated. In the future, the terrestrial TOC model could be coupled more tightly with the TIC model to simulate mineralisation processes and greenhouse gas emissions from land areas.
5.3 CO2 emissions
The simulation of the transfer velocity of CO2 across the water-air interface, represented by k600, is crucial in the calculation of CO2 emissions and requires the introduction of physical/topographic features like wind speed and water velocity to reduce the uncertainty associated with k600 estimates at the catchment scale (Alin et al., 2011; Rocher-Ros et al., 2019). In this study, k600 was defined separately for lakes and rivers and correlated respectively to wind speed (Jonsson et al., 2008) and water velocity (Alin et al., 2011). Average values of k600 in Tuusulanjärvi over both periods (k600=6.1–7.8 cm h−1 annual averages) are comparable to other measurements from lakes like Heiskanen et al. (2014) who calculated an average k600 of 7 cm h−1 in a small boreal lake during autumn. Alin et al. (2011) presented a k600 range between 5–55 cm h−1 in rivers with a water velocity between 0.05–1 m s−1. In Vantaanjoki, the average water velocity ranges between 0.02–0.35 m s−1 over the period 1990–2023 (WSFS-Vemala, Syke, 2025f), resulting in a range of k600 between 14–26 cm h−1. This is below the range used to characterise rivers in Sweden (k600=26–64 cm h−1, Humborg et al., 2010), however, the velocity in the Swedish streams was much higher, ranging from 1–4 m s−1, which would explain our lower estimates of k600.
The average annual CO2 emissions rate for Tuusulanjärvi of 25 gC m−2 yr−1 is comparable to other studies, for instance, using the equation related to open water rainfall from Rantakari and Kortelainen (2005) provides an average annual CO2 emission rate of 24 gC m−2 yr−1. Our estimate also compares to other studies like the estimate, based on continuous CO2 concentrations in the water (April 2005–October 2006), of 30–44 gC m−2 yr−1 from a meso-eutrophic, slightly acidic headwater lake in southern Finland (Huotari et al., 2009). However, our estimate is about half the estimate for its lake size class (1–10 km2) of 56 gC m−2 yr−1 but corresponds to a lake class with an area greater than 100 km2 in the study from Kortelainen et al. (2006). Kortelainen et al.'s study did not account for residence time, eutrophication or acidity levels that can considerably influence carbon emissions from lakes.
The overall river network carbon emissions of 223–260 gC m−2 yr−1 were low compared to calculations based on the size of the rivers like in Humborg et al. (2010: 473–3032 gC m−2 yr−1, depending on the Strahler stream order). This discrepancy can first be explained by the discrepancy in the average velocity of rivers between the two papers as we have presented with the k600 values. These high emissions have also been reported by Rocher-Ros et al. (2019: median 1290 and mean 2790 gC m−2 yr−1) or Raymond et al. (2012: mean 3358 gC m−2 yr−1). However, in peat areas, lower CO2 emissions have been reported like Rocher-Ros et al. (2019: 40 gC m−2 yr−1) or Dinsmore et al. (2010: 39 gC m−2 yr−1). TIC concentrations in Finnish waters can play a role in the lower estimates of CO2 emissions. Indeed, in boreal environments DOC flux represents up to 80 % of the carbon export to the Baltic Sea (Räike et al., 2016), while worldwide DIC export to the Sea is equivalent to DOC (Hope et al., 1994) and can even represent up to 80 % of the carbon flux in UK rivers (Jarvie et al., 2017). In boreal catchments characterised by non-carbonate bedrocks, inland waters are low in alkalinity and in inorganic carbon explaining the lower CO2 emissions. Finally, the lower estimates of carbon emissions in the streams could also be explained by an underestimation of TIC in the water column. The underestimation of TIC is due to a simplification of the TIC loading, which is in this model based uniquely on soil types and not incorporating the added diffuse sources of TIC from agriculture, peat or urban areas, nor the point sources like wastewater treatment plants.
5.4 Lake carbon budget
The older version of the Vemala model, simulating TOC only as a separate variable and including a retention term for both carbon emission and carbon sedimentation in the lake, simulated a TOC retention of 108 tC yr−1 equivalent to 20 % of the TOC loading to the lake (Vemala, Huttunen et al., 2016). This value is lower than the combined total carbon loss from the lake in our new estimates (147 tC yr−1) that includes not only carbon retention in the sediments but also carbon emissions to the atmosphere. Thus, over a third of the total carbon loss is omitted in the previous version of the model showing the importance of simulating TIC as well as TOC in carbon emission calculations. In this simulation, a large part of the total carbon is sedimented through phytoplankton sedimentation. However, only a relatively small fraction undergoes long-term burial (3 % of TC), referred in this model as “compacted”, thus most of the sedimented TOC is mineralised in the surface of the sediments and returns to the water column as TIC. The capture of carbon in the sediments (3 gC m−2 yr−1) is lower than in other lakes of similar sizes (1–10 km2: 7.2 gC m−2 yr−1) according to Pajunen (2000). The carbon cycling in inland waters has significantly changed due to human activities (Tranvik et al., 2009) and this link should be further explored using this model. It would be important to expand this study to the national scale to get the total estimate of carbon balance and flows in the aquatic environment, taking into account the variety in characteristics and loading of lakes and rivers. This would improve currently available estimates on GHG fluxes from Finnish surface waters, which are based on generalised emission coefficients (Holmberg et al., 2023). Evaluation of the regional-scale impacts of future changes in climate or land-use could also be improved (e.g. Forsius et al., 2017). Water residence times and nutrient concentrations are key predictors for organic carbon reactivity and CO2 emissions from inland surface waters (Evans et al., 2017). WSFS-Vemala through its biogeochemical submodel links nutrients to phytoplankton growth and carbon cycling in inland waters to further study these fundamental links between eutrophication and GHG emissions in the future.
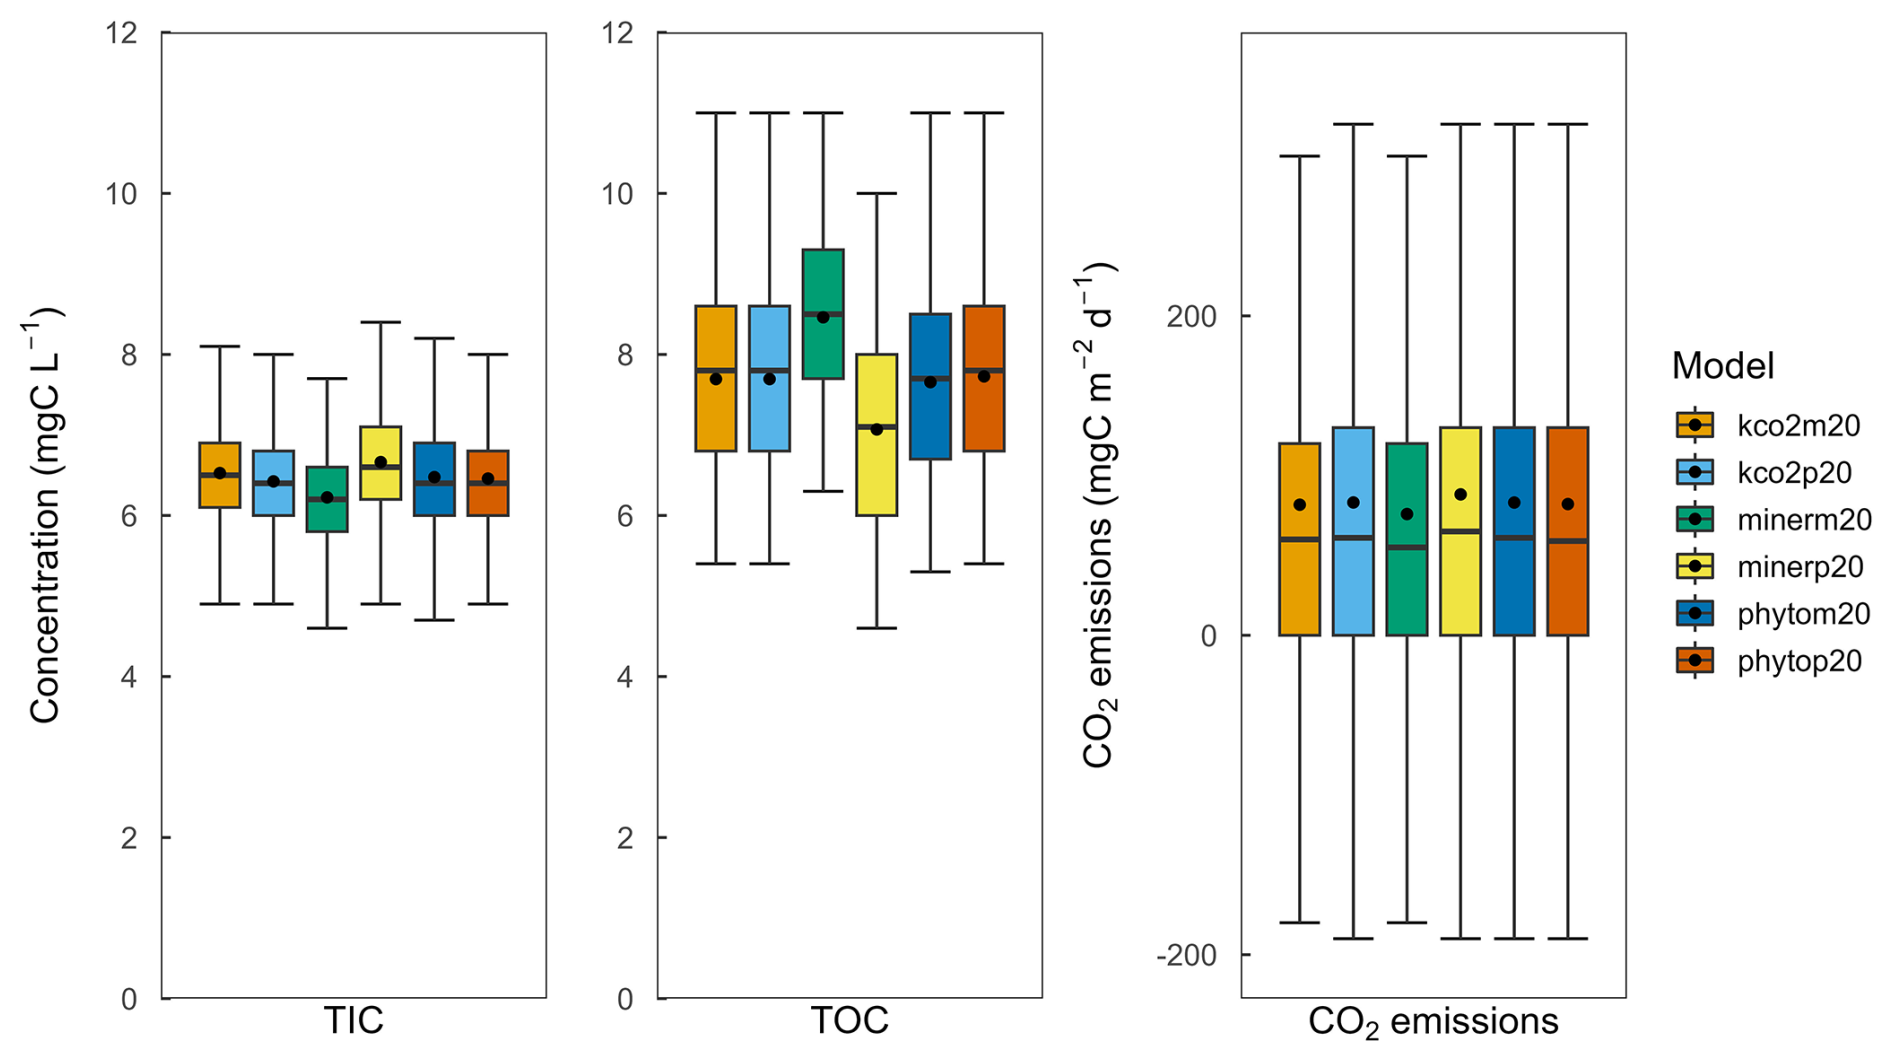
Figure 10Sensitivity analysis of daily total inorganic carbon (TIC in mgC L−1) and total organic carbon (TOC in mgC L−1) concentrations in the water, and daily CO2 emissions to/from the atmosphere (F in mgC m−2 d−1) to an increase/decrease of the mineralisation rates (minerp20/minerm20), of the phytoplankton growth (phytop20/phytom20) and of the CO2 exchange rate (kco2p20/kco2m20) by 20 % over the period 2004–2023. The mean is represented by the black dot.
5.5 Sensitivity analysis
In the Vemala biogeochemical model, mineralisation is at the core of the carbon cycling in the water, which explains the sensitivity of the model to this process (Fig. 10). The mineralisation process is simulated as affected by temperature following a sigmoid function (Korppoo et al., 2017). Future climate change scenarios will thus have an impact on the simulated mineralisation dynamics in the aquatic ecosystem. Mineralisation not only influences carbon dynamics but also affects nutrient availability and phytoplankton growth, making it a key driver of biogeochemical interactions in the system. The co-dependency of various variables to the mineralisation rates allows for a reduction in the uncertainty of the calibrated parameters as mineralisation rates are calibrated to fit not only TOC but also organic nitrogen and phosphorus. This demonstrates the benefit of deterministic process-based models that rely on well documented enzyme reaction rates as well as the simulation of interconnected variables affected by the same processes in the aquatic ecosystem. The sensitivity analysis highlights the performance of the model to represent well all variables in the water column considering the sensitivity of each output to each calibrated parameter.
The development of the carbon processes in WSFS-Vemala model presents a significant advancement in simulating carbon dynamics, particularly in capturing both TOC and TIC processes and their contributions to carbon retention and emissions through a river/lake network. This model is especially relevant in boreal catchments where TIC and TOC are mostly under a dissolved form. This improved representation of carbon cycling in Vemala, linked with phytoplankton growth and nutrient cycling, allows for the distinction between carbon losses to the atmosphere and long-term carbon storage in the sediments of inland waters. The model's ability to simulate TOC loading across various land use/soil types and TIC loading across soil types aligns closely with reported literature values, demonstrating its applicability in diverse climatic and geographical settings. Moreover, the addition of organic acids to the total alkalinity definition improved pH simulations and thus CO2 emissions in acidic and organic rich waters like in Finland. The model's performance in estimating CO2 emissions shows good correlations with established ranges for rivers and lakes. The inclusion of sedimentation and mineralization processes in the lake carbon budget underlines the necessity of accounting for both organic and inorganic pathways in carbon modelling.
Future development efforts for Vemala model should aim at linking the TOC and TIC terrestrial submodels to represent TIC leaching from rock weathering and mineralisation in soils as well as CO2 emissions from land areas. This is important especially in a lake abundant country such as Finland, where carbon processes in a large number of lakes will be affected by changing climate and human actions including the implementation of water and climate related policies. Overall, the enhanced Vemala model provides a robust foundation for understanding carbon cycling and supporting sustainable, integrated water resource management and climate change scenario assessments from sub-catchments to the national scale. Subsequent changes in carbon release and sedimentation in inland waters could then be added to estimates of the national carbon balance and formal GHG reporting processes.
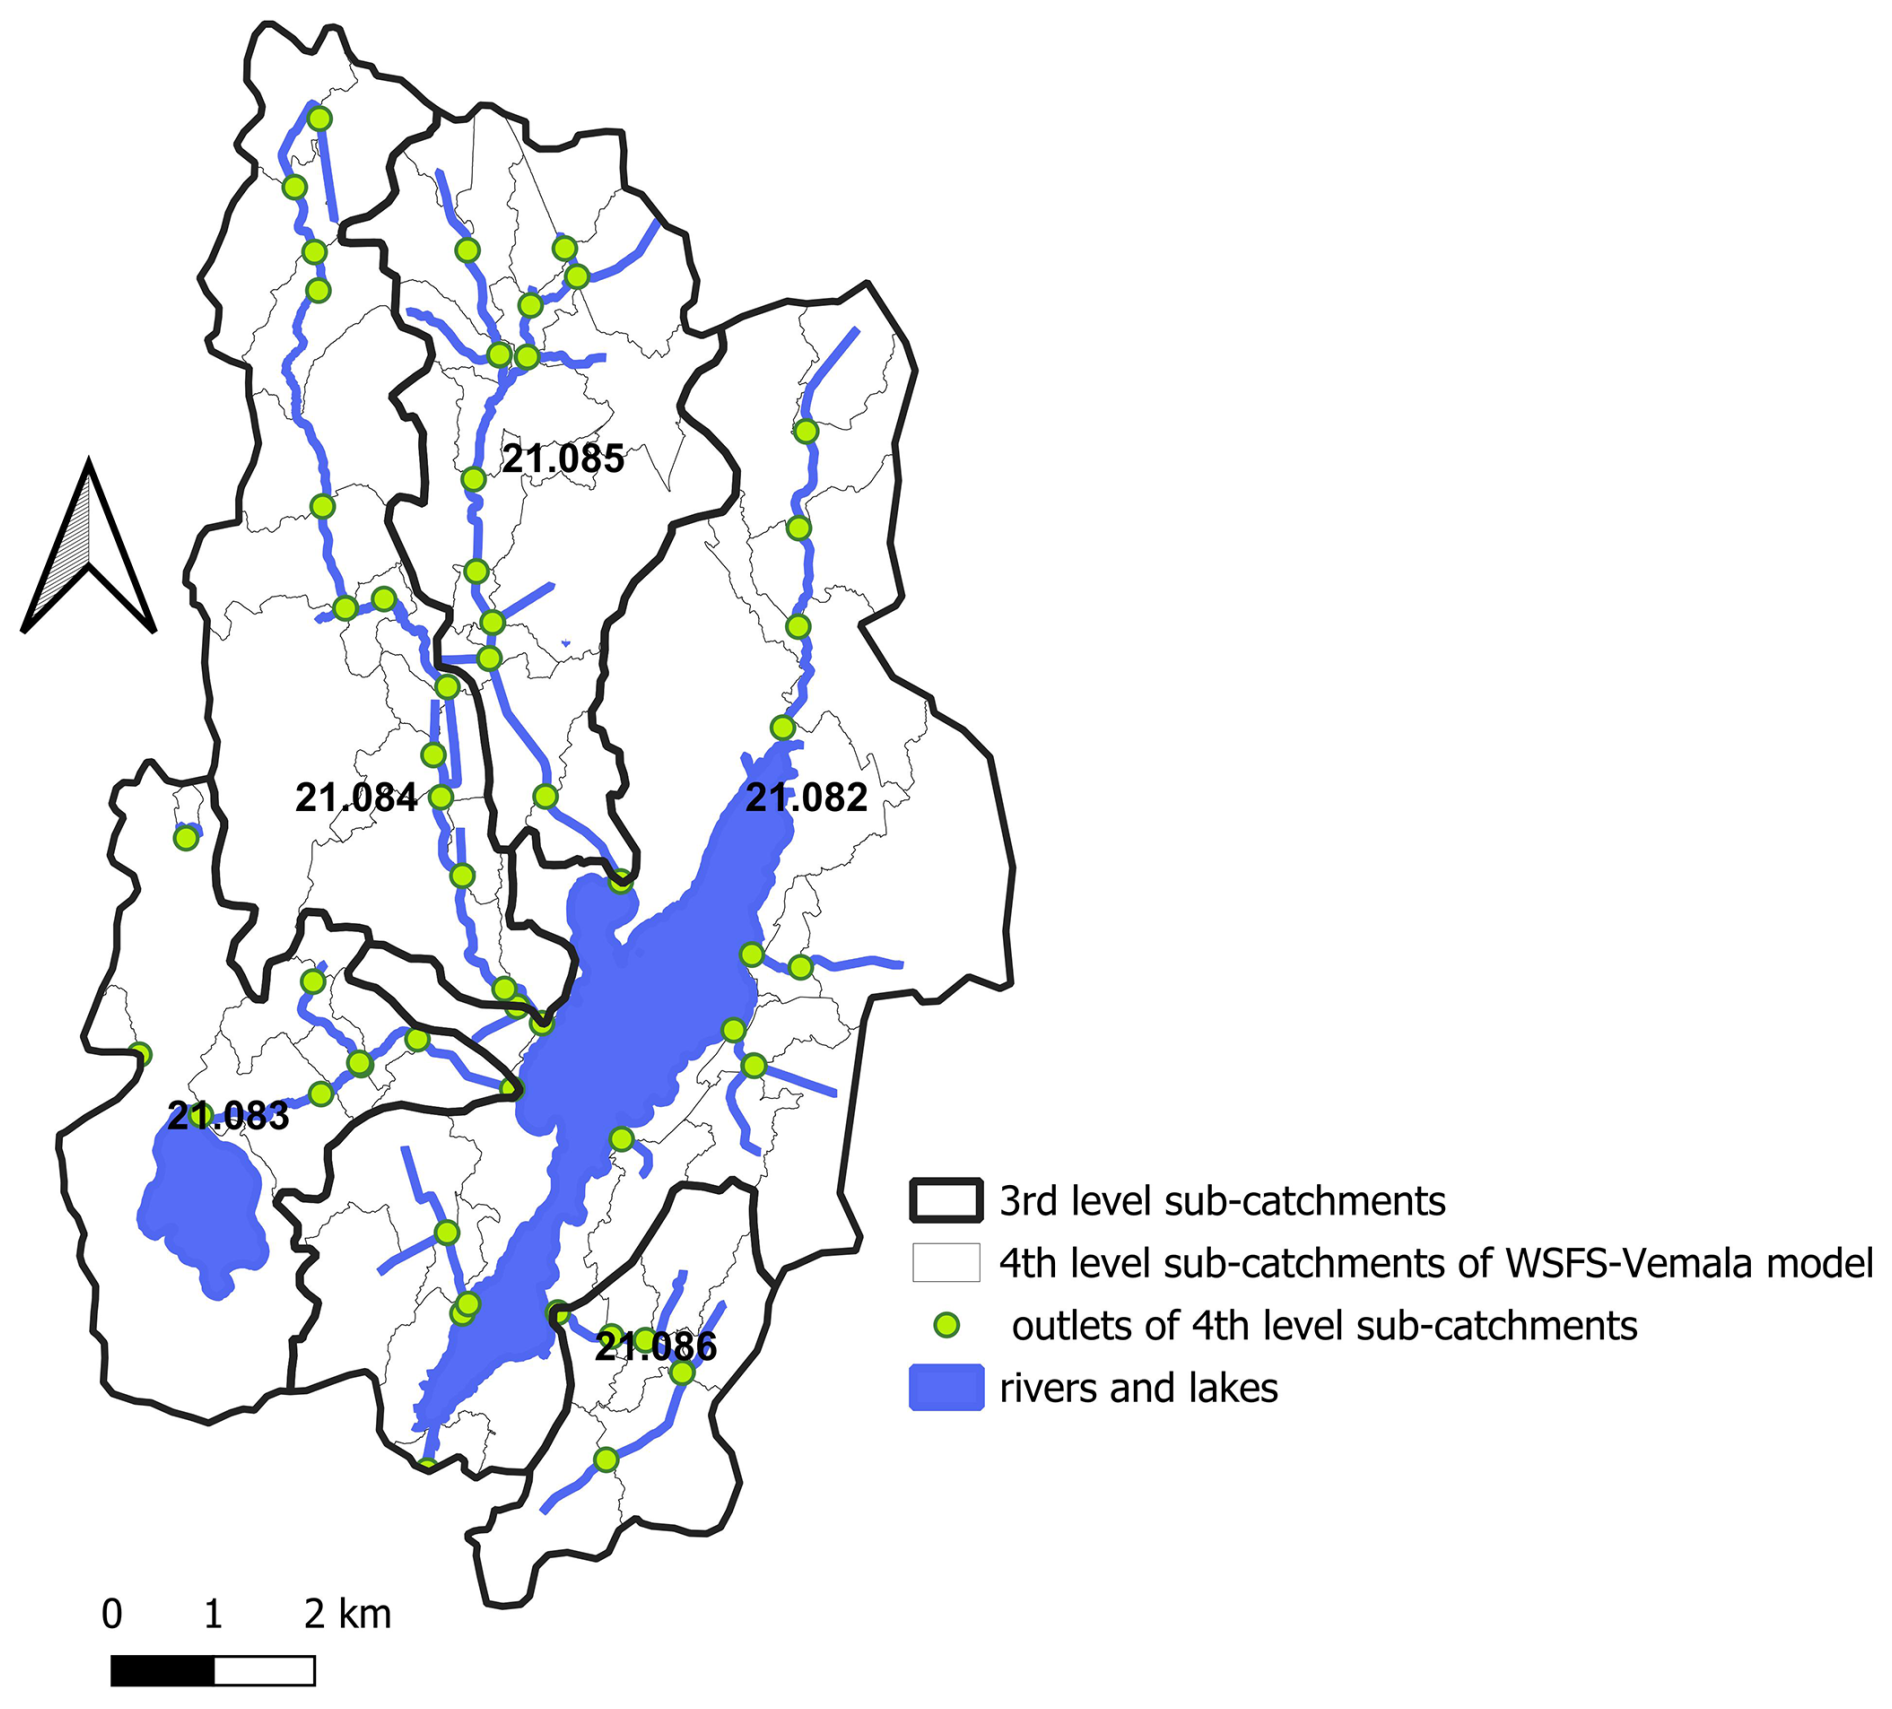
Figure A13rd and 4th level sub-catchments including rivers and lakes (blue) and the outlets of the 4th level sub-catchments (green dots) describing the river routing in Tuusulanjärvi catchment. (Source: WSFS-Vemala, Syke, 2025f).
Calculation of the initial C content in soils
The C content calculation is performed at the national scale since the WSFS-Vemala TOC model is applied at this scale. The C content calculation in mineral agricultural soils is based on field parcel data from Soil testing laboratory Viljavuuspalvelu oy which contains soil organic matter (SOM) class (vm – low, m – medium, rm – rich, erm – very rich, mm – mull, Tm – peat soil). Only the 5 first classes are for mineral soil and were used in creating C content for mineral soils. Only 40 % of fields have observations, so the mean C content for 3rd level subcatchments for clay or for coarse soils was extrapolated based only on 40 % of observed data.
Table B1Soil organic matter classes according to soil type(mineral/organic) and soil organic matter percentage (Lemola et al., 2018).
The methodology was as follow:
-
the mean SOM content in % for the top soil for each class was obtained from LUKE report (Lemola et al., 2018, see the Table B1)
-
the area of agricultural clay soils and coarse soils for each 3rd level subcatchment was estimated,
-
the mean SOM content for clay and coarse soils separately was estimated, and then weighted mean SOM content for 3rd level subcatchments was estimated,
-
SOM content 1000 kg ha−1 is calculated using bulk density of the mineral soils and SOM content,
-
it is assumed that SOM content in the 0–1 m deep soil (Mg ha−1) is decreasing exponentially with the layer depth. The van Bemmelen factor of 0.58 was used to convert SOM data to SOC. Corresponding values for Vantaanjoki catchment are 180–200 Mg C ha−1.
pH model
Solubility of CO2 is defined by Weiss (1974):
Where K0 is expressed in moles kg−1 atm and T the temperature in Kelvin.
Alkalinity is defined as the ability of water to neutralize acids. The expression to calculate alkalinity in this paper using both TIC and TOC is given by:
With,
With DOCH3 omitted from the following equations as its process is outside the range of freshwater pH (pKa = 3.04, Hruska et al., 2003).
The dissociation of water is determined by:
With Kw, in mol kg−1, the dissociation of water given by the adaptation of Millero's (1995) equation for freshwater:
The first dissociation constant of carbonic acid is given by:
and the second dissociation constant is given by:
For low salinities, as in freshwater, the equations valid for low salinities (below a salinity of 5) from Millero (1995) can be used:
With K1 and K2 in mol kg−1 and T the temperature in Kelvin
The dissociation constants of TOC are given by Hruska et al. (2003):
Solving analytically for protons the alkalinity equation (C3) the polynomial resulting equation is:
With,
The Eq. (C13) is solved using the Newton-Raphson algorithm.
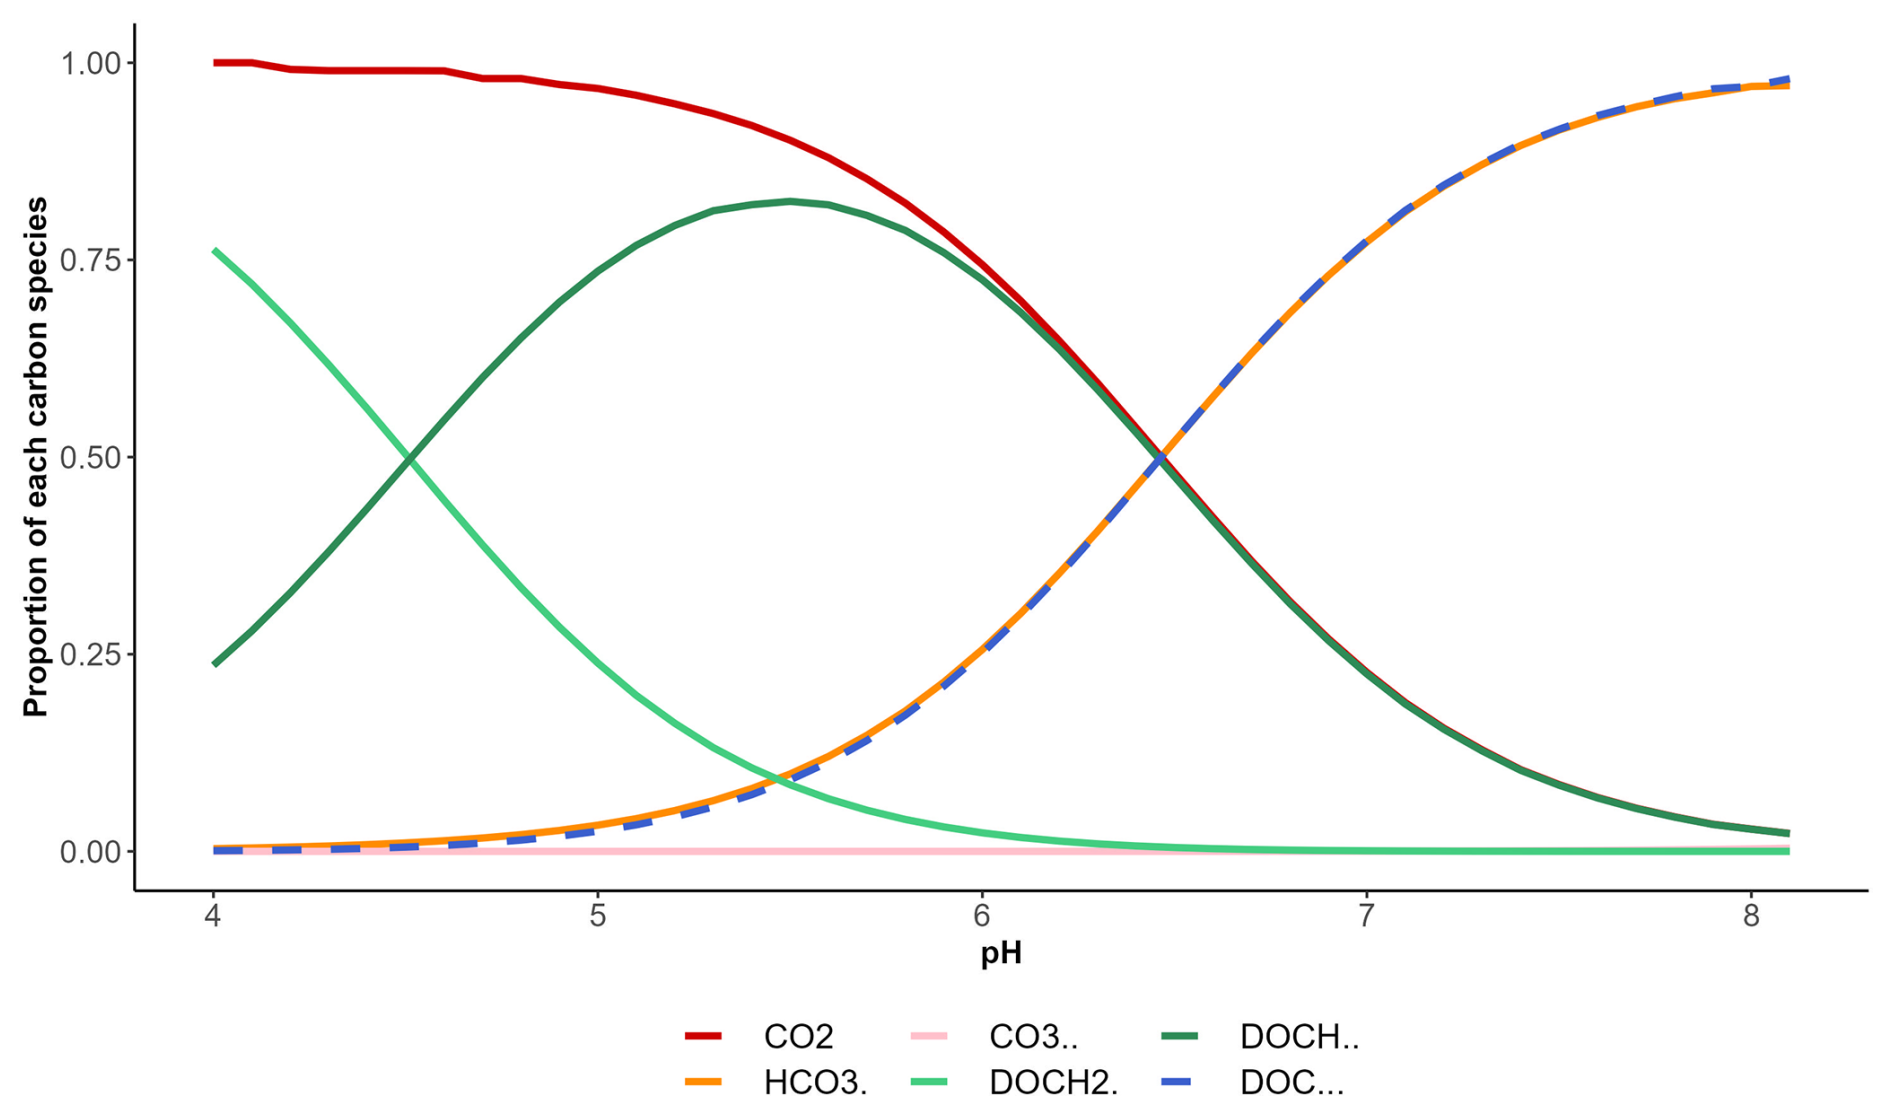
Figure C1Carbon species proportion for both dissolved organic carbon (DOCH light green, DOCH2− green, and DOC3− dashed blue) and dissolved inorganic carbon (CO2 red, HCO orange, CO pink) depending on pH.
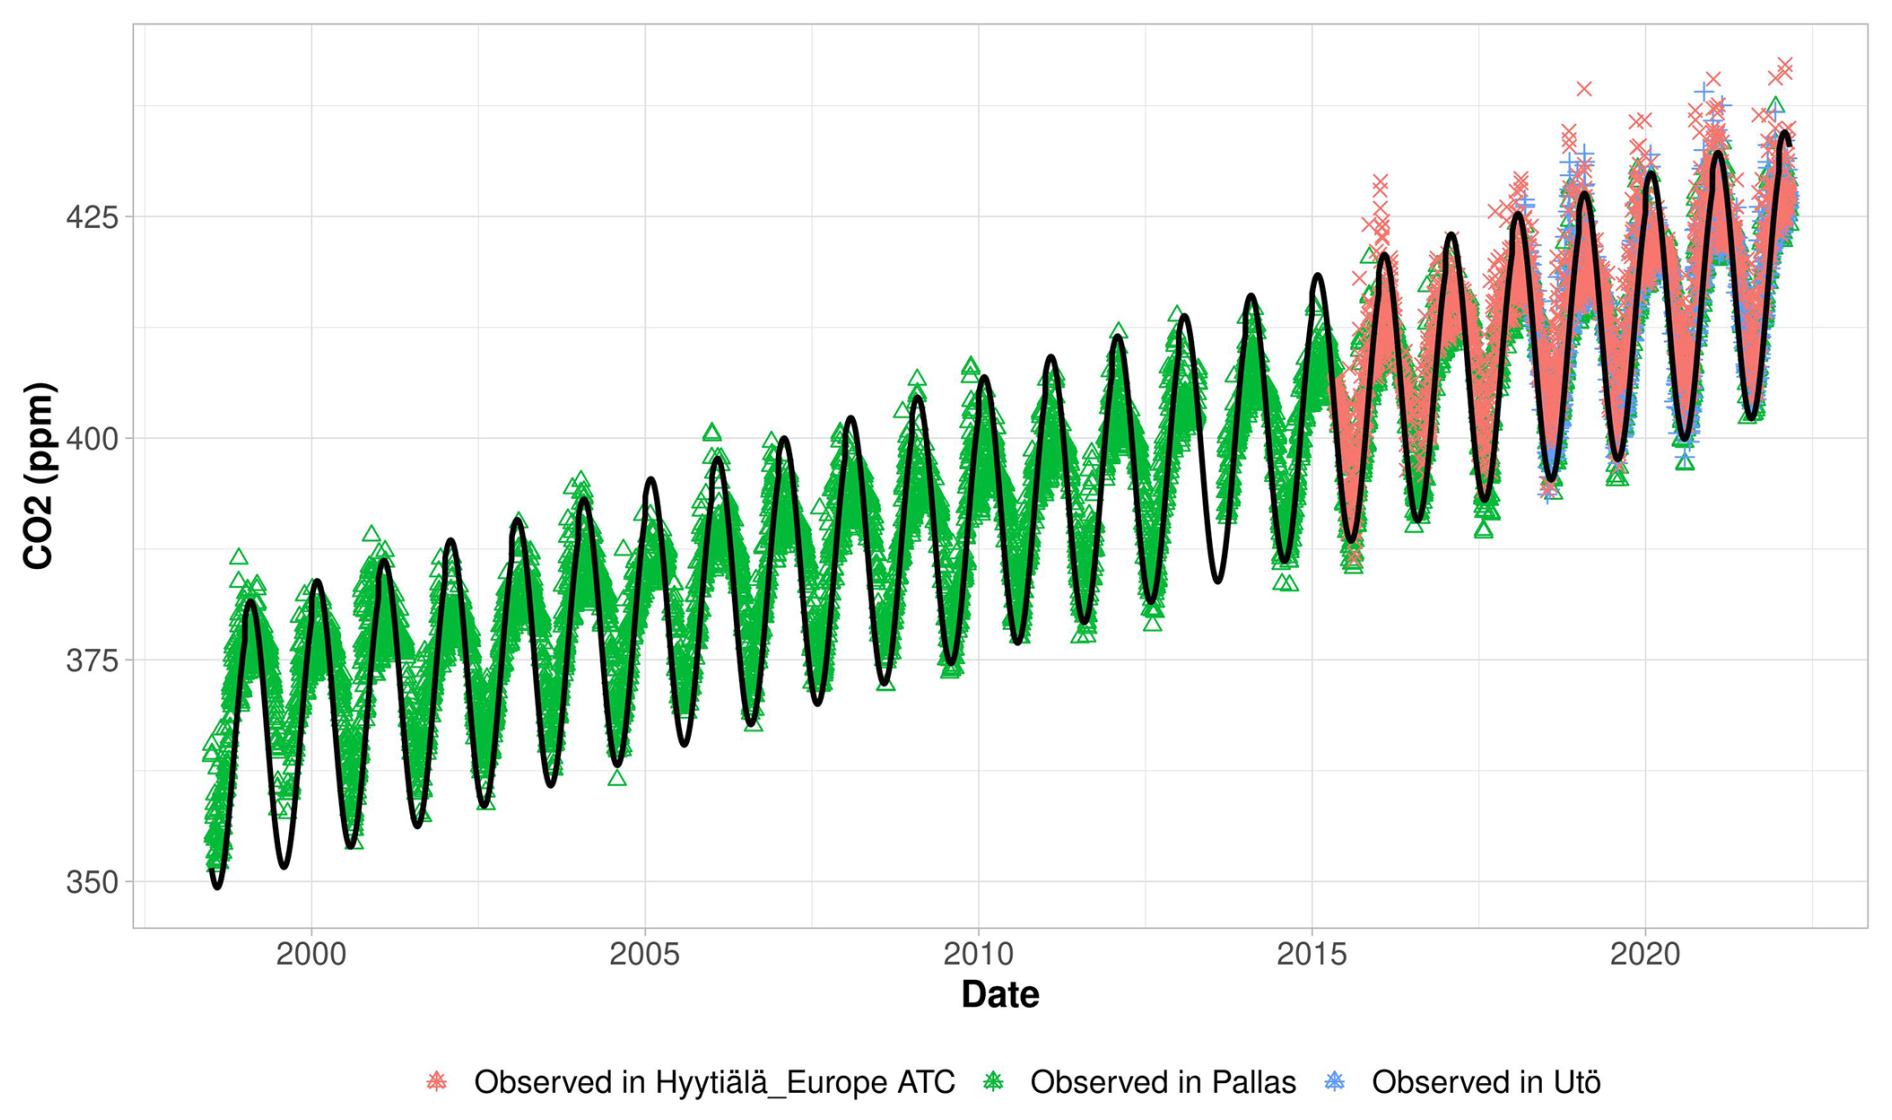
Figure C2Atmospheric CO2 (ppm) as recorded at the Finnish weather stations of Hyytiälä (pink marker), Pallas (green marker) and Utö (blue marker) compared with the simulated atmospheric CO2 (black line, Eq. 11) (Source: Integrated Carbon Observation System ICOS RI, licensed under CC4BY).
Table D1Annual exports of TOC (kgC ha−1 yr−1) used in the first step of Vemala TOC model calibration.
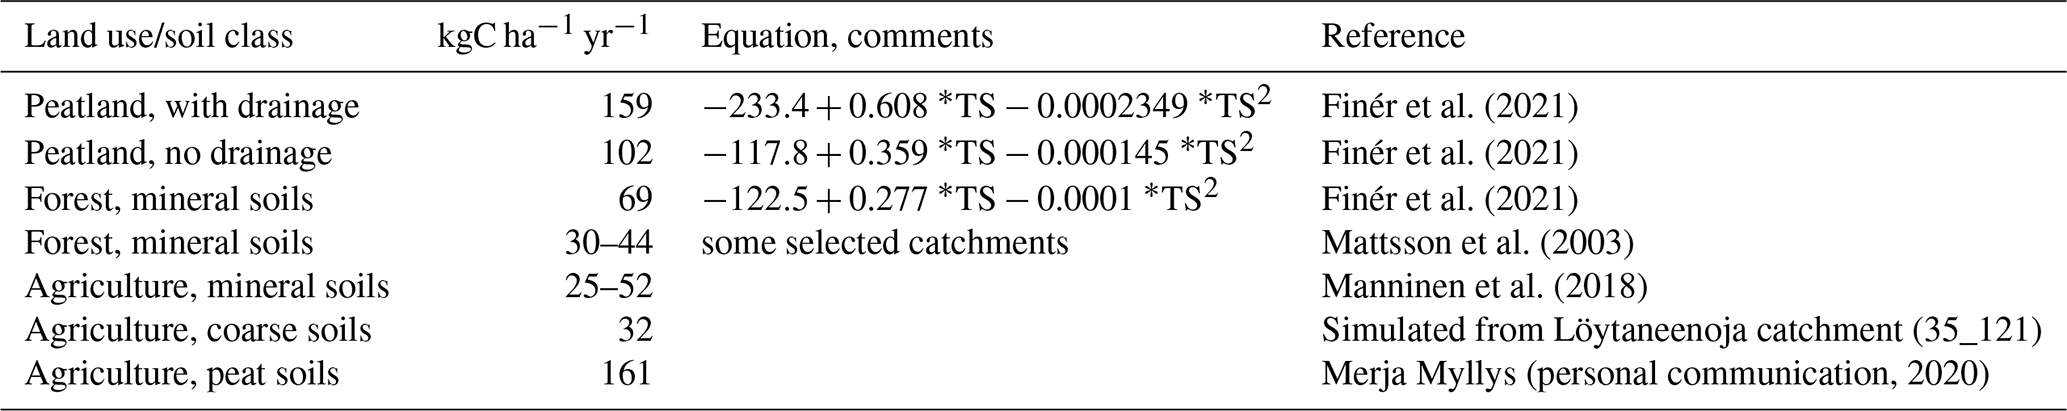
* TS – Temperature sum (day degree, °C) = 1372 °C for Vantaanjoki catchment.
Table D2Land use and soil types in the upstream catchment of the tributaries and outlet of Tuusulanjärvi lake. The soil types Vertic Cambisol represents clay, Dystric Leptosol represents rock, Haplic Podzol 2 represents sand and Haplic Podzol 1 represents till as characterized by the lower soil layer.
Code and data generated in the present study will be made available on request.
MK, IH and MH developed the model code, MK and JS designed the sampling campaign and MK and IH prepared the manuscript with contributions from MH, MN, JS, TJ, MF, PK, NK, CU, A-KR. The authors declare that they have no conflict of interest.
The contact author has declared that none of the authors has any competing interests.
Publisher's note: Copernicus Publications remains neutral with regard to jurisdictional claims made in the text, published maps, institutional affiliations, or any other geographical representation in this paper. The authors bear the ultimate responsibility for providing appropriate place names. Views expressed in the text are those of the authors and do not necessarily reflect the views of the publisher.
This research has been supported by The Finnish Environment Institute (Syke), the Ministry of Agriculture and Forestry of Finland (grant no. VN/28536/2020) and by the European Union (NextGenerationEU and Water4all) through the Research Council of Finland (grant nos. 347703, 353316, 347848, 367832 and 367822).
This paper was edited by Fuqiang Tian and reviewed by two anonymous referees.
Abril, G., Bouillon, S., Darchambeau, F., Teodoru, C. R., Marwick, T. R., Tamooh, F., Ochieng Omengo, F., Geeraert, N., Deirmendjian, L., Polsenaere, P., and Borges, A. V.: Technical Note: Large overestimation of pCO2 calculated from pH and alkalinity in acidic, organic-rich freshwaters, Biogeosciences, 12, 67–78, https://doi.org/10.5194/bg-12-67-2015, 2015.
Aherne, J., Posch, M., Forsius, M., Lehtonen, A., and Härkönen, K.: Impacts of forest biomass removal on soil nutrient status under climate change: a catchment-based modelling study for Finland, Biogeochemistry, 107, 471–488, https://doi.org/10.1007/s10533-010-9569-4, 2012.
Algesten, G., Sobek S., Bergström, A. K., Gren, A. A., Tranvik, L. J., and Jansson, M.: The role of lakes for organic carbon cycling in the boreal zone, Glob. Change Biol., 10, 141–147, https://doi.org/10.1111/j.1365-2486.2003.00721.x, 2003.
Alin, S. R., Rasera, M. D. F. F. L., Salimon, C. I., Richey, J. E., Holtgrieve, G. W., Krusche, A. V., and Snidvongs, A.: Physical controls on carbon dioxide transfer velocity and flux in low-gradient river systems and implications for regional carbon budgets, J. Geophys. Res., 116, G01009, https://doi.org/10.1029/2010jg001398, 2011.
Allesson, L., Valiente, N., Dörsch, P., Andersen, T., Eiler, A., and Hessen, D. O.: Drivers and variability of CO2: O2 saturation along a gradient from boreal to Arctic lakes, Sci. Rep.-UK, 12, 18989, https://doi.org/10.1038/s41598-022-23705-9, 2022.
Amora-Nogueira, L., Sanders, C. J., Enrich-Prast, A., Monteiro Sanders, S., Coutinho Abuchacra, R., Moreira-Turcq, P. F., Campello Cordeiro, R., Gauci, V., Silva Moreira, L., Machado-Silva, F., Libonati, R., Fonseca, T., Nunes Francisco, C., and Marotta, H.: Tropical forests as drivers of lake carbon burial, Nat. Commun., 13, 4051, https://doi.org/10.1038/s41467-022-31258-8, 2022.
Chen, C.-T. and Millero, F. J.: The high pressure specific volume of seawater, Deep-Sea Res., 23, 595–612, 1976.
Cole, J. J., Caraco, N. F., Kling, G. W., and Kratz, T. K.: Carbon dioxide supersaturation in the surface waters of lakes, Science, 265, 1568–70, https://doi.org/10.1126/science.265.5178.1568, 1994.
Cole, J. J., Prairie, Y. T., Caraco, N. F., McDowell, W. H., Tranvik, L. J., Striegl, R. G., Duarte, C. M., Kortelainen, P., Downing, J. A., Middelburg, J. J., and Melack, J.: Plumbing the global carbon cycle: integrating inland waters into the terrestrial carbon budget, Ecosystems, 10, 171–184, https://doi.org/10.1007/s10021-006-9013-8, 2007.
de Wit, H. A., Valinia, S., Weyhenmeyer, G. A., Futter, M., Kortelainen, P., Austnes, K., Hessen, D. O., Raäike, A., Laudon, H., and Vuorenmaa, J.: Current Browning of Surface Waters Will Be Further Promoted by Wetter Climate, Environ. Sci. Technol. Lett., 3, 430–435, https://doi.org/10.1021/acs.estlett.6b00396, 2016.
Dinsmore, K. J., Billett, M. F., Skiba, U. M., Rees, R. M., Drewer, J., and Helfter, C.: Role of the aquatic pathway in the carbon and greenhouse gas budgets of a peatland catchment, Glob. Change Biol., 16, 2750–2762, https://doi.org/10.1111/j.1365-2486.2009.02119.x, 2010.
Evans, C., Futter, M. N., Moldan, F., Valinia, S., Frogbrook, Z., and Kothawala, D. N.: Variability in organic carbon reactivity across lake residence time and trophic gradients, Nature Geosci., 10, 832–835, https://doi.org/10.1038/ngeo3051, 2017.
Finér, L., Lepistö, A., Karlsson, K., Räike, A., Härkönen, L., Huttunen, M., Joensuu, S., Kortelainen, P., Mattsson, T., Piirainen, S., Sallantaus, T., Sarkkola, S., Tattari, S., and Ukonmaanaho, L.: Drainage for forestry increases N, P and TOC export to boreal surface waters, STOTEN, Vol. 762, https://doi.org/10.1016/j.scitotenv.2020.144098, 2021.
Forsius, M., Räike, A., Huttunen, I., Poutanen, H., Mattsson, T., Kankaanpää, S., Kortelainen, P., and Vuorilehto, V.-P.: Observed and predicted future changes of total organic carbon in the lake Päijänne catchment (southern Finland): Implications for water treatment of the Helsinki metropolitan area, Boreal Environ. Res. 22, 317–336, http://www.borenv.net/BER/archive/pdfs/ber22/ber22-317-336.pdf (last access: 22 April 2025), 2017.
Futter, M. N., Butterfield, D., Cosby, B. J., Dillon, P. J., Wade, A. J., and Whitehead, P. G.: Modeling the mechanisms that control in-stream dissolved organic carbon dynamics in upland and forested catchments, Water Resour. Res., 43, https://doi.org/10.1029/2006WR004960, 2007.
Gibson, J. J., Price, J. S., Aravena, R., Fitzgerald, D. F., and Maloney, D.: Runoff generation in a hypermaritime bog–forest upland, Hydrol. Process., 14, 2711–2730, https://doi.org/10.1002/1099-1085(20001030)14:15<2711::AID-HYP88>3.0.CO;2-2, 2000.
Gupta, H. V., Sorooshian, S., and Yapo, P. O.: Status of Automatic Calibration for Hydrologic Models: Comparison with Multilevel Expert Calibration, J. Hydrol. Eng., 4, https://doi.org/10.1061/(ASCE)1084-0699(1999)4:2(135), 1999.
Heiskanen, J. J., Mammarella, I., Haapanala, S., Pumpanen, J., Vesala, T., Macintyre, S., and Ojala, A.: Effects of cooling and internal wave motions on gas transfer coefficients in a boreal lake, Tellus B, 66, 22827, https://doi.org/10.3402/tellusb.v66.22827, 2014.
HELCOM: HELCOM PLC-water database [data set], https://metadata.helcom.fi/geonetwork/srv/eng/catalog.search#/metadata/59445232-e9de-445d-8be0-06f59cea726a, last access 3 February 2025.
Hiederer, R.: Distribution of Organic Carbon in Soil Profile Data, EUR 23980 EN. Luxembourg: Office for Official Publications of the European Communities, 126 pp., https://doi.org/10.2788/33102, 2009.
Holmberg, M., Junttila, V., Schulz, T., Grönroos, J., Paunu, V.-V., Savolahti, M., Minunno, F., Ojanen, P., Akujärvi, A., Karvosenoja, N., Kortelainen, P., Mäkelä, A., Peltoniemi, M., Petäjä, J., Vanhala, P., and Forsius, M.: Role of land cover in Finland's greenhouse gas emissions, Ambio, 52, 1697–1715, https://doi.org/10.1007/s13280-023-01910-8, 2023.
Hope, D., Billett, M. F., and Cresser, M. S.: A review of the export of carbon in river water: fluxes and processes, Environ. Poll., 84, 301–324, 1994.
Hruska, J., Köhler, S., Laudon, H., and Bishop, K.: Is a universal model of organic acidity possible: comparison of the acid/base properties of dissolved organic carbon in the boreal and temperate zones, Environ. Sci. Technol., 37, 1726–30, https://doi.org/10.1021/es0201552, 2003.
Humborg, C., Mörth, C.-M., Sundbom, M., Borg, H., Blenckner, T., Giesler, R., and Ittekkot, V.: CO2 supersaturation along the aquatic conduit in Swedish watersheds as constrained by terrestrial respiration, aquatic respiration and weathering, Glob. Change Biol., 16, 1966–1978, https://doi.org/10.1111/j.1365-2486.2009.02092.x, 2010.
Huotari, J., Ojala, A., Peltomaa, E., Pumpanen, J., Hari, P., and Vesala, T.: Temporal variations in surface water CO2 concentration in boreal humic lake based on high-frequency measurements, Boreal Environ. Res., 14, 48–60, 2009.
Huotari, J., Nykänen, H., Forsius, M., and Arvola, L.: Effect of catchment characteristics on aquatic carbon export from a boreal catchment and its importance in regional carbon cycling, Glob. Change Biol., 19, 3607–3620, https://doi.org/10.1111/gcb.12333, 2013.
Huttunen, I., Huttunen, M., Piirainen, V., Korppoo, M., Lepistö, A., Räike, A., Tattari, S., and Vehviläinen, B.: A national scale nutrient loading model for Finnish watersheds – Vemala, Environ. Model. Assess., 21, 83–109, https://doi.org/10.1007/s10666-015-9470-6, 2016.
Jakkila, J., Vento, T., Rousi, T., and Vehviläinen, B.: SMOS soil moisture data validation in the Aurajoki watershed, Finland, Hydrol. Res., 45, 684–702, https://doi.org/10.2166/nh.2013.234, 2014.
Jarvie, H. P., King, S. M., and Neal, C.: Inorganic carbon dominates total dissolved carbon concentrations and fluxes in British rivers: Application of the THINCARB model – Thermodynamic modelling of inorganic carbon in freshwaters, Sci. Total Environ., 575, 496–512, https://doi.org/10.1016/j.scitotenv.2016.08.201, 2017.
Jonsson, A., Åberg, J., Lindroth, A., and Jansson, M.: Gas transfer rate and CO2 flux between an unproductive lake and the atmosphere in northern Sweden, J. Geophys. Res., 113, G04006, https://doi.org/10.1029/2008JG000688, 2008.
Kolhinen, V., Huttunen, M., Jakkila, J., Havu, P., Menberu, M., Kumpumäki, M., Fazel, N., Koistinen, A., Vehviläinen, B., and Veijalainen, N.: Development and Validation of National Scale Process-Based Hydrological Model for Finland, J. Hydrol., 665, 134650, https://doi.org/10.1016/j.jhydrol.2025.134650, 2026.
Korkka-Niemi, K. I.: Cumulative geological, regional and site-specific factors affecting groundwater quality in domestic wells in Finland, Boreal Environ. Res., Monographs, 20, http://hdl.handle.net/10138/39327 (last access: 22 April 2025), 2001.
Korppoo, M., Huttunen, M., Huttunen, I., Piirainen, V., and Vehviläinen, B.: Simulation of bioavailable phosphorus and nitrogen loading in an agricultural river basin in Finland using VEMALA v.3, J. Hydrol., 549, 363–373, https://doi.org/10.1016/j.jhydrol.2017.03.050, 2017.
Kortelainen, P.: Content of total organic carbon in Finnish lakes and its relationship to catchment characteristics, Can. J. Fish. Aquat. Sci., 50, 1477–1483, 1993.
Kortelainen, P., Rantakari, M., Huttunen, J. T., Mattsson, T., Alm, J., Juutinen, S., Larmola, T., Silvola, J., and Martikainen, P. J.: Sediment respiration and lake trophic state are important predictors of large CO2 evasion from small boreal lakes, Glob. Change Biol., 12, 1554–1567, 2006.
Krause, P., Boyle, D. P., and Bäse, F.: Comparison of different efficiency criteria for hydrological model assessment, Adv. Geosci., 5, 89–97, https://doi.org/10.5194/adgeo-5-89-2005, 2005.
Laurén, A., Lappalainen, M., Kieloaho, A.-J., Karhu, K., and Palviainen, M.: Temperature sensitivity patterns of carbon and nitrogen processes in decomposition of boreal organic soils – Quantification in different compounds and molecule sizes based on a multifactorial experiment, PLoS ONE, 14, e0223446, https://doi.org/10.1371/journal.pone.0223446, 2019.
Lehtonen, A. and Heikkinen, J.: Uncertainty of upland soil carbon sink estimate for Finland, Can. J. Forest Res., 46, 310–322, https://doi.org/10.1139/cjfr-2015-0171, 2016.
Lemola, R., Uusitalo, R., Hyväluoma, J., Sarvi, M., and Turtola, E.: Suomen peltojen maalajit, multavuus ja fosforipitoisuus, Vuodet 1996–2000 ja 2005–2009, Luonnonvarakeskus (Luke), Helsinki, 209 pp., https://urn.fi/URN:ISBN:978-952-326-558-5 (last access: 22 April 2025), 2018 (in Finnish).
Lignell, R., Miettunen, E., Kuosa, H., Ropponen, J., Tuomi, L., Puttonen, I., Lukkari, K., Korppoo, M., Huttunen, M., Kaurila, K., Vanhatalo, J., and Thingstad, F.: Modeling how eutrophication in northern Baltic coastal zone is driven by new nutrient inputs, internal loading, and 3D hydrodynamics, J. Marine Syst., 249, 104049, https://doi.org/10.1016/j.jmarsys.2025.104049, 2025.
Mäkisara, K., Katila, M., Peräsaari, J., and Tomppo, E.: The Multi-Source National Forest Inventory of Finland – methods and results 2013, Natural Resources Institute Finland (Luke), 215 pp., http://urn.fi/URN:ISBN:978-952-326-186-0 (last access 22 April 2025), 2016.
Manninen, N., Soinne, H., Lemola, R., Hoikkala, L., and Turtola, E.: Effects of agricultural land use on dissolved organic carbon and nitrogen in surface runoff and subsurface drainage, STOTEN, 618, 1519–1528, https://doi.org/10.1016/j.scitotenv.2017.09.319, 2018.
Marescaux, A., Thieu, V., Gypens, N., Silvestre, M., and Garnier, J.: Modeling inorganic carbon dynamics in the Seine River continuum in France, Hydrol. Earth Syst. Sci., 24, 2379–2398, https://doi.org/10.5194/hess-24-2379-2020, 2020.
Mattsson, T., Finér, L., Kortelainen, P., and Sallantaus, T.: Brook Water Quality and Background Leaching from Unmanaged Forested Catchments in Finland, Water Air Soil Poll., 147, 275–298, https://doi.org/10.1023/A:1024525328220, 2003.
Mattsson, T., Kortelainen, P., and Räike, A.: Export of DOM from boreal catchments: Impacts of land use cover and climate, Biogeochemistry, 76, 373–394, 2005.
Mendonça, R., Müller, R. A., Clow, D., Verpoorter, C., Raymond, P., Tranvik, L. J., and Sobek, S.: Organic carbon burial in global lakes and reservoirs, Nat. Commun., 8, 1694, https://doi.org/10.1038/s41467-017-01789-6, 2017.
Millero, F. J.: Thermodynamics of the carbon dioxide system in the oceans, Geochim. Cosmochim. Ac., 59, 661–677, https://doi.org/10.1016/0016-7037(94)00354-O, 1995.
Minunno, F., Peltoniemi, M., Härkönen, S., Kalliokoski, T., Mäkinen, H., and Mäkelä, A.: Bayesian calibration of a carbon balance model PREBAS using data from permanent growth experiments and national forest inventory, Forest Ecol. Manag., 440, 208–257, 2019.
Mozafari, B., Bruen, M., Donohue, S., Renou-Wilson, F., and O'Loughlin, F.: Peatland dynamics: A review of process-based models and approaches, Sci. Total Environ., 877, https://doi.org/10.1016/j.scitotenv.2023.162890, 2023.
Munhoven, G.: Mathematics of the total alkalinity–pH equation – pathway to robust and universal solution algorithms: the SolveSAPHE package v1.0.1, Geosci. Model Dev., 6, 1367–1388, https://doi.org/10.5194/gmd-6-1367-2013, 2013.
Munhoven, G.: SolveSAPHE (Solver Suite for Alkalinity-PH Equations), Zenodo [code], https://doi.org/10.5281/zenodo.4328965, 2020.
Nash, J. E. and Sutcliffe, J. V.: River flow forecasting through conceptual models part I – A discussion of principles, J. Hydrol., 10, 282–290, https://doi.org/10.1016/0022-1694(70)90255-6, 1970.
Natural Resources Institute Finland and Geological Survey of Finland: Finnish Soil Database, 2016, CSC – IT Center for Science, http://urn.fi/urn:nbn:fi:att:d0083b93-930c-426c-a231-74f0d9c0d71e (last access: 22 April 2025), 2023.
Nieminen, M., Sarkkola, S., Sallantaus, T., Hasselquist, E. M., and Hjalmar Laudon, H.: Peatland drainage – a missing link behind increasing TOC concentrations in waters from high latitude forest catchments?, Sci. Total Environ., 774, https://doi.org/10.1016/j.scitotenv.2021.145150, 2021.
Pajunen, H.: Lake sediments: their carbon store and related accumulation rates, Geol. S. Finl., 29, 39–69, 2000.
Qi, J., Du, X., Zhang, X., Lee, S., Wu, Y., Deng, J., Moglen, G. E., Sadeghi, A. M., and McCarty, G. W.: Modeling riverine dissolved and particulate organic carbon fluxes from two small watersheds in the northeastern United States, Environ. Modell. Softw., 124, https://doi.org/10.1016/j.envsoft.2019.104601, 2020.
Räike, A., Kortelainen, P., Mattsson, T., and Thomas, D. N.: Long term trends in the export of carbon from Finnish rivers to the Baltic Sea: Organic and inorganic components compared, Aquat. Sci., 78, 505–523, https://doi.org/10.1007/s00027-015-0451-2, 2016.
Räike, A., Taskinen, A., Härkönen, L., Kortelainen, P., and Lepistö, A.: Browning from headwaters to coastal areas in the boreal region: Trends and drivers, Sci. Total Environ., 927, https://doi.org/10.1016/j.scitotenv.2024.171959, 2024.
Rantakari, M.: The role of lakes in carbon cycling in boreal catchments, Monographs of the Boreal Environment Research, 35, http://hdl.handle.net/10138/22176 (last access: 22 April 2025), 2010.
Rantakari, M. and Kortelainen, P.: Interannual variation and climatic regulation of the CO2 emission from large boreal lakes, Glob. Change Biol., 11, 1368–1380, 2005.
Rantakari, M. and Kortelainen, P.: Controls of Organic and Inorganic Carbon in Randomly Selected Boreal Lakes in Varied Catchments, Biogeochemistry, 91, 151–162, https://www.jstor.org/stable/40343625 (last access: 22 April 2025), 2008.
Rantakari, M., Mattsson, T., Kortelainen, P., Piirainen, S., Finér, L., and Ahtiainen, M.: Organic and inorganic carbon concentrations and fluxes from managed and unmanaged boreal first-order catchments, Sci. Total Environ., 408, 1649–1658, https://doi.org/10.1016/j.scitotenv.2009.12.025, 2010.
Raymond, P. A., Zappa, C. J., Butman, D., Bott, T. L., Potter, J., Mulholland, P., Laursen, A. E., McDowell, W. H., and Newbold, D.: Scaling the gas transfer velocity and hydraulic geometry in streams and small rivers, Limnol. Oceanogr., Fluids Environ., 2, 41–53, https://doi.org/10.1215/21573689-1597669, 2012.
Rocher-Ros, G., Sponseller, R. A., Lidberg, W., Mörth, C.-M., and Giesler, R.: Landscape process domains drive patterns of CO2 evasion from river networks, Limnology and Oceanography Letters, 4, 87–95, 2019.
Schönach, P. M., Nygrén, N. A., Tammeorg, O., Heikkinen, M. E., Holmroos, H. J., Massa, I., Niemistö, J. P., Tapio, P. E. J., and Horppila, J. A.: The past, present, and future of a lake: Interdisciplinary analysis of long-term lake restoration, Environ. Sci. Policy, 81, 95–103, https://doi.org/10.1016/j.envsci.2017.12.015, 2018.
Sobek, S., Tranvik, L. J., and Cole, J. J.: Temperature independence of carbon dioxide supersaturation in global lakes, Global Biogeochem. Cy., 19, https://doi.org/10.1029/2004GB002264, 2005.
Syke: Catchment areas [data set], https://ckan.ymparisto.fi/dataset/%7B44394B13-85D7-4998-BD06-8ADC77C7455C%7D, last access: 22 April 2025a.
Syke: Corine Land cover 2018 (partly LUKE, MAVI, LIVI, DVV, EU, NLS Maastotietokanta 01/2017) [data set], https://ckan.ymparisto.fi/dataset/%7B0B4B2FAC-ADF1-43A1-A829-70F02BF0C0E5%7D, last access: 22 April 2025b.
Syke: HYDRO dataset [data set], https://ckan.ymparisto.fi/dataset/%7B86FC3188-6796-4C79-AC58-8DBC7B568827%7D, last access: 75 22 April 2025c.
Syke: Peatland drainage status [data set], https://ckan.ymparisto.fi/dataset/%7BC73BC2C1-C2CA-4FCA-9171-B8074F2BC2A3%7D, last access: 3 June 2025d.
Syke: VESLA dataset [data set], https://ckan.ymparisto.fi/dataset/%7BE7D10B36-D734-4C2A-95F2-5C3C544C6BB8%7D, last access: 22 April 2025e.
Syke: WSFS-Vemala [data set], https://ckan.ymparisto.fi/fi/dataset/wsfs-vemala-kuormitustiedot, last access 22 April 2025f.
Syke and National Land Survey of Finland: Shoreline 10 dataset [data set], https://ckan.ymparisto.fi/dataset/%7BC40D8B4A-DC66-4822-AF27-7B382D89C8ED%7D, last access 22 April 2025.
Tranvik, L. J., Downing, J. A., Cotner, J. B., Loiselle, S. A., Striegl, R. G., Ballatore, T. J., Dillon, P., Finlay, K., Fortino, K., Knoll, L. B., Kortelainen, P. L., Kutser, T., Larsen, S., Laurion, I., Leech, D. M., McCallister, S. L., McKnight, D. M., Melack, J. M., Overholt, E., Porter, J. A., Prairie, Y., Renwick, W. H., Roland, F., Sherman, B. S., Schindler, D. W., Sobek, S., Tremblay, A., Vanni, M. J., Verschoor, A. M., von Wachenfeldt, E., and Weyhenmeyer, G. A.: Lakes and reservoirs as regulators of carbon cycling and climate, Limnol. Oceanogr., 54, https://doi.org/10.4319/lo.2009.54.6_part_2.2298, 2009.
Tranvik, L. J., Cole, J. J., and Prairie, Y. T.: The study of carbon in inland waters – from isolated ecosystems to players in the global carbon cycle, Limnology and Oceanography Letters, 3, 41–48, https://doi.org/10.1002/lol2.10068, 2018.
Vuorenmaa, J.: Recovery Responses of Acidified Finnish Lakes Under Declining Acid Deposition, Monographs of the Boreal Environment Research, 30, http://hdl.handle.net/10138/39342 (last access: 22 April 2025), 2007.
Wanninkhof, R.: Relationship between wind-speed and gas ex-change over the ocean, J. Geophys. Res., 97, 7373–7382, https://doi.org/10.1029/92JC00188, 1992.
Ward, N. D., Bianchi, T. S., Medeiros, P. M., Seidel, M., Richey, J. E., Keil, R. G., and Sawakuchi, H. O.: Where Carbon Goes When Water Flows: Carbon Cycling across the Aquatic Continuum, Front. Mar. Sci., 4, 7, https://doi.org/10.3389/fmars.2017.00007, 2017.
Weiss, R.: Carbon dioxide in water and seawater. The solubility of a non-ideal gas, Mar. Chem. 2, 203–215, https://doi.org/10.1016/0304-4203(74)90015-2, 1974.
Wen, H., Perdrial, J., Abbott, B. W., Bernal, S., Dupas, R., Godsey, S. E., Harpold, A., Rizzo, D., Underwood, K., Adler, T., Sterle, G., and Li, L.: Temperature controls production but hydrology regulates export of dissolved organic carbon at the catchment scale, Hydrol. Earth Syst. Sci., 24, 945–966, https://doi.org/10.5194/hess-24-945-2020, 2020.