the Creative Commons Attribution 4.0 License.
the Creative Commons Attribution 4.0 License.
 | 12 May 2026
Moisture origins affecting sub-daily precipitation δ18O and d-excess values mapped in Western Europe
Christoph J. Gey
Bernd R. Schöne
Stable isotopes of oxygen (O) and hydrogen (H) in streams and precipitation are cardinal tools to assess water sources, flow paths, and age. However, their spatial and temporal variability in the context of climate change remain largely unknown – essentially due to the limited and often fragmented availability of precipitation O and H isotope records. To overcome this limitation in hydro-ecological studies, we aim to assess the influence of synoptic atmospheric changes on precipitation isotope signatures. In this study, we conjecture that contrasted moisture origins affect precipitation δ18O and d-excess signals in precipitation, and precipitation δ18O residuals after removing local meteorologic effects with a multiple linear regression model. To test our hypothesis, we collected high-resolution (i.e., sub-daily) δ18O and δ2H data at Belvaux (Luxembourg) from 2017 to 2022. We also used a pre-established Lagrangian model to visualise 120 h air mass trajectories and determine the moisture origins for 648 precipitation events. We then analysed how moisture origins affect precipitation isotope signatures by mapping isotope signatures based on the moisture uptake locations we determined. Our results demonstrated effects of moisture origins on precipitation isotope signals in Luxembourg (Western Europe). More specifically, we found that remote (> 1500 km) moisture sources over the Atlantic Ocean are major contributors to precipitation in autumn and winter, while replaced by mid-range (< 1500 km) and local (< 500 km) moisture sources in spring and summer, with an average δ18O value of −8.1 ‰ and d-excess value of +10.8 ‰. We also found that differences in isotope signals from contrasting moisture origins are season-dependent, which we argue is linked to changes in the balance of transpiration and evaporation in moisture stemming from land sources, or specific properties of the Western Mediterranean and the Bay of Biscay. Orographic barriers, such as the Pyrenees, Alps, or Massif Central also had an influence precipitation isotope signatures. The δ18O residuals from the multiple linear regression model, used to exclude local meteorologic effects, did not yield significant differences in moisture origin-specific isotope signatures. This was probably due to local meteorological variables already containing inherent information on remote conditions during moisture formation processes or inaccurate or unrepresentative boundaries for the classification of the moisture origins. Ultimately, with the maps of isotope signatures based on the moisture origins, this study offers a nuanced insight into atmospheric moisture origins affecting precipitation and precipitation isotope signals in Western Europe. This information improves the interpretation of precipitation isotope signals and could contribute to assessing potential changes of the moisture origins of precipitation.
- Article
(8161 KB) - Full-text XML
- BibTeX
- EndNote


Owing to their nearly conservative chemical behaviour, the naturally occurring stable isotopes of oxygen (O) and hydrogen (H) in water are powerful tools to investigate water sources, fluxes, and residence times in the hydrologic cycle (Craig, 1961; Dansgaard, 1964; McGuire and McDonnell, 2007). Over the last two decades, δ18O and δ2H values in precipitation and stream water have been used in a variety of studies unveiling complex and sometimes unexpected streamflow contributions (McDonnell, 1990; Kirchner, 2003). For example, one-third of the global river discharge has been found to consist of so-called young water, i.e., precipitation water travelling to the stream in less than 2–3 months (Jasechko et al., 2016). Such insights are crucial for predicting the effects of the intensification of the hydrologic cycle (Allen and Ingram, 2002; Blöschl et al., 2017, Madakumbura et al., 2019) on the “changing pulse of rivers” (Slater and Wilby, 2017). Long δ18O chronologies spanning over multiple decades are particularly valuable to answer questions on flood and drought resilience under a changing climate e.g., to assess global change impacts on large river systems (Rank et al., 2018).
For large-scale and long-term studies, isotope signals in precipitation are typically retrieved from platforms such as the Global Network of Isotopes in Precipitation (GNIP), the Online Isotopes in Precipitation Calculator (OIPC) (Bowen and Revenaugh, 2003; Bowen et al., 2005), or other isoscape models that describe the spatial distribution of isotope patterns (Terzer et al., 2013; Allen et al., 2019). The GNIP network was established in 1960 and holds monthly δ18O and δ2H data to the present day, yet complete records from the start of the monitoring initiative exist only for a few locations. While approaches based on these datasets led to great advances in watershed hydrology (Klaus and McDonnell, 2013), recent progress in paleohydrology opened new avenues to venture beyond short (in terms of climate change) historic observation intervals. To overcome the limitation of rather short and truncated time-series, pre-instrumental δ18O data can be obtained from environmental archives, such as sediments, ice-cores (Konecky et al., 2020), tree-rings (Álvarez et al., 2024; Rodriguez-Caton et al., 2024) or mollusc shells (Fritz and Poplawski, 1974; Pfister et al., 2018; Schöne et al., 2020). Thus, isotope-enabled global circulation models or, more recently, AI models (Nelson et al., 2021; Erdélyi, 2023), are promising tools to complement proxy-based approaches (Sturm et al., 2010). A direct comparison of open-access, ready-to-use δ18O products from different modelling approaches is also available in Nelson et al. (2021) – amongst which Piso.AI (Nelson et al., 2021), the sine wave fitting approach (Allen et al., 2019), IsoGSM (Yoshimura et al., 2008), OPIC (Bowen and Revenaugh, 2003; Bowen et al., 2005), and the Regionalized Cluster-based Water Isotope Prediction model (RCWIP) (Terzer et al., 2013). This product portfolio highlights the potential of modern AI-enabled technologies, with an unprecedented δ18O root mean square error (RMSE) of solely 1.68 ‰ (Piso.AI), and even 1.345 ‰ (RFSP, Erdélyi, 2023) for Europe, fitted and calibrated on GNIP data.
However, the prediction accuracy of many of these models significantly decreases for earlier decades as meteorological data become increasingly sparse and fragmented. Reanalysis datasets, such as ERA5 serve for reconstructing precipitation δ18O chronologies with high accuracy over large geographical extents until the 1950s. For reconstructions prior to that date, modelling tools with very limited data requirements are needed. The availability of systematic air temperature measurements since the mid-19th century, allows the relation between δ18O and surface temperature, known as the temperature effect (Dansgaard, 1964), to be used as a robust analytical tool. Still, a simple empiric approach requires caution, as Sturm et al. (2010) point out non-stationarities in the relation between δ18O and meteorologic variables, inherent to changing atmospheric circulation patterns (Noone and Simmonds, 2002; Lee et al., 2008). The temporal δ18O vs T gradient may have been substantially lower for the Last Glacial Maximum – Pre-Industrial (LGM-PI) era than under the present climate for most mid to high-latitude regions (Werner et al., 2016). In addition, δ18O and temperature relations have varied across past climates (Jouzel, 1999; Buizert et al., 2014). Colder climates (e.g., during the LGM) are typically associated with lower δ18O values in precipitation (Lee et al., 2008; Risi et al., 2010; Werner et al., 2016). This raises the question of how well models can reconstruct long δ18O chronologies for data-poor periods not covered by dense reanalysis datasets. Isotope-enabled climate models notably often fail in capturing long-term trends caused by changes in atmospheric circulation (Putman et al., 2021). In the Hubbard brook catchment (New Hampshire, USA), a significant decrease in precipitation δ18O and δ2H values observed between 1968 and 2010 has been linked to changes in atmospheric circulation (Puntsag et al., 2016). Along similar lines, Vystavna et al. (2020) related 60-year trends in δ18O of global precipitation to large scale patterns. A process-based connection between isotope signatures in precipitation and the frequency of strong large-scale ocean water evaporation events in the subpolar North Atlantic was revealed by Aemisegger (2018). Such modifications in large-scale movements of air masses may thus need to be incorporated in precipitation δ18O model but eventually remain challenging to quantify in a generalised way.
In Western Europe, the isotope composition of local precipitation is primarily controlled by large-scale processes, i.e., moist air masses coming primarily from the Atlantic Ocean with different rainout histories (Rozanski et al., 1982). As those air masses travel over continents and orographic obstacles, condensation occurs with a selective transition to the liquid phase of the heavy isotopes – following a Rayleigh distillation scheme. The gradual depletion of precipitation 18O and 2H, leading to increasingly lower δ18O and δ2H values is known as the continental effect (Dansgaard, 1964). The origin of the air moisture also plays a key role in defining δ18O and δ2H signals, with several studies documenting the unique isotope signature of the Mediterranean Sea in contrast to other sources in Europe (Bonne et al., 2020; Casellas et al., 2019; Celle-Jeanton et al., 2001; Krklec et al., 2018). Celle-Jeanton et al. (2001) reported precipitation from the Mediterranean area to be 18O-enriched with higher δ18O (−5 ‰) compared to Atlantic sources (−8 ‰), and significantly higher d-excess values (22 ‰ against 10 ‰), the d-excess being defined as δ2H − 8×δ18O. The d-excess value is a proxy for evaporation conditions at the moisture source (Merlivat and Jouzel, 1979) and reportedly relates to remote over-sea relative humidity and sea surface temperature (Aemisegger et al., 2014; Bonne et al., 2019; Pfahl and Sodemann, 2014). Backward air mass trajectory models, based on Lagrangian techniques, are now implemented to visualise the pathways of incoming airmasses, going back several days before the precipitation event, to describe the short-term influence of changes in moisture origin or moisture source conditions on the precipitation isotope signature (Aemisegger et al., 2014; Juhlke et al., 2019; Krklec et al., 2018). Integrated vapor transport models complement the trajectories to identify air streams that carry most of the moisture (Conticello et al., 2020; Juhlke et al., 2019; Lavers and Villarini, 2013).
Note that other effects also need to be considered, including local processes during cloud formation in the boundary layer (such as frontal and convective activity and the re-evaporation of rain drops) (Aemisegger et al., 2014; Coplen et al., 2015; Moore et al., 2014), as well as continental moisture recycling (Insua-Costa et al., 2022; Krklec et al., 2018). Plant transpiration further complicates the identification of continental inputs, making them harder to distinguish from oceanic sources, and altering the apparent link between isotope signatures and local meteorological variables (Aemisegger et al., 2014; Krklec et al., 2018). A decrease of secondary evaporation with higher convection strength can also mistakenly be interpreted as the amount effect because of the apparent depletion (or lack of enrichment) of the isotope signal with higher precipitation amounts (Moore et al., 2014).
In this study, we conjectured that contrasted moisture origins (e.g., over the Atlantic Ocean, Mediterranean Sea or continents) affect sub-daily δ18O and d-excess signals in precipitation, and δ18O residuals after removing local meteorologic effects. To test our hypothesis, we relied on six years of high-resolution (i.e., sub-daily) precipitation δ18O and δ2H data, and hourly meteorological data recorded in Belvaux (Luxembourg). We used a pre-established Langrangian model to visualise 120-hour air mass trajectories and determined the moisture origins for 648 precipitation events. We then analysed how moisture origins affect precipitation isotope signatures by mapping isotope data based on the moisture uptake locations. Next, we employed a simple modelling approach for δ18O in precipitation based on multiple linear regressions using local meteorologic variables to plot the residuals according to moisture source locations. Applying this method, we aimed to disentangle local effects (i.e., linked to meteorologic variables) from remote effects (i.e., linked to atmospheric circulation), and assessed potential implications for reconstructions of long time-series of δ18O in precipitation.
2.1 Sub-daily meteorologic and isotope measurements in precipitation
Sub-daily precipitation samples were obtained from a sampling system connected to a tipping-bucket rain gauge, located on the rooftop of LIST's (Luxembourg Institute of Science and Technology) premises in Belvaux (49°30.40′23.87′′ N, 5°56.63′38.08′′ E; WGS84; 305 m a.s.l.). For the sample collection, a modified ISCO automatic liquid sampler with small inserts at the opening of the bottles was used to limit the effects of in-bottle evaporation (Von Freyberg et al., 2020). The inserts, consisting of the outer shell of water syringes, were filled first to reduce the evaporation through their smaller diameter for small precipitation amounts. For larger precipitation amounts, the inserts can spill into the larger bottle, which will also undergo less evaporation because the opening is clogged by the syringe. From December 2016 to March 2020, sampling time intervals varied between 4 and 12 h. Precipitation events could thus be split or aggregated during that time.
From April 2020 to the end of the sampling campaign in January 2023, a new sampling protocol was applied where event-based precipitation samples were collected manually twice per day with a pluviometer installed approx. 200 m away from the original sampling site in Belvaux (49.508270° N, 5.940040° E). In addition, we used the tipping-bucket rain gauge on LIST's premises in Belvaux to obtain a fine-grained distribution of precipitation amounts [mm h−1]. This allowed us to determine the exact duration of the precipitation events for a subsequent extraction of event-specific meteorologic variable. In total, 1664 samples were collected (1586 liquid samples), amongst which 1177 events were selected by comparing the precipitation amount measured with the two different devices (recording gauge and simple pluviometer, with a margin of 1.0 mm). We retained precipitation samples larger than 1.0 mm (N = 648) for further analysis to focus on the bulk of precipitation and avoid overrepresenting small events. Note that many of the discarded samples came from the first half of the sampling interval, when the collection was automatized.
All water samples were analysed for δ18O and δ2H values using a Los Gatos TIWA-45-EP off-axis integrated cavity output spectroscopy laser spectrometer (OA-ICOS). Standards provided by the instrument manufacturer were used for the calibration, as well as an internal standard (δ2H: −52.6 ‰, δ18O: −8.1 ‰) consisting of local tap water calibrated on IAEA standards. For each sample, eight injections were made, discarding the first four to avoid memory effects. The standards were tested every three samples to check for deviations and later correction. Values were reported in per mil relative to the Vienna Standard Mean Ocean Water 2 standard (VSMOW2) (IAEA, 2017) with an accuracy of 0.2 ‰ for δ18O and 0.5 ‰ for δ2H. The local meteorological water line (LMWL) was also calculated and compared to the global meteorological water line (GMWL, Craig, 1961), by plotting dual isotope plots, where δ2H (y-axis) was plotted against δ18O (x-axis). We fitted the LMWL with a reduced major axis regression (RMA) algorithm using the lmodel2 package in R (Legendre, 2024), based on the recommendations of Crawford et al. (2014). Such plots are useful to identify isotope interferences, most notably re-evaporation (McGuire and McDonnell, 2007).
We extracted hourly air temperature [°C] and relative humidity [%] measured at 2 m above ground level from a nearby meteorological station located in Schifflange (49.513710° N, 6.028375° E) and managed by LIST. Surface pressure [hPa] was obtained from the Findel airport station (49.626100° N, 6.203470° E), a national reference for meteorological measurements operated by MeteoLux. Since records ended in July 2022, data from a station operated by LIST located near Roodt (49.806087° N, 5.831247° E) were used to complement the missing surface pressure values. To compensate for a period with inconsistent precipitation measurements (September to October 2022), data from another nearby rain gauge were used instead (station Oberkorn, 49.512354° N, 5.900925° E).
2.2 Air mass trajectories and moisture origin attribution and classification
Incoming air mass trajectories for precipitation events at our sampling site in Luxembourg were calculated using the Hybrid Single-Particle Lagrangian Integrated Trajectory (HYSPLIT) model in backward mode, developed by the National Oceanic and Atmospheric Administration (NOAA) Air Resources Laboratory (Stein et al., 2015; Rolph et al., 2017). Input parameters are the location (latitude and longitude given in WGS84, decimal), the date and time at the air mass arrival, and the elevation above ground level (m above ground level, m agl), plus the duration of the simulation, or how far back in time the model should trace the incoming air masses. The methodology followed here relates to the methods and recommendations found in Krklec et al. (2018), conducting a similar study in Slovenia. The elevation for the incoming air mass trajectories was set to 500, 1000, 1500 and 2000 m a.g.l. because most atmospheric moisture typically resides at these altitudes (Holton and Hakim, 2013; Trenberth et al., 2005; Wallace and Hobbs, 2006). For the simulations, 3-hour reanalysis meteorologic data from Global Forecasting System (GFS) grids with 1°×1° resolution from the National Oceanic and Atmospheric Administration and National Centers for Environmental Prediction (NOAA/NCEP) (https://www.ready.noaa.gov/READYmetdata.php, last access: 21 December 2025) were used. We further used the splitr package in R (Iannone, 2016) to automatize parameter inputs for the simulations and run the HYSPLIT model. The output of these simulations consisted in hourly point-locations of the most likely trajectory of the incoming air masses at four different altitudes for the location and time given by the user. Later processing would reveal which of the four trajectories carried more moisture to the sampling location, then retained as the main trajectory for further analysis. We opted for a simulation duration of 120 h, similar to previous studies (e.g., Aemisegger et al., 2014; Juhlke et al., 2019; Krklec et al., 2018) relating to the long residence time of atmospheric moisture, even though moisture uptake in Slovenia was mostly found to occur overland or in proximity to the coastal regions only 36 h prior to the start of the precipitation event (Krklec et al., 2018). We plotted the trajectories on a map of Europe (25–75° N, 45° W–45° E) using the sf package in R (Pebesma, 2018; Pebesma and Bivand, 2023) and assigned categories based on the origin of the incoming atmospheric moisture.
Moisture uptake locations were determined by tracking variations of the specific humidity along the trajectories. Atmospheric variables, e.g., pressure, temperature, or specific humidity along the hourly point-locations are part of the HYSPLIT outputs. To attribute moisture uptake areas, we calculated 6 h running means of the specific humidity along the trajectories, and defined areas with increases of the specific humidity of more than 0.5 g kg−1 in 6 h along the trajectory as significant moisture locations. To categorize them, the centre of gravity (i.e., mean longitude and latitude of all moisture uptake locations) for each trajectory was assigned to a specific contributing area. These contributing areas have been designated as delimitated by radial lines departing from the sampling site to indicate the tendential direction of incoming air moisture, and three perimeters (500 km, 1500 km, and beyond, dashed lines) have additionally been defined to distinguish local, mid-range, and moisture sources. This classification accounts for the fact that continents, oceans, and confined Seas are reported to carry different isotope signatures. The Atlantic Ocean in the Northern Hemisphere was further subdivided into various contributing areas by latitude and remoteness of the moisture sources, as these regions carry different isotope signatures (e.g., Bonne et al., 2019; Pfahl and Sodemann, 2014).
2.3 Mapping moisture origin influence on precipitation isotope signatures
To test our hypothesis that distinct moisture origins of air masses reaching Western Europe influence sub-daily δ18O and d-excess signals in precipitation, we relied on isotope maps in addition to the classification of contributing areas. The maps were generated by calculating precipitation amount weighted means of precipitation δ18O and d-excess for all trajectories traversing 1° by 1° grid cells. This way we analysed atmospheric circulation effects by mapping which precipitation isotope signals at the study site originated from which moisture uptake locations. To avoid biases from seasonal variations in precipitation isotopes and the uneven annual distribution of atmospheric circulation types, we normalised δ18O and d-excess by calculating deviations from 30 d running means. Note that the produced maps are not isoscapes (e.g., as in Allen et al., 2019) or maps showing the isotope signature at the moisture origin but merely maps showing the relation between the isotope composition at the destination and the location of the moisture origins.
2.4 Multiple linear regression models
Next, we modelled δ18O in precipitation based on multiple linear regressions using local meteorologic variables to obtain the residuals. The underlying idea was that these precipitation δ18O residuals are linked to remote atmospheric variations after local effects have been removed. For this, we took 5-hour running means of the meteorologic variables at the mid-duration of the precipitation events, or sampling intervals, as input variables to compute precipitation δ18O fits. A fixed 5 h window around the mid-duration of the precipitation events was chosen to reduce uncertainty around the exact duration of the precipitation events. Hence, the input variables were the precipitation amount of each sample, and 5-hour averages of air temperature, relative humidity and surface pressure. To reduce the influence of small samples that might be overrepresented in terms of volume, only samples larger than 1.0 mm and a complete set of meteorologic variables were retained for the multiple linear regressions model (N=638). Ten samples were left out because surface pressure values were missing from 7 to 11 September 2022 and from 1 to 3 November 2022. The multiple linear regressions model was then built in R using the lm function, using different combinations of the input variables and taking the R2 value and the RMSE as goodness-of-fit metrics. To obtain precipitation δ18O residuals, we took the fitted precipitation δ18O values from the best performing model and the difference with the actual measured precipitation δ18O. Later, we plotted the δ18O residuals separately based on the moisture origins that we categorized previously to assess the implications of atmospheric circulation variability for reconstructions of δ18O chronologies.
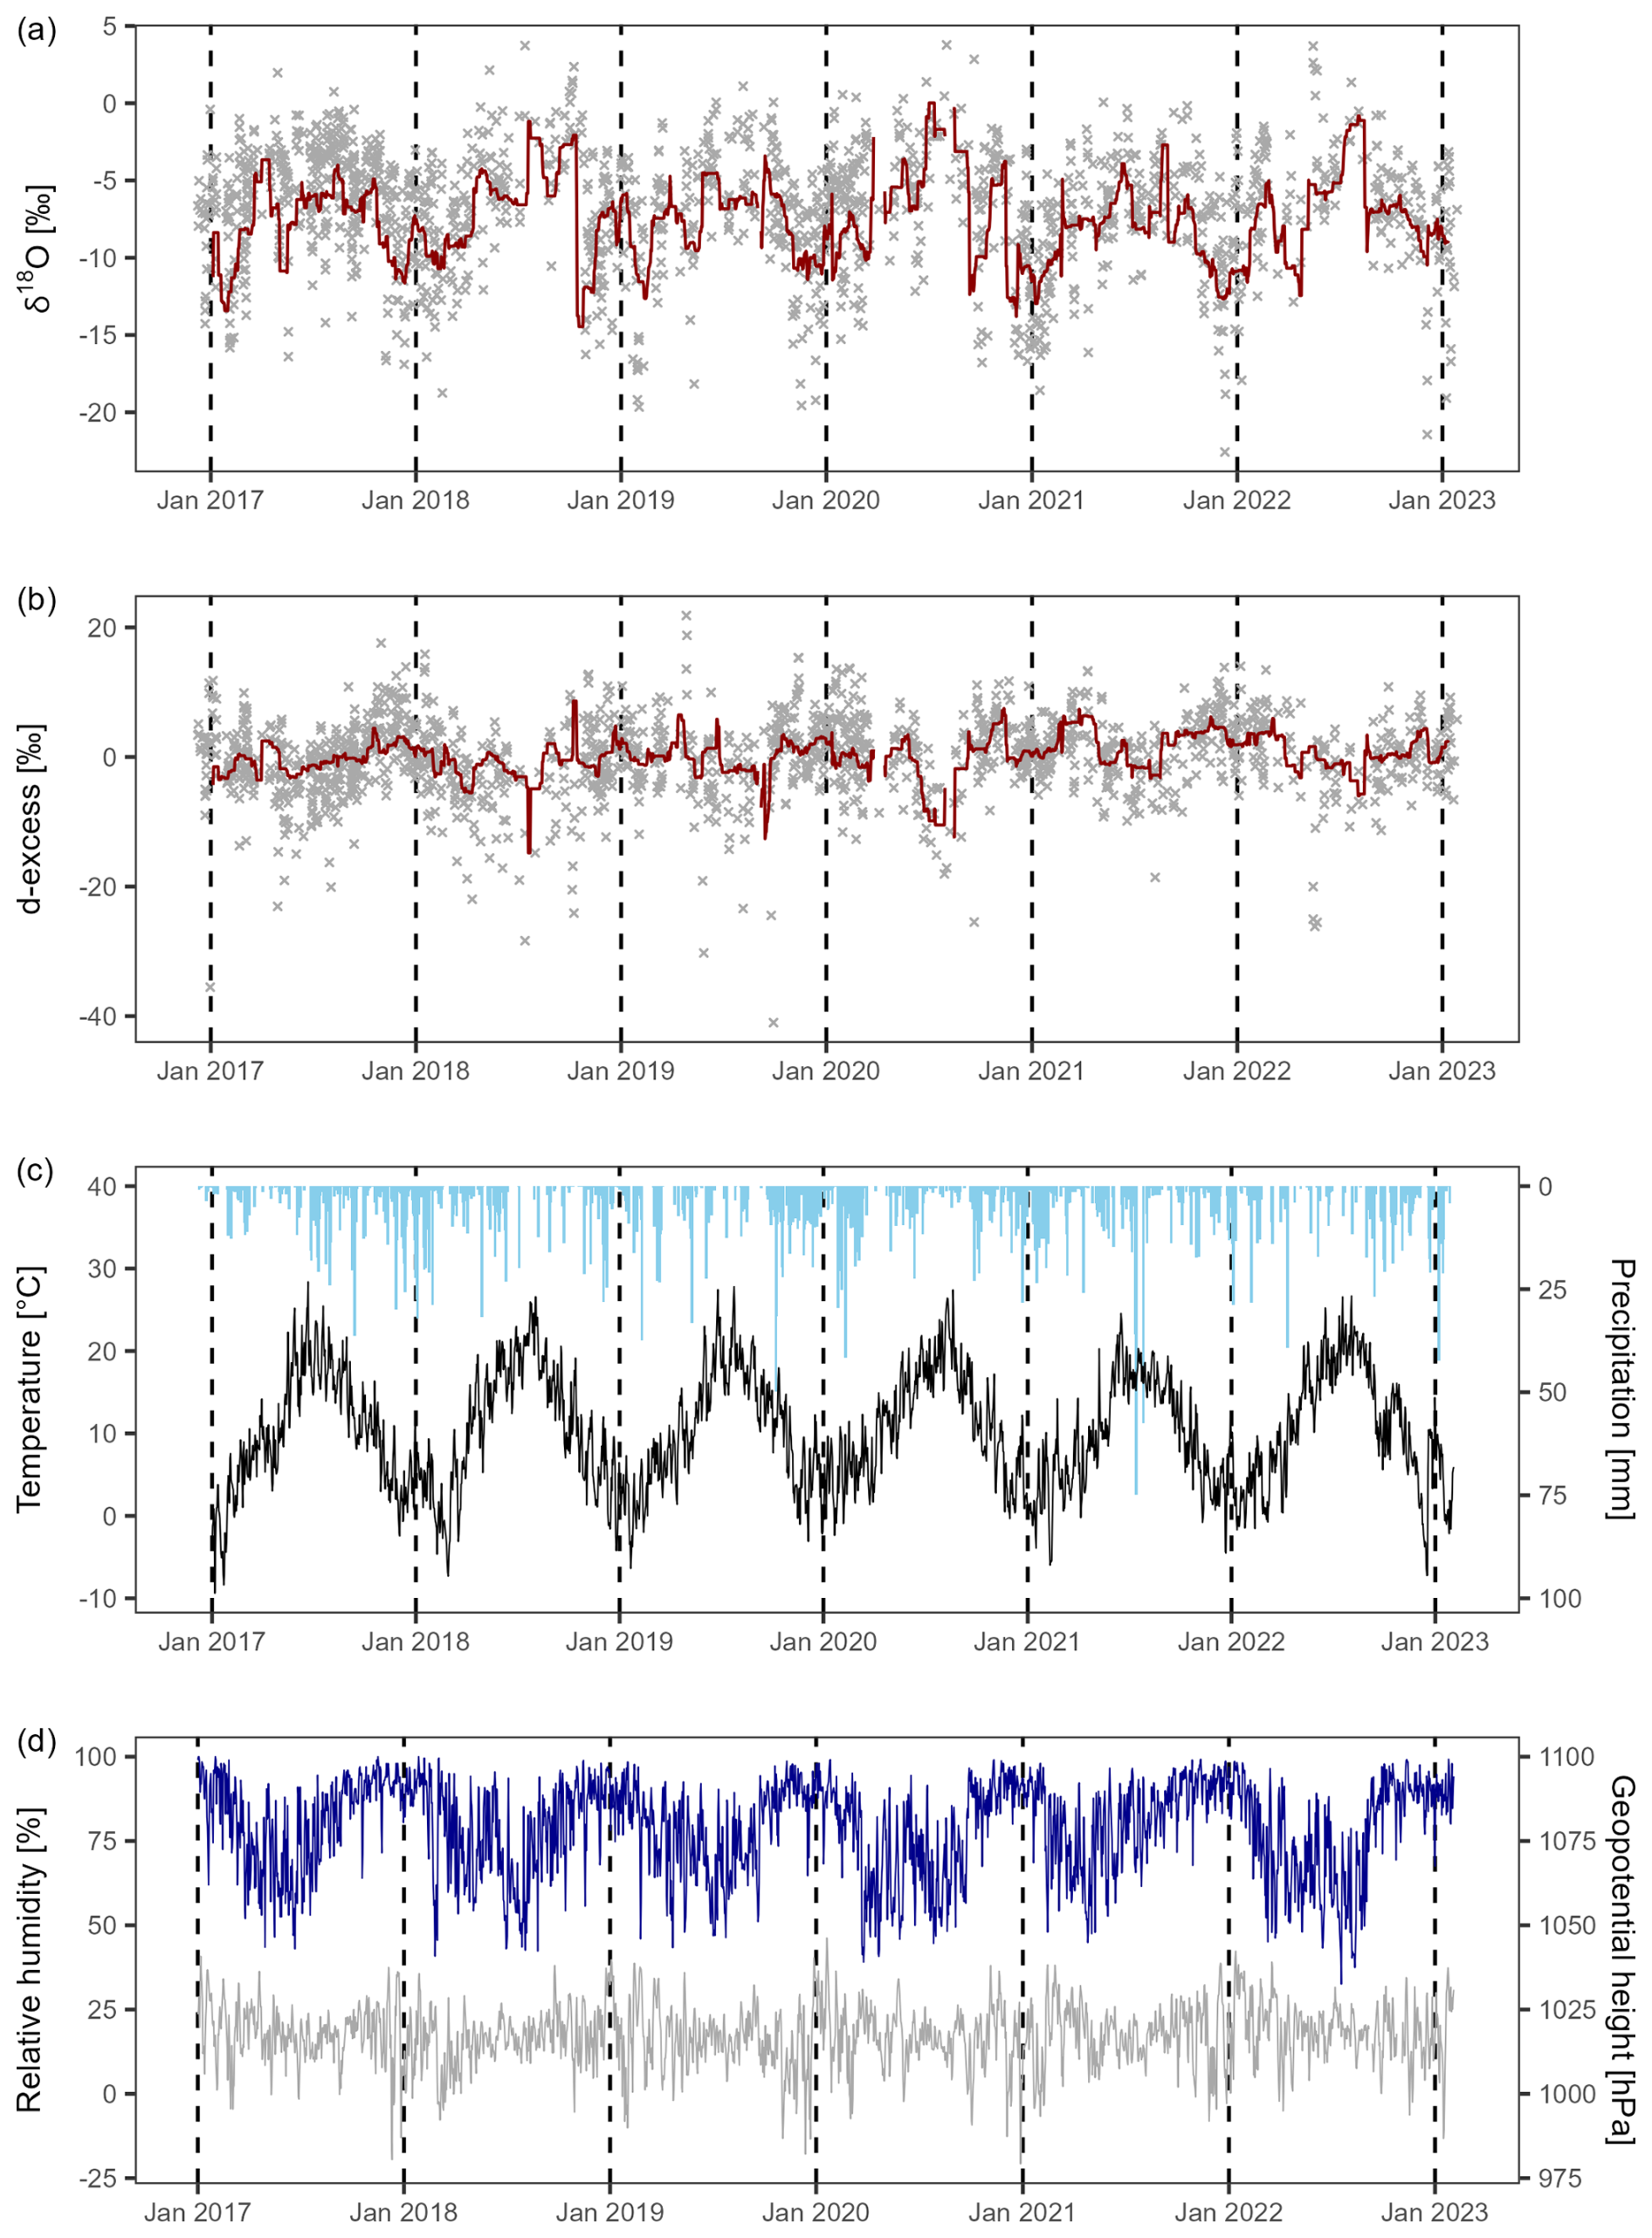
Figure 1Time-series of (a) precipitation δ18O and (b) d-excess, (c) air temperature (black) and precipitation amounts (light blue), and (d) relative humidity (dark blue) and surface pressure (grey) in Belvaux (L). Sampling frequency in (a) and (b) is sub-daily representing individual precipitation events or intervals of the automatic sampler. The red lines represent precipitation amount-weighted 30 d running means of the δ18O and d-excess. Hourly frequency time-series are displayed for the meteorological variables, except for the precipitation in (c), which matches the sampling frequency in (a) and (b).
3.1 Isotope and meteorological variability at the study site
Considering all the measurements over the sampling interval (N=1586), the mean weighted precipitation δ18O was −8.1 ‰ with an interquartile range (IQR) of 5.0 ‰, and d-excess 10.8 ‰ with an IQR of 7.0 ‰. For samples larger than 1.0 mm of precipitation (N=648), these values changed slightly, with a mean weighted precipitation δ18O of −7.9 ‰ and an IQR of 5.3 ‰ for δ18O, and 10.6 ‰ and an IQR of 6.2 ‰ for the d-excess. The isotope values of precipitation exhibited a distinct seasonality, with inverse patterns for δ18O and the d-excess (Fig. 1a and b). The mean weighted summer high for precipitation δ18O was −5.6 ‰ with an IQR of 3.6 ‰ and the mean weighted winter low for δ18O was −8.9 ‰ with an IQR of 5.4 ‰ (N=648). For the d-excess, the mean weighted summer low was 7.2 ‰ with an IQR of 5.2 ‰, and the mean weighted winter high was 11.8 ‰ with an IQR of 5.9 ‰, and even higher values in autumn (weighted mean 12.2 ‰, IQR 5.1 ‰). Intramonthly variability was high, with an average standard deviation of 2.9 ‰ for δ18O and 4.1 ‰ for d-excess values (N=648), slightly below the IQR of the isotope signals. The LMWL was flatter than the GMWL with a slope of 7.46 (versus 8.00, GMWL) and an intercept of 5.99 ‰ (versus 10.0 ‰, GMWL) (Fig. A1a in Appendix). The LMWLs also showed seasonal differences, with slopes ranging from 7.14 (JJA) to 7.84 (DJF), and intercepts ranging from 1.01 ‰ (JJA) to 10.51 ‰ (DJF) (Fig. A1b in Appendix).
The mean annual air temperature during the sampling intervals was 10.4 °C – slightly higher than the climatic normal (1991–2020) of 9.9 °C in Luxembourg (MeteoLux, 2024). Note that the year 2021 was colder, with a mean annual air temperature of 9.5 °C. Compared to the 2017–2022 mean annual precipitation of 876 mm, rainfall totals were rather high in 2021 (1026 mm) – mostly due to a very wet summer (JJA, 324 mm) that eventually led to disastrous flood events in Germany, Belgium and Luxembourg (Fig. 1c). Winter and spring of 2017 were rather dry, with seasonal totals of 72 and 78 mm, respectively. The winter of 2019/2020 was rather wet with 420 mm of precipitation. Mean annual precipitation was 876 mm, with seasonal fluctuations comprised between 167 mm (MAM/JJA) and 310 mm (DJF), and 230 mm in autumn (SON).
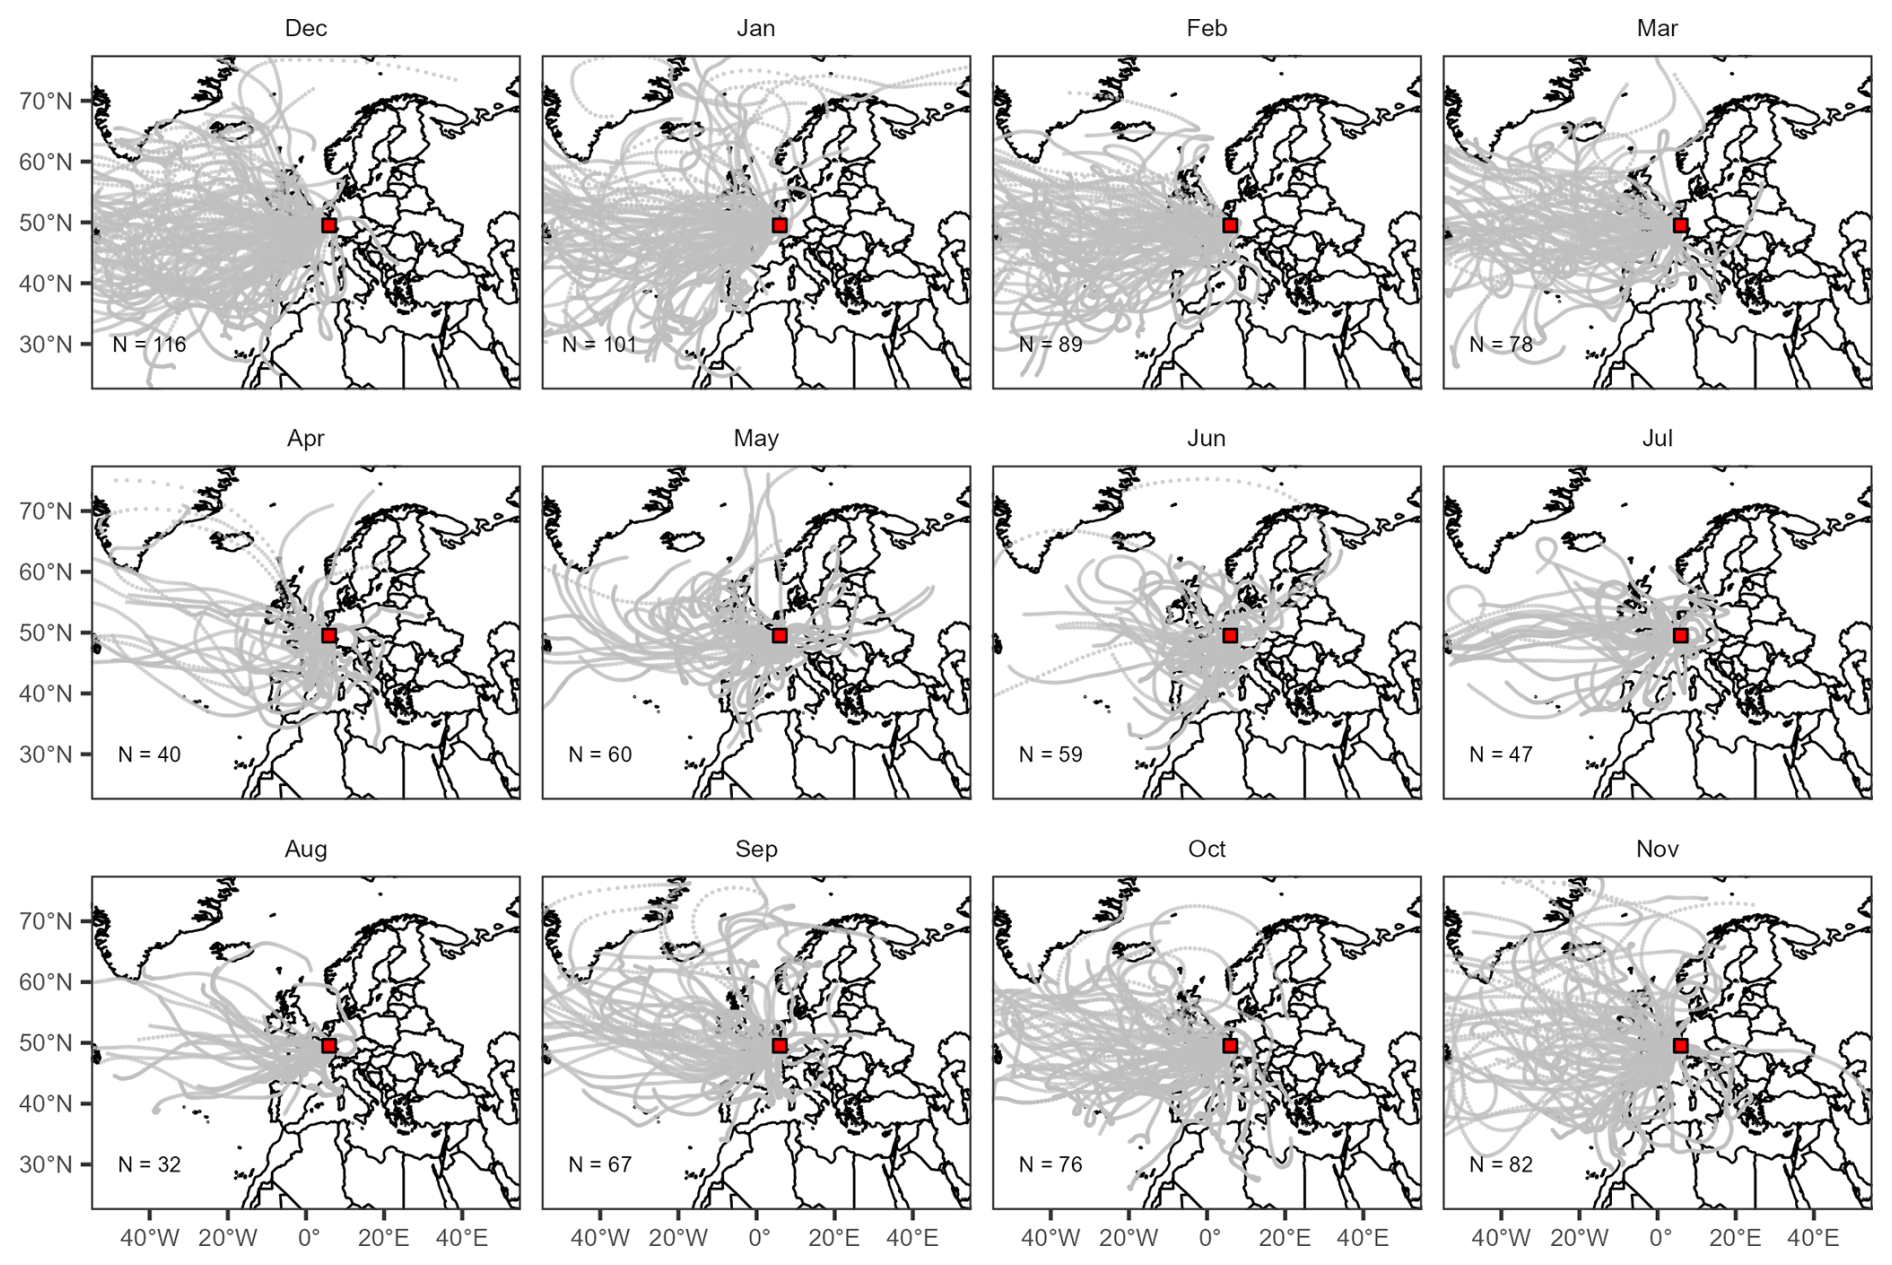
Figure 2HYSPLIT trajectories of incoming air masses for events above 1.0 mm (N=847) between December 2016 and January 2023 regrouped after the month of the year. The location of the isotope sampling site in Luxembourg is indicated with a red rectangle.
3.2 Air mass trajectory simulations and moisture origins
Most simulated trajectories were in DJF (N=306) and SON (N=225), with fewer trajectories in JJA (N=135) and MAM (N=178). They predominantly came from the West, travelling over the North Atlantic Ocean (Fig. 2). Almost all simulated point-locations were westward of the study site, with 80.5 % in JJA, and up to 96.5 % in DJF. Still, some trajectories came from the East travelling over the Eurasian continent or the Baltic Sea in spring and early summer. Few travelled over the Mediterranean or the Balkans in late autumn. Moisture uptake locations were predominantly situated within a 1500 km radius of the study site and over the North Atlantic Ocean, west of the Bay of Biscay (Fig. 3). Most moisture uptake locations lay within a triangle drawn between the study site, the eastern-most point of North America and the Canary Islands.
Moisture origins varied seasonally, with the bulk of moisture coming from remote locations (> 1500 km) over the North Atlantic Ocean from November to March, to be gradually replaced by nearer moisture sources in spring and summer, with up to 50 % of moisture with local origin (< 500 km) in July (Fig. 4a). Mid-range (> 500 km; < 1500 km) Western moisture contributions were large from April to August, with notable peaks in May (35.6 %) and August (53.2 %). Mid-range Southwestern moisture contributions peaked in June (23.0 %) and September (15.3 %), while Southeastern contributions did in April (22.8 %) and October (14.4 %). Mid-range Eastern moisture contributions peaked in May only (10.2 %) and Northern contributions from July to September (10.8–17.2 %).
The seasonality also affected the height of the trajectories carrying the bulk of atmospheric moisture, with about half of the moisture originated at low altitudes (500 m a.g.l.) in spring and summer (Fig. 4b). In autumn and in winter, high altitude (up to 2000 m a.g.l.) and low altitude trajectories carrying atmospheric moisture were more evenly distributed.
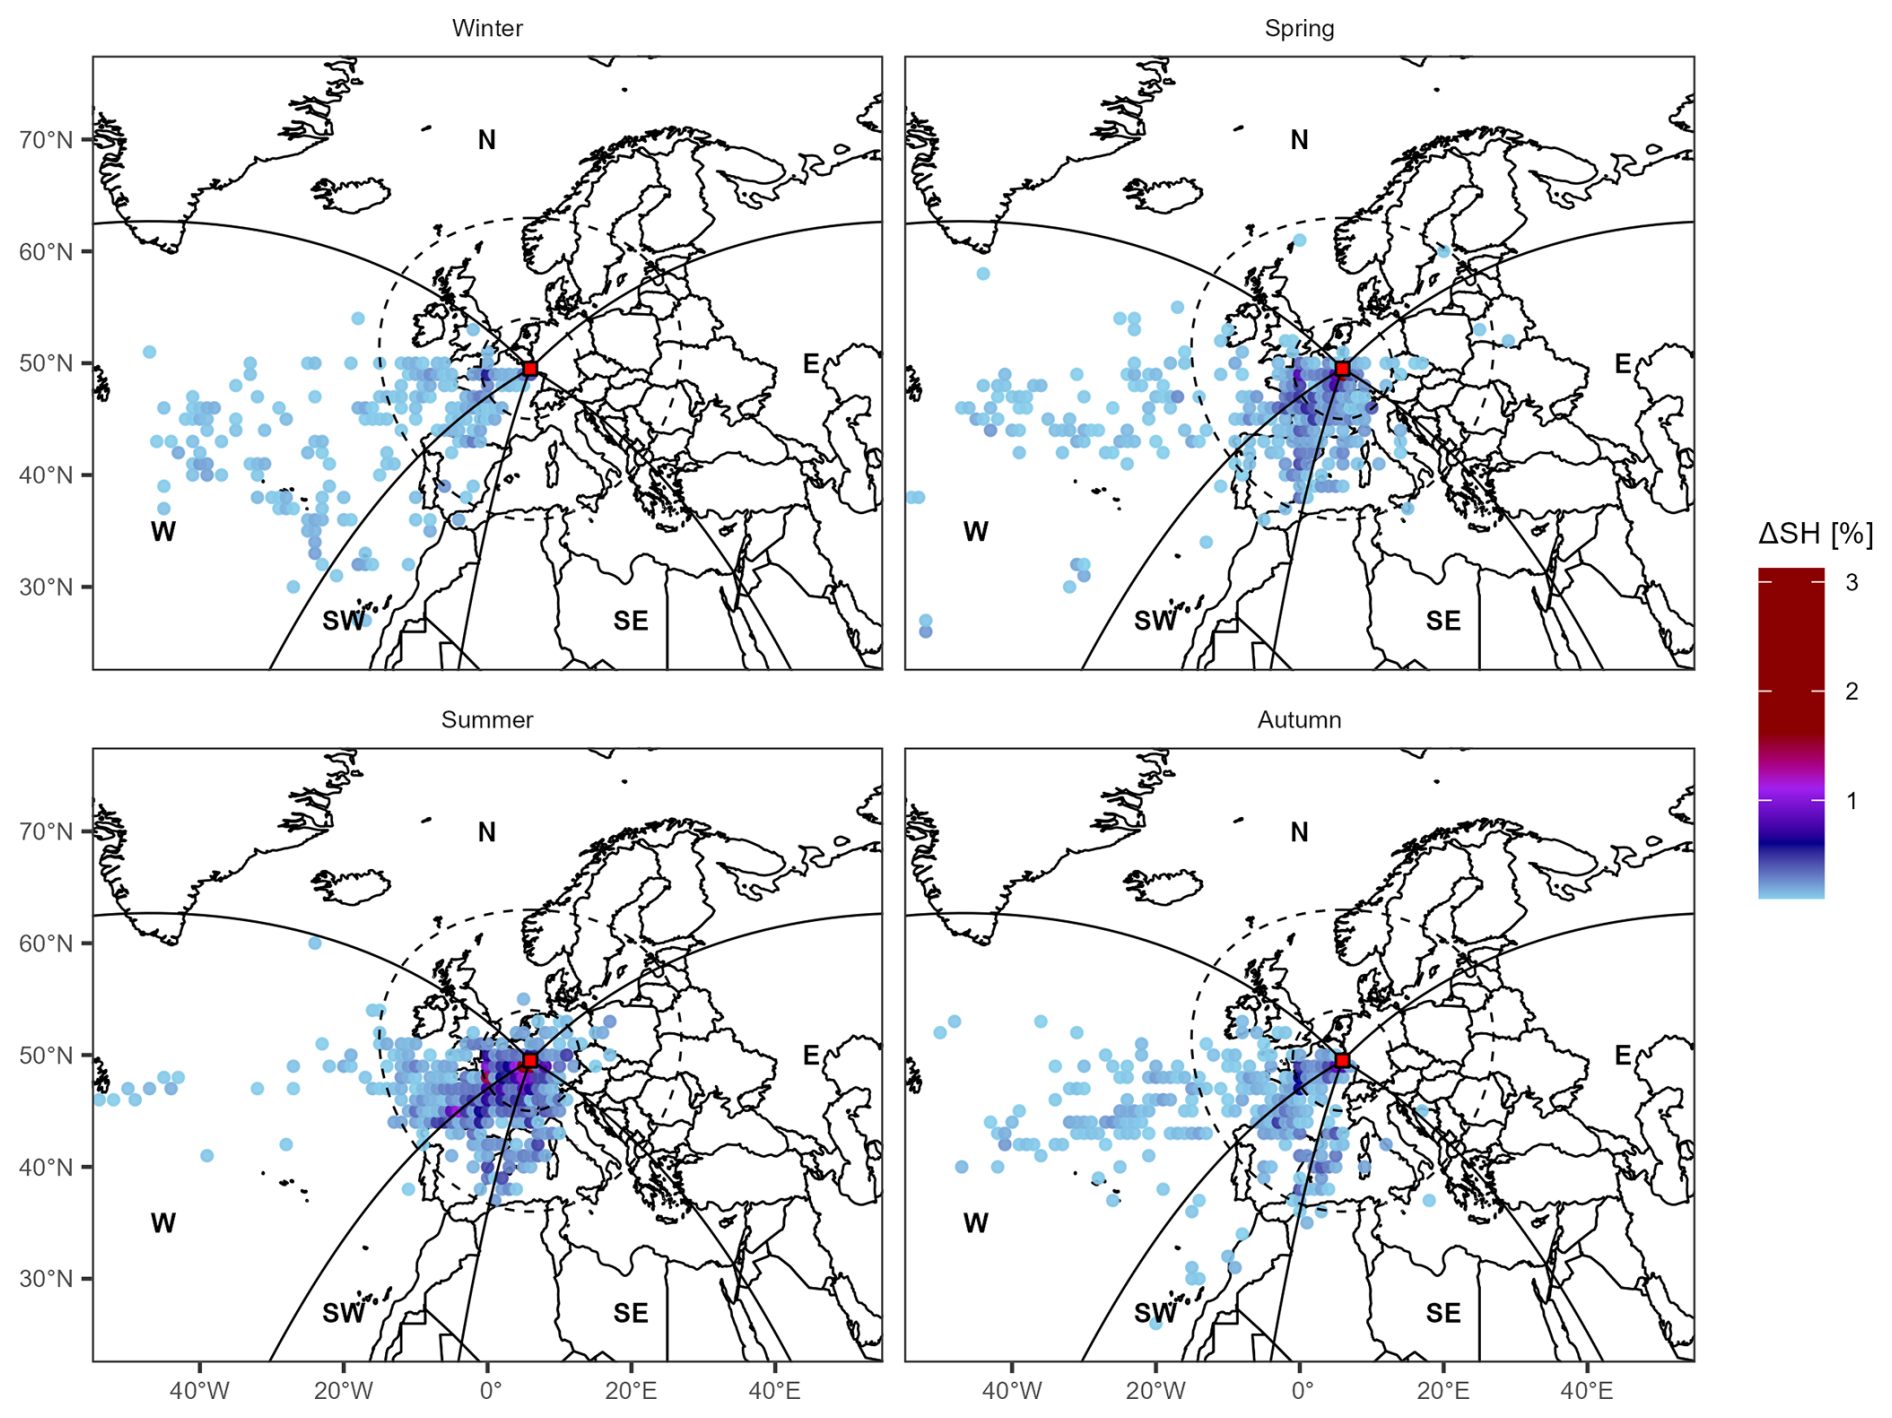
Figure 3Moisture uptake locations for events above the 1.0 mm (N=847) between December 2016 and January 2023 for each season. Only moisture uptake locations contributing to more than 0.1 % of the total seasonal uptake are shown. The colour grading represents the proportional contribution of 1° by 1° cells to the total seasonal uptake. Contributing areas (black lines) have also been designated as areas delimitated by radial lines departing from the sampling site to indicate the direction of incoming air moisture. Three perimeters (500 km, 1500 km, and beyond, dashed lines) have additionally been defined to distinguish local from distant moisture sources. The location of the sampling site is indicated with a red rectangle.
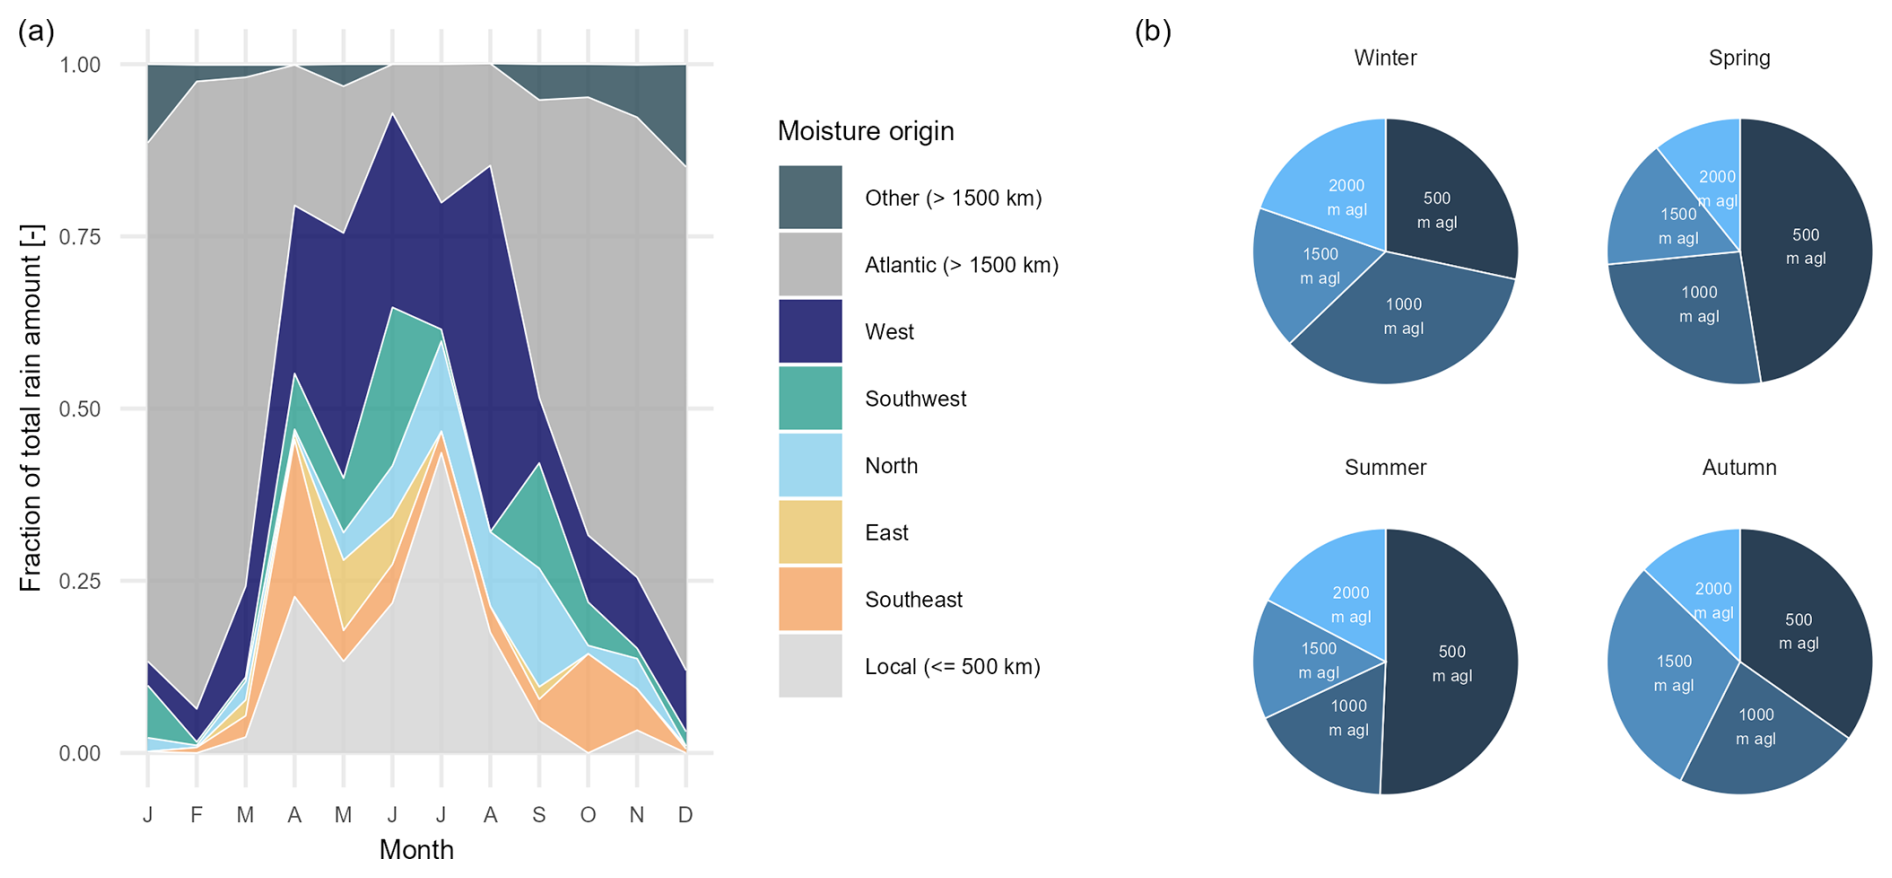
Figure 4(a) Proportional fraction of air moisture origin for events above the 1.0 mm threshold (N=847) between December 2016 and January 2023 based on contributing areas displayed in Fig. 3 of each month of the year. (b) Altitude of retained incoming air mass trajectories for 847 events based on the highest moisture content amongst trajectories at four different heights (500, 1000, 1500, 2000 m a.g.l.).
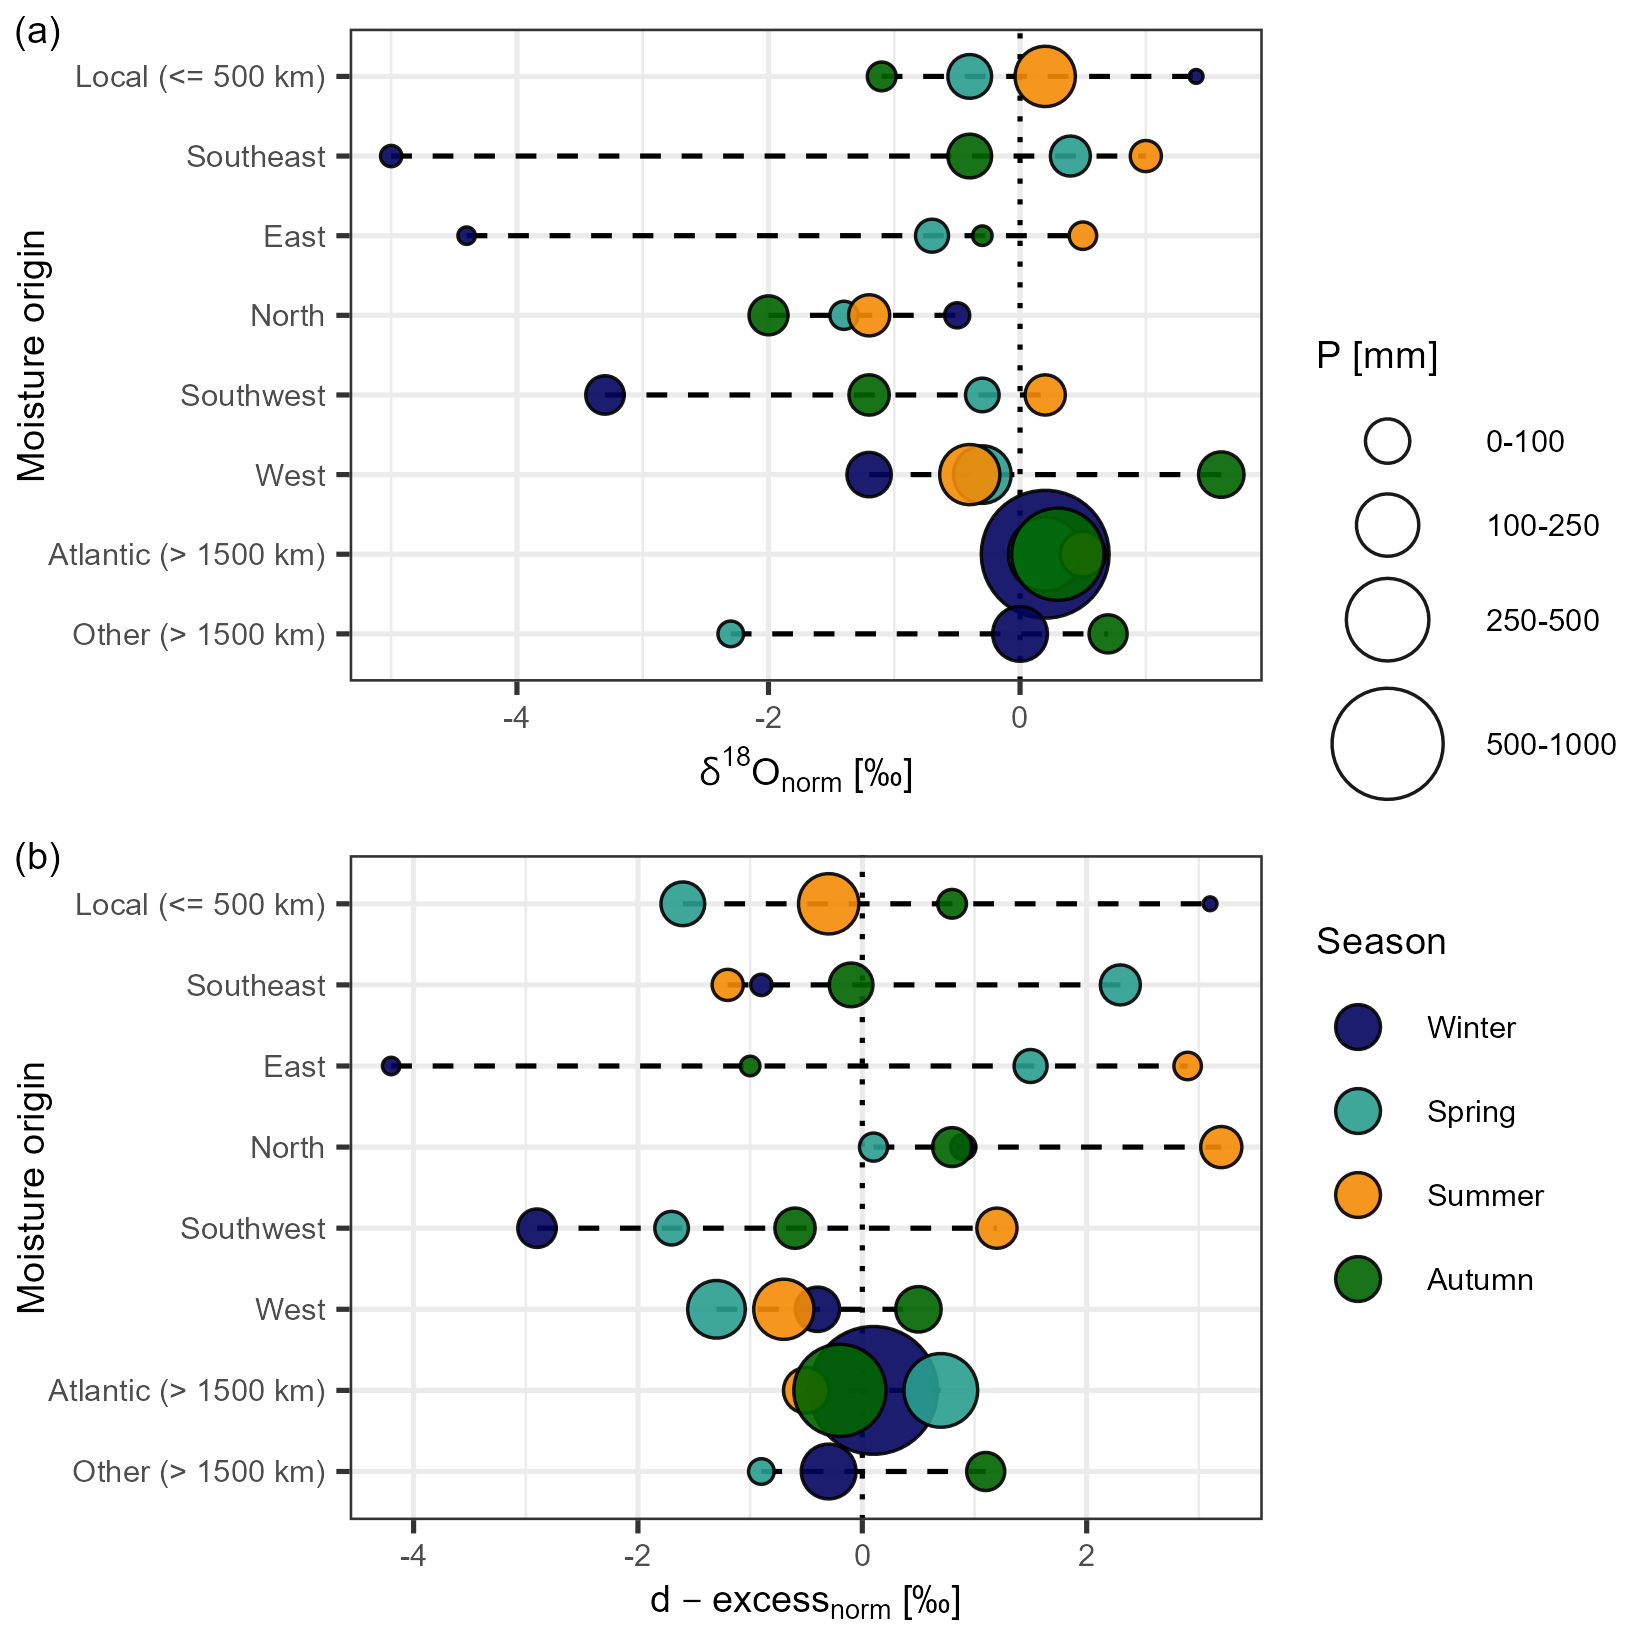
Figure 5Influence of the moisture origin (categories) on seasonal precipitation isotope signals. The circles represent seasonal (indicated by fill colour) means (precipitation amount weighted) of normalised (using 30-day running mean windows) (a) precipitation δ18O (δ18Onorm) and (b) d-excess (d-excessnorm) values (N=847). The circle size is proportional to the total seasonal amount of precipitation; the black dashed lines link the highest seasonal value to the lowest seasonal value as a visual aid for the seasonal range of values within a moisture origin group.
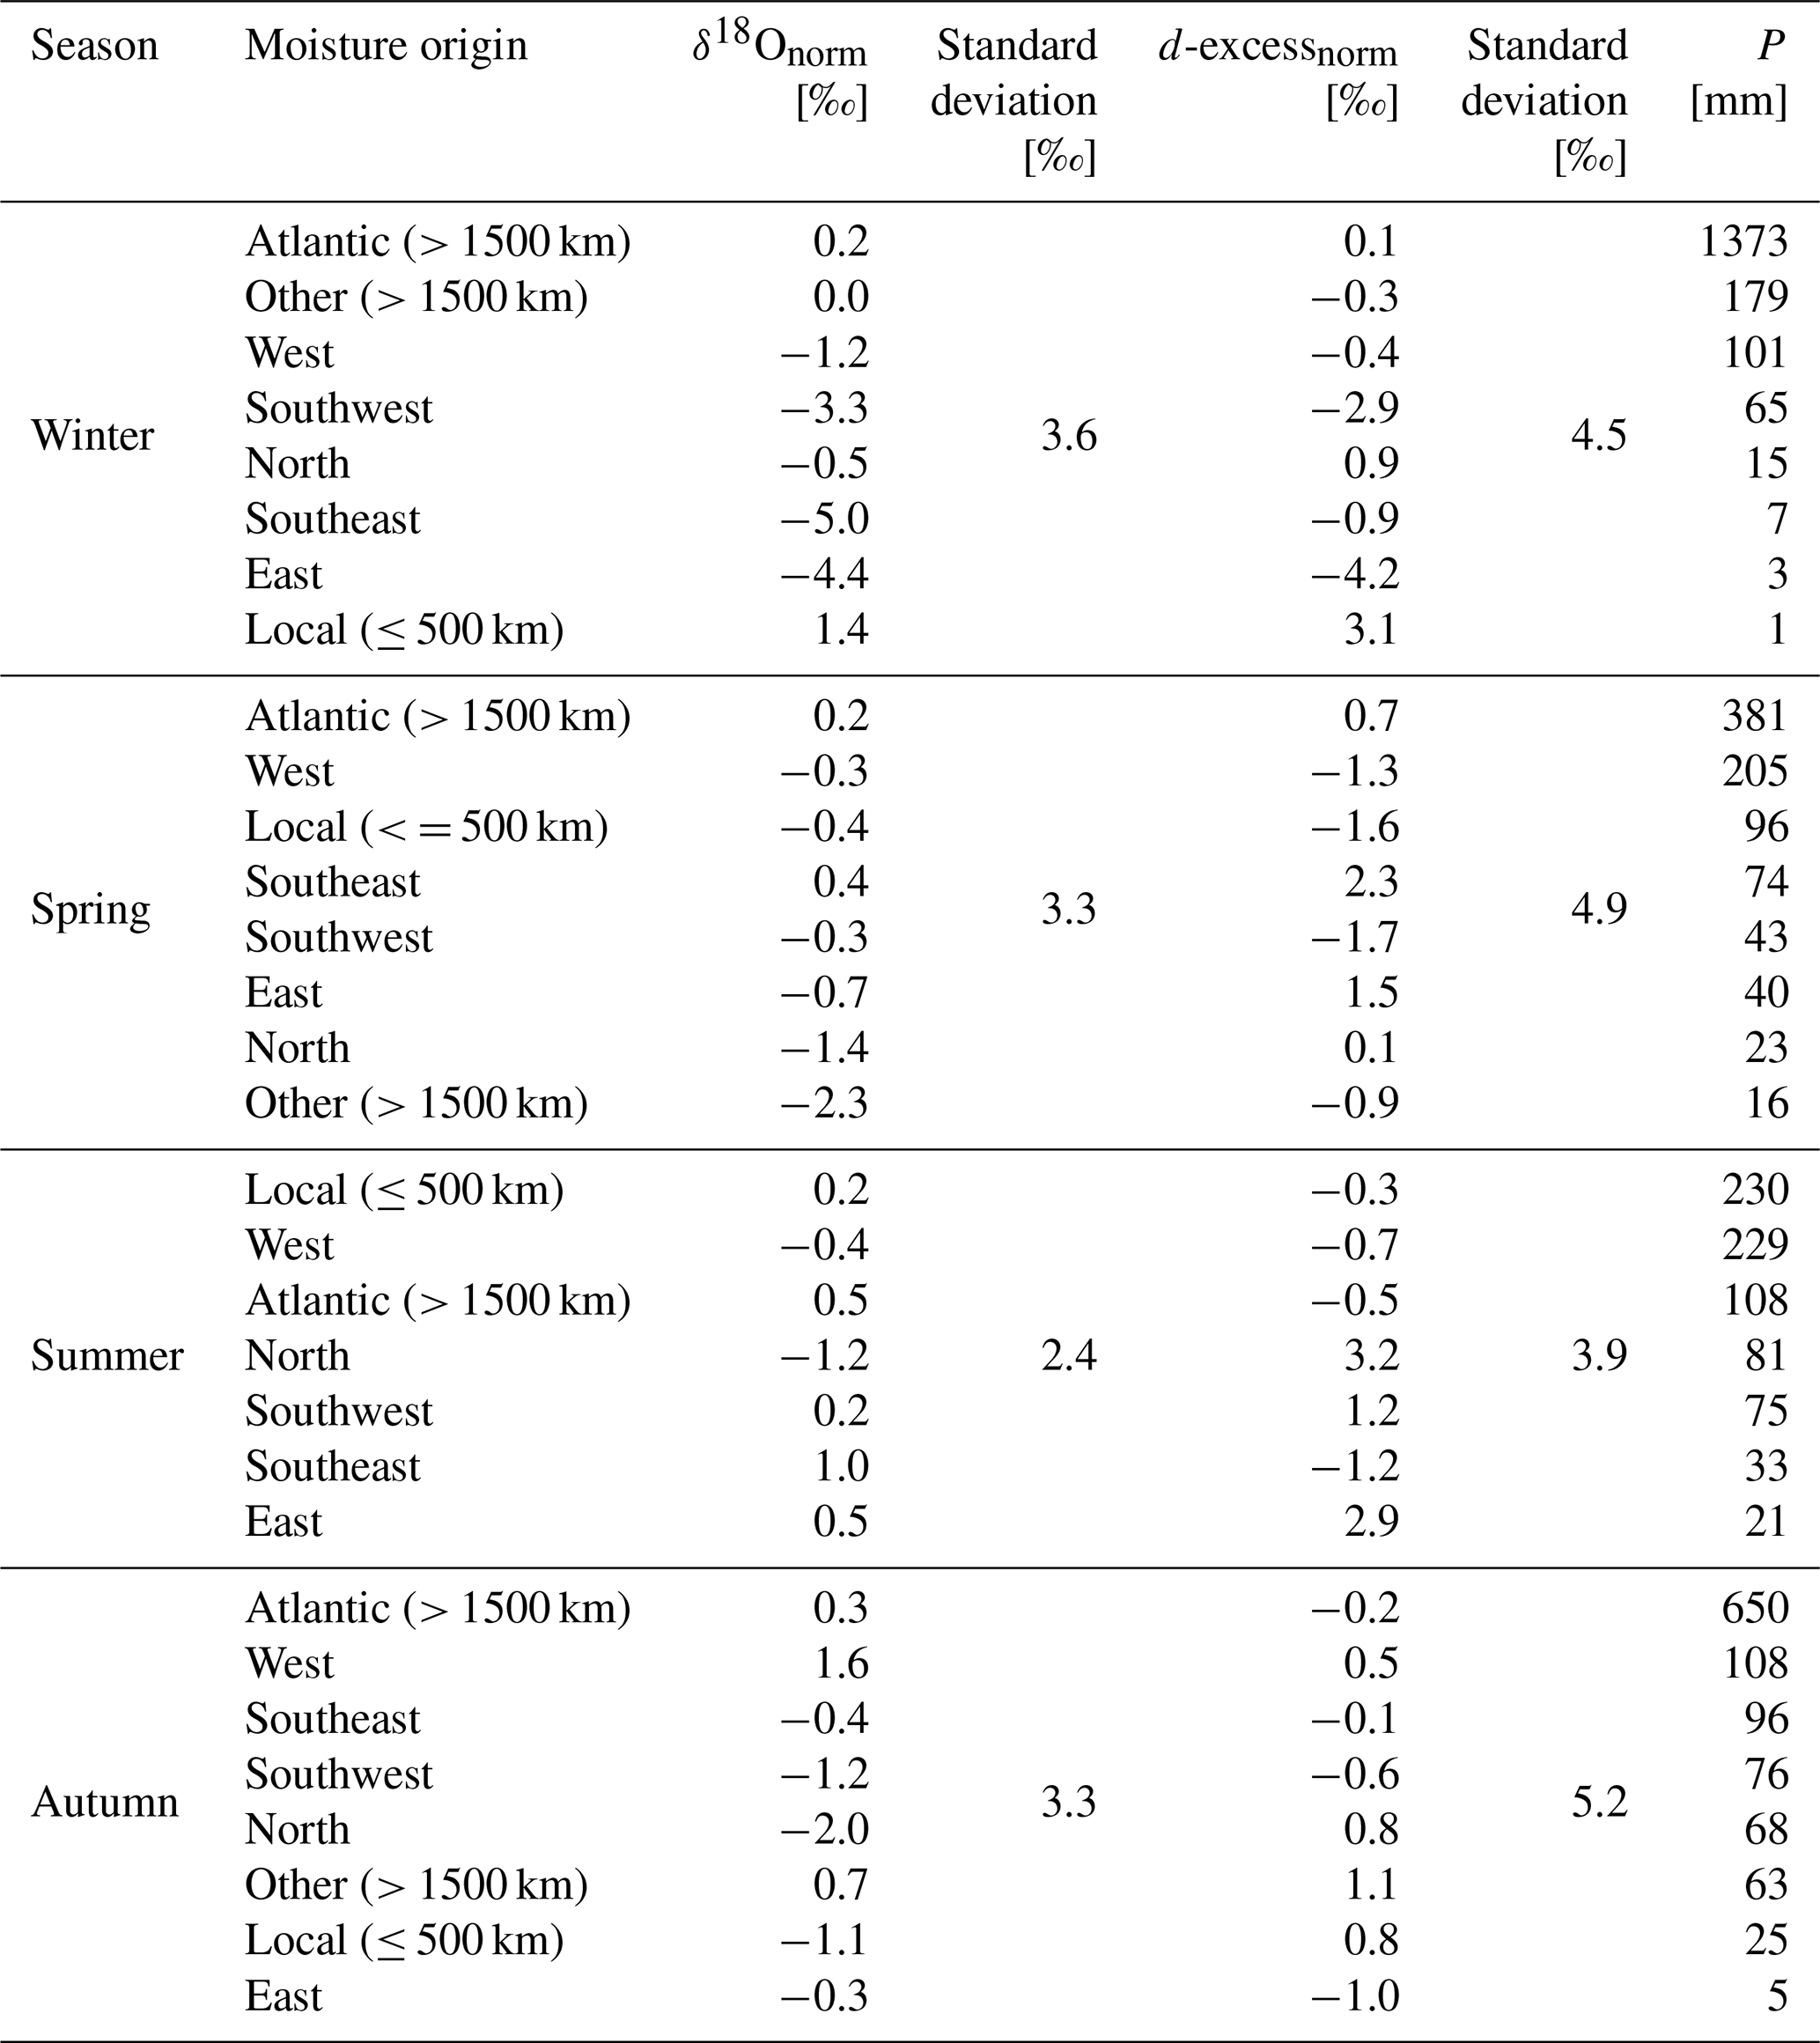
Table 1Seasonal means (precipitation amount weighted) of normalised (using 30-day running mean windows) precipitation δ18O (δ18Onorm) and d-excess (d-excessnorm) values (N=847). Standard deviations and total precipitation amounts are also given.
3.3 Moisture origin influence on precipitation isotope signatures
Moisture origin-specific contributions to precipitation had contrasting seasonal isotope signals, which were reflected in precipitation weighted means of normalised δ18O (Fig. 5a), d-excess values (Fig. 5b) and varying ranges of seasonal values for each moisture origin type. Note that as large moisture contributors leading to rainfalls at the study site, remote (> 1500 km) moisture origins had normalised δ18O (δ18Onorm) and d-excess (d-excessnorm) values near zero in most seasons (Fig. 5). Stronger isotope differences could be observed for mid-range moisture origins (Table 1). Comparing the moisture origin-specific isotope differences with the overall variability of seasonal isotope signals, distinct origin-specific isotope signals were uncertain, as differences sometimes fell within the range of sub-daily isotope variability (Table 1). For example, the precipitation weighted means of δ18Onorm and d-excessnorm values of the main moisture origin groups contributing to rainfalls in winter (i.e., remote and mid-range Western sources) had ranges well under the standard deviation of δ18Onorm and d-excessnorm values in winter (range of 1.4 ‰ against 3.6 ‰ for δ18Onorm; range of 0.5 ‰ against variability of 4.5 ‰ for d-excessnorm values). The only isotope signals differing significantly (i.e., difference close or higher to standard deviation) from that main contribution cluster in winter were mid-range moisture origins form the Southwest, Southeast and East for δ18Onorm (values spanning from −5.0 ‰ to −3.3 ‰). However, some of these groups (Southeast and East) had marginal precipitation contributions, raising questions about the robustness of this result. For d-excessnorm values, no significant difference of moisture origin-specific isotope signals larger than the standard deviation could be found, except for isotope signals from local contributions (3.1 ‰), again with marginal precipitation contributions that contrasted with mid-range Eastern (−4.2 ‰) or Southwestern (−2.9 ‰) isotope contributions.
In spring, moisture origin-specific isotope differences were small compared to the standard deviation of the seasonal isotope signals, with the only notable differences being d-excessnorm signatures coming from mid-range Southeastern origins (2.3 ‰), contrasting with local and mid-range Western and Southwestern moisture origins (values spanning from −1.7 ‰ to −1.3 ‰). In summer, one could stress δ18Onorm differences between mid-range Northern (−1.2 ‰) and Southeastern contributions (1.0 ‰, against a standard deviation of 2.4 ‰) or, to a lesser extent local or remote Atlantic contributions (0.5 ‰). Mid-range Northern contributions in summer also had a significantly higher d-excessnorm values (3.2 ‰) than other dominant precipitation contributing moisture origins, i.e., local, remote Atlantic and mid-range Western contributions (d-excessnorm values spanning from −0.7 ‰ to −0.3 ‰). Lastly in autumn, δ18Onorm form mid-range Western moisture origins (1.6 ‰) contrasted with mid-range Southwestern (−1.2 ‰) and Northern (−2.0 ‰) moisture origins. For d-excessnorm values, the differences were small.
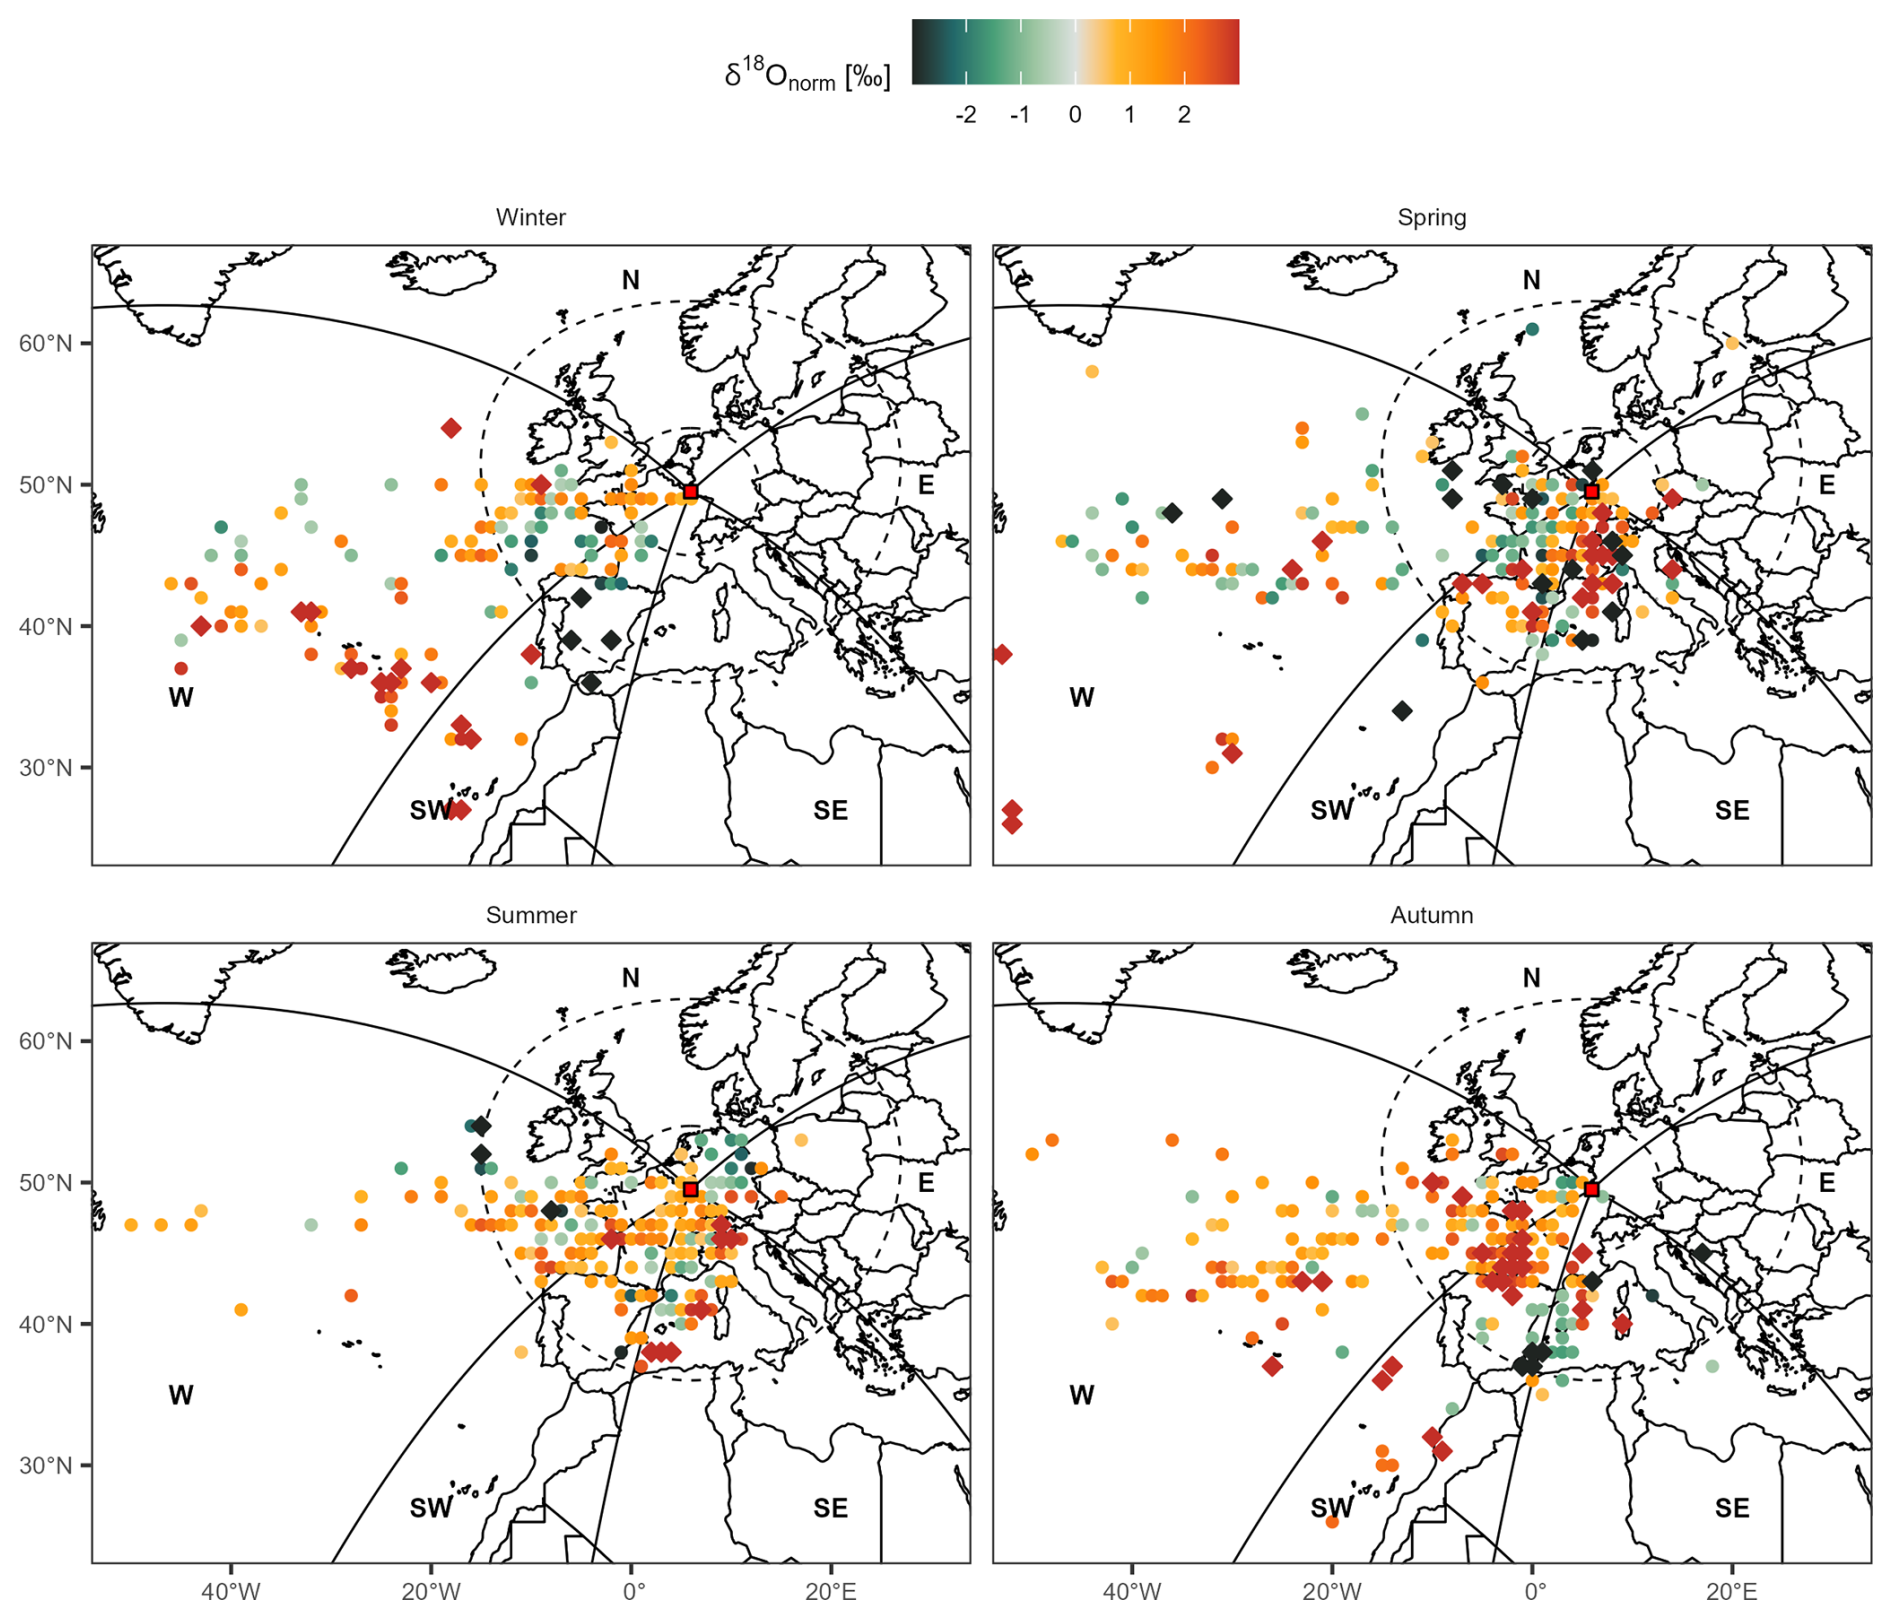
Figure 6Maps of normalised precipitation δ18O (δ18Onorm) values at the study site (N=847) based on the air moisture contributing areas (Fig. 3). Only moisture uptake locations contributing to more than 0.1 percent of the total seasonal uptake are shown. The colour of the points represents the mean (precipitation amount weighted) δ18Onorm (using 30 d running mean windows) of all trajectories carrying moisture from that specific location (i.e., cell of 1° by 1° raster). It is important to note that these are precipitation δ18Onorm from the sampling site marked by a red square, not δ18Onorm at the moisture origin. Moisture uptake locations with precipitation δ18Onorm between −0.5 ‰ and 0.5 ‰ are not shown, while moisture uptake locations with precipitation δ18Onorm below −3.0 ‰ are marked with black diamonds and above 3.0 ‰ with red diamonds.
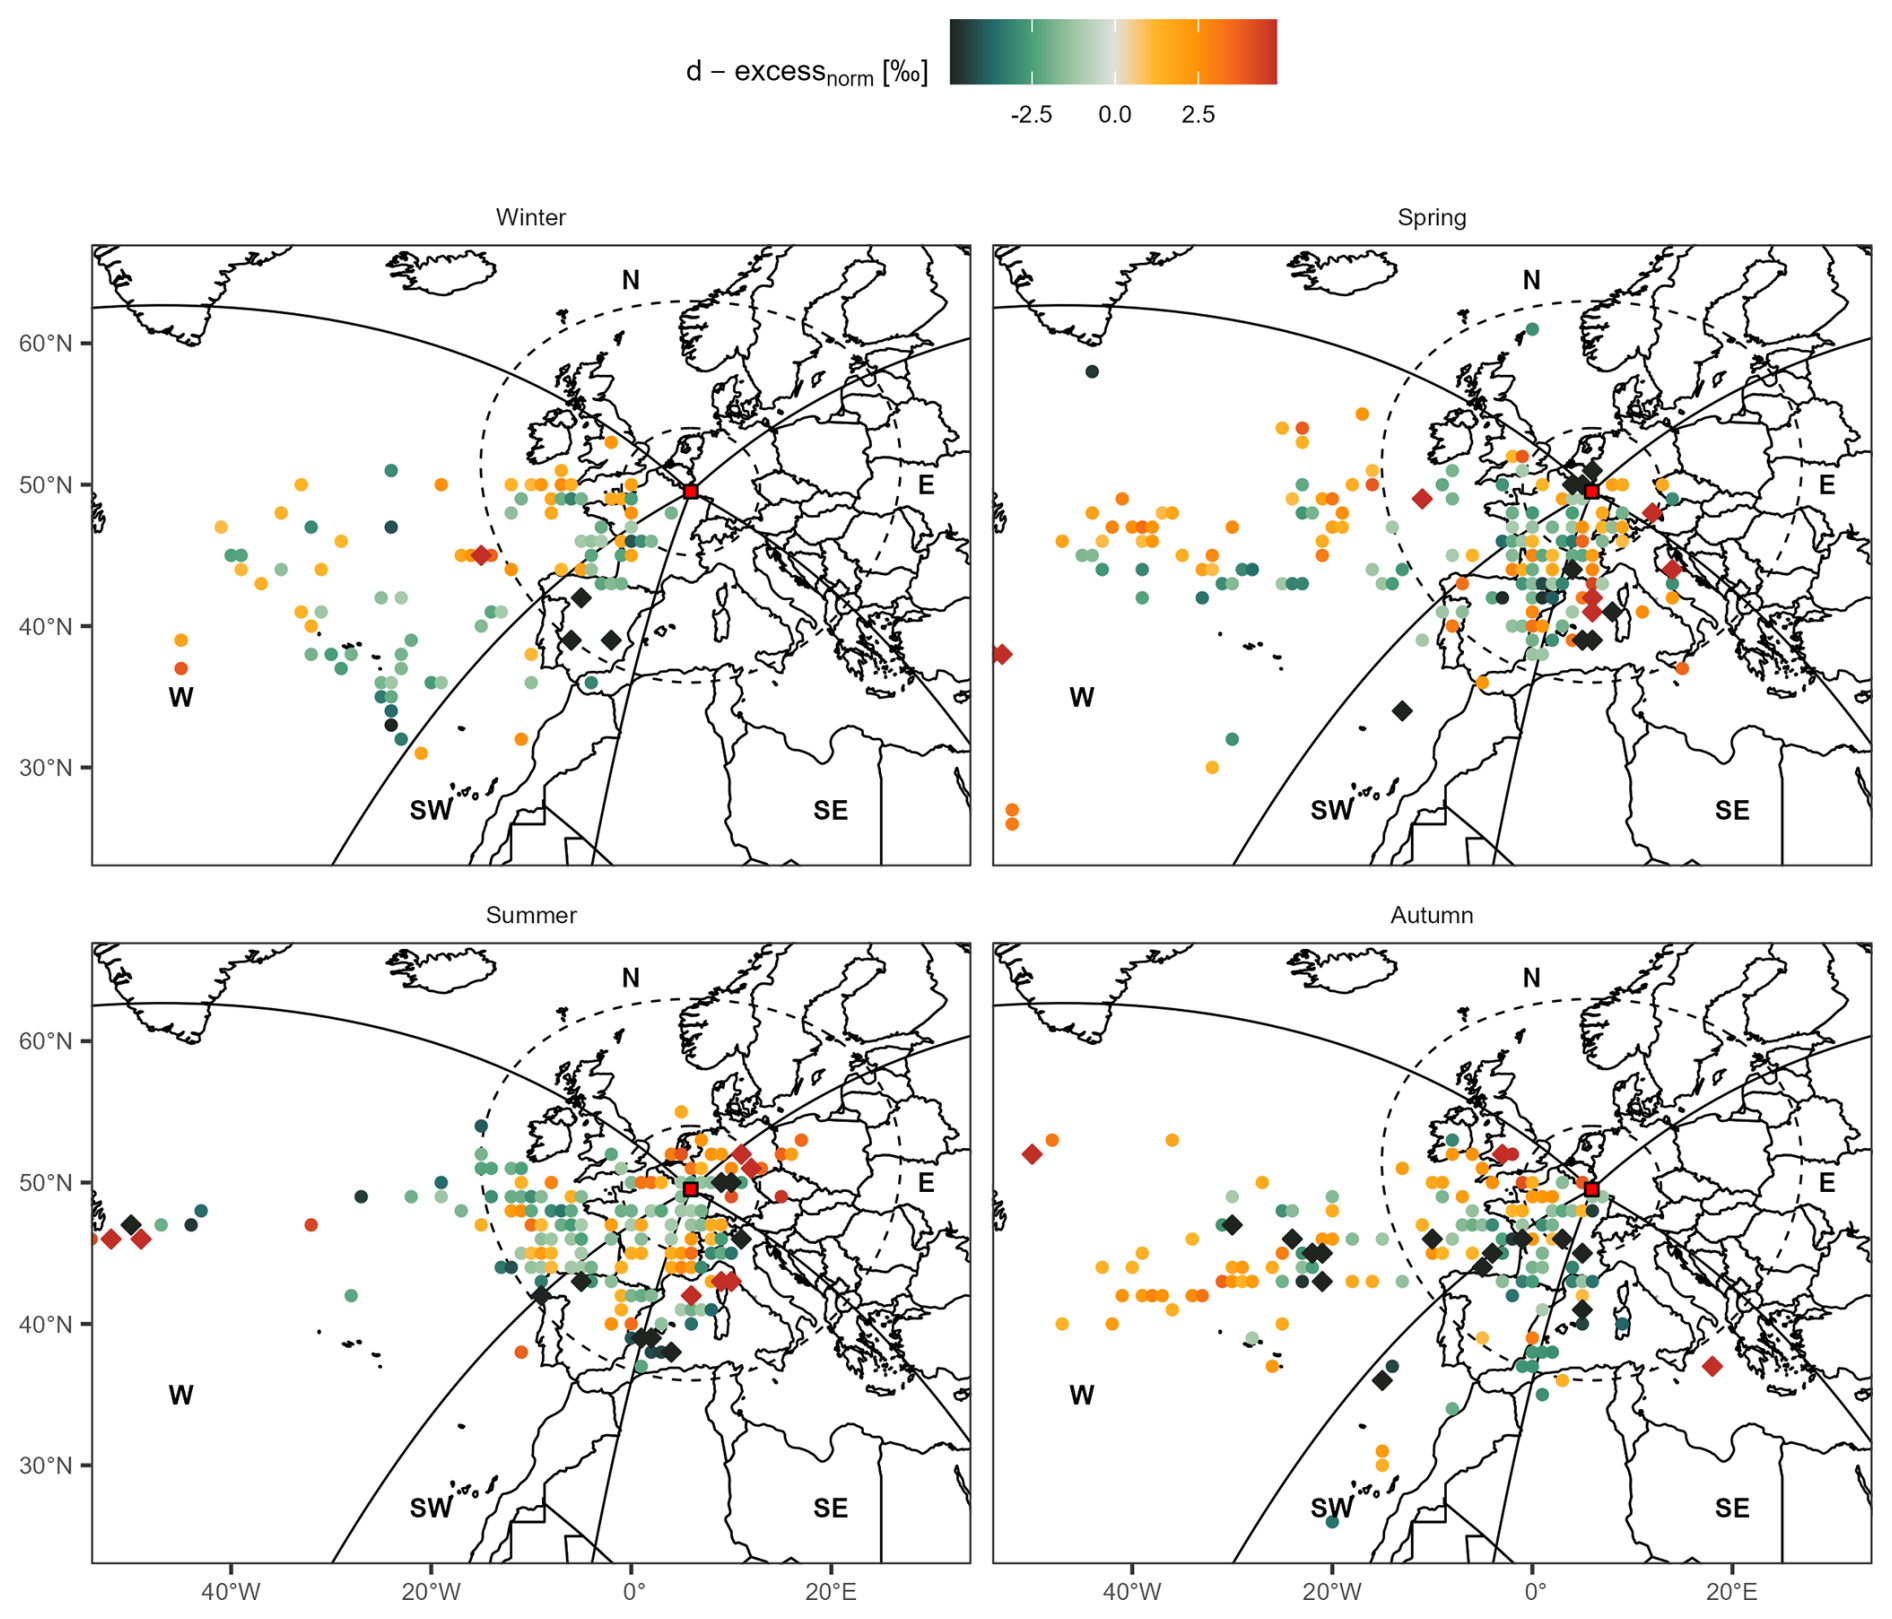
Figure 7Maps of normalised precipitation d-excess (d-excessnorm) values at the study site (N=847) based on the air moisture contributing areas (Fig. 3). Only moisture uptake locations contributing to more than 0.1 % of the total seasonal uptake are shown. The colour of the points represents the mean (precipitation amount weighted) precipitation d-excessnorm (using 30 d running mean windows) of all trajectories carrying moisture from that specific location (i.e., cell of 1° by 1° raster). It is important to note that these are precipitation d-excessnorm values from the sampling site marked by a red square, not d-excessnorm at the moisture origin. Moisture uptake locations with precipitation d-excessnorm between −1.0 ‰ and 1.0 ‰ are not shown, while moisture uptake locations with precipitation d-excessnorm below −5.0 ‰ are marked with black diamonds and above 5.0 ‰ with red diamonds. The location of the sampling site is indicated with a red rectangle.
Maps of precipitation δ18Onorm (Fig. 6) and d-excessnorm values (Fig. 7) at the study site were analysed next, with moisture origins classified according to the contributing areas shown in Fig. 3. It is important to note that these maps represent isotope signatures in precipitation measured at the study site, not the vapor isotope signature at the moisture origin. In winter, a cluster of highly positive δ18Onorm could be seen in the areas between and around the Azores and the Canary Islands (Fig. 6). More positive δ18Onorm were also found in the northern part and Atlantic coast of France, northern coast of Spain and in some parts of the Atlantic southwest of Ireland. The Iberian Peninsula had highly negative δ18Onorm values, while more negative δ18Onorm values could also be found in the Pyrenees, over the Massif Central in France and in the Gulf of Biscay. In spring, highly positive δ18Onorm values were found south of the study site all the way to the Mediterranean and north of the Iberian Peninsula. Isolated points of more negative δ18Onorm values were over the Alps and the Pyrenees, Corsica and the Balearic Islands. More positive δ18Onorm values also came West of the study site over France and the English Channel, the Bay of Biscay, and over the Atlantic south of Ireland. Remote sources over the Atlantic were tendentially more positive in δ18Onorm in spring. In summer, more positive δ18Onorm values came from the western part of the Mediterranean, the north of Italy, vast parts of France and the Bay of Biscay. Few locations with lower δ18Onorm values in summer were over Germany and the south of France and north of the Balearic Islands. In autumn, highly positive δ18Onorm came from the Bay of Biscay, the western part of France and northern parts of the Iberian Peninsula. Some locations with more positive δ18Onorm were found in the southern parts of the British Isles and surrounding waters all the way to the Bay of Biscay. Remote sources over the Atlantic were tendentially more positive in δ18Onorm, also near the Canary Islands and over Morocco. Highly negative δ18Onorm values came from the area the Gibraltar Peninsula, and lower δ18Onorm values were found in surrounding parts of the Mediterranean and the Balearic Islands.
For the d-excessnorm in winter, highly negative values were found again over the Iberian Peninsula (Fig. 7). This time, more negative d-excessnorm values were localized around the Azores, the Western edge of the Pyrenees and the Bay of Biscay. Clear clusters of more positive values were difficult to identify, but more positive d-excessnorm values could be found North of France, in the English Channel, South of the British Isles, and remote Atlantic locations. In spring, more negative d-excessnorm values were over the Pyrenees, in the Mediterranean east of the Spanish coast, Central France and near the study site. Remote more negative and more positive d-excessnorm locations were scattered interchangeably the Atlantic Ocean between the latitudes 40 and 50° N. More positive d-excessnorm values in spring were found around the Alps and in the Mediterranean South of France. Locations to the southeast of the study site also had more positive d-excess values. In summer, a cluster of highly negative d-excessnorm values extended from the Mediterranean East off the Spanish coast all the way to Corsica. More negative d-excessnorm values were also found on the northwestern tip of the Iberian Peninsula, in the Bay of Biscay, and west of the southern tip of Ireland. Highly positive d-excessnorm values were over Corsica and around the Polish-German border. Other areas with more positive d-excessnorm values were in the south of France and west of the Bay of Biscay. In autumn, clear clusters of negative and highly negative d-excessnorm values were over Central and Southern France, the Pyrenees, the Bay of Biscay, and the Western Mediterranean around the coasts of Spain and France. Another cluster was located in the Atlantic Ocean northwest of the Azores. More positive d-excessnorm values were found on the other hand in Northern France, and south of the British Isles. Additional more positive d-excessnorm values were found in the Atlantic Ocean, north and northwest of the Azores.
In brief, the Iberian Peninsula, the Western Mediterranean around the coasts of Spain and France, the Bay of Biscay, the English Channel, the Atlantic around the coast of the southern tip of Ireland, and the Azores were identified as areas of distinct isotope signals reaching the study site in Luxembourg. Orographic obstacles (i.e., mountain chains such as the Pyrenees, Alps or Massif Central) appeared to influence isotope signals of precipitation as well.
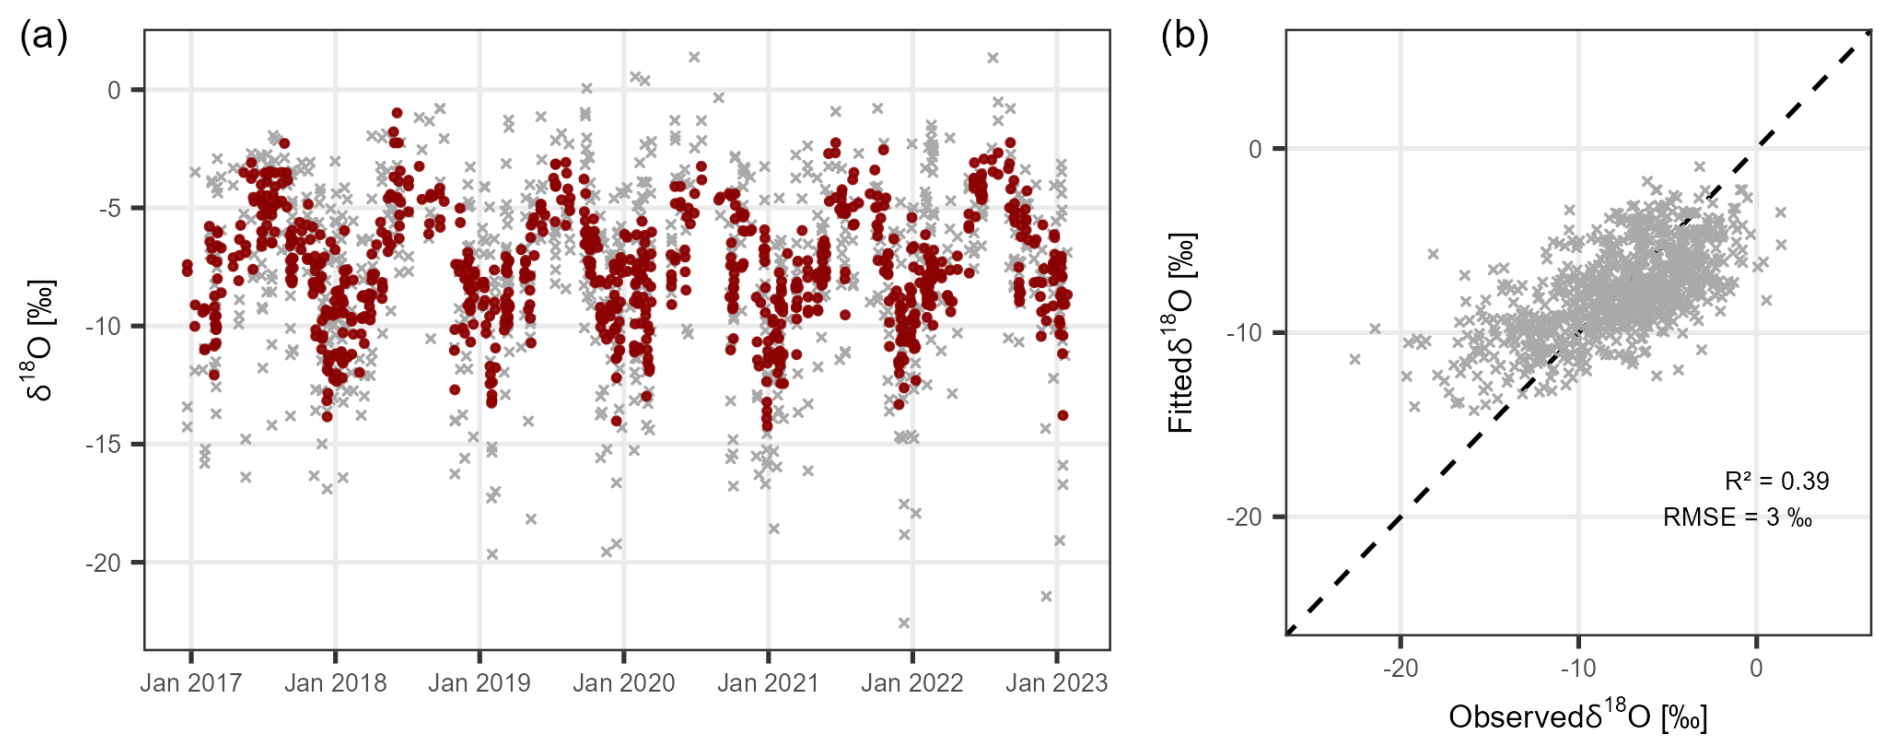
Figure 8(a) Observation (grey) and predicted (red) precipitation δ18O for events above the 1.0 mm (N=837) based on multiple linear regression model using local meteorologic variables. (b) Observed δ18O plotted against fitted δ18O with goodness-of-fit metric (R2) and the root mean square error (RMSE). The dashed line represents the 1:1 line.
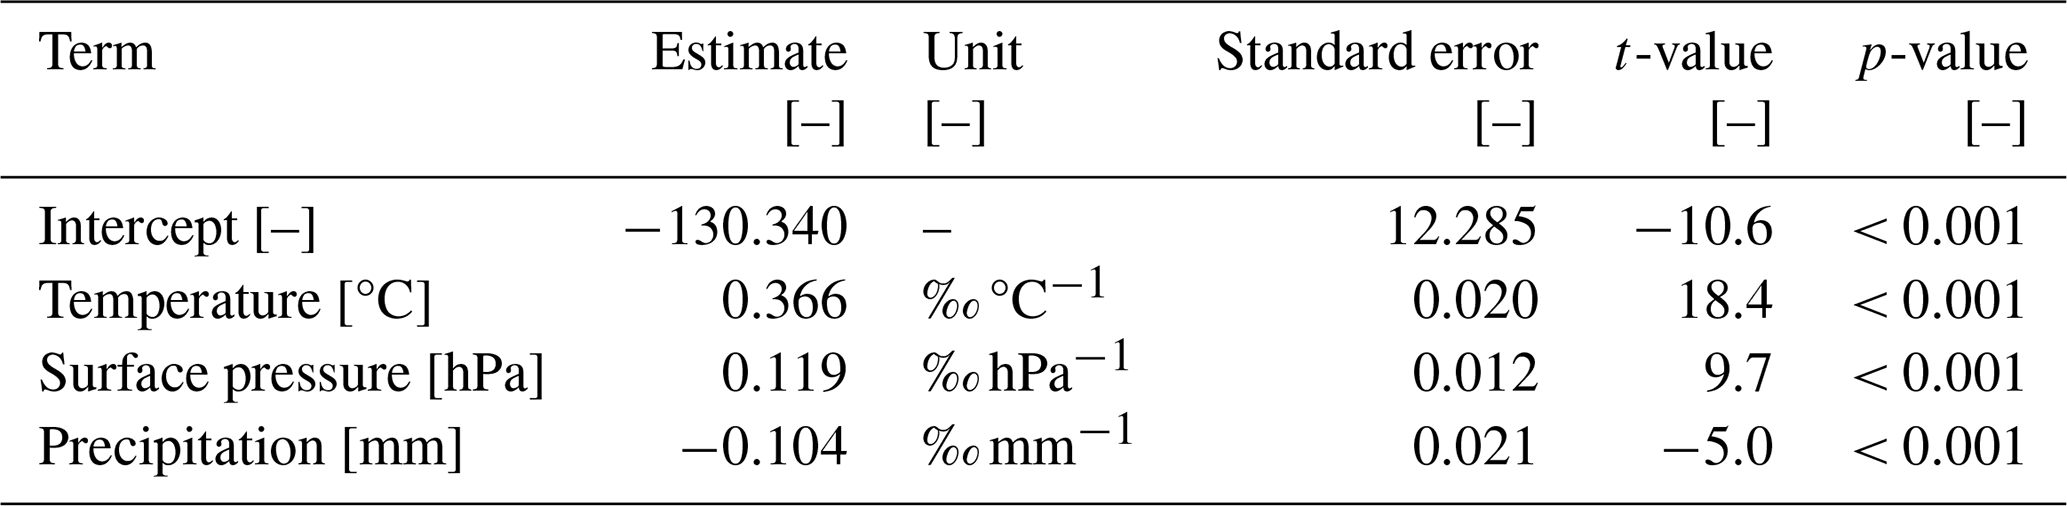
Table 2Summary of the coefficients of the multiple linear regression model for precipitation δ18O using local meteorological variables (N=837).
3.4 Multiple linear regression models for precipitation δ18O based on local meteorologic variables
The multiple linear regression model for sub-daily precipitation δ18O based on precipitation amount, air temperature, and surface pressure fairly represented seasonal δ18O (Fig. 8a) and modelled δ18O was significantly correlated with observed δ18O (R2=0.39, p < 0.001). The RMSE of 3.0 ‰ was largely below the IQR of sub-daily δ18O (5.0 ‰). Systematic overestimations towards the lower end of values occurred, which typically correspond to the winter season, and underestimations in summer towards the higher end of the δ18O spectrum (Fig. 8a). This led the linear regression line of modelled versus observed values to deviate from the 1:1 line (Fig. 8b). The relative humidity was left out of the model because adding it did not change the model performance (R2=0.39, p < 0.001; RMSE = 3.0 ‰).
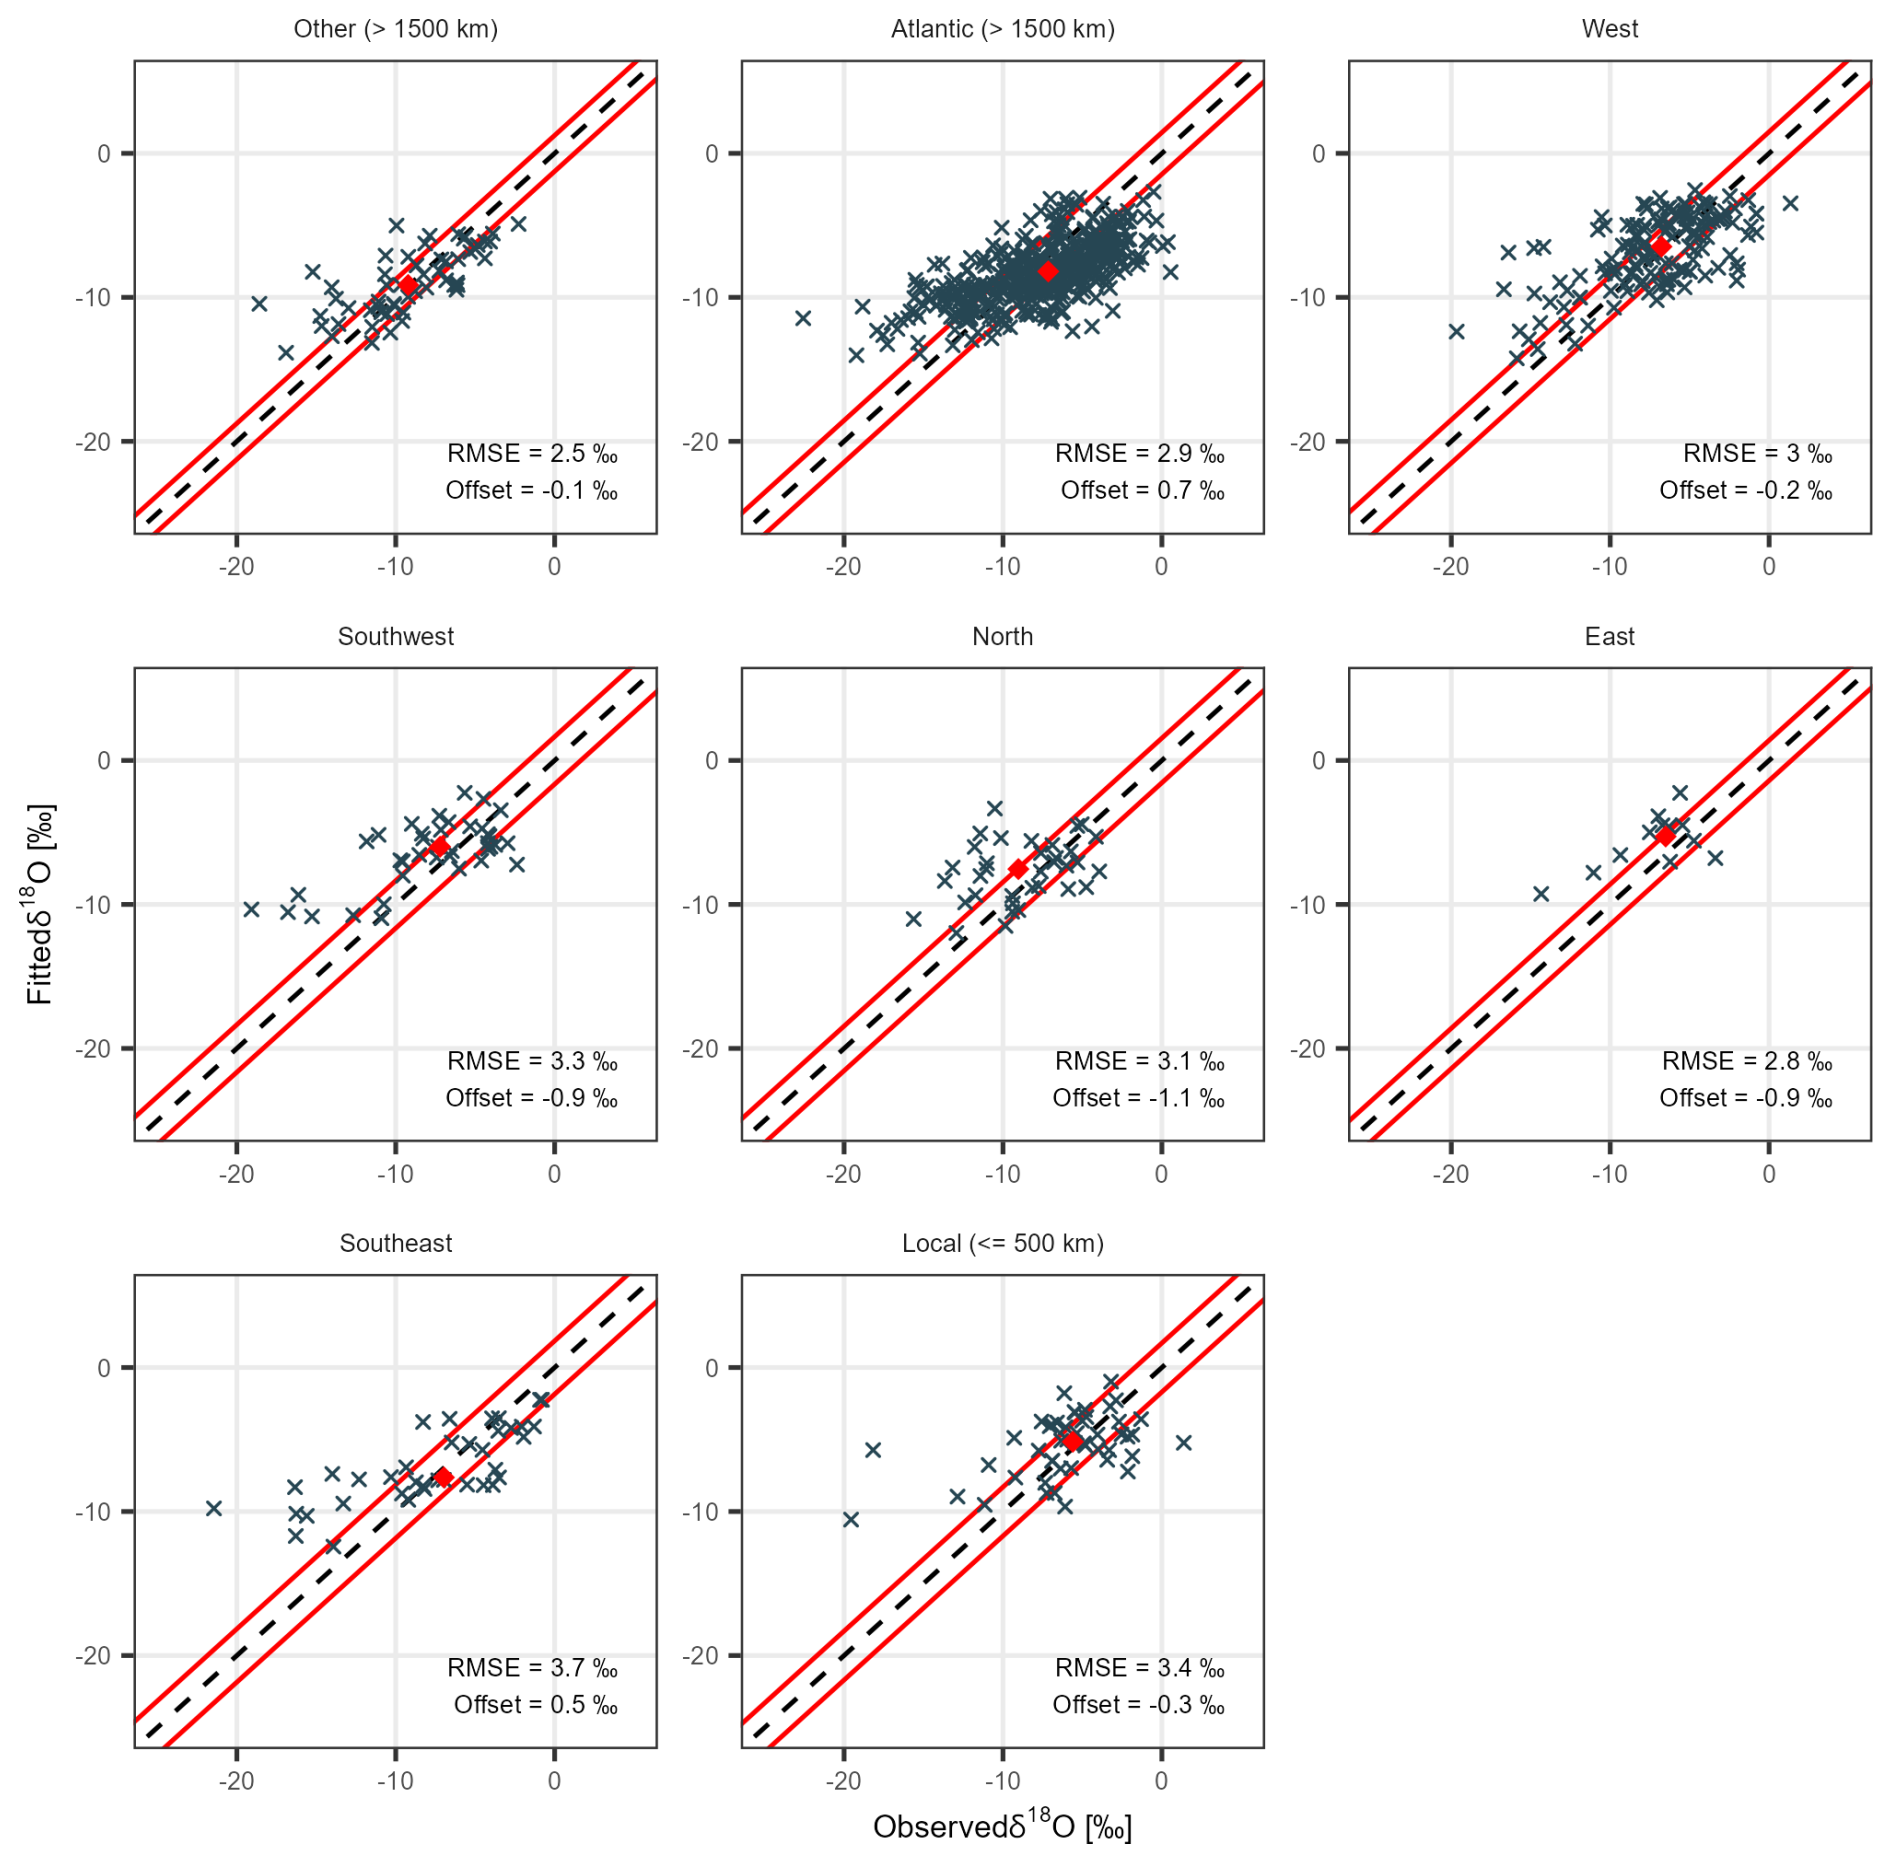
Figure 9Observed δ18O plotted against fitted δ18O (N=837) regrouped according to the moisture origin group. The red diamond represents the point with the median observed δ18O and median fitted δ18O as coordinates – the offset refers to the distance of that point from the 1:1 line (dashed line). The area between the red lines corresponds the root mean square error (RMSE).
Lastly, we plotted predicted δ18O against observed δ18O in moisture origin-specific plots (Fig. 9) to compare the residuals after attempting to remove local effects linked to meteorological variables. RMSE of δ18O of the moisture origin groups was similar, with values spanning from 2.5 ‰ (remote uptake locations) to 3.7 ‰ (mid-range Southeast uptake locations). RMSE values were slightly higher in mid-range and local uptake locations (above 3.1 ‰, except for mid-range Eastern uptake locations with 2.8 ‰) than in remote and mid-range Western uptake locations (below 3.0 ‰). The median δ18O offset, defined as the distance between the median fitted and observed δ18O from the 1:1 line (Fig. 9), was smaller than half the RMSE in all groups. No significant differences of moisture origin-specific δ18O residuals could be established based on these plots.
While the δ18O IQR of 5.0 ‰ for Luxembourg is consistent with seasonal ranges reported in global isoscapes for the same region (Allen et al., 2019), the average weighted δ18O value (−8.1 ‰) was lower than the long-term mean of 1978 to 2009 at the GNIP station (−7.4 ‰) in Trier, Germany (Stumpp et al., 2014). Given the proximity of the stations (∼ 55 km) and the small elevation difference (273 m), this likely does not reflect an altitude or latitude effect. However, the Mosel River valley is known for its mild microclimate, favouring viticulture in the region (Urhausen et al., 2011), which could affect the isotope signatures in precipitation sampled in Trier. The isotope signal at both locations showed signs of re-evaporation, i.e., sub-cloud evaporation of newly formed raindrops (Moore et al., 2014), with LMWLs less steep than the GMWL (McGuire and McDonnell, 2007). This observation is particularly interesting because the sampling protocol with the sampling bottle insert theoretically excludes in-bottle re-evaporation. The LMWL slope of 7.46 for Belvaux (Luxembourg) ranks amongst the flattest reported for Germany – solely exceeding northern stations (Stumpp et al., 2014). At continental scale, this value lies well within the slopes reported in Europe for coastal regions in Portugal (5), and continental sites in Russia (9), where high relative humidity and low temperature are expected to substantially reduce sub-cloud evaporation (Lécuyer et al., 2021). The LMWL for Belvaux was found to vary significantly between dry and wet years as reported in Central Europe, and with changes of the summer temperature (Vodila et al., 2011). We also found seasonal differences in LMWL slopes (from 7.14 in summer to 7.84 in winter). These findings may eventually relate to the unprecedented high temperatures recorded during the sampling period, and subsequent changes of the convection strength and re-evaporation intensity in the boundary layer. Higher rainfall intensity and frequency tend to lead to lower δ18O values in summer (Aemisegger et al., 2015; Moore et al., 2014). Despite the flatter LMWL slope in Luxembourg, the weighted d-excess values (10.8 ‰) at our study site was still higher than at Trier (6.3 ‰). It is possible that there is a stronger recycling of air moisture in the Mosel River valley, causing lower d-excess values.
The d-excess values close to the global mean of 10.0 ‰ following the GMWL suggests vapour formed over the Atlantic Ocean as a major source of moisture (Celle-Jeanton et al., 2001). Analysing the actual moisture origins using Lagrangian-based trajectories only partially supports the previous statement and indicates that precipitation from remote (> 1500 km) Atlantic moisture sources in autumn and winter is gradually replaced by precipitation from mid-range (< 1500 km) and local (< 500 km) sources. For example, we found that 50 % of precipitation in July had local moisture origins. A recent study further shows that continental landmasses can be large contributors of recycled moisture in Europe (Insua-Costa et al., 2022). Our study offers a more nuanced view than the common perception that δ18O and δ2H variations in precipitation in Western Europe are primarily controlled by large-scale rainout processes within landfalling humid air masses deriving from the Atlantic Ocean (Rozanski et al., 1982). Another study in the Northern Alps reached similar conclusions to ours, describing a strong seasonal variability of moisture origins, with oceanic sources dominating in winter and gradually being replaced by continental sources in summer (Sodemann and Zubler, 2010).
High d-excess values can be caused by continental inputs (Krklec et al., 2018), but results show that this relation is ambiguous at our study site (Fig. 7). Some continental locations south and east of our study site had higher d-excess inputs in spring and summer, but more negative d-excess values also came from the continent, especially in autumn and in winter (Fig. 7). Mountain chains (e.g., the Pyrenees, Alps, or Massif Central) appeared to influence the relation between continental moisture sources and d-excess values. A distinct d-excess signal of local (< 500 km) moisture sources was not observed (Fig. 5b, Table 1). Air masses from the Mediterranean Sea, reported to carry highly positive d-excess values (Araguás-Araguás et al., 2000; Celle-Jeanton et al., 2001), could be detected in Luxembourg in some cases in spring and summer only (Fig. 7). It should be noted, however, that d-excess values at our study site were far from the 22 ‰ reported for moisture from the Mediterranean Sea (Celle-Jeanton et al., 2001), even for rain event when moisture origins were from around the Mediterranean Sea (Figs. 1b and 7). Overall, precipitation with Mediterranean moisture origins were rare, except for western parts of the Mediterranean Sea near the Spanish shores (Fig. 3). Interestingly, this region also yielded highly negative d-excess values in summer (Fig. 7). We argue this could be linked to seasonal changes of the components of evapotranspiration contributing to air moisture. The isotope signature of land evapotranspiration is difficult to seize because transpiration from vegetation leads to less negative δ18O values, closer to or invariant from oceanic input (Krklec et al., 2018).
In response to our research question on moisture origin influences on precipitation isotope signatures, we found contrasting moisture origin-specific precipitation δ18Onorm contributions (Fig. 5a) (and, to a lesser degree, d-excessnorm values, Fig. 5b), also reflected in varying ranges of seasonal values. The strongest isotope differences could be observed for mid-range moisture origins (Fig. 5, Table 1). Notably the Iberian Peninsula, the Western Mediterranean around the coasts of Spain and France, the Bay of Biscay, the English Channel, the Atlantic around the coast of the southern tip of Ireland, and the Azores were identified as areas leading to distinct isotope signals reaching Luxembourg (Figs. 6 and 7). Their influence as areas with higher or lower isotope signals depended on season, which we argue is linked to changes in the components of evapotranspiration and possibly the thermal inertia of water around the shores of Western Europe, e.g., the Western Mediterranean and the Bay of Biscay. Orographic obstacles (i.e., mountain chains such as the Pyrenees, Alps or Massif Central) also had an influence on precipitation isotope signals. These contrasting δ18O and d-excess contributions depending on the moisture origins confirm previous reports on changes of atmospheric circulation influencing precipitation δ18O (Aemisegger, 2018; Puntsag et al., 2016; Sturm et al., 2010), showcasing their influence in Western Europe. The latter was not evident, considering the dominance of the Atlantic Ocean on precipitation isotope signals (Rozanski et al., 1982; Sodemann and Zubler, 2010).
However, moisture origin-specific isotope differences were comparable with the overall variability of sub-daily isotope signals, masking the distinction between moisture origin-specific isotope signals. For example, the precipitation weighted means of δ18Onorm and d-excessnorm values of the main moisture origin groups contributing to rainfalls in winter (i.e., remote and mid-range Western sources) had ranges well under the standard deviation of δ18Onorm and d-excessnorm values in winter (range of 1.4 ‰ against 3.6 ‰ for δ18O; range of 0.5 ‰ against variability of 4.5 ‰ for d-excess values). Moreover, the δ18O residuals, obtained from the multiple linear regression model with the aim to exclude local meteorological effects, did not yield significant differences either (Fig. 9). This could be due to the inaccurate or unrepresentative boundaries defined for the classification of the moisture origins (Figs. 6 and 7). Yet, finding a classification that would fit the complex patterns in Figs. 6 and 7 may prove challenging. The similarity of δ18O residuals in the moisture origin groups (Fig. 9) might indicate that local meteorological variables contain more information on remote conditions during moisture formation processes than initially conceived in this study. Hence, we argue that while atmospheric inferences with precipitation isotope signatures were observed, including atmospheric variability (e.g., moisture origins or trajectories) for δ18O predictions may not provide a decisive advantage due to input variable redundancy. A challenge was also the uneven seasonal distribution of the moisture origins contributing to precipitation (Fig. 4a). This could also have led to the systematic over- and underestimations towards the lower and higher end of precipitation δ18O values in the multiple linear regression model. With the complexity of processes during precipitation formation (Aemisegger et al., 2015; Moore et al., 2014), we stress the importance of long sub-daily precipitation δ18O observation intervals covering all types of trajectories at different times of the year. We also propose the inclusion of other complex processes during precipitation formation such as the convection strength (e.g., as in Piso.AI; Nelson et al., 2021) as direct improvements for follow-up studies.
By using a rare set of sub-daily precipitation δ18O values covering nearly six years, this study demonstrated that moisture origins affect precipitation isotope signals in Luxembourg (Western Europe). A pre-established Lagrangian model was used to visualise 120 h air mass trajectories and determine the moisture origins for 648 precipitation events. We built a δ18O multiple linear regression model based on meteorological variables to assess differences in precipitation δ18O residuals according to moisture origin groups after attempting to remove local effects. Specifically, we found:
- i.
Signs of sub-cloud re-evaporation of newly formed raindrops. This was suggested by a slope (7.46) of the local meteorologic water line (LMWL) less steep than that of the global meteorologic water line (GMWL).
- ii.
Remote (> 1500 km) moisture origins over the Atlantic Ocean are major precipitation contributors and influencers of precipitation isotope signals in Luxembourg, illustrated by an average δ18O value of −8.1 ‰ and d-excess value of 10.8 ‰. In spring and in summer, they are replaced by mid-range (< 1500 km) and local (< 500 km) moisture sources, latter ones representing up to 50 % in July.
- iii.
Differences in δ18O and d-excess signatures stemming from moisture origins across and near the shores of Western Europe, as well as from remote Atlantic sources. Their seasonal influence on isotope signals is likely linked to changes in the proportion of transpiration and evaporation, or to specific properties of the Western Mediterranean and the Bay of Biscay. Orographic barriers, such as the Pyrenees, Alps or Massif Central, also affect precipitation isotope signals.
- iv.
Moisture origin-specific isotope differences were comparable to the overall variability of sub-daily isotope signals, masking distinctions among moisture origin-specific signals. The reason may lie in inaccurate or unrepresentative boundaries defined for the classification of the moisture origins.
- v.
The δ18O residuals from the multiple linear regression model, used to exclude local meteorologic effects, did not yield significant differences in moisture origin-specific isotope signatures. This was probably due to local meteorological variables already containing inherent information on remote conditions during moisture formation processes.
Ultimately, with the maps of isotope signatures based on the moisture origins, this study offers a nuanced insight into atmospheric moisture origins affecting precipitation and precipitation isotope signals in Western Europe. This information improves the interpretation of precipitation isotope signals and could contribute to assessing potential changes of the moisture origins of precipitation.
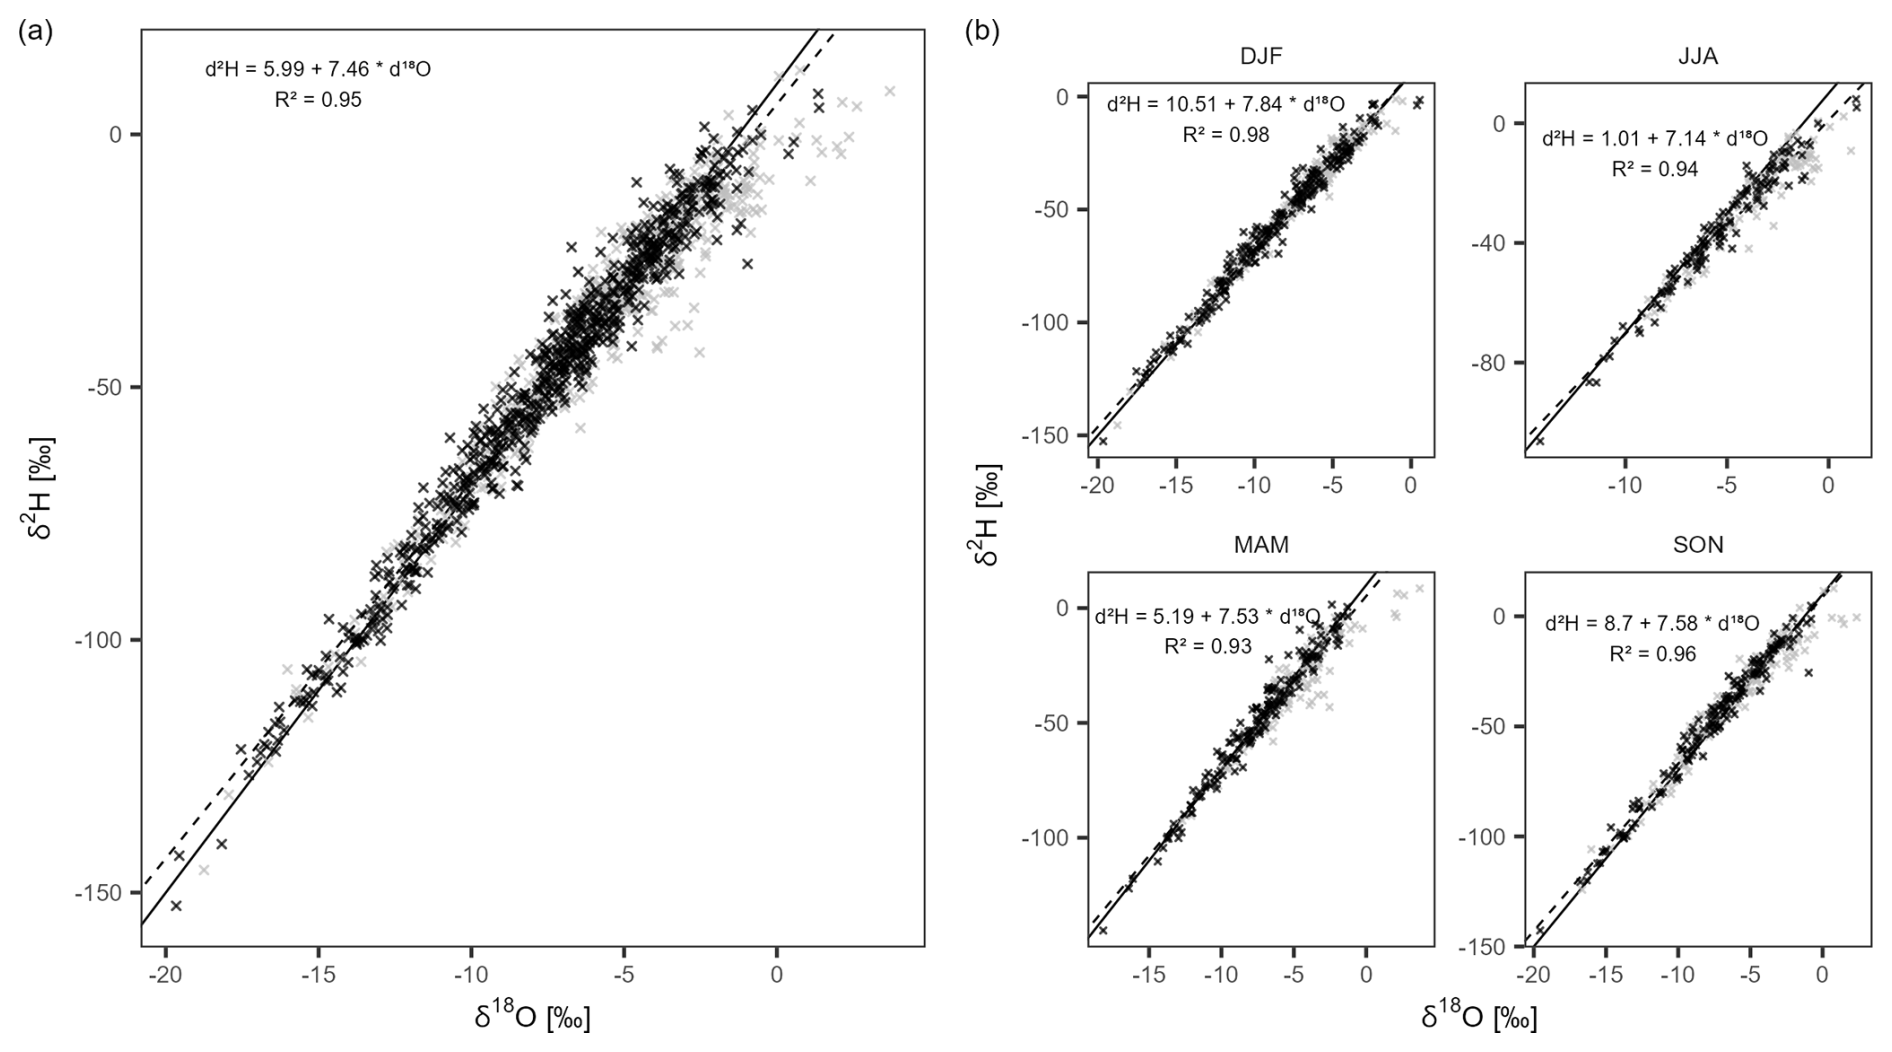
Figure A1Dual isotope plots showing (a) the precipitation samples in Belvaux (N=1147), and (b) seasonal subsets of the same values. The grey crosses represent the sub-daily samples below 1.0 mm (N=529) and the black crosses the retained samples (N=648), while the lines represent the Global Meteorologic Water Line (GMWL, solid) and the Local Meteorologic Water Lines (LMWL, dashed). The LMWL were calculated using a reduced major axis regression (RMA) algorithm. The regression equations and the R2 are also given – all results were significant (p < 0.001).
The scripts used for generating the maps and analyses in this study are publicly available under the following GitHub repository: https://github.com/guilhem-turk/Moisture-origins (https://doi.org/10.5281/zenodo.20111415, Türk, 2026).
The data that support the findings of this study are available from the corresponding authors upon reasonable request.
LP and BRS conceptualized, administrated and supervised the project. They were also responsible for writing the project proposal and acquiring the funding. LP collected and curated the data, which was analysed for the model production by GT, validated by LP. GT wrote the manuscript, which was reviewed and edited by all co-authors.
At least one of the (co-)authors is a member of the editorial board of Hydrology and Earth System Sciences. The peer-review process was guided by an independent editor, and the authors also have no other competing interests to declare.
Publisher's note: Copernicus Publications remains neutral with regard to jurisdictional claims made in the text, published maps, institutional affiliations, or any other geographical representation in this paper. The authors bear the ultimate responsibility for providing appropriate place names. Views expressed in the text are those of the authors and do not necessarily reflect the views of the publisher.
We thank Gwenaël Carrer, Judith Nijzink, Carol Tamez-Melendez and Vincent Pfister for assistance in sampling precipitation at the Belvaux site. Our gratitude also goes to Loïc Leonard and François Barnich for O-H isotope analyses in precipitation samples.
This research has been supported by the Fonds National de la Recherche Luxembourg (grant no. C20/SR/14757154) and the Deutsche Forschungsgemeinschaft (grant no. SCHO793/25).
This paper was edited by Natalie Orlowski and reviewed by four anonymous referees.
Aemisegger, F.: On the link between the North Atlantic storm track and precipitation deuterium excess in Reykjavik, Atmos. Sci. Lett., 19, 1–9, https://doi.org/10.1002/asl.865, 2018.
Aemisegger, F., Pfahl, S., Sodemann, H., Lehner, I., Seneviratne, S. I., and Wernli, H.: Deuterium excess as a proxy for continental moisture recycling and plant transpiration, Atmos. Chem. Phys., 14, 4029–4054, https://doi.org/10.5194/acp-14-4029-2014, 2014.
Aemisegger, F., Spiegel, J. K., Pfahl, S., Sodemann, H., Eugster, W., and Wernli, H.: Isotope meteorology of cold front passages: A case study combining observations and modeling, Geophys. Res. Lett., 42, 5652–5660, https://doi.org/10.1002/2015GL063988, 2015.
Allen, M. R. and Ingram, W. J.: Constraints on future changes in climate and the hydrologic cycle, Nature, 419, 224–232, https://doi.org/10.1038/nature01092, 2002.
Allen, S. T., Jasechko, S., Berghuijs, W. R., Welker, J. M., Goldsmith, G. R., and Kirchner, J. W.: Global sinusoidal seasonality in precipitation isotopes, Hydrol. Earth Syst. Sci., 23, 3423–3436, https://doi.org/10.5194/hess-23-3423-2019, 2019.
Álvarez, C., Christie, D. A., González-Reyes, Á., Veblen, T. T., Helle, G., LeQuesne, C., Rodriguez-Caton, M., Szejner, P., Flores-Sáez, F., Gipoulou-Zúñiga, T., Suazo-Álvarez, M., Muñoz-Salazar, T., Aliste, D., Morales, M. S., Muñoz, A., and Villalba, R.: Hydroclimate variability in the Tropical Andes recorded by δ18O isotopes from a new network of Polylepis tarapacana tree-rings, Glob. Planet. Change, 239, https://doi.org/10.1016/j.gloplacha.2024.104503, 2024.
Araguás-Araguás, L., Froehlich, K., and Rozanski, K.: Deuterium and oxygen-18 isotope composition of precipitation and atmospheric moisture, Hydrol. Process., 14, 1341–1355, https://doi.org/10.1002/1099-1085(20000615)14:8<1341::AID-HYP983>3.3.CO;2-Q, 2000.
Blöschl, G., Hall, J., Parajka, J., Perdigão, R. A. P., Merz, B., Arheimer, B., Aronica, G. T., Bilibashi, A., Bonacci, O., Borga, M., Čanjevac, I., Castellarin, A., Chirico, G. B., Claps, P., Fiala, K., Frolova, N., Gorbachova, L., Gül, A., Hannaford, J., Harrigan, S., Kireeva, M., Kiss, A., Kjeldsen, T. R., Kohnová, S., Koskela, J. J., Ledvinka, O., Macdonald, N., Mavrova-Guirguinova, M., Mediero, L., Merz, R., Molnar, P., Montanari, A., Murphy, C., Osuch, M., Ovcharuk, V., Radevski, I., Rogger, M., Salinas, J. L., Sauquet, E., Šraj, M., Szolgay, J., Viglione, A., Volpi, E., Wilson, D., Zaimi, K., and Živković, N.: Changing climate shifts timing of European floods, Science, 357, 588–590, https://doi.org/10.1126/science.aan2506, 2017.
Bonne, J. L., Behrens, M., Meyer, H., Kipfstuhl, S., Rabe, B., Schönicke, L., Steen-Larsen, H. C., and Werner, M.: Resolving the controls of water vapour isotopes in the Atlantic sector, Nat. Commun., 10, 1–10, https://doi.org/10.1038/s41467-019-09242-6, 2019.
Bonne, J. L., Meyer, H., Behrens, M., Boike, J., Kipfstuhl, S., Rabe, B., Schmidt, T., Schönicke, L., Steen-Larsen, H. C., and Werner, M.: Moisture origin as a driver of temporal variabilities of the water vapour isotopic composition in the Lena River Delta, Siberia, Atmos. Chem. Phys., 20, 10493–10511, https://doi.org/10.5194/acp-20-10493-2020, 2020.
Bowen, G. J. and Revenaugh, J.: Interpolating the isotopic composition of modern meteoric precipitation, Water Resour. Res., 39, 1–13, https://doi.org/10.1029/2003WR002086, 2003.
Bowen, G. J., Wassenaar, L. I., and Hobson, K. A.: Global application of stable hydrogen and oxygen isotopes to wildlife forensics, Oecologia, 143, 337–348, https://doi.org/10.1007/s00442-004-1813-y, 2005.
Buizert, C., Gkinis, V., Severinghaus, J. P., He, F., Lecavalier, B. S., Kindler, P., Leuenberger, M., Carlson, A. E., Vinther, B., Masson-Delmotte, V., White, J. W. C., Liu, Z., Otto-Bliesner, B., and Brook, E. J.: Greenland temperature response to climate forcing during the last deglaciation, Science, 345, 1177–1180, https://doi.org/10.1126/science.1254961, 2014.
Casellas, E., Latron, J., Cayuela, C., Bech, J., Udina, M., Sola, Y., Lee, K. O., and Llorens, P.: Moisture origin and characteristics of the isotopic signature of rainfall in a Mediterranean mountain catchment (Vallcebre, eastern Pyrenees), J. Hydrol., 575, 767–779, https://doi.org/10.1016/j.jhydrol.2019.05.060, 2019.
Celle-Jeanton, H., Travi, Y., and Blavoux, B.: Isotopic typology of the precipitation in the Western Mediterrenean region at the three different time scales, Geophys. Res. Lett., 28, 1215–1218, https://doi.org/10.1029/2000GL012407, 2001.
Conticello, F. R., Cioffi, F., Lall, U., and Merz, B.: Synchronization and Delay Between Circulation Patterns and High Streamflow Events in Germany, Water Resour. Res., 56, https://doi.org/10.1029/2019WR025598, 2020.
Coplen, T. B., Neiman, P. J., White, A. B., and Martin Ralph, F.: Categorisation of northern California rainfall for periods with and without a radar brightband using stable isotopes and a novel automated precipitation collector, Tellus B, 6, https://doi.org/10.3402/tellusb.v67.28574, 2015.
Craig, H.: Isotopic Variations in Meteoric Waters, Science, 133, 1702–1703, https://doi.org/10.1126/science.133.3465.1702, 1961.
Crawford, J., Hughes, C. E., and Lykoudis, S.: Alternative least squares methods for determining the meteoric water line, demonstrated using GNIP data, J. Hydrol., 519, 2331–2340, https://doi.org/10.1016/j.jhydrol.2014.10.033, 2014.
Dansgaard, W.: Stable isotopes in precipitation, Tellus, 16, 436–468, https://doi.org/10.3402/tellusa.v16i4.8993, 1964.
Erdélyi, D., Kern, Z., Nyitrai, T., and Hatvani, I. G.: Predicting the spatial distribution of stable isotopes in precipitation using a machine learning approach: a comparative assessment of random forest variants, Int. J. Geomath., 14, 1–19, https://doi.org/10.1007/s13137-023-00224-x, 2023.
Von Freyberg, J., L. A. Knapp, J., Rücker, A., and W. Kirchner, J.: Technical note: Evaluation of a low-cost evaporation protection method for portable water samplers, Hydrol, Earth Syst. Sci., 24, 5821–5834, https://doi.org/10.5194/hess-24-5821-2020, 2020.
Fritz, P. and Poplawski, S.: 18O and 13C in the shells of freshwater molluscs and their environments, Earth Planet Sci. Lett., 24, 91–98, https://doi.org/10.1016/0012-821X(74)90012-0, 1974.
Holton, J. R. and Hakim, G. J.: An Introduction to Dynamic Meteorology, Elsevier, https://doi.org/10.1016/C2009-0-63394-8, 2013.
IAEA: Reference Sheet for International Measurement Standards VSMOW2, SLAP2, Int. At. Energy Agency, 8, 2017.
Iannone, R.: SplitR: V0.4, Zenodo, https://doi.org/10.5281/zenodo.49106, 2016.
Insua-Costa, D., Senande-Rivera, M., Llasat, M. C., and Miguez-Macho, G.: The central role of forests in the 2021 European floods, Environ. Res. Lett., 17, https://doi.org/10.1088/1748-9326/ac6f6b, 2022.
Jasechko, S., Kirchner, J. W., Welker, J. M., and McDonnell, J. J.: Substantial proportion of global streamflow less than three months old, Nat. Geosci., 9, 126–129, https://doi.org/10.1038/ngeo2636, 2016.
Jouzel, J.: Calibrating the Isotopic Paleothermometer, Science, 286, 910–911, https://doi.org/10.1126/science.286.5441.910, 1999.
Juhlke, T. R., Meier, C., van Geldern, R., Vanselow, K. A., Wernicke, J., Baidulloeva, J., Barth, J. A. C., and Weise, S. M.: Assessing moisture sources of precipitation in the Western Pamir Mountains (Tajikistan, Central Asia) using deuterium excess, Tellus B, 71, 1–16, https://doi.org/10.1080/16000889.2019.1601987, 2019.
Kirchner, J. W.: A double paradox in catchment hydrology and geochemistry, Hydrol. Process., 17, 871–874, https://doi.org/10.1002/hyp.5108, 2003.
Klaus, J. and McDonnell, J. J.: Hydrograph separation using stable isotopes: Review and evaluation, J. Hydrol., 505, 47–64, https://doi.org/10.1016/j.jhydrol.2013.09.006, 2013.
Konecky, B. L., McKay, N. P., Churakova, O. V., Comas-Bru, L., Dassié, E. P., DeLong, K. L., Falster, G. M., Fischer, M. J., Jones, M. D., Jonkers, L., Kaufman, D. S., Leduc, G., Managave, S. R., Martrat, B., Opel, T., Orsi, A. J., Partin, J. W., Sayani, H. R., Thomas, E. K., Thompson, D. M., Tyler, J. J., Abram, N. J., Atwood, A. R., Cartapanis, O., Conroy, J. L., Curran, M. A., Dee, S. G., Deininger, M., Divine, D. V., Kern, Z., Porter, T. J., Stevenson, S. L., von Gunten, L., Braun, K., Carré, M., Incarbona, A., Kaushal, N., Klaebe, R. M., Kolus, H. R., Mortyn, P. G., Moy, A. D., Roop, H. A., Sicre, M. A., and Yoshimura, K.: The Iso2k database: A global compilation of paleo-δ18O and δ2H records to aid understanding of Common Era climate, Earth Syst. Sci. Data, 12, 2261–2288, https://doi.org/10.5194/essd-12-2261-2020, 2020.
Krklec, K., Domínguez-Villar, D., and Lojen, S.: The impact of moisture sources on the oxygen isotope composition of precipitation at a continental site in central Europe, J. Hydrol., 561, 810–821, https://doi.org/10.1016/j.jhydrol.2018.04.045, 2018.
Lavers, D. A. and Villarini, G.: The nexus between atmospheric rivers and extreme precipitation across Europe, Geophys. Res. Lett., 40, 3259–3264, https://doi.org/10.1002/grl.50636, 2013.
Lécuyer, C., Bojar, A.-V., Daux, V., and Legendre, S.: Geographic variations in the slope of the δ2H–δ18O meteoric water line over Europe: a record of increasing continentality, Geol. Soc. Lond. Spec. Publ., 507, 5–17, https://doi.org/10.1144/SP507-2020-68, 2021.
Lee, J.-E., Fung, I., DePaolo, D. J., and Otto-Bliesner, B.: Water isotopes during the Last Glacial Maximum: New general circulation model calculations, J. Geophys. Res., 113, 1–15, https://doi.org/10.1029/2008jd009859, 2008.
Legendre, P.: lmodel2: Model II Regression, https://CRAN.R-project.org/package=lmodel2 (last access: 2 November 2025), 2024.
Madakumbura, G. D., Kim, H., Utsumi, N., Shiogama, H., Fischer, E. M., Seland, Ø., Scinocca, J. F., Mitchell, D. M., Hirabayashi, Y., and Oki, T.: Event-to-event intensification of the hydrologic cycle from 1.5 °C to a 2 °C warmer world, Sci. Rep., 9, 1–8, https://doi.org/10.1038/s41598-019-39936-2, 2019.
McDonnell, J. J.: A Rationale for Old Water Discharge Through Macropores in a Steep, Humid Catchment, Water Resour. Res., 26, 2821–2832, https://doi.org/10.1029/WR026i011p02821, 1990.
McGuire, K. and McDonnell, J.: Stable Isotope Tracers in Watershed Hydrology, in: Stable Isotopes in Ecology and Environmental Science, Blackwell Publishing Ltd, Oxford, UK, 334–374, https://doi.org/10.1002/9780470691854.ch11, 2007.
Merlivat, L. and Jouzel, J.: Global climatic interpretation of the deuterium-oxygen 16 relationship for precipitation, J. Geophys. Res., 84, 5029–5033, https://doi.org/10.1029/JC084iC08p05029, 1979.
MeteoLux: Normales et extrêmes – Valeurs extrêmes depuis 1947, Luxembourg Air Navigation Administration, https://www.meteolux.lu/fr/climat/normales-et-extremes/ (last access: 14 October 2024), 2024.
Moore, M., Kuang, Z., and Blossey, P. N.: A moisture budget perspective of the amount effect, Geophys. Res. Lett., 41, 1329–1335, https://doi.org/10.1002/2013GL058302, 2014.
Nelson, D. B., Basler, D., and Kahmen, A.: Precipitation isotope time series predictions from machine learning applied in Europe, P. Natl. Acad. Sci. USA, 118, https://doi.org/10.1073/pnas.2024107118, 2021.
Noone, D. and Simmonds, I.: Associations between δ18O of water and climate parameters in a simulation of atmospheric circulation for 1979–95, J. Clim., 15, 3150–3169, https://doi.org/10.1175/1520-0442(2002)015<3150:ABOOWA>2.0.CO;2, 2002.
Pebesma, E.: Simple Features for R: Standardized Support for Spatial Vector Data, The R Journal, 10, 439–446, https://doi.org/10.32614/RJ-2018-009, 2018.
Pebesma, E. and Bivand, R.: Spatial Data Science: With Applications in R, Chapman and Hall/CRC, https://doi.org/10.1201/9780429459016, 2023.
Pfahl, S. and Sodemann, H.: What controls deuterium excess in global precipitation?, Clim. Past, 10, 771–781, https://doi.org/10.5194/cp-10-771-2014, 2014.
Pfister, L., Thielen, F., Deloule, E., Valle, N., Lentzen, E., Grave, C., Beisel, J. N., and McDonnell, J. J.: Freshwater pearl mussels as a stream water stable isotope recorder, Ecohydrology, 11, 1–10, https://doi.org/10.1002/eco.2007, 2018.
Puntsag, T., Mitchell, M. J., Campbell, J. L., Klein, E. S., Likens, G. E., and Welker, J. M.: Arctic Vortex changes alter the sources and isotopic values of precipitation in northeastern US, Sci. Rep., 6, 1–9, https://doi.org/10.1038/srep22647, 2016.
Putman, A. L., Bowen, G. J., and Strong, C.: Local and Regional Modes of Hydroclimatic Change Expressed in Modern Multidecadal Precipitation Oxygen Isotope Trends, Geophys. Res. Lett., 48, 1–10, https://doi.org/10.1029/2020GL092006, 2021.
Rank, D., Wyhlidal, S., Schott, K., Weigand, S., and Oblin, A.: Temporal and spatial distribution of isotopes in river water in Central Europe: 50 years experience with the Austrian network of isotopes in rivers, Isot. Environ. Health S., 54, 115–136, https://doi.org/10.1080/10256016.2017.1383906, 2018.
Risi, C., Bony, S., Vimeux, F., and Jouzel, J.: Water-stable isotopes in the LMDZ4 general circulation model: Model evaluation for present-day and past climates and applications to climatic interpretations of tropical isotopic records, J. Geophys. Res.-Atmos., 115, 1–27, https://doi.org/10.1029/2009JD013255, 2010.
Rodriguez-Caton, M., Morales, M. S., Rao, M. P., Nixon, T., Vuille, M., Rivera, J. A., Oelkers, R., Christie, D. A., Varuolo-Clarke, A. M., Ferrero, M. E., Magney, T., Daux, V., Villalba, R., and Andreu-Hayles, L.: A 300-year tree-ring δ18O-based precipitation reconstruction for the South American Altiplano highlights decadal hydroclimate teleconnections, Commun. Earth Environ., 5, 1–13, https://doi.org/10.1038/s43247-024-01385-9, 2024.
Rolph, G., Stein, A., and Stunder, B.: Real-time Environmental Applications and Display sYstem: READY, Environ. Model. Softw., 95, 210–228, https://doi.org/10.1016/j.envsoft.2017.06.025, 2017.
Rozanski, K., Sonntag, C., and Munnich, K. O.: Factors controlling stable isotope composition of European precipitation, Tellus, 34, 142–150, https://doi.org/10.3402/tellusa.v34i2.10796, 1982.
Schöne, B. R., Meret, A. E., Baier, S. M., Fiebig, J., Esper, J., Mcdonnell, J., and Pfister, L.: Freshwater pearl mussels from northern Sweden serve as long-term, high-resolution stream water isotope recorders, Hydrol. Earth Syst. Sci., 24, 673–696, https://doi.org/10.5194/hess-24-673-2020, 2020.
Slater, L. J. and Wilby, R. L.: Measuring the changing pulse of rivers, Science, 357, 552, https://doi.org/10.1126/science.aao2441, 2017.
Sodemann, H. and Zubler, E.: Seasonal and inter-annual variability of the moisture sources for alpine precipitation during 1995–2002, Int. J. Climatol., 30, 947–961, https://doi.org/10.1002/joc.1932, 2010.
Stein, A. F., Draxler, R. R., Rolph, G. D., Stunder, B. J. B., Cohen, M. D., and Ngan, F.: Noaa's hysplit atmospheric transport and dispersion modeling system, Bull. Am. Meteorol. Soc., 96, 2059–2077, https://doi.org/10.1175/BAMS-D-14-00110.1, 2015.
Stumpp, C., Klaus, J., and Stichler, W.: Analysis of long-term stable isotopic composition in German precipitation, J. Hydrol., 517, 351–361, https://doi.org/10.1016/j.jhydrol.2014.05.034, 2014.
Sturm, C., Zhang, Q., and Noone, D.: An introduction to stable water isotopes in climate models: Benefits of forward proxy modelling for paleoclimatology, Clim. Past, 6, 115–129, https://doi.org/10.5194/cp-6-115-2010, 2010.
Terzer, S., Wassenaar, L. I., Araguás-Araguás, L. J., and Aggarwal, P. K.: Global isoscapes for δ18O and δ2H in precipitation: Improved prediction using regionalized climatic regression models, Hydrol. Earth Syst. Sci., 17, 4713–4728, https://doi.org/10.5194/hess-17-4713-2013, 2013.
Trenberth, K. E., Fasullo, J., and Smith, L.: Trends and variability in column-integrated atmospheric water vapor, Clim. Dyn., 24, 741–758, https://doi.org/10.1007/s00382-005-0017-4, 2005.
Türk, G.: guilhem-turk/Moisture-origins-affecting-sub-daily-precipitation-18O-and-d-excess-values-mapped-in-Western-Europe: Original release for the HESS journal publication (v.0), Zenodo [code], https://doi.org/10.5281/zenodo.20111416, 2026.
Urhausen, S., Brienen, S., Kapala, A., and Simmer, C.: Climatic conditions and their impact on viticulture in the Upper Moselle region, Climatic Change, 109, 349–373, https://doi.org/10.1007/s10584-011-0059-z, 2011.
Vodila, G., Palcsu, L., Futó, I., and Szántó, Z.: A 9-year record of stable isotope ratios of precipitation in Eastern Hungary: Implications on isotope hydrology and regional palaeoclimatology, J. Hydrol., 400, 144–153, https://doi.org/10.1016/j.jhydrol.2011.01.030, 2011.
Vystavna, Y., Matiatos, I., and Wassenaar, L. I.: 60-year trends of δ18O in global precipitation reveal large scale hydroclimatic variations, Glob. Planet. Change, 195, https://doi.org/10.1016/j.gloplacha.2020.103335, 2020.
Wallace, J. M. and Hobbs, P. V.: Atmospheric Science, Elsevier, https://doi.org/10.1016/C2009-0-00034-8, 2006.
Werner, M., Haese, B., Xu, X., Zhang, X., Butzin, M., and Lohmann, G.: Glacial-interglacial changes in H218O, HDO and deuterium excess-results from the fully coupled ECHAM5/MPI-OM Earth system model, Geosci. Model Dev., 9, 647–670, https://doi.org/10.5194/gmd-9-647-2016, 2016.
Yoshimura, K., Kanamitsu, M., Noone, D., and Oki, T.: Historical isotope simulation using Reanalysis atmospheric data, J. Geophys. Res.-Atmos., 113, 1–15, https://doi.org/10.1029/2008JD010074, 2008.