the Creative Commons Attribution 4.0 License.
the Creative Commons Attribution 4.0 License.
 | 08 May 2026
Linking heavy rainfall to suspended sediment fluxes in a deglaciating Alpine catchment
Lena Katharina Schmidt
Nele Eggers
Jana Tjeda Brettin
Oliver Korup
Axel Bronstert
Sediment transport in high-Alpine environments is undergoing a fundamental shift as glaciers retreat and heavy precipitation events become more frequent. Understanding how these changes influence suspended sediment yields (SSY) is critical for predicting future sediment dynamics, water quality, and geomorphic evolution in mountain catchments. This study investigates the role of heavy precipitation in driving suspended sediment export in the rapidly deglaciating, nested Alpine catchments of Tumpen-Ötztal and Vent-Rofental in Austria. We examine how precipitation and rainfall intensity, frequency, and duration influence suspended sediment yields and concentrations. Using a 21-year dataset of hourly 1 km gridded precipitation and a multi-scale detection approach, we identify heavy precipitation events and analyse their characteristics and contribution to sediment transport. Events are classified based on their temporal characteristics, distinguishing between sub-daily and long-duration heavy precipitation events, and spatial scale, distinguishing between catchment-wide and localised heavy precipitation. We also evaluate the influence of precipitation uncertainties. Our findings show a significant increase in the frequency of heavy precipitation events and their contribution to annual SSY. Sub-daily events, primarily convective summer storms, generate disproportionately high sediment fluxes due to their localised and intense rainfall. Sediment transport during long-duration events responds more strongly to increases in event rainfall intensity and totals. Despite an increasing trend in heavy-precipitation-driven sediment fluxes, annual SSY remains stable in Tumpen-Ötztal but declines in Vent-Rofental, suggesting that heavy-precipitation-driven transport may partially offset, but not fully replace, glacier-driven sediment supply. As climate projections indicate a continued rise in heavy precipitation, particularly at sub-daily scales, Alpine catchments may develop increasingly flashier sediment regimes in the future. However, long-term reductions in glacier-driven sediment supply will likely lead to overall declining annual sediment yields. These findings highlight the need for continued monitoring and study of changing precipitation dynamics, sediment transport, and paraglacial landscape evolution in high-Alpine environments.
- Article
(6585 KB) - Full-text XML
-
Supplement
(3180 KB) - BibTeX
- EndNote


Heavy precipitation is projected to increase in both frequency and intensity with rising global temperatures (Madsen et al., 2014; Vergara-Temprado et al., 2021; Fowler et al., 2021). In high mountain areas like the European Alps, where precipitation patterns are strongly influenced by topography, changes in precipitation are spatially heterogeneous and differ between seasons (Giorgi et al., 2016; Ménégoz et al., 2020; Brönnimann et al., 2018). At the same time, the ongoing degradation of the mountain cryosphere, in particular glacier mass loss, alters sediment availability and export over decadal scales (Schmidt et al., 2022, 2023; Zhang et al., 2022b; Delaney and Adhikari, 2020). In combination, these changes to precipitation patterns and the mountain cryosphere have affected hydrological and sediment transport regimes of rivers (Zhang et al., 2023; Kormann et al., 2016) and measurably increased the amount of fluvial sediment exported from some high-mountain areas (Li et al., 2021a; Vergara et al., 2022; Costa et al., 2018; Zhang et al., 2022a; Delaney and Adhikari, 2020; Vergara et al., 2024). Elevated sediment loads in rivers can negatively impact downstream communities, infrastructure, and ecosystems, particularly by altering flood frequencies, degrading water quality, impairing hydro-power production, and disrupting aquatic habitats (Adler et al., 2022; Huss et al., 2017; Scheurer et al., 2009; Li et al., 2022).
Peak fluvial sediment fluxes in mountainous regions are often associated with extreme or heavy precipitation (Skålevåg et al., 2024; Li et al., 2021b; Rainato et al., 2021; Wulf et al., 2012; Himmelstoss et al., 2024; Scorpio et al., 2022). Rainstorms may cause runoff and erosion; slope wash from rainsplash, sheet flow, rill erosion, or gullying; and trigger mass movements such as debris flows and landslides, thus mobilizing sediment that eventually enters the channel network (Wischmeier and Smith, 1978; Beylich et al., 2017; Scorpio et al., 2022; Hirschberg et al., 2019; Leonarduzzi et al., 2017; Himmelstoss et al., 2024; Rom et al., 2023). Streamflow peaks in response to rainfall also enhance channel erosion via bed incision and bank erosion (Rainato et al., 2021; Scorpio et al., 2022). Another control on sediment dynamics in Alpine catchments during rainstorms is the increase in functional sediment connectivity (Scorpio et al., 2022; Buter et al., 2022; Himmelstoss et al., 2024), which elevates sediment fluxes by better coupling hillslopes to the channel network. Given the projected increases in summer convective rainfall at high elevations in the European Alps (Giorgi et al., 2016; Dallan et al., 2024) and the waning influence of glaciers on annual sediment transport (Schmidt et al., 2023, 2024), the timing and frequency of extreme precipitation are likely to be of increased relevance for fluvial sediment transport in cryospheric basins.
Yet, at least two confounding factors complicate the quantitative assessment of heavy-precipitation-driven sediment transport in high mountain areas. First, the scarcity of weather stations and the complex topography of mountainous terrain means that estimates of precipitation at high elevations is associated with high uncertainties, which add to the intrinsically high errors tied to rare events by virtue of extreme-value theory. Second, both glacial processes and deglaciation remain an important, but rarely systematically captured, control on sediment production and transport (Schmidt et al., 2022; Li et al., 2024). Paraglacial landscapes might respond differently to future increases in extreme precipitation than unglaciated basins, because proglacial areas exposed by deglaciation host higher amounts of unconsolidated sediments and sparse vegetation cover. Furthermore, increases in heavy precipitation could accelerate system-internal paraglacial redistribution of sediments, such as fluvial reworking. Projections suggest that, with the decreasing influence of glaciers (Schmidt et al., 2024), precipitation-driven sediment fluxes could become more dominant and sediment-transport regimes flashier and more dependent on erosive rainfall events (Zhang et al., 2022b). Hence, by studying the influence of heavy precipitation in the current transient state and analysing whether sediment export associated with heavy precipitation is already changing, we may glean important insights about the hydro-geomorphic future of Alpine rivers.
In this study, we employ a multi-scale detection approach based on extreme-value statistics to assemble a catalogue of heavy precipitation events in a catchment in the Ötztal Alps, Austria. By using an hourly, 1 km gridded precipitation product for catchment-averaged and grid-scale maximum precipitation time series, we identify heavy precipitation peaks at multiple temporal and spatial scales. Each detected event is quantified in terms of precipitation intensity, duration, seasonality, spatio-temporal pattern, and mass of suspended sediment exported from the catchment. We also classify the number of suspended sediment peaks which are associated with heavy, non-heavy, or no precipitation. We wish to understand the response of suspended sediment yield to heavy precipitation events, by addressing the following objectives:
-
to quantify fluvial sediment responses to heavy precipitation events, including differences between types of events; and
-
to identify trends in precipitation- and heavy-precipitation-driven contributions to annual fluvial sediment yield.
Our study area covers two nested catchments in the valley of Ötztal in Tyrol, Austria, which is located in the comparatively dry region of the Central Alps relative to the rest of the European Alps (Fig. 1a). The valley has been the focus of several hydrometeorological and glaciological studies and has unique long-term observations (see Strasser et al., 2018).
The two gauging stations used in this study, Tumpen and Vent, are operated by the Hydrographic Service of Tyrol (HD-Tirol). Tumpen station (931 , 46.85797° N, 10.91049° E) is situated on the Ötztaler Ache, a few kilometers upstream of the outlet of Ötztal valley. The Tumpen-Ötztal catchment covers 782.8 km2 which is most of Ötztal valley and spans almost 3000 m of elevation from 931 to 3772 (Schmidt et al., 2022). Vent station (1891 , 46.85691° N, 10.91093° E) is located in the village of Vent and drains the Rofental valley. The 98 km2 Vent-Rofental catchment is in the headwaters of Tumpen-Ötztal (Fig. 1c). About 10 % of the study area is currently covered by glaciers and the glaciated area has been rapidly decreasing in recent decades (Table 1; Hartl et al., 2025). Furthermore, the current glacier ice volume is projected to be reduced to 4 %–20 % by 2100 (Hanzer et al., 2018) and may disappear entirely if global warming is not kept below 1.5° (Hartl et al., 2025).
The hydrological regime is dominated by snow and ice melt (Strasser et al., 2018), with peak streamflow occurring around June in Tumpen-Ötztal and July in Vent-Rofental (Fig. 2; Schmidt et al., 2022). Snowmelt mainly occurs between May and July, peaking in June, while glacier melt contribution to streamflow is at its highest from July to August, and lasts until September (Kormann et al., 2016). The highest amounts of both precipitation and rainfall in both catchments occur in the summer months between June and August (Fig. 2). Outside of the main melt season (May–October) little to no rainfall occurs. The suspended sediment flux is also highest during the summer months and the seasonal cycle is fairly synchronous between the main catchment and the high-elevation sub-catchment Vent-Rofental (Fig. 2; Schmidt et al., 2022). For a more detailed description of the two catchments' seasonal discharge and suspended sediment, as well as land and snow cover, see Schmidt et al. (2022).
Table 1Catchment area, evolution of the glacier covered area, and land cover in the nested catchments of Vent-Rofental and Tumpen-Ötztal.
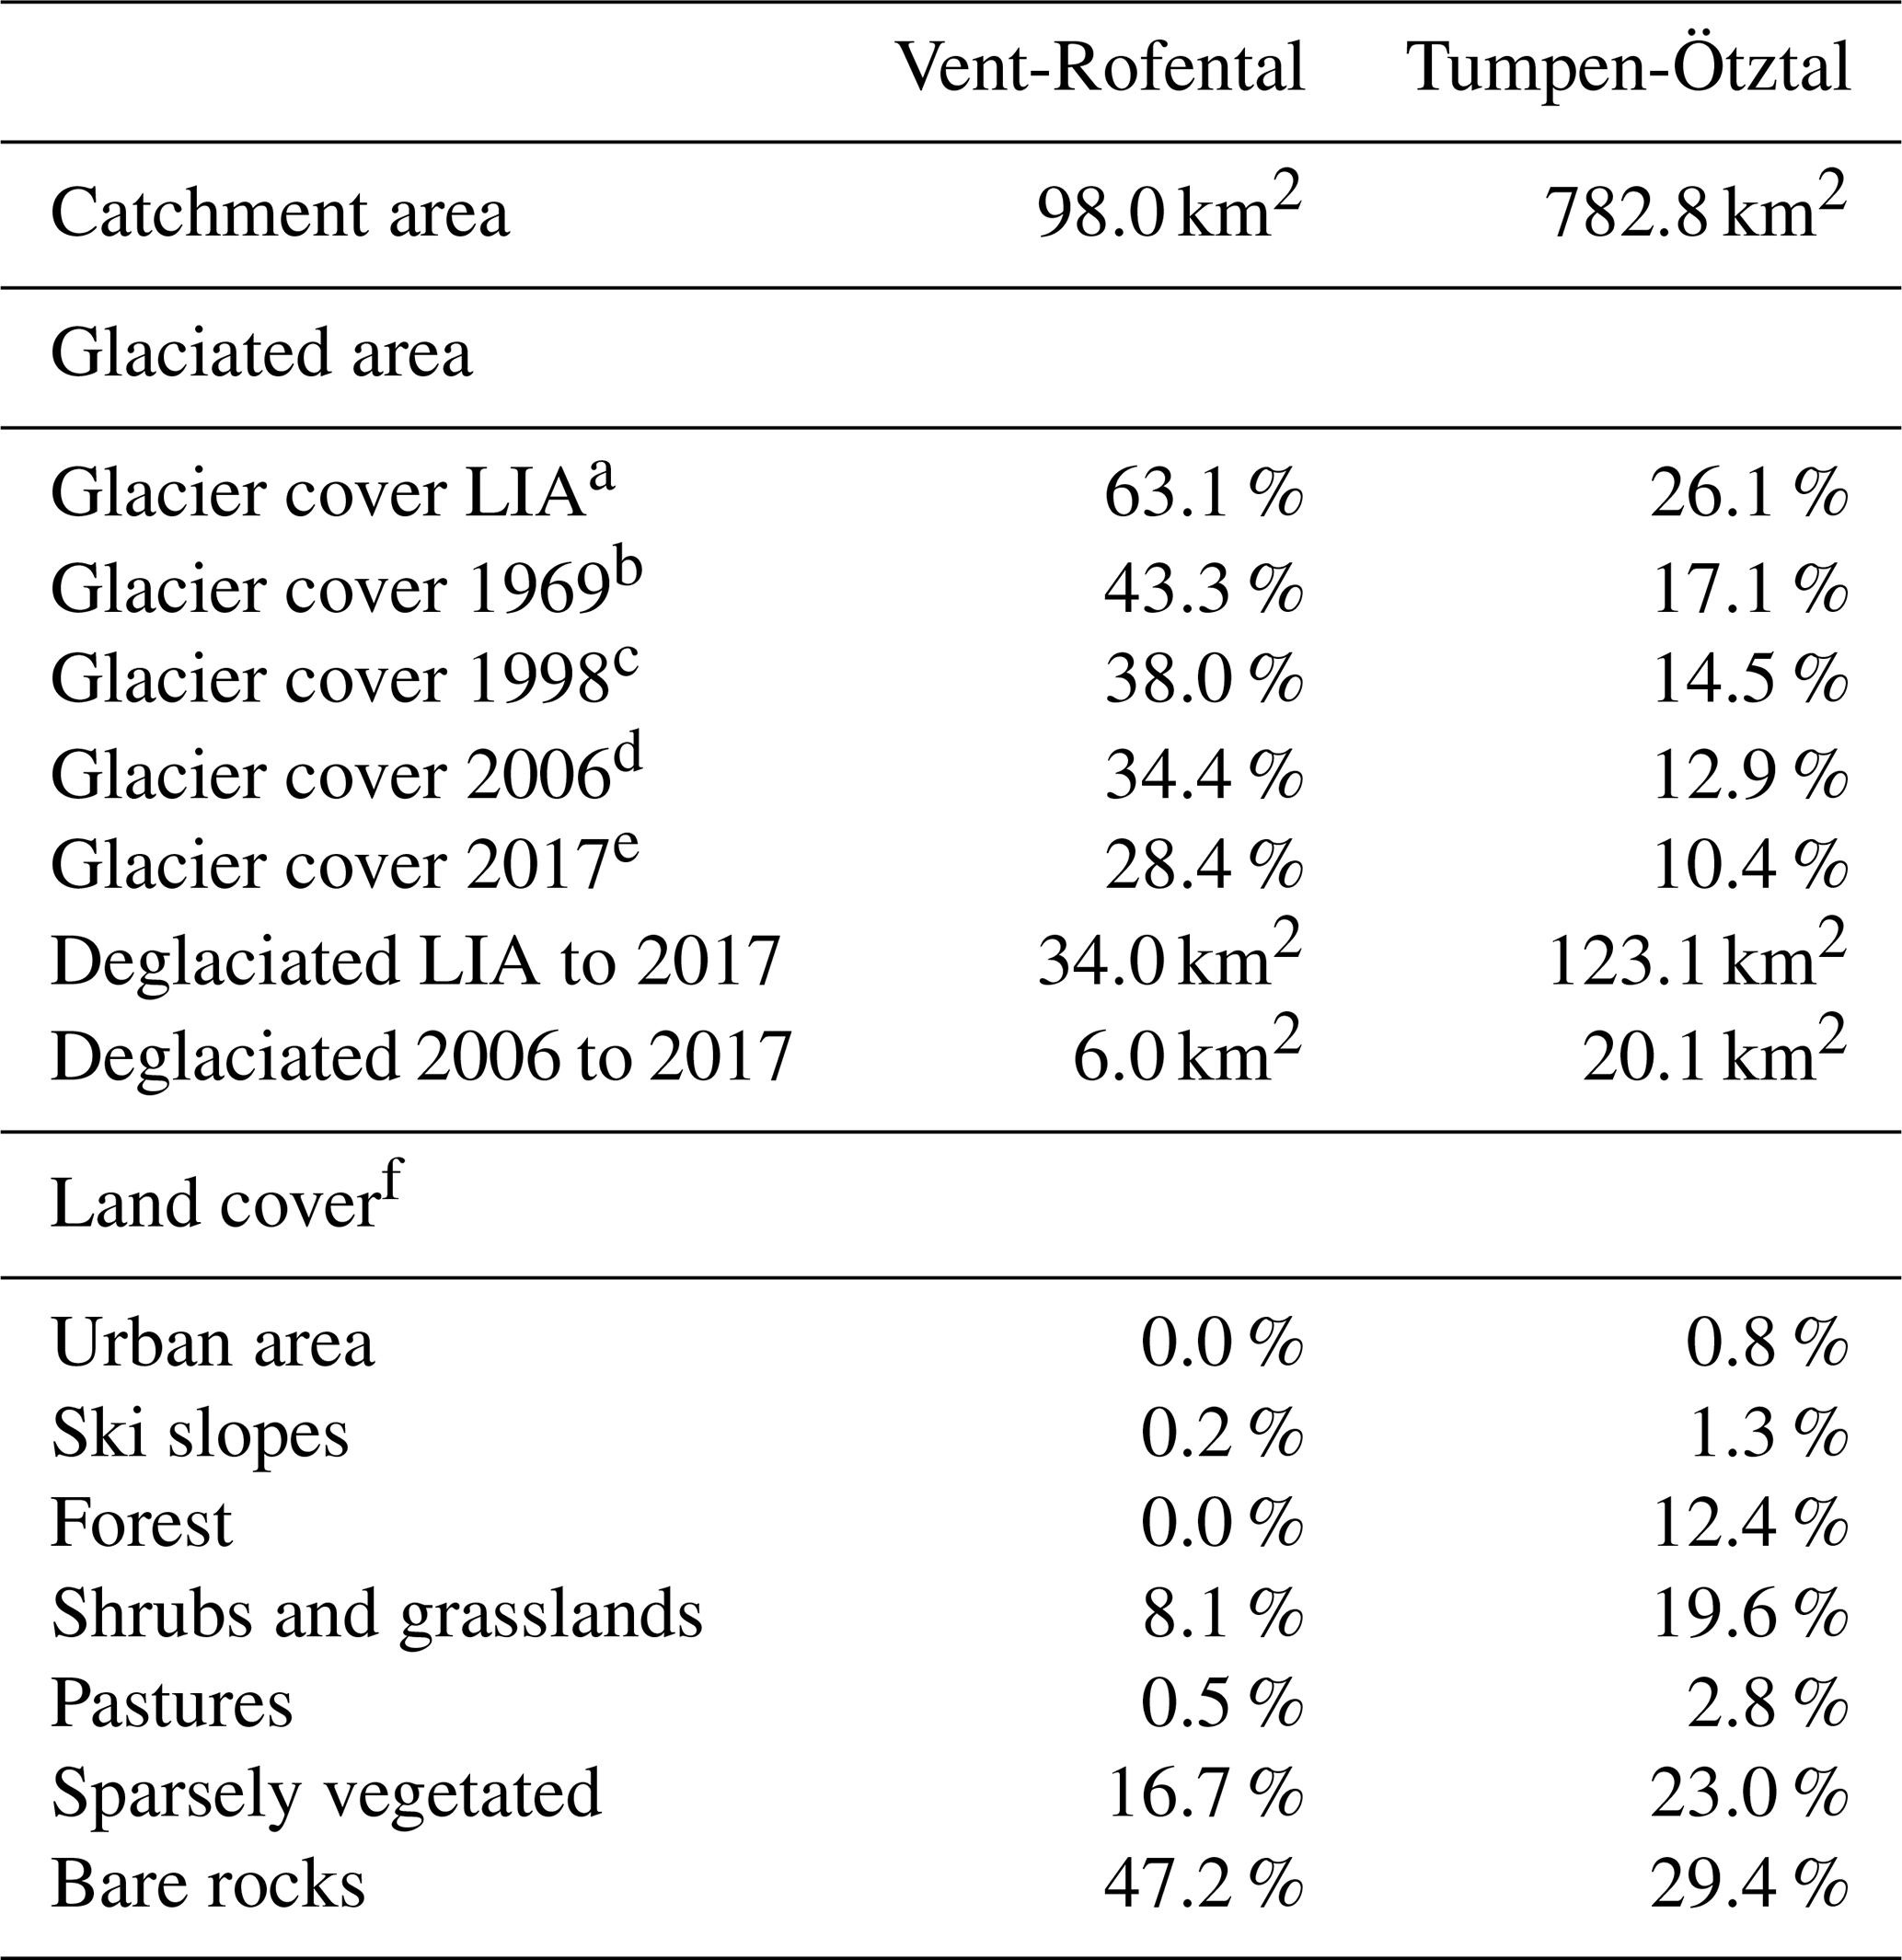
Calculated from: a Austrian Glacier Inventory for the Little Ice Age Maximum (Groß and Patzelt, 2015), b Austrian Glacier Inventory 1 (Patzelt, 2015), c Austrian Glacier Inventory 2 (Kuhn et al., 2015), d Austrian Glacier Inventory 3 (Fischer et al., 2015), e Proposed Austrian Glacier Inventory 5 (Helfricht et al., 2024, 2025), f CORINE Land Cover 2018 (Copernicus Land Monitoring Service, 2020)
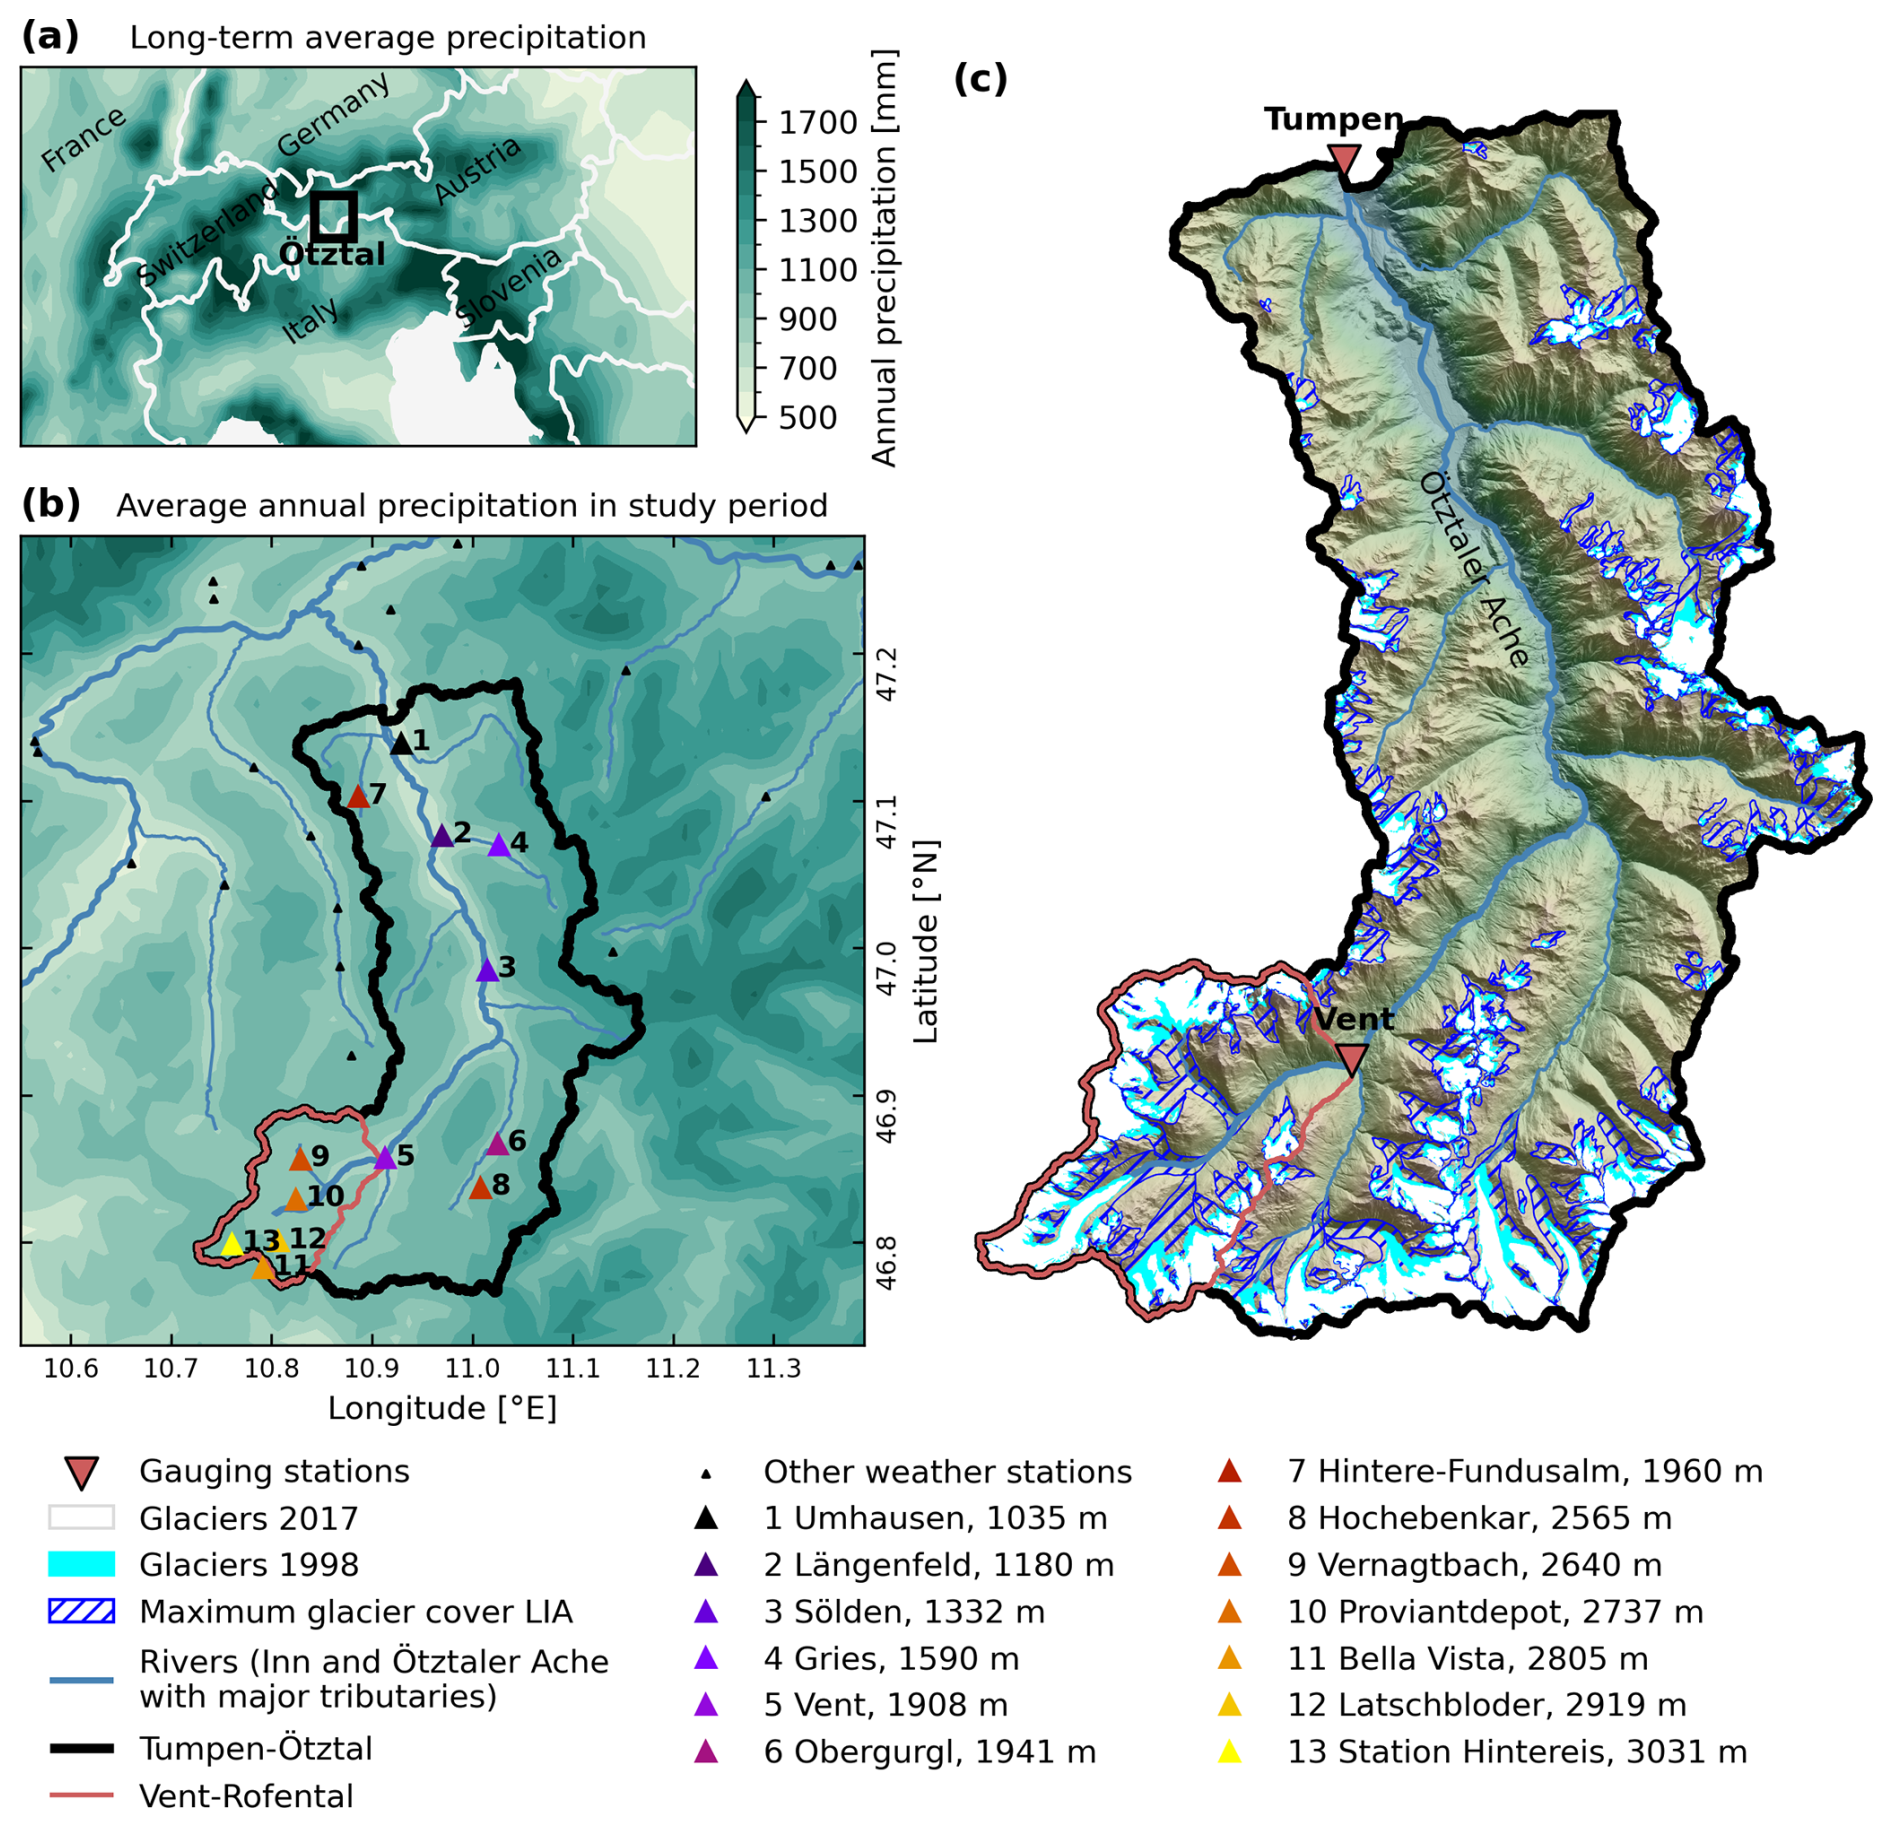
Figure 1Average annual precipitation of the European Alps (a) and the study area, Ötztal (b). Precipitation data (1801-2014) from HISTALP (GeoSphere Austria, 2020) show the drier central Alps, where the Ötztal is located (a). Annual precipitation in Tumpen-Ötztal during the study period (2004–2024) from INCA (GeoSphere Austria, 2024a) ranges between 632 mm at the valley floor to 1223 mm along the eastern catchment boundary (b). Most of the 13 weather stations in the study area are located along the main valley (e.g. Umhausen, Längenfeld and Sölden) or in the Vent-Rofental catchment (e.g. Proviantdepot). Station elevation is given in The topography of Ötztal is steep with the exception of river plains in the lower half of the central valley (c). Glaciers are concentrated in the Stubai Alps along the catchments eastern border and the Ötztal Alps to the south (c). The change in glacier covered area from the Little Ice Age (LIA) maximum (Groß and Patzelt, 2015), to the extent in 1998 (Kuhn et al., 2015), and to the most recent mapping in 2017 (Helfricht et al., 2024, 2025) highlights the deglaciated areas.
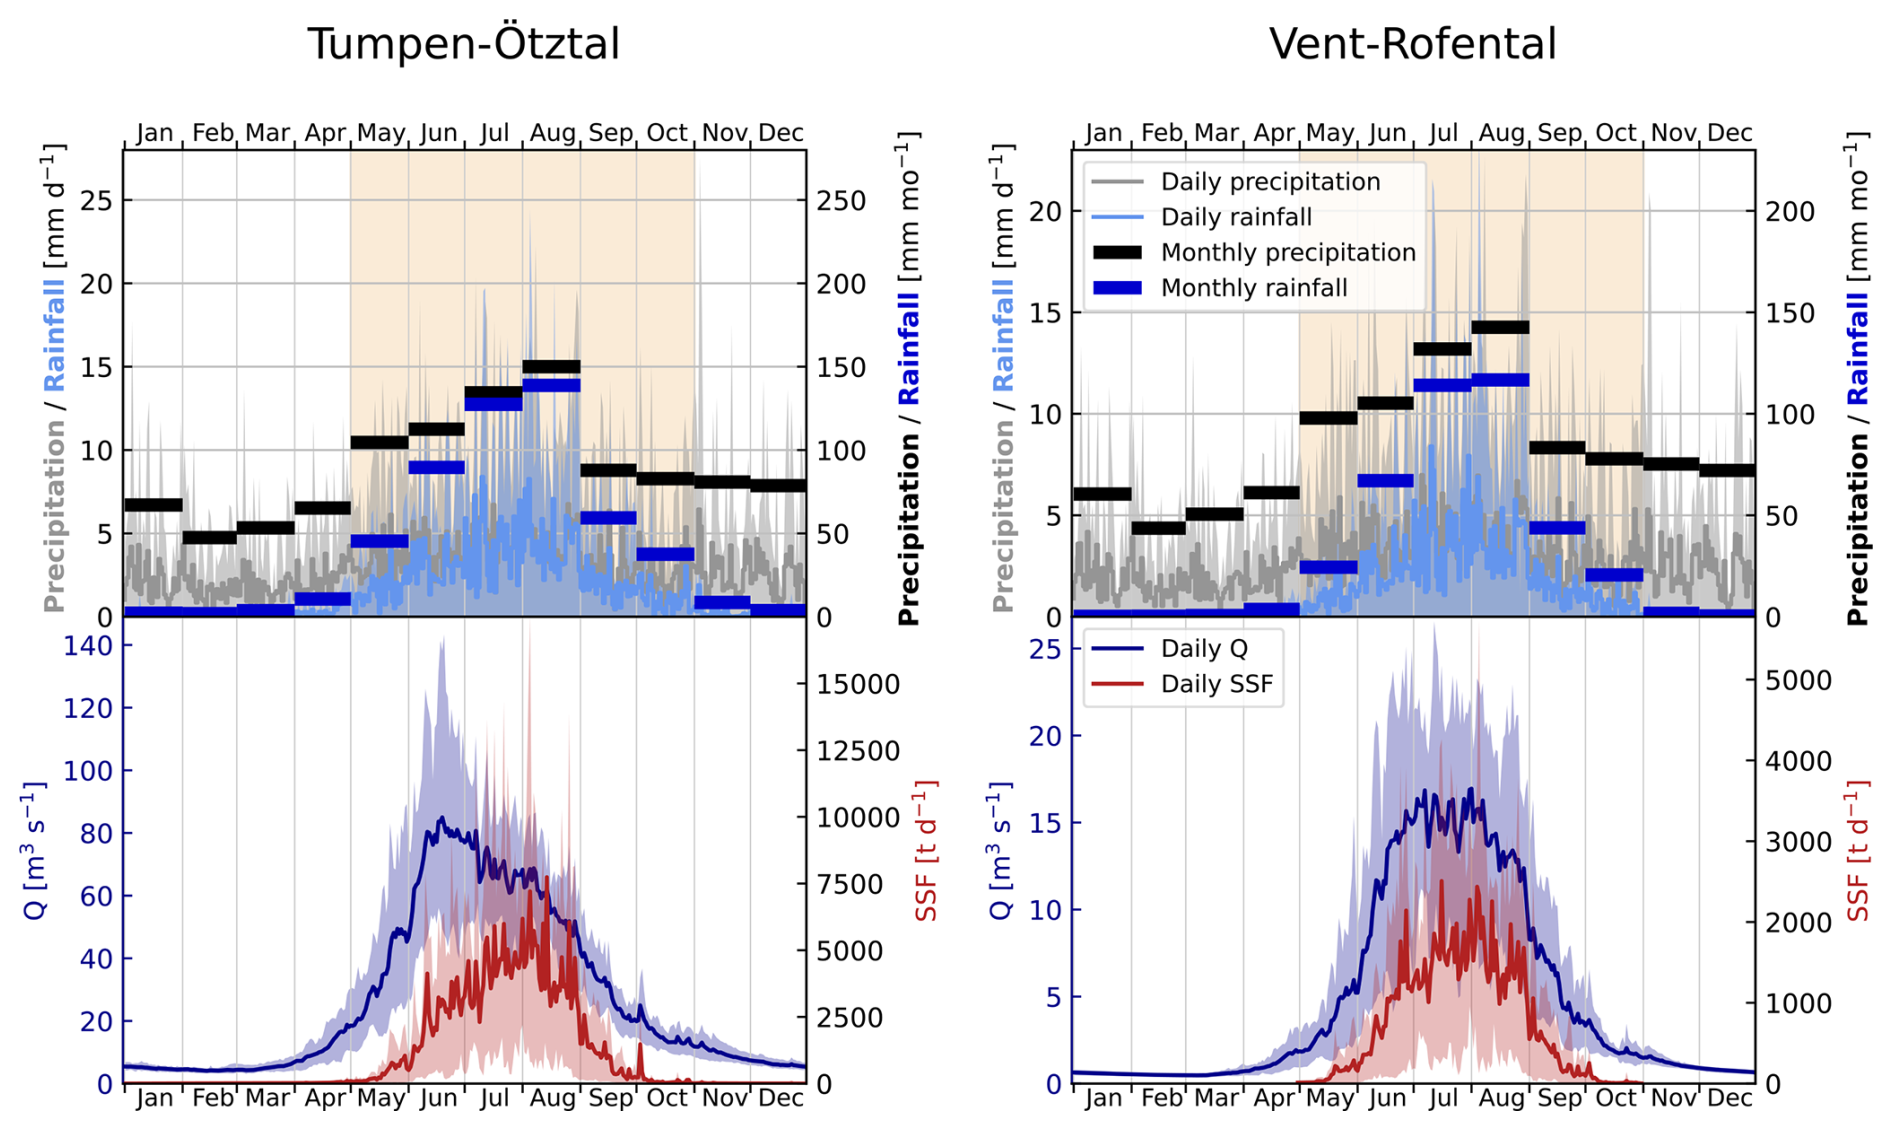
Figure 2Seasonal cycle of precipitation, rainfall, streamflow (Q), and suspended sediment flux (SSF). Top panels show daily (grey lines) and monthly (black horizontal bars) precipitation totals based on data from 2004 to 2024, while daily (light blue lines) and monthly (blue horizontal bars) rainfall totals are averages of 2011–2024 (data described in Sect. 2.2.1) with 10 %–90 % percentile ranges (shaded areas). Bottom panels show 2006–2022 averages (lines) and 10 %–90 % percentile ranges (shaded areas) of daily average Q and total daily SSF (data described in Sect. 2.1). Horizontal bars show average monthly precipitation and rainfall totals. Precipitation follows the same seasonal cycle in both catchments. Little to no rainfall occurs outside of the melt season (May–October; highlighted in yellow). The wettest months both in terms of precipitation and rainfall are the summer months (June–August).
2.1 Streamflow and suspended sediment data
The monitoring of riverine sediments in Ötztal is part of Austria's national strategy to assess changes in sediment dynamics due to factors like deglaciation and land-use change (for details, see Lalk et al., 2014).
Suspended sediment concentrations (SSC) have been monitored since 2006 at both stations by HD-Tirol using optical infrared turbidity sensors. SSCs are derived from the turbidity measurements, and calibrated with in-situ SSC samples manually taken at the gauge at a variety of flow conditions. At Tumpen, turbidity is continuously monitored throughout the year, while at Vent measurements are paused in winter (November–April) to protect the equipment from damage by ice. Sediment transport is considered negligible during this period (Fig. 2).
For this study we used 15 min time series of streamflow, Qt, and suspended sediment concentration, SSCt. Time series of suspended sediment flux SSFt in tonnes per time step is calculated by multiplying Qt and SSCt. These data are available between 2006 and 2022, meaning that data on fluvial sediment transport is only available for 16 of the 21 years of the study period (2004–2024).
2.2 Precipitation data
The main precipitation data used in this study are hourly precipitation grids at 1 km resolution which are supplemented by daily and hourly precipitation from 33 weather stations in and around Ötztal (Fig. 1b).
2.2.1 INCA
To estimate catchment-wide precipitation and rainfall we used gridded precipitation and temperature data from the analysis product of GeoSphere Austria's Integrated Nowcasting through Comprehensive Analysis (INCA) system (Haiden et al., 2011; GeoSphere Austria, 2024a). This blended product integrates observations, weather radar, numerical weather prediction (NWP) outputs, and topographical information into 15 min 1 km grids for all of Austria, of which the freely available hourly resolution is used in this study.
Precipitation estimates are based on a radar composite from four to five C-band radars supplemented with data from neighbouring countries, and calibrated with rain-gauge measurements from approximately 250 weather stations and elevation effects (Haiden et al., 2011). Observed precipitation is interpolated onto the INCA grid with inverse distance weighting (IDW). Topographical errors in the radar composite is corrected by applying a climatological scaling and spatially rescaling it using the latest observations. Finally, the twice adjusted radar field is combined with the interpolated observations. For temperature estimation, INCA employs a three-dimensional analysis method, in which NWP outputs are adjusted with measured temperatures (see Kann et al., 2009; Haiden et al., 2011). The accuracy of INCA estimates can vary, particularly in complex terrain, with an average error of 50 %–100 % in the 15 min precipitation grids and 1.0 to 1.5 °C in the temperature grids (Haiden et al., 2011).
Hourly INCA precipitation grids from 15 March 2011 to 12 December 2024 (GeoSphere Austria, 2024a) were merged with hourly grids aggregated from 15-min resolution grids from 1 January 2004 to 14 March 2011 to create a unified hourly precipitation dataset from 2004 and 2024. We performed a simple quality check on the unified dataset, removing negative values and checking each time step with grid-scale precipitation > 100 mm h−1. In the latter case, we removed seven time steps where these high precipitation rates were clearly data artefacts.
Hourly rainfall grids were estimated by calculating the precipitation phase with the routine from the snow-hydrological model openAMUNDSEN (Hanzer et al., 2024; Strasser et al., 2024) using INCA temperature grids. This routine assumes that fractions of solid and liquid precipitation are linearly distributed between 100 % liquid at 1 °C and 100 % solid at 0 °C. The resulting liquid precipitation fraction grids were multiplied with INCA precipitation to obtain hourly rainfall grids. As rainfall estimates rely on temperature grids (GeoSphere Austria, 2024a), which begin on 15 March 2011, our calculated hourly rainfall grids are only available for the same time period as temperature (i.e. March 2011 to December 2024).
Hourly time series of catchment-averaged precipitation, Pt, and grid-scale maximum precipitation, It, for the Ötztal-Tumpen catchment were calculated from INCA precipitation grids by taking the mean and maximum of all grid cells within the catchment for each time step. Similarly, we calculated hourly catchment-averaged rainfall, RFt, by averaging INCA rainfall grids over the Ötztal-Tumpen catchment for each time step.
2.2.2 Weather stations
We collected daily and sub-daily precipitation measurements from 33 weather stations in and around Ötztal (Fig. 1b, Table S1, Supplement) of which 13 are located within the study area. Most stations are operated by GSA or the Hydrographic Service of Tyrol (HD-Tirol) and tend to be located at lower elevations on the valley floor. Therefore we supplemented with high-elevation stations from the Department of Geography (UIBK-GEOG) and the Department of Atmospheric and Cryospheric Sciences (ACINN) at the University of Innsbruck, as well as the Vernagtbach station operated by the Bavarian Academy of Sciences (BADW) (see Strasser et al., 2018; Warscher et al., 2024). The weather stations have varying coverage during the study period (Fig. S2, see Table S1 in Supplement for a complete list of weather stations).
Most of the stations have already undergone initial quality checks by the providers in terms of the precipitation data, except for the ACINN stations, which feature raw data. For these stations we performed visual quality checks of all data to remove implausible values. For comparison with the gridded INCA data, we aggregated the measurements to hourly and daily resolution where applicable with the criteria that the aggregation interval must contain at least 90 % valid data.
3.1 Uncertainty analysis of INCA
Gridded precipitation products in mountainous regions have limited accuracy (e.g. Prein and Gobiet, 2017; Zandler et al., 2019; Deng et al., 2024; Sleziak et al., 2023) due to the strong influence of topography on precipitation, an observation bias towards lower elevations, and challenging conditions for radar (e.g. beam shielding) (Germann et al., 2006). Even in the mountainous parts of the INCA domain (i.e. Austrian Alps), the high density of weather stations is somewhat biased towards elevations below 2000 (Haiden et al., 2011). Taking advantage of the higher density of rain gauges in Ötztal also at high elevations (Strasser et al., 2018; Warscher et al., 2024), we can estimate the uncertainty of hourly and daily INCA precipitation with our assembled rain gauge data in and around Ötztal using four metrics.
The mean error (ME, Eq. 1) and the root-mean squared error (RMSE, Eq. 2) are calculated for each station by comparing the observed precipitation of a station with the predicted INCA precipitation at the grid cell in which the station is located
where N is the total number of time steps indexed by i with both valid INCA and observation values. The ME indicates whether INCA tends to over- or under-estimate precipitation at the station, whereas the RMSE quantifies the overall error magnitude of INCA (Wilks, 2019).
To estimate the ability of INCA to capture the occurrence of precipitation we classified each time step of and into a “precipitation” and “no-precipitation” category, using a threshold of 0.1 mm h−1 for the hourly data, and 1 mm d−1 for the daily data. The latter is the definition of a “wet day” commonly used in climate indices (Zhang et al., 2011). Next, we computed contingency tables (see Gold et al., 2019) listing the number of hits (true positives) a, misses (false negatives) b, false positives c, and true negatives d. From these four possible outcomes we estimated (1) the accuracy (Acc, Eq. 3) and (2) the frequency bias (FB, Eq. 4) (Wilks, 2019; Gold et al., 2019).
The Acc is the fraction time steps in which INCA correctly predicts the occurrence of precipitation. The FB quantifies whether INCA tends to over- or under-estimate the occurrence of precipitation.
3.1.1 Annual-based uncertainty analysis
To quantify how uncertainties in INCA precipitation estimates may have changed during the study period, we conducted an annual-based analysis. We calculated RMSE of daily precipitation for each year and station separately. Next, we calculated annual RMSE averages from all available stations within Tumpen-Ötztal. Of particular interest is whether precipitation and heavy precipitation days (>10 mm d−1) are over- or under-predicted, as this may affect the detection of heavy precipitation peaks. Hence we also calculated the FB of these two quantities for each year of the study period.
3.2 Multi-scale detection of heavy precipitation events
To assemble a catalogue of heavy precipitation events, we device a multi-scale detection approach based on extreme value statistics that allows for detection of heavy precipitation peaks at multiple temporal and spatial scales. We use catchment-averaged, Pt, and grid-scale maximum precipitation, It, to represent the spatial scales of the catchment-wide and localised precipitation respectively (Fig. 3). Events in Pt will tend to represent catchment-wide heavy precipitation such as frontal precipitation, while events in It will track localised heavy precipitation, generally convective cells. Using a duration-dependent generalised extreme value (d-GEV) distribution, we estimate intensity-duration-frequency (IDF) curves of Pt and It during May–October for Tumpen-Ötztal (Fig. S3, Supplement). With the IDF curves we set detection thresholds for each duration, extract peaks, isolate the associated precipitation event, and merge any duplicated or overlapping events. The procedure is described in detail below.
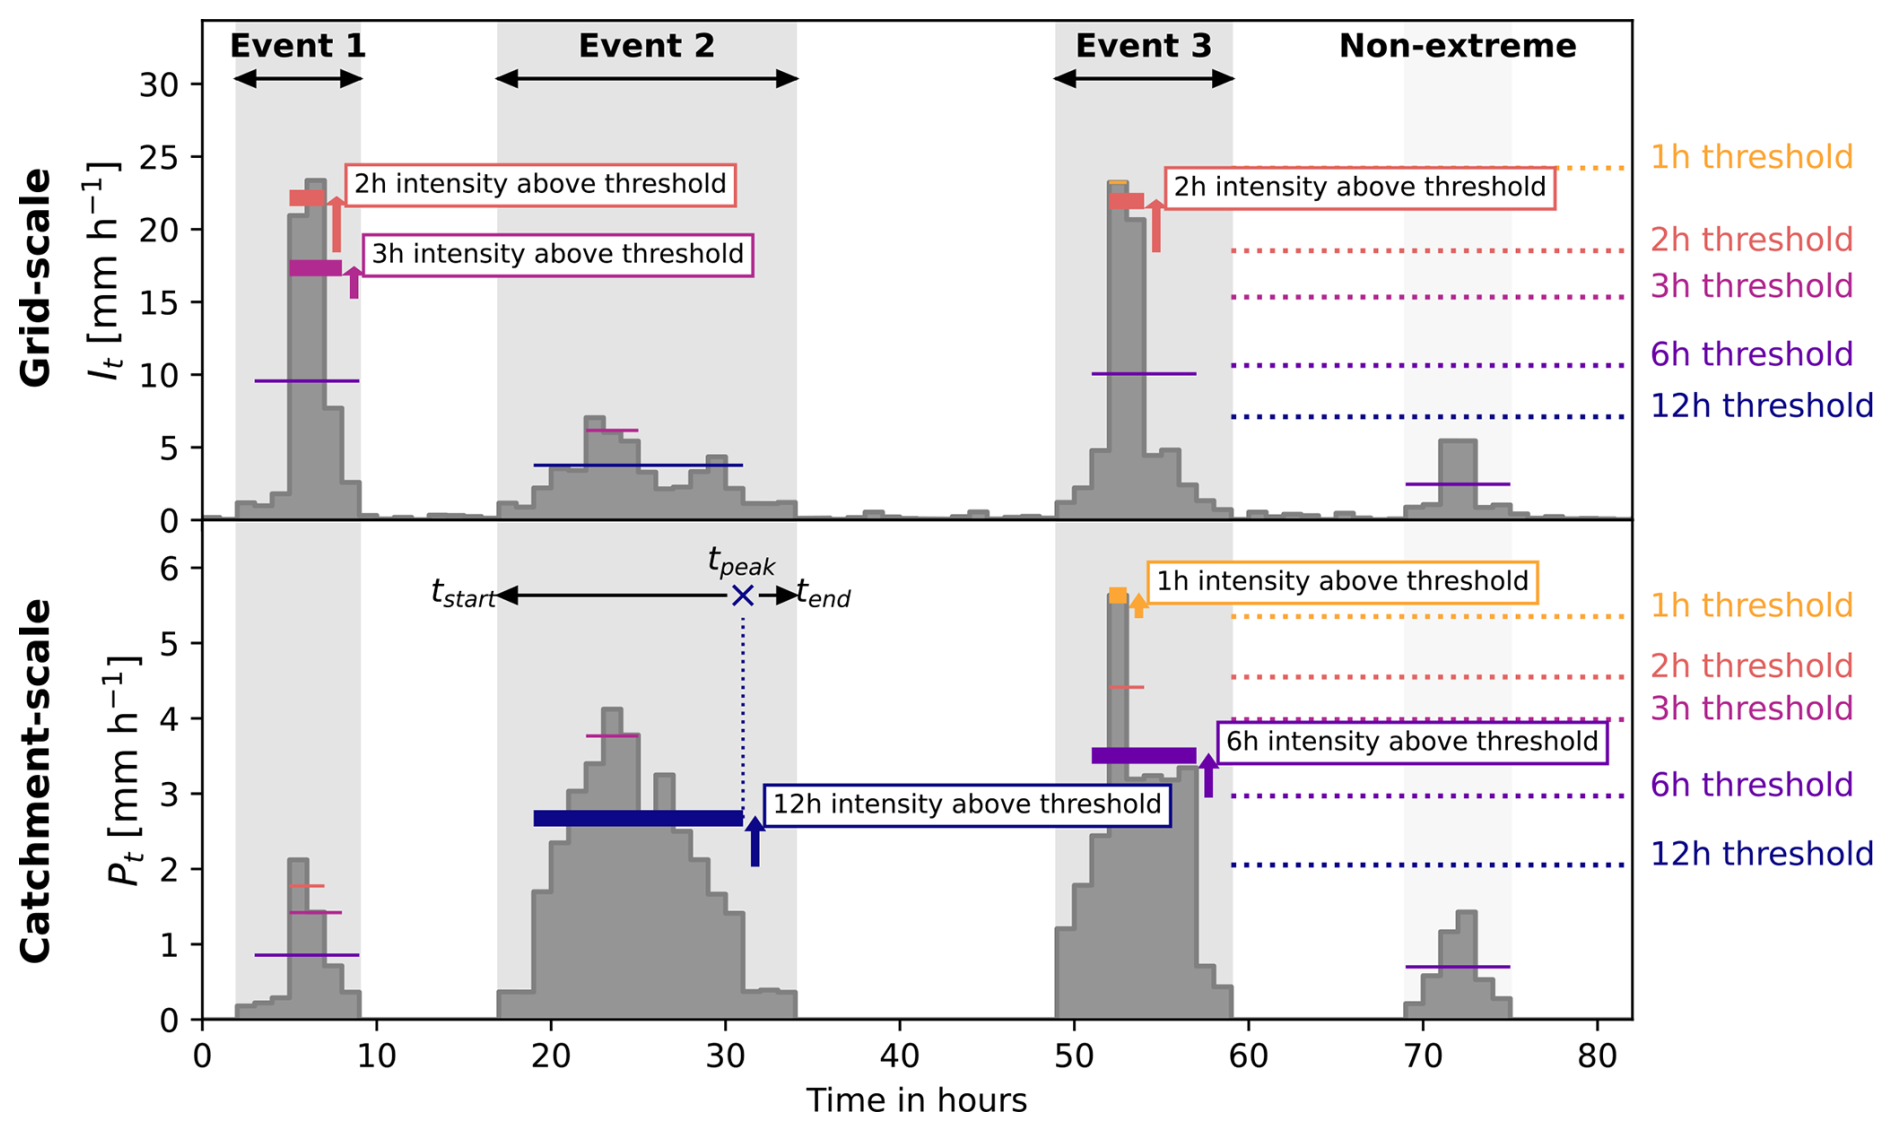
Figure 3Illustration of multi-scale detection of heavy precipitation events (synthetic time series). Heavy precipitation peaks above the detection thresholds are detected both on the 1 km-scale with the grid-scale maximum precipitation time series It (top) and on the catchment-scale with the catchment-averaged precipitation time series Pt (bottom). Peaks exceeding the detection thresholds (only sub-daily durations show in this figure) are identified (thick coloured lines with labels and arrows showing threshold exceedance), while those below are ignored (thin coloured lines). From the timing of the detected peak tpeak, the detection algorithm searches forward and backward in time to identify the start tstart and end tend of the event (grey area). Event 1 shows a case where heavy precipitation peaks at two durations were detected from It (grid-scale) but the event was not extreme at the catchment scale. Event 2 has a single heavy precipitation peak at the catchment-scale. Event 3 has heavy precipitation peaks both at the grid- and catchment-scale. The precipitation event towards the end of the time series shows a case where precipitation did not exceed the thresholds at any duration and spatial scale and thus judged to be “Non-extreme”.
For each of the two time series, Pt and It, we fit a d-GEV distribution (Koutsoyiannis et al., 1998) which allows us to calculate IDF curves from a single extreme value distribution (see Ulrich et al., 2020; Fauer et al., 2021) reducing the total number of parameters required (Ulrich et al., 2020) compared to approaches which individually fits one GEV distribution for each duration. We use the the R-package IDF (Fauer et al., 2017) with the options allowing multi-scaling and curvature for small durations (see Fauer et al., 2021).
The d-GEV distributions were fitted to annual May–October precipitation block maxima, M=(mdj), using the maximum likelihood method. We calculated M for each of the precipitation time series Pt and It. For each duration d, M were calculated by applying a d-moving average to the precipitation time series and extracting the maximum value m during May–October of each year j. We considered the durations 1, 2, 3, 6, 12, 24, 48, and 72 h. We restricted M to May–October precipitation, when most sediment is exported and rainfall is highest (Fig. 2). Outside of this season precipitation predominantly falls and accumulates as snow and is therefore not relevant for our study. Furthermore, suspended sediment transport is negligible from November to April.
Detection thresholds, u, for each duration d and spatial scale (i.e. grid-scale It or catchment-scale Pt) were set at the 0.2 non-exceedence probability quantile of their respective IDF curves, which corresponds to a return period of 1.25 years. With this choice of u we should capture the major precipitation events each year for the spatial and temporal scales under consideration and thus ensure a sufficiently large catalogue of heavy precipitation events.
Next, we detected and isolated heavy precipitation peaks in the precipitation time series. From d-moving-averaged Pt and It we extracted peaks above u and their timing, tpeak (Fig. 3, explained in detail in figure caption). The peaks were identified using the get_extremes function from pyextremes (Bocharov, 2024), which applies a declustering procedure to ensure a minimum time window of 24 h between peaks. We detected event peaks for all durations in Pt but only for durations ≤ 24 h in It, under the assumption that localised heavy precipitation events detected in the grid-scale precipitation time series will generally be convective events that last less than 24 h.
For each heavy precipitation peak, we isolated the associated event by searching forward and backward in time from tpeak to identify when it started and stopped raining. The event start time, tstart, was defined as the first time step before tpeak that satisfied the criteria
or
depending on in which precipitation time series the heavy precipitation peak was detected. The event end time, tend, was defined as the first time step after tpeak that satisfied the criteria in Eqs. (5) and (6) (tstart substituted with tend).
Given the generous criteria for the detection of heavy precipitation peak, many heavy precipitation events were detected at multiple scales, meaning these events exceeded the detection thresholds for several durations, or were detected both in Pt and It. These events are either duplicates (i.e. same tstart and tend) or temporally overlapping, and were merged iteratively by passing over the whole collection of detected events several times. The events were selected for merging by different criteria in each merging pass:
-
duplicated or overlapping events with peaks for the same duration, detected in both Pt and It;
-
events with identical tend;
-
events with identical tstart; and
-
any remaining overlapping events.
In each pass, overlapping events were merged by updating tstart and tend to the earliest tstart and the latest tend, so that the merged event encompassed the timespan of all events being merged.
After the merging, each remaining precipitation event was tagged with the durations and spatial scales at which it was extreme. Finally, all events were manually checked by visually evaluating their accumulated precipitation maps and comparing their time series with station observations. Events with implausible values or precipitation patterns were checked thoroughly and removed if it was judged that the event was a data artefact or mistaken detection, such as precipitation only occurring in a single grid cell.
3.3 Characterisation and categorisation of heavy precipitation events
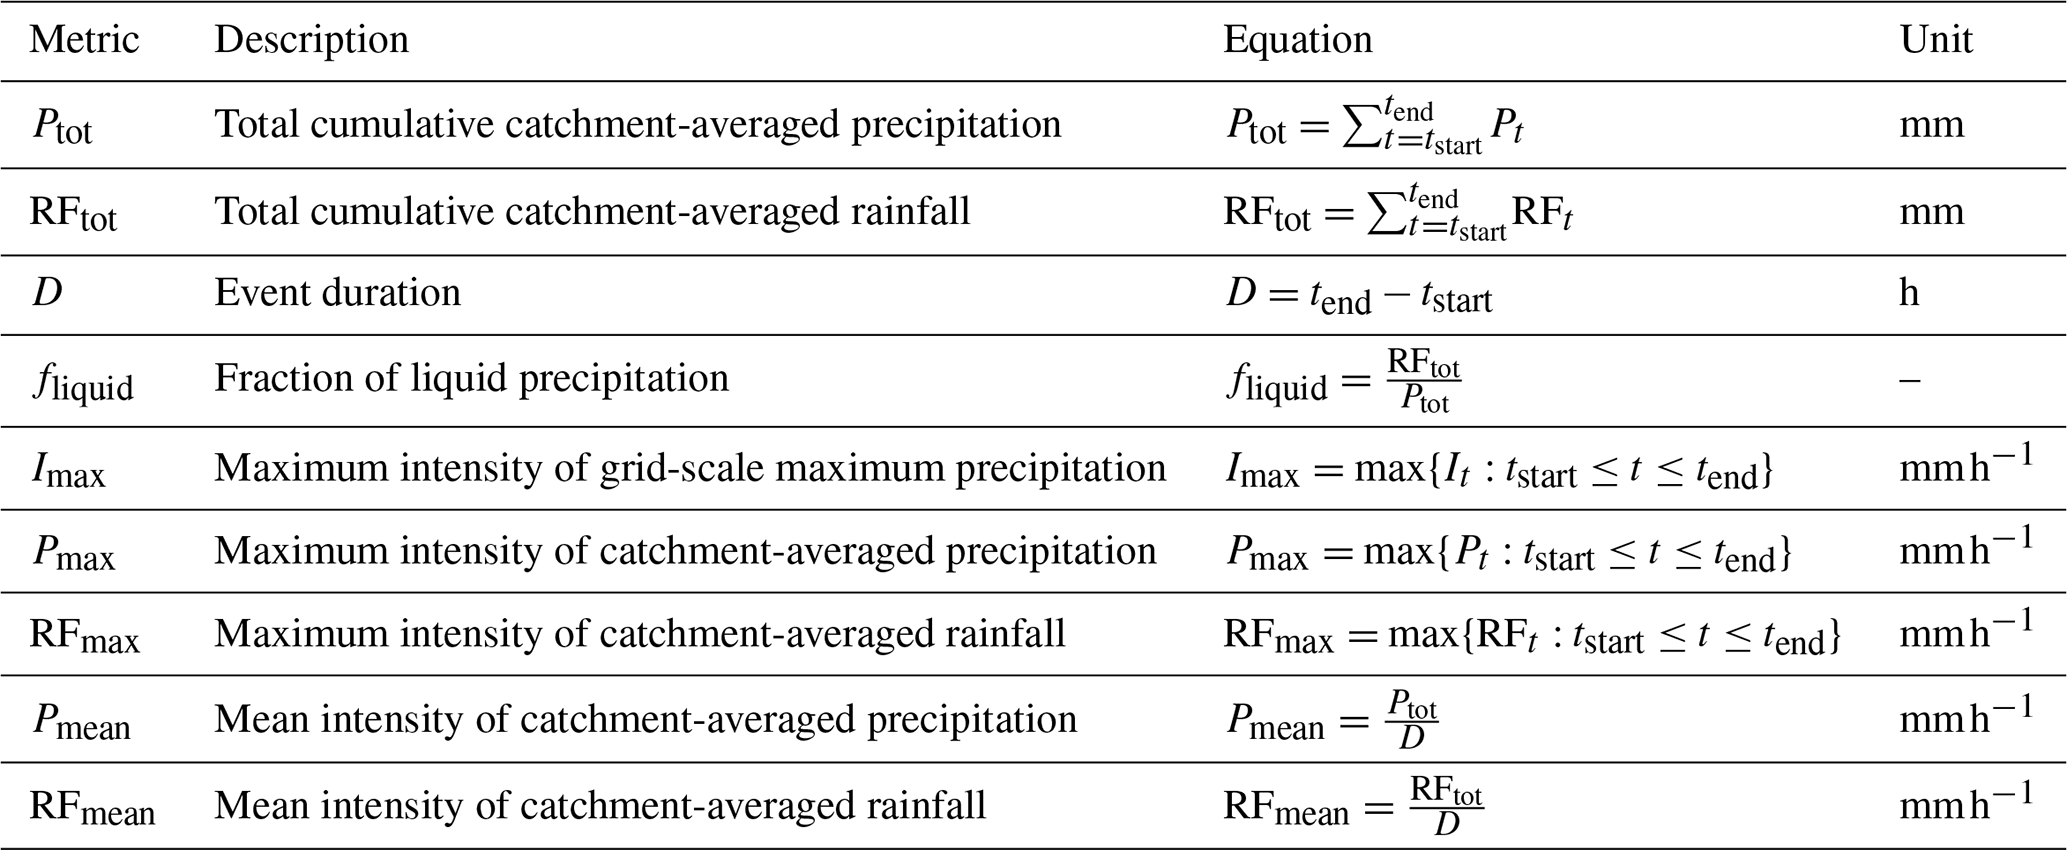
For each heavy precipitation event, we calculate a set of characteristics based on Leonarduzzi et al. (2017), which quantify rainfall and precipitation amounts and intensity (Table 2). In addition, we calculated the average precipitation area Aprecip in order to estimate the catchment area affected by a precipitation event. We calculated Aprecip by determining the fraction of catchment area receiving > 0.1 mm precipitation for each time step, before averaging over the entire event duration. To give an indication of the moisture conditions in the catchment over the last seven days leading up to the event, we calculated the 7 d normalised antecedent precipitation index, NAPI7, after Heggen (2001).
Table 2Metrics quantifying the characteristics of the heavy precipitation events.
We further categorised each event according to the spatial and temporal scale of the set of heavy precipitation peaks detected. An event detected from Pt or both Pt and It was categorised as a catchment-wide event, while one detected only from It was categorised as a localised event. Sub-daily events only have heavy precipitation peaks above 1 to 12 h thresholds. Long-duration events contain at least one heavy precipitation peak above a 24, 48, or 72 h threshold. Hence, the temporal scale does not refer to the overall duration of the precipitation event, i.e. D in Table 2, but the set of heavy precipitation peaks detected witin the event (Fig. 3).
3.3.1 Indicators of snow amount and melt
Snow conditions in the catchment during heavy precipitation events were represented using daily 1 km snow water equivalent (SWE) grids from SNOWGRID-CL, a physically based and spatially distributed snow model that simulates snow accumulation and ablation (Olefs et al., 2020). A time series of catchment-averaged snow water equivalent SWEt was calculated by averaging the daily SWE grids over Tumpen-Ötztal between 2004 and 2023. For each event, we calculate the average SWE in the catchment during the period from the first day to the last of the event, SWEmean. In addition, to give an indication of whether snowmelt occurred during each heavy precipitation event, we calculate the difference between the catchment-averaged SWE on the last day of the event and the day before the event, SWEloss. Both of these indicators are only intended to give a rough estimate of whether the amount of snow in the catchment or snowmelt might have played a role during an event.
3.3.2 Uncertainty analysis
To gauge the uncertainty in the precipitation intensity and amount of each detected event, we calculated the RMSE of Ptot and Imax for each event. This analysis was based on the 10 stations within Ötztal with hourly precipitation measurements (see Table S1, Supplement). Due to the varying temporal extents of the station data, we first calculated the event-based RMSE for each station then averaged over all stations to obtain one RMSE value for Ptot and Imax respectively. This ensures that each station is weighted equally which prevents biasing the estimate towards the lower elevation stations that have more observations.
3.4 Fluvial sediment response to heavy precipitation events
To estimate the fluvial sediment response to precipitation events we first delineated hydrological events in Qt using local-minima hydrograph separation (Sloto and Crouse, 1996). This method separates the entire streamflow time series into pulses of river discharge, separated by the local minima which mark the end of recession after one hydrological event and the onset of the next. Following Tsyplenkov et al. (2020) we use a 21 h search window, which is suitable for Ötztal's glacially-influenced hydrological regime (Skålevåg et al., 2024), which ensures that two local minima are separated by at least 10.5 h.
The resulting hydrological event catalogue was compared to the detected heavy precipitation events, matching hydrological events to each heavy precipitation event: All hydrological events that overlap with a precipitation event, i.e. begin or end between tstart and tend, are assigned to that event. We discarded all cases, in which the first matched hydrological event began > 3 h before tstart, or where the last matched hydrological event began < 1 h before the end of the precipitation event.
The fluvial sediment response window of an heavy precipitation event was defined as the time window from tstart to the end of the last matched hydrological event thydro,end. For each heavy precipitation event we calculated the mass of suspended sediment exported, i.e. suspended sediment yield SSY in t:
To take into account the varying event durations we also calculate the average suspended sediment flux SSFmean in t h−1:
During the melt season, and especially in July and August, the sediment load in the river will be elevated at the onset of an event due to other drivers such as high sub-glacial sediment discharge. To account for this, we also calculated the excess suspended sediment yield SSYex of an event in t. This metric only sums up the SSF in each time step that exceeds the initial SSF at the start of the event:
Finally, we extracted the peak and averaged SSC in mg L−1 during the sediment response window of each heavy precipitation event:
3.5 Contribution of precipitation-driven events to annual sediment yield
To quantify the contribution of precipitation-driven sediment transport to annual SSY, we conducted an inverse analysis in which we classified all hydrological events based on the associated precipitation. We categorised hydrological events with influence of heavy precipitation if they matched with heavy precipitation events in Sect. 3.4. Of the remaining hydrological events, those with an average precipitation intensity of >0.1 mm h−1 were categorised as non-heavy precipitation and the rest as no precipitation.
For each hydrological event we calculated SSY, SSF, Ptot, and RFtot, substituting tstart and tend with the start and end times of the hydrological event (see Eqs. 7–10 and in Table 2). Next, we calculated the contribution to annual SSY of each hydrological event under the influence of heavy, non-heavy, and no precipitation. Due to the high inter-annual variability of annual SSY we also calculated the fraction of annual SSY exported during each precipitation influence event class. Using a Mann-Kendall (MK) test (Kendall, 1970; Mann, 1945) with a 5 % significance level we detected significant annual trends, and estimated their magnitude with Theil-Sen slope (Sen, 1968; Theil, 1950).
3.6 Fraction of precipitation-driven suspended sediment spikes
Given the strong influence of melt-driven sediment transport in the study area, not all hydrological events with high SSC are linked to (heavy) precipitation. In another inverse analysis we extracted hydrological events with high peak SSC and classified them as influenced by heavy, non-heavy, or no precipitation as in Sect. 3.5. We defined these suspended sediment spikes as hydrological events with SSCmax above the 90th percentile of SSCt, SSC90 after Skålevåg et al. (2024). For both catchments we counted the number of such events affected by either heavy or non-heavy precipitation.
4.1 INCA uncertainty
The uncertainty analysis of daily and hourly INCA precipitation shows that INCA tends to overestimate the precipitation amount with an average ME of 0.2 mm d−1 and 0.01 mm h−1 for daily and hourly precipitation respectively. The average RMSE of hourly precipitation is 0.5 mm h−1 and is unrelated to altitude (Fig. S4d, Supplement). The RMSE of daily precipitation is 1.0 to 2.5 mm d−1 at stations below 1750 compared to 1.0 to 6.2 mm d−1 at higher elevations (Fig. S4c, Supplement). At both, the hourly and daily scale, the INCA data are highly accurate (Acc > 0.9) concerning precipitation up to about 2500 (Fig. S4e–f, Supplement). At higher elevations, this accuracy drops to between 0.8 and 0.9 for precipitation hours and between 0.66 and 0.93 for precipitation days. Overall, the frequency of precipitation hours and days is overestimated by INCA with FB generally above 1 (Fig. S4g–h, Supplement). However, at three stations, Proviantdepot, Latschbloder, and Station Hintereis, located at high elevations (2737 to 3031 ) in the inner Rofental, INCA underestimates the occurrence of precipitation at both the daily and hourly scale.
4.2 Heavy precipitation event catalogue and characteristics
A total of 169 heavy precipitation events were identified with the multi-scale detection approach. Three events were removed during the visual check, as the precipitation maps revealed that only one or two grid cells received very high amounts of precipitation while neighbouring cells did not receive any and no precipitation was recorded at the weather stations; these events were likely data artefacts (see Sect. S2.2.1 in the Supplement).
Of the 166 events compiled in the final catalogue, 62 were detected from It, 78 from Pt, and 26 from both time series. Only 41 events (25 %) were detected with a single threshold, while the majority contained heavy precipitation peaks at multiple temporal or spatial scales. The events ranged from intense short duration bursts to long-duration events with high precipitation totals (Fig. 4b). The average event duration was 24 h with the shortest event lasting 5 h and the longest 128 h (5.3 d). The highest Imax was 88 mm h−1 with an average of 19 mm h−1 (2019-g, Fig. 4b). The largest event in terms of precipitation amount recorded a Ptot of 106 mm (2023-g, Fig. 4b) compared to the highest RFtot of 97 mm. On average the total precipitation and rainfall amount was 24 and 16 mm respectively.
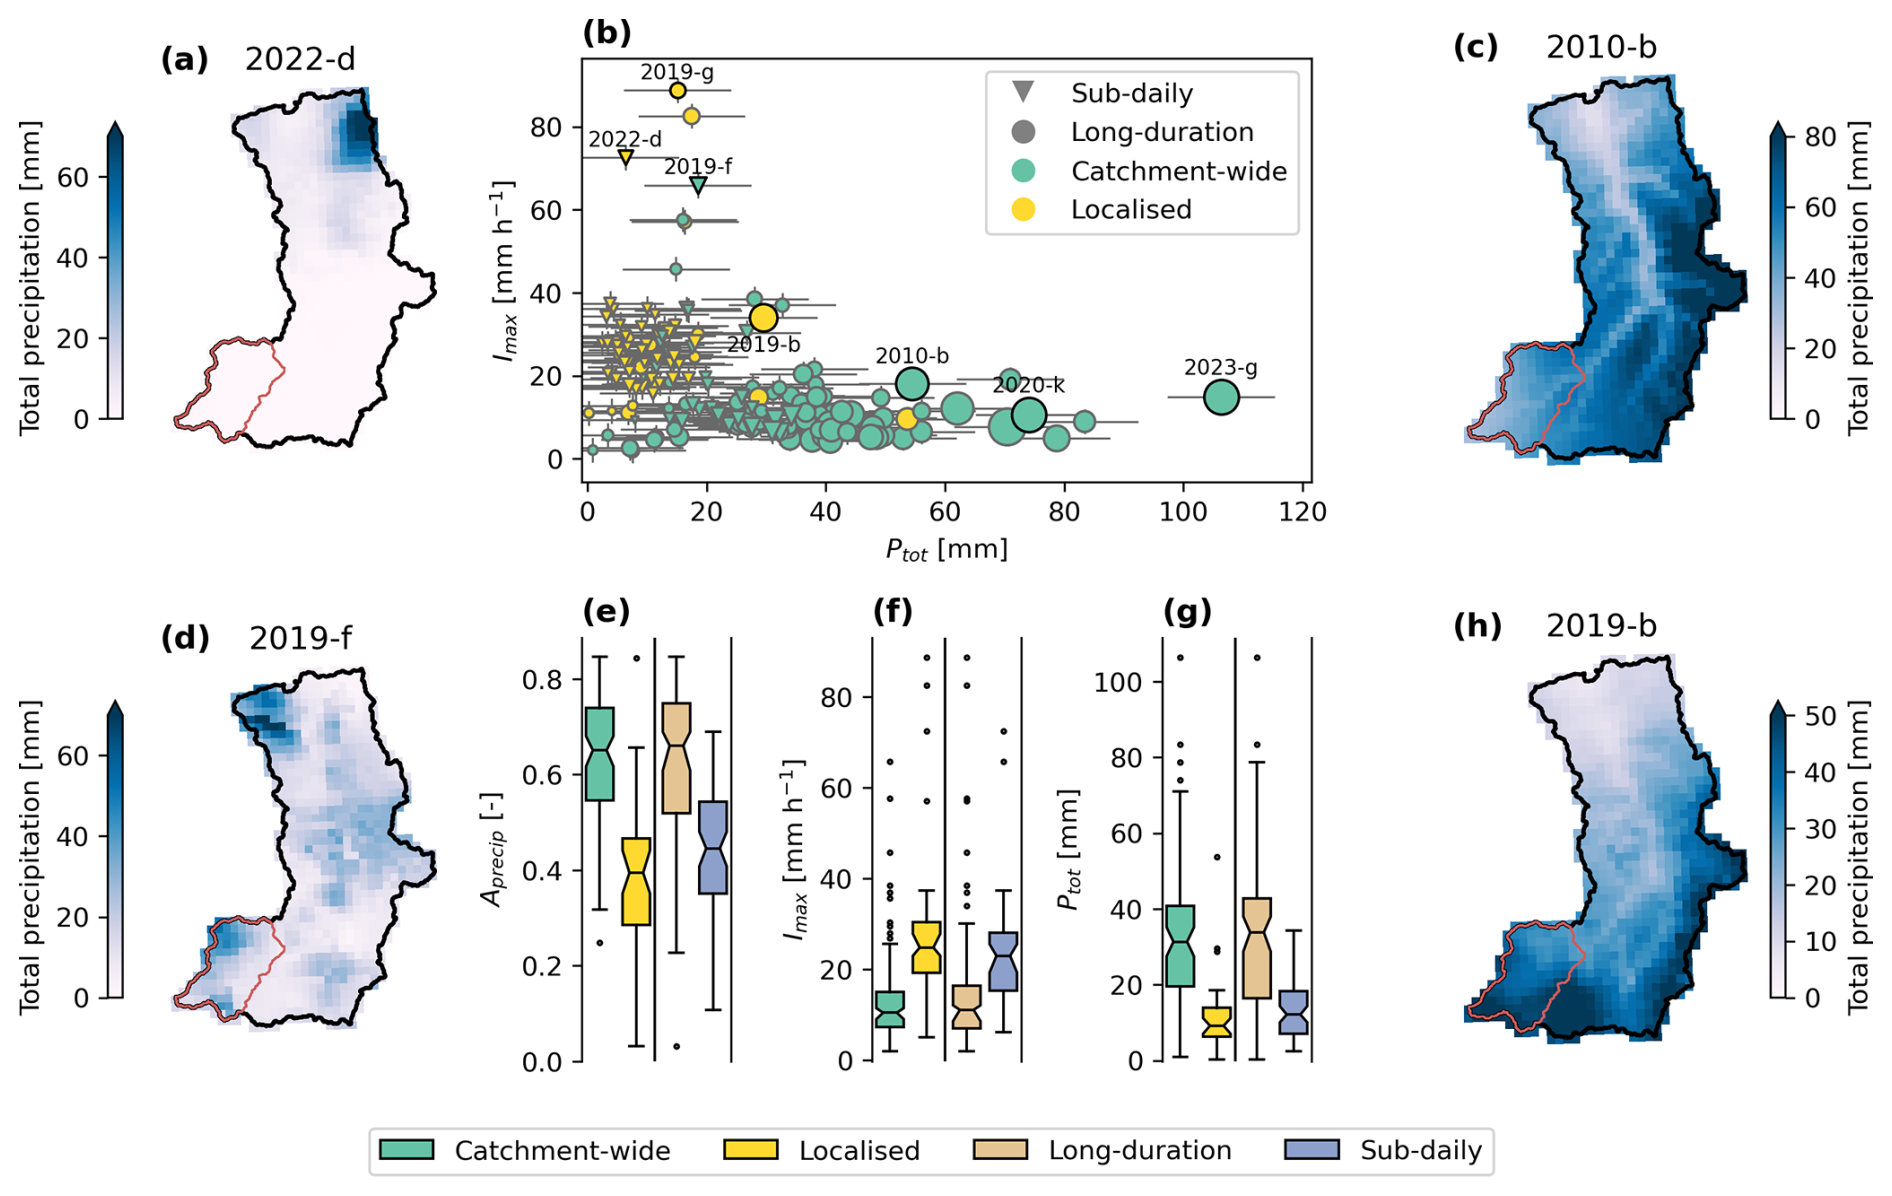
Figure 4Overview of heavy precipitation events detected with the multi-scale approach (b). Events range from localised events of high intensity to catchment-wide heavy precipitation events with high precipitation totals. Dot size indicates the duration of events. Error bars show the average RMSE of Ptot and Imax across all events and stations. Total accumulated precipitation maps of selected events (highlighted in (b)) show examples of a sub-daily localised event (a), sub-daily catchment-wide event (d), long-duration catchment-wide event (c), and localised long-duration event (h), in addition to the event with the highest Ptot (2023-g) and Imax (2019-g). Event 2020-k exported a high amount of suspended sediment. Boxplots of average precipitation area (e), peak 1 h catchment maximum precipitation intensity Imax (f), and total cumulative precipitation Ptot (g) highlight differences between catchment-wide and localised events (left) and events classified as long duration or sub-daily events (right). Boxplot notches are 95 % bootstrap confidence intervals for the median based on 1000 randomisations. The whiskers extend from the box to the most distant data point within 1.5 times the inter-quartile range (IQR) from the box.
The 75 heavy precipitation events detected with sub-daily thresholds (≤ 12 h) tended to have more intense precipitation (Fig. 4f) consisting mostly of rainfall (95 % on average). They occurred mainly between June and August, which is when precipitation and rainfall amounts are highest (Fig. 2). Two examples of sub-daily heavy precipitation events (Fig. 4a, d) highlight how localised precipitation was, with much the catchment receiving little to no precipitation. The 91 long-duration heavy precipitation events had higher precipitation totals (Fig. 4g) that affected larger areas (Fig. 4e), occurred throughout May–October without any particular seasonality, and with higher fractions of snowfall (45 % on average).
The 104 catchment-wide heavy precipitation events had low precipitation intensities (Fig. 4b, f) but affected a larger catchment area (Fig. 4e) with high precipitation totals (Fig. 4g). In contrast, the 62 localised heavy precipitation events affected a smaller catchment area (Fig. 4e), had high Imax (Fig. 4f), and precipitation totals of mostly < 20 mm (Fig. 4g).
The annual frequency of heavy precipitation events varied over the study period with events occurring more frequently towards the end (Fig. 5a), displaying a significant increasing trend (MK-test, 5 % significance level). For the first few years of the study period there were 3–5 events per year and in these years May–October precipitation was lower than the latter part of the study period. From 2010 onwards followed a few years with high inter-annual variability in event numbers, varying between 4 and 16 events per year. In the final part of the study period, from 2015 onwards, the annual occurrence of heavy precipitation events was at a higher level with a minimum of 8 events per year. In general, there were more events in years with higher May–October precipitation, with annual event counts and May–October precipitation totals being significantly correlated, r=0.65.
Average annual RMSE of daily precipitation was higher in the first half of the study period (median: 2.4 mm d−1) and dropped to a lower level (median: 1.4 mm d−1) between 2016 and 2024 (Fig. 5a). In both periods daily precipitation is overestimated, but with a higher median annual mean error of 0.24 mm in 2004–2016 compared to 0.14 mm from 2017 onwards. Heavy precipitation days with more than 10 mm d−1 had a tendency to be overpredicted, except in 2004 and 2015 where they were under-predicted. The years with the highest frequency bias are 2007, 2012, 2013, and 2014.
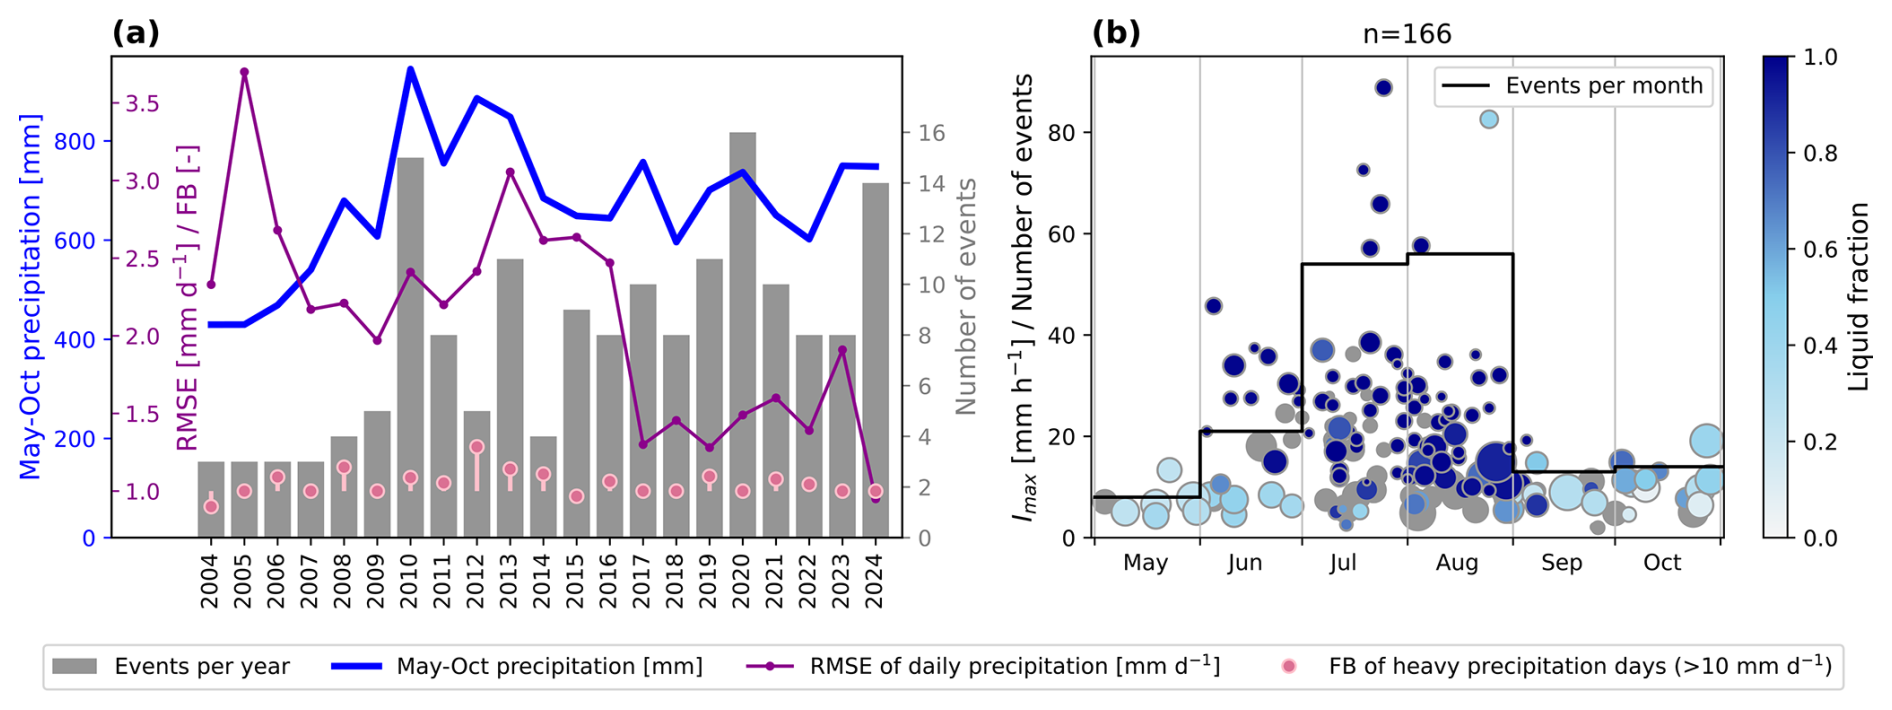
Figure 5Annual (a) and seasonal (b) occurrence of heavy precipitation events. Number of events per year and May–October precipitation (a) are lower in the first six years of the study period compared to the later years. The annual median RMSE of daily precipitation across all stations within the study area show higher uncertainties in INCA for the first 13 years (a). The frequency bias (FB) of heavy precipitation days in INCA is also higher in the first decade (a). Most heavy precipitation events occur during July and August (b) when events consist mostly of liquid precipitation. Dot sizes are proportional to the total event precipitation. Grey dots are events with unknown liquid fraction (2004–2010).
About two thirds of heavy precipitation events occurred during the summer months July and August with the lowest occurrences in May, September and October (Fig. 5b). Events with a high liquid fraction, i.e. mainly rainfall, were concentrated in the months June, July and August. Mid-season heavy precipitation events tend to have higher intensities and shorter durations, while events with longer duration and lower intensity occurred evenly throughout the year. Events with higher amounts of snowfall (liquid fraction generally below 0.5) mainly occurred in the colder months of May, June, September and October.
4.3 Precipitation characteristics and sediment response
Of all precipitation event characteristics, the three rainfall characteristics show the strongest and consistently positive significant correlation with each of the sediment response variables (Table 3), with the exception of peak SSC and total rainfall, which is not significantly correlated. The peak catchment averaged precipitation intensity, Pmax, shows significant but somewhat weaker positive correlation with the sediment response variables. The 7 d antecedent precipitation index, NAPI7, is not significantly correlated with the sediment response variables, with the exception of peak SSC which is weakly negatively correlated. Event duration, D, and average precipitation area, Aprecip, are negatively correlated with the sediment response variables. Both SWEmean, indicating the amount of snow in the catchment, and SWEloss, indicating snowmelt during the heavy precipitation event, are significantly negatively correlated with the sediment response variables. The correlation between SSYex and the precipitation event characteristics does not substantially differ from SSY.
Table 3Rank correlation coefficients (Spearman) between precipitation event characteristics and log 10-transformed sediment response variables in Tumpen-Ötztal. Statistical significant correlations (5 % significance level) are denoted with an asterisk (*). The number of heavy precipitation events n used to calculate the correlation coefficient is indicated in the right-hand column.
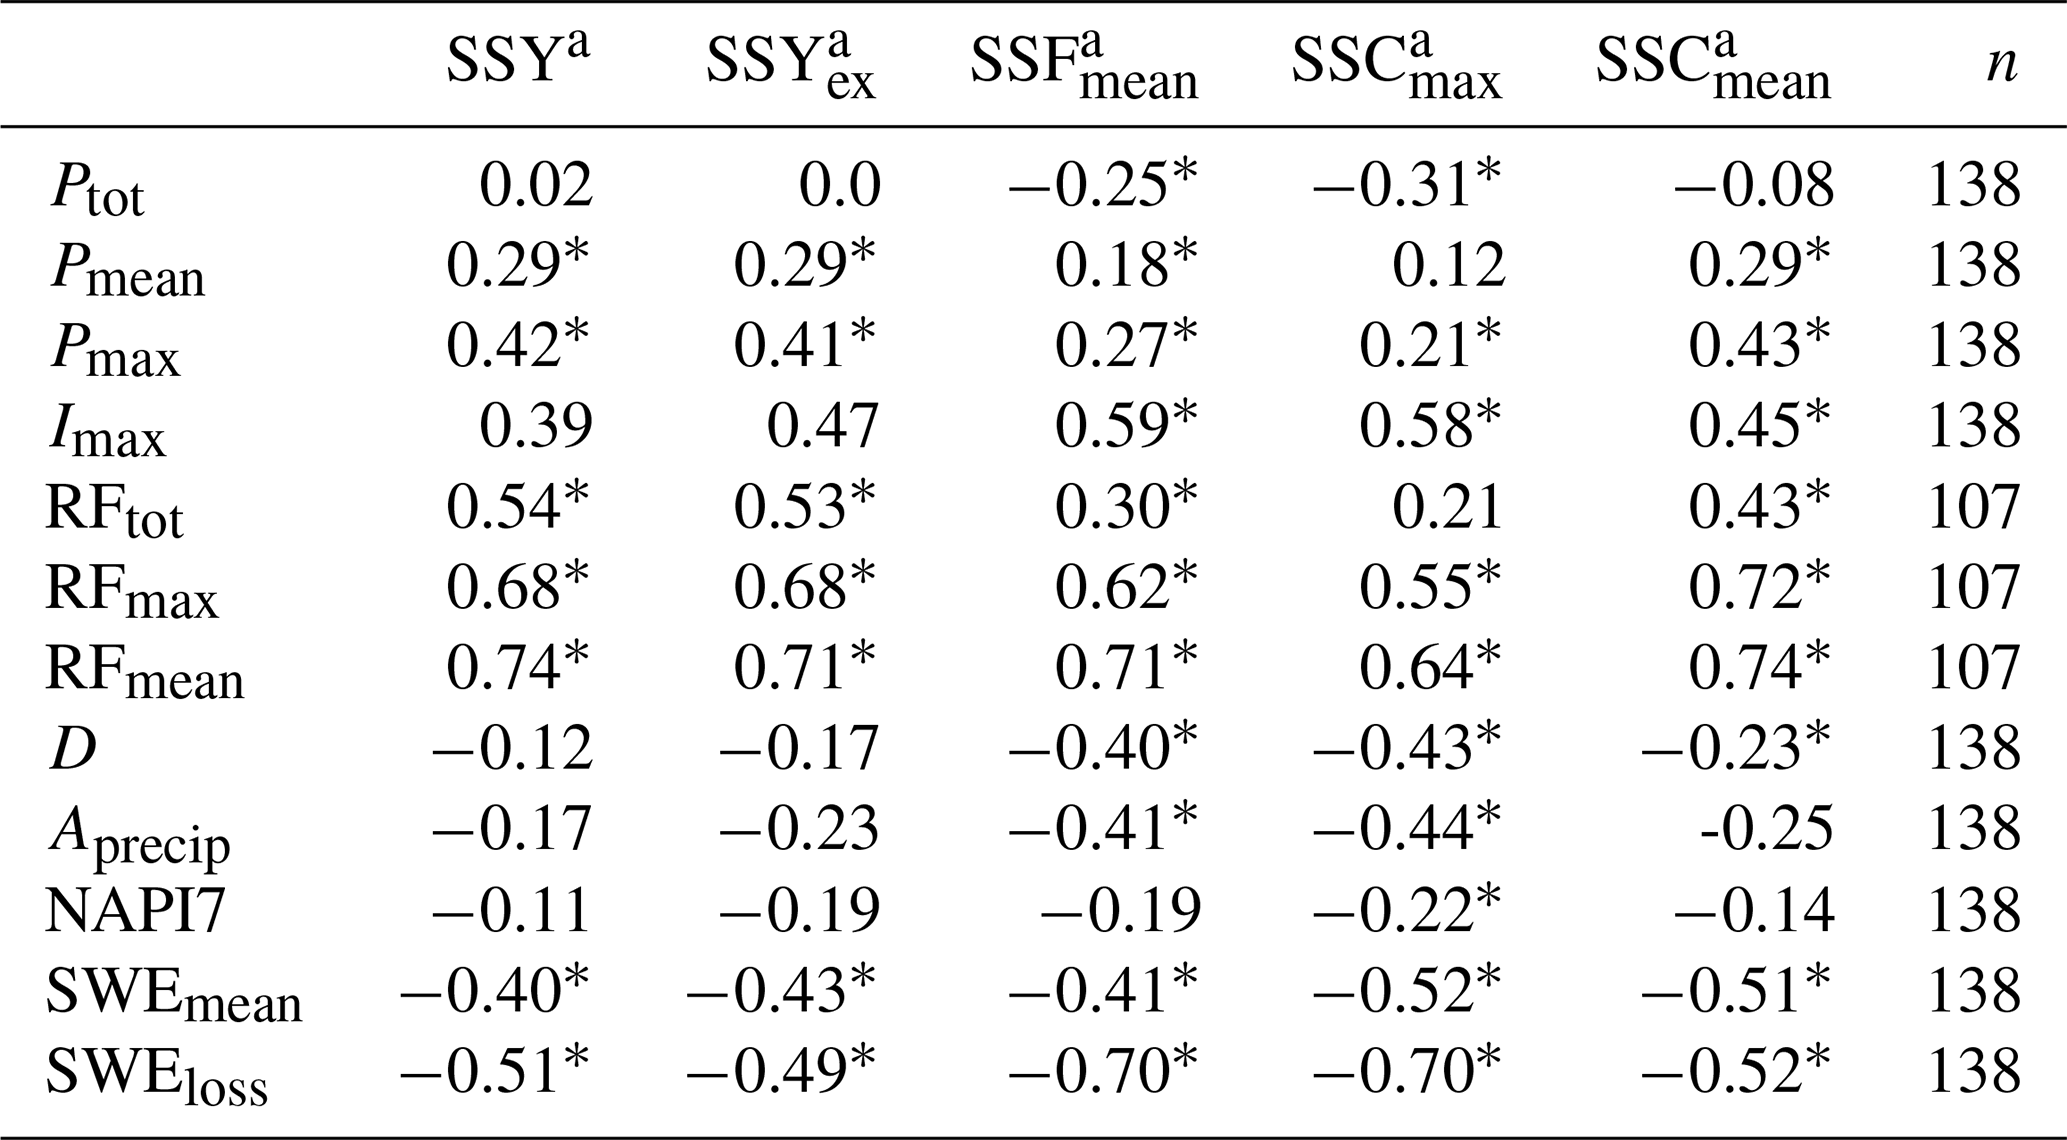
a log 10-transformed
The relationship between event rainfall and suspended sediment shows clear differences between sub-daily and long-duration heavy precipitation events (Fig. 6). The sub-daily heavy precipitation events have an overall weaker positive relationship with rainfall intensity and amount. The difference is particularly pronounced for RFmax and SSY and SSFmean (Fig. 6b, f). Here, SSY and SSFmean markedly increase with rainfall intensity for long-duration heavy precipitation event, whereas for sub-daily heavy precipitation event, increases in rainfall intensity barely have an effect. Sub-daily heavy precipitation events overall have higher SSFmean compared to long-duration heavy precipitation events (Fig. 6h) and somewhat although not significantly higher SSCmax (confidence intervals of medians overlap, Fig. 6l). In terms of total exported suspended sediment mass there is little difference between the two categories of heavy precipitation events, except a larger spread for long-duration heavy precipitation events (Fig. 6d).
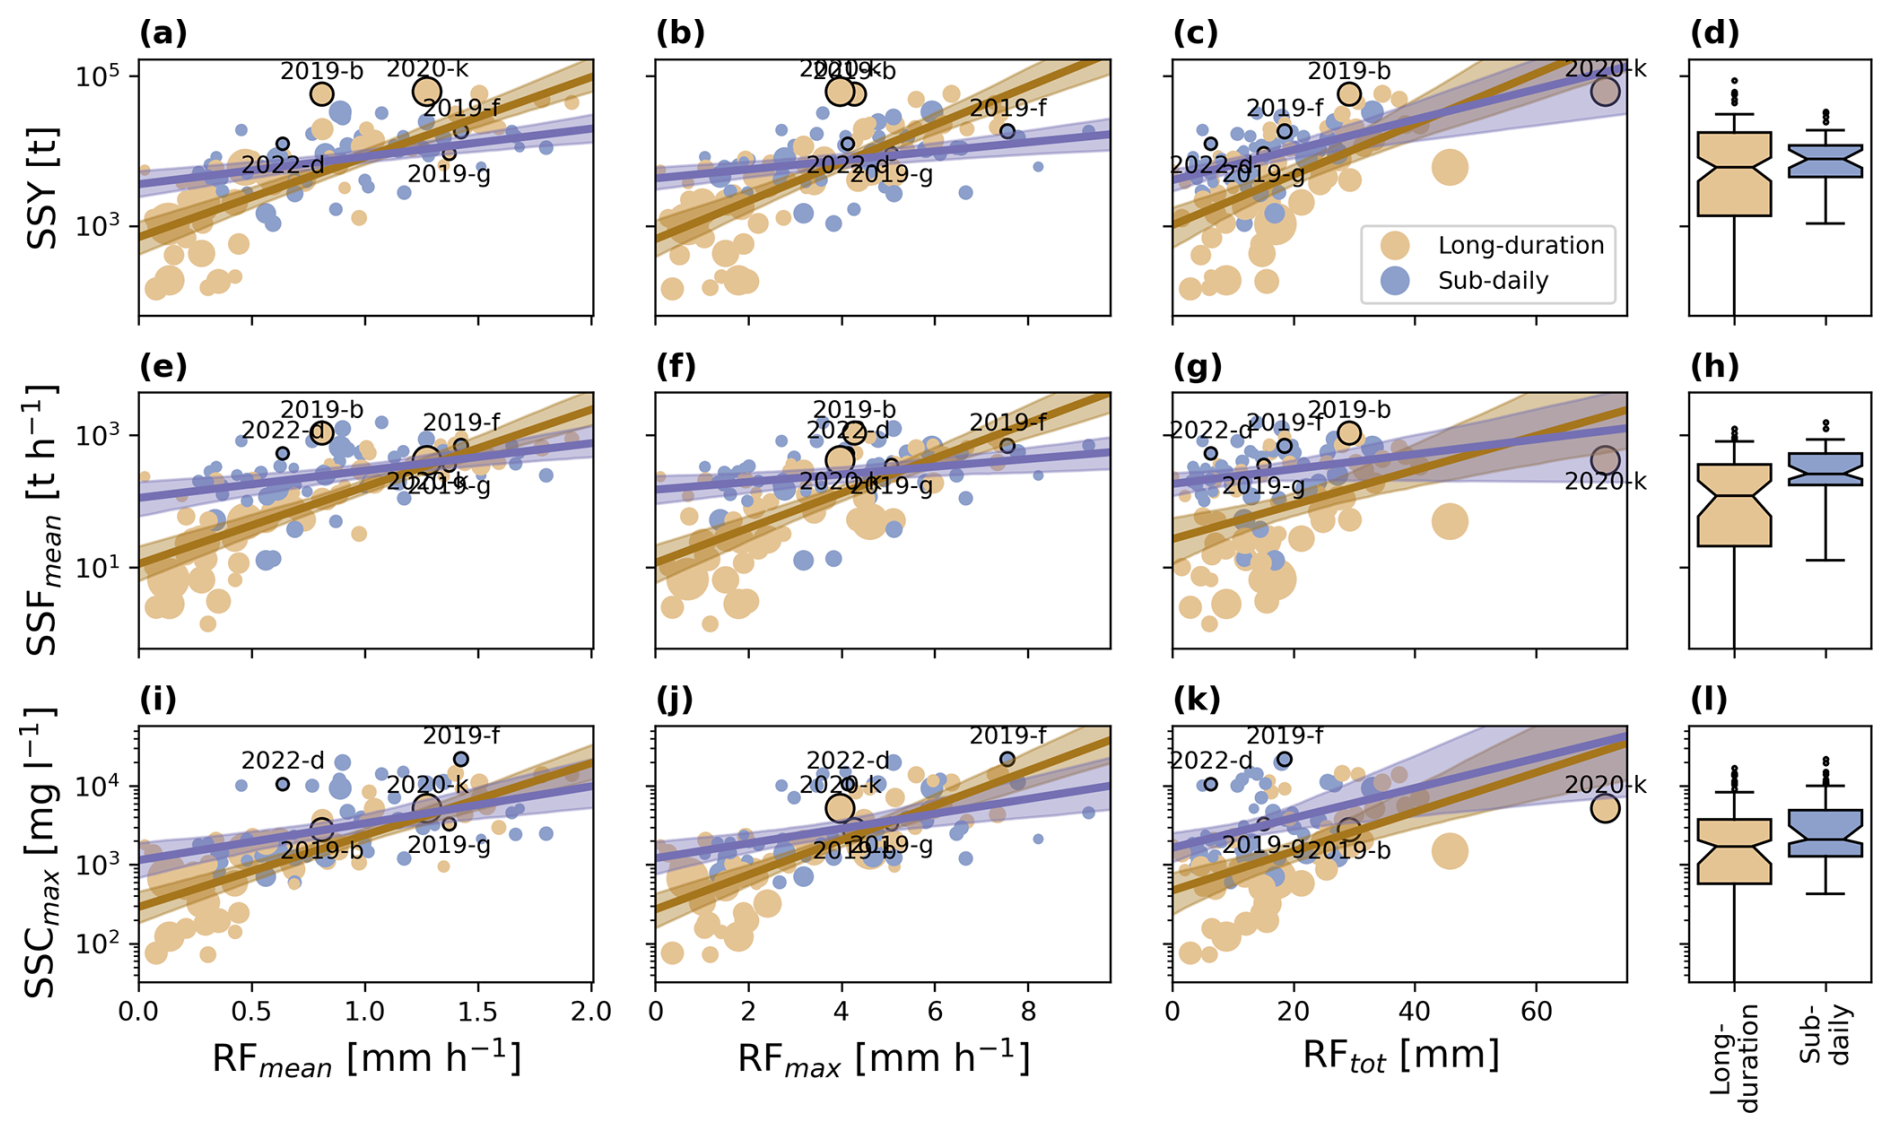
Figure 6Suspended sediment response to heavy precipitation events in Tumpen-Ötztal (107 events between 2011–2022) in terms of their mean intensity of catchment-averaged rainfall RFmean (a, e, i), maximum intensity of catchment-averaged rainfall RFmax (b, f, j), and total cumulative catchment-averaged rainfall RFtot (c, g, k). There are 58 long-duration and 49 sub-daily heavy precipitation events. Dot size indicates the duration of events. Lines are means from linear regression, and shaded areas are 95 % bootstrap confidence intervals based on 1000 randomisations. Labelled events are the same as in Fig. 4. See Fig. 4 for details on boxplot configuration.
4.4 Contribution of precipitation to annual sediment yield
Between 2006 and 2022, both the total mass and the fraction of suspended sediment exported during heavy precipitation events increased significantly in both catchments (Fig. 7a–d). The fraction of annual SSY exported during heavy precipitation-driven hydrological events increased at about 1 % yr−1 in both catchments (Fig. 7a, c). There are no significant annual trends in suspended sediment exported during hydrological events with non-heavy or no precipitation. Moreover, in both catchments the sediment mass exported outside of heavy precipitation events (Fig. 7b, d) follows a similar trend to the total annual SSY (Fig. 7a, c). In Tumpen-Ötztal, the sediment mass exported outside of heavy precipitation events was largely unchanged throughout the 17 years (Fig. 7b). In Vent-Rofental, the contribution of hydrological events associated with non-heavy or no precipitation decreased until 2021, though abruptly increased in 2022 (Fig. 7d).
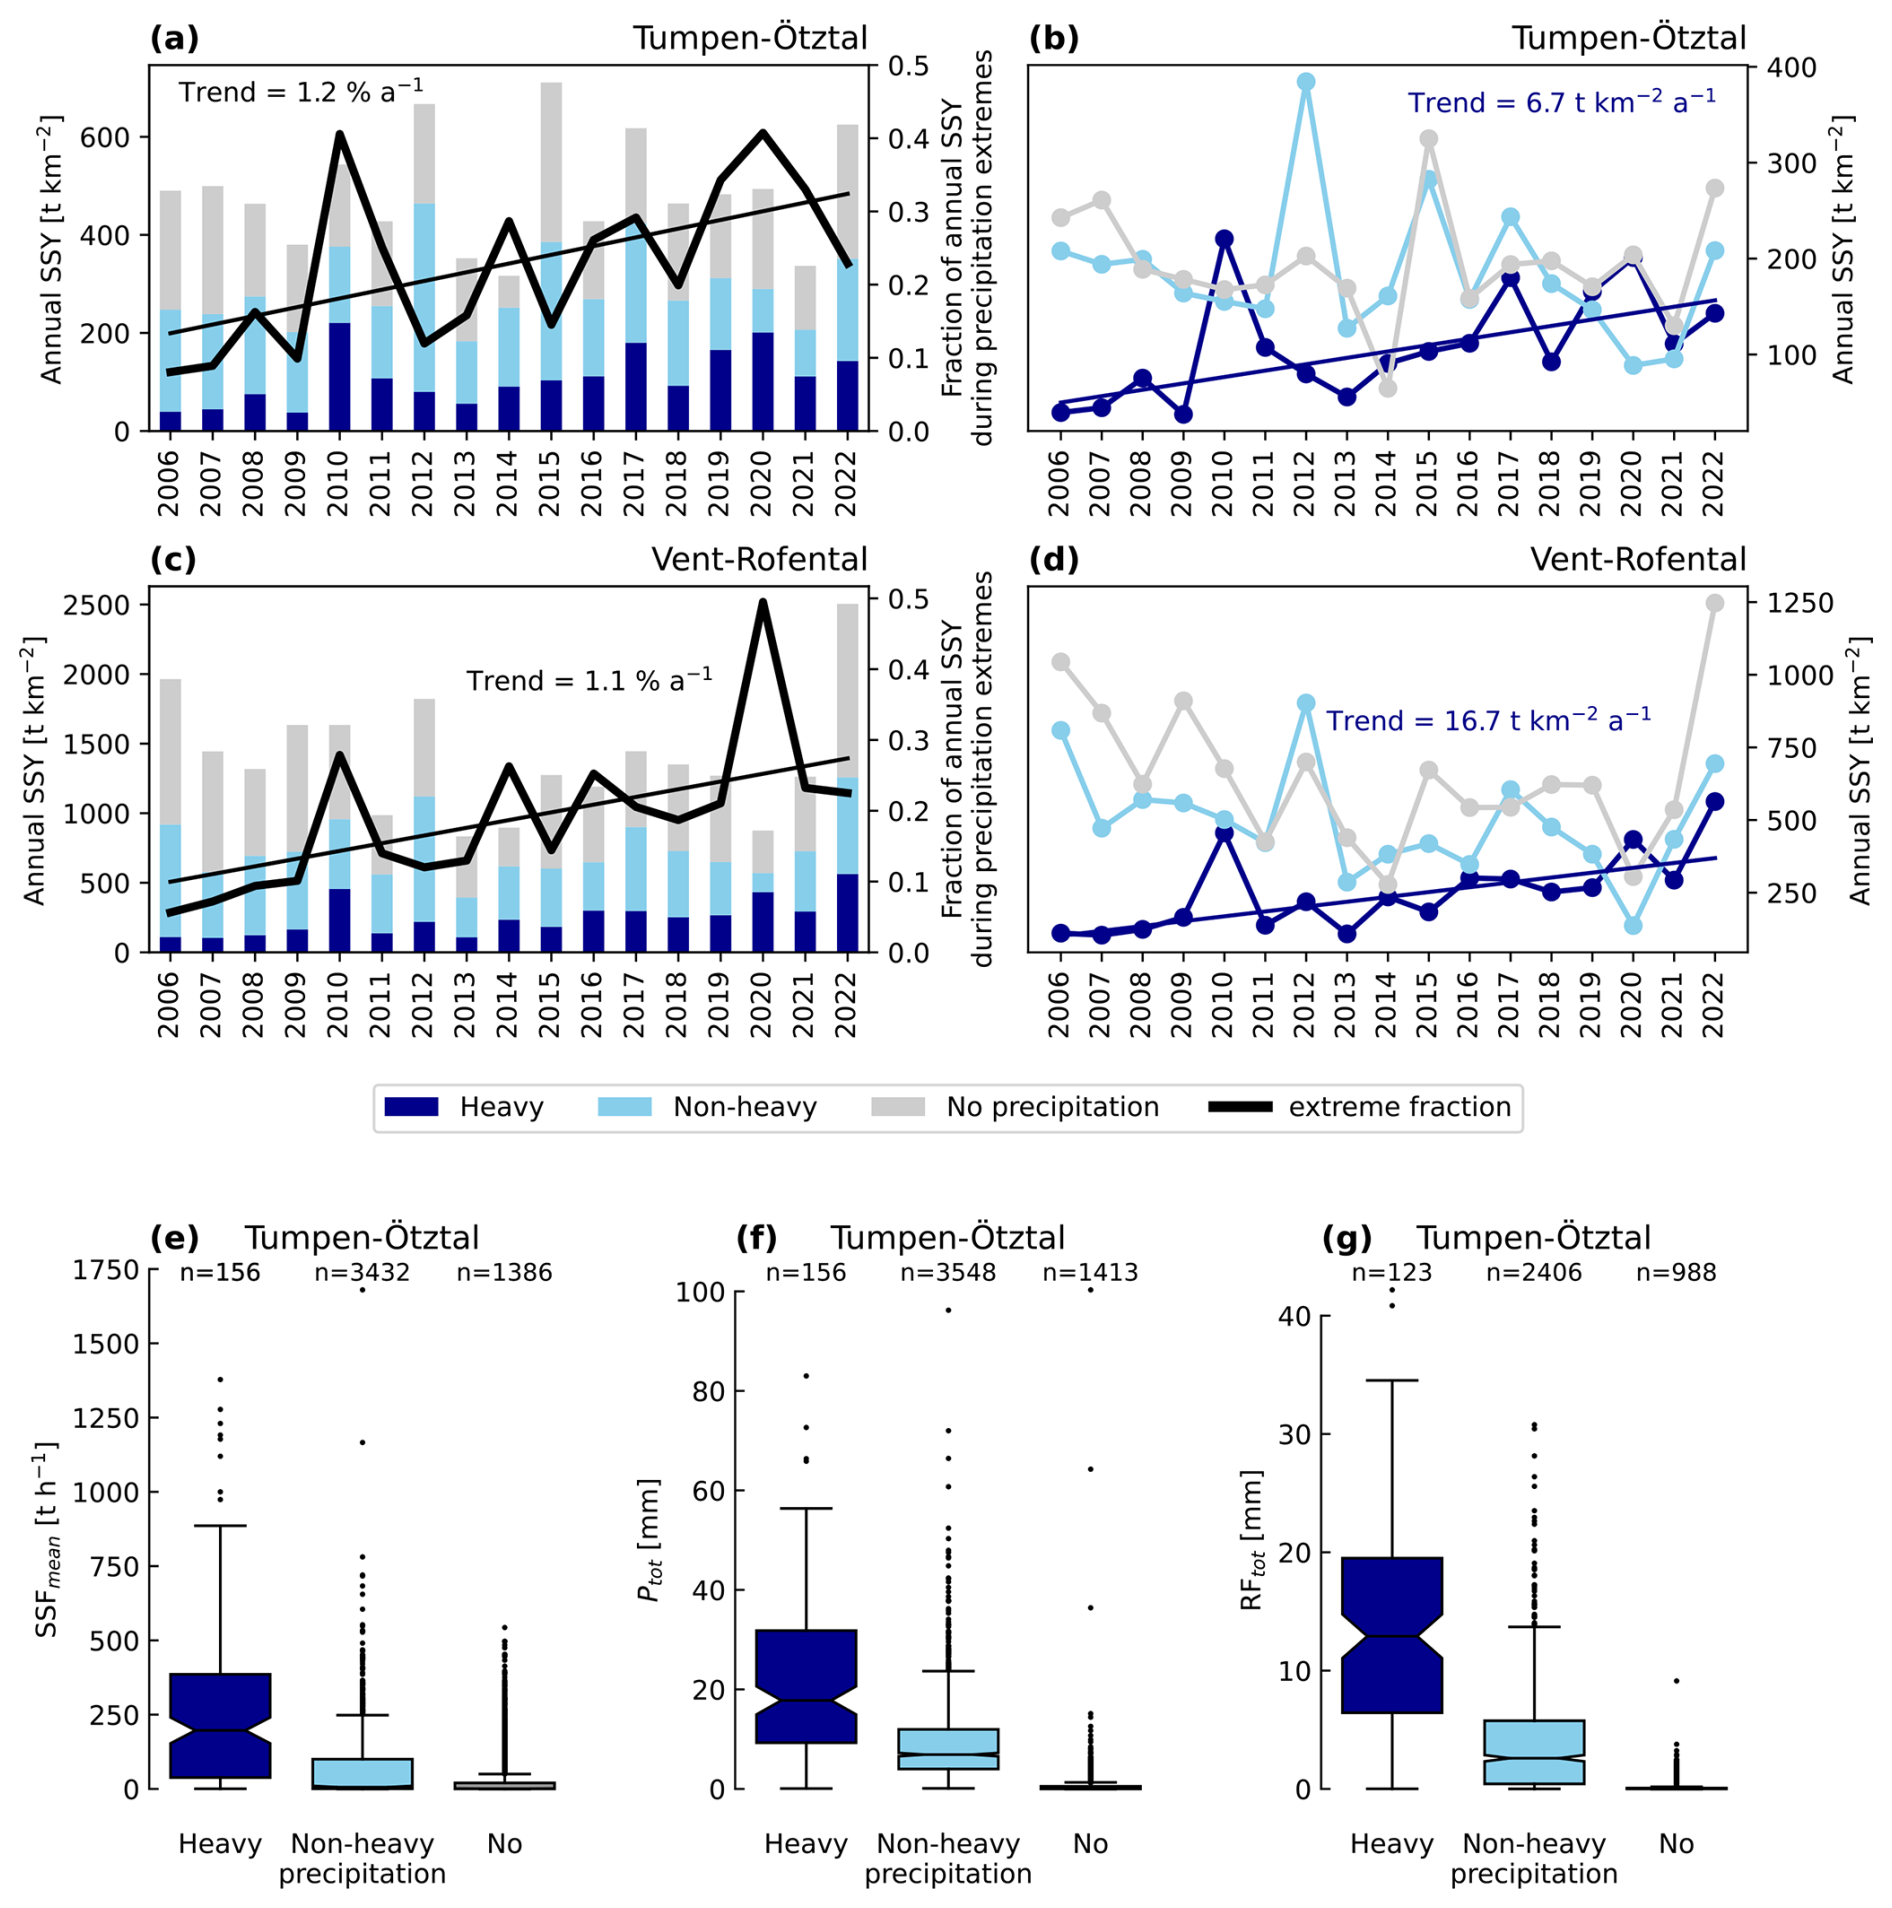
Figure 7Annual suspended sediment yield (SSY) categorised by precipitation type during a hydrological event with the contribution of each type between 2006 and 2022 for Tumpen (a–b) and Vent (c–d). The fraction (thick black lines) and total amount of sediment (colour-coded bars) exported during heavy precipitation events significantly increases between 2006 and 2022. Average suspended sediment flux (e), total precipitation (f), and total rainfall (g) during hydrological events associated with heavy precipitation, non-heavy precipitation (Pmean>0.1 mm h−1), and no precipitation (Pmean≤0.1 mm h−1) show significant differences in their magnitude (two-sample Kolmogorov-Smirnov test with 5 % significance level, see Hodges, 1958). The number of hydrological events in each category with valid data is shown above each boxplot.
There is a significant difference between the SSFmean, Ptot, and RFtot of hydrological events associated with heavy, non-heavy and no precipitation (Fig. 7e–g). Those with heavy precipitation have the highest magnitudes, followed by non-heavy and no precipitation. On average, 23 % of annual suspended sediments were exported in association with heavy precipitation, compared to 37 % during non-heavy precipitation and 40 % during hydrological events without precipitation. The discrepancy between the magnitude and annual contribution of each category is due to the differing event frequencies (Fig. 7e–g). Events influenced by heavy precipitation are rarer, thus despite their high SSFmean, their contribution to annual SSY is lower than the other two categories.
4.5 Fraction of precipitation-driven suspended sediment spikes
The results of the inverse analysis showed that only 10 % of the more than 1000 suspended sediment spike events, i.e. hydrological events with SSCmax>SSC90, were associated with heavy precipitation (Fig. 8). About a third were associated with some, but not heavy, precipitation (Fig. 8). More than half of the suspended sediment spikes in both catchments were not associated with any precipitation. The pattern was nearly identical for Tumpen-Ötztal and Vent-Rofental.
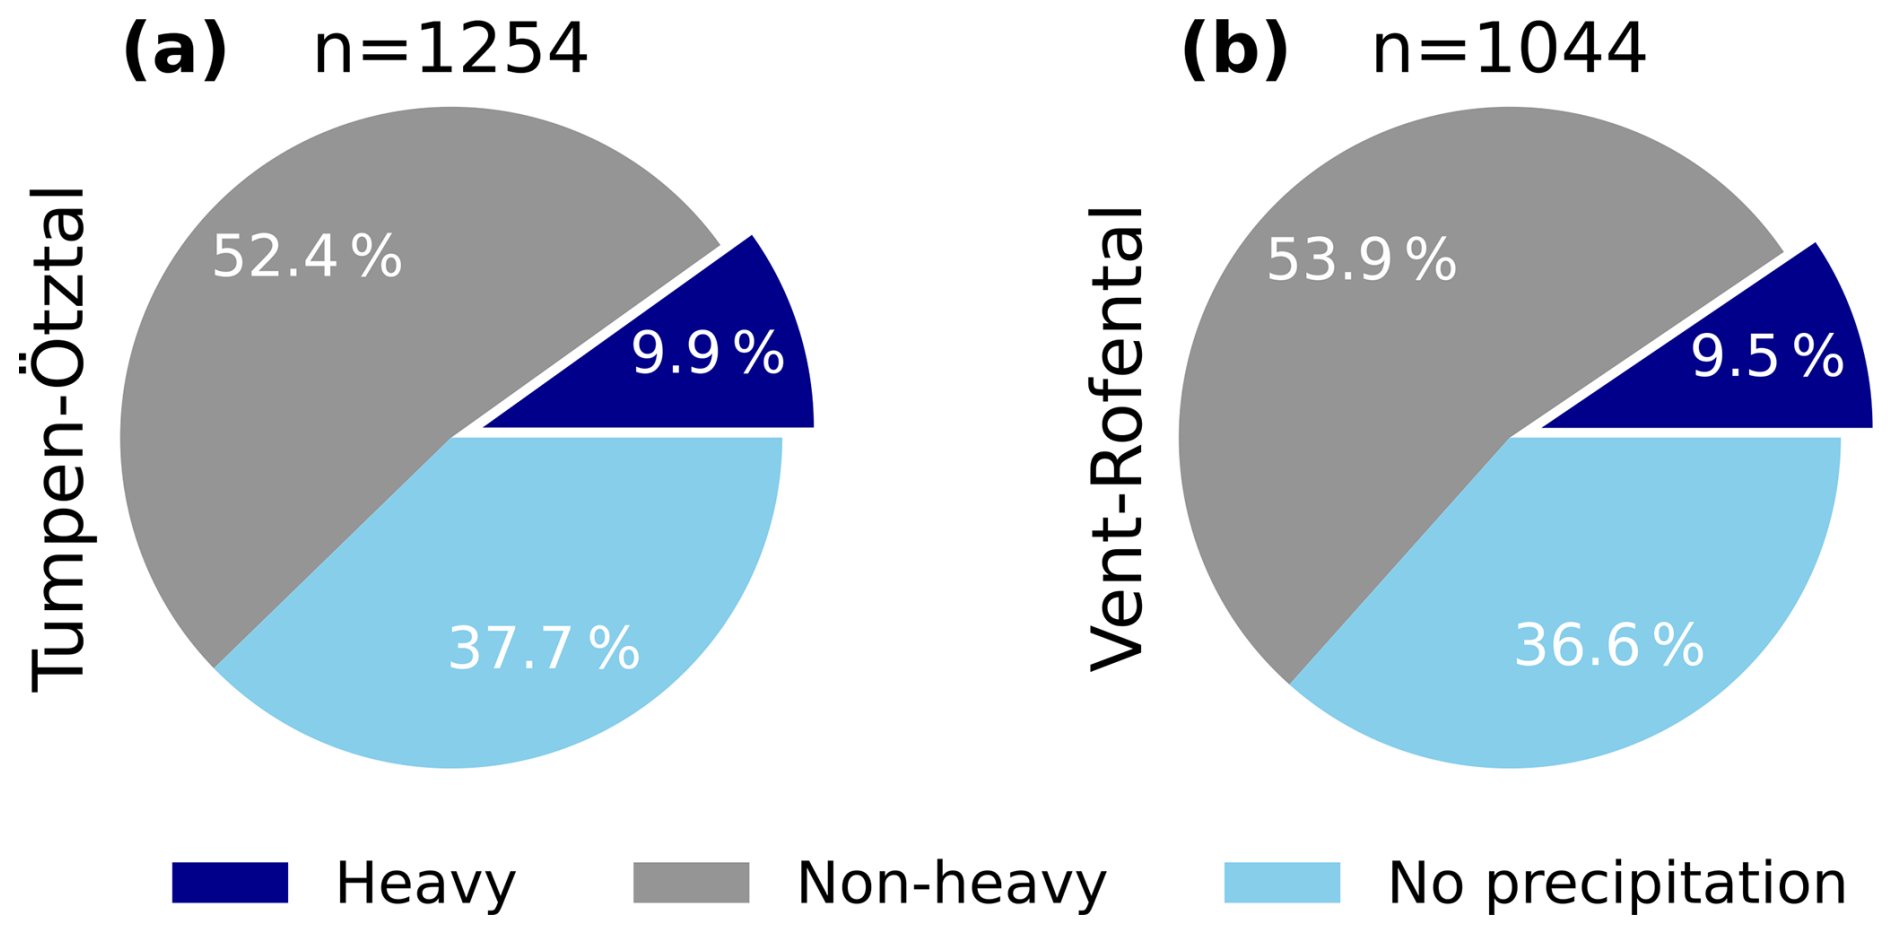
Figure 8Number of suspended sediment spikes (hydrological events with SSCmax>SSC90) associated with heavy precipitation events, non-heavy precipitation (Pmean>0.1 mm h−1), and no precipitation (Pmean≤0.1 mm h−1) in Tumpen-Ötztal (a) and Vent-Rofental (b).
5.1 Uncertainty analysis
5.1.1 INCA uncertainty and detection of heavy precipitation events
Our uncertainty analysis found that INCA tends to overestimate both the occurrence and amount of precipitation, with increasing inaccuracies with elevation. Using a very dense rain-gauge network in southeastern Austria, Ghaemi et al. (2021) found both over- and underestimation in space of INCA annual and heavy precipitation. They also found higher errors in 2012–2014, which they attribute to the installation of a new radar, and reported an improvement after 2015. We find that INCA uncertainty is higher for the first 13 years of the study period with a marked reduction in 2017, which may also be related to the incorporation of the new radar. Furthermore, INCA tends to underestimate precipitation at the highest-elevation stations in the south-western part of the study area, where the terrain is enclosed by mountain peaks over 3000 . This underestimation may be caused by radar beam shielding (Germann et al., 2006).
Changes in INCA uncertainties over time may affect the number of heavy precipitation events detected by our threshold-based approach. However, given that before 2017 INCA had higher annual mean errors (i.e. positive bias) and a greater tendency to overpredict heavy precipitation days, it is more likely that the event numbers in INCA during the first 13 years of the study period are higher than they aught to be. To give an indication of the robustness of the trend, we applied the same detection routine to three GSA stations within or close to Tumpen-Ötztal (see Sect. S2.2.2 in the Supplement). All three stations show a positive trend in the number of events over the study period, although only the trend at Umhausen is significant. Hence, we assume that the significantly positive trend in annual event numbers represent a true increase and not an artifact of inhomogeneities in INCA.
Except for the three detected events that were in fact data artefacts, we found no indications that the errors in INCA produced further false positives. All other 166 events were verified as precipitation events recorded at weather stations. Despite uncertainties in the estimated precipitation quantities, as our detection routine relies on thresholds estimated from the INCA data itself and the spatial extent of precipitation, we believe that the uncertainties in INCA hardly affect our detection routine.
Moreover, a combined gridded precipitation product such as INCA has clear advantages: First, complete and consistent spatial coverage with information on areas not covered by weather stations due to the inclusion of radar-based remotely sensed precipitation. Second, a spatial resolution of 1 km and temporal resolution of 1 h, which resolves localised, sub-daily heavy precipitation events like convective storms (e.g. event 2022-d, Fig. 4a). The spatio-temporal characteristics of such events could not have been detected with weather stations alone and their rainfall intensities would likely have been underestimated (Schroeer et al., 2018). Furthermore, geomorphological variables, such as total sediment yield and the area with active erosion and deposition during heavy rainfall events, have been found to be sensitive to changes in rainfall spatial structure and intensity (Peleg et al., 2020). Such spatio-temporal characterisation of heavy rainfall requires distributed, high-resolution data. Finally, using a dataset with consistent spatio-temporal extent and resolution has advantages over using stations with varying temporal coverage and spatial representativeness. Hence, the detection and characterisation of heavy precipitation events at multiple spatial scales, as presented in this study, would have been impossible from station data alone and would have missed key precipitation characteristics that are relevant for rainfall erosion and sediment transport processes.
5.1.2 Methodological uncertainties in event detection
Our assumption of stationarity in the precipitation time series has important implications, as it may introduce uncertainty into the thresholds used for event detection. By assuming stationarity, we neglect the possibility that the underlying precipitation distribution is shifting (or scaling) over time due to a covariate, such as global mean temperature. Both observation-based and model-based studies suggest that heavy precipitation events in the European Alps are likely to increase with climate warming (Giorgi et al., 2016; Molnar et al., 2015; Dallan et al., 2024; Vergara-Temprado et al., 2021).
Consequently, non-stationarity in heavy precipitation over time in our study area is likely. If true, this assumption introduces uncertainty into the estimation of the d-GEV. However, two aspects lead us to believe that this is of less concern. First, with a relatively short study period of 21 years, shifts in extreme values will only have limited influence. Second, our primary interest lies in understanding how shifts in heavy precipitation over time affect sediment transport. Many geomorphic processes, such as erosion and sediment transport, respond only when certain thresholds are exceeded. Consequently, adjusting detection thresholds to account for temporal shifts in heavy precipitation would not necessarily reflect the physical precipitation-driven hydro-geomorphic response in the catchment. Furthermore, the fact that we use multi-scale detection and 0.2 non-exceedence-probability to define detection thresholds means that we are quite generous with our definition of “extreme”.
5.2 Drivers of fluvial sediment export during heavy precipitation events
5.2.1 Importance of distinguishing liquid and solid precipitation
We find a close positive association between rainfall intensities of heavy precipitation events and their suspended sediment yields, fluxes, mean and peak concentrations. Precipitation phase significantly influences runoff generation, which may explain why we find that precipitation alone has a weaker association with suspended sediment responses compared to liquid precipitation. In the steep, high-altitude terrain of the Alps, precipitation during summer can still fall as snow at higher catchment elevations. Indeed, many of our detected heavy precipitation events contain some snowfall (Fig. 5b). Distinguishing between rain and snow with elevation is already emphasised in hydrological modelling and flood forecasting (Harpold et al., 2017). Moreover, in high-elevation regions of the Northern Hemisphere, increases in rainfall extremes with climate warming is amplified due to a warming-induced shift from snow to rain, making them hotspots with increasing risk of extreme-rainfall-related hazards (Ombadi et al., 2023). Our results highlight that precipitation phase is an important factor to quantify and consider when studying sediment transport during heavy precipitation events in Alpine areas.
5.2.2 Sub-daily heavy precipitation events and sediment dynamics
Our analysis shows that, at lower catchment-averaged rainfall intensities, sub-daily heavy precipitation events generate higher suspended sediment yields and fluxes than long-duration ones. Sub-daily events also typically affect a smaller catchment area (Fig. 4e), which indicates more localised precipitation. Consequently, local rainfall intensities are likely to be substantially higher than indicated by catchment-averaged values. A further indication of this is provided by the timing of sub-daily events: because they occur predominantly in summer, convection is likely to play a role, which typically produces localised, high-intensity rainfall.
Because of the association between erosion rates and rainfall intensity (Berger et al., 2010), locally elevated intensities likely explain why sub-daily events in our Alpine catchment produce higher sediment yields and fluxes even at comparatively low catchment-averaged rainfall intensities. Modelling studies have shown that localised, high-intensity precipitation can induce significant local surface runoff generation (Bronstert and Bárdossy, 2003) and locally high erosion rates (Battista et al., 2020) and that the area with active erosion and deposition is sensitive to intensification of peak rainfall intensity (Peleg et al., 2020). Higher intensity storms are also associated with higher functional sediment connectivity (Scorpio et al., 2022), allowing sediment mobilised on hillslopes to efficiently reach channels. Thus, we attribute the higher sediment fluxes observed at the catchment outlet during sub-daily events to intense, localised erosion and efficient sediment transfer from hillslopes to the channel network. Although this erosion is concentrated over a smaller fraction of the catchment, it generates higher sediment fluxes than long-duration events at comparable catchment-averaged rainfall intensities. This capability to induce high erosion rates may also explain why sub-daily events produce high event yields even at lower rainfall totals (Fig. 6c).
In Tumpen–Ötztal, areas above 2500 have been identified as key sediment source regions, comprising bare rock, sparsely vegetated slopes, and recently deglaciated terrain (Schmidt et al., 2022). During heavy precipitation events, sediment is therefore likely mobilised primarily from these high-elevation source areas and from steep hillslopes, through a combination of splash erosion amd overland-flow-driven erosion (Maier et al., 2023). During rainfall events the activation of gullies and streams that normally do not carry flowing water is likely to flush out accumulated sediments. Although infiltration-excess overland flow is unlikely to be spatially extensive across coarse, well-drained proglacial deposits, localised near-surface runoff and overland flow may still develop in soils with higher silt and clay content during sub-daily events (Bronstert et al., 2023). Such limited source areas can disproportionately contribute to the sediment export, particularly if small channels and ephemeral streams are activated thus rapidly increasing their sediment transport capacity.
Rainfall-driven geomorphic processes such as erosion and sediment transport exhibit threshold behaviours (Peleg et al., 2020). The localised high intensities of sub-daily heavy precipitation events can more readily exceed these thresholds, activating erosion processes and generating significant sediment fluxes. Another relevant process which is also highly threshold-dependent is mass wasting. Certain sub-daily events in our catalogue stand out for their unusually high SSC peaks despite relatively low rainfall intensities (Fig. 6i–j) and most of these were also classified as localised heavy precipitation events (Fig. S9i–j, Supplement). One such event is 2022-d (Fig. 4a), which triggered more than 150 debris flows in the Horlach valley, a sub-catchment of Tumpen-Ötztal (Himmelstoss et al., 2024; Rom et al., 2023). We hypothesise that these events represent highly localised precipitation triggering intense erosion, sediment mobilisation, and possibly mass wasting, which deposit large sediment pulses into the main channel and result in exceptional SSC peaks at the outlet.
5.2.3 Sediment response to long-duration heavy precipitation events
Long-duration heavy precipitation events are characterised by lower rainfall intensities that are distributed over longer periods and larger areas than sub-daily heavy precipitation events (Figs. 4e, S14, Supplement). At lower rainfall intensities, erosion is likely to be less widespread, resulting in lower sediment yields. Accordingly, many long-duration events may lack the local rainfall intensities required to trigger extensive hillslope erosion or to establish strong functional connectivity between sediment sources and the channel network. However, their large rainfall amounts (Fig. 4g) can generate high streamflow through runoff concentration, promoting in-channel erosion (Scorpio et al., 2022). As these events progress, increasing discharge concentrates flow within the channel network, raising water levels and enhancing bank erosion and the mobilisation of previously deposited sediments. In addition, the broader spatial extent of long-duration precipitation increases the fraction of the catchment contributing sediment, which may explain why these events produce some of the highest SSY (Fig. 6a–b) and why SSY increases more strongly with rainfall intensity for long-duration events than for sub-daily extremes.
Events characterised by low initial rainfall intensity with a later intensification are likely to play a role in the sharper increase in the sediment response variables with increasing rainfall intensities for long-duration events. Despite lower, more spatially distributed rainfall intensities, long-duration heavy precipitation events may include such short bursts of high intra-event rainfall rates. Dunkerley (2021) demonstrated this in Australian data, showing that longer events can produce elevated 30 min intensity peaks values despite their lower overall intensities, and that such “late-peak” events are associated with higher runoff ratios and peak overland flow rates. Our study area is a different type of landscape from the one studies by Dunkerley (2021), and it therefore uncertain whether such effects are relevant in an Alpine setting. However, in our results, the subset of long-duration heavy precipitation events that also contained sub-daily heavy precipitation peaks exhibit markedly higher suspended sediment yields, fluxes, and peak concentrations as well as rainfall intensities and amounts compared to those that were only extreme at durations ≥ 24 h (Fig. 9). These long-mixed heavy precipitation events also had markedly higher rainfall totals and SSY compared to sub-daily ones (Fig. 9). This suggest that high-intensity rain bursts nested within long-duration heavy precipitation events is a key driver of exported sediment mass. This highlights the benefit of our multi-scale detection approach, as the identification of multiple extreme durations allows us to classify such events with complex intra-event rainfall dynamics.
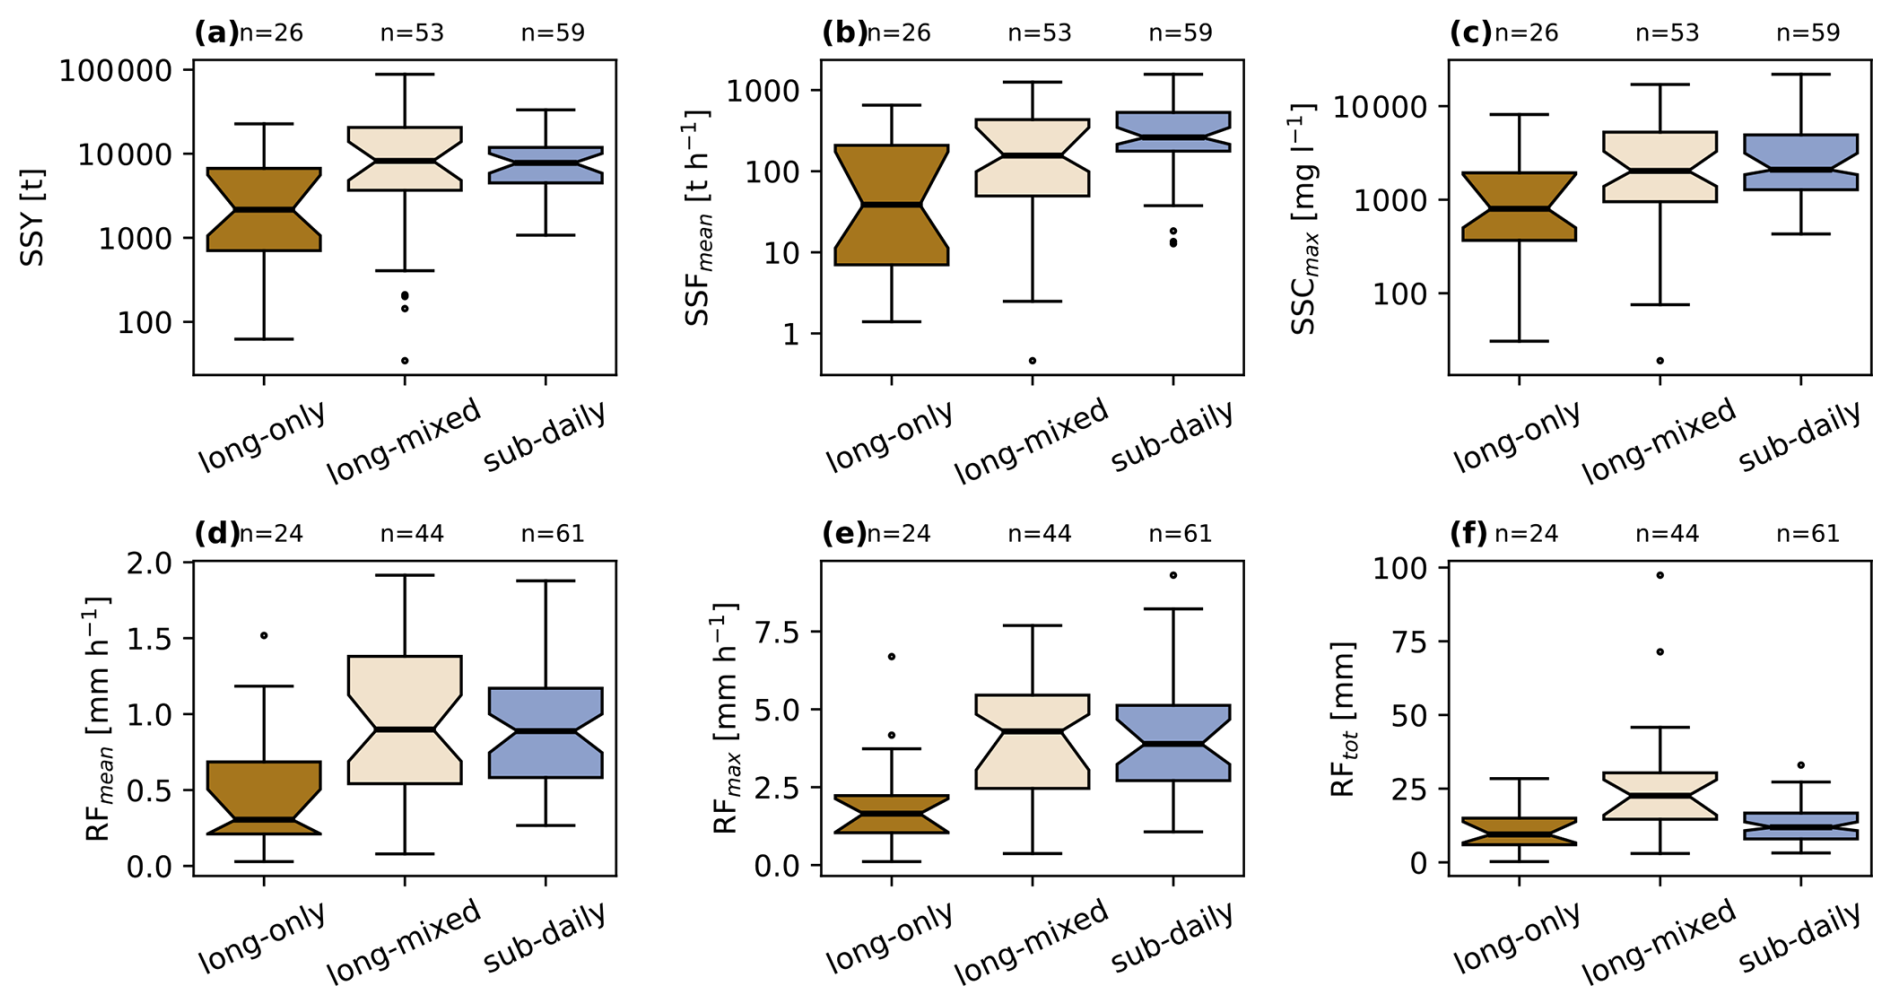
Figure 9Sediment response variables (a–c) and rainfall characteristics (d–f) of heavy precipitation events. Long-duration heavy precipitation events are divided into two sub-classes: “long-only” events where all extreme durations are ≥ 24 h, and “long-mixed” events which also have some extreme durations at the sub-daily scale. See Fig. 4 for details on boxplot configuration.
5.2.4 Other factors influencing sediment response
Antecedent precipitation, snow water equivalent in the catchment, and snowmelt during events are all negatively correlated with the sediment response variable (Table 3). Snowmelt occurs almost exclusively during long-duration precipitation events (Fig. S14l, Supplement), and the indications we have suggest that snow processes do not play a dominant role in controlling suspended sediment response. However, snow is present in the catchment during many heavy precipitation events (Fig. S14k, Supplement). Rainfall occurring during periods of active snowmelt may still influence sediment mobilisation, as soils are likely to be wetter and more erodible under these conditions. Conversely, the snow cover may also restrict the sediment contributing area of the catchment (Skålevåg et al., 2025a) and thus reduce the effective area with erosive rainfall during heavy precipitation events. Finally, high volumes of snowmelt water may provide a dilution effect, effectively lowering SSC in the river. Thus, while snow and snowmelt do not appear to directly enhance sediment yields at the event scale, they may indirectly modulate sediment availability and erodibility during combined rain–snow conditions and reduce SSC through dilution.
5.3 Trends in heavy-precipitation-driven suspended sediment yields
Over the study period, we observe an increase in the fraction of annual SSY exported during heavy precipitation events. Furthermore, the number of heavy precipitation events significantly increased. As discussed above, uncertainties in the INCA dataset do not appear to significantly affect the detected number of heavy precipitation events. Lower event numbers in the early study period likely reflect drier-than-average years, such as 2004 and 2006 (Gattermayr et al., 2004, 2006), dominated by isolated convective storms. The significantly increasing trend in the number of heavy precipitation events is therefore more likely due to an overall increase in precipitation intensity leading more events to exceed the heavy precipitation thresholds. While we find no indications of precipitation or rainfall intensity of heavy precipitation events significantly increasing over the study period, this may be due to the high variability of precipitation and the relatively short period we are considering. May–October precipitation in Ötztal calculated from the SPARTACUS dataset (GeoSphere Austria, 2024c), consisting of spatially interpolated station data (see Hiebl and Frei, 2018), has significantly increased with 2.6 mm yr−1 since 1961 (MK test with 5 % significance level). Thus we can at least say that the total precipitation amount during the extended summer season increased during our study period and is part of a longer term trend. As heavy precipitation-driven transport events have significantly higher suspended sediment fluxes (Fig. 7e), a pattern common in mountainous areas (e.g. Li et al., 2021b; Rainato et al., 2021; Wulf et al., 2012; Scorpio et al., 2022; van Hamel et al., 2025), the increasing number of heavy precipitation events means that the fraction of annual SSY also increases.
In years with a high frequency of heavy precipitation events, this effect is especially noticeable. Examples are 2010 and 2020, years in which around 40 % of annual SSY were associated with heavy precipitation (Fig. 7a). In 2020, heavy precipitation events contributed significantly to annual sediment export. For instance, during event 2020-k, persistent rainfall triggered a debris flow in the proglacial area of the Hintereisferner glacier (in Vent-Rofental). A thunderstorm in August (2020-j) and a cold front in October (2020-n) caused additional flooding and mass wasting. Together these three events contributed 124 t km−2 or 25 % of the annual SSY of 2020. The remaining 13 events contributed 15 %. The year 2020 illustrates the cumulative effect of both moderate and severe storms on sediment yields (Wischmeier and Smith, 1978). Notably, the years 2013 and 2019 had the same number of heavy precipitation events but did not contribute comparable amounts or fractions of annual SSY. This highlights that factors such as annual sediment production and availability play an important role in determining the fraction of heavy-precipitation-driven sediment exports, in addition to the annual frequency and intensity of heavy precipitation events.
Annual SSYs have remained stable over the study period in Tumpen-Ötztal but show a gradual decline in Vent-Rofental (Fig. 7), excluding extreme melt years such as 2022 (Bayerische Akademie der Wissenschaften, 2025; Voordendag et al., 2023). In Vent-Rofental, peak sediment may already have been passed (Schmidt, 2023), with annual SSY now steadily decreasing as glacier retreat reduces subglacial sediment supply, a trend projected to persist over the long term (Schmidt et al., 2024). In Tumpen-Ötztal, sediment exported during non-heavy or precipitation-free events showed a non-significant decline (Fig. 7b), suggesting that increases in heavy-precipitation-driven sediment transport at larger scales may partially offset reductions in glacier-driven transport. These contrasting trends highlight the influence of different spatial scales of paraglacial adjustments, as the timing of peak sediment and the duration of sediment reworking vary with catchment size and glacier cover (Ballantyne, 2002).
Despite the increasing prominence of heavy precipitation, only 10 % of extreme suspended sediment spikes in Ötztal can be directly attributed to these events, with nearly half occurring without precipitation (Fig. 8). This is consistent with findings showing that high SSC peaks in Alpine catchments can be generated by rainfall, glacier melt, snowmelt, or combinations thereof (Skålevåg et al., 2024; van Hamel et al., 2025). Melt processes, due to their frequency, remain the dominant driver of annual SSY (Schmidt et al., 2022; Skålevåg et al., 2024), with the most extreme sediment discharge often arising from a combination of melt- and precipitation-driven processes (Skålevåg et al., 2024; van Hamel et al., 2025). Extensive work in glaciated catchments has shown that increased water input to subglacial drainage systems, whether from melt or rainfall, may enhance suspended sediment export (Swift et al., 2005) without necessarily increasing surface erosion. However, during heavy precipitation events increased cloud cover and reduced air temperatures may suppress melt rates and sub-glacial discharge. Consequently, rainfall- and melt-driven sediment production should not be viewed as entirely independent, and heavy-precipitation-driven sediment transport in this study likely includes a substantial glacial component, particularly during summer when subglacial sediment discharge is high.
While glacial influences on sediment transport are declining, projected increases in heavy precipitation, particularly at sub-daily scales, remains a critical factor. Conceptual models suggest that rainfall-driven sediment transport will dominate post-deglaciation sediment yield levels (Zhang et al., 2022b). Convective summer precipitation is expected to intensify in the Alps (Giorgi et al., 2016), with an ensemble of 1 km convection-permitting climate models projecting a 20 %–38 % increase in sub-daily (1–24 h) extremes in the Eastern Alps, including Tumpen-Ötztal (Dallan et al., 2024). Our results demonstrate that sub-daily heavy precipitation events are particularly effective at generating high suspended sediment loads. This is amplified by the abundant unconsolidated sediments in high-elevation landscapes, a legacy of deglaciation, which will remain available for transport until these areas stabilise (Musso et al., 2020; Ballantyne, 2002). While vegetation and soil development will eventually promote stabilisation (Klaar et al., 2015), these processes are temporally variable (Bayle et al., 2023) and can be disrupted by geomorphic disturbances such as rainfall erosion and fluvial reworking of proglacial deposits (Moreau et al., 2008). These dynamics suggest that future sediment regimes in high-elevation catchments like the Ötztal will become flashier, characterised by more frequent and intense rainfall-driven events, but with overall lower annual yields.
This study provides new insights into the interplay between heavy precipitation, sediment transport, and paraglacial adjustments in high-Alpine environments.
Sub-daily heavy precipitation events, driven primarily by convective summer storms, are particularly effective at mobilising sediment due to their localised and intense rainfall, which exceeds erosion and runoff thresholds. Long-duration heavy precipitation events, while less intense, affect larger catchment areas and sustain sediment transport over a longer time, especially when they include shorter high-intensity rainfall bursts.
We observed a significant increase in the frequency of heavy precipitation events and their contribution to annual suspended sediment yields (SSY) over the study period. While we find evidence of an increasing trend in heavy precipitation events, uncertainties in the INCA dataset, such as its tendency to overestimate heavy precipitation, particularly at higher elevations, may partially influence this trend. However, given the reduction in INCA errors post-2017 and the strong alignment between detected heavy precipitation events and station data, these uncertainties likely have a limited effect on our overall findings.
Despite the increases in heavy-precipitation-driven sediment transport, annual SSY has remained stable in Tumpen-Ötztal but declined in Vent-Rofental, where reduced sediment availability due to glacier retreat appears to drive long-term declines. This suggests that increases in heavy-precipitation-driven sediment transport at larger scales may partially offset reductions in glacial-driven transport in less glaciated catchments. However, sediment transport during heavy precipitation events is highly dependent on sediment availability, highlighting the role of glacial and paraglacial dynamics in controlling sediment fluxes.
Projections indicate that extreme and heavy precipitation, particularly at sub-daily scales, will intensify in the future due to climate warming. This, combined with the abundant unconsolidated sediment in deglaciating landscapes, suggests that Alpine catchments like the Ötztal will experience flashier sediment regimes characterised by more frequent and intense rainfall-driven events. However, long-term stabilization of these landscapes will depend on changes in vegetation cover and soil development, processes that are temporally variable and vulnerable to disturbance.
Overall, while the intensification of heavy precipitation events is expected to increase the frequency of sediment transport events, long-term reductions in glacial sediment supply will likely result in declining annual sediment yields. These findings emphasise the need for continued monitoring and refined modelling of sediment transport dynamics under changing climatic and geomorphic conditions in Alpine environments.
The HISTALP dataset with monthly precipitation amounts (https://data.hub.geosphere.at/dataset/histalp, (GeoSphere Austria, 2020)), INCA hourly precipitation and temperature grids (https://doi.org/10.60669/6akt-5p05, GeoSphere Austria, 2024a), and hourly precipitation data from GeoSphere Austria's weather stations (https://doi.org/10.60669/9bdm-yq93, GeoSphere Austria, 2024b) are available for download at the GeoSphere Austria Data Hub, https://data.hub.geosphere.at (last access: 18 January 2025). Daily precipitation data from the 15 rain gauges operated by the Hydrographic Service of Tyrol (HD-Tirol) were downloaded from https://ehyd.gv.at/ (BML, 2024). Precipitation data from Hintere-Fundusalm with 15 min resolution was provided by HD-Tirol upon request. Raw precipitation data from the Vent, Hochebenkar, and Station Hintereis weather stations were downloaded from https://acinn-data.uibk.ac.at/ (ACINN, 2024). Precipitation data in 10 min resolution from weather stations Latschbloder, Bella Vista, and Proviantdepot operated by Department of Geography – University of Innsbruck (2024, https://doi.org/10.5880/fidgeo.2023.037). Processed data, results, and code can be found here: https://doi.org/10.5281/zenodo.16571983 (Skålevåg et al., 2025b).
The supplement related to this article is available online at https://doi.org/10.5194/hess-30-2717-2026-supplement.
AS and LKS developed the general idea and conceptualised the study, with input from AB and OK. AS and NE processed the station data and performed the uncertainty analysis. AS and JTB calculated the extreme value statistics and the IDF curves. AS detected and analysed the extreme precipitation events and the sediment response. AS prepared the original manuscript draft with input from NE and JTB. AS prepared all the figures. All authors critically reviewed, commented and revised the manuscript.
The contact author has declared that none of the authors has any competing interests.
Publisher's note: Copernicus Publications remains neutral with regard to jurisdictional claims made in the text, published maps, institutional affiliations, or any other geographical representation in this paper. The authors bear the ultimate responsibility for providing appropriate place names. Views expressed in the text are those of the authors and do not necessarily reflect the views of the publisher.
The authors would like to acknowledge Maik Heistermann for his advice on how to analyse precipitation uncertainty and for the idea to use two time series for the detection, i.e. both catchment-averaged and grid-scale maximum precipitation. The research presented in this article was conducted within the research training group “Natural Hazards and Risks in a Changing World” (NatRiskChange) funded by the Deutsche Forschungsgemeinschaft (DFG; GRK 2043/2). During the writing and revision of the manuscript, ChatGPT assisted in editing existing portions of text written by the authors. At no point was ChatGPT or any AI-tools used to generate new portions of text.
This research has been supported by the Deutsche Forschungsgemeinschaft (grant no. GRK 2043/2).
This paper was edited by Nadav Peleg and reviewed by four anonymous referees.
ACINN: ACINN Weather Station Portal, ACINN [data set], https://acinn-data.uibk.ac.at/ (last access: 25 October 2024), 2024. a
Adler, C., Wester, P., Bhatt, I., Huggel, C., Insarov, G., Morecroft, M., Muccione, V., and Prakash, A.: Cross-Chapter Paper 5: Mountains, in: Climate Change 2022: Impacts, Adaptation and Vulnerability, edited by: Pörtner, H.-O., Roberts, D., Tignor, M., Poloczanska, E., Mintenbeck, K., Alegría, A., Craig, M., Langsdorf, S., Löschke, S., Möller, V., Okem, A., and Rama, B., Cambridge University Press, Cambridge, UK and New York, NY, USA, 2273–2318, https://doi.org/10.1017/9781009325844.022, 2022. a
Ballantyne, C. K.: A general model of paraglacial landscape response, Holocene, 12, 371–376, https://doi.org/10.1191/0959683602hl553fa, 2002. a, b
Battista, G., Molnar, P., and Burlando, P.: Modelling impacts of spatially variable erosion drivers on suspended sediment dynamics, Earth Surf. Dynam., 8, 619–635, https://doi.org/10.5194/esurf-8-619-2020, 2020. a
Bayerische Akademie der Wissenschaften: Mass balance of the Vernagtferner, https://geo.badw.de/en/vernagtferner-digital/mass-balance.html (last access: 19 January 2025), 2025. a
Bayle, A., Carlson, B. Z., Zimmer, A., Vallée, S., Rabatel, A., Cremonese, E., Filippa, G., Dentant, C., Randin, C., Mainetti, A., Roussel, E., Gascoin, S., Corenblit, D., and Choler, P.: Local environmental context drives heterogeneity of early succession dynamics in alpine glacier forefields, Biogeosciences, 20, 1649–1669, https://doi.org/10.5194/bg-20-1649-2023, 2023. a
Berger, C., Schulze, M., Rieke‐Zapp, D., and Schlunegger, F.: Rill development and soil erosion: a laboratory study of slope and rainfall intensity, Earth Surf. Proc. Land., 35, 1456–1467, https://doi.org/10.1002/esp.1989, 2010. a
Beylich, A. A., Laute, K., and Storms, J. E.: Contemporary suspended sediment dynamics within two partly glacierized mountain drainage basins in western Norway (Erdalen and Bødalen, inner Nordfjord), Geomorphology, 287, 126–143, https://doi.org/10.1016/J.GEOMORPH.2015.12.013, 2017. a
BML: eHYD, BML [data set], https://ehyd.gv.at/ (last access: 6 November 2024), 2024. a
Bocharov, G.: pyextremes 2.3.3, https://georgebv.github.io/pyextremes (last access: 25 January 2026), 2024. a
Brönnimann, S., Rajczak, J., Fischer, E. M., Raible, C. C., Rohrer, M., and Schär, C.: Changing seasonality of moderate and extreme precipitation events in the Alps, Nat. Hazards Earth Syst. Sci., 18, 2047–2056, https://doi.org/10.5194/nhess-18-2047-2018, 2018. a
Bronstert, A. and Bárdossy, A.: Uncertainty of runoff modelling at the hillslope scale due to temporal variations of rainfall intensity, Phys. Chem. Earth, 28, 283–288, https://doi.org/10.1016/S1474-7065(03)00039-1, 2003. a
Bronstert, A., Niehoff, D., and Schiffler, G. R.: Modelling infiltration and infiltration excess: The importance of fast and local processes, Hydrol. Process., 37, https://doi.org/10.1002/hyp.14875, 2023. a
Buter, A., Heckmann, T., Filisetti, L., Savi, S., Mao, L., Gems, B., and Comiti, F.: Effects of catchment characteristics and hydro-meteorological scenarios on sediment connectivity in glacierised catchments, Geomorphology, 402, 108128, https://doi.org/10.1016/J.GEOMORPH.2022.108128, 2022. a
Copernicus Land Monitoring Service: CORINE Land Cover 2018 (raster 100 m), Copernicus Land Monitoring Service [data set], https://doi.org/10.2909/960998c1-1870-4e82-8051-6485205ebbac, 2020. a
Costa, A., Molnar, P., Stutenbecker, L., Bakker, M., Silva, T. A., Schlunegger, F., Lane, S. N., Loizeau, J.-L., and Girardclos, S.: Temperature signal in suspended sediment export from an Alpine catchment, Hydrol. Earth Syst. Sci., 22, 509–528, https://doi.org/10.5194/hess-22-509-2018, 2018. a
Dallan, E., Marra, F., Fosser, G., Marani, M., and Borga, M.: Dynamical Factors Heavily Modulate the Future Increase of Sub‐Daily Extreme Precipitation in the Alpine‐Mediterranean Region, Earth's Future, 12, e2024EF005185, https://doi.org/10.1029/2024EF005185, 2024. a, b, c
Delaney, I. and Adhikari, S.: Increased Subglacial Sediment Discharge in a Warming Climate: Consideration of Ice Dynamics, Glacial Erosion, and Fluvial Sediment Transport, Geophys. Res. Lett., 47, e2019GL085672, https://doi.org/10.1029/2019GL085672, 2020. a, b
Deng, Y., Wang, X., Ruan, H., Lin, J., Chen, X., Chen, Y., Duan, W., and Deng, H.: The magnitude and frequency of detected precipitation determine the accuracy performance of precipitation data sets in the high mountains of Asia, Sci. Rep., 14, 17251, https://doi.org/10.1038/s41598-024-67665-8, 2024. a
Department of Geography – University of Innsbruck: Continuous meteorological and snow hydrological measurements for 2013–2023 from three automatic weather stations (AWS) in the upper Rofental, Ötztal Alps, Austria, GFZ Data Services [data set], https://doi.org/10.5880/fidgeo.2023.037, 2024. a
Dunkerley, D.: Rainfall intensity in geomorphology: Challenges and opportunities, Prog. Phys. Geogr., 45, 488–513, https://doi.org/10.1177/0309133320967893, 2021. a, b
Fauer, F. S., Ulrich, J., and Ritschel, C.: IDF: Estimation and Plotting of IDF Curves, https://doi.org/10.32614/CRAN.package.IDF, 2017. a
Fauer, F. S., Ulrich, J., Jurado, O. E., and Rust, H. W.: Flexible and consistent quantile estimation for intensity–duration–frequency curves, Hydrol. Earth Syst. Sci., 25, 6479–6494, https://doi.org/10.5194/hess-25-6479-2021, 2021. a, b
Fischer, A., Seiser, B., Stocker-Waldhuber, M., and Abermann, J.: The Austrian Glacier Inventory GI 3, 2006, in ArcGIS (shapefile) format, PANGAEA [data set], https://doi.org/10.1594/PANGAEA.844985, 2015. a
Fowler, H. J., Lenderink, G., Prein, A. F., Westra, S., Allan, R. P., Ban, N., Barbero, R., Berg, P., Blenkinsop, S., Do, H. X., Guerreiro, S., Haerter, J. O., Kendon, E. J., Lewis, E., Schaer, C., Sharma, A., Villarini, G., Wasko, C., and Zhang, X.: Anthropogenic intensification of short-duration rainfall extremes, Nat. Rev. Earth Environ., 2, 107–122, https://doi.org/10.1038/s43017-020-00128-6, 2021. a
Gattermayr, W., Niedertscheider, K., Mair, G., and Felderer, W.: Hydrologische Übersicht Jahr 2004, Tech. rep., Hydrographischer Dienst Tirol, Innsburck, https://www.tirol.gv.at/fileadmin/themen/umwelt/wasserkreislauf/downloads/hueb2004_01.pdf (last access: 25 April 2026), 2004. a
Gattermayr, W., Niedertscheider, K., Mair, G., and Felderer, W.: Hydrologische Übersicht Jahr 2006, Tech. rep., Hydrographischer Dienst Tirol, Innsbruck, https://www.tirol.gv.at/fileadmin/themen/umwelt/wasserkreislauf/downloads/hueb2006_01.pdf (last access: 25 April 2026), 2006. a
GeoSphere Austria: HISTALP – Homogenisierte Stationsdaten und abgeleitete Datensätze [data set], https://data.hub.geosphere.at/dataset/histalp-v1-1y (last access: 25 April 2026), 2020. a, b
GeoSphere Austria: INCA Stundendaten, GeoSphere Austria [data set], https://doi.org/10.60669/6akt-5p05, 2024a. a, b, c, d, e
GeoSphere Austria: Messstationen Stundendaten v2, GeoSphere Austria [data set], https://doi.org/10.60669/9bdm-yq93, 2024b. a
GeoSphere Austria: SPARTACUS v2.1 Tagesdaten, GeoSphere Austria [data set], https://doi.org/10.60669/t3d8-cn40, 2024c. a
Germann, U., Galli, G., Boscacci, M., and Bolliger, M.: Radar precipitation measurement in a mountainous region, Q. J. Roy. Meteor. Soc., 132, 1669–1692, https://doi.org/10.1256/qj.05.190, 2006. a, b
Ghaemi, E., Foelsche, U., Kann, A., and Fuchsberger, J.: Evaluation of Integrated Nowcasting through Comprehensive Analysis (INCA) precipitation analysis using a dense rain-gauge network in southeastern Austria, Hydrol. Earth Syst. Sci., 25, 4335–4356, https://doi.org/10.5194/hess-25-4335-2021, 2021. a
Giorgi, F., Torma, C., Coppola, E., Ban, N., Schär, C., and Somot, S.: Enhanced summer convective rainfall at Alpine high elevations in response to climate warming, Nat. Geosci., 9, 584–589, https://doi.org/10.1038/ngeo2761, 2016. a, b, c, d
Gold, S., White, E., Roeder, W., McAleenan, M., Kabban, C. S., and Ahner, D.: Probabilistic Contingency Tables: An Improvement to Verify Probability Forecasts, Weather Forecast., 35, 609–621, https://doi.org/10.1175/WAF-D-19-0116.1, 2019. a, b
Groß, G. and Patzelt, G.: The Austrian Glacier Inventory for the Little Ice Age Maximum (GI LIA) in ArcGIS (shapefile) format, PANGAEA [data set], https://doi.org/10.1594/PANGAEA.844987, 2015. a, b
Haiden, T., Kann, A., Wittmann, C., Pistotnik, G., Bica, B., and Gruber, C.: The Integrated Nowcasting through Comprehensive Analysis (INCA) System and Its Validation over the Eastern Alpine Region, Weather Forecast., 26, 166–183, https://doi.org/10.1175/2010WAF2222451.1, 2011. a, b, c, d, e
Hanzer, F., Förster, K., Nemec, J., and Strasser, U.: Projected cryospheric and hydrological impacts of 21st century climate change in the Ötztal Alps (Austria) simulated using a physically based approach, Hydrol. Earth Syst. Sci., 22, 1593–1614, https://doi.org/10.5194/hess-22-1593-2018, 2018. a
Hanzer, F., Warscher, M., and Strasser, U.: openAMUNDSEN v1.0.0, Zenodo [code], https://doi.org/10.5281/zenodo.11859175, 2024. a
Harpold, A. A., Kaplan, M. L., Klos, P. Z., Link, T., McNamara, J. P., Rajagopal, S., Schumer, R., and Steele, C. M.: Rain or snow: hydrologic processes, observations, prediction, and research needs, Hydrol. Earth Syst. Sci., 21, 1–22, https://doi.org/10.5194/hess-21-1-2017, 2017. a
Hartl, L., Schmitt, P., Schuster, L., Helfricht, K., Abermann, J., and Maussion, F.: Recent observations and glacier modeling point towards near-complete glacier loss in western Austria (Ötztal and Stubai mountain range) if 1.5 °C is not met, The Cryosphere, 19, 1431–1452, https://doi.org/10.5194/tc-19-1431-2025, 2025. a, b
Heggen, R. J.: Normalized Antecedent Precipitation Index, J. Hydrol. Eng., 6, 377–381, https://doi.org/10.1061/(ASCE)1084-0699(2001)6:5(377), 2001. a
Helfricht, K., Hartl, L., Stocker-Waldhuber, M., Seiser, B., and Fischer, A.: Glacier inventory Ötztal Alps 2017, PANGAEA [data set], https://doi.org/10.1594/PANGAEA.965798, 2024. a, b
Helfricht, K., Hartl, L., Stocker-Waldhuber, M., Seiser, B., and Fischer, A.: Glacier inventory Stubai Alps 2017/2018, PANGEA [data set], https://doi.org/10.1594/PANGAEA.965791, 2025. a, b
Hiebl, J. and Frei, C.: Daily precipitation grids for Austria since 1961—development and evaluation of a spatial dataset for hydroclimatic monitoring and modelling, Theor. Appl. Climatol., 132, 327–345, https://doi.org/10.1007/s00704-017-2093-x, 2018. a
Himmelstoss, T., Haas, F., Becht, M., and Heckmann, T.: Catchment-scale network analysis of functional sediment connectivity during an extreme rainfall event in the Grastal catchment, Austrian Central Alps, Geomorphology, 465, 109419, https://doi.org/10.1016/j.geomorph.2024.109419, 2024. a, b, c, d
Hirschberg, J., Mcardell, B. W., Badoux, A., and Molnar, P.: Analysis of rainfall and runoff for debris flows at the Illgraben catchment, Switzerland, in: Debris-flow hazards mitigation: mechanics, monitoring, modeling, and assessment, edited by: Kean, J. W., Coe, J. A., Santi, P. M., and Guillen, B. K., Association of Environmental and Engineering Geologists, 693–700, https://www.dora.lib4ri.ch/wsl/islandora/object/wsl:21300 (last access: 5 January 2023), 2019. a
Hodges, J. L.: The significance probability of the Smirnov two-sample test, Arkiv för Matematik, 3, 469–486, https://doi.org/10.1007/BF02589501, 1958. a
Huss, M., Bookhagen, B., Huggel, C., Jacobsen, D., Bradley, R. S., Clague, J. J., Vuille, M., Buytaert, W., Cayan, D. R., Greenwood, G., Mark, B. G., Milner, A. M., Weingartner, R., and Winder, M.: Toward mountains without permanent snow and ice, Earth's Future, 5, 418–435, https://doi.org/10.1002/2016EF000514, 2017. a
Kann, A., Wittmann, C., Wang, Y., and Ma, X.: Calibrating 2-m Temperature of Limited-Area Ensemble Forecasts Using High-Resolution Analysis, Mon. Weather Rev., 137, 3373–3387, https://doi.org/10.1175/2009MWR2793.1, 2009. a
Kendall, M. G.: Rank correlation methods, Griffin, 4th Edn., ISBN 978-0852641996, 1970. a
Klaar, M. J., Kidd, C., Malone, E., Bartlett, R., Pinay, G., Chapin, F. S., and Milner, A.: Vegetation succession in deglaciated landscapes: implications for sediment and landscape stability, Earth Surf. Proc. Land., 40, 1088–1100, https://doi.org/10.1002/esp.3691, 2015. a
Kormann, C., Bronstert, A., Francke, T., Recknagel, T., and Graeff, T.: Model-Based Attribution of High-Resolution Streamflow Trends in Two Alpine Basins of Western Austria, Hydrology, 3, 7, https://doi.org/10.3390/hydrology3010007, 2016. a, b
Koutsoyiannis, D., Kozonis, D., and Manetas, A.: A mathematical framework for studying rainfall intensity-duration-frequency relationships, J. Hydrol., 206, 118–135, https://doi.org/10.1016/S0022-1694(98)00097-3, 1998. a
Kuhn, M., Lambrecht, A., and Abermann, J.: The Austrian glacier inventory GI 2, 1998, in ArcGIS (shapefile) format, PANGAEA [data set], https://doi.org/10.1594/PANGAEA.844984, 2015. a, b
Lalk, P., Haimann, M., and Habersack, H.: Monitoring, Analyse und Interpretation des Schwebstofftransportes an österreichischen Flüssen, Osterreichische Wasser- und Abfallwirtschaft, 66, 306–315, https://doi.org/10.1007/s00506-014-0175-x, 2014. a
Leonarduzzi, E., Molnar, P., and McArdell, B. W.: Predictive performance of rainfall thresholds for shallow landslides in Switzerland from gridded daily data, Water Resour. Res., 53, 6612–6625, https://doi.org/10.1002/2017WR021044, 2017. a, b
Li, D., Lu, X., Overeem, I., Walling, D. E., Syvitski, J., Kettner, A. J., Bookhagen, B., Zhou, Y., and Zhang, T.: Exceptional increases in fluvial sediment fluxes in a warmer and wetter High Mountain Asia, Science, 374, 599–603, https://doi.org/10.1126/science.abi9649, 2021a. a
Li, D., Overeem, I., Kettner, A. J., Zhou, Y., and Lu, X.: Air Temperature Regulates Erodible Landscape, Water, and Sediment Fluxes in the Permafrost-Dominated Catchment on the Tibetan Plateau, Water Resour. Res., 57, 1–14, https://doi.org/10.1029/2020WR028193, 2021b. a, b
Li, D., Lu, X., Walling, D. E., Zhang, T., Steiner, J. F., Wasson, R. J., Harrison, S., Nepal, S., Nie, Y., Immerzeel, W. W., Shugar, D. H., Koppes, M., Lane, S., Zeng, Z., Sun, X., Yegorov, A., and Bolch, T.: High Mountain Asia hydropower systems threatened by climate-driven landscape instability, Nat. Geosci., 2022, 1–11, https://doi.org/10.1038/s41561-022-00953-y, 2022. a
Li, D., Zhang, T., Walling, D. E., Lane, S., Bookhagen, B., Tian, S., Overeem, I., Syvitski, J., Kettner, A. J., Park, E., Koppes, M., Schmitt, R. J. P., Sun, W., Ni, J., and Ehlers, T. A.: The competing controls of glaciers, precipitation, and vegetation on high-mountain fluvial sediment yields, Sci. Adv., 10, 6196, https://doi.org/10.1126/sciadv.ads6196, 2024. a
Madsen, H., Lawrence, D., Lang, M., Martinkova, M., and Kjeldsen, T.: Review of trend analysis and climate change projections of extreme precipitation and floods in Europe, J. Hydrol., 519, 3634–3650, https://doi.org/10.1016/j.jhydrol.2014.11.003, 2014. a
Maier, F., Lustenberger, F., and van Meerveld, I.: Assessment of plot-scale sediment transport on young moraines in the Swiss Alps using a fluorescent sand tracer, Hydrol. Earth Syst. Sci., 27, 4609–4635, https://doi.org/10.5194/hess-27-4609-2023, 2023. a
Mann, H. B.: Nonparametric Tests Against Trend, Econometrica, 13, 245, https://doi.org/10.2307/1907187, 1945. a
Ménégoz, M., Valla, E., Jourdain, N. C., Blanchet, J., Beaumet, J., Wilhelm, B., Gallée, H., Fettweis, X., Morin, S., and Anquetin, S.: Contrasting seasonal changes in total and intense precipitation in the European Alps from 1903 to 2010, Hydrol. Earth Syst. Sci., 24, 5355–5377, https://doi.org/10.5194/hess-24-5355-2020, 2020. a
Molnar, P., Fatichi, S., Gaál, L., Szolgay, J., and Burlando, P.: Storm type effects on super Clausius–Clapeyron scaling of intense rainstorm properties with air temperature, Hydrol. Earth Syst. Sci., 19, 1753–1766, https://doi.org/10.5194/hess-19-1753-2015, 2015. a
Moreau, M., Mercier, D., Laffly, D., and Roussel, E.: Impacts of recent paraglacial dynamics on plant colonization: A case study on Midtre Lovénbreen foreland, Spitsbergen (79 °N), Geomorphology, 95, 48–60, https://doi.org/10.1016/j.geomorph.2006.07.031, 2008. a
Musso, A., Ketterer, M. E., Greinwald, K., Geitner, C., and Egli, M.: Rapid decrease of soil erosion rates with soil formation and vegetation development in periglacial areas, Earth Surf. Proc. Land., 45, 2824–2839, https://doi.org/10.1002/esp.4932, 2020. a
Olefs, M., Koch, R., Schöner, W., and Marke, T.: Changes in Snow Depth, Snow Cover Duration, and Potential Snowmaking Conditions in Austria, 1961–2020 – A Model Based Approach, Atmosphere, 11, 1330, https://doi.org/10.3390/ATMOS11121330, 2020. a
Ombadi, M., Risser, M. D., Rhoades, A. M., and Varadharajan, C.: A warming-induced reduction in snow fraction amplifies rainfall extremes, Nature, 619, 305–310, https://doi.org/10.1038/s41586-023-06092-7, 2023. a
Patzelt, G.: The Austrian glacier inventory GI 1, 1969, in ArcGIS (shapefile) format, PANGEA [data set], https://doi.org/10.1594/PANGAEA.844983, 2015. a
Peleg, N., Skinner, C., Fatichi, S., and Molnar, P.: Temperature effects on the spatial structure of heavy rainfall modify catchment hydro-morphological response, Earth Surf. Dynam., 8, 17–36, https://doi.org/10.5194/esurf-8-17-2020, 2020. a, b, c
Prein, A. F. and Gobiet, A.: Impacts of uncertainties in European gridded precipitation observations on regional climate analysis, Int. J. Climatol., 37, 305–327, https://doi.org/10.1002/joc.4706, 2017. a
Rainato, R., Martini, L., Pellegrini, G., and Picco, L.: Hydrological, geomorphic and sedimentological responses of an alpine basin to a severe weather event (Vaia storm), Catena, 207, https://doi.org/10.1016/j.catena.2021.105600, 2021. a, b, c
Rom, J., Haas, F., Hofmeister, F., Fleischer, F., Altmann, M., Pfeiffer, M., Heckmann, T., and Becht, M.: Analysing the Large-Scale Debris Flow Event in July 2022 in Horlachtal, Austria Using Remote Sensing and Measurement Data, Geosciences, 13, 100, https://doi.org/10.3390/GEOSCIENCES13040100, 2023. a, b
Scheurer, K., Alewell, C., Bänninger, D., and Burkhardt-Holm, P.: Climate and land-use changes affecting river sediment and brown trout in alpine countries-a review, Environ. Sci. Pollut. Res., 16, 232–242, https://doi.org/10.1007/s11356-008-0075-3, 2009. a
Schmidt, L. K.: Altered hydrological and sediment dynamics in high-alpine areas – Exploring the potential of machine-learning for estimating past and future changes, Ph.D. thesis, University of Potsdam, Potsdam, https://doi.org/10.25932/publishup-62330, 2023. a
Schmidt, L. K., Francke, T., Rottler, E., Blume, T., Schöber, J., and Bronstert, A.: Suspended sediment and discharge dynamics in a glaciated alpine environment: identifying crucial areas and time periods on several spatial and temporal scales in the Ötztal, Austria, Earth Surf. Dynam., 10, 653–669, https://doi.org/10.5194/esurf-10-653-2022, 2022. a, b, c, d, e, f, g, h
Schmidt, L. K., Francke, T., Grosse, P. M., Mayer, C., and Bronstert, A.: Reconstructing five decades of sediment export from two glacierized high-alpine catchments in Tyrol, Austria, using nonparametric regression, Hydrol. Earth Syst. Sci., 27, 1841–1863, https://doi.org/10.5194/hess-27-1841-2023, 2023. a, b
Schmidt, L. K., Francke, T., Grosse, P. M., and Bronstert, A.: Projecting sediment export from two highly glacierized alpine catchments under climate change: exploring non-parametric regression as an analysis tool, Hydrol. Earth Syst. Sci., 28, 139–161, https://doi.org/10.5194/hess-28-139-2024, 2024. a, b, c
Schroeer, K., Kirchengast, G., and Sungmin, O.: Strong Dependence of Extreme Convective Precipitation Intensities on Gauge Network Density, Geophys. Res. Lett., 45, 8253–8263, https://doi.org/10.1029/2018GL077994, 2018. a
Scorpio, V., Cavalli, M., Steger, S., Crema, S., Marra, F., Zaramella, M., Borga, M., Marchi, L., and Comiti, F.: Storm characteristics dictate sediment dynamics and geomorphic changes in mountain channels: A case study in the Italian Alps, Geomorphology, 403, 108173, https://doi.org/10.1016/J.GEOMORPH.2022.108173, 2022. a, b, c, d, e, f, g
Sen, P. K.: Estimates of the Regression Coefficient Based on Kendall's Tau, J. Am. Stat. Assoc., 63, 1379–1389, https://doi.org/10.1080/01621459.1968.10480934, 1968. a
Skålevåg, A., Korup, O., and Bronstert, A.: Inferring sediment-discharge event types in an Alpine catchment from sub-daily time series, Hydrol. Earth Syst. Sci., 28, 4771–4796, https://doi.org/10.5194/hess-28-4771-2024, 2024. a, b, c, d, e, f
Skålevåg, A., Bronstert, A., and Korup, O.: Freeze‐Thaw Effects on Daily Sediment Transport in an Alpine River, Water Resour. Res., 61, e2024WR039183, https://doi.org/10.1029/2024WR039183, 2025a. a
Skålevåg, A., Schmidt, L. K., Eggers, N., Brettin, J. T., Korup, O., and Bronstert, A.: Data and code for “Linking extreme rainfall to suspended sediment fluxes in a deglaciating Alpine catchment”, Zenodo [code and data set], https://doi.org/10.5281/zenodo.16571983, 2025b. a
Sleziak, P., Jančo, M., Danko, M., Méri, L., and Holko, L.: Accuracy of radar-estimated precipitation in a mountain catchment in Slovakia, J. Hydrol.d Hydromech., 71, 111–122, https://doi.org/10.2478/johh-2022-0037, 2023. a
Sloto, R. A. and Crouse, M. Y.: HYSEP: A Computer Program for Streamflow Hydrograph Separation and Analysis, Tech. rep., U.S. Geological Survey, https://doi.org/10.3133/wri964040, 1996. a
Strasser, U., Marke, T., Braun, L., Escher-Vetter, H., Juen, I., Kuhn, M., Maussion, F., Mayer, C., Nicholson, L., Niedertscheider, K., Sailer, R., Stötter, J., Weber, M., and Kaser, G.: The Rofental: a high Alpine research basin (1890–3770 m a.s.l.) in the Ötztal Alps (Austria) with over 150 years of hydrometeorological and glaciological observations, Earth Syst. Sci. Data, 10, 151–171, https://doi.org/10.5194/essd-10-151-2018, 2018. a, b, c, d
Strasser, U., Warscher, M., Rottler, E., and Hanzer, F.: openAMUNDSEN v1.0: an open-source snow-hydrological model for mountain regions, Geosci. Model Dev., 17, 6775–6797, https://doi.org/10.5194/gmd-17-6775-2024, 2024. a
Swift, D. A., Nienow, P. W., and Hoey, T. B.: Basal sediment evacuation by subglacial meltwater: suspended sediment transport from Haut Glacier d'Arolla, Switzerland, Earth Surf. Proc. Land., 30, 867–883, https://doi.org/10.1002/ESP.1197, 2005. a
Theil, H.: A rank-invariant method of linear and polynomial regression analysis, Proceedings of the Royal Netherlands Academy of Sciences, 53, 386–392, 1950. a
Tsyplenkov, A., Vanmaercke, M., Golosov, V., and Chalov, S.: Suspended sediment budget and intra-event sediment dynamics of a small glaciated mountainous catchment in the Northern Caucasus, J. Soil. Sediment., 20, 3266–3281, https://doi.org/10.1007/s11368-020-02633-z, 2020. a
Ulrich, J., Jurado, O. E., Peter, M., Scheibel, M., and Rust, H. W.: Estimating IDF Curves Consistently over Durations with Spatial Covariates, Water, 12, 3119, https://doi.org/10.3390/w12113119, 2020. a, b
van Hamel, A., Molnar, P., Janzing, J., and Brunner, M. I.: Suspended sediment concentrations in Alpine rivers: from annual regimes to sub-daily extreme events, Hydrol. Earth Syst. Sci., 29, 2975–2995, https://doi.org/10.5194/hess-29-2975-2025, 2025. a, b, c
Vergara, I., Garreaud, R., and Ayala, A.: Sharp Increase of Extreme Turbidity Events Due To Deglaciation in the Subtropical Andes, J. Geophys. Res.-Earth, 127, e2021JF006584, https://doi.org/10.1029/2021JF006584, 2022. a
Vergara, I., Garreaud, R., Delaney, I., and Ayala, A.: Deglaciation in the subtropical Andes has led to a peak in sediment delivery, Commun. Earth Environ., 5, 630, https://doi.org/10.1038/s43247-024-01815-8, 2024. a
Vergara-Temprado, J., Ban, N., and Schär, C.: Extreme Sub-Hourly Precipitation Intensities Scale Close to the Clausius-Clapeyron Rate Over Europe, Geophys. Res. Lett., 48, e2020GL089506, https://doi.org/10.1029/2020GL089506, 2021. a, b
Voordendag, A., Prinz, R., Schuster, L., and Kaser, G.: Brief communication: The Glacier Loss Day as an indicator of a record-breaking negative glacier mass balance in 2022, The Cryosphere, 17, 3661–3665, https://doi.org/10.5194/tc-17-3661-2023, 2023. a
Warscher, M., Marke, T., Rottler, E., and Strasser, U.: Operational and experimental snow observation systems in the upper Rofental: data from 2017 to 2023, Earth Syst. Sci. Data, 16, 3579–3599, https://doi.org/10.5194/essd-16-3579-2024, 2024. a, b
Wilks, D. S.: Statistical Methods in the Atmospheric Sciences, Elsevier, 4th Edn., ISBN 9780128158234, https://doi.org/10.1016/C2017-0-03921-6, 2019. a, b
Wischmeier, W. H. and Smith, D. D.: Predicting rainfall erosion losses – a guide to conservation planning, Tech. rep., U.S. Department of Agriculture, Agriculture Handbook No. 537, Washington, D.C., https://www.ars.usda.gov/ARSUserFiles/60600505/RUSLE/AH_537%20Predicting%20Rainfall%20Soil%20Losses.pdf (last access: 1 November 2024), 1978. a, b
Wulf, H., Bookhagen, B., and Scherler, D.: Climatic and geologic controls on suspended sediment flux in the Sutlej River Valley, western Himalaya, Hydrol. Earth Syst. Sci., 16, 2193–2217, https://doi.org/10.5194/hess-16-2193-2012, 2012. a, b
Zandler, H., Haag, I., and Samimi, C.: Evaluation needs and temporal performance differences of gridded precipitation products in peripheral mountain regions, Sci. Rep., 9, 15118, https://doi.org/10.1038/s41598-019-51666-z, 2019. a
Zhang, F., Hu, Y., Fan, X., Yu, W., Liu, X., and Jin, Z.: Controls on seasonal erosion behavior and potential increase in sediment evacuation in the warming Tibetan Plateau, CATENA, 209, 105797, https://doi.org/10.1016/j.catena.2021.105797, 2022a. a
Zhang, T., Li, D., East, A. E., Walling, D. E., Lane, S., Overeem, I., Beylich, A. A., Koppes, M., and Lu, X.: Warming-driven erosion and sediment transport in cold regions, Nat. Rev. Earth Environ., 1–20, https://doi.org/10.1038/s43017-022-00362-0, 2022b. a, b, c
Zhang, T., Li, D., East, A. E., Kettner, A. J., Best, J., Ni, J., and Lu, X.: Shifted sediment-transport regimes by climate change and amplified hydrological variability in cryosphere-fed rivers, Sci. Adv., 9, https://doi.org/10.1126/sciadv.adi5019, 2023. a
Zhang, X., Alexander, L., Hegerl, G. C., Jones, P., Tank, A. K., Peterson, T. C., Trewin, B., and Zwiers, F. W.: Indices for monitoring changes in extremes based on daily temperature and precipitation data, WIREs Clim. Change, 2, 851–870, https://doi.org/10.1002/wcc.147, 2011. a