the Creative Commons Attribution 4.0 License.
the Creative Commons Attribution 4.0 License.
 | 08 May 2026
Precipitation Forecasting for Hydrologic Modeling in West-Central Florida using Seasonal Climate Outlooks
Manoj Shrestha
Hui Wang
Jeffrey S. Geurink
Kshitij Parajuli
Tirusew Asefa
Fanzhang Zeng
Dingbao Wang
Seasonal precipitation forecasts play a vital role in short-term decision-making for water resources management, agriculture, and wildfire preparedness. NOAA's seasonal precipitation forecasts can be used at the local scale to further develop precipitation forecasts. Rather than evaluating the forecasting skill at the scale at which forecasts are provided, this study applies NOAA forecasts at the local basin scale and evaluates the skill of such localized forecasts. This study evaluates the skill of NOAA's 3-month precipitation outlooks at a 0.5-month lead for the Alafia and Hillsborough River Basins in west-central Florida, using hindcasts from 1995 to 2019. Forecast performance is assessed seasonally using categorical and probabilistic metrics against basin-scale observed precipitation from a Bayesian gauge-radar dataset. To translate categorical outlooks into basin-scale rainfall estimates, two non-parametric ensemble generation methods are introduced: Proportional Tercile Sampling (PTS) and Dominant Tercile Sampling (DTS). These methods sample from pre-generated rainfall realizations conditioned on seasonal forecasts to capture uncertainty and support operational planning. Results indicate that forecast skill peaks during the dry season (October to February), particularly for wet-tercile forecasts issued during El Niño years. DTS performs best during high-skill seasons by leveraging dominant climate signals, while PTS proves more reliable during low-skill periods. Based on these findings, a hybrid strategy is recommended: apply DTS during late fall and winter to capitalize on strong climate signals and use PTS during other seasons to maintain reliability and operational value. This study contributes a strategic approach to applying NOAA's forecasts in the study area and demonstrates that this method of applying NOAA's forecasts at the local scale is general and can be applied to other regions.
- Article
(4516 KB) - Full-text XML
- BibTeX
- EndNote


Seasonal precipitation forecasts play a critical role in decision making across water resources management, agriculture, and disaster preparedness. By offering lead times of several months, these forecasts help mitigate risks and support proactive planning. Numerous studies have demonstrated their value across diverse sectors. For example, Portele et al. (2021) and MacLeod et al. (2023) applied seasonal climate forecasts to drought management, while Bett et al. (2018) explored their use in flood control. Alexander and Block (2022) and Garcia et al. (2025) highlighted their relevance to agricultural planning. Hurkmans et al. (2023) and Graham et al. (2021) investigated their utility in reservoir operations, and Turco et al. (2019) examined their application in assessing fire risk.
Over the past century, seasonal climate forecasting has evolved through successive waves of research and operational advancement. Namias (1968) laid the groundwork by synthesizing long-range forecasting methods, including analog techniques and emerging statistical approaches. Building on this foundation, Nicholls (1980) classified a broad spectrum of methodologies such as analog, teleconnection, cosmic cycle, time series, and early numerical models, highlighting the diversity of forecasting strategies. Barnett and Preisendorfer (1987) advanced the field by applying canonical correlation analysis to identify key drivers of seasonal temperature predictability in North America. A major milestone came with the establishment of the National Oceanic and Atmospheric Administration's (NOAA) Climate Prediction Center (CPC) in 1995, which marked the beginning of modern operational seasonal climate forecasting. Digitized monthly and three-month “tercile” forecasts were officially archived and made publicly accessible (Hartmann et al., 2002), enhancing transparency and usability. Nowadays, NOAA's CPC issues three-month seasonal precipitation outlooks with a 0.5-month lead time, extending up to 12.5 months into the future.
NOAA's CPC generates seasonal precipitation forecasts by integrating statistical and dynamic modeling approaches. On the statistical side, techniques such as Canonical Correlation Analysis (CCA) and Screening Multiple Linear Regression (SMLR) establish relationships between global sea surface temperature (SST) indices to precipitation anomalies, effectively capturing teleconnection patterns like the El Niño–Southern Oscillation (ENSO) and the North Atlantic Oscillation (O'Lenic et al., 2008; NOAA Climate Prediction Center, 2021). Dynamic models, such as the Climate Forecast System (CFS) and the North American Multi-Model Ensemble (NMME), simulate coupled ocean-atmosphere processes. CFS initializes oceanic conditions using the Global Ocean Data Assimilation System (GODAS), while NMME improves forecast reliability through multi-model consensus (Kirtman et al., 2014). The NOAA CPC operationally maintains the NMME, a dynamic multimodel ensemble system comprising NCEP-CFSv2, ECCC-CanESM5, ECCC-GEM5.2-NEMO, NCAR-CESM1, NCAR-CCSM4, and NASA-GEOS-S2S-2 (NOAA Climate Prediction Center, 2025), which provides more skillful probabilistic seasonal forecasts than single-model systems (Kirtman et al., 2014). Evaluation studies have shown that NMME precipitation skill varies substantially by season, region, and lead time, with the multimodel ensemble generally outperforming individual members, and models such as CCSM4 and CFSv2 showing stronger skill in the southeastern USA (Wang, 2014; Slater et al., 2019; Becker and Van Den Dool, 2016). When raw GCM precipitation fields are used directly rather than probabilistic outlooks, postprocessing such as quantile mapping is often applied to correct systematic biases, though its effectiveness depends on the forecast objective (Zhao et al., 2017).
Forecast skill tends to be highest when statistical and dynamical models agree, particularly during ENSO events. In contrast, when large-scale climate signals are weak, forecast skill often reverts toward climatology (Hartmann et al., 2002). Livezey and Timofeyeva (2008) observed that forecast skill generally declines with increasing lead time, except during ENSO winters when skill remains elevated. These short-term seasonal forecasts provide critical lead time for water resource managers, supporting proactive planning, optimized reservoir operations, and effective drought mitigation strategies (Peng et al., 2012).
Despite advances in seasonal climate forecasting, its application in basin-scale water management remains limited. Water managers continue to evaluate whether these forecasts can meaningfully inform decision-making at the basin level. Tampa Bay Water (TBW), the largest wholesale water provider in the southeastern United States, employs a rainfall–streamflow statistical modeling approach to generate stochastic flow estimates for two key basins that serve as primary surface water sources (Wang et al., 2024). However, the limited skill of seasonal precipitation forecasts has constrained their operational utility in water resources planning and management (Wang et al., 2019). If forecast skill improves, probabilistic information could be used to support proactive water resources planning and management. Wang and Asefa (2018) demonstrated that ENSO phases exert a strong influence on winter rainfall in Florida, highlighting the potential value of seasonal climate outlooks in enhancing regional water management strategies.
This study focuses on two subtropical river basins in west-central Florida and pursues two primary objectives. First, it evaluates the categorical and probabilistic skill of CPC's seasonal precipitation outlooks, with a 0.5-month lead time, over a 25-year period (1995–2019), assessing performance by season (wet vs. dry) and forecast category (above-normal vs. below-normal). Second, it translates CPC's tercile forecasts into basin-scale precipitation estimates by sampling stochastically generated rainfall realizations within the basins. Two sampling approaches are proposed: the proportional probabilistic sampling method and the dominant category-based sampling method. The study examines whether conditioning ensembles of simulated seasonal rainfall on forecast probabilities enhances prediction accuracy relative to climatology. By evaluating both forecast skill and operational utility at the basin scale, this research aims to assess the reliability of CPC's seasonal precipitation forecasts for informing water supply planning in the Tampa Bay region and identify the most effective method for translating probabilistic seasonal outlooks into quantitative precipitation estimates for operational water supply planning in the Tampa Bay region.
2.1 Study Area
This study focuses on two river basins in west-central Florida: one within the Hillsborough River system and the other in the Alafia River system (Fig. 1). Both basins lie within the TBW supply region, serving more than 2.6 million people through its member governments. The agency employs a statistical rainfall-runoff model to generate monthly streamflow forecasts that inform surface water management decisions (Wang et al., 2024). As primary sources of surface water supply, the Alafia River basin and Hillsborough River basin are particularly sensitive to improvements in seasonal rainfall predictability, which can enhance short-term water supply planning. Rainfall in these basins is influenced by large-scale climate variability, especially the ENSO. Notably, El Niño events tend to increase cool-season (winter to early spring) rainfall, while La Niña events typically suppress it. This sensitivity to ENSO highlights the potential for improved predictive skill during certain seasons (Wang and Asefa, 2018).
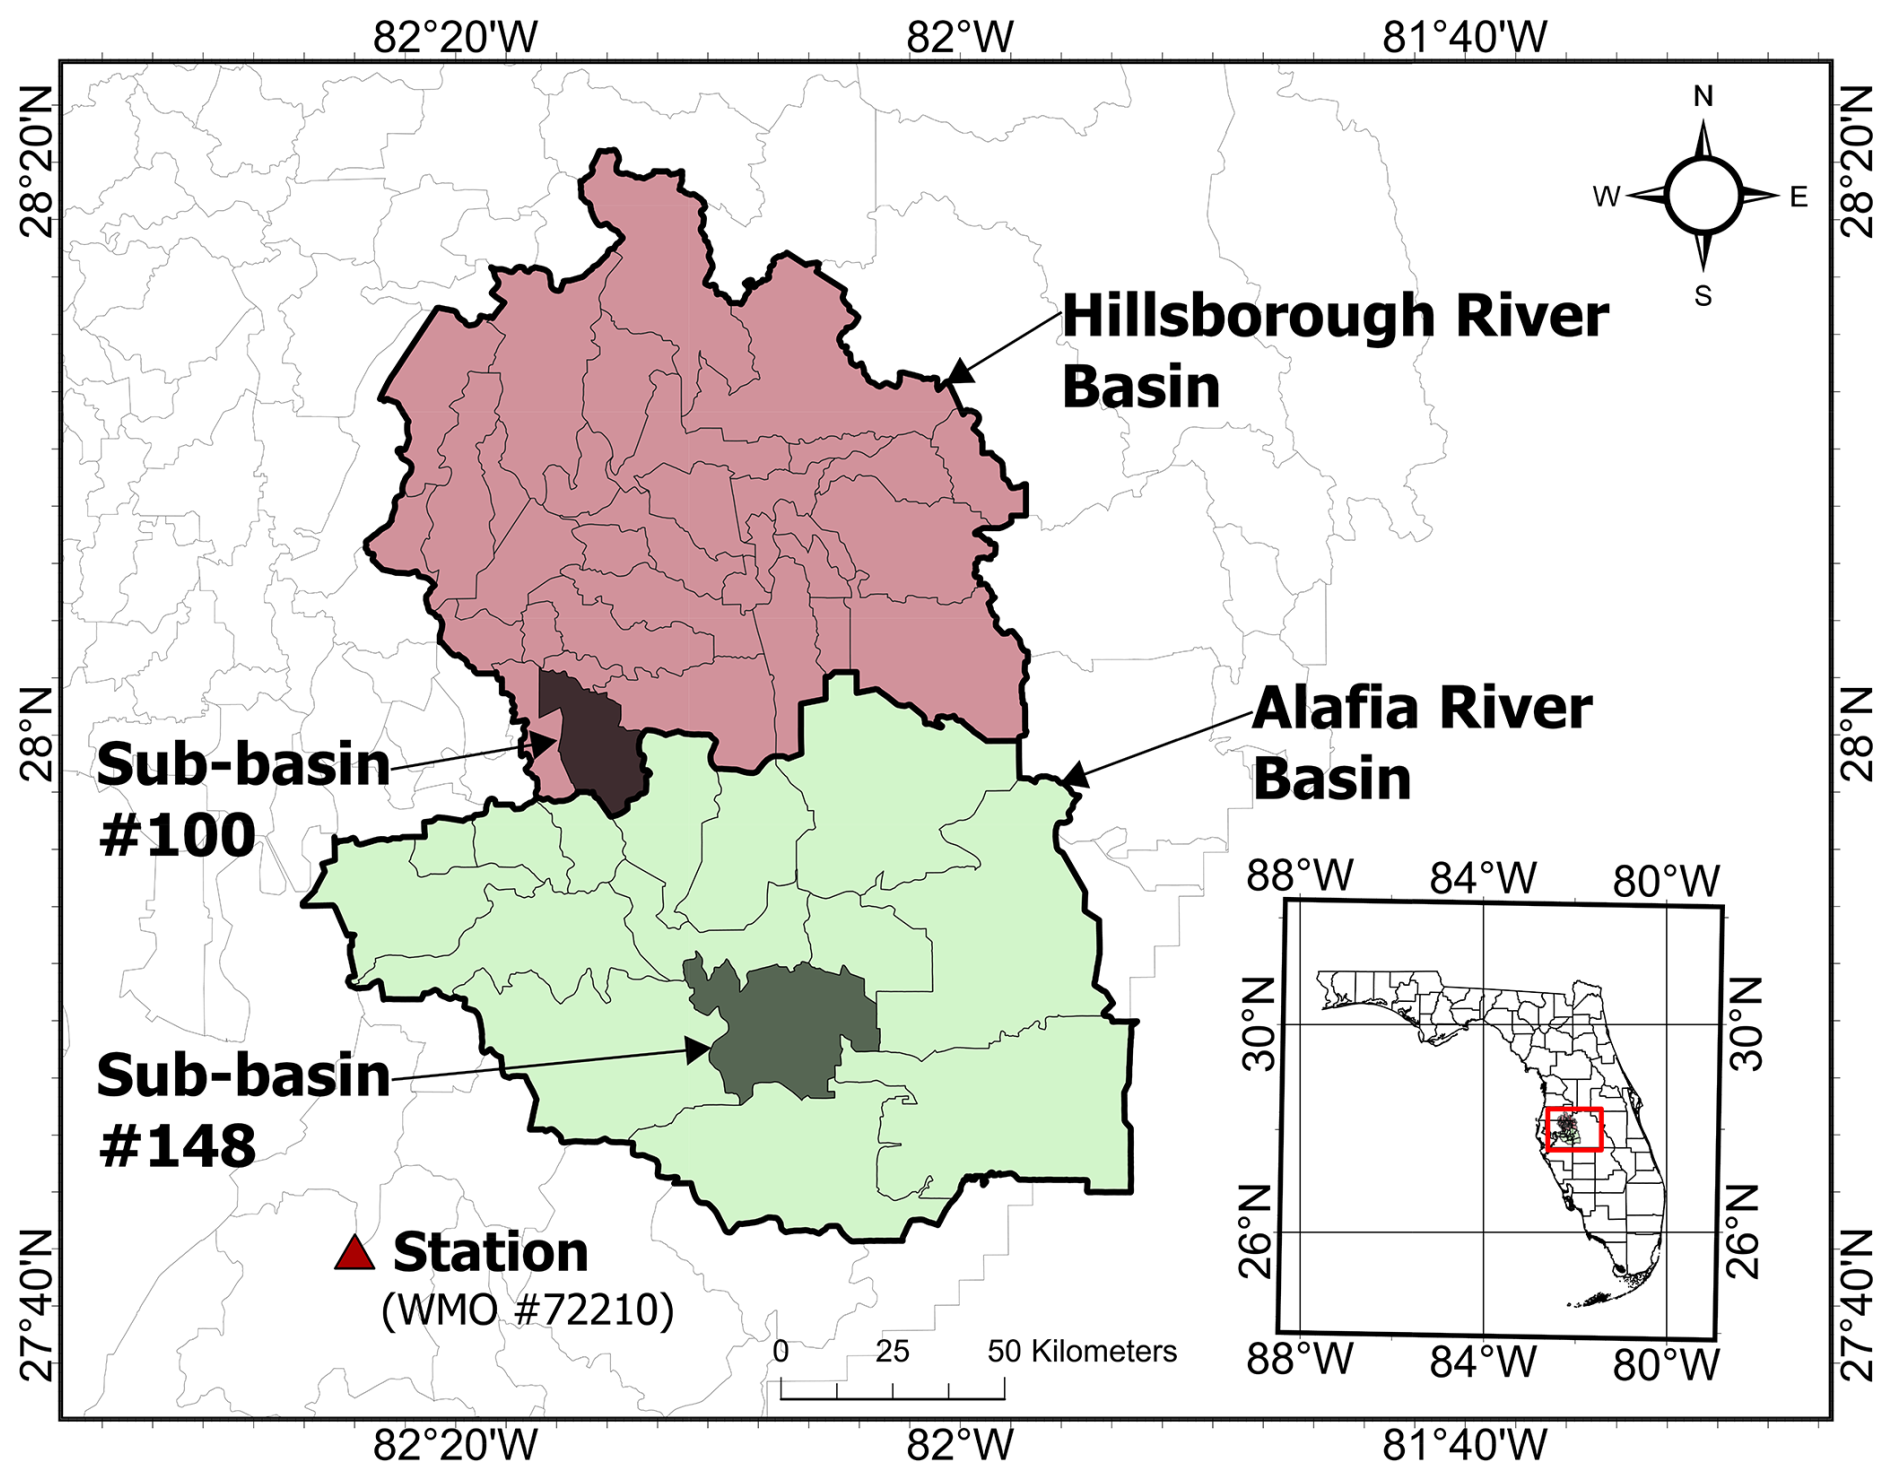
Figure 1Hillsborough River Basin and Alafia River Basin in west-central Florida, with sub-basins #100, #148 and forecast station (WMO #72210) highlighted.
2.2 Seasonal Forecasts and Observation Data
Seasonal precipitation forecasts from CPC with a 0.5-month lead time were obtained for the period 1995–2019 from the publicly accessible database (https://ftp.cpc.ncep.noaa.gov/cpcfcsts/archives/long_lead/data/, last access: 12 October 2025). Gridded forecasts corresponding to the 2° × 2° grid cell encompassing 28° N, 82° W, where the study area is located, were used. Beginning in 2000, CPC transitioned to station-specific forecasts; therefore, data from World Meteorological Organization (WMO) Station #72210 (Tampa Bay, FL, at 27.7° N, 82.4° W) were utilized. A 25-year compilation of seasonal forecasts was assembled, each represented as a tercile probability distribution (below-normal, near-normal, and above-normal). Forecast categories were assigned based on the highest probability among the three. If all categories had equal probabilities (33.33 %), the forecast was classified as “Equal Chances (EC).”
Tercile boundaries were defined using a uniform 30-year baseline climatology for each season, updated every decade in accordance with guidelines from the WMO and the National Weather Service (NWS). For forecasts spanning 2010–2020, tercile limits were based on the 1981–2010 climatology (NOAA Climate Prediction Center, 2019). CPC forecasts were available with lead times ranging from 0.5 to 12.5 months, offering long-range seasonal outlooks. The earliest forecasts were issued mid-month, with a 0.5-month lead indicating release approximately two weeks prior to the start of the target season. For example, the January–February–March (JFM) forecast issued in mid-December (0.5-month lead) was used to predict precipitation for the JFM period. For five seasons during the study period, 0.5-month lead forecasts were unavailable; in these cases, the next-shortest available lead time was used.
Observed basin precipitation for the study basins was obtained from Tampa Bay Water's Bayesian rainfall dataset for the Integrated Northern Tampa Bay (INTB) domain, which integrates rain-gauge observations and Doppler radar measurements within a Bayesian statistical framework and interpolates the resulting daily rainfall estimates to the basins (GSI Environmental Inc., 2021a, b, c). The resulting basin-scale daily precipitation record was then aggregated to seasonal totals for use in forecast verification.
To analyze the influence of ENSO phases on forecast skill, Oceanic Niño Index (ONI) values were collected for each season from 1995 to 2019. The ONI is defined as the three-month running mean of SST anomalies in the Niño 3.4 region (5° S–5° N, 120–170° W). El Niño (La Niña) events are identified by Niño 3.4 index values °C ( °C) sustained for at least five consecutive overlapping seasons, while neutral conditions are defined by −0.5 °C < ONI < +0.5 °C.
2.3 Stochastic Rainfall Simulation
To generate ensemble rainfall scenarios for the study basins, this research employed a stochastic weather simulation approach. Stochastic rainfall simulators have been widely used to produce synthetic precipitation time series that preserve the statistical characteristics of observed climates (Wilks and Wilby, 1999; Srikanthan and McMahon, 2001). In this study, Monte Carlo–simulated realizations of monthly rainfall, developed by GSI Environmental Inc. and TBW for 172 basins within the INTB hydrologic model domain, were utilized. These realizations were produced using a stochastic weather simulation framework specifically designed to maintain the historical spatial-temporal variability and cross-basin correlations of rainfall across the Tampa Bay region.
Over the 25-year simulation period, a total of 12 300 monthly gauge rainfall observations (41 gauges × 12 months × 25 years) were collected and subsequently transformed into standard normal variables as follows:
where represents the observed rainfall at station i, in month m, and year t; Fi,m denotes the empirical cumulative distribution function (CDF); and Φ−1 is the inverse standard normal CDF. The resulting standard normal variable is denoted as . To model the spatial and temporal dependence of rainfall, lagged cross-correlations among the normalized variables were computed using:
where i and j denote the gauge stations, and τ represents the lag in months, extending up to 96 months (8 years). This process yields a comprehensive correlation matrix that captures the spatial correlation among gauges across years. The correlation matrix over 8-years period is structured as:
where denotes the correlation matrix between gauges i and j for the same month, and represents the correlation matrix between gauges i and j across different months and years. Using this correlation matrix, realizations of the joint multivariate normal distribution were generated to represent spatially and temporally correlated rainfall fields in the standard-normal space. These simulated Z-scores were then transformed back into original rainfall values () using the inverse of the empirical CDF:
Simulated values that exceeded historical maximum or minimum observations were truncated to remain within those bounds. Finally, monthly gauge rainfall was spatially interpolated to generate basin-specific rainfall time series.
2.4 Ensemble Rainfall Forecast Generation
To incorporate forecast probabilities into the selection of members from the stochastic rainfall simulations described in Sect. 2.3, two ensemble generation schemes were evaluated for sub-basin #100 and sub-basin #148 (Fig. 1). A nonparametric, tercile-stratified sampling method was employed to condition synthetic rainfall on CPC tercile probabilities, ensuring the generated ensemble is probabilistically consistent with the forecast without assuming a parametric rainfall distribution. For each season and basin, the simulated total rainfall was defined as:
where Rr,t denotes the total rainfall in year t in realization r. The empirical CDF of X, denoted as F(X), is used to stratify the rainfall totals into tercile categories:
Given the CPC seasonal forecast probabilities, PBN, PNN, PAN representing probabilities of below-normal, near-normal, and above-normal rainfall conditions, respectively, two sampling schemes were evaluated to generate ensemble forecasts conditioned on these probabilities. The full ensemble generation process, including stratification of synthetic rainfall and probabilistic sampling, is illustrated in Fig. 2.
2.4.1 Proportional Tercile Sampling (PTS)
In this approach, ensemble members are randomly sampled with replacement from each pool, i.e., below-normal, near-normal, and above-normal as defined by Eqs. (6), (7), and (8), respectively. Sampling is performed in proportion to the CPC seasonal tercile forecast probabilities, ensuring that the ensemble reflects the relative likelihood of each rainfall category indicated by the forecast. For example, if the CPC forecast for a target season assigns a 50 % probability to above-normal, 30 % to near-normal, and 20 % to below-normal rainfall, 50 % of the ensemble members are randomly drawn from the pool defined by Eq. (8), 30 % from Eq. (7), and 20 % from Eq. (6). By weighing the sampling according to the forecast probabilities, the likelihood of generating wet or dry scenarios is guided by the forecast signal.
In a prior study by MacLeod et al. (2023), tercile-based seasonal rainfall forecasts were used to resample the historical hydrological data. In contrast, the proposed PTS method utilizes a large ensemble of stochastically generated rainfall realizations, offering a more robust representation of the inherent variability and uncertainty in seasonal rainfall.
2.4.2 Dominant Tercile Sampling (DTS)
Under this scheme, ensemble members are randomly sampled with replacement exclusively from the tercile with the highest forecast probability. For instance, if the above-normal category has the highest probability among the three, all ensemble members are drawn from the above-normal pool defined by Eq. (8). This method assumes high forecast confidence and may produce sharper predictions; however, it risks underrepresenting uncertainty when forecast probabilities are relatively close.
For comparison, unconditioned (climatology-based) ensembles were also generated, independent of seasonal forecasts. In this case, ensemble members were sampled uniformly from each of the terciles defined by Eqs. (6), (7), and (8), without regard to forecast probabilities. For EC forecasts, realizations were sampled equally from the below-normal, near-normal, and above-normal tercile pools for each method. This baseline represents a “no-skill” forecast and is equivalent to relying solely on historical climatology for each season. The climatology ensemble serves as a benchmark, and any climate-informed method should ideally demonstrate improved performance relative to this baseline (Liu et al., 2022). In this study, 1000 ensemble members were generated for each method: PTS, DTS, and climatology, covering the period from 1995 to 2019.
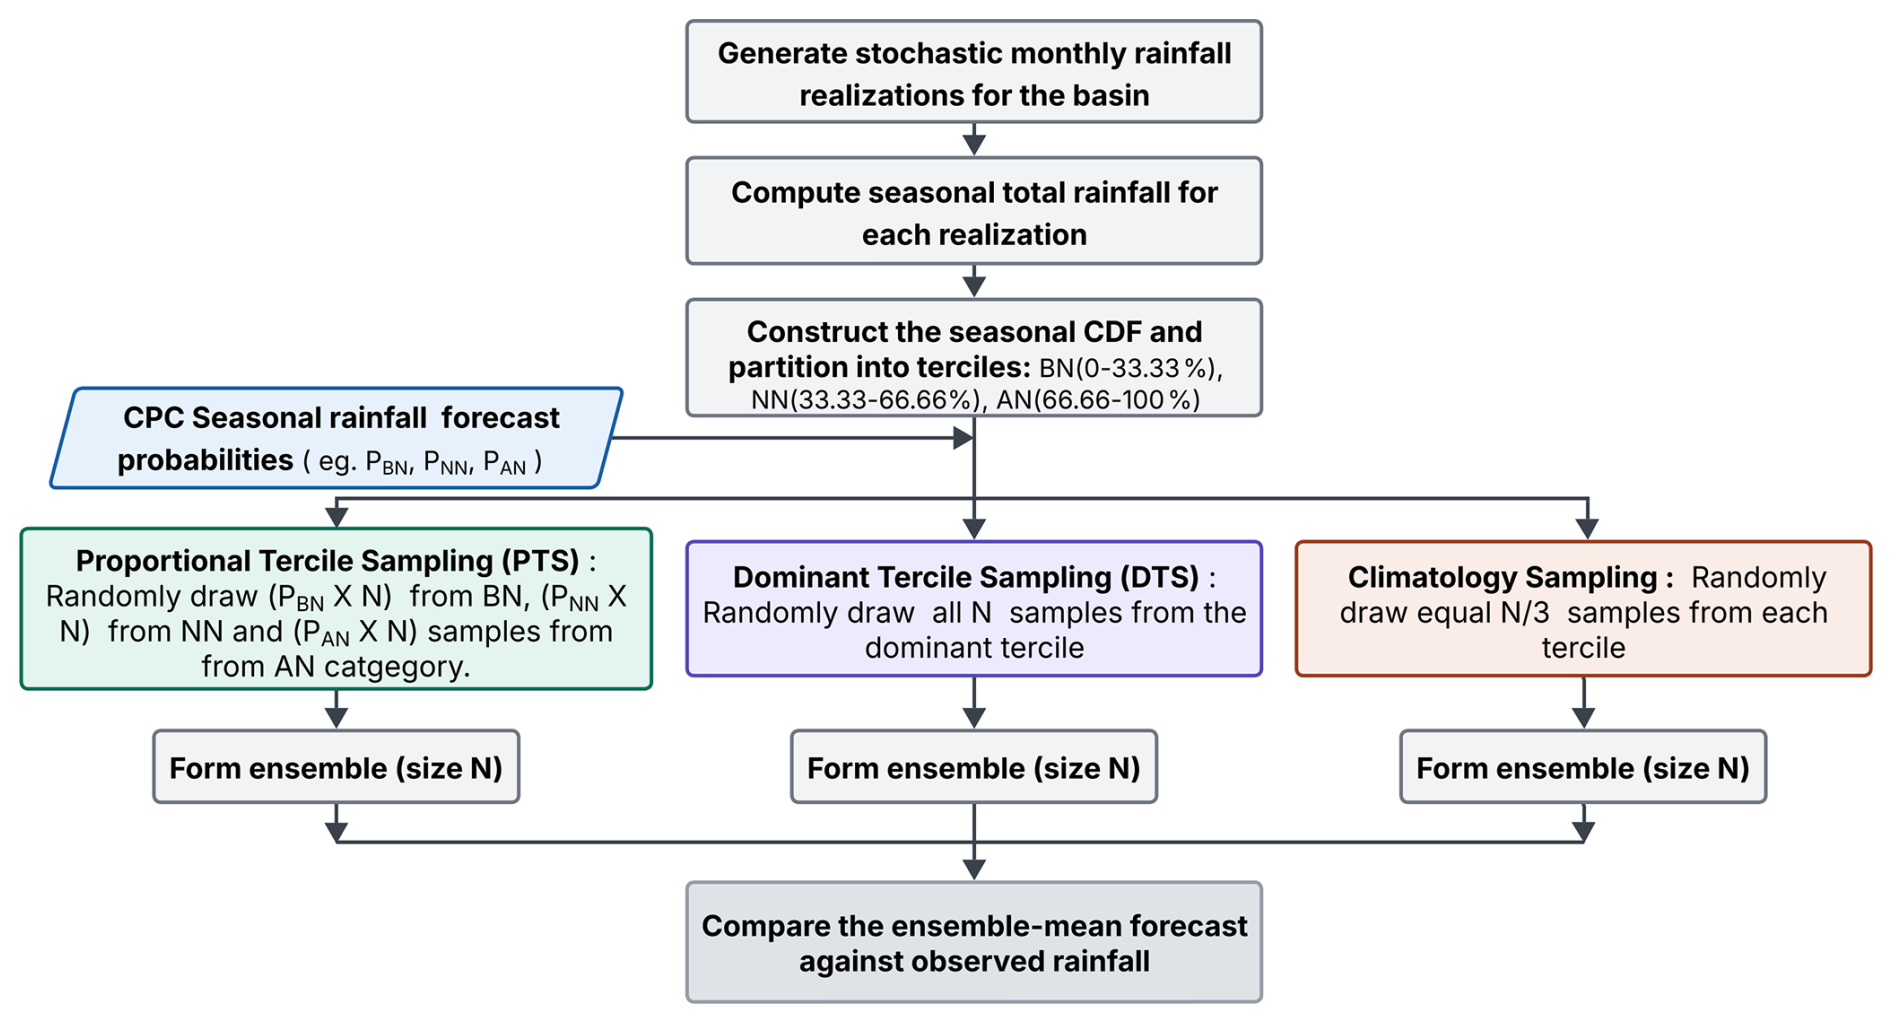
Figure 2Schematic diagram illustrating the process of generating ensemble forecasts informed by seasonal climate outlooks.
2.5 Seasonal Precipitation Forecast Verification
Verification of seasonal forecasts is essential for evaluating the reliability and skill of climate forecasts (Huang and Zhao, 2022). Seasonal probabilistic precipitation forecasts are typically assessed using two primary approaches. The first is categorical verification, which compares the forecasted precipitation category (below-normal or above-normal) with the corresponding observed category. This comparison is summarized in a contingency table from which various verification metrics are derived. The second is probabilistic verification, which evaluates the forecasted probabilities assigned to each tercile category against the actual observed outcome, providing a more nuanced assessment of forecast performance (Zhang and Casey, 2000; Murphy and Winkler, 1987).
2.5.1 Categorical Forecast Verification
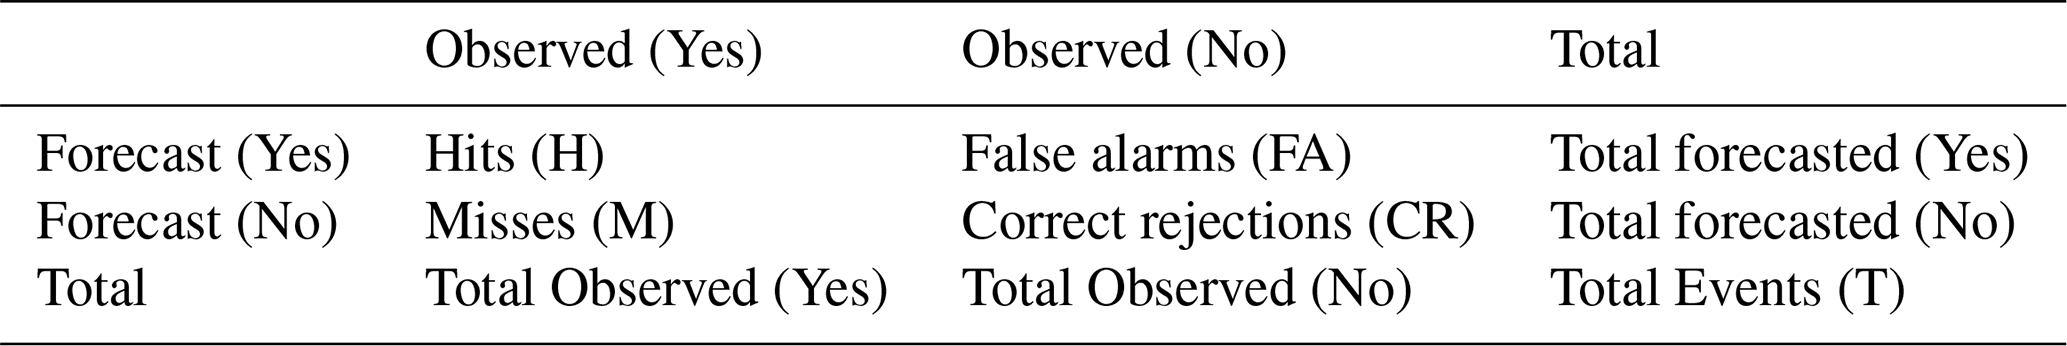
For categorical evaluation, the discrete distribution of forecasts and observations is assessed using a 2 × 2 contingency table, as illustrated in Table 1 (Doswell et al., 1990). The table includes four metrics: “Hits”, when an event is both forecasted and observed; “Misses”, when the event occurs but is not forecasted; “False Alarms”, when the event is forecasted but does not occur; and “Correct Rejections”, when the event is neither forecasted nor observed. Separate contingency tables are constructed for wet events (above-normal) and dry events (below-normal) for each basin to enable more detailed evaluation where equal-chances cases forecast grouped into the non-event category. From these tables, several standard skill metrics are computed, consistent with methodologies used in prior studies (Wilks, 2006; Doswell et al., 1990):
The probability of detection (POD), or hit rate, defined in Eq. (9), represents the proportion of observed events that were correctly forecasted. The false alarm rate (FAR), shown in Eq. (10), indicates the proportion of forecasted events that did not actually occur. The success rate (SR), given in Eq. (11), measures the proportion of correct forecasts relative to all forecasts issued. The forecast's ability to discriminate between events and non-events can be assessed by comparing POD, and FAR: a useful forecast should detect a substantial portion of events while minimizing false alarms (i.e., POD > FAR). If POD equals FAR, the forecast lacks skill in distinguishing events from non-events and effectively performs no better than random guessing. It is important to evaluate all three metrics collectively to obtain a comprehensive understanding of forecast performance. The ideal scenario is characterized by being POD=1, FAR=0, and SR=1.
Table 1A 2 × 2 contingency table summarizing outcomes of hits (H), misses (M), false alarms (FA), and correct rejections (CR) derived from observed versus forecasted events.
To assess overall categorical skill relative to a no-skill baseline, the CPC-modified Heidke Skill Score (HSS), defined in Eq. (12) (Heidke, 1926; NOAA Climate Prediction Center, 2005), is used. HSS quantifies the improvement of the number of correct forecasts over what would be expected by chance and is defined as:
where T is the total number of forecasts issued; H is the number of correct forecasts; and E is the expected number of correct forecasts by chance. For tercile categorical forecasts, E is equal to one-third of T. A HSS score of 100 indicates a perfect forecast, −50 corresponds to the worst possible forecast with no correct predictions, and a score of 0 reflects a forecast with no skill, equivalent to random guessing.
2.5.2 Probabilistic Forecast Verification
In addition to categorical evaluations, probabilistic forecasts are assessed using metrics that quantify the quality of the predicted probability distributions. A key metric for this purpose is the Ranked Probability Skill Score (RPSS), which is derived from the Ranked Probability Score (RPS) (Wilks, 1995). The RPS evaluates the accuracy of forecast probability distribution relative to the observed outcome, while the RPSS compares this accuracy against a reference forecast, typically climatology (Wilks, 2006). For a single forecast–observation pair, the RPS is calculated as:
where N=3 for tercile forecasts. Fk and Ok represent the cumulative forecast probabilities and cumulative observed probabilities for category k, respectively. An RPSvalue of 0 indicates a perfect forecast. To evaluate the skill of the forecast relative to a reference (typically climatology), the reference RPS, denoted as RPSCl, is computed as:
where Ck represents the cumulative climatological probability for category k.The RPSS metric is defined as:
The RPSS value ranges from −∞ to 1. An RPSS of 0 indicates that the forecast performs no better than the reference baseline, typically climatology. The metric penalizes more severely when high-confidence predictions are incorrect, while forecasts made with low confidence receive smaller penalties if they turn out to be wrong.
2.5.3 Ensemble Forecast Evaluation
Following the generation of ensemble mean forecasts as described in Sect. 2.4, their performance in predicting observed seasonal precipitation from 1995 to 2019 was evaluated using two metrics. The first metric, Root Mean Square Error (RMSE), quantifies the average magnitude of the differences between the ensemble mean forecasts and the corresponding observed precipitation. RMSE was computed using Eq. (16):
where fi and oi denote the ith forecast and corresponding observation, respectively; and N is the total number of forecast–observation pairs. RMSE provides a measure of overall forecast accuracy and is particularly sensitive to outliers, penalizing larger errors more heavily than smaller ones.
To evaluate the agreement between forecasted and observed precipitation time series, the Pearson correlation coefficient was computed as:
Where and denote the mean forecasted and observed precipitation, respectively. This metric evaluates how effectively the ensembled forecast captures interannual variability.
Forecasts were generated with a 0.5-month lead time to support short-term seasonal water resources management. By comparing the ensemble forecasts derived from sampling historical stochastic data, this study aims to identify the most effective method for each season and assess whether either approach yields skillful predictions beyond those provided by climatology-based forecasts.
3.1 Evaluation of localized NOAA forecasts
This Section examines the frequency of CPC tercile-category forecast issuance over a 25-year study period, as illustrated in Fig. 3a for the Alafia River Basin and Fig. 3c for the Hillsborough River Basin. Of the 298 forecasts issued, 59.06 % (176/298) favored a specific tercile category: 27.85 % (83/298) predicted below-normal precipitation, while 31.21 % (93/298) predicted above-normal precipitation. The remaining 40.94 % (122/298) were classified as EC, indicating no clear preference for any category. Notably, none of the forecasts during the study period favored the near-normal category, likely reflecting the inherent difficulty in predicting the middle tercile, which is often associated with weak anomaly signals (Van Den Dool and Toth, 1991; Mason et al., 2021).
A seasonal pattern emerged in the issuance of EC and non-EC forecasts, as shown in Fig. 3a and c. From late spring through early fall (AMJ to OND), only about half of the forecasts fell into the non-EC category (i.e., either above-normal or below-normal precipitation). In contrast, the proportion of non-EC forecasts increased markedly during winter months: 79 % for NDJ, 84 % for FMA, 92 % for DJF, and 96 % for JFM. This trend suggests that CPC tends to issue forecasts with greater confidence during winter, consistent with the findings of Peng et al. (2012), who observed that predictive skill enhances the frequency of non-EC forecasts. The success ratio, as defined in Eq. (11), was calculated based on Fig. 3a and c over the 25-year evaluation period. In the Alafia River Basin, below-normal forecasts yielded a success rate of 45.78 % (38 hits out of 83), while above-normal forecasts achieved 43.01 % (40 hits out of 93). The Hillsborough River Basin exhibited slightly lower but comparable success ratios: 42.17 % (35/83) for below-normal and 40.86 % (38/93) for above-normal forecasts.
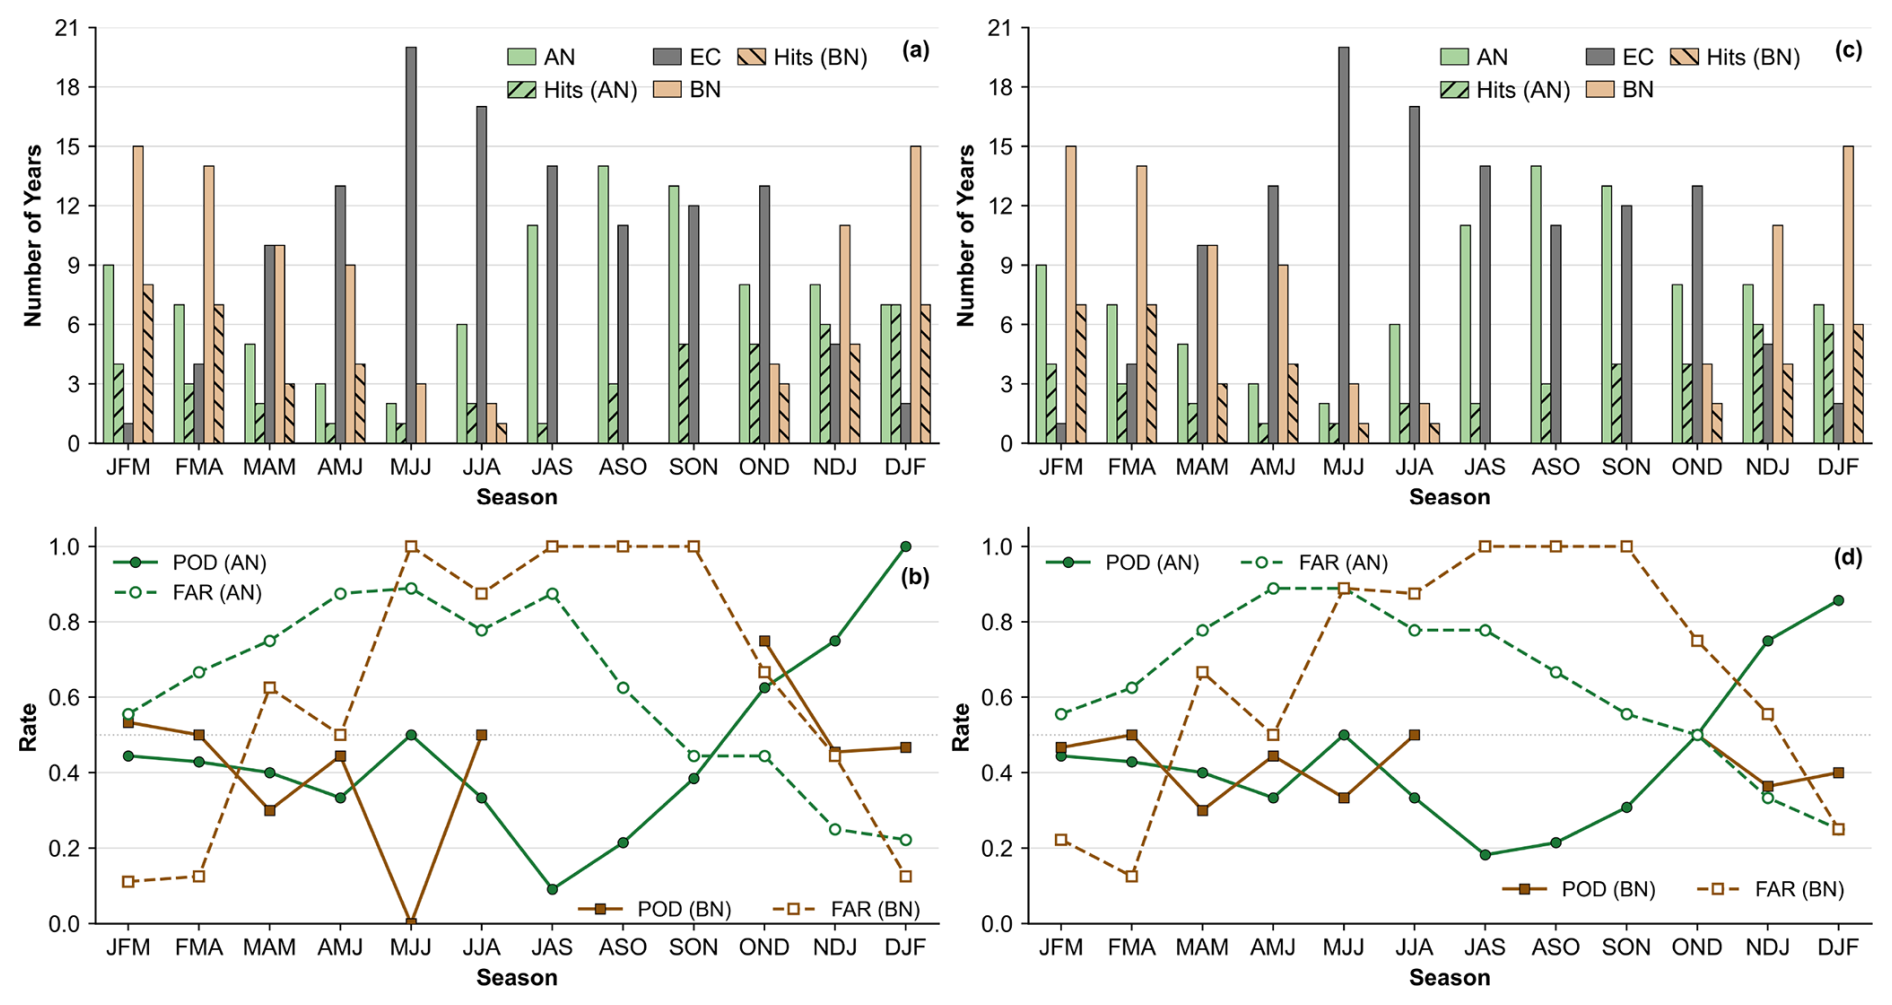
Figure 3Seasonal distribution of categorical precipitation forecasts and associated performance metrics for the Alafia River Basin (a, b) and Hillsborough River Basin (c, d). Panels (a) and (c) display the number of years forecasted as above-normal (AN), below-normal (BN), and equal-chance (EC), along with the number of years correctly predicted as above-normal [Hits (AN)] and below-normal [Hits (BN)]. Panels (b) and (d) present the probability of detection (POD) and false alarm rate (FAR) for AN and BN categories across seasons from 1995–2019.
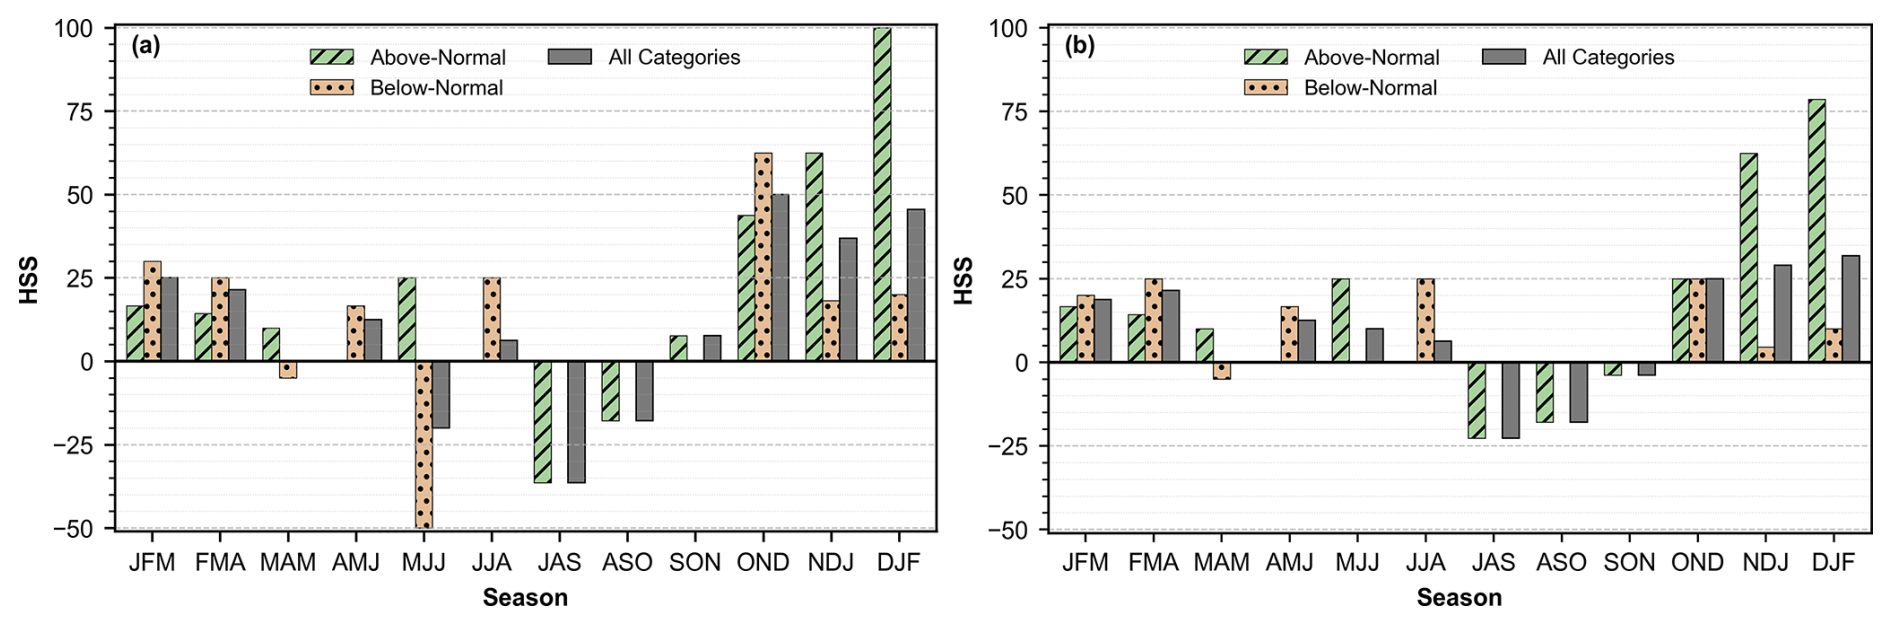
Figure 4Heidke Skill Score (HSS) for CPC 0.5-month-lead seasonal precipitation forecasts in the Alafia River Basin (a) and Hillsborough River Basin (b), shown separately for above-normal, below-normal, and both forecast categories combined.
To assess the seasonal discrimination ability of the forecasts, contingency statistics (i.e., hits, misses, false alarms, and correct rejections) were computed for each season. The POD and FAR were then derived and are presented in Fig. 3b for the Alafia River Basin and Fig. 3d for the Hillsborough River Basin. Forecast discrimination skill is most pronounced during the dry season for the above-normal category, particularly in OND, NDJ, and DJF periods, where POD consistently exceeds FAR. In the Alafia River Basin, above-normal forecasts during OND (POD = 0.63, FAR = 0.44), NDJ (POD = 0.75, FAR = 0.25), and DJF (POD = 1.00, FAR = 0.22) demonstrate strong predictive capability. The Hillsborough River Basin shows comparable skill, with above-normal forecasts during OND (POD = 0.50, FAR = 0.50), NDJ (POD = 0.75, FAR = 0.33), and DJF (POD = 0.85, FAR = 0.25). In contrast, during the remaining dry-season months, POD values for above-normal generally fall below FAR, indicating weaker discrimination between observed and unobserved events. Forecast skill for the below-normal category is more limited, with POD exceeding FAR only during DJF, JFM, and FMA. This pattern suggests that the ability to correctly identify dry anomalies is largely confined to the early part of the year, when large-scale climate drivers such as ENSO enhance predictability. During the rest of the year, particularly throughout the wet season, FAR consistently exceeds POD, indicating a higher tendency for false alarms and reduced discrimination skills for both forecast categories.
Overall, these findings indicate that while below-normal forecasts exhibit episodic skill during winter and early spring (DJF, JFM, FMA), above-normal forecasts show stronger and more consistent discrimination performance during late fall and early winter (OND–DJF).
Figure 4 presents the HSS, which adjusts the proportion of correct forecasts expected by chance, thereby isolating the true categorical forecast skill. Figure 5 displays the RPSS, which evaluates the probabilistic forecast skill relative to climatology. Both categorical and probabilistic skill metrics consistently show that forecast skill is concentrated during the dry season (OND–FMA), while the wet season exhibits limited or even negative skill. For both basins, overall HSS values exceed 20 throughout late fall and winter but become negative during the wet season (Fig. 4a and b). When disaggregated by forecast category, above-normal forecasts contribute most significantly to overall skill. In both basins, HSS for above-normal forecasts increase from OND, peaks in DJF with maximum scores of 100 for the Alafia River Basin (Fig. 4a) and 79 for the Hillsborough River Basin (Fig. 4b) and then gradually decline through JFM and FMA. These trends are mirrored in the RPSS results (Fig. 5a and b), where above-normal forecasts consistently outperform climatology during OND–DJF, indicating higher forecast skill and reliability. In contrast, below-normal forecasts exhibit weaker and less consistent skill. HSS values for below-normal forecasts remain below 30 for most seasons, except for OND in the Alafia River Basin (Fig. 4a). RPSS values for below-normal forecasts hover near or below zero for much of the year, indicating limited probabilistic skill.
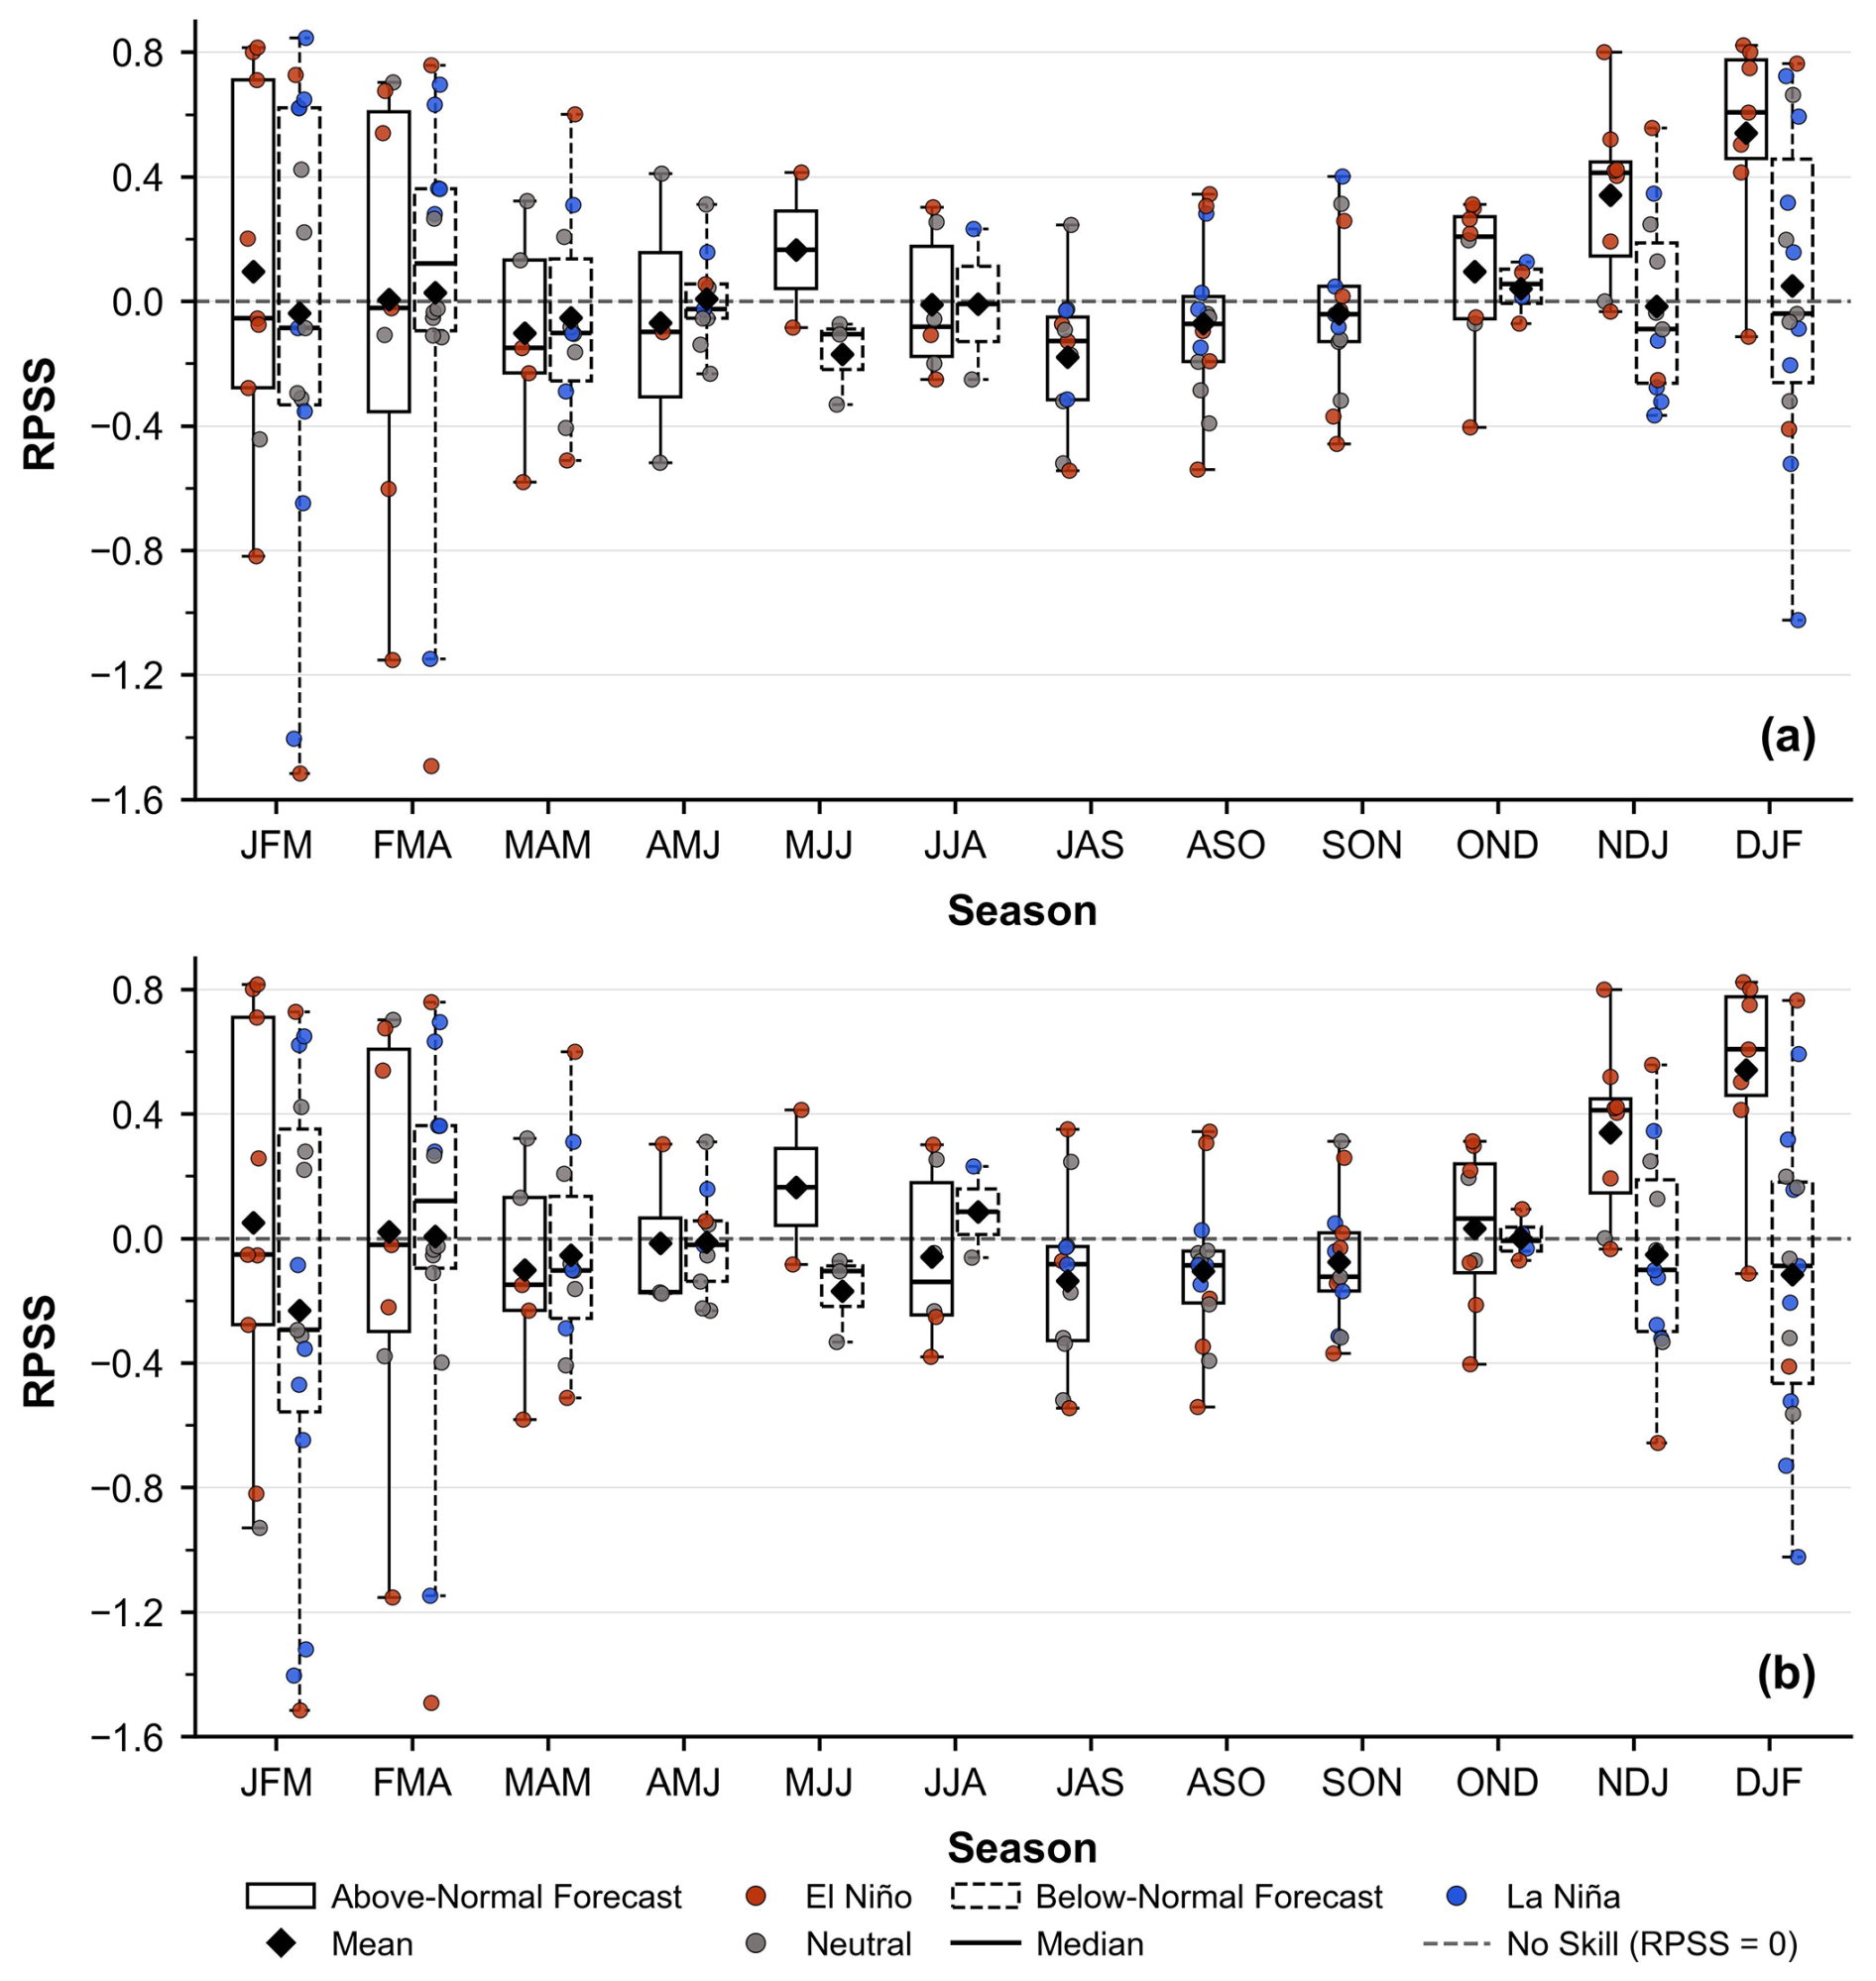
Figure 5Ranked probability skill score (RPSS) for CPC 0.5-month-lead seasonal precipitation forecasts in the Alafia River Basin (a) and Hillsborough River Basin (b). Boxplots depict the seasonal distribution of RPSS for above-normal (AN) and below-normal (BN) forecast categories from 1995 to 2019. Individual points represent seasonal cases, color-coded by ENSO phase (El Niño, La Niña, Neutral). The dashed horizontal line represents the no-skill reference (RPSS = 0), indicating performance equivalent to climatology.
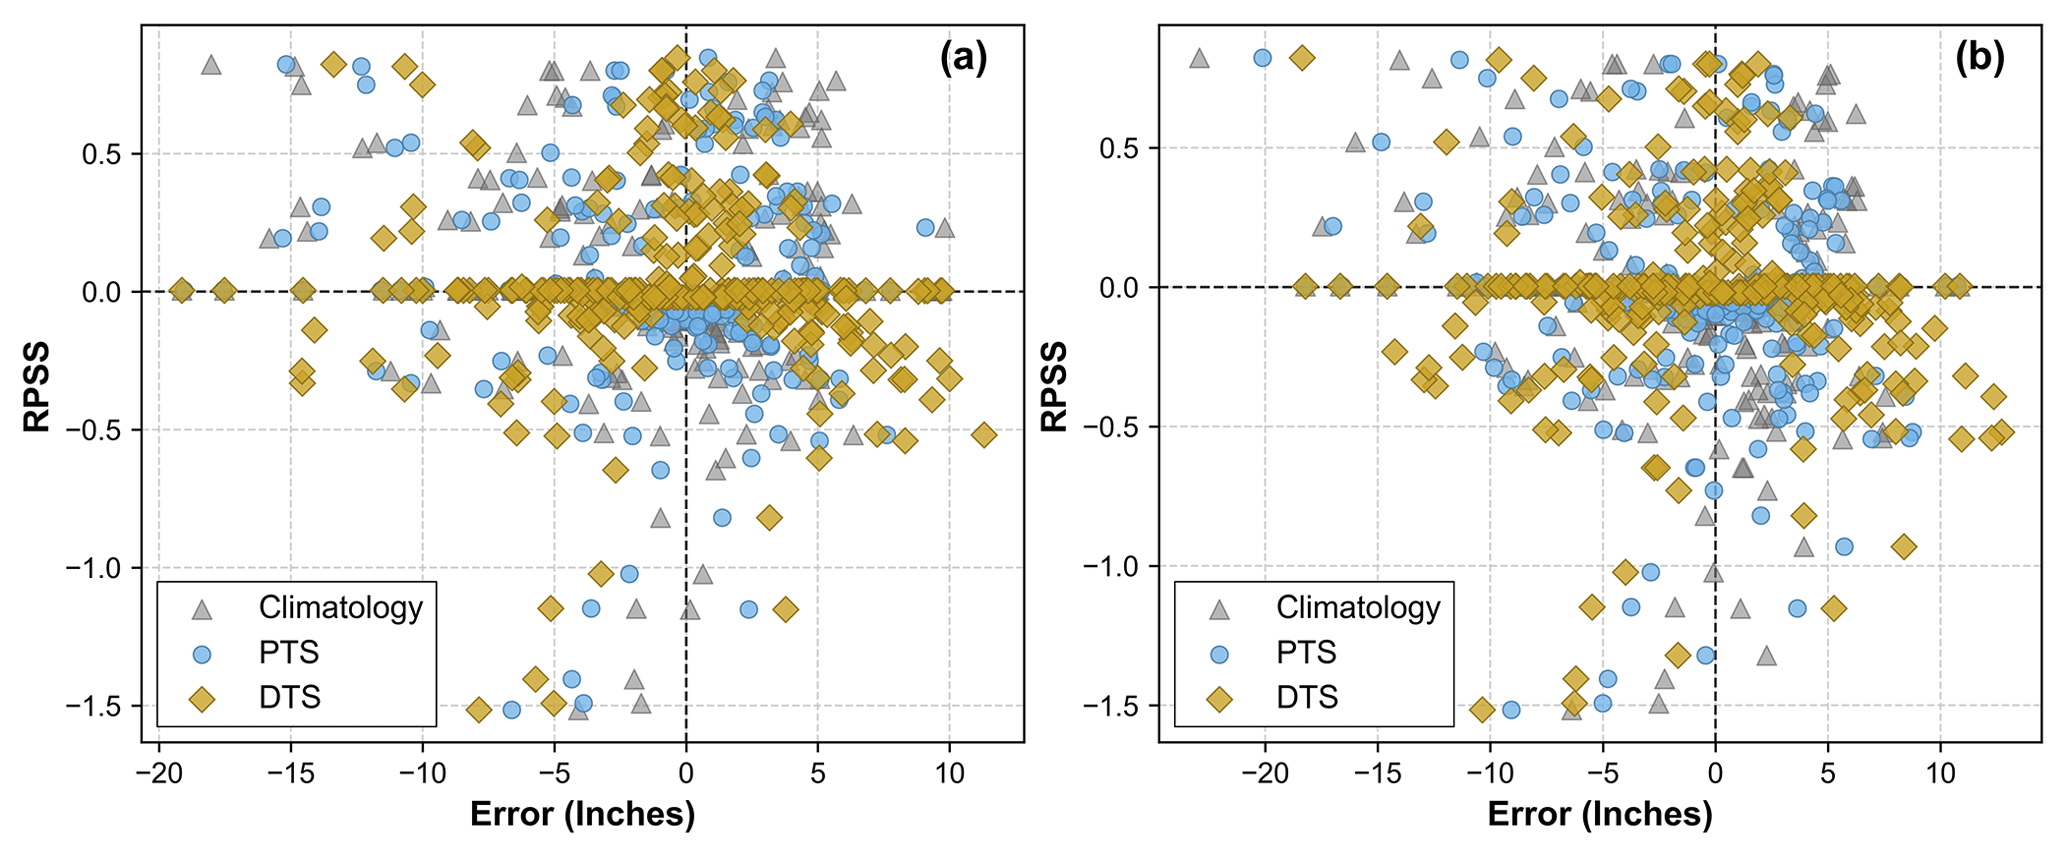
Figure 6Scatterplot of forecast error (mean ensemble forecast minus observed precipitation, in inches) for each season from 1995 to 2019, corresponding to proportional tercile sampling (PTS), dominant tercile sampling (DTS), and climatology sampling. Errors are plotted against the ranked probability skill score (RPSS) of that season for sub-basin #148 (a) and sub-basin #100 (b).
Overall, the categorical and probabilistic analyses highlight the strong seasonality of forecast skill, with enhanced performance during winter and early spring (OND–FMA). During this period, both categorical accuracy and probabilistic reliability substantially exceed climatology, underscoring the predictive value of CPC seasonal forecasts for hydrological applications in west-central Florida.
3.2 ENSO Influence on Forecast Skill
Figure 5 shows the seasonal distribution of RPSS for individual forecast categories, annotated by the corresponding ENSO phase during each observed season. Nearly all high-skill outcomes coincide with El Niño years. Across both the Alafia and Hillsborough basins, the highest RPSS values occur overwhelmingly during El Niño conditions, indicating that wintertime predictability in this region is largely realized when the ENSO teleconnection provides a strong, coherent anomaly signal. Further analysis of dry season periods (NDJ and DJF) and classifying ENSO using the Oceanic Niño Index (ONI) highlights the role of El Niño in both the frequency and accuracy of above-normal precipitation forecasts. In NDJ, eight above-normal forecasts were issued between 1995 and 2019 (1997/98, 2002/03, 2006/07, 2009/10, 2012/13, 2014/15, 2015/16, and 2018/19); seven align with El Niño conditions, with the exception of 2012/13, which occurred during a neutral phase. In DJF, all seven above-normal forecasts (1997/98, 2002/03, 2006/07, 2009/10, 2014/15, 2015/16, and 2018/19) were issued during El Niño conditions. By contrast, below-normal (dry) forecasts are distributed across El Niño, neutral, and La Niña phases and do not show a consistent alignment with a single large-scale driver, which is consistent with their weaker and more variable skill. Overall, these results underscore ENSO, particularly El Niño as a dominant source of enhanced wet-winter forecast skill for this region.
3.3 Performance of Sampling Schemes
Figure 6 summarizes how seasonal forecast error (ensemble-mean minus observed precipitation) varies with probabilistic skill (RPSS) for PTS, DTS, and climatology in sub-basin #148 (Fig. 6a) and sub-basin #100 (Fig. 6b). A consistent visual pattern emerges in both panels: near the no-skill threshold (RPSS ≈ 0), the PTS and climatology points largely overlap, indicating comparable errors when the seasonal forecast provides little usable information, whereas DTS is typically farther from the zero-error line, reflecting larger errors under weak-signal conditions. In the skillful regime (RPSS > 0), DTS points cluster closest to the zero-error line, with PTS generally falling between DTS and climatology, suggesting that concentrating sampling on the dominant tercile is most beneficial when the seasonal signal is strong enough to yield positive RPSS. In contrast, for unskillful seasons (RPSS < 0), DTS shows the largest departures from the zero-error line, indicating that DTS can amplify errors when the forecast probabilities are unreliable.
Table 2Comparison of PTS, DTS, and climatology performance for sub-basins #148 and #100 across all seasons and skilful seasons only (RPSS > 0). RMSE is reported in inches, and r denotes the Pearson correlation coefficient. Bold values indicate the best performance within each sub-basin and season subset.
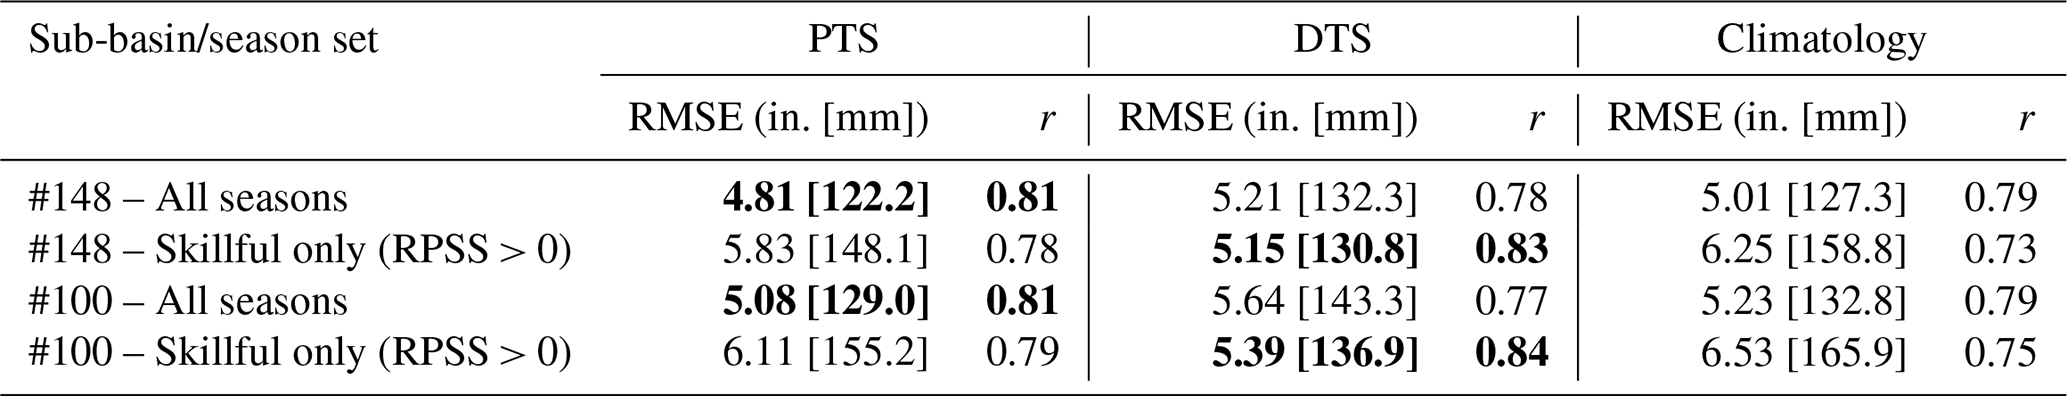
These qualitative patterns are reflected in the summary statistics shown in Table 2. Across both sub-basins, a consistent performance pattern emerged for RMSE and correlation. When all seasons were included, the PTS approach produced only modest improvements, typically reducing RMSE by about 3 %–4 % relative to climatology, while DTS actually performed worse than both methods. This indicates that PTS provides a relatively stable advantage under mixed-skill conditions. In contrast, when the analysis focused solely on skillful seasons (RPSS > 0), the DTS approach became clearly superior. DTS achieved RMSE reductions of approximately 12 % relative to PTS and 17 %–18 % relative to climatology, while PTS still outperformed climatology by about 7 %. Correlation patterns were consistent with these findings, with DTS yielding the highest r values during skillful seasons, compared to PTS and climatology.
Taken together, these results highlight that the relative value of the two sampling strategies is strongly dependent on forecast quality: PTS offers greater stability when all seasons are considered, whereas DTS is markedly more effective during seasons with demonstrable predictive skill, improving both error magnitude and correspondence with observed variability.
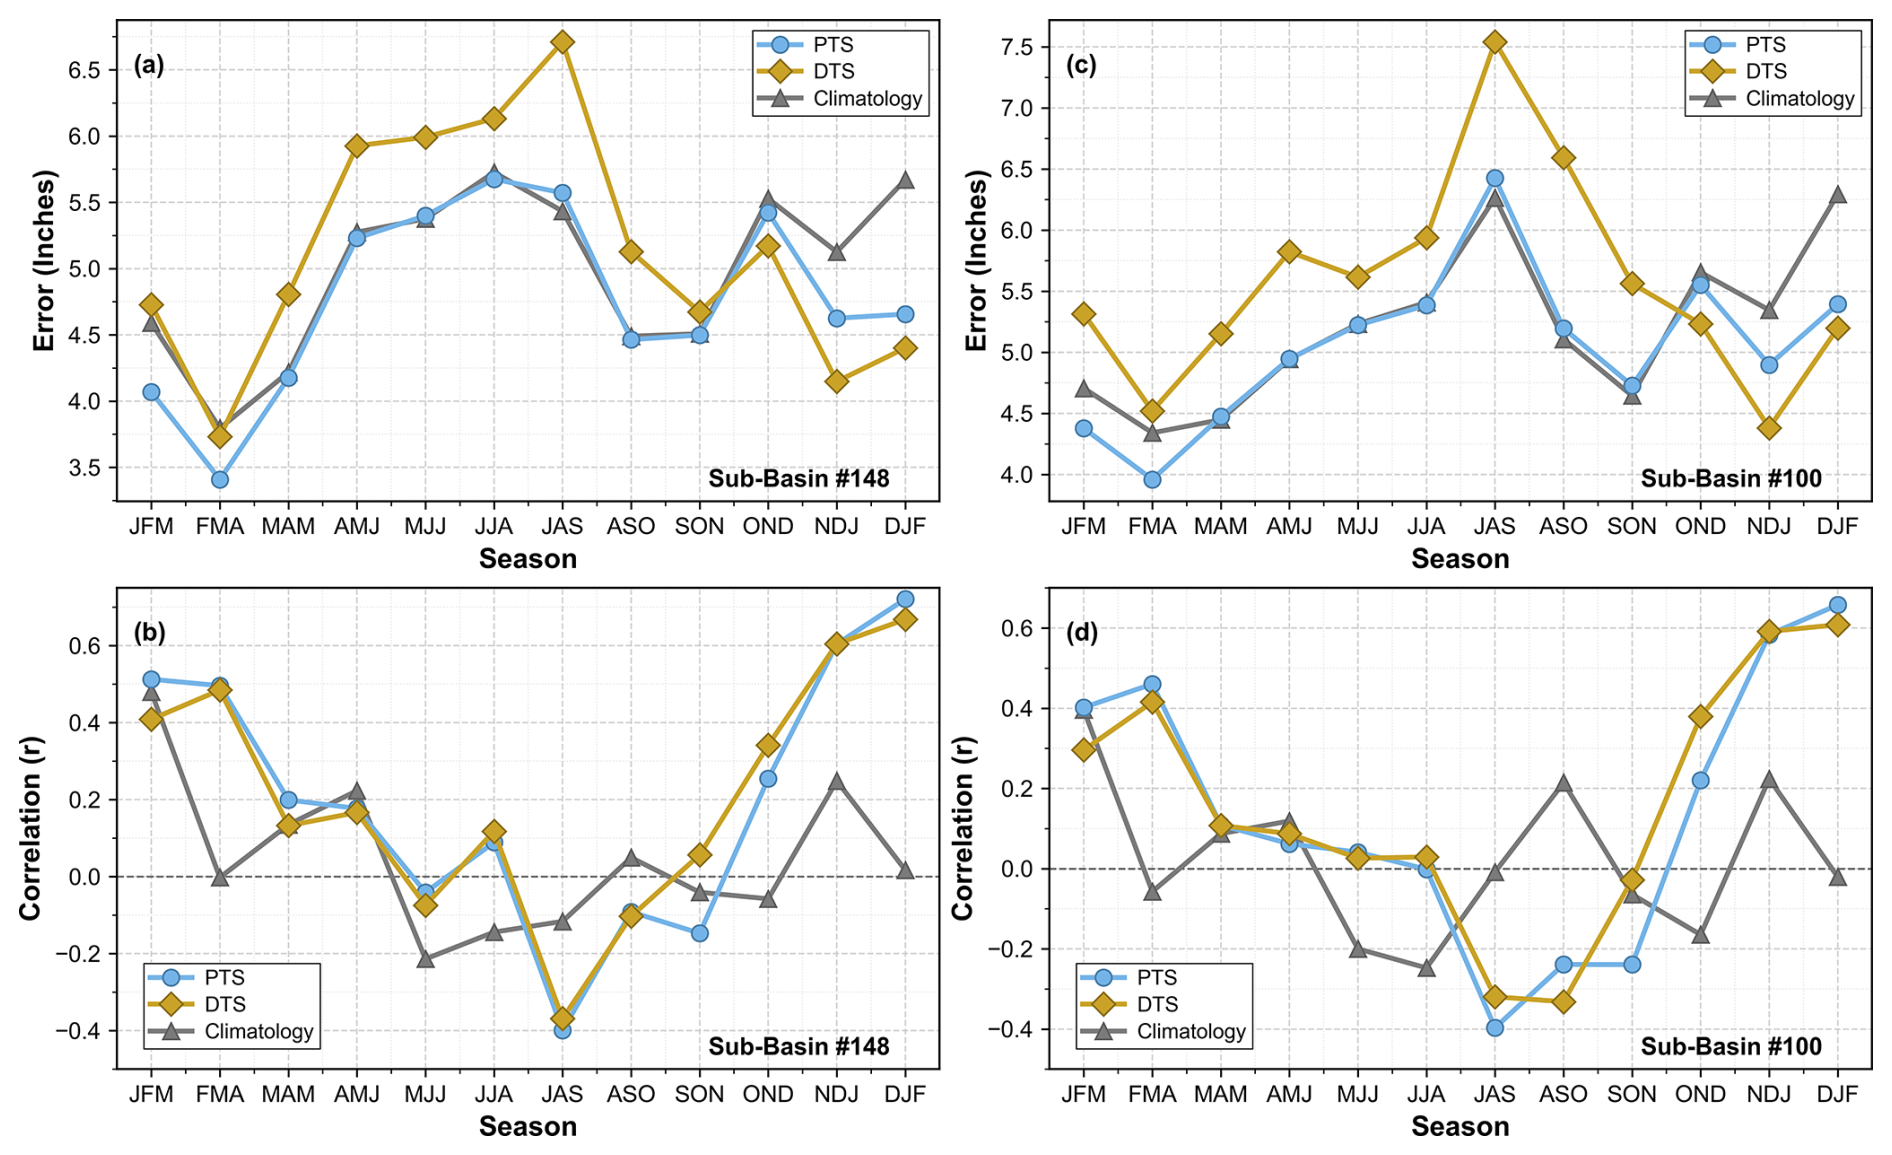
Figure 7Seasonal variation in forecast performance for proportional tercile sampling (PTS), dominant tercile sampling (DTS), and climatology sampling for sub-basin #148 (a, b) and sub-basin #100 (c, d). Panels (a) and (c) display the root mean square error (RMSE, in inches) for each season, while panels (b) and (d) show the Pearson correlation coefficient (r) between ensemble forecasts and observed precipitation from 1995 to 2019.
Figure 7 summarizes seasonal forecast skill using RMSE and Pearson correlation coefficient (r) for PTS, DTS, and climatology across sub-basins #148 and #100. Consistent with earlier RPSS diagnostics, the dry-season window, which spans OND, NDJ, DJF, and extends into JFM and MAM, exhibits the higher forecast skill. During this period, both CPC-informed methods (PTS and DTS) outperform climatology. At the onset of the dry season (OND), DTS achieves the lowest RMSE and highest correlation in both basins, maintaining its lead through NDJ and DJF. While PTS and DTS yield broadly comparable correlation values during these months, DTS consistently demonstrates a clear advantage in RMSE, reflecting the influence of strong large-scale climate signals such as El Niño.
In contrast, during late winter and spring (JFM–FMA–MAM–AMJ), when overall skill diminishes, PTS generally matches or exceeds climatology and outperforms DTS in both basins. As the wet-season begins (MJJ–JJA–JAS–ASO–SON), forecast performance deteriorates across all methods, with increased RMSE and near-zero or negative correlations. DTS frequently performs worse during this period, while PTS remains closest to the climatological baseline.
This study presents a comprehensive framework for applying NOAA's seasonal precipitation forecasts at the local scale and a thorough evaluation of the resulting localized forecasts. The evaluation of CPC 3-month precipitation outlooks at a 0.5-month lead for two basins in west-central Florida (Tampa Bay region) over the 1995–2019 period reveals that forecast skill is primarily concentrated in the dry half of the year. Non-equal chance (non-EC) outlooks were issued more frequently during late fall and winter, and verification confirms that OND, NDJ and DJF exhibit the strongest forecast performance, characterized by elevated Heidke Skill Scores, positive Ranked Probability Skill Scores, and strong categorical discrimination. In contrast, summer outlooks show minimal to no skill. Among forecast categories, above-normal (wet) forecasts are the primary contributors to wintertime skill, while below-normal (dry) forecasts demonstrate more modest but consistent performance throughout the dry season. Peak skill levels are closely aligned with El Niño winters, during which wet outcomes are more likely, a finding consistent with Infanti and Kirtman (2014), who documented elevated NMME skill during El Niño winters in the south-eastern United States.
To translate categorical outlooks into quantitative basin-scale precipitation forecasts, two non-parametric ensemble methods were assessed. PTS offers a conservative approach, yielding the lowest overall errors and highest robustness across all seasons. DTS, by contrast, generally outperforms PTS during high-skill periods (fall–winter), particularly in terms of RMSE and correlation. Based on these findings, a hybrid operational strategy is recommended: employ DTS during high-skill fall and winter months (OND, NDJ, DJF) to capitalize on strong climate signals, and apply PTS during spring, summer, and other low-skill periods to preserve consistency with the forecasted tercile probabilities. This adaptive approach is expected to improve the accuracy of hydrologic simulation, e.g., streamflow forecasts, and subsequently benefit water resources management, which will be the focus of an extended study. The major contribution of this study is the development of a strategic approach to apply NOAA's forecasts at the local scale. The proposed methods, along with the approaches for forecast evaluation, are general and readily applicable to other regions.
The precipitation forecast data used in this study are publicly available from NOAA CPC (https://ftp.cpc.ncep.noaa.gov/cpcfcsts/archives/long_lead/data/). Basin-scale observed precipitation data were obtained from Tampa Bay Water's rainfall dataset for the Integrated Northern Tampa Bay domain, available through Tampa Bay Water's data portal (https://tampabaywater.sharefile.com/share/view/f3376a6f07534256/focac193-6df5-48bf-b3c0-6f8e7614a15f, last access: 12 October 2025). Oceanic Niño Index (ONI) values used to identify ENSO episodes for each season were obtained from the NOAA CPC (https://www.cpc.ncep.noaa.gov/products/analysis_monitoring/ensostuff/ONI_v5.php, last access: 12 October 2025). The rainfall realizations for the two study basins will be made available on request.
MS conceptualized the study, curated the data, conducted the formal analysis, and prepared the original draft of the manuscript. HW contributed to the conceptualization of the study, provided supervision, and participated in manuscript review and editing. JSG, KP, TA, and FZ contributed to reviewing and editing the manuscript. DW contributed to the conceptualization and supervision of the study and participated in manuscript review and editing.
The contact author has declared that none of the authors has any competing interests.
Publisher's note: Copernicus Publications remains neutral with regard to jurisdictional claims made in the text, published maps, institutional affiliations, or any other geographical representation in this paper. The authors bear the ultimate responsibility for providing appropriate place names. Views expressed in the text are those of the authors and do not necessarily reflect the views of the publisher.
The authors would like to thank Tampa Bay Water for its support in conducting this research. The authors also acknowledge the University of Central Florida for institutional support.
This research has been supported by the Tampa Bay Water (grant no. 2024-017).
This paper was edited by Fuqiang Tian and reviewed by three anonymous referees.
Alexander, S. and Block, P.: Integration of seasonal precipitation forecast information into local-level agricultural decision-making using an agent-based model to support community adaptation, Climate Risk Management, 36, 100417, https://doi.org/10.1016/j.crm.2022.100417, 2022.
Barnett, T. P. and Preisendorfer, R.: Origins and Levels of Monthly and Seasonal Forecast Skill for United States Surface Air Temperatures Determined by Canonical Correlation Analysis, Mon. Weather Rev., 115, 1825–1850, https://doi.org/10.1175/1520-0493(1987)115<1825:OALOMA>2.0.CO;2, 1987.
Becker, E. and Van Den Dool, H.: Probabilistic Seasonal Forecasts in the North American Multimodel Ensemble: A Baseline Skill Assessment, J. Climate, 29, 3015–3026, https://doi.org/10.1175/JCLI-D-14-00862.1, 2016.
Bett, P. E., Scaife, A. A., Li, C., Hewitt, C., Golding, N., Zhang, P., Dunstone, N., Smith, D. M., Thornton, H. E., Lu, R., and Ren, H.-L.: Seasonal Forecasts of the Summer 2016 Yangtze River Basin Rainfall, Adv. Atmos. Sci., 35, 918–926, https://doi.org/10.1007/s00376-018-7210-y, 2018.
Doswell, C. A., Davies-Jones, R., and Keller, D. L.: On Summary Measures of Skill in Rare Event Forecasting Based on Contingency Tables, Weather Forecast., 5, 576–585, https://doi.org/10.1175/1520-0434(1990)005<0576:OSMOSI>2.0.CO;2, 1990.
Garcia, D., Rolim, J., Cameira, M. D. R., Belaud, G., Dalezios, N. R., Karoutsos, G., Santos, J. A., and Paredes, P.: Assessing seasonal forecast performance to predict crop irrigation requirements to support water management decision-making in the Mediterranean region, Agr. Water Manage., 313, 109467, https://doi.org/10.1016/j.agwat.2025.109467, 2025.
Graham, R. M., Browell, J., Bertram, D., and White, C. J.: The application of sub-seasonal to seasonal (S2S) predictions for hydropower forecasting, arXiv [preprint], https://doi.org/10.48550/arxiv.2108.06269, 2021.
GSI Environmental Inc.: Evaluation of rain gauge and Doppler radar data in the Integrated Northern Tampa Bay Hydrologic Model Domain, Tech. Rep., prepared for Tampa Bay Water, Clearwater, Florida, USA, https://tampabaywater.sharefile.com/share/view/65beb75f65584df0 (last access: 30 April 2026), 2021a.
GSI Environmental Inc.: Integration of rainfall data from rain gauges and Doppler radar in the Integrated Northern Tampa Bay Hydrologic Model Domain, Tech. Rep., prepared for Tampa Bay Water, Clearwater, Florida, USA, https://tampabaywater.sharefile.com/share/view/36cb78a35b924cc3 (last access: 30 April 2026), 2021b.
GSI Environmental Inc.: Supplemental report on integration of rainfall data from rain gauges and Doppler radar in the Integrated Northern Tampa Bay Hydrologic Model Domain for 2017 through 2019, Tech. Rep., prepared for Tampa Bay Water, Clearwater, Florida, USA, https://tampabaywater.sharefile.com/share/view/e5f63e07492d4c5d (last access: 30 April 2026), 2021c.
Hartmann, H. C., Pagano, T. C., Sorooshian, S., and Bales, R.: Confidence Builders: Evaluating Seasonal Climate Forecasts from User Perspectives, B. Am. Meteorol. Soc., 83, 683–698, https://doi.org/10.1175/1520-0477(2002)083<0683:CBESCF>2.3.CO;2, 2002.
Heidke, P.: Berechnung Des Erfolges Und Der Güte Der Windstärkevorhersagen Im Sturmwarnungsdienst, Geogr. Ann., 8, 301–349, https://doi.org/10.1080/20014422.1926.11881138, 1926.
Huang, Z. and Zhao, T.: Predictive performance of ensemble hydroclimatic forecasts: Verification metrics, diagnostic plots and forecast attributes, WIREs Water, 9, e1580, https://doi.org/10.1002/wat2.1580, 2022.
Hurkmans, R. T. W. L., Van Den Hurk, B., Schmeits, M., Wetterhall, F., and Pechlivanidis, I. G.: Seasonal Streamflow Forecasting for Fresh Water Reservoir Management in the Netherlands: An Assessment of Multiple Prediction Systems, J. Hydrometeorol., 24, 1275–1290, https://doi.org/10.1175/JHM-D-22-0107.1, 2023.
Infanti, J. M. and Kirtman, B. P.: Southeastern U.S. Rainfall Prediction in the North American Multi-Model Ensemble, J. Hydrometeorol., 15, 529–550, https://doi.org/10.1175/JHM-D-13-072.1, 2014.
Kirtman, B. P., Min, D., Infanti, J. M., Kinter, J. L., Paolino, D. A., Zhang, Q., Van Den Dool, H., Saha, S., Mendez, M. P., Becker, E., Peng, P., Tripp, P., Huang, J., DeWitt, D. G., Tippett, M. K., Barnston, A. G., Li, S., Rosati, A., Schubert, S. D., Rienecker, M., Suarez, M., Li, Z. E., Marshak, J., Lim, Y.-K., Tribbia, J., Pegion, K., Merryfield, W. J., Denis, B., and Wood, E. F.: The North American Multimodel Ensemble: Phase-1 Seasonal-to-Interannual Prediction; Phase-2 toward Developing Intraseasonal Prediction, B. Am. Meteorol. Soc., 95, 585–601, https://doi.org/10.1175/BAMS-D-12-00050.1, 2014.
Liu, J., Yuan, X., Zeng, J., Jiao, Y., Li, Y., Zhong, L., and Yao, L.: Ensemble streamflow forecasting over a cascade reservoir catchment with integrated hydrometeorological modeling and machine learning, Hydrol. Earth Syst. Sci., 26, 265–278, https://doi.org/10.5194/hess-26-265-2022, 2022.
Livezey, R. E. and Timofeyeva, M. M.: The First Decade of Long-Lead U.S. Seasonal Forecasts: Insights from a Skill Analysis, B. Am. Meteorol. Soc., 89, 843–854, https://doi.org/10.1175/2008BAMS2488.1, 2008.
MacLeod, D., Quichimbo, E. A., Michaelides, K., Asfaw, D. T., Rosolem, R., Cuthbert, M. O., Otenyo, E., Segele, Z., Rigby, J. M., Otieno, G., Hassaballah, K., Tadege, A., and Singer, M. B.: Translating seasonal climate forecasts into water balance forecasts for decision making, PLOS Clim., 2, e0000138, https://doi.org/10.1371/journal.pclm.0000138, 2023.
Mason, S. J., Ferro, C. A. T., and Landman, W. A.: Forecasts of “normal,” Q. J. Roy. Meteor. Soc., 147, 1225–1236, https://doi.org/10.1002/qj.3968, 2021.
Murphy, A. H. and Winkler, R. L.: A General Framework for Forecast Verification, Mon. Weather Rev., 115, 1330–1338, https://doi.org/10.1175/1520-0493(1987)115<1330:AGFFFV>2.0.CO;2, 1987.
Namias, J.: long range weather forecasting – history, current status and outlook1, B. Am. Meteorol. Soc., 49, 438–470, https://doi.org/10.1175/1520-0477-49.5.438, 1968.
Nicholls, N.: Long-range weather forecasting: Value, status, and prospects, Rev. Geophys., 18, 771–788, https://doi.org/10.1029/RG018i004p00771, 1980.
NOAA Climate Prediction Center: CPC verification summary: Tutorial (Heidke Skill Score), National Weather Service, National Centers for Environmental Prediction, https://www.cpc.ncep.noaa.gov/products/verification/summary/index.php?page=tutorial (last access: 12 October 2025), 2005.
NOAA Climate Prediction Center: Long-lead forecast tool discussion and analysis, National Weather Service, National Oceanic and Atmospheric Administration, https://www.cpc.ncep.noaa.gov/products/predictions/long_range/tools.html (last access: 12 October 2025), 2021.
NOAA Climate Prediction Center: Prognostic discussion for long-lead seasonal outlooks, National Weather Service, National Centers for Environmental Prediction, https://www.cpc.ncep.noaa.gov/products/predictions/long_range/fxus05.php (last access: 12 October 2025), 2019.
NOAA Climate Prediction Center: North American Multi-Model Ensemble (NMME), National Oceanic and Atmospheric Administration, https://www.cpc.ncep.noaa.gov/products/NMME/about.html (last access: 16 March 2026), 2025.
O'Lenic, E. A., Unger, D. A., Halpert, M. S., and Pelman, K. S.: Developments in Operational Long-Range Climate Prediction at CPC, Weather Forecast., 23, 496–515, https://doi.org/10.1175/2007WAF2007042.1, 2008.
Peng, P., Kumar, A., Halpert, M. S., and Barnston, A. G.: An Analysis of CPC's Operational 0.5-Month Lead Seasonal Outlooks, Weather Forecast., 27, 898–917, https://doi.org/10.1175/WAF-D-11-00143.1, 2012.
Portele, T. C., Lorenz, C., Dibrani, B., Laux, P., Bliefernicht, J., and Kunstmann, H.: Seasonal forecasts offer economic benefit for hydrological decision making in semi-arid regions, Sci. Rep., 11, 10581, https://doi.org/10.1038/s41598-021-89564-y, 2021.
Srikanthan, R. and McMahon, T. A.: Stochastic generation of annual, monthly and daily climate data: A review, Hydrol. Earth Syst. Sci., 5, 653–670, https://doi.org/10.5194/hess-5-653-2001, 2001.
Slater, L. J., Villarini, G., and Bradley, A. A.: Evaluation of the skill of North-American Multi-Model Ensemble (NMME) Global Climate Models in predicting average and extreme precipitation and temperature over the continental USA, Clim. Dynam., 53, 7381–7396, https://doi.org/10.1007/s00382-016-3286-1, 2019.
Turco, M., Marcos-Matamoros, R., Castro, X., Canyameras, E., and Llasat, M. C.: Seasonal prediction of climate-driven fire risk for decision-making and operational applications in a Mediterranean region, Sci. Total Environ., 676, 577–583, https://doi.org/10.1016/j.scitotenv.2019.04.296, 2019.
Van Den Dool, H. M. and Toth, Z.: Why Do Forecasts for “Near Normal” Often Fail?, Weather Forecast., 6, 76–85, https://doi.org/10.1175/1520-0434(1991)006<0076:WDFFNO>2.0.CO;2, 1991.
Wang, H.: Evaluation of monthly precipitation forecasting skill of the National Multi-model Ensemble in the summer season, Hydrol. Process., 28, 4472–4486, https://doi.org/10.1002/hyp.9957, 2014.
Wang, H. and Asefa, T.: Impact of different types of ENSO conditions on seasonal precipitation and streamflow in the Southeastern United States, Int. J. Climatol., 38, 1438–1451, https://doi.org/10.1002/joc.5257, 2018.
Wang, H., Asefa, T., Bracciano, D., Adams, A., and Wanakule, N.: Proactive water shortage mitigation integrating system optimization and input uncertainty, J. Hydrol., 571, 711–722, https://doi.org/10.1016/j.jhydrol.2019.01.071, 2019.
Wang, H., Asefa, T., and Duncan, J.: Event-based evaluation of operational ENSO forecasting models in 2002–2020: Implications for seasonal water resources management, J. Hydrol., 636, 131295, https://doi.org/10.1016/j.jhydrol.2024.131295, 2024.
Wilks, D. S.: Statistical methods in the atmospheric sciences: an introduction, Academic Press, San Diego, ISBN 978-0127519654, 1995.
Wilks, D. S. and Wilby, R. L.: The weather generation game: a review of stochastic weather models, Progress in Physical Geography: Earth and Environment, 23, 329–357, https://doi.org/10.1177/030913339902300302, 1999.
Wilks, D. S.: Statistical methods in the atmospheric sciences, 2nd edn., Elsevier, Amsterdam Paris, ISBN 978-0127519661, 2006.
Zhang, H. and Casey, T.: Verification of Categorical Probability Forecasts, Weather Forecast., 15, 80–89, https://doi.org/10.1175/1520-0434(2000)015<0080:VOCPF>2.0.CO;2, 2000.
Zhao, T., Bennett, J. C., Wang, Q. J., Schepen, A., Wood, A. W., Robertson, D. E., and Ramos, M.-H.: How Suitable is Quantile Mapping For Postprocessing GCM Precipitation Forecasts?, J. Climate, 30, 3185–3196, https://doi.org/10.1175/JCLI-D-16-0652.1, 2017.