the Creative Commons Attribution 4.0 License.
the Creative Commons Attribution 4.0 License.
 | 08 May 2026
Sensitivities of mean and extreme streamflow to climate variability across Europe
Anna Luisa Hemshorn de Sánchez
Wouter R. Berghuijs
Anne F. Van Loon
Dimmie Hendriks
Ype van der Velde
Understanding how streamflow responds to variability in climate is an important aspect of regions' hydrological resilience, particularly under climate change. Streamflow elasticities (ε) (or sensitivities) to climate describe observed percentage changes in river flow conditions per percentage change (or unit change) of a climate driver. Drawing on data from over 7000 catchments, this study provides the first pan-European quantification of elasticities of annual mean and extreme streamflow to annual and seasonal precipitation, and streamflow sensitivities to temperature. Results indicate that elasticities exhibit distinct regional patterns across Europe. Annual mean, maximum, and minimum flows generally increase with higher annual mean precipitation. A 1 % change in precipitation typically leads to an amplified flow response of > 1 % in mean flows (median elasticity: ), an even stronger amplification in maximum flows (), and a dampened response of < 1 % in minimum flows (). Temperature has a limited influence on annual streamflow, and its effects vary in sign (illustrated by both positive and negative sensitivities), but are relatively similar for mean, maximum, and minimum flows.
To assess regional differences in elasticities to precipitation, we use a random forest model that considers catchment characteristics beyond commonly studied climate factors. Results indicate that elasticities are not modulated by a single dominant characteristic but emerge with complex combinations of catchment characteristics, likely including influences not well captured by typically available characteristics (e.g., anthropogenic influences). By revealing regional and continental patterns of amplified and dampened streamflow response across Europe, this research provides valuable insights into the hydrological resilience of mean and extreme flows to climate variability and climate change, and offers support for targeted water management and disaster risk mitigation.
- Article
(9893 KB) - Full-text XML
-
Supplement
(16216 KB) - BibTeX
- EndNote


Understanding controls on streamflow variability is crucial for water resource management, disaster risk management, food security, energy production, ecosystems, and the economy. Despite the high confidence that mean and extreme streamflow will change with climate change, the magnitude and even the sign of change remains uncertain in many regions (Caretta et al., 2022). Projections of future streamflow conditions integrate projected climate scenarios with catchment responses to these scenarios (Eisner et al., 2017; Samaniego et al., 2017, 2019). Isolating the sensitivity of streamflow to climate perturbations can constrain the uncertainties in this component of earth-system projections by serving as a validation metric (Sankarasubramanian et al., 2001). More broadly, such sensitivity estimates help identify locations that are inherently more sensitive to climate variability.
Precipitation and temperature are two key controls on streamflow (Fu et al., 2007; Sankarasubramanian et al., 2001; Vano et al., 2012, 2015), and their effects on streamflow can be quantified using streamflow elasticities or sensitivities. Streamflow elasticities describe the percentage change of a streamflow variable (e.g. annual mean streamflow) per percentage change of a climate variable (e.g. annual mean precipitation) (Schaake, 1990). Similarly, streamflow sensitivities describe the percentage change of streamflow per unit change of the climate variable (e.g. °C), which is commonly applied for temperature. With the climate becoming more extreme (Seneviratne et al., 2021), elasticities and sensitivities help to identify how streamflow will respond to such conditions. Streamflow elasticities to precipitation and sensitivities to temperature can vary widely across different climates and catchment characteristics, highlighting the need to investigate spatial patterns that emerge for a wider range of climates and hydrological settings (Anderson et al., 2024; Němec and Schaake, 1982).
Several studies report positive streamflow elasticities to precipitation and mainly negative streamflow sensitivities to temperature of mean annual flows across the USA, with substantial regional differences (Anderson et al., 2024; Awasthi et al., 2024; Vano et al., 2012, 2015). Streamflow elasticities to precipitation tend to vary strongly with the flow percentile and over different seasons, highlighting that the typically used annual mean values alone give an incomplete image (Anderson et al., 2024). Chiew et al. (2006) studied 500 catchments across the globe and found precipitation elasticities ranging from 1.0 to 3.0, whereby catchments with a lower runoff ratio are more responsive to precipitation variations. However, they focus on elasticities of annual mean flows to annual mean precipitation only and have a limited spatial coverage. Potter et al. (2011) found that in Australia the streamflow elasticity to precipitation during the Millennium Drought was related to precipitation. Alternatively, the Budyko framework has been used to assess the relative importance of changes in precipitation, potential evaporation, and other factors influencing precipitation partitioning (e.g. climate seasonality, soils, vegetation, topography) to streamflow at the global scale (Berghuijs et al., 2017). For Europe, there are regional (Andréassian et al., 2016; Weiler et al., 2025) and local (Dallan et al., 2025) elasticity studies, but a pan-European overview is lacking. This could reveal the gradients and variability occurring across Europe and help unravel characteristics that shape the elasticities. While several studies link elasticities to catchment characteristics, these links remain incomplete, as they generally only explore a small number of climatic and hydrological catchment properties that may shape elasticity values (Anderson et al., 2024; Chiew, 2006; Sankarasubramanian et al., 2001; Tang et al., 2019; Zheng et al., 2009).
Many of these elasticity studies are model based (Berghuijs et al., 2017; Sankarasubramanian et al., 2001; Vano et al., 2012, 2015), which makes the results strongly dependent on the choice of model and underlying assumptions (Sankarasubramanian et al., 2001; Vano et al., 2012). In rainfall-runoff models, the constraining parameters cannot be measured directly (due to spatial variability) and are hard to derive from field observations, resulting in more uncertainty in parameter estimates and model performance (Peters-Lidard et al., 2017). Further, model-based elasticity studies necessitate an initial validation process using observations. In contrast, calculating elasticities directly with observed data, only requires the modelling assumption of linearity and, therefore, allows the data to strongly shape the relationship between the two variables of interest based on past data (Andréassian et al., 2016). This observation-based approach is particularly advantageous for large-scale regional analyses, as it is model-independent, simple to apply, and transferable across many catchments (Chiew, 2006). Newly published large-scale datasets like the CARAVAN dataset (Kratzert et al., 2023) and the European streamflow dataset EStreams (do Nascimento et al., 2024) provide the opportunity to study observation-based elasticities at a large scale.
Given the lack of a pan-European overview of sensitivities of mean and extreme flows to climate, and the limited understanding of what shapes spatial differences in these streamflow sensitivities, here, we quantify streamflow elasticities to precipitation and streamflow sensitivities to temperature across Europe for mean and extreme flows. As reduced streamflow sensitivities to climate fluctuations can also be understood as a measure of catchment resilience (Botter et al., 2013; Zhang et al., 2022), we can combine the calculated elasticities of maximum and minimum flows to precipitation to assess whether a catchment is resilient in one of the two flow extremes, in both or in none. Further, we assess what shapes regional differences in these elasticities. We make use of the European streamflow dataset EStreams (do Nascimento et al., 2024), which allows us to analyse the elasticities of thousands of catchments across different climates and landscapes in Europe.
2.1 Data
We analyse a wide range of European catchments using streamflow, catchment-aggregated hydro-climatic and landscape variables from the EStreams dataset Version 1.3 (do Nascimento et al., 2024). The meteorological data in EStreams represent catchment averages derived from 0.25°-gridded daily Ensemble Observations (E-OBS) data (Cornes et al., 2018). We use these daily precipitation and temperature timeseries and aggregate them to hydrological years (November–October). Yearly values are only computed if there is a minimum of 330 daily values in that year. For seasonal analyses, we aggregate the daily timeseries to 6-month seasons for the cold season (November–April) and the warm season (May–October). Seasonal values are only computed if there is a minimum of 165 valid daily values in that season.
As the meteorological data covers 1950 to 2023, we also use the EStreams streamflow timeseries only within this range. We use a two-step quality control to the streamflow timeseries to set unrealistic periods of zero flow to nans. First, we identify years with at least 11 months of zero flow. If the beginning of such a period directly follows a flow rate exceeding Q5, the entire period of zero values is set to nan. For these streamflow data, we aggregate monthly values to annual, using hydrological years. We specify that at least 11 valid monthly data points per year are needed to calculate an annual value, avoiding seasonal bias. At least 15 valid annual values are needed to retain the catchment for the analysis. Further, we filter the catchments based on a visual inspection of hydrographs (e.g. repeating value, frequent gaps, magnitude shift, binary pattern) and by omitting catchments with runoff coefficients exceeding 1.5 (because they indicate implausible runoff relative to precipitation) or with more than 61 d (2 months) in a year flagged as suspicious days in the EStreams dataset. This reduces the number of catchments from 17 130 to 7519. The median catchment area of the selected catchments is 249.9 km2 (5th percentile: 25.5 km2; 95th percentile: 12 402.9 km2) (see histogram of the catchment areas in Fig. S1 in the Supplement).
The annual maximum flow is based on the 1 d maximum, and the annual minimum flow is based on the 7 d minimum in each hydrological year. A comparison of the annual 1 d minimum and annual 7 d minimum yielded very similar results. We choose the 7 d minimum, calculated from a 7 d moving average to reduce short-term disturbances (Laaha et al., 2017).
2.2 Estimating sensitivity of mean and extreme annual flows to climate
Precipitation is commonly the dominant driver of streamflow variations at the annual scale (Fu et al., 2007; Sankarasubramanian et al., 2001). A secondary climate driver of streamflow is temperature, which has been described as a key control of streamflow and its variability (Fu et al., 2007; Vano et al., 2012, 2015). We analyse how streamflow in each catchment varies with both variables simultaneously (Fig. 1). First, we normalize streamflow and precipitation timeseries per catchment with their long-term mean (of overlapping years). For streamflow, we normalize annual mean (Qmean), annual maximum (Qmax) and annual minimum (Qmin) streamflow with their corresponding long-term means. For precipitation, we normalize annual mean precipitation and seasonal mean precipitation. For temperature, we use non-normalized annual and seasonal mean temperatures instead of normalized ones because 0 °C is an arbitrary reference point rather than a physical absence (unlike 0 mm of precipitation, which represents no precipitation). Normalizing temperature with the arbitrary reference point would introduce a misleading scale and distort physically meaningful differences. Next, we calculate the streamflow elasticity to precipitation ε per catchment expressing the percentage change in streamflow per 1 % change in precipitation, and the streamflow sensitivity to temperature ζ expressing the percentage change in streamflow per 1 °C change in temperature using this function for a multiple linear regression analogous to the approach of Sankarasubramanian et al. (2001) and Chiew (2006):
where Qn(t) describes the normalized annual streamflow at time t, which can represent the annual mean flow, the annual 1 d maximum flow, or the annual 7 d minimum flow. The variable Pn(t) describes the average normalized annual (or seasonal) precipitation, the term α0 is the intercept and the term η describes the unexplained variability. The variable T(t) describes the average non-normalized annual (or seasonal) temperature. We solve for ε and ζ using the ordinary-least-square method (OLS) from the statsmodel.api python package (Perktold et al., 2024). We apply a bi-variate approach, as this gives more robust estimates (Andréassian et al., 2016). We also test an alternative approach to test the robustness of the results, computing the linear regression in a hierarchical manner (Sect. S2 in the Supplement).
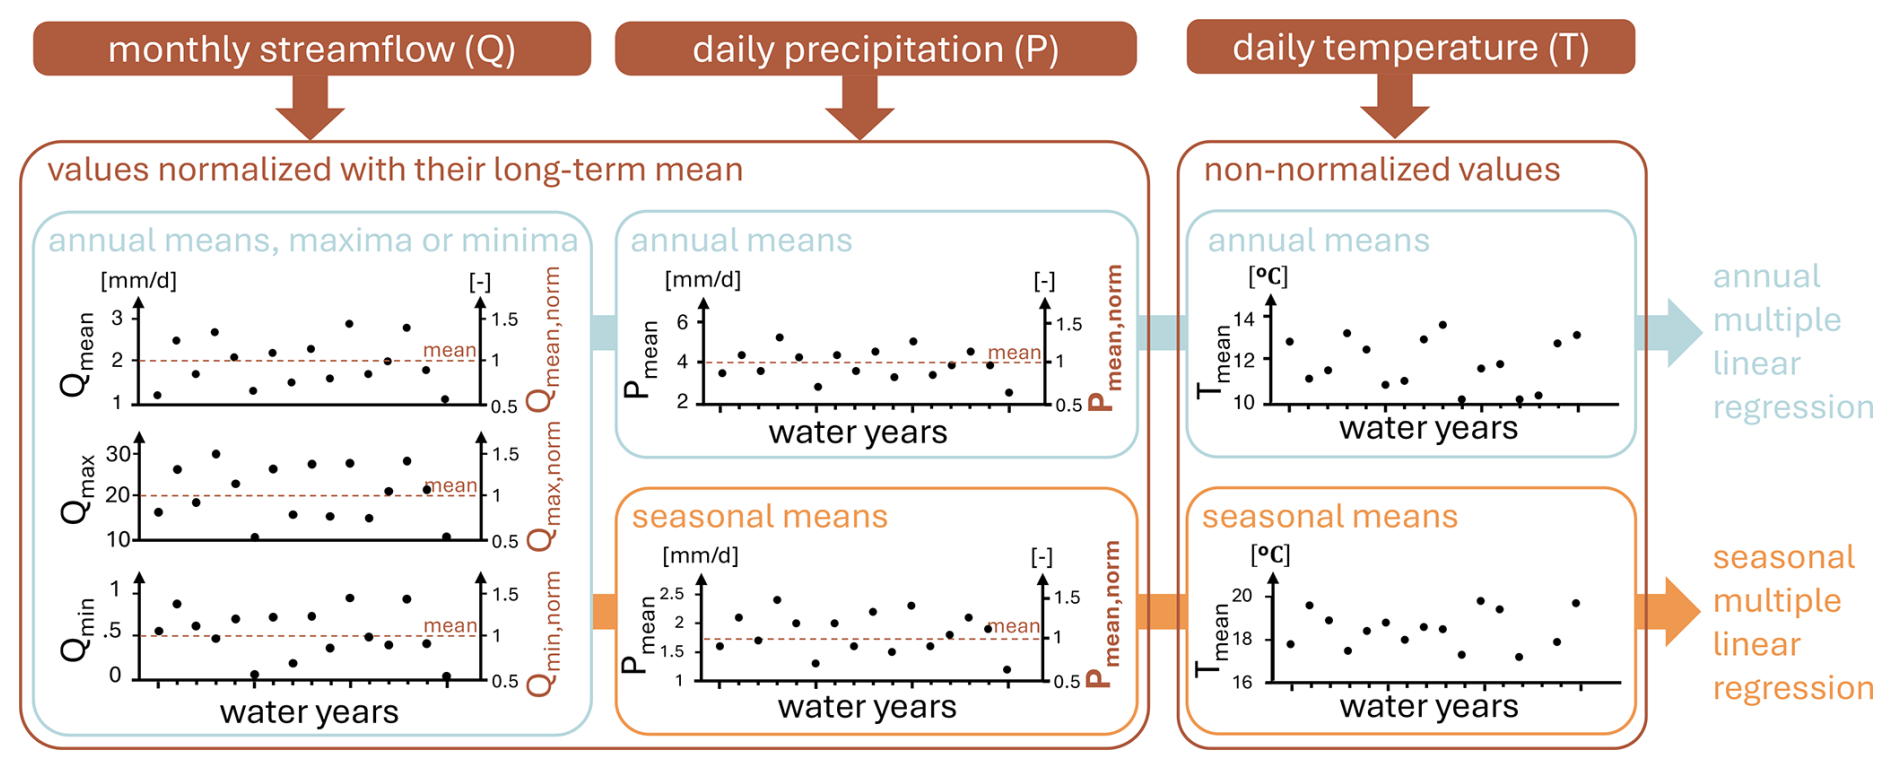
Figure 1Example overview of timeseries used for the annual and seasonal multiple linear regressions used to calculate elasticities and sensitivities. Monthly streamflow timeseries of mean, maximum, and minimum flow are aggregated to hydrological years and normalized with their long-term mean. Similarly, daily mean precipitation timeseries are aggregated to annual, cold-season (November–April) and warm-season (May–October) means and normalized by their long-term mean. Daily mean temperature is also aggregated to annual, cold-season and warm-season means but not normalized.
Note that, despite resulting in less intuitive sensitivity units (°C−1), we choose temperature over potential evapotranspiration as a driver of streamflow for two reasons. First, the estimates for potential evapotranspiration can lead to a range of different values depending on the calculation used (Fisher et al., 2011), whereas temperature is less uncertain. Second, future climate scenarios are often expressed in changes of temperature (Vano et al., 2012, 2015), making our results more relatable to future scenarios compared to future estimates of potential evapotranspiration.
Streamflow elasticities to precipitation can shift depending on the temporal scales over which they are calculated (Zhang et al., 2022). For Europe, elasticities remain stable or grow when considering timescales longer than a year (Zhang et al., 2022). Here, we focus on the annual and seasonal (6-months) scales. For the seasonal scale, we analyse how sensitive annual streamflow is to a seasonal climate variable. The seasonal analysis can enhance the understanding of annual elasticities, especially in regions with strongly seasonal streamflow. This is particularly relevant given that, in Europe, different seasons have experienced distinct trends in precipitation and temperature (Moberg et al., 2006).
As a description of how well precipitation and temperature explain variabilities of annual streamflow, we calculate the R2 value. We calculate the R2 three times: for the multiple linear regression model using both precipitation and temperature, using precipitation only and using temperature only (Fig. S5). We consider precipitation elasticities and temperature sensitivities statistically significant when their two-tailed p-value is below 0.05 (t-tests are calculated using the statsmodel.api.OLS python package testing for H0: ε= 0 or ζ= 0).
2.3 Seasonal dominance
We calculate which catchments are more dominated by the elasticities of cold-season precipitation or warm-season precipitation, using seasonal dominance (s):
where εc is the cold-season elasticity and εw the warm-season elasticity to precipitation. A s-value of +1 would indicate that the streamflow is completely dominated by the cold-season elasticity and a value of −1 would indicate that the streamflow is completely dominated by the warm-season elasticity. We exclude catchments where the elasticity value in either of the two season is a nan value due to insufficient monthly data or smaller than −0.5 as more negative elasticities are less feasible physically. This means that we exclude 125, 340 or 473 catchments, respectively, for the analysis of mean, maximum, and minimum flows.
2.4 Catchment characteristics shaping elasticities
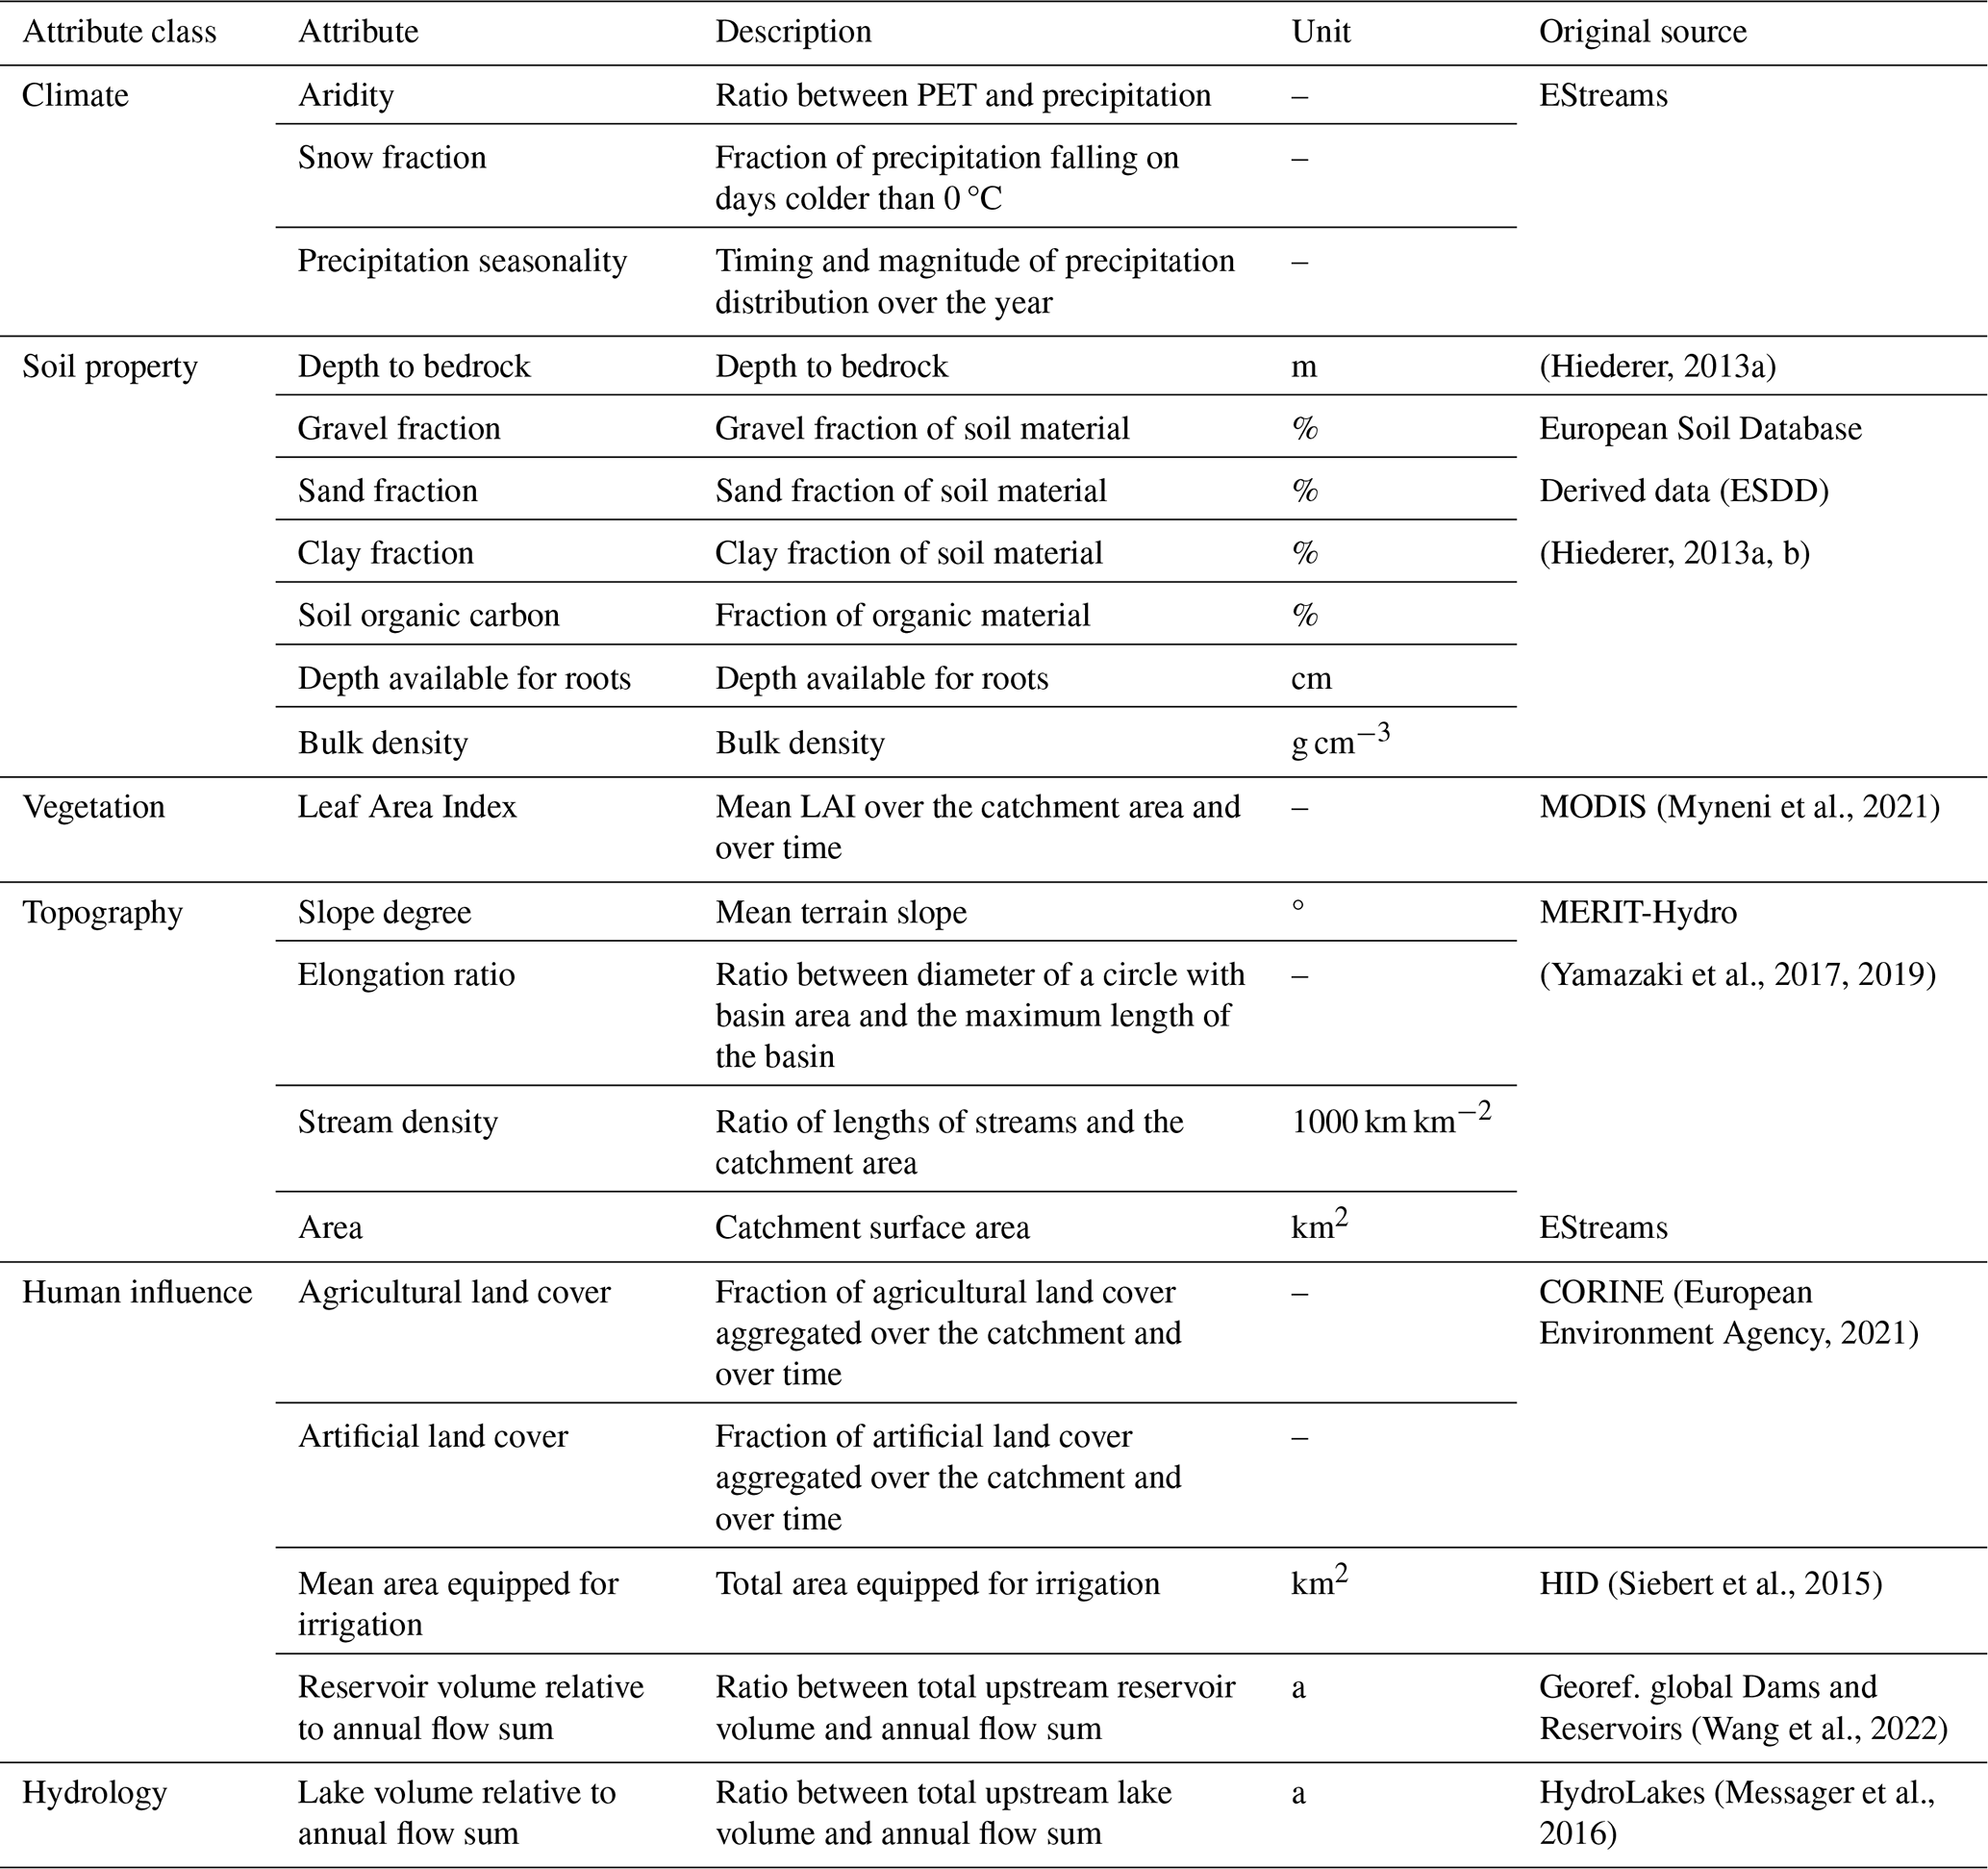
When analysing annual elasticities across a very wide climate range (e.g. global), differences in elasticities tend to be climate dominated (Chiew et al., 2006). The influence of landscape and soil, although recognised, remains underexplored and requires further considering a wider range of catchment characteristics (Gong et al., 2022; de Lavenne et al., 2022). In explaining elasticities, we focus on streamflow elasticity to precipitation, as this controls most variability of streamflow (R2 values in Fig. S8). To follow a hypothesis-oriented approach when selecting catchment descriptors (Tarasova et al., 2024), we select 20 different catchment characteristics describing the climate, soil properties, land cover, topography, human modification and hydrological signatures (Table 1) that relate to hydrological functions that can influence the amplification or dampening of rainfall variability (Müller et al., 2021). We select three typically used climate attributes that influence the partitioning of precipitation (aridity) and streamflow seasonality (snow fraction, and precipitation seasonality). We also select six attributes describing soil properties (depth to bedrock, soil fractions, soil organic carbon, bulk density, and depth available for roots) and one vegetation attribute (Leaf Area Index). These give an indication of the effective soil-vegetation water storage and buffering capacity, and the coupling strength between precipitation variability, evapotranspiration, and runoff. To represent the topography, we select four attributes that relate to drainage efficiency and catchment scale (slope, elongation ratio, stream density, area). We select four human-influence attributes which relate to precipitation partitioning (anthropogenic land cover), catchment storage (reservoir volume), and additional inputs to the hydrological system (area equipped for irrigation). Finally, we select lake volume as a hydrological attribute which affects available catchment storage. Beyond the 20 selected characteristics, we exclude parameters that are too strongly correlated (spearman ρ > 0.8) to other attributes (e.g., NDVI). We verify that none of the parameters excessively inflates the variance of the regression coefficient due to multicollinearity by setting the maximum accepted Variance Infiltration Factor (VIF) to 9 avoiding high multicollinearity. Further, we exclude parameters where a physical connection to streamflow elasticity is too indirect (e.g., elevation), or streamflow signatures that are derived from streamflow timeseries (e.g., baseflow, Fig. S10).
Table 1Overview of attributes derived from the EStreams dataset used in the random forest model with their corresponding attribute class and unit adapted from EStreams (do Nascimento et al., 2024). For time-varying variables (e.g., LAI, mean irrigation area), long term-means are used.
For the elasticities of annual mean, maximum, and minimum streamflow, we train a random forest model using scikit-learn v1.3.0 (Pedregosa et al., 2011) using a random seed of 42 to initiate the model. Model performance is evaluated using nested 5×5 cross-validation. Hyperparameters are tuned using inner 5-fold cross-validation with the parameters given in Table S1 using GridSearchCV from scikit-learn. The generalization performance is assessed on outerfolds providing the mean R2 and standard deviation.
3.1 Elasticities of annual mean and extreme streamflow to annual precipitation
Elasticities of annual mean, maximum, and minimum flows to mean annual precipitation are almost always positive and vary systematically across Europe (Fig. 2). Annual mean and maximum flows tend to be amplified compared to precipitation changes (, whereas annual minimum flows typically are dampened () (Fig. 2a). Mean elasticities tend to be slightly exceeding the medians and can be used to compare elasticities to other studies that also used means to summarise the range of elasticity values. The observed range (mean ± standard deviation: 1.20±0.53) of elasticities of annual mean flows to precipitation, including both statistically significant and insignificant elasticities, is broadly consistent with those reported for approximately 80 European catchments (Chiew et al., 2006), a global study (approx. 1.45±0.40) (Zhang et al., 2022) and studies in the USA (Anderson et al., 2024; Awasthi et al., 2024). The elasticities identified in our study tend to be slightly higher than previously reported values for France (Andréassian et al., 2016). The range of elasticities of maximum flows (1.38±0.95) is comparable to those previously reported across the contiguous USA, while the range of elasticities of minimum flows (1.01±0.95) is narrower than previously reported (Anderson et al., 2024).
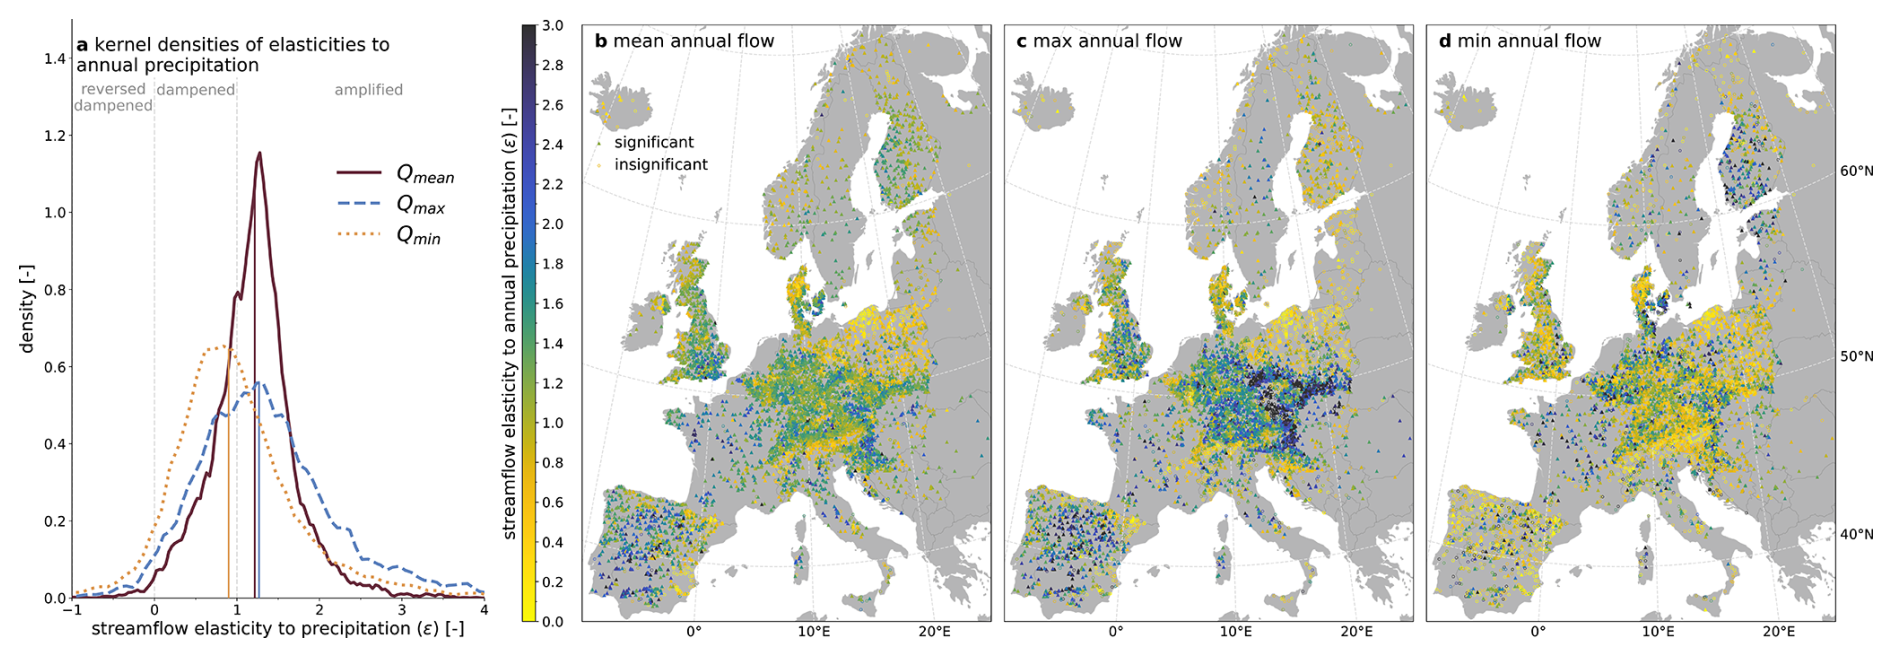
Figure 2Frequency distribution (a) and spatial distributions (b–d) of annual mean (b), maximum (c), and minimum (d) streamflow elasticity to the annual mean precipitation. The vertical lines in the frequency distribution plot indicate medians of the elasticity distributions. The fractions of statistically significant values are 0.89 (mean annual flow), 0.67 (maximum annual flow) and 0.61 (minimum annual flow). Elasticities are largely uncorrelated with precipitation station density (Fig. S4).
The degree of spatial consistency of elasticity values varies between mean, maximum, and minimum flows. Elasticities of mean and maximum flows tend to be more uniform across nearby catchments, suggesting that large-scale drivers, such as climate, shape them. In contrast, elasticities of minimum flows show stronger heterogeneity in space, which indicates that the response is more dominated by smaller-scale drivers, such as landscape properties and anthropogenic influences.
The regional patterns of elasticities in mean and maximum flows are comparable. Both annual mean and maximum flows are relatively sensitive to annual mean precipitation in the southern parts of the Continental Zone (Carpathians, Germany, Czechia, and Slovakia) and western parts of the Maritime South and Mediterranean (Spain and France) (see Fig. S6 for a map of the environmental zones by Metzger (2018) used here to refer to geographic regions). These are regions that tend to have smaller depth to bedrock (see Sect. S9), typically associated with limited groundwater and soil moisture storage capacities which could indicate less storage buffering at annual time scales (for a quantitative comparison of these elasticities to the catchment characteristics see Sect. 3.4). Annual mean and maximum flows are less sensitive to annual mean precipitation in northern parts of the Continental Zone (Poland), the eastern Atlantic North (Denmark), the Boreal North (Norway), the Boreal South (Alps), and southern parts of the Maritime South (eastern Spain). Regions with lower elasticity values exhibit a higher proportion of statistically insignificant elasticities. However, the fact that low elasticities are regionally consistent suggests that elasticity values are actually low and reflect that precipitation is a weak driver of annual streamflow variations in those regions. These regions of low elasticities also coincide, to some extent, with larger depths to bedrock. There also seems to be a strong spatial overlap with wetlands and, specifically, with peatlands (Tegetmeyer et al., 2025). Peatlands often attenuate precipitation peaks due to their high water-holding capacity and the slow release of water (Karimi et al., 2023). The lower streamflow elasticities in the Alps could also be related to the presence of fractured bedrock, enhanced permeability, and deep infiltration, that could contribute to lower contributions of recent rainfall in their streams (Jasechko et al., 2016). In addition, the higher snow fraction in this region could partly decouple annual precipitation from annual streamflow.
Elasticities of minimum flows (Fig. 2d) are distinctively different from those of mean and maximum flows (Fig. 2b–c). They tend to have stronger storage-induced annual memory than mean or maximum flows (Berghuijs et al., 2025a), making them more dependent on longer-term storage variations and partly decoupling them from annual precipitation changes. Catchments with larger subsurface storage capacities can often buffer more of the precipitation variability over annual timescales (Van Loon et al., 2024), leading to lower annual elasticities. This is, for example, consistent with lower elasticities in areas of deeper bedrock (e.g. Poland and Denmark). In places where minimum flows occur during winter (e.g. the Alps), these flows result from long periods of below-zero temperatures (Floriancic et al., 2021; Laaha and Blöschl, 2006), which makes them temperature controlled, and thus precipitation elasticities are low. In addition, precipitation in the Alps is summer dominated (see precipitation seasonality in Fig. S9), further decoupling annual precipitation amounts from low flows.
Note that the elasticities estimated here at the annual scale may differ when using multi-year aggregation periods. This is particularly relevant for minimum flows, which tend to retain a stronger memory of preceding conditions than mean or maximum flows (Berghuijs et al., 2025a). Consequently, minimum-flow elasticities at longer aggregation timescales may be higher than mean or maximum flows.
For all three streamflow elasticities there are very few (statistically insignificant) negative values, similar to Anderson et al. (2024) and Fu et al. (2007). However, some hydrographs do not display any obvious measurement errors (but there may be some). For these cases without obvious measurement errors, possible causes of negative elasticities could be anthropogenic influences such as the regulation of reservoirs (Bai et al., 2024).
Streamflow elasticities of annual maximum flows to precipitation follow a similar spatial and frequency distribution to the ones of annual mean flows (Fig. 2b and c). This similarity could be the result of wetter (drier) years leading to a wetter (drier) landscape that produces larger (smaller) maximum flows. Alternatively, the mean precipitation of a hydrological year could be positively correlated with maximum precipitation (Räisänen et al., 2004). In that case, elasticities of maximum flows may reflect the sensitivity to maximum precipitation rather than mean precipitation. While the correlation between annual mean and maximum precipitation is on average moderate (mean spearman ρ=0.42), the correlation strength between mean and maximum precipitation only weakly affects the elasticities of maximum flow (ρ=0.14) (see more details in Sect. S7). This indicates that in some regions of Europe with summer-dominated rainfall the correlation of maximum and mean precipitation may contribute to higher elasticities. However, across the scale of Europe, the mechanism of wetter (drier) years leading to a generally wetter (drier) landscape that produces larger (smaller) maximum flows might play a more dominant role. This would be consistent with earlier work (Berghuijs et al., 2019; Blöschl et al., 2017) that emphasizes few annual maximum flows result from annual maximum precipitation but instead often arise through sub-extreme precipitation falling on an already-wet landscape.
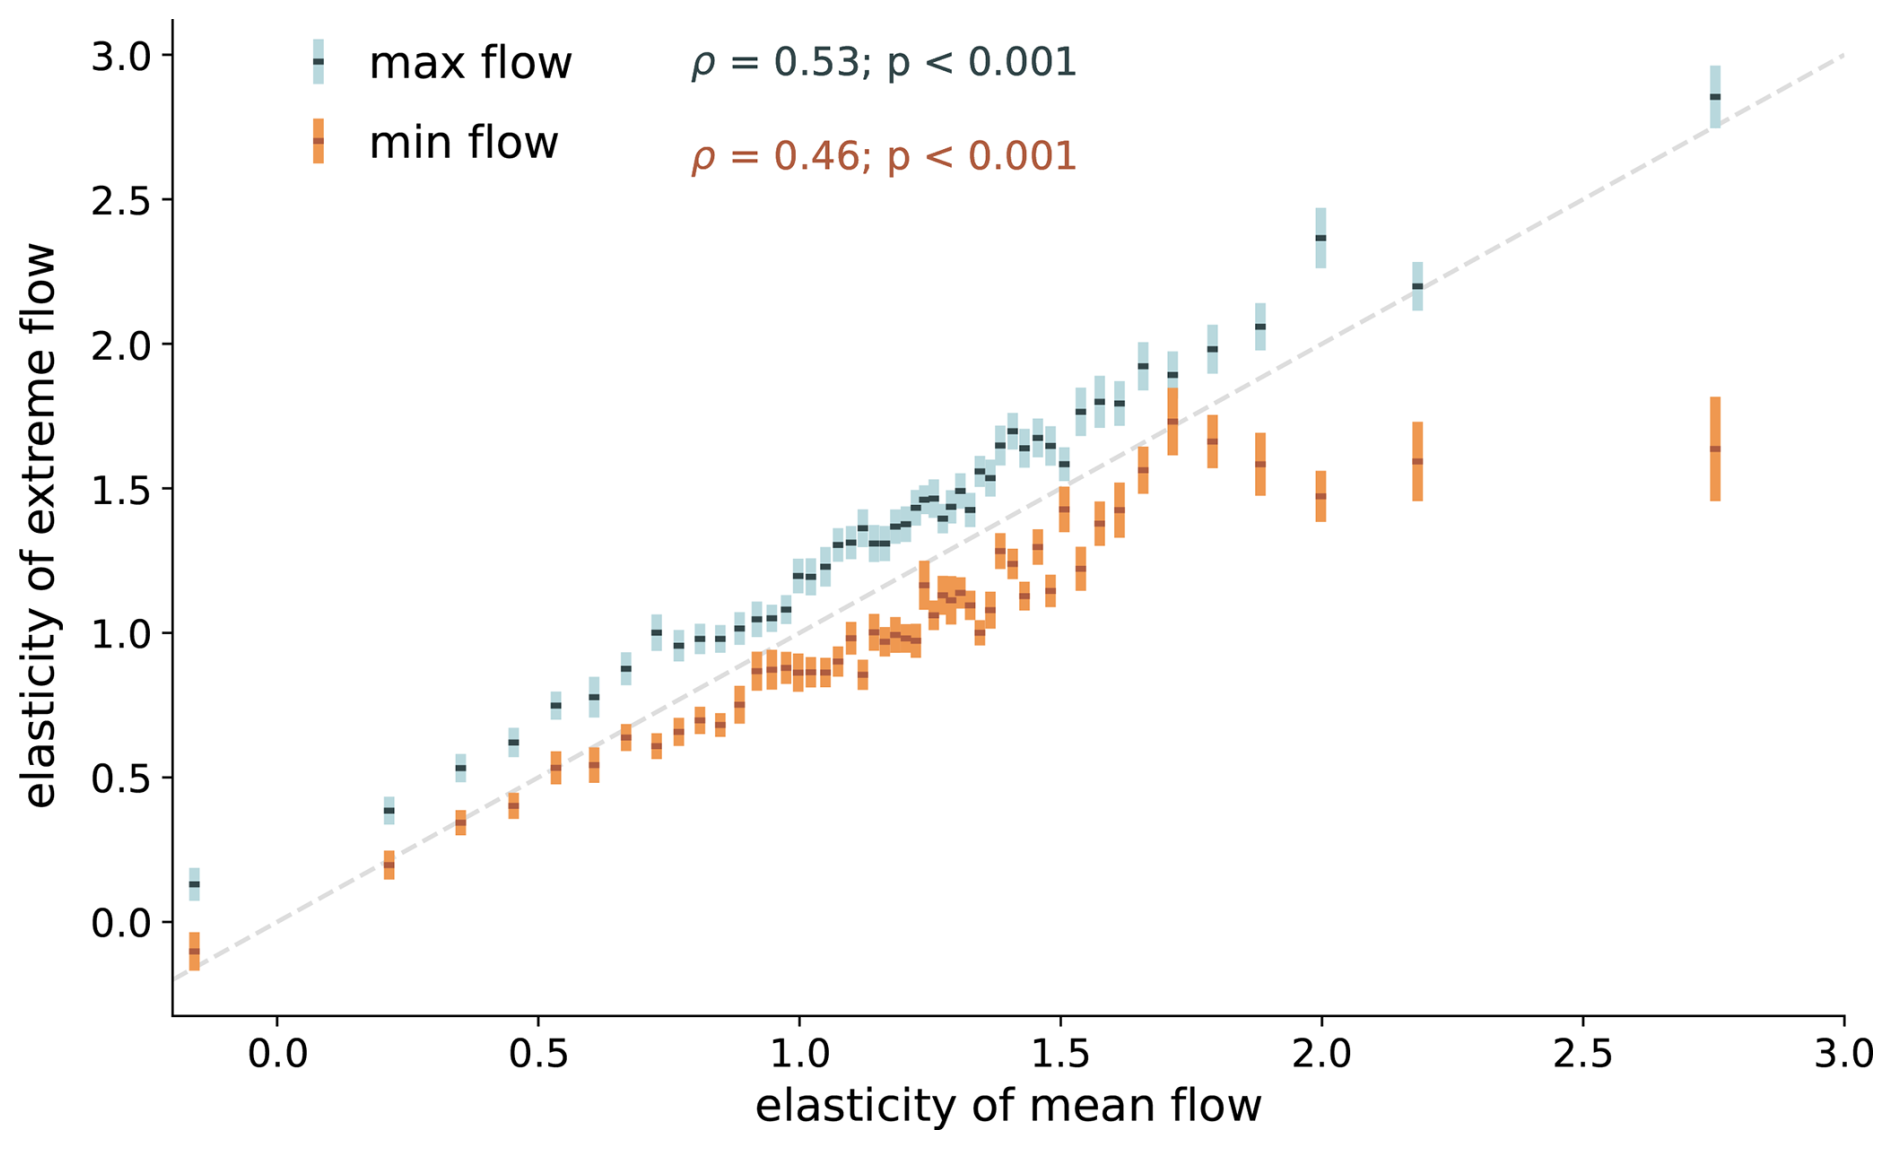
Figure 3Relationship of annual elasticities of mean flow and annual elasticities of maximum flow (blue) and minimum flow (orange) to annual precipitation. Precipitation elasticities of mean flows are discretized into bins of 2 %. The error bars display the standard error of the mean for each bin. The bins are based on the order of the elasticities of mean flow, which is why these lowest (highest) elasticities of mean flow are not necessarily the lowest (highest) elasticities of extreme flow. The spearman correlations coefficients are of the data without binning.
Catchments with higher elasticities of mean annual flows are also places where extreme annual flows are more sensitive to mean precipitation (Fig. 3). This indicates that a catchment's elasticity to precipitation is linked across mean and extreme flows. For most catchments, elasticities of maximum flows exceed those of mean flows, while the minimum flows tend to be less sensitive, especially for the catchments where elasticities of mean flow exceed 1.7. The higher elasticities for maximum compared to mean flows are consistent with the observation that the response of streamflow tends to be non-linear (responses are not always proportional to the rainfall input) and nonstationary (responses can vary with ambient conditions, for example, soil moisture conditions) (Berghuijs et al., 2019; Blöschl et al., 2017; Tromp-Van Meerveld and McDonnell, 2006). Annual means are the total result of a wide range of events, whereas annual maxima capture “extreme” conditions. Consequently, such nonlinearity and nonstationarity will likely have a larger effect for extremes than means and are thus also associated with larger elasticities. This is also reflected in annual flood regimes being typically more variable than annual flow regimes (Blöschl et al., 2013).
3.2 Elasticities of annual mean and extreme streamflow to seasonal precipitation
We now analyse the annual streamflow response to seasonal precipitation to understand if the precipitation of a particular season is more important for the annual elasticities. The elasticity of annual streamflow to cold-season (November–April) precipitation (Fig. 4a–d) has comparable regional patterns in elasticities of mean and maximum flows. These regional differences are largely similar elasticities to annual precipitation (Fig. 2). However, cold-season precipitation variability is typically dampened in annual mean and maximum flows (Fig. 4a), while annual precipitation variability is amplified in the flow signal. Catchments typically dampen variations of annual minimum flows compared to cold season precipitation as well and their elasticities are generally much lower than for mean and maximum flows. Similar to streamflow elasticities to annual precipitation, elasticities of minimum flows to cold-season precipitation are spatially more heterogeneous than for mean and maximum flows. Cold-season elasticity to precipitation has similar regions of higher elasticities as the annual elasticities.
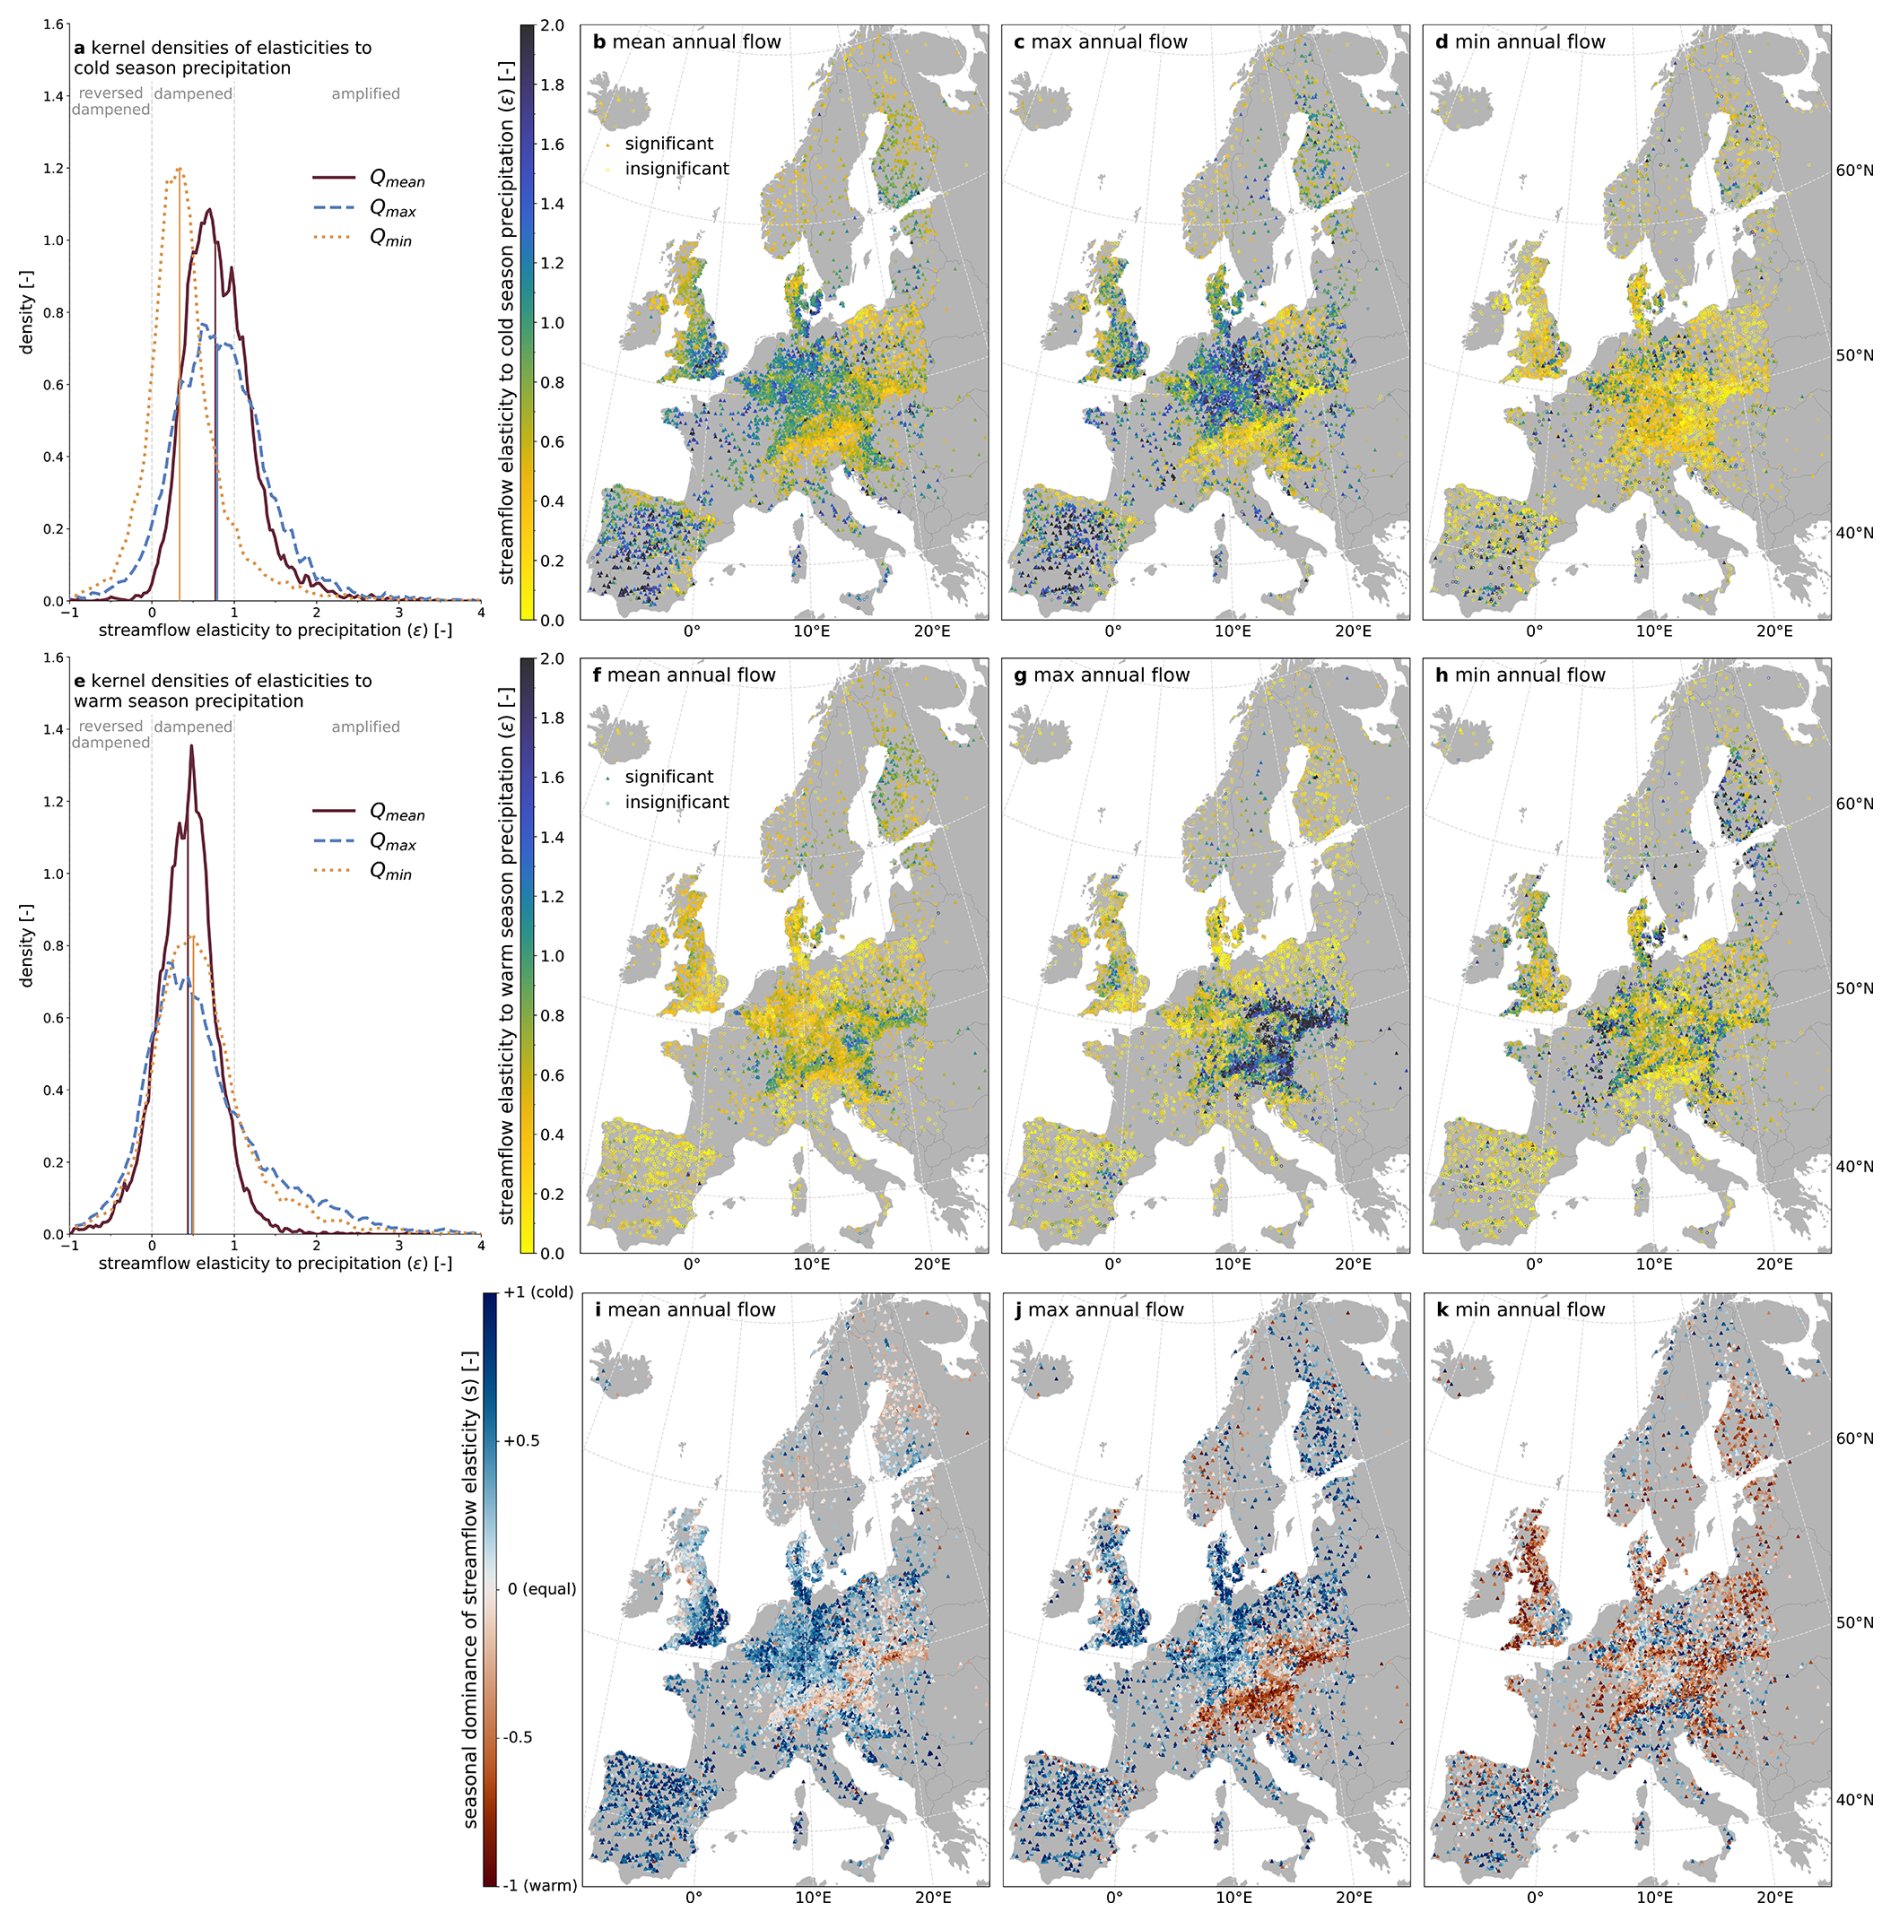
Figure 4Frequency distributions of streamflow elasticities to cold-season precipitation (a) and warm-season precipitation (e). The vertical lines in the frequency distribution plot represent medians of the elasticity distributions. Plots (b)–(d) show the spatial distribution of mean, maximum and minimum streamflow elasticity to cold-season precipitation and plots (f)–(h) the corresponding elasticities to warm-season precipitation. The fractions of statistically significant values for mean flows are 0.89 (b) and 0.47 (f), for max flows 0.60 (c) and 0.32 (g) and for min flows 0.31 (d) and 0.44 (h). The bottom row (i–k) shows the seasonal dominance (s) of elasticity to seasonal precipitation.
Precipitation variability of the warm season (May–October) is typically dampened in annual mean and extreme flows (Fig. 4e). The spatial patterns of elasticities of annual streamflow to warm season (May–October) precipitation (Fig. 4e–h) are partially inverse compared to those of the cold season precipitation. This means that regions where cold-season precipitation is amplified in streamflow, warm-season precipitation is dampened (and vice versa). For example, streamflow in Central Europe tends to be highly sensitive to summer precipitation, which is consistent with the occurrence of the 2024 Central European floods during summer (Athanase et al., 2024). We show which catchments are more sensitive to cold- or warm-season precipitation by mapping seasonal dominance (s, see Eq. 2) (Fig. 4i–k). In most regions, annual mean and maximum streamflow are dominated by cold-season precipitation. This agrees with a case study in Colorado (USA) (Woodhouse et al., 2016), where cold-season precipitation explained more of the variability in annual flows than warm-season precipitation. It is also in line with the general concept that runoff ratios tend to be higher in colder or more humid settings (Budyko, 1974; Merz and Blöschl, 2009). As the emerging spatial patterns of seasonal dominance of elasticity of mean and maximum flow resemble the pattern of streamflow seasonality (Berghuijs et al., 2025b), we tested whether the seasonal dominance is just a representation of whether the centre of mass of mean, maximum, and minimum flow is in phase with our definition of the season (see Sect. S8), but this is not the case. Note that the pattern emerging for mean and maximum flow resembles areas with higher snow fraction (snow fraction > 0.15 see Fig. S9). These are regions where, in the warm season, precipitation falls more likely as rain which contributes faster to streamflow as opposed to precipitation falling as snow in the cold season. For minimum flows, there is less distinct regional pattern of seasonal dominance across continental Europe. In the UK there is a clear gradient of warm-season dominated catchments in the northwest to cold-season dominated in the southeast, which broadly aligns with the spatial patterns of how meteorological drought propagate to hydrological droughts (Barker et al., 2016).
Streamflow elasticities to climate can be used as a measure of catchment resilience (Zhang et al., 2022), especially when considering the elasticities to both high and low flow conditions per catchment (because these are associated with potential hazards such as droughts and floods). Our resilience definition is based on the response of annual extreme streamflow to annual mean precipitation. Although annual maximum flows are triggered by event-scale precipitation (or snowmelt) their magnitude often strongly depends on the antecedent wetness state of the landscape (Berghuijs et al., 2019). This is also supported by the catchments we study because they have a weak relationship between annual maxima of precipitation and annual maxima of flow (median R2 of 0.16). We use mean annual precipitation as a proxy for the antecedent wetness state because periods with more precipitation tend to be associated with, for example, higher soil moisture (Shreve, 1914). This choice is consistent with Sect. S7 where results suggest that the elasticities of annual maximum flows to annual mean precipitation reflect effects of antecedent wetness rather than effects of annual maximum precipitation (see Sect. S7 for more detailed information). In other words, across Europe the derived elasticities of annual maximum flows primarily reflect state-dependent flood amplification rather than resilience to event-scale annual extreme precipitation. We categorize the catchments into whether they dampen or amplify extreme flows (Fig. 5). Figure 5 highlights which catchments only have sensitive (amplified) maximum flows, only sensitive minimum flows, have both extremes being sensitive or have both extremes being resilient (dampened). Thus, catchments are considered more resilient in their minimum flow response, if minimum flows are less sensitive to annual precipitation variations.
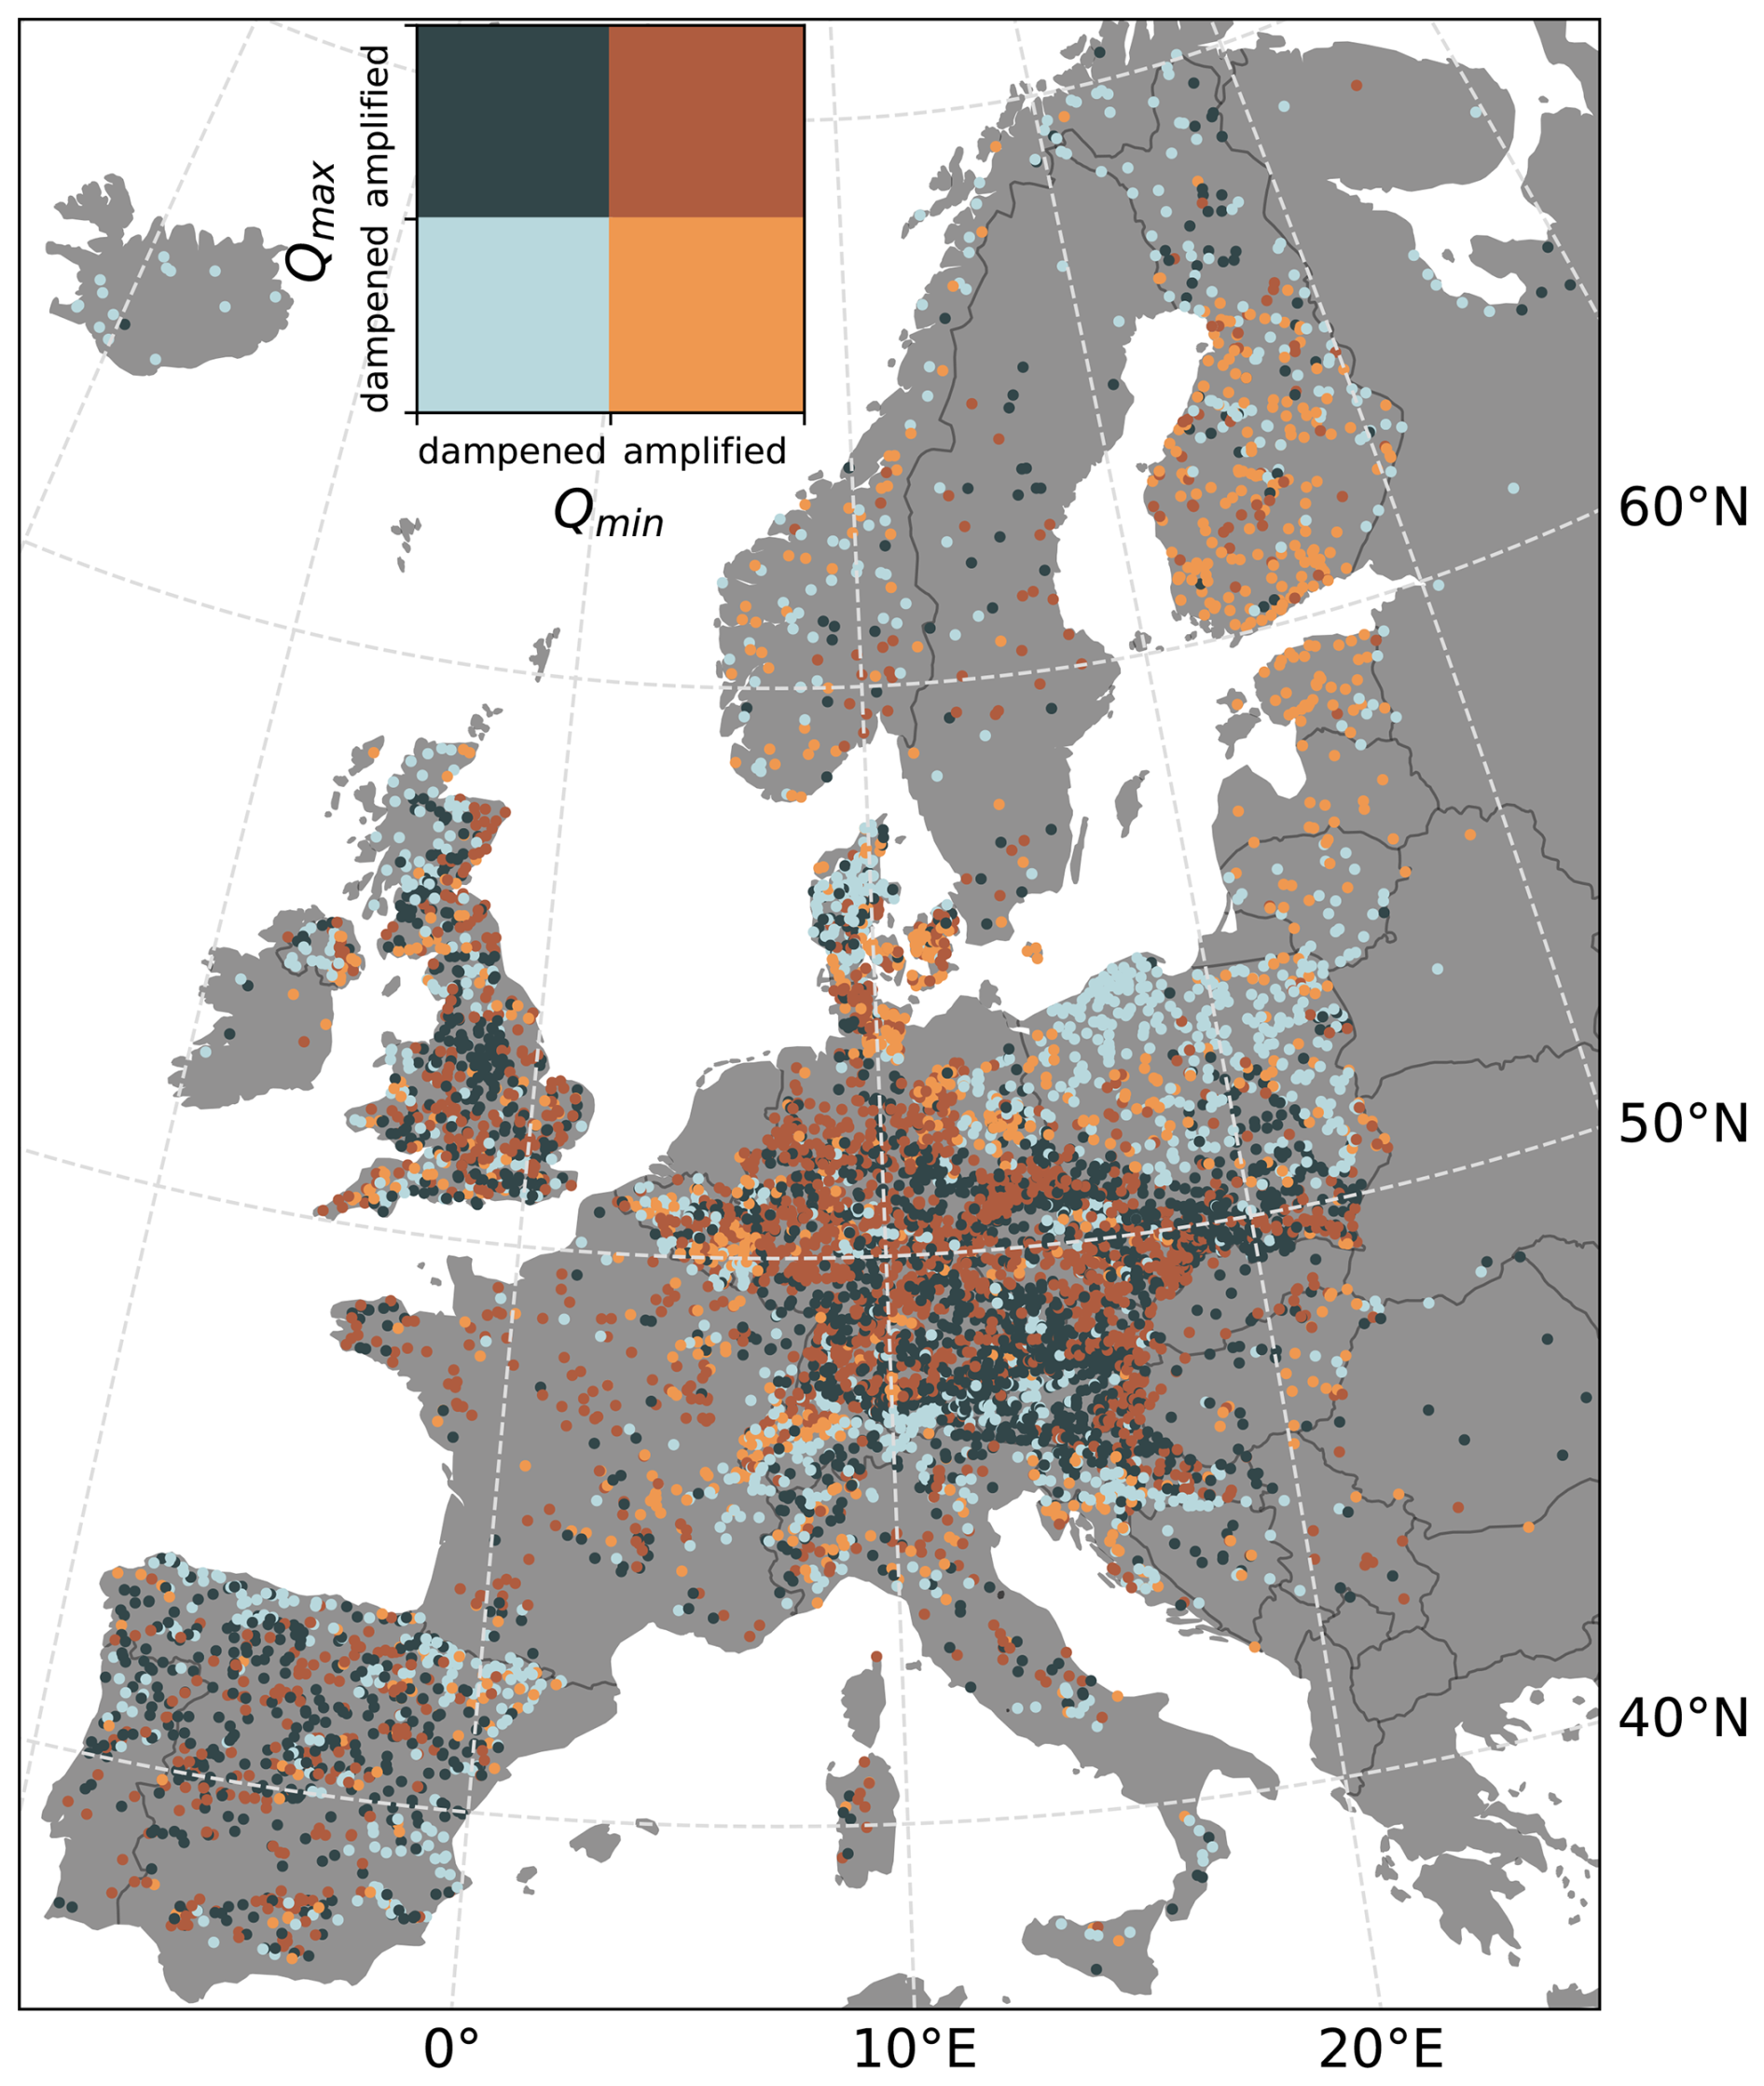
Figure 5Combined elasticity of maximum and minimum flow to precipitation as a measure of resilience. The colour classes split the elasticities into whether the streamflow response is dampened/resilient (ε < 1), or amplified/sensitive (ε > 1).
Catchments that are resilient in both their low and high flows are common (21.6 %) and occur in the northern Continental Zone (northern Poland), the Alpine South (Northern Italy), and the Alpine North (Norway) and locally in other places. As mentioned before, the higher resilience could be linked to an increased storage (indicated by deeper depth to bedrock as in northern Poland) or a higher peat land cover and their sponge functioning (Karimi et al., 2023; Tegetmeyer et al., 2025), but could also be linked to different seasonality of high and low flows (the Alps). High sensitivities of both minimum and maximum flows occur more commonly (29.2 %) and are concentrated in the Atlantic North and Atlantic Central (western Germany and southern Denmark), as well as parts of the Continental Zone (Czechia and Austria), but also occur elsewhere. In most of the catchments (35.1 %), maximum flows are sensitive to precipitation, but minimum flows are resilient, and they commonly occur in the Continental Zone (large parts of Germany, Austria, southern Poland, and Czechia (in spatial vicinity to catchments that are sensitive in both extremes)). Catchments that are sensitive in their minimum flows but that have resilient maximum flows are rare (14.1 %) but occur mainly in the Boreal Zone (southern Finland) and the Nemoral Zone (Estonia, Latvia, Lithuania). The resilience classes of these catchments are partly geographically clustered (as described above) but also show a lot of local spatial heterogeneity. Therefore, it is relevant to understand what drives both these regional and the more localized differences.
3.3 Temperature sensitivities of annual mean and extreme streamflow
The sensitivities of annual mean, maximum and minimum streamflow to mean annual temperature have spatial patterns (Fig. 6a–d) that differ from those of streamflow elasticities to precipitation (Fig. 2a–d). In most catchments, streamflow decreases (increases) with increasing (decreasing) temperatures, as shown by mostly negative temperature sensitivities for mean (), maximum (), and minimum flow (), including both statistically significant and insignificant sensitivities (Fig. 2a). These negative sensitivities are in line with increased evaporation at higher temperatures reducing the amount of water reaching the stream, which is expected especially in energy-limited environments (Budyko, 1974). However, there are also many catchments responding the opposite way (positive sensitivities), indicating that higher temperatures are associated with more streamflow. The occurrence of both positive and negative temperature sensitivities has also been reported for mean annual streamflow mainly in snow-affected catchments as temperature can trigger different processes (e.g. snow occurrence, melt or evaporation) throughout the year (Berghuijs et al., 2014; Vano et al., 2012, 2015; Weiler et al., 2025). Note that temperature variations explain much less of the annual variability of streamflow compared to precipitation variations. The performance (R2) of the linear regression model using only temperature to describe mean streamflow, for example, is on average 0.03, while the performance using only precipitation is 0.46 (see Fig. S5). This is also reflected in the low fractions of statistically significant sensitivities (Fig. 2).
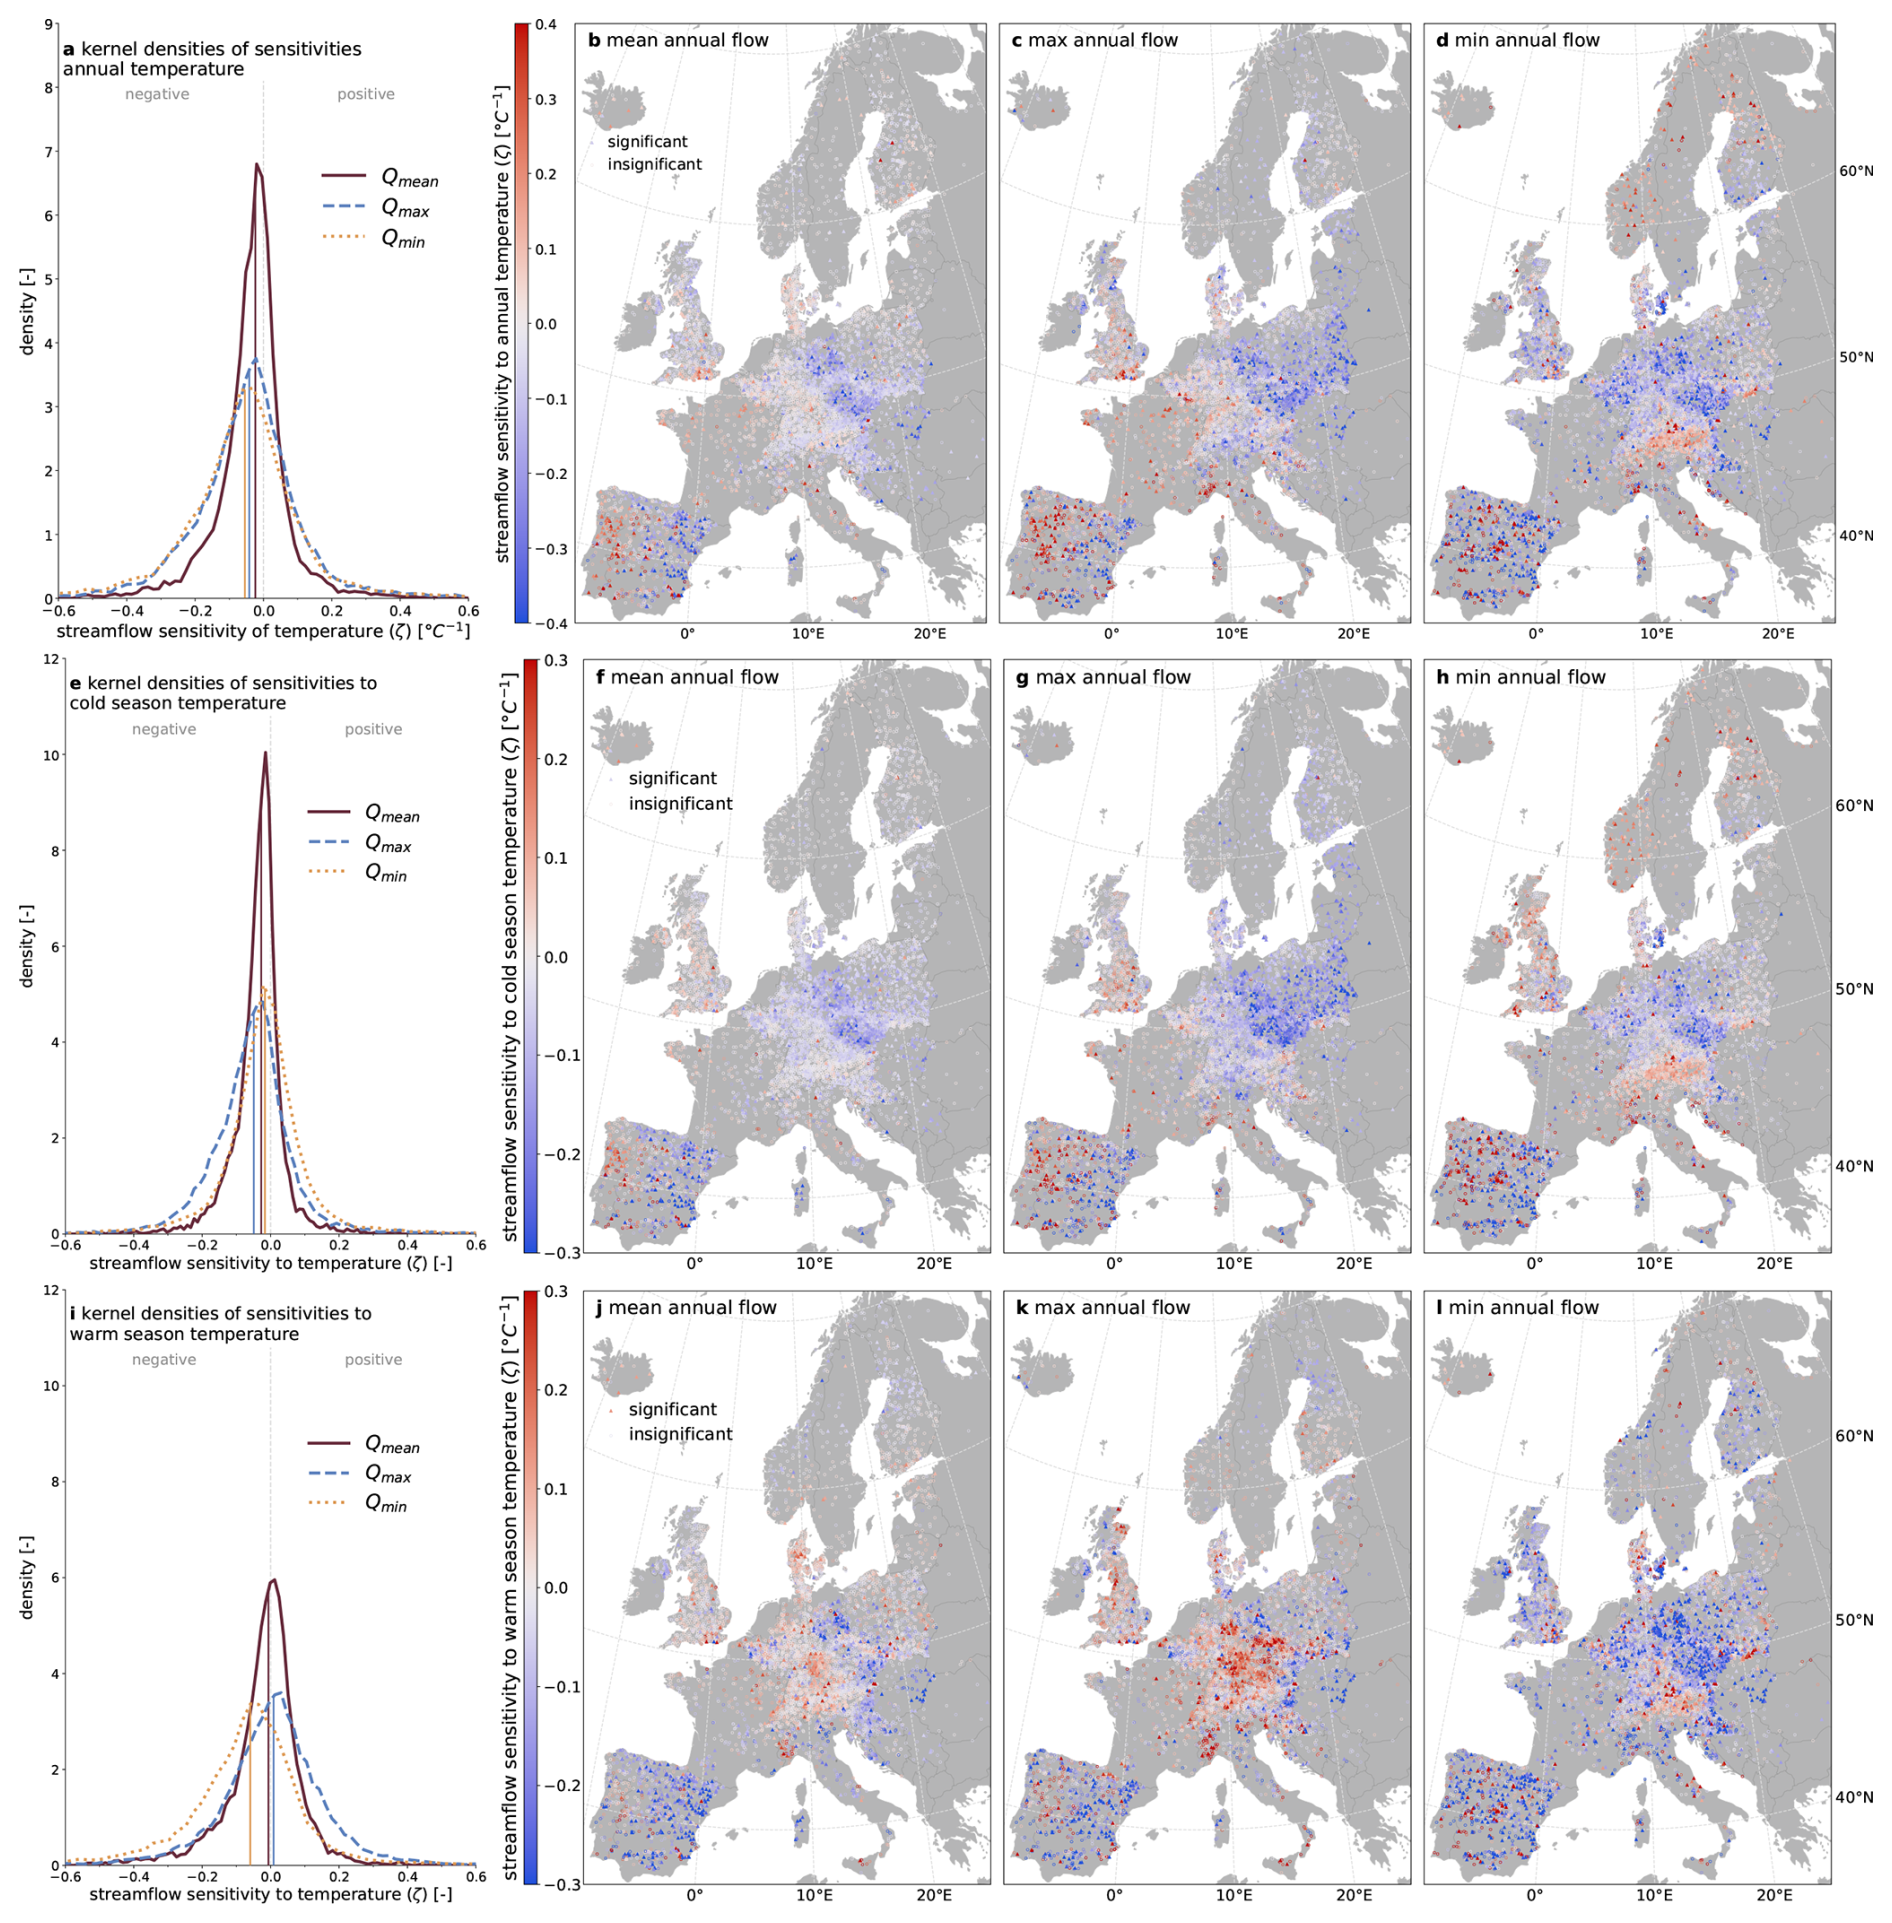
Figure 6Frequency (first column) and spatial distribution (second to fourth column) of the temperature sensitivities of mean (second column), maximum (third column) and minimum (fourth column) streamflow across Europe. The plots show the streamflow sensitivities to annual temperatures (first row), to cold-season temperature (second row) and to warm-season temperature (third row). The vertical lines in the frequency distribution plots (a), (e), (i) show the medians of the sensitivity distributions. The fractions of statistically significant values range from 0.16 to 0.31 for the annual sensitivities, from 0.21 to 0.26 for the cold season sensitivities and from 0.10 to 0.28 for warm-season sensitivities, reflecting the overall weak influence of temperature on annual streamflow.
Across flow metrics and temporal scales, we find a considerable number of catchments in the western Iberian Peninsula with positive streamflow response to temperature, where we would expect higher rates of evapotranspiration and therefore a negative streamflow response to temperature. However, in energy-limited environments the sensitivity of evapotranspiration to temperature tends to be smaller (Berghuijs et al., 2017), which makes other factors more dominant in controlling sensitivities. Declines of mean streamflow with higher temperatures (linked to an increase in evaporative demand), in particular, in the warm season when evaporation rates are higher, have been reported across Iberia (Martínez-Fernández et al., 2013; Vicente-Serrano et al., 2014) and southern Europe (Stahl et al., 2010). Positive temperature sensitivities in Iberia are likely indirect, possibly resulting from weather patterns or atmospheric circulation patterns (such as the North Atlantic Oscillation) that are sometimes covarying with annual temperatures (Lorenzo-Lacruz et al., 2011) or from human water management responses to warmer temperatures.
For the annual minimum flow response, positive sensitivities occur in the Alps and the Nordic Mountains (Northern Scandinavia) and Iceland. As mentioned before, in these regions minimum flows usually occur January through March, whereas in most parts of Europe minimum flows usually occur June through September (Floriancic et al., 2021). In snow-affected catchments with winter low flows, higher temperatures can increase liquid water availability (rain + snowmelt) during the low-flow season leading higher low flows (Van Loon and Van Lanen, 2012) and thus, positive temperature sensitivities. The response of annual mean, maximum, and minimum flow to cold-season temperature is very similar to the response to annual temperature (Fig. 6i–l) in terms of the typically negative response (Fig. 6e) and the spatial patterns (Fig. 6f–h). Contrastingly, the response of annual mean and maximum flow to warm-season temperature exhibits spatial patterns that differ from those to annual temperature sensitivities with a more negative average response of minimum flows and a positive average response in maximum flow (Fig. 6i). In particular, Germany, Austria, and Switzerland show positive warm-season temperature sensitivities. Such positive sensitivities can, in some highly glaciated catchments, arise through glacial melt during the warm season (Van Tiel et al., 2021).
3.4 Catchment characteristics shaping elasticities
So far, this study provides empirical evidence of how annual mean and extreme flows in Europe respond to climate without empirically analysing its causes. Revealing related physical characteristics and processes that could drive or co-occur with these elasticities, builds understanding and potentially improve predictions in a changing climate. Here, we use a random forest model (Pedregosa et al., 2011) to quantify the feature importance of 20 selected catchment characteristics (spatial distribution of the 16 most prominent characteristics is shown in Fig. S9) for predicting the elasticities of mean, maximum, and minimum annual flow to precipitation (Fig. 7). Feature importance is defined as the total reduction prediction error (R2) contributed by a feature across all splits of all trees in the random forest model. The resulting importance values are normalized and shown in the importance plot that illustrates the relative contribution of each predictor to the model's prediction, highlighting how influence is distributed across all inputs. The higher the feature importance of a characteristic is, the more this characteristic is related to the corresponding elasticity. It does not necessarily mean that there is a causal relationship between the characteristics and the elasticities but rather an associative one.
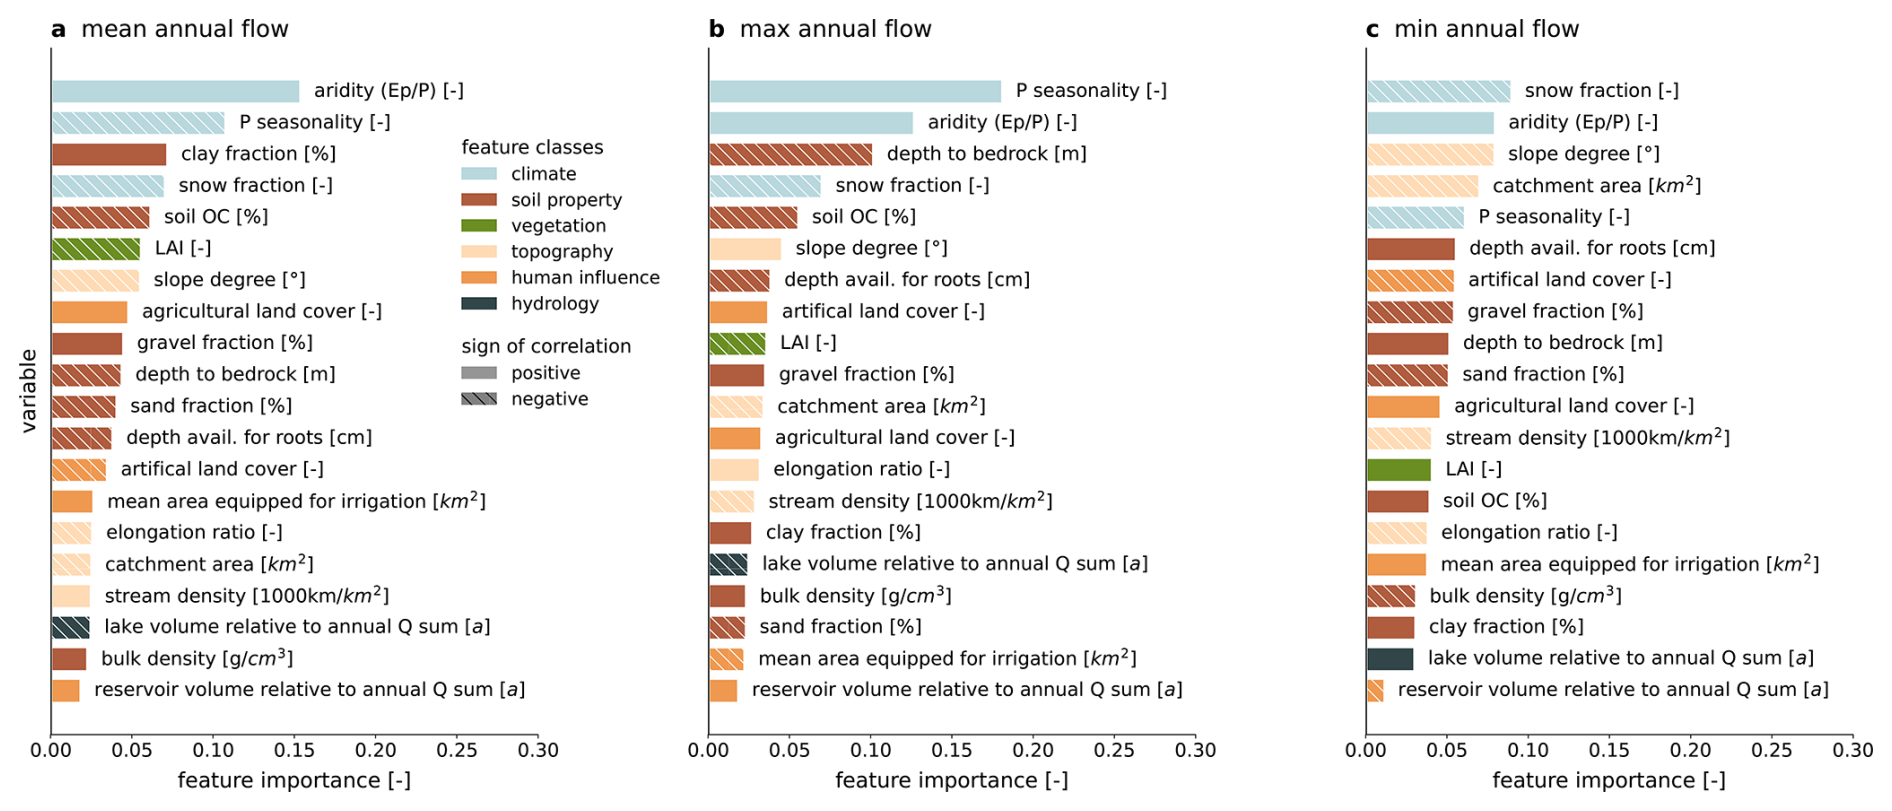
Figure 7The feature importance of catchment characteristics in shaping elasticities estimated by their feature importance for elasticities of mean (a), maximum (b) and minimum (c) annual streamflow to annual precipitation. This importance plot illustrates the relative contribution of each predictor to the model, highlighting how influence is distributed across all inputs. Thus, the importances of all features (characteristics) always sums to one, independent of the model fit. The colours of the bars indicate the class (climate, soil property, land cover, topography, human influence, and hydrological signatures) of the feature and the pattern of the bar shows whether the correlation of a feature to the elasticity is positive (solid) or negative (striped).
Elasticity cannot be accurately predicted by a single catchment characteristic, and the combination of the 20 characteristics only predicts about half of the variations in the elasticities of the annual mean (R2 ± std: 0.47±0.02), maximum (0.51±0.03), and minimum flow (0.30±0.02). Despite using a combination of a wide (and in hydrological modelling commonly used) range of catchment characteristics, we cannot easily predict elasticities and thereby encode the physical connections of annual streamflow elasticities to precipitation. This underlines the importance of showing the elasticity behaviour empirically, such as presented in this paper, and not by predictions that would depend on modelling.
Although spatial distribution and binned scatter plots (Fig. 3) of the streamflow elasticities to annual precipitation seemed to indicate that the elasticities of different flow metrics are connected (e.g. catchments with higher mean flow elasticity also featured a higher maximum flow elasticity), the feature importance plots show that the higher-ranked features vary among the different flow metrics. Aridity is among the most prominent characteristics for all three streamflow elasticities (but only ranked highest for mean flow elasticities) across this range of European climates.
Multiple studies described the relationship of aridity to elasticity of mean flows. Humid basins were found to have a significantly lower elasticity to precipitation (Zheng et al., 2009), while in arid regions there is a larger spread of values (Sankarasubramanian et al., 2001) and uncertainty due to greater inter-annual streamflow variability (Potter et al., 2011). This could be linked to arid and semi-arid catchments (aridity index (AI) > 1) being more sensitive to precipitation decreases than to precipitation increases (Tang et al., 2019). Some of these studies also aknowledge that theoretical relationships of elasticity and humidity can only describe the observed relationship for very humid regions (AI < 0.5) and that additional factors shape the elasticities (Potter et al., 2011; Sankarasubramanian et al., 2001). In this study, we see that while aridity ranks among the highest factors, it is not solely dominating the elasticity. Furthermore, we can extend this finding to extreme flows as well.
Precipitation seasonality is the most influential characteristic for maximum flow elasticities to precipitation, and among the higher-ranked characteristics for the other elasticities. For the maximum flow elasticity, the correlation is positive, indicating that more summer-dominant (or winter-dominant) precipitation is associated with a higher (or lower) elasticity. For example, maximum flow elasticities around the Carpathians are among the highest of Europe. Here, maximum flows usually occur around the end of summer, while precipitation is also summer-dominant. In contrast, the lowest maximum flow elasticities occur where maximum flows occur in winter or spring while the precipitation seasonality is also summer-dominant.
Snow fraction is among the most highly ranked characteristics for mean and extreme flow elasticities and is negatively related. This is in line with Sankarasubramanian et al. (2001), who found elasticities of mean flows to precipitation in the USA to be lower for catchments with higher snow accumulation.
There are several characteristics beyond climate that are also of importance. The depth to bedrock is also among the higher-ranked features for maximum flow elasticities, that can affect groundwater storage capacity and response time through the unsaturated zone. A larger groundwater storage capacity could increase the buffering capacity of precipitation variability at the annual scale leading to lower elasticities, compared to small depths to bedrock that offer only limited groundwater and soil moisture storage in thin soils or fractured bedrock. The catchment area is more relevant for the minimum flow elasticity. This could be due to the longer memories of low flows discussed before, becoming even larger the bigger the catchment is. Several other factors appear important for specific elasticities but are not consistently showing up as being important for all signatures (e.g. clay fraction, soil organic carbon, slope degree and artificial land cover).
We show that streamflow elasticities to precipitation arise with complex combinations of climate and landscape characteristics, with important influences that may not be adequately captured by the existing metrics, such as specific landscape properties (e.g. peatland cover) or anthropogenic impacts. For example, the used irrrigation metric of mean area equipped for irrigation, does not indicate actual volumes of irrigation water used nor does it differentiate between water sources used for irrigation. Further, the human influences are treated as static over time while they may be varying, which could influence the dampening or amplification of precipitation variability (Müller et al., 2021). Vegetation may also play a larger role than indicated here, as it is represented only by the lumped leaf area index, which does not account for differences in root depth, vegetation type or seasonality. The capacity of vegetation to regulate transpiration rates in response to wetness conditions of previous years can affect the elasticities to precipitation (Gardiya Weligamage et al., 2025; Zhang et al., 2022). Some metrics, such as land cover, also vary over time, potentially altering streamflow elasticities, as suggested by earlier studies (Martínez-Fernández et al., 2013; Morán-Tejeda et al., 2012). Considering these multiple and dynamic influences, there is a risk of equifinality, where similar elasticity values arise from different underlying processes, posing a challenge for process-based interpretation.
This study presents the first pan-European quantification of streamflow elasticities to annual and seasonal precipitation, along with the streamflow sensitivities to temperature. Our analysis includes elasticities of extreme flows, which have rarely been examined at this scale. Results indicate that streamflow elasticity to precipitation exhibits distinct regional patterns across Europe and shows that annual mean, minimum, and maximum flows almost always increase with annual mean precipitation. Changes in mean flows are typically amplified relative to precipitation changes, with maximum flows being amplified even more. In contrast, minimum flows often have elasticities below one, indicating dampening of precipitation variabilities. We further map the combined elasticities of maximum and minimum flows, for example highlighting areas where streamflow is amplified in both extremes. Streamflow exhibits both positive and negative sensitivities to temperature depending on the region and flow type, whereby temperature explains a significantly smaller portion of the overall variability in annual streamflow. Five key patterns emerge from our analyses: First, streams in Northern Poland and Baltic States are remarkably insensitive to annual precipitation variations. Second, maximum streamflow in mountainous Central Europe is highly sensitive to summer precipitation, making these catchments particularly vulnerable to large amount of summer precipitation, as occurred during the Central European floods in 2024. Third, mean and maximum flows in Spain are particularly sensitive to winter precipitation. Fourth, the elasticity of low flows tends to be more localised and less related to precipitation variability compared to elasticities of mean and maximum flows. Fifth, elasticities emerge with a combination of many catchment properties with climate properties appearing to be the strongest control. However, available catchment properties can only explain about half of the regional variability in elasticity values. This suggests that key drivers remain unaccounted for and underlines the importance of deriving elasticities from data and not by predictions that would depend on modelling.
As future temperature changes are projected to exceed historical variability (IPCC, 2021), the role of temperature in shaping streamflow responses may grow, highlighting the need to revisit sensitivity assessments under ongoing climate change. Our spatially explicit elasticity estimates reveal where in Europe streamflow is most sensitive to climate drivers and where hydrological resilience is strongest. We identify areas where both maximum and minimum flows are highly sensitive to precipitation, further highlighting vulnerable areas. This is particularly important as climate warms and becomes more erratic. By revealing these spatial patterns, this research enhances our understanding of hydrological resilience of mean and extreme flow in Europe. It provides a valuable basis for assessing regional exposure to climate change and variability, informing targeted water and climate risk management towards more resilient catchments across the continent.
The code to produce the main results is available on Zenodo at https://doi.org/10.5281/zenodo.19497458 (Hemshorn de Sanchez, 2026).
Timeseries of European streamflow, precipitation, and temperature, as well as catchment characteristcs are available from the EStreams dataset (do Nascimento et al., 2024).
The supplement related to this article is available online at https://doi.org/10.5194/hess-30-2667-2026-supplement.
ALHdS performed all analyses and led the writing. All authors contributed to the design of the study and to the writing.
At least one of the (co-)authors is a member of the editorial board of Hydrology and Earth System Sciences. The peer-review process was guided by an independent editor, and the authors also have no other competing interests to declare.
Publisher's note: Copernicus Publications remains neutral with regard to jurisdictional claims made in the text, published maps, institutional affiliations, or any other geographical representation in this paper. The authors bear the ultimate responsibility for providing appropriate place names. Views expressed in the text are those of the authors and do not necessarily reflect the views of the publisher.
The authors used AI-assisted tools to streamline parts of the coding and debugging process. All final implementations and analyses were conducted and verified by the authors. We acknowledge Mira Anand for the meticulous visual inspection and flagging of the hydrographs of EStreams. Colour schemes used for the maps in this study are from Crameri (2018) and Kovesi (2015).
This research has been supported by the Nederlandse Organisatie voor Wetenschappelijk Onderzoek (grant no. KICH1.LWV03.LWV03.007).
This paper was edited by Francesco Marra and reviewed by three anonymous referees.
Anderson, B. J., Brunner, M. I., Slater, L. J., and Dadson, S. J.: Elasticity curves describe streamflow sensitivity to precipitation across the entire flow distribution, Hydrol. Earth Syst. Sci., 28, 1567–1583, https://doi.org/10.5194/hess-28-1567-2024, 2024.
Andréassian, V., Coron, L., Lerat, J., and Le Moine, N.: Climate elasticity of streamflow revisited – an elasticity index based on long-term hydrometeorological records, Hydrol. Earth Syst. Sci., 20, 4503–4524, https://doi.org/10.5194/hess-20-4503-2016, 2016.
Athanase, M., Sánchez-Benítez, A., Monfort, E., Jung, T., and Goessling, H. F.: How climate change intensified storm Boris' extreme rainfall, revealed by near-real-time storylines, Commun. Earth Environ., 5, https://doi.org/10.1038/s43247-024-01847-0, 2024.
Awasthi, C., Vogel, R. M., and Sankarasubramanian, A.: Regionalization of Climate Elasticity Preserves Dooge's Complementary Relationship, Water Resour. Res., 60, https://doi.org/10.1029/2023WR036606, 2024.
Bai, X., Liu, W., Wang, T., Feng, Y., Wang, H., Lan, Z., Guo, S., and Sun, F.: Large-sample detection of reservoir impacts on flow regime alteration through improved paired-catchment approach, J. Hydrol.-Amst., 642, https://doi.org/10.1016/j.jhydrol.2024.131872, 2024.
Barker, L. J., Hannaford, J., Chiverton, A., and Svensson, C.: From meteorological to hydrological drought using standardised indicators, Hydrol. Earth Syst. Sci., 20, 2483–2505, https://doi.org/10.5194/hess-20-2483-2016, 2016.
Berghuijs, W. R., Woods, R. A., and Hrachowitz, M.: A precipitation shift from snow towards rain leads to a decrease in streamflow, Nat. Clim. Change, 4, 583–586, https://doi.org/10.1038/nclimate2246, 2014.
Berghuijs, W. R., Larsen, J. R., van Emmerik, T. H. M., and Woods, R. A.: A Global Assessment of Runoff Sensitivity to Changes in Precipitation, Potential Evaporation, and Other Factors, Water Resour. Res., 53, 8475–8486, https://doi.org/10.1002/2017WR021593, 2017.
Berghuijs, W. R., Harrigan, S., Molnar, P., Slater, L. J., and Kirchner, J. W.: The Relative Importance of Different Flood-Generating Mechanisms Across Europe, Water Resour. Res., 55, 4582–4593, https://doi.org/10.1029/2019WR024841, 2019.
Berghuijs, W. R., Woods, R. A., Anderson, B. J., Hemshorn de Sánchez, A. L., and Hrachowitz, M.: Annual memory in the terrestrial water cycle, Hydrol. Earth Syst. Sci., 29, 1319–1333, https://doi.org/10.5194/hess-29-1319-2025, 2025a.
Berghuijs, W. R., Hale, K., and Beria, H.: Technical note: Streamflow seasonality using directional statistics, Hydrol. Earth Syst. Sci., 29, 2851–2862, https://doi.org/10.5194/hess-29-2851-2025, 2025b.
Blöschl, G., Sivapalan, M., Wagener, T., Viglione, A., and Savenije, H.: Runoff Prediction in Ungauged Basins: Synthesis across Processes, Places and Scales, Cambridge University Press, Cambridge, https://doi.org/10.1017/CBO9781139235761, 2013.
Blöschl, G., Hall, J., Parajka, J., Perdigão, R. A. P., Merz, B., Arheimer, B., Aronica, G. T., Bilibashi, A., Bonacci, O., Borga, M., Čanjevac, I., Castellarin, A., Chirico, G. B., Claps, P., Fiala, K., Frolova, N., Gorbachova, L., Gül, A., Hannaford, J., Harrigan, S., Kireeva, M., Kiss, A., Kjeldsen, T. R., Kohnová, S., Koskela, J. J., Ledvinka, O., Macdonald, N., Mavrova-Guirguinova, M., Mediero, L., Merz, R., Molnar, P., Montanari, A., Murphy, C., Osuch, M., Ovcharuk, V., Radevski, I., Rogger, M., Salinas, J. L., Sauquet, E., Šraj, M., Szolgay, J., Viglione, A., Volpi, E., Wilson, D., Zaimi, K., and Živković, N.: Changing climate shifts timing of European floods, Science, 357, 588–590, https://doi.org/10.1126/science.aan2506, 2017.
Botter, G., Basso, S., Rodriguez-Iturbe, I., and Rinaldo, A.: Resilience of river flow regimes, P. Natl. Acad. Sci. USA, 110, 12925–12930, https://doi.org/10.1073/pnas.1311920110, 2013.
Budyko, M. I.: Climate and life, Academic Press, New York, ISBN 0-12-139450-6, 1974.
Caretta, M. A., Mukherji, A., Arfanuzzaman, M., Betts, R. A., Gelfan, A., Hirabayashi, Y., Lissner, T. K., Liu, J., Lopez Gunn, E., Morgan, R., Mwanga, S., Supratid, S., and Supratid, S.: Water, in: Climate Change 2022 – Impacts, Adaptation and Vulnerability, edited by: Pörtner, H.-O., Roberts, D. C., Tignor, M., Poloczanska, E. S., Mintenbeck, K., Alegría, A., Craig, M., Langsdorf, S., Löschke, S., Möller, V., Okem, A., and Rama, B., Cambridge University Press, Cambridge, UK and New York, NY, USA, 551–712, https://doi.org/10.1017/9781009325844.006, 2022.
Chiew, F. H. S.: Estimation of rainfall elasticity of streamflow in Australia, Hydrolog. Sci. J., 51, 613–625, https://doi.org/10.1623/hysj.51.4.613, 2006.
Chiew, F. H. S., Peel, M. C., Mcmahon, T. A., and Siriwardena, L. W.: Precipitation elasticity of streamflow in catchments across the world, in: Proceedings of the Fifth FRIEND World Conference held at Havana, Cuba, November 2006, IAHS Publ. 308, 256–262, https://iahs.info/uploads/dms/13670.49-256-262-08-308-Chiew.pdf (last access: 24 April 2026), 2006.
Cornes, R. C., van der Schrier, G., van den Besselaar, E. J. M., and Jones, P. D.: An Ensemble Version of the E-OBS Temperature and Precipitation Data Sets, J. Geophys. Res.-Atmos., 123, 9391–9409, https://doi.org/10.1029/2017JD028200, 2018.
Crameri, F.: Scientific colour maps, Zenodo [code], https://doi.org/10.5281/zenodo.1243862, 2018.
Dallan, E., Perez-Ciria, T., Giovannini, L., Davolio, S., Zardi, D., and Borga, M.: Rainfall elasticity functions explain divergent runoff sensitivity to rainfall errors in hydrological models, J. Hydrol.-Amst., 653, https://doi.org/10.1016/j.jhydrol.2025.132746, 2025.
de Lavenne, A., Andréassian, V., Crochemore, L., Lindström, G., and Arheimer, B.: Quantifying multi-year hydrological memory with Catchment Forgetting Curves, Hydrol. Earth Syst. Sci., 26, 2715–2732, https://doi.org/10.5194/hess-26-2715-2022, 2022.
do Nascimento, T. V. M., Rudlang, J., Höge, M., van der Ent, R., Chappon, M., Seibert, J., Hrachowitz, M., and Fenicia, F.: EStreams: An integrated dataset and catalogue of streamflow, hydro-climatic and landscape variables for Europe, Sci. Data, 11, 879, https://doi.org/10.1038/s41597-024-03706-1, 2024.
Eisner, S., Flörke, M., Chamorro, A., Daggupati, P., Donnelly, C., Huang, J., Hundecha, Y., Koch, H., Kalugin, A., Krylenko, I., Mishra, V., Piniewski, M., Samaniego, L., Seidou, O., Wallner, M., and Krysanova, V.: An ensemble analysis of climate change impacts on streamflow seasonality across 11 large river basins, Clim. Change, 141, 401–417, https://doi.org/10.1007/s10584-016-1844-5, 2017.
European Environment Agency: CORINE: CORINE Land Cover, https://land.copernicus.eu/en/products/corine-land-cover (last access: 3 July 2025), 2021.
Fisher, J. B., Whittaker, R. J., and Malhi, Y.: ET come home: Potential evapotranspiration in geographical ecology, https://doi.org/10.1111/j.1466-8238.2010.00578.x, 2011.
Floriancic, M. G., Berghuijs, W. R., Molnar, P., and Kirchner, J. W.: Seasonality and Drivers of Low Flows Across Europe and the United States, Water Resour. Res., 57, https://doi.org/10.1029/2019WR026928, 2021.
Fu, G., Charles, S. P., and Chiew, F. H. S.: A two-parameter climate elasticity of streamflow index to assess climate change effects on annual streamflow, Water Resour. Res., 43, https://doi.org/10.1029/2007WR005890, 2007.
Gardiya Weligamage, H., Fowler, K., Ryu, D., Saft, M., Peterson, T., and Peel, M. C.: Vegetation as a driver of shifts in rainfall-runoff relationship: Synthesising hydrological evidence with remote sensing, J. Hydrol.-Amst., 648, https://doi.org/10.1016/j.jhydrol.2024.132389, 2025.
Gong, X., Xu, A., Du, S., and Zhou, Y.: Spatiotemporal variations in the elasticity of runoff to climate change and catchment characteristics with multi-timescales across the contiguous United States, J. Water Clim. Change, 13, 1408–1424, https://doi.org/10.2166/wcc.2022.242, 2022.
Hemshorn de Sanchez, A. L.: Updated Release for the revised Manuscript Submission: Sensitivities of mean and extreme streamflow to climate variability across Europe (v1.2.1), Zenodo [code], https://doi.org/10.5281/zenodo.19497458, 2026.
Hiederer, R.: Mapping Soil Typologies: Spatial Decision Support Applied to the European Soil Database, Publications Office, https://doi.org/10.2788/87286, 2013a.
Hiederer, R.: Mapping soil properties for Europe: spatial representation of soil database attributes, Publications Office, 47 pp., https://doi.org/10.2788/94128, 2013b.
Intergovernmental Panel on Climate Change (IPCC): Summary for Policymakers, in: Climate Change 2021 – The Physical Science Basis, edited by: Masson-Delmotte, V., Zhai, P., Pirani, A., Connors, S. L., Péan, C., Berger, S., Caud, N., Chen, Y., Goldfarb, L., Gomis, M. I., Huang, M., Leitzell, K., Lonnoy, E., Matthews, J. B. R., Maycock, T. K., Waterfield, T., Yelekçi, O., Yu, R., and Zhou, B., Cambridge University Press, Cambridge, United Kingdom and New York, NY, USA, 3–32, https://doi.org/10.1017/9781009157896.001, 2021.
Jasechko, S., Kirchner, J. W., Welker, J. M., and McDonnell, J. J.: Substantial proportion of global streamflow less than three months old, Nat. Geosci., 9, 126–129, https://doi.org/10.1038/ngeo2636, 2016.
Karimi, S., Leach, J., Karlsen, R. H., Seibert, J., Bishop, K., and Laudon, H.: Local- and network-scale influence of peatlands on boreal catchment response to rainfall events, Hydrol. Process., 37, https://doi.org/10.1002/hyp.14998, 2023.
Kovesi, P.: Good Colour Maps: How to Design Them, https://www.colorcet.com/ (last access: 4 March 2025), 2015.
Kratzert, F., Nearing, G., Addor, N., Erickson, T., Gauch, M., Gilon, O., Gudmundsson, L., Hassidim, A., Klotz, D., Nevo, S., Shalev, G., and Matias, Y.: Caravan – A global community dataset for large-sample hydrology, Sci. Data, 10, https://doi.org/10.1038/s41597-023-01975-w, 2023.
Laaha, G. and Blöschl, G.: Seasonality indices for regionalizing low flows, Hydrol. Process., 20, 3851–3878, https://doi.org/10.1002/hyp.6161, 2006.
Laaha, G., Gauster, T., Tallaksen, L. M., Vidal, J.-P., Stahl, K., Prudhomme, C., Heudorfer, B., Vlnas, R., Ionita, M., Van Lanen, H. A. J., Adler, M.-J., Caillouet, L., Delus, C., Fendekova, M., Gailliez, S., Hannaford, J., Kingston, D., Van Loon, A. F., Mediero, L., Osuch, M., Romanowicz, R., Sauquet, E., Stagge, J. H., and Wong, W. K.: The European 2015 drought from a hydrological perspective, Hydrol. Earth Syst. Sci., 21, 3001–3024, https://doi.org/10.5194/hess-21-3001-2017, 2017.
Lorenzo-Lacruz, J., Vicente-Serrano, S. M., López-Moreno, J. I., González-Hidalgo, J. C., and Morán-Tejeda, E.: The response of Iberian rivers to the North Atlantic Oscillation, Hydrol. Earth Syst. Sci., 15, 2581–2597, https://doi.org/10.5194/hess-15-2581-2011, 2011.
Martínez-Fernández, J., Sánchez, N., and Herrero-Jiménez, C. M.: Recent trends in rivers with near-natural flow regime: The case of the river headwaters in Spain, Prog. Phys. Geogr., 37, 685–700, https://doi.org/10.1177/0309133313496834, 2013.
Merz, R. and Blöschl, G.: A regional analysis of event runoff coefficients with respect to climate and catchment characteristics in Austria, Water Resour. Res., 45, https://doi.org/10.1029/2008WR007163, 2009.
Messager, M. L., Lehner, B., Grill, G., Nedeva, I., and Schmitt, O.: Estimating the volume and age of water stored in global lakes using a geo-statistical approach, Nat. Commun., 7, https://doi.org/10.1038/ncomms13603, 2016.
Metzger, M. J.: The Environmental Stratification of Europe, University of Edinburgh [data set], https://doi.org/10.7488/ds/2356, 2018.
Moberg, A., Jones, P. D., Lister, D., Walther, A., Brunet, M., Jacobeit, J., Alexander, L. V., Della-Marta, P. M., Luterbacher, J., Yiou, P., Chen, D., Tank, A. M. G. K., Saladié, O., Sigró, J., Aguilar, E., Alexandersson, H., Almarza, C., Auer, I., Barriendos, M., Begert, M., Bergström, H., Böhm, R., Butler, C. J., Caesar, J., Drebs, A., Founda, D., Gerstengarbe, F. W., Micela, G., Maugeri, M., Österle, H., Pandzic, K., Petrakis, M., Srnec, L., Tolasz, R., Tuomenvirta, H., Werner, P. C., Linderholm, H., Philipp, A., Wanner, H., and Xoplaki, E.: Indices for daily temperature and precipitation extremes in Europe analyzed for the period 1901–2000, J. Geophys. Res. -Atmos., 111, https://doi.org/10.1029/2006JD007103, 2006.
Morán-Tejeda, E., Ceballos-Barbancho, A., Llorente-Pinto, J. M., and López-Moreno, J. I.: Land-cover changes and recent hydrological evolution in the Duero Basin (Spain), Reg. Environ. Change, 12, 17–33, https://doi.org/10.1007/s10113-011-0236-7, 2012.
Müller, M. F., Roche, K. R., and Dralle, D. N.: Catchment processes can amplify the effect of increasing rainfall variability, Environ. Res. Lett., 16, https://doi.org/10.1088/1748-9326/ac153e, 2021.
Myneni, R., Knyazikhin, Y., and Park, T.: MODIS/Terra Leaf Area Index/FPAR 8-Day L4 Global 500m SIN Grid V061, NASA Land Processes Distributed Active Archive Center [data set], https://doi.org/10.5067/MODIS/MOD15A2H.061, 2021.
Němec, J. and Schaake, J.: Sensitivity of water resource systems to climate variation, Hydrolog. Sci. J., 27, 327–343, 1982.
Pedregosa, F., Varoquaux, G., Gramfort, A., Michel, V., Thirion, B., Grisel, O., Blondel, M., Prettenhofer, P., Weiss, R., Dubourg, V., Vanderplas, J., Passos, A., Cournapeau, D., Brucher, M., and Perrot Édouard Douchesnay, M.: Scikit-learn: Machine Learning in Python, J. Mach. Learn. Res., 12, 2825–2830, 2011.
Perktold, J., Seabold, S., Sheppard, K., ChadFulton, Shedden, K., jbrockmendel, j-grana6, Quackenbush, P., Arel-Bundock, V., McKinney, W., Langmore, I., Baker, B., Gommers, R., yogabonito, s-scherrer, Zhurko, Y., Brett, M., Giampieri, E., yl565, Millman, J., Hobson, P., Vincent, Roy, P., Augspurger, T., tvanzyl, alexbrc, Hartley, T., Perez, F., Tamiya, Y., and Halchenko, Y.: statsmodels/statsmodels: Release 0.14.2, Zenodo [code], https://doi.org/10.5281/zenodo.10984387, 2024.
Peters-Lidard, C. D., Clark, M., Samaniego, L., Verhoest, N. E. C., van Emmerik, T., Uijlenhoet, R., Achieng, K., Franz, T. E., and Woods, R.: Scaling, similarity, and the fourth paradigm for hydrology, Hydrol. Earth Syst. Sci., 21, 3701–3713, https://doi.org/10.5194/hess-21-3701-2017, 2017.
Potter, N. J., Petheram, C., and Zhang, L.: Sensitivity of streamflow to rainfall and temperature in south-eastern Australia during the Millennium drought, in: 19th International Congress on Modelling and Simulation (MODSIM2011), Perth, Australia, 12–16 December 2011, edited by: Chan, F., Marinova, D., and Anderssen, R. S., 3636–3642, https://doi.org/10.36334/modsim.2011.I6.potter, ISBN: 978-0-9872143-1-7, 2011.
Räisänen, J., Hansson, U., Ullerstig, A., Döscher, R., Graham, L. P., Jones, C., Meier, H. E. M., Samuelsson, P., and Willén, U.: European climate in the late twenty-first century: Regional simulations with two driving global models and two forcing scenarios, Clim. Dynam., 22, 13–31, https://doi.org/10.1007/s00382-003-0365-x, 2004.
Samaniego, L., Kumar, R., Breuer, L., Chamorro, A., Flörke, M., Pechlivanidis, I. G., Schäfer, D., Shah, H., Vetter, T., Wortmann, M., and Zeng, X.: Propagation of forcing and model uncertainties on to hydrological drought characteristics in a multi-model century-long experiment in large river basins, Clim. Change, 141, 435–449, https://doi.org/10.1007/s10584-016-1778-y, 2017.
Samaniego, L., Thober, S., Wanders, N., Pan, M., Rakovec, O., Sheffield, J., Wood, E. F., Prudhomme, C., Rees, G., Houghton-Carr, H., Fry, M., Smith, K., Watts, G., Hisdal, H., Estrela, T., Buontempo, C., Marx, A., and Kumar, R.: Hydrological forecasts and projections for improved decision-making in the water sector in europe, B. Am. Meteorol. Soc., 100, 2451–2471, https://doi.org/10.1175/BAMS-D-17-0274.1, 2019.
Sankarasubramanian, A., Vogel, R. M., and Limbrunner, J. F.: Climate elasticity of streamflow in the United States, Water Resour. Res., 37, 1771–1781, https://doi.org/10.1029/2000WR900330, 2001.
Schaake, J. C.: From climate to flow., in: Climate change and U.S. water resources, edited by: Waggoner, P. E., John Wiley and Sons Inc., New York, 177–206, ISBN: 978-0-471-61838-6, 1990.
Seneviratne, S. I., Zhang, X., Adnan, M., Badi, W., Dereczynski, C., Di Luca, A., Ghosh, S., Iskandar, I., Kossin, J., Lewis, S., Otto, F., Pinto, I., Satoh, M., Vicente-Serrano, S. M., Wehner, M., and Zhou, B.: Weather and Climate Extreme Events in a Changing Climate, in: Climate Change 2021: The Physical Science Basis. Contribution of Working Group I to the Sixth Assessment Report of the Intergovernmental Panel on Climate Change, edited by: Masson-Delmotte, V., Zhai, P., Pirani, A., Connors, S. L., Péan, C., Berger, S., Caud, N., Chen, Y., Goldfarb, L., Gomis, M. I., Huang, M., Leitzell, K., Lonnoy, E., Matthews, J. B. R., Maycock, T. K., Waterfield, T., Yelekçi, O., Yu, R., and Zhou, B., Cambridge University Press, Cambridge, United Kingdom and New York, NY, USA, 1513–1766, https://doi.org/10.1017/9781009157896.013, 2021.
Shreve, F.: Rainfall as a determinant of soil moisture, Source: The Plant World, Tucson, 17, 9–26, https://www.jstor.org/stable/43477038 (last access: 18 February 2026), 1914.
Siebert, S., Kummu, M., Porkka, M., Döll, P., Ramankutty, N., and Scanlon, B. R.: A global data set of the extent of irrigated land from 1900 to 2005, Hydrol. Earth Syst. Sci., 19, 1521–1545, https://doi.org/10.5194/hess-19-1521-2015, 2015.
Stahl, K., Hisdal, H., Hannaford, J., Tallaksen, L. M., van Lanen, H. A. J., Sauquet, E., Demuth, S., Fendekova, M., and Jódar, J.: Streamflow trends in Europe: evidence from a dataset of near-natural catchments, Hydrol. Earth Syst. Sci., 14, 2367–2382, https://doi.org/10.5194/hess-14-2367-2010, 2010.
Tang, Y., Tang, Q., Wang, Z., Chiew, F. H. S., Zhang, X., and Xiao, H.: Different Precipitation Elasticity of Runoff for Precipitation Increase and Decrease at Watershed Scale, J. Geophys. Res.-Atmos., 124, 11932–11943, https://doi.org/10.1029/2018JD030129, 2019.
Tarasova, L., Gnann, S., Yang, S., Hartmann, A., and Wagener, T.: Catchment characterization: Current descriptors, knowledge gaps and future opportunities, Earth-Sci. Rev., 252, 104739, https://doi.org/10.1016/j.earscirev.2024.104739, 2024.
Tegetmeyer, C., Kaiser, M., and Barthelmes, A.: The European Wetland Map (`EWM'), Zenodo [data set], https://doi.org/10.5281/zenodo.15302184, 2025.
Tromp-Van Meerveld, H. J. and McDonnell, J. J.: Threshold relations in subsurface stormflow: 2. The fill and spill hypothesis, Water Resour. Res., 42, https://doi.org/10.1029/2004WR003800, 2006.
Van Loon, A. F. and Van Lanen, H. A. J.: A process-based typology of hydrological drought, Hydrol. Earth Syst. Sci., 16, 1915–1946, https://doi.org/10.5194/hess-16-1915-2012, 2012.
Van Loon, A. F., Kchouk, S., Matanó, A., Tootoonchi, F., Alvarez-Garreton, C., Hassaballah, K. E. A., Wu, M., Wens, M. L. K., Shyrokaya, A., Ridolfi, E., Biella, R., Nagavciuc, V., Barendrecht, M. H., Bastos, A., Cavalcante, L., de Vries, F. T., Garcia, M., Mård, J., Streefkerk, I. N., Teutschbein, C., Tootoonchi, R., Weesie, R., Aich, V., Boisier, J. P., Di Baldassarre, G., Du, Y., Galleguillos, M., Garreaud, R., Ionita, M., Khatami, S., Koehler, J. K. L., Luce, C. H., Maskey, S., Mendoza, H. D., Mwangi, M. N., Pechlivanidis, I. G., Ribeiro Neto, G. G., Roy, T., Stefanski, R., Trambauer, P., Koebele, E. A., Vico, G., and Werner, M.: Review article: Drought as a continuum – memory effects in interlinked hydrological, ecological, and social systems, Nat. Hazards Earth Syst. Sci., 24, 3173–3205, https://doi.org/10.5194/nhess-24-3173-2024, 2024.
Vano, J. A., Das, T., and Lettenmaier, D. P.: Hydrologic sensitivities of Colorado River runoff to changes in precipitation and temperature, J. Hydrometeorol., 13, 932–949, https://doi.org/10.1175/JHM-D-11-069.1, 2012.
Vano, J. A., Nijssen, B., and Lettenmaier, D. P.: Seasonal hydrologic responses to climate change in the Pacific Northwest, Water Resour. Res., 51, 1959–1976, https://doi.org/10.1002/2014WR015909, 2015.
Van Tiel, M., Van Loon, A. F., Seibert, J., and Stahl, K.: Hydrological response to warm and dry weather: do glaciers compensate?, Hydrol. Earth Syst. Sci., 25, 3245–3265, https://doi.org/10.5194/hess-25-3245-2021, 2021.
Vicente-Serrano, S. M., Lopez-Moreno, J. I., Beguería, S., Lorenzo-Lacruz, J., Sanchez-Lorenzo, A., García-Ruiz, J. M., Azorin-Molina, C., Morán-Tejeda, E., Revuelto, J., Trigo, R., Coelho, F., and Espejo, F.: Evidence of increasing drought severity caused by temperature rise in southern Europe, Environ. Res. Lett., 9, https://doi.org/10.1088/1748-9326/9/4/044001, 2014.
Wang, J., Walter, B. A., Yao, F., Song, C., Ding, M., Maroof, A. S., Zhu, J., Fan, C., McAlister, J. M., Sikder, S., Sheng, Y., Allen, G. H., Crétaux, J.-F., and Wada, Y.: GeoDAR: georeferenced global dams and reservoirs dataset for bridging attributes and geolocations, Earth Syst. Sci. Data, 14, 1869–1899, https://doi.org/10.5194/essd-14-1869-2022, 2022.
Weiler, M., Gnann, S., and Stahl, K.: Streamflow sensitivity regimes of alpine catchments: seasonal relationships with elevation, temperature, and glacier cover, Environ. Res. Lett., https://doi.org/10.1088/1748-9326/ade26c, 2025.
Woodhouse, C. A., Pederson, G. T., Morino, K., McAfee, S. A., and McCabe, G. J.: Increasing influence of air temperature on upper Colorado River streamflow, Geophys. Res. Lett., 43, 2174–2181, https://doi.org/10.1002/2015GL067613, 2016.
Yamazaki, D., Ikeshima, D., Tawatari, R., Yamaguchi, T., O'Loughlin, F., Neal, J. C., Sampson, C. C., Kanae, S., and Bates, P. D.: A high-accuracy map of global terrain elevations, Geophys. Res. Lett., 44, 5844–5853, https://doi.org/10.1002/2017GL072874, 2017.
Yamazaki, D., Ikeshima, D., Sosa, J., Bates, P. D., Allen, G. H., and Pavelsky, T. M.: MERIT Hydro: A High-Resolution Global Hydrography Map Based on Latest Topography Dataset, Water Resour. Res., 55, 5053–5073, https://doi.org/10.1029/2019WR024873, 2019.
Zhang, Y., Viglione, A., and Blöschl, G.: Temporal Scaling of Streamflow Elasticity to Precipitation: A Global Analysis, Water Resour. Res., 58, https://doi.org/10.1029/2021WR030601, 2022.
Zheng, H., Zhang, L., Zhu, R., Liu, C., Sato, Y., and Fukushima, Y.: Responses of streamflow to climate and land surface change in the headwaters of the Yellow River Basin, Water Resour. Res., 45, https://doi.org/10.1029/2007WR006665, 2009.