the Creative Commons Attribution 4.0 License.
the Creative Commons Attribution 4.0 License.
 | 28 Apr 2026
Climate change and irrigation expansion reshape the water pressure and upstream–downstream interactions in the Lancang–Mekong River Basin
Hongling Zhao
Zilong Zhao
Khosro Morovati
Dongsheng Zhang
In transboundary river basins, water resource pressure results from the combined effects of internal water use growth, external transboundary withdrawal, and climate change, yet the relative contributions of these drivers to both water pressure and upstream–downstream interactions remain poorly quantified. To address this issue, this study adopts the Pressure–State–Response analytical framework to explicitly disentangle and characterize the spatiotemporal patterns and evolution of irrigation water withdrawal pressure in the Lancang–Mekong River Basin under climate change. Results indicate that the proportion of irrigation water withdrawal relative to available water exhibits a persistent increasing trend. Under the SSP5–8.5 scenario, this proportion is projected to rise to 19 % annually and 59 % during the dry season by 2040. Irrigation water withdrawal exerts a substantially greater reduction in water availability in downstream subregions than in upstream subregions, particularly during the dry season. In the historical period (1980–2020), internal irrigation water withdrawal pressure dominates in Subregions 1 (China), 8 (primarily in Thailand), and 13 (primarily in Vietnam), exceeding external pressure from upstream irrigation water withdrawal, whereas external irrigation-induced water appropriation is the primary driver in the remaining subregions. Under the SSP1–2.6, SSP2–4.5, and SSP5–8.5 scenarios during 2021–2040, both internal and external irrigation pressures intensify across the basin, exhibiting pronounced nonlinear dynamics and spatial heterogeneity. Notably, Subregion 8 undergoes a structural shift in dominant pressure, transitioning from internally driven irrigation pressure in the historical period to externally driven irrigation appropriation in the future. Meanwhile, the growth rates of irrigation water withdrawal pressure are redistributed spatially: compared to the historical period, the growth of external irrigation pressure slows in downstream subregions (9–13), while it continues to increase in midstream and upstream subregions (2–8). The analysis identifies vulnerable components of the basin system, clarifies the spatial distribution of transboundary water pressures, and provides a basis for differentiated water governance strategies across the basin.
- Article
(5918 KB) - Full-text XML
- BibTeX
- EndNote


Irrigation water use accounts for the largest share of consumptive freshwater use globally and constitutes one of the most direct anthropogenic drivers of basin-scale hydrological change (Döll and Siebert, 2002; Tian et al., 2025; Zafarmomen et al., 2024). Under ongoing climate warming, alterations in the spatiotemporal distribution of precipitation, increased evapotranspiration, and changes in runoff seasonality are modifying basin-scale water availability and demand, thereby intensifying irrigation-related pressure on water resource systems. In transboundary river basins, such pressure is not only generated by local water use growth but is also propagated and potentially amplified through upstream–downstream connectivity within river networks, leading to complex patterns of water competition across regions. Consequently, it is estimated that between 290 million and 1.13 billion people worldwide are affected by irrigation-induced water stress in transboundary river basins (Munia et al., 2016).
The Lancang–Mekong River Basin is one of the world's most representative transboundary river systems, with water resources that are critical for agricultural production across riparian countries. Approximately 90 % of irrigation water use in these countries depends on the river, supporting the livelihoods of hundreds of millions of people (Li et al., 2019). However, the basin is highly sensitive to both climate change and human activities. Recent studies indicate that the regional warming rate exceeds the global average, while precipitation and runoff exhibit pronounced spatiotemporal variability (Pokhrel et al., 2018; Morovati et al., 2024b). Declining discharge trends have already been detected at several hydrological stations, with potential implications for irrigation water availability (Liu et al., 2022; Zhang et al., 2023; Morovati et al., 2024a). At the same time, anthropogenic pressures have further intensified water stress across the basin. Agricultural expansion has continued, resulting in a dense irrigation network that currently encompasses approximately 4 million ha of cultivated land and more than 11 000 irrigation projects, with the irrigated area projected to expand to around 6 million hectares by 2030. Together with rapid hydropower development, these changes have increased the complexity and uncertainty of irrigation water supply conditions throughout the basin (Li et al., 2017; Morovati et al., 2024b; Wang et al., 2023).
Accordingly, numerous studies have investigated water stress and its driving mechanisms in transboundary river basins (Chen et al., 2020; Do et al., 2020; Tian et al., 2020). Despite these important contributions, existing studies have largely focused on individual stressors or localized spatial scales, and systematic quantification of the relative contributions of intra-basin irrigation expansion and upstream competitive water appropriation in transboundary river basins remains limited. This research gap is largely associated with ongoing challenges in accessing consistent, high-resolution transboundary datasets and in developing basin-wide simulations that can simultaneously represent large-scale climate influences and fine-scale human-water interactions (Morovati et al., 2026). Across riparian regions, data availability remains uneven due to fragmentation and varying national data-sharing practices. Recent studies do not yet fully represent the complete conveyance pathway from water source to field, particularly in terms of spatially explicit canal infrastructure (Zhao et al., 2026). Consequently, the dominant sources of irrigation water withdrawal pressures across subregions and their spatiotemporal evolution are still not well understood. Under future climate scenarios, mismatches between irrigation water demand and available water supply are expected to intensify, while the relative roles of upstream competition and local water-use intensity may undergo substantial shifts (Wang et al., 2021; Yu et al., 2024). Such simplified attribution obscures the multi-driver nature of water stress and can introduce structural biases into basin-scale water resource assessments. These biases, in turn, hinder responsibility allocation and the formulation of differentiated governance strategies in transboundary river basins, particularly under future climate change scenarios where the balance between internal water-use expansion and external upstream pressures is likely to change.
To systematically elucidate the mechanisms underlying the formation and evolution of water resource stress, a number of integrated analytical frameworks have been proposed. Among them, the Pressure–State–Response (PSR) framework has been widely adopted in water resource system studies due to its clear causal structure linking human activities, changes in water resource conditions, and societal management responses (Zhang et al., 2025). Compared with single-indicator or static assessment approaches, the PSR framework enables structured decomposition of water resource stress, allowing systematic identification of its sources, pathways, and potential intervention points. Previous studies have demonstrated its applicability not only at local scales but also its strong potential for basin-scale analysis (Hazbavi et al., 2020).
Building on this, this study develops a PSR analytical framework to systematically elucidate the evolutionary dynamics of irrigation-induced water resource stress in the Lancang–Mekong River Basin. By leveraging remote-sensing-based intelligent canal system identification and harmonized regional datasets to overcome historical transboundary data limitations, this study enables a more spatially explicit simulation of irrigation water dynamics across the basin. Within this framework, climate change and upstream irrigation-induced water appropriation are treated as the primary pressure drivers, regional water availability is represented as the core state variable, and system responses are characterized by irrigation water stress types. Using this framework, we analyse the spatiotemporal patterns and evolution of irrigation pressures at both annual and seasonal scales, with particular attention to shifts in dominant stress regimes and the reorganization of their growth trajectories. Furthermore, a basin-scale subregional irrigation water withdrawal pressure types classification framework is developed by integrating internal and external irrigation pressure changes and dominant pressure. This integrated approach aims to advance understanding of the nonlinear evolution of irrigation water withdrawal stress and the resilience of transboundary river basin systems.
2.1 Study area
The Lancang–Mekong River Basin is not only an important transboundary river system of the Indochina Peninsula but also one of the most important agricultural regions in the world. Over the past four decades, the irrigated area in the Lancang–Mekong Basin has exhibited a sustained expansion (Fig. 1), with a multi-year average of approximately 27 000 km2. During 2020–2024, the irrigated area reached its maximum, about 43 000 km2. The period 2000–2009 experienced the most rapid growth compared with 1990–1999, with an increase of up to 56 %, whereas the growth rate slowed considerably to 15 % during 2010–2019. Notably, the recent period (2010s–2024) shows a renewed upward trend, with a cumulative increase of 21 %. Agricultural land is projected to expand by 65 % by 2060 (Morovati et al., 2024b), with surface water expected to supply 97 % of irrigation demand (AQUASTAT, 2014; Tatsumi and Yamashiki, 2015).
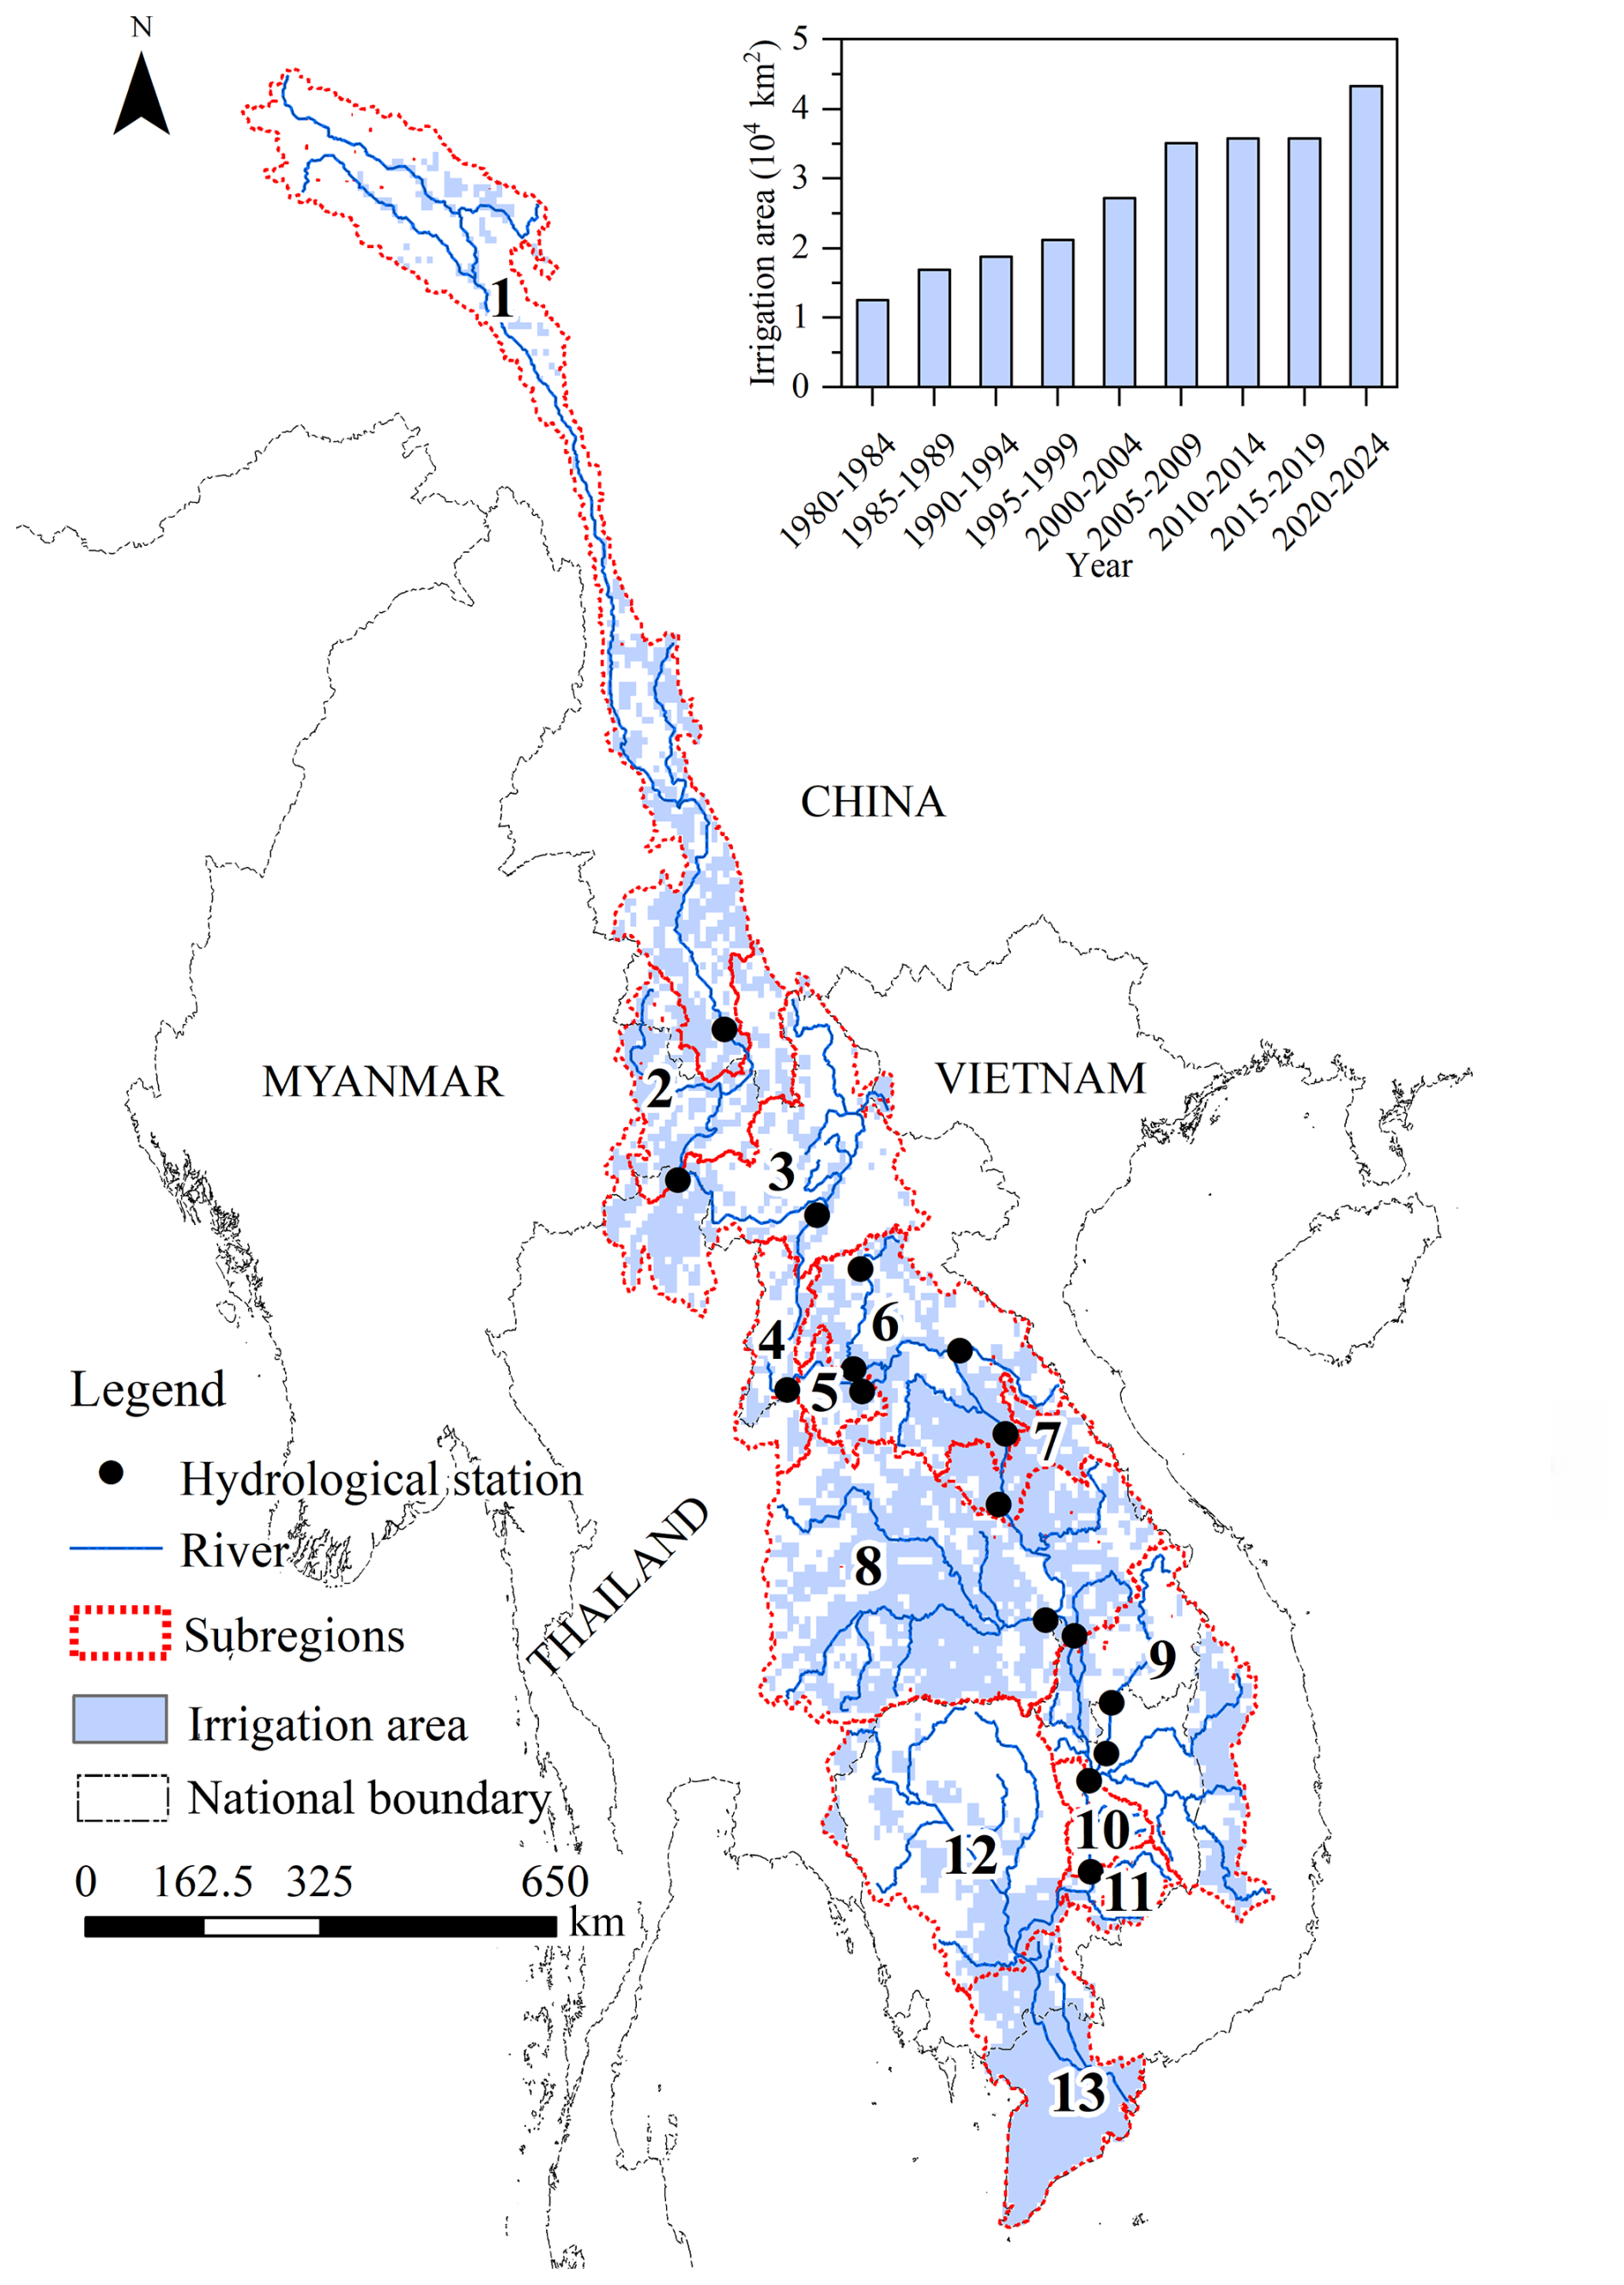
Figure 1Spatial distribution of hydrological stations, river network, subregions, and irrigation areas in the Lancang–Mekong River Basin. The irrigation areas shown in the map represent the distribution in 2020. The inset shows the temporal evolution of basin-wide irrigation area during 1980–2024. Irrigated area data were obtained from the FAO Global Map of Irrigation Areas dataset and further combined with Global Area Equipped for Irrigation in the 21st Century (2000–present) and the Spatial Production Allocation Model dataset.
2.2 Data sources and preprocessing
The datasets used in this study include meteorological variables (precipitation and potential evapotranspiration), hydrological and hydraulic data (runoff, irrigation canals, and reservoir operations), and land-surface characteristics (soil types, vegetation indices, and spatial distribution of irrigated areas).
Historical meteorological data for the period 1980–2024 were obtained from the ERA5-Land dataset and were used to estimate agricultural irrigation water demand, calibrate climate projections from the Coupled Model Intercomparison Project Phase 6, and drive the hydrological model. ERA5-Land provides precipitation, temperature, and potential evapotranspiration variables at a spatial resolution of 0.1°. Given the potential uncertainties in precipitation and evapotranspiration estimates, ERA5-Land precipitation and potential evapotranspiration (PET) were bias-corrected using historical observations from 110 meteorological stations distributed across the basin for the period 2000–2020, applying a monthly scaling coefficient method.
Future climate conditions for the period 2021–2040 were represented using a multi-model ensemble from CMIP6 under three representative Shared Socioeconomic Pathway (SSP) scenarios: SSP1–2.6 (low-emission), SSP2–4.5 (medium-emission), and SSP5–8.5 (high-emission). Based on performance evaluations for the Mekong River Basin, five global climate models (GCMs) were selected: GFDL-ESM4, IPSL-CM6A-LR, MPI-ESM1-2-HR, MRI-ESM2-0, and UKESM1-0-LL (Eyring et al., 2016; Gidden et al., 2019), ensuring the robustness of climate projections. To enhance the reliability of future climate simulations, CMIP6 outputs were subjected to a rigorous bias-correction procedure. First, bilinear interpolation was applied to downscale the five GCM datasets with varying native resolutions to a unified spatial resolution of 0.1°, consistent with ERA5-Land. Subsequently, a multivariate bias correction method based on N-dimensional probability density function transformation (Multivariate Bias Correction) was employed. This approach uses historical ERA5-Land data as a reference to establish correction relationships with corresponding CMIP6 simulations and applies these relationships to future CMIP6 projections, thereby correcting systematic biases in key climate variables, including precipitation and temperature.
Daily streamflow data were obtained from the Mekong River Commission (MRC) database (https://portal.mrcmekong.org/home, last access: 26 January 2026). Observed discharge records from 15 key hydrological stations along the main stem and major tributaries of the Mekong River were used for hydrological model calibration and validation during the period 2000–2020. These stations include Jinghong, Chiang Sean, Chiang Khan, Nong Khai, Nakhon Phanom, Mukdahan, Pakse, Stung Treng, Kratie, Chantangoy, Siempang, Pak Mun, Phonesy, Tha Ngon, and Ban Pak Kanhoung.
Irrigation canal network data were derived from high-resolution Google satellite imagery with a spatial resolution of 0.5 m, which was downloaded through the MapGIS software platform. Irrigation canals were identified using a deep learning–based intelligent remote sensing recognition model. Canal headworks were extracted and treated as irrigation water abstraction points for the irrigation water-withdrawal analysis (Zhao et al., 2025). Reservoir data were obtained from the MRC and the Mekong Region Futures Institute (MERFI, 2024). The dataset includes reservoir locations, storage capacities, and years of operation, covering both existing and planned reservoirs during the period 1965–2035, and was used to represent basin-scale water storage and regulation capacity in the analysis.
Soil data were obtained from the global soil database of the Food and Agriculture Organization of the United Nations (FAO). The dataset has a spatial resolution of 10 km × 10 km and provides key soil parameters used in the hydrological model. The normalized difference vegetation index (NDVI), leaf area index (LAI), and snow cover fraction were derived from MODIS products, with a spatial resolution of 500 m × 500 m and a temporal resolution of 16 d. These datasets were used as input variables to drive the hydrological model, representing vegetation and land-surface conditions affecting evapotranspiration and runoff processes.
Irrigated area data were obtained from the FAO Global Map of Irrigation Areas dataset (available at https://data.apps.fao.org/catalog/dataset, last access: 26 January 2026), which integrates national and subnational irrigation statistics with geospatial information on irrigation locations and extents. The spatial distribution of irrigated area was further combined with the Global Area Equipped for Irrigation in the 21st Century (2000–present) and the Spatial Production Allocation Model (SPAM) dataset to represent irrigated area distribution across the basin during the period 1980–2024 (Mehta et al., 2024). Spatial distributions of irrigated crop types were derived from the SPAM Global dataset, which includes information for 46 crop types and has a spatial resolution of 10 km × 10 km (IFPRI, 2024; https://www.mapspam.info/data/, last access: 20 January 2026).
2.3 Methodology
This study employs the Pressure–State–Response (PSR) analytical framework to systematically assess the spatial patterns and evolution of water pressure in the Lancang–Mekong Basin under the combined influences of irrigation water withdrawal and climate change. Upstream irrigation withdrawal and climate change were identified as the primary sources of pressure, while changes in regional water availability were used to characterize the system's state (Fig. 2). In this study, two reservoir operation scenarios were considered to isolate the effects of hydraulic infrastructure: (1) a scenario without reservoir operation (pre-dam), representing natural flow conditions without regulation by dams; and (2) a scenario with reservoir operation (post-dam), which explicitly accounts for reservoir storage and release processes based on historical commissioning dates and operating rules. Reservoir operations in the model are represented using a rule-based module designed to balance hydropower generation and downstream water requirements, which have been validated for the Lancang–Mekong River cascade (Zhang et al., 2026). Specifically, reservoir regulation is governed by operating rules that optimize storage and release based on seasonal water availability and hydropower demand. These rules ensure that reservoir storage remains within defined safety and operational limits while maximizing hydropower benefits. To account for downstream water needs, minimum environmental flow requirements are imposed as baseline constraints on all release processes. This ensures that essential ecological functions and agricultural water demands are maintained under varying hydrological conditions. In terms of model structure, major reservoirs with significant downstream irrigation dependencies are explicitly represented as individual units. In contrast, smaller or less influential reservoirs are aggregated into reservoir complexes to reduce computational burden while preserving the overall regulation effect at the basin scale.
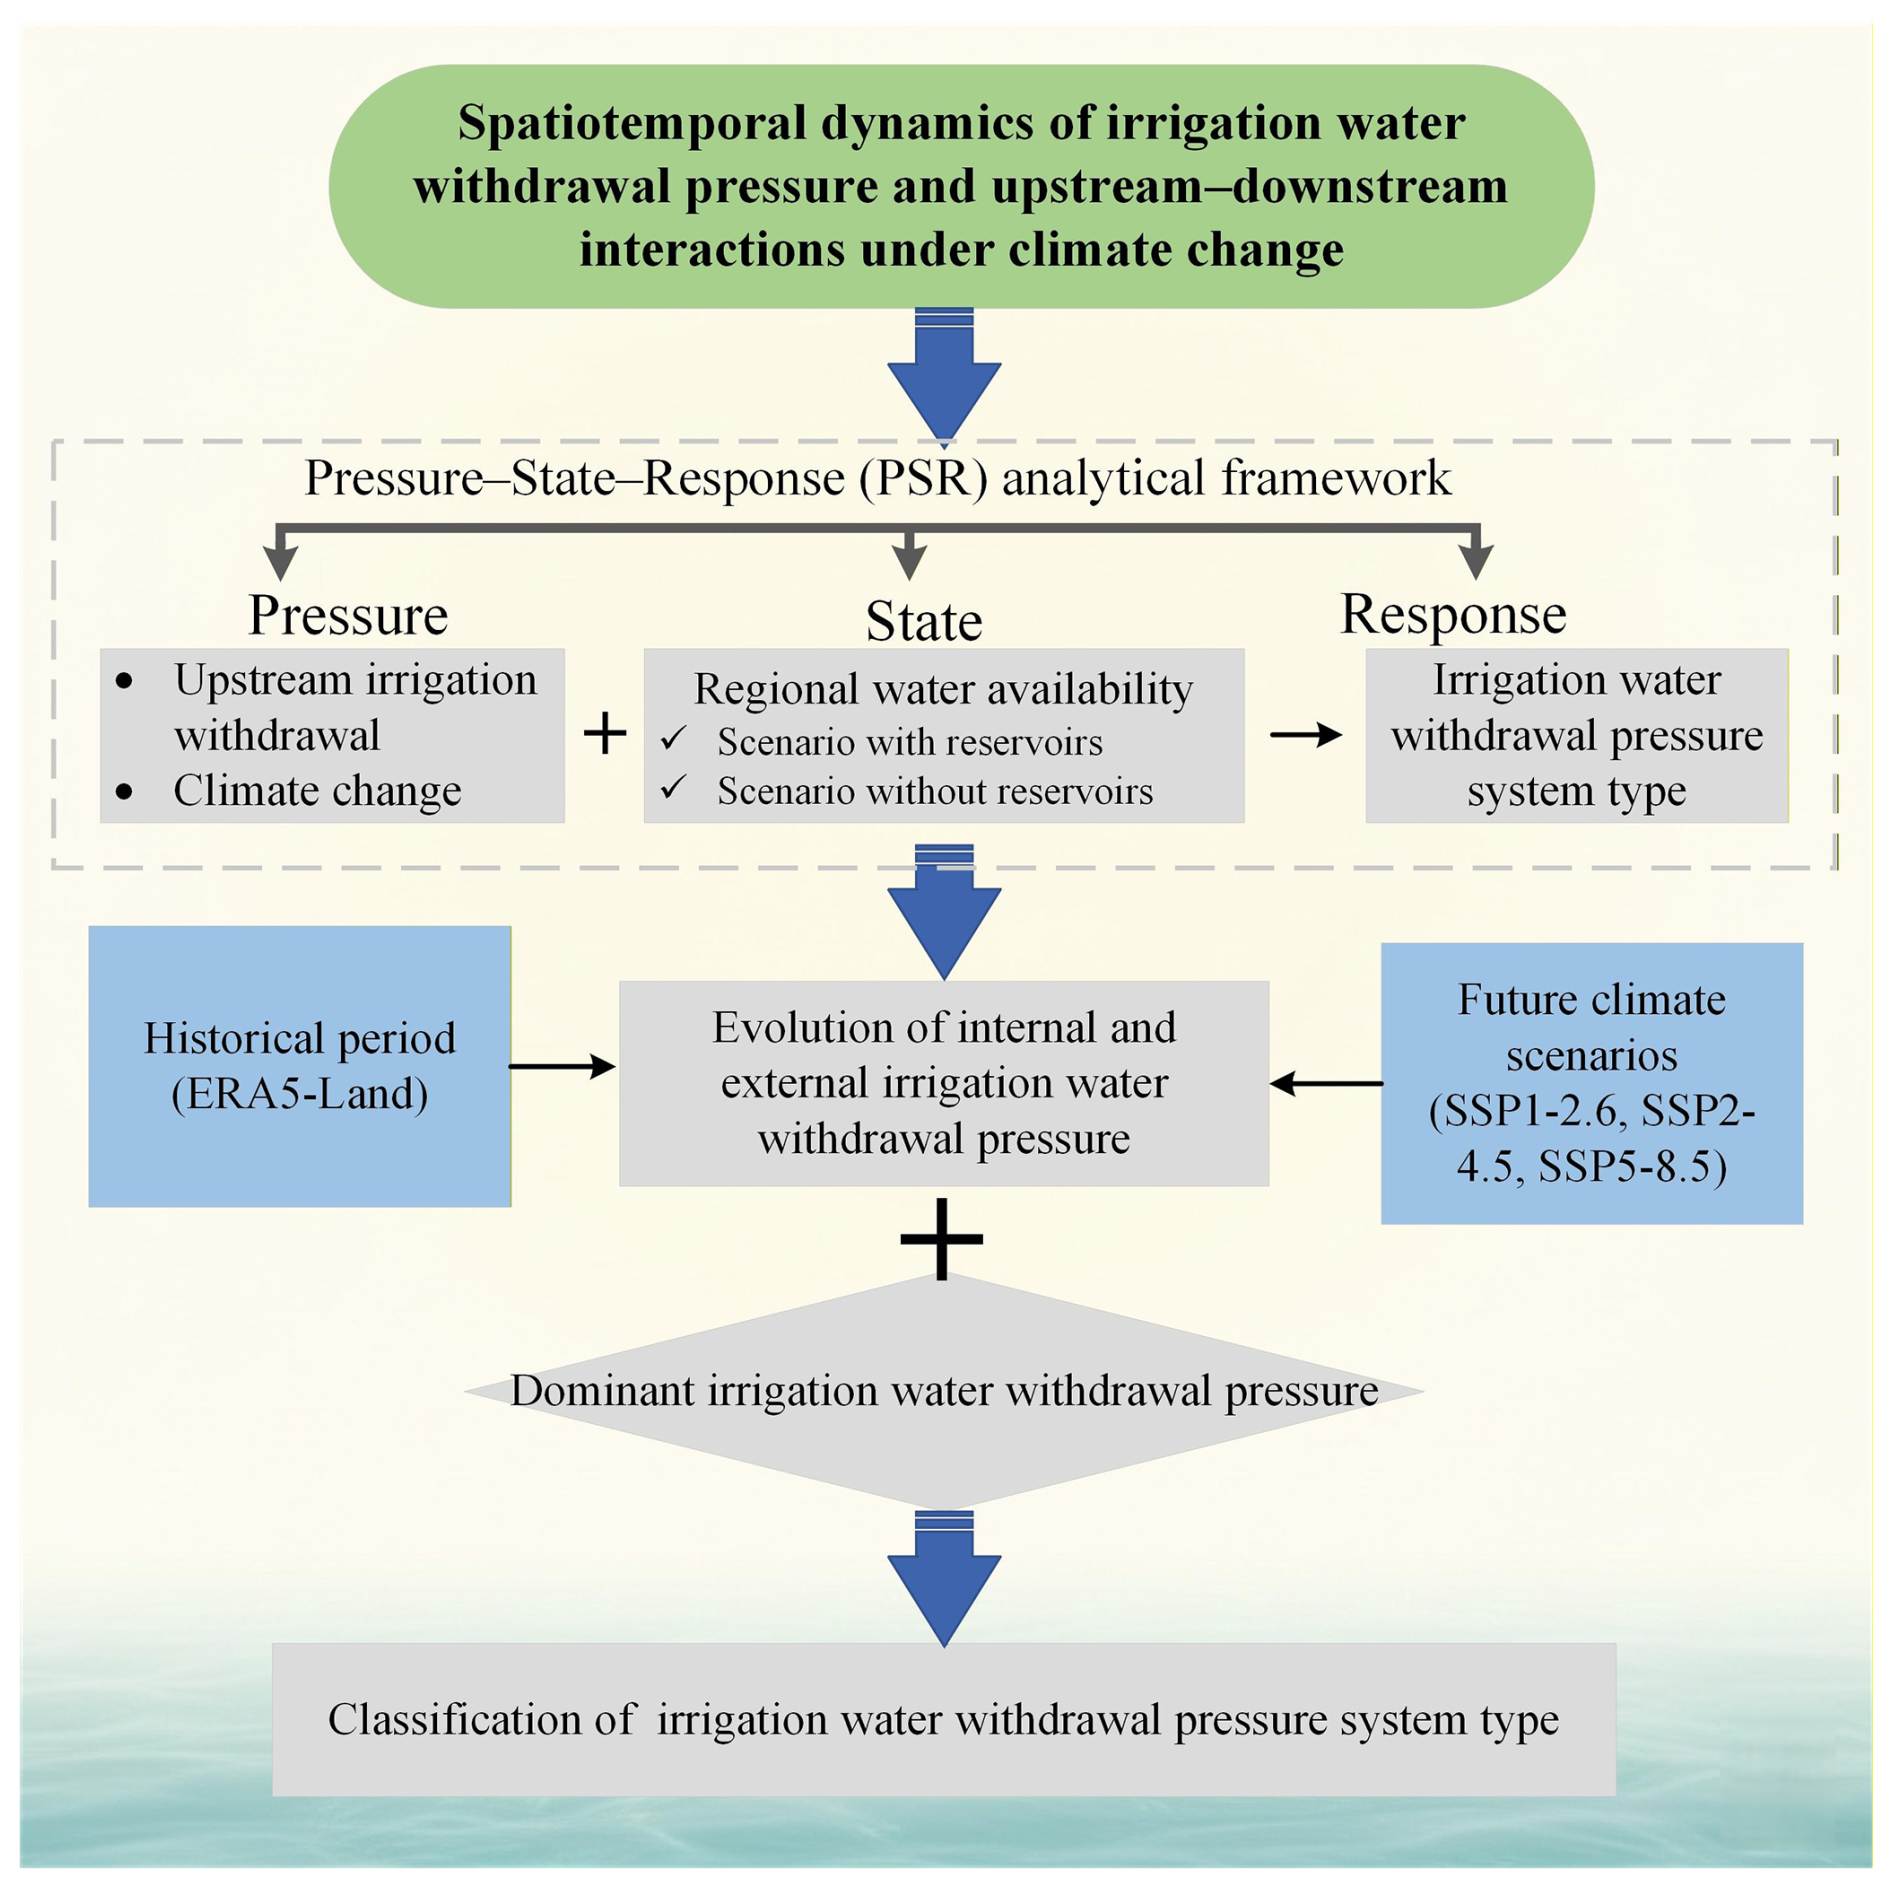
In addition, we defined two pressure indicators: (1) internal irrigation water withdrawal pressure (internal irrigation pressure), measured as the proportion of local irrigation withdrawal relative to regional available water, and (2) external irrigation water withdrawal pressure (external irrigation pressure), measured as the proportion of the reduction in regional water availability caused by upstream irrigation withdrawal. Dominant irrigation water withdrawal pressure (dominant irrigation pressure) characteristics for each subregion were identified by jointly considering these two indicators. Specifically, a subregion is classified as internally dominated if its internal irrigation pressure exceeds external irrigation pressure; otherwise, it is categorized as externally dominated. Finally, by considering the change of internal and external irrigation pressure along with the dominant irrigation pressure, we define the irrigation water withdrawal pressure system (irrigation pressure system) type of each subregion as the system's response.
This study calculated monthly runoff and irrigation water withdrawal for each sub-basin of the Lancang–Mekong River Basin for the period 1980–2020. 30 % simulated runoff was reserved as environmental flow. This threshold is broadly supported by the “Good” ecological condition defined by the Tennant Method (Tennant, 1976), which has been widely applied in environmental flow assessments. It is further supported by previous studies indicating that an environmental flow requirement of approximately 30 % of the mean annual runoff is necessary to sustain fundamental ecosystem processes in the Lancang–Mekong River Basin (Smakhtin et al., 2004). The remaining portion was defined as available water. The methods used to simulate runoff and irrigation water withdrawal are described as follows. Runoff was simulated at a daily scale and aggregated to monthly values, while irrigation water withdrawals were calculated directly at the monthly scale.
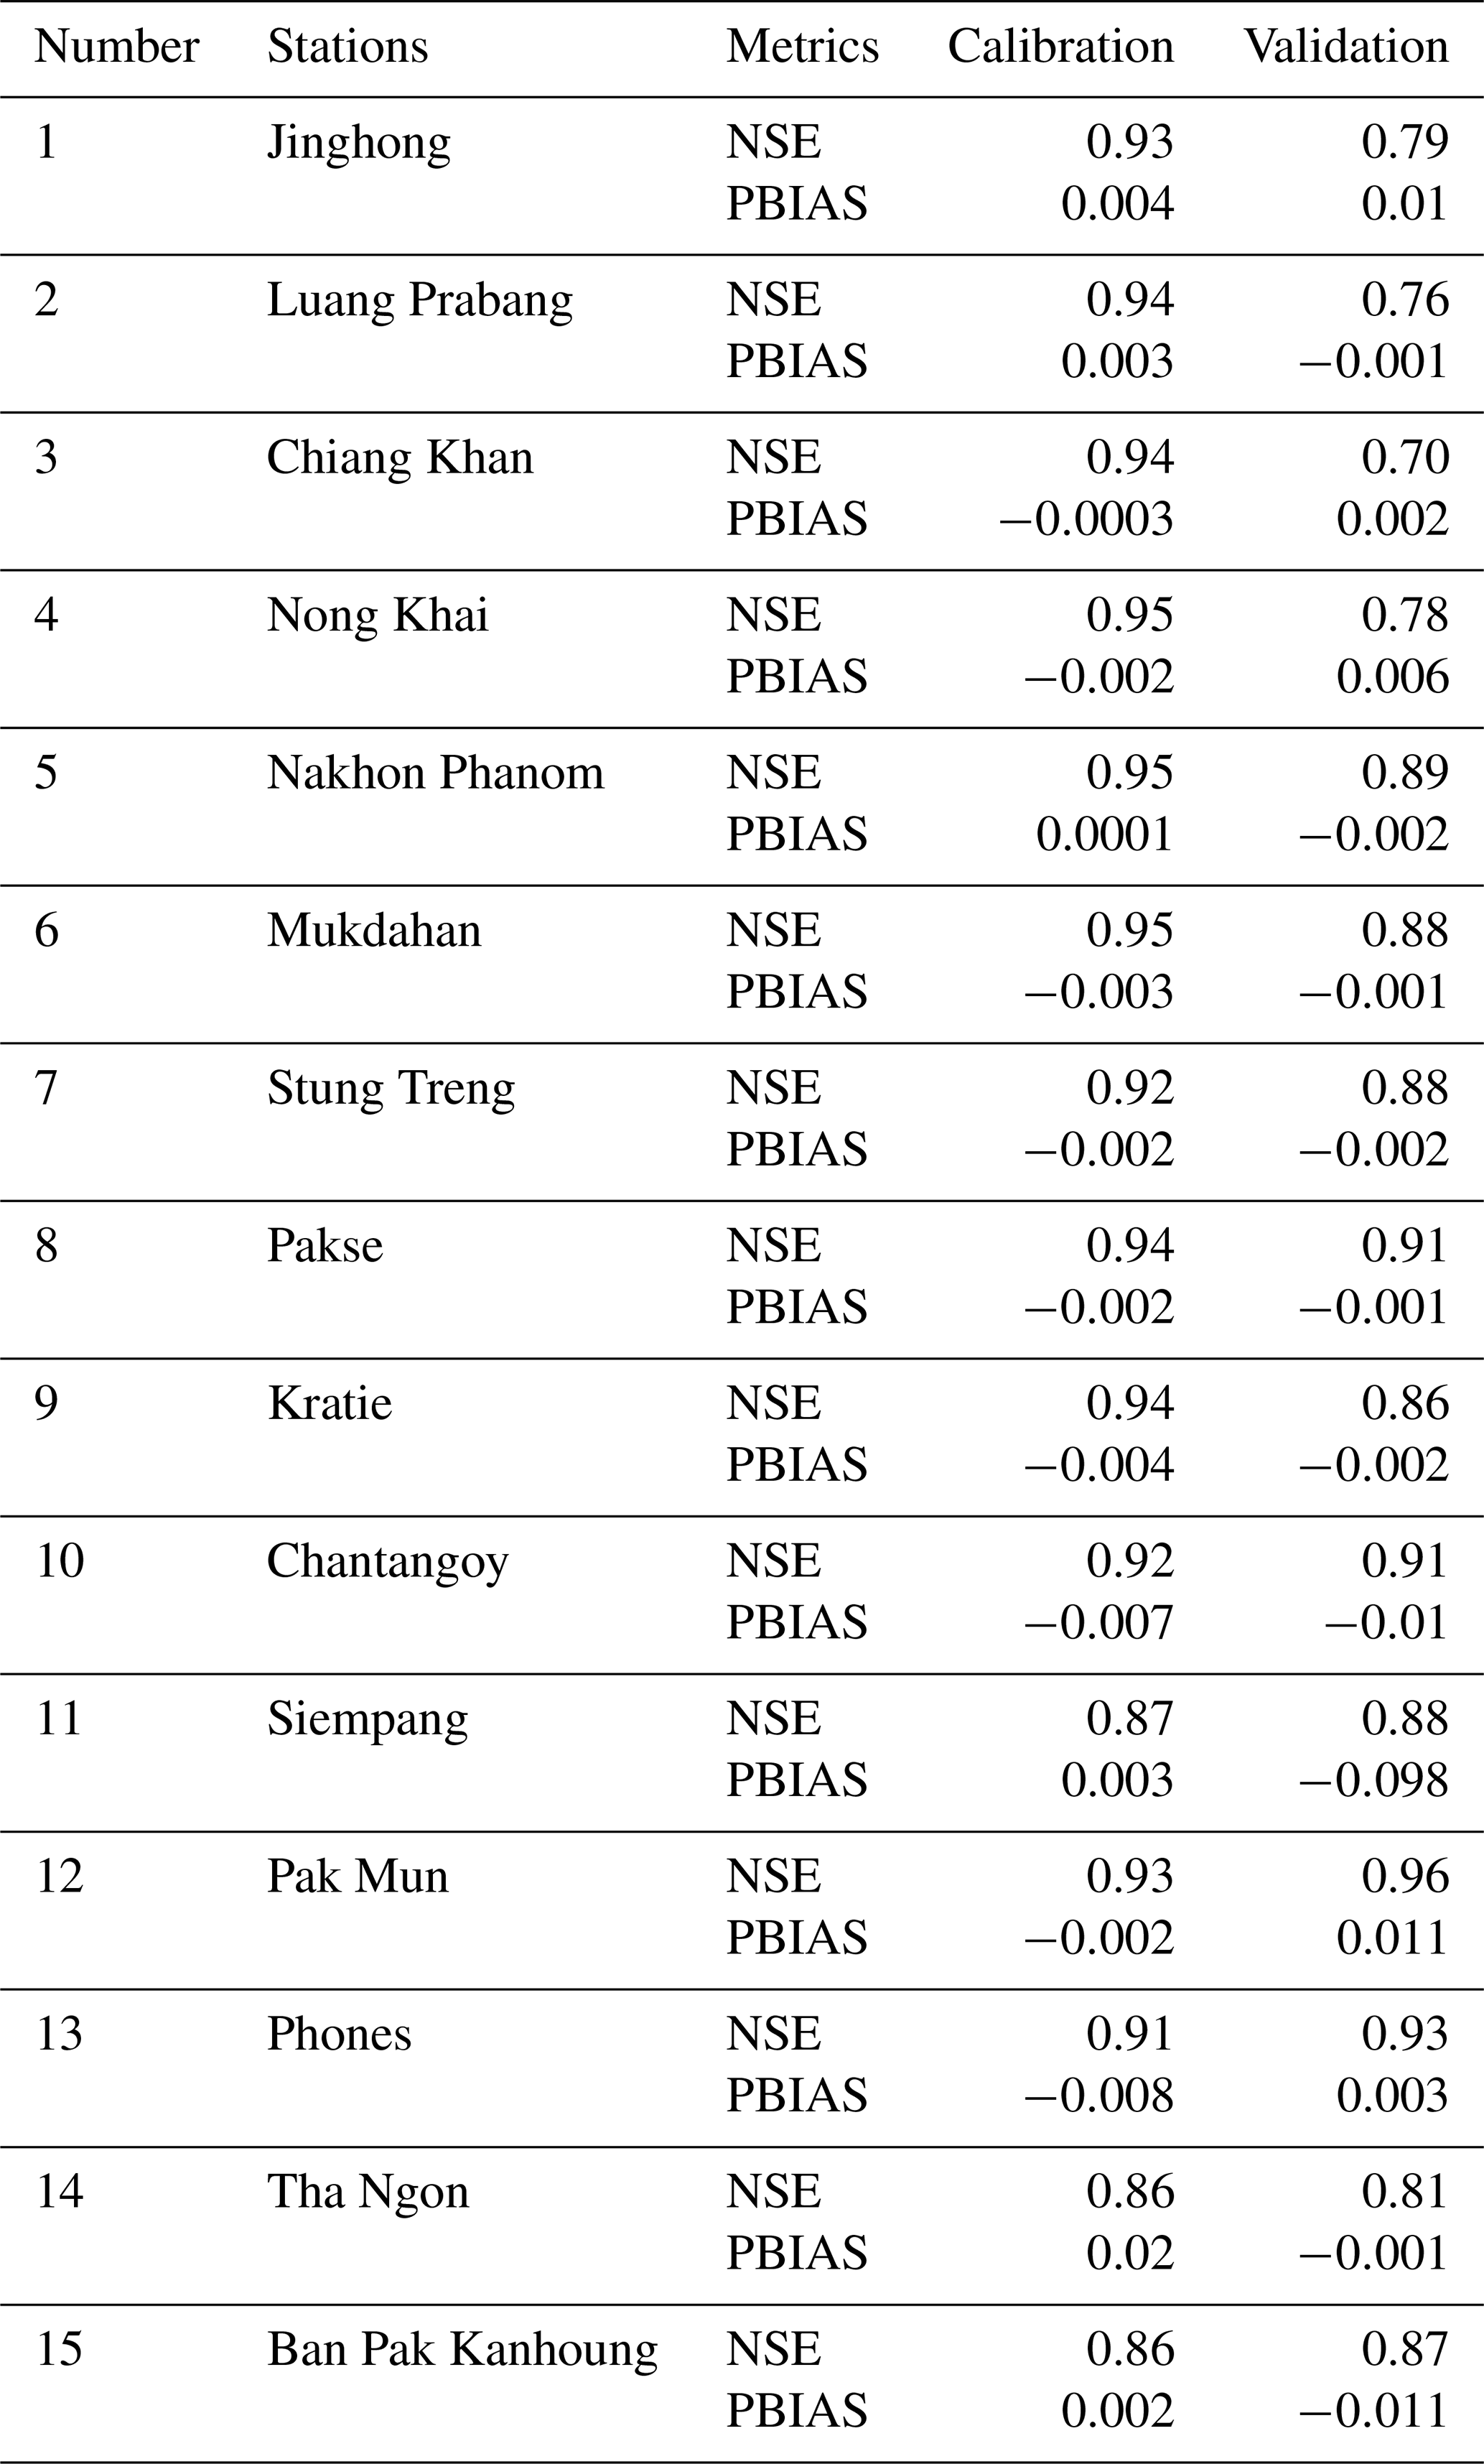
Table 1NSE and PBIAS (%) of the THREW model at hydrological stations.
-
Runoff simulation. This study utilizes the Tsinghua Representative Elementary Watershed (THREW) hydrological model to simulate daily runoff processes. Rooted in watershed thermodynamic systems theory, THREW simulates the exchange of energy, momentum, mass, and entropy within the system (Tian et al., 2012). The model adopts the Representative Elementary Watershed (REW) as the fundamental computational unit, which is delineated based on hydro-geomorphological characteristics rather than administrative or political boundaries. Within this framework, the watershed is structured vertically into surface and subsurface layers. The surface layer is further divided into six sub-layers, while the subsurface layer consists of two sub-layers, enabling a detailed representation of hydrological processes. In addition, irrigation withdrawals are represented as discrete nodes along river reaches. Water extraction at these nodes directly alters local streamflow, which is subsequently routed through the river network across interconnected REWs using a node-link structure. This setup allows the model to capture hydrological connectivity as well as lateral interactions between riparian regions, including transboundary effects where water use on opposite riverbanks influences the same river reach. The model integrates multi-source forcing data, including precipitation, air temperature, potential evapotranspiration, Leaf Area Index, Normalized Difference Vegetation Index, soil properties, land use, and Digital Elevation Model. The THREW model has been successfully applied in the Lang-Mekong River Basin (Morovati et al., 2023; Zhang et al., 2023).
To ensure consistency between model inputs and evaluation data, the model calibration and validation were conducted over the period 2000–2020, during which both meteorological and streamflow data were available. The calibration period is defined as 2000–2009, and the validation period as 2010–2020. Model performance is evaluated using the Nash–Sutcliffe Efficiency (NSE) coefficient and the Percent Bias (PBIAS), calculated as follows:
In the equation: n is the number of observations; Qo denotes the observed streamflow; Qs denotes the simulated streamflow; and represents the mean of the observed streamflow. The closer the NSE is to 1, and the PBIAS is to 0, the better the simulation performance. Table 1 shows that at all stations, both calibration and validation achieved NSE >0.76 and %, demonstrating the model's high reliability.
-
Irrigation water withdrawal estimation. This study first integrated spatial datasets using geographic information system (GIS) overlay analysis. These datasets include sub-basin boundaries, agricultural irrigation districts, irrigation canal networks, and crop planting patterns. This process enabled the spatially explicit identification of irrigation abstraction points, the service areas of each irrigation node, and the corresponding crop types.
Based on this information, crop net irrigation water demand was calculated following the crop water requirement approach recommended by the Food and Agriculture Organization of the United Nations. The calculation incorporated potential evapotranspiration, precipitation, and crop coefficient data. Net irrigation water demand (IR) at each irrigation node was estimated by accumulating the monthly differences between crop evapotranspiration (ET) and effective precipitation (Peff). The calculation is expressed as follows:
Where m represents the crop growth season length (months) and j denotes the month index; monthly crop evapotranspiration (ET) is calculated as follows:
Kc denotes the crop coefficient (Allen et al., 1998; FAO, 2019), and PET represents potential evapotranspiration.
Effective precipitation is determined via the SCS method (USDA, 1967), with the calculation given by:
P denotes monthly precipitation, and f represents the correction factor.
Following the estimation of net irrigation requirements, actual irrigation water withdrawal is calculated by incorporating variations in irrigation efficiency coefficients of different irrigation areas (Koponen et al., 2017). Specifically, Actual irrigation water use is obtained by dividing the net irrigation demand by the corresponding efficiency factors. For scenarios involving irrigation expansion, the increase in irrigated area is projected based on development plans outlined in MRC reports (Koponen et al., 2017).
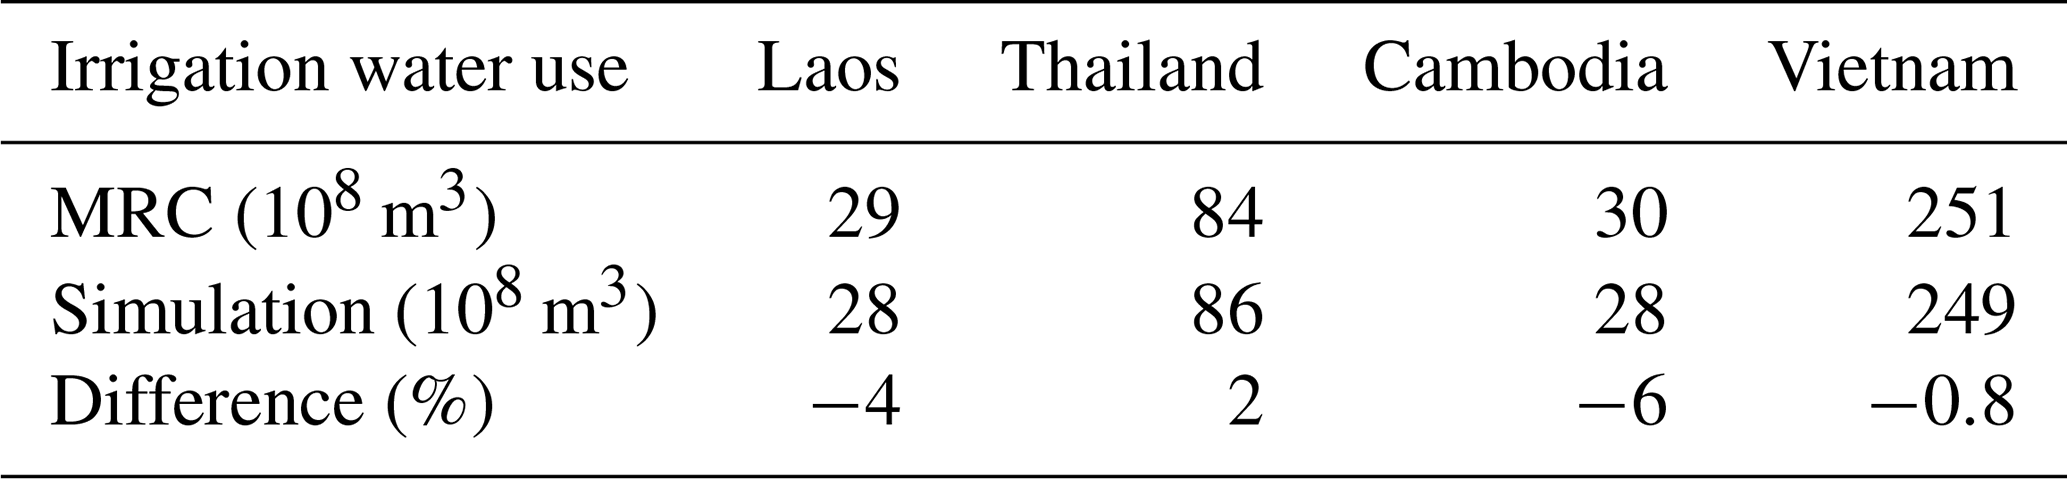
Simulated irrigation water withdrawal under historical conditions closely matched reported national irrigation statistics from the MRC (Koponen et al., 2017). For Laos, Thailand, Cambodia, and Vietnam, simulated estimates differed from reported values by less than 6 % (Table 2), which is acceptable for basin-scale irrigation water withdrawal modelling.
Table 2Comparison between simulated and reported irrigation water withdrawal in 2007.
3.1 Historical spatiotemporal distribution and evolution of internal and external irrigation pressure
3.1.1 Changes in the basin-wide ratio of irrigation water withdrawal to available water
The results (Fig. 3) show that the proportion of irrigation water withdrawal relative to available water in the basin increased steadily from 1980 to 2020 at both annual and dry-season scales. This upward trend reflects the combined effects of a sustained decline in natural runoff since 2000 and a continuous increase in irrigation water withdrawal. Under the no-reservoir scenario, irrigation withdrawal accounted for an average of 8 % of available water on an annual basis and 27 % during the dry season over the period 1980–2020. During 1980–2009, these proportions were lower, at 6 % annually and 23 % in the dry season. In contrast, during 2010–2020, the dry-season proportion increased markedly to 36 %, while the annual proportion rose to 11 %. Following the rapid expansion of reservoir infrastructure after 2010, the reservoir scenario exhibits a slight moderation of irrigation pressure. Under this scenario, irrigation withdrawal accounted for 10 % of available water annually and 34 % during the dry season over 2010–2020. Although reservoir regulation has slightly alleviated irrigation pressure, the overall reduction in natural runoff means that basin-wide irrigation water stress continues to increase.
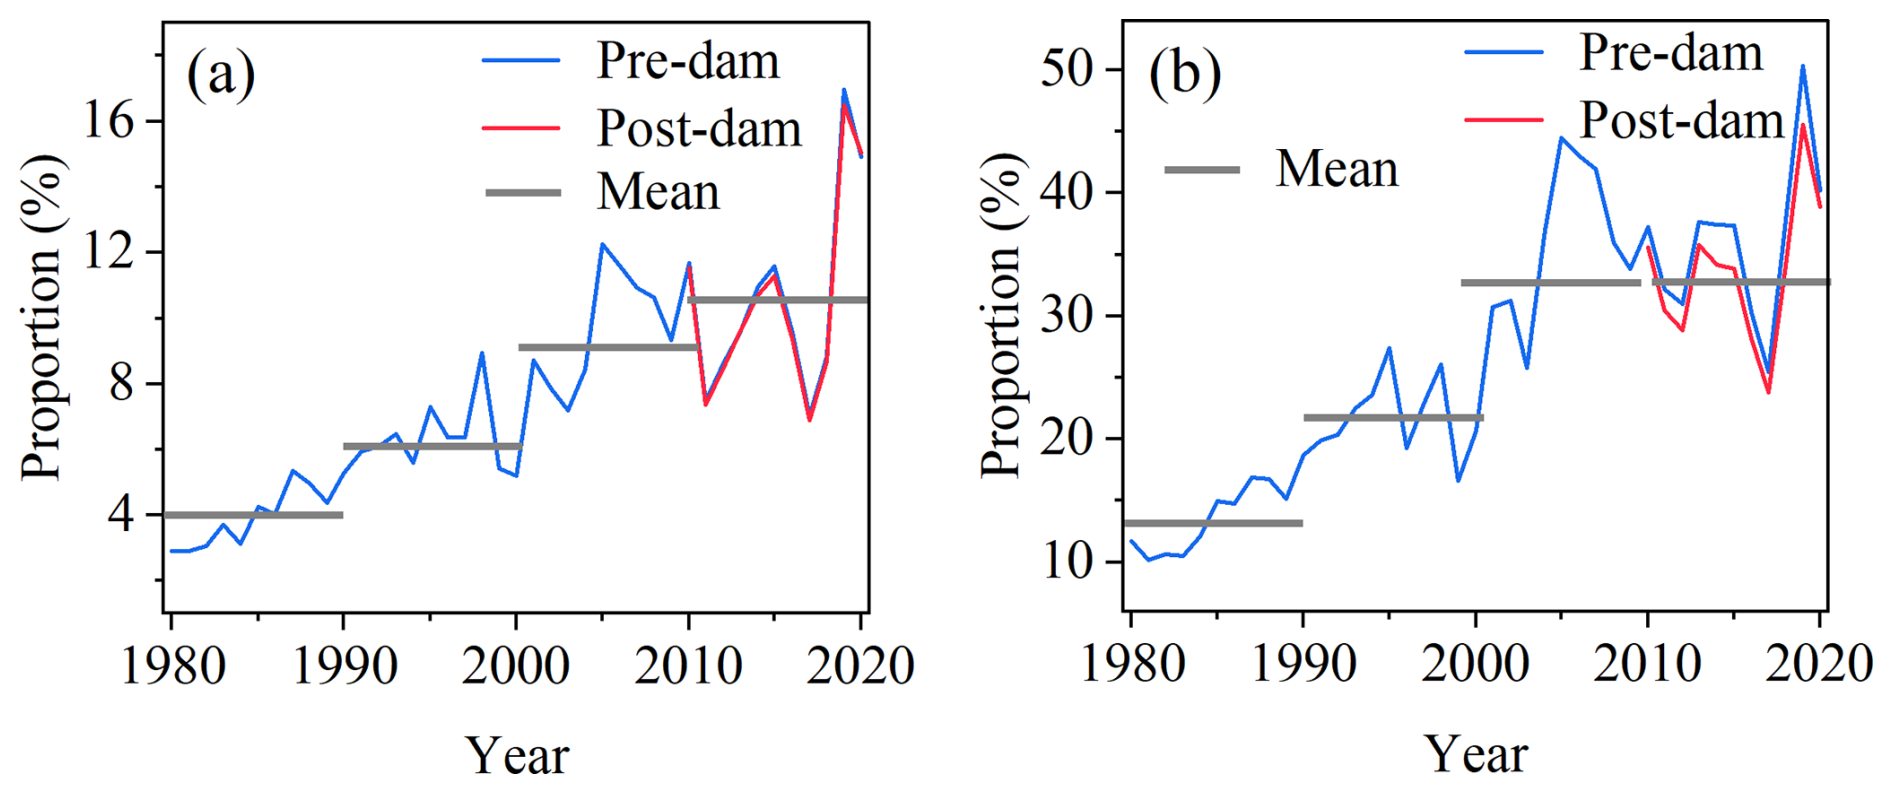
Figure 3Temporal variation in the proportion of irrigation water withdrawal to available water in the Lancang–Mekong River Basin during 1980–2020 at the basin scale: (a) annual scale and (b) dry season scale. The blue line represents the pre-dam period, the red line represents the post-dam period, and the grey horizontal lines indicate the mean values for the corresponding periods.
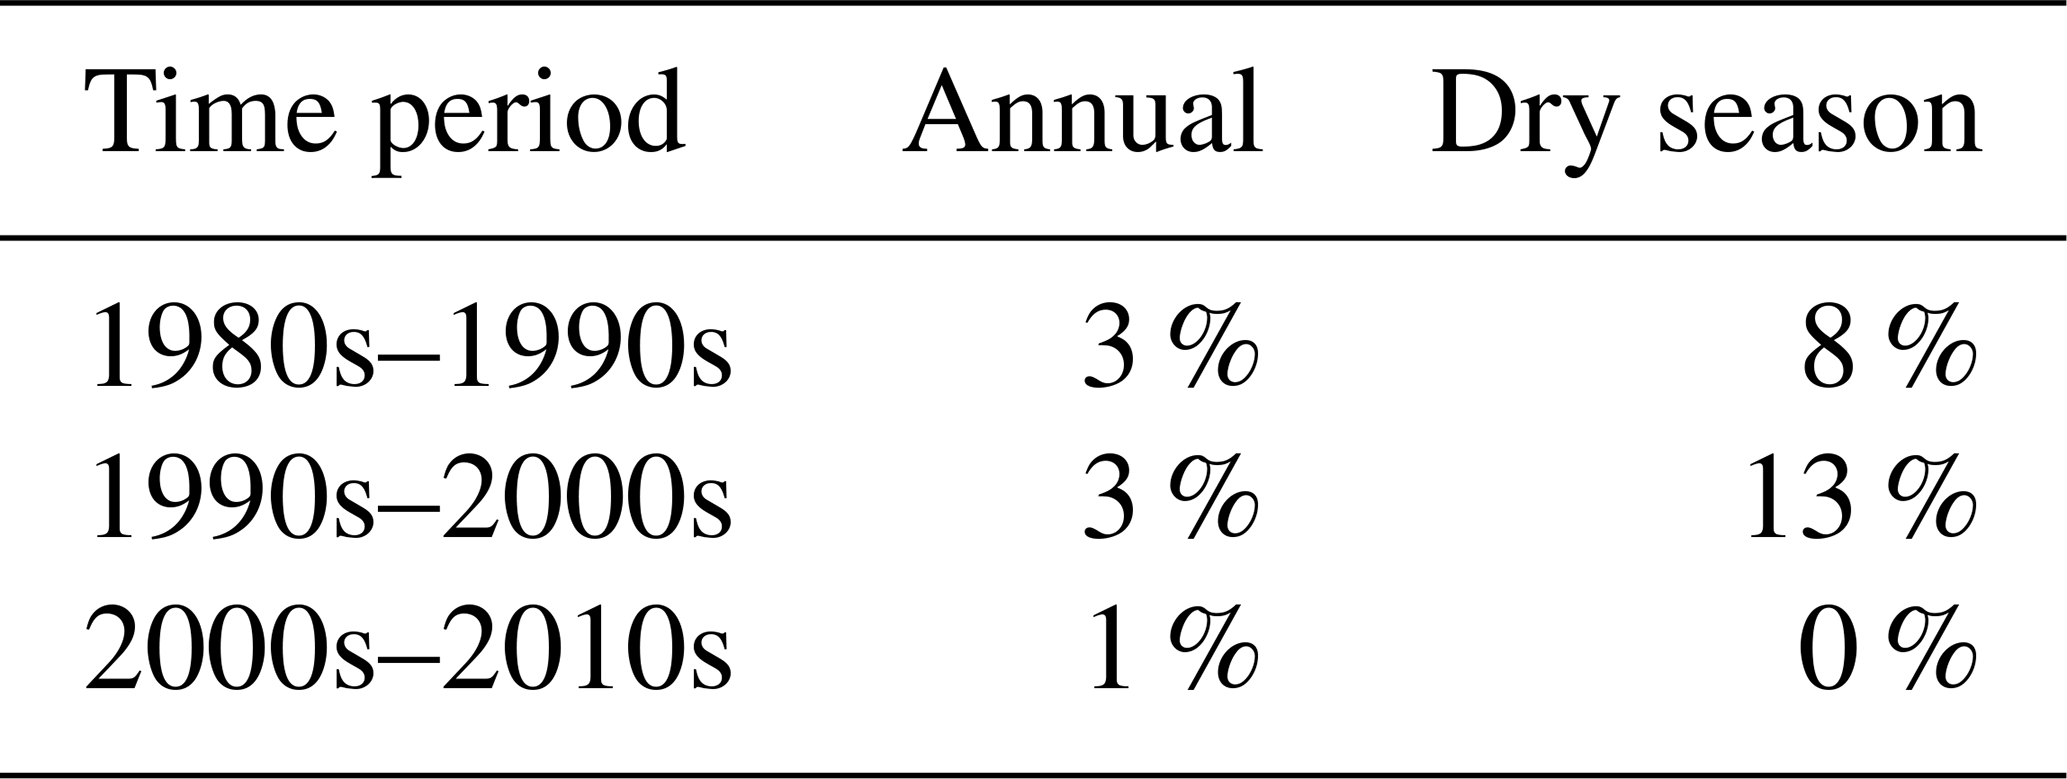
Decadal statistics indicate that, at the annual scale, the growth rates of the ratio of irrigation water withdrawal to available water were broadly similar during the 1980s–1990s and the 1990s–2000s, each at approximately 3 % (Table 3). In both periods, the increase was driven primarily by expansion in irrigation water withdrawal. Based on the irrigation water withdrawal and available water data, irrigation withdrawal rose by 53 % in the 1980s–1990s and by 44 % in the 1990s–2000s, whereas available water declined by 7 % in the former period and remained essentially unchanged in the latter. During the 2000s–2010s, the annual growth rate slowed markedly to 1 %, reflecting stable water availability and a much smaller increase in irrigation withdrawal (7 %). At the dry-season scale, the growth rate of the irrigation-to-availability ratio peaked at 13 % in the 1990s–2000s before dropping sharply to nearly zero in the 2000s–2010s.
Table 3Percentage growth of basin irrigation water relative to available water over different periods.
3.1.2 Spatial heterogeneity of internal and external irrigation pressure across subregions
As shown in Fig. 4a, pronounced spatial heterogeneity characterizes the multi-year mean (1980–2020) ratio of irrigation water withdrawal to available water across the 13 subregions of the Lancang–Mekong Basin. The downstream delta region (Subregion 13) exhibits the highest ratios. At the annual scale, irrigation withdrawal accounts for approximately 4 % of available water, increasing to nearly 15 % during the dry season. Despite relatively abundant water resources, this region sustains very high absolute irrigation demand, contributing about 56 % of total basin-wide irrigation withdrawal over 1980–2020.
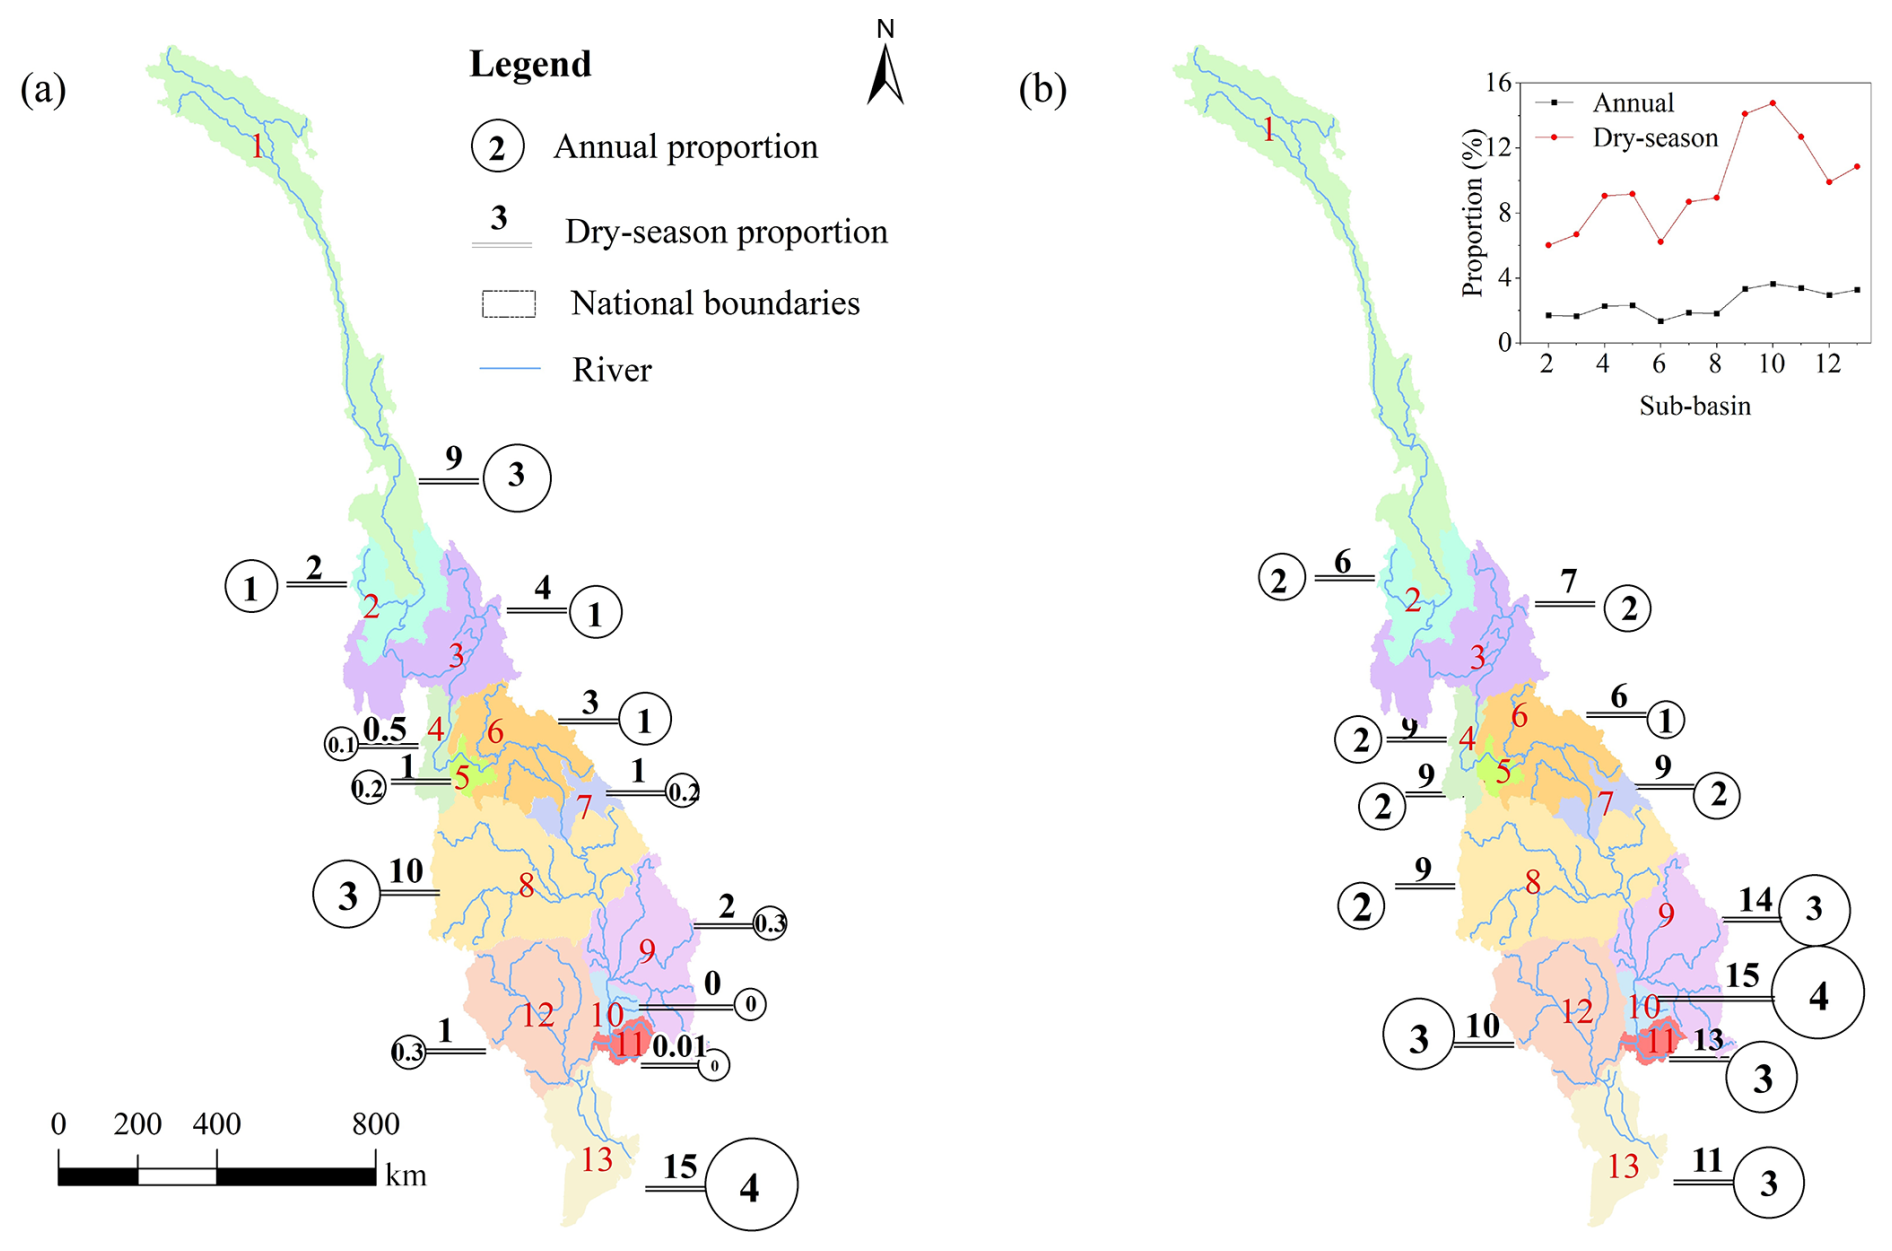
Figure 4Spatial patterns of irrigation pressure across the 13 subregions of the Lancang–Mekong River Basin during 1980–2020 at both annual and dry-season scales: (a) ratio of local irrigation water withdrawal to available water (internal irrigation pressure), and (b) ratio of upstream irrigation-induced reductions in subregional available water (external irrigation pressure). Colored polygons represent the delineated subregion. The inset panel compares the multi-year average external pressure at both annual and dry-season scales among subregions.
The second-highest ratios occur in the midstream region (Subregion 8, mainly in Thailand), with values of approximately 3 % annually and 10 % during the dry season. The upstream region (Subregion 1, mainly in China) ranks third. Although this subregion accounts for only about 4 % of total basin irrigation withdrawal, it contains roughly 10 % of basin-wide available water. Consequently, irrigation withdrawal represents a relatively high share of local water availability, indicating pronounced internal irrigation pressure.
Figure 4b shows that the impact of upstream irrigation withdrawal (pressure) on subregional water availability (state) also exhibits pronounced spatial heterogeneity. Downstream subregions are generally more strongly affected than upstream ones, whereas impacts in the midstream subregions (7–8) are comparatively lower.
At the annual scale, due to the propagation effect of upstream irrigation withdrawal, available water in the upper- and midstream subregions decreases on average by 1 %–2 %. In the downstream subregions (9–13), the reduction in available water is larger, reaching about 3 %–4 %. At the dry-season scale, the influence of upstream irrigation withdrawal is further amplified. Available water in the upper- and midstream subregions declines by roughly 6 %–9 %, whereas in the downstream subregions (9–13), the reduction reaches approximately 10 %–15 %.
Dominant irrigation pressure characteristics were identified by jointly considering internal irrigation pressure and external irrigation pressure (Fig. 4a, b). Results indicate that Subregions 1, 8, and 13 exhibit substantially higher proportions of local irrigation water withdrawal relative to available water than upstream-induced reductions. The irrigation pressure in these subregions is therefore internally dominated. In contrast, the remaining subregions are primarily influenced by the propagation of upstream competitive water withdrawal and display a spatial pattern dominated by external irrigation pressure.
3.1.3 Changes in internal and external irrigation pressure across subregions
Considering internal and external irrigation pressure separately, external pressure increased most strongly in the downstream subregions (9–13) during 2001–2020 compared with 1980–2000 (Fig. 5). Internal pressure increased most in Subregions 8 and 13. When changes in internal and external irrigation pressure are examined jointly, the multi-year averages for 2001–2020 show that, relative to 1980–2000, 10 out of the 13 subregions experienced increases in both internal and external pressure. Among the subregions, Subregion 13 exhibits the largest combined increase in internal and external irrigation pressure, followed by Subregions 8 and 9. Subregions 10 and 11 are primarily affected by increases in external pressure due to upstream irrigation withdrawal. The upstream-most Subregion 1 shows changes only in internal pressure, with no influence from upstream abstractions.
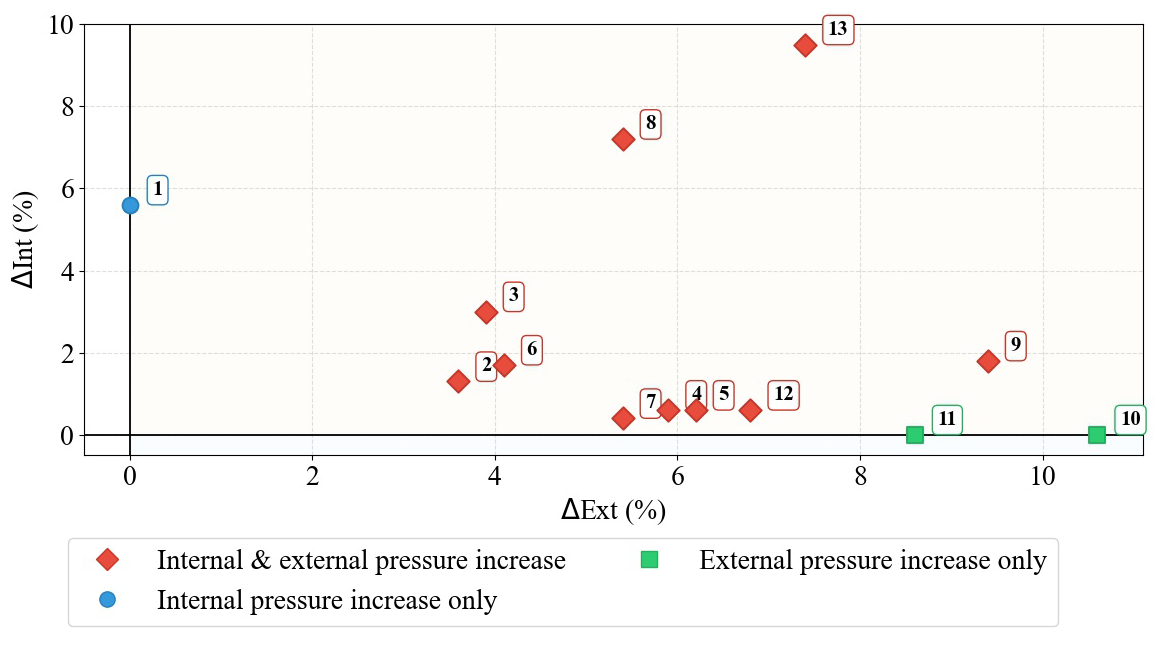
Figure 5Spatial variation in irrigation pressure increments (Int and Ext) across 13 subregions from the baseline period (1980–2000) to the current period (2001–2020). Red diamonds indicate subregions with simultaneous increases in both internal and external irrigation pressure, green squares represent subregions with increases in external pressure only, and blue circles denote subregions with increases in internal pressure only. Numbered labels (1–13) correspond to specific subregion IDs within the study area.
3.2 Spatiotemporal distribution and evolution of internal and external irrigation pressure under future climate scenarios
3.2.1 Changes in the basin-wide ratio of irrigation water withdrawal to available water
Compared with the historical period, the proportion of irrigation water withdrawal relative to available water in the basin shows a significant increasing trend under all three climate scenarios, with a particularly pronounced increase during the dry season (Fig. 6). At the annual scale, during 2031–2040, the proportion of irrigation water withdrawal under SSP1–2.6, SSP2–4.5, and SSP5–8.5 reaches 14 %, 14 %, and 15 %, respectively. This represents an increase of approximately 6 %–7 % relative to the multi-year average for 1980–2020. Changes at the dry-season scale are more pronounced. During 2031–2040, the proportion of irrigation water withdrawal under SSP1–2.6, SSP2–4.5, and SSP5–8.5 reaches 46 %, 40 %, and 46 %, respectively, representing an increase of approximately 11 %–17 % compared with the historical multi-year average. Under the high-emission SSP5–8.5 scenario, by 2040, the annual and dry-season proportions rise to 19 % and 59 %, respectively.
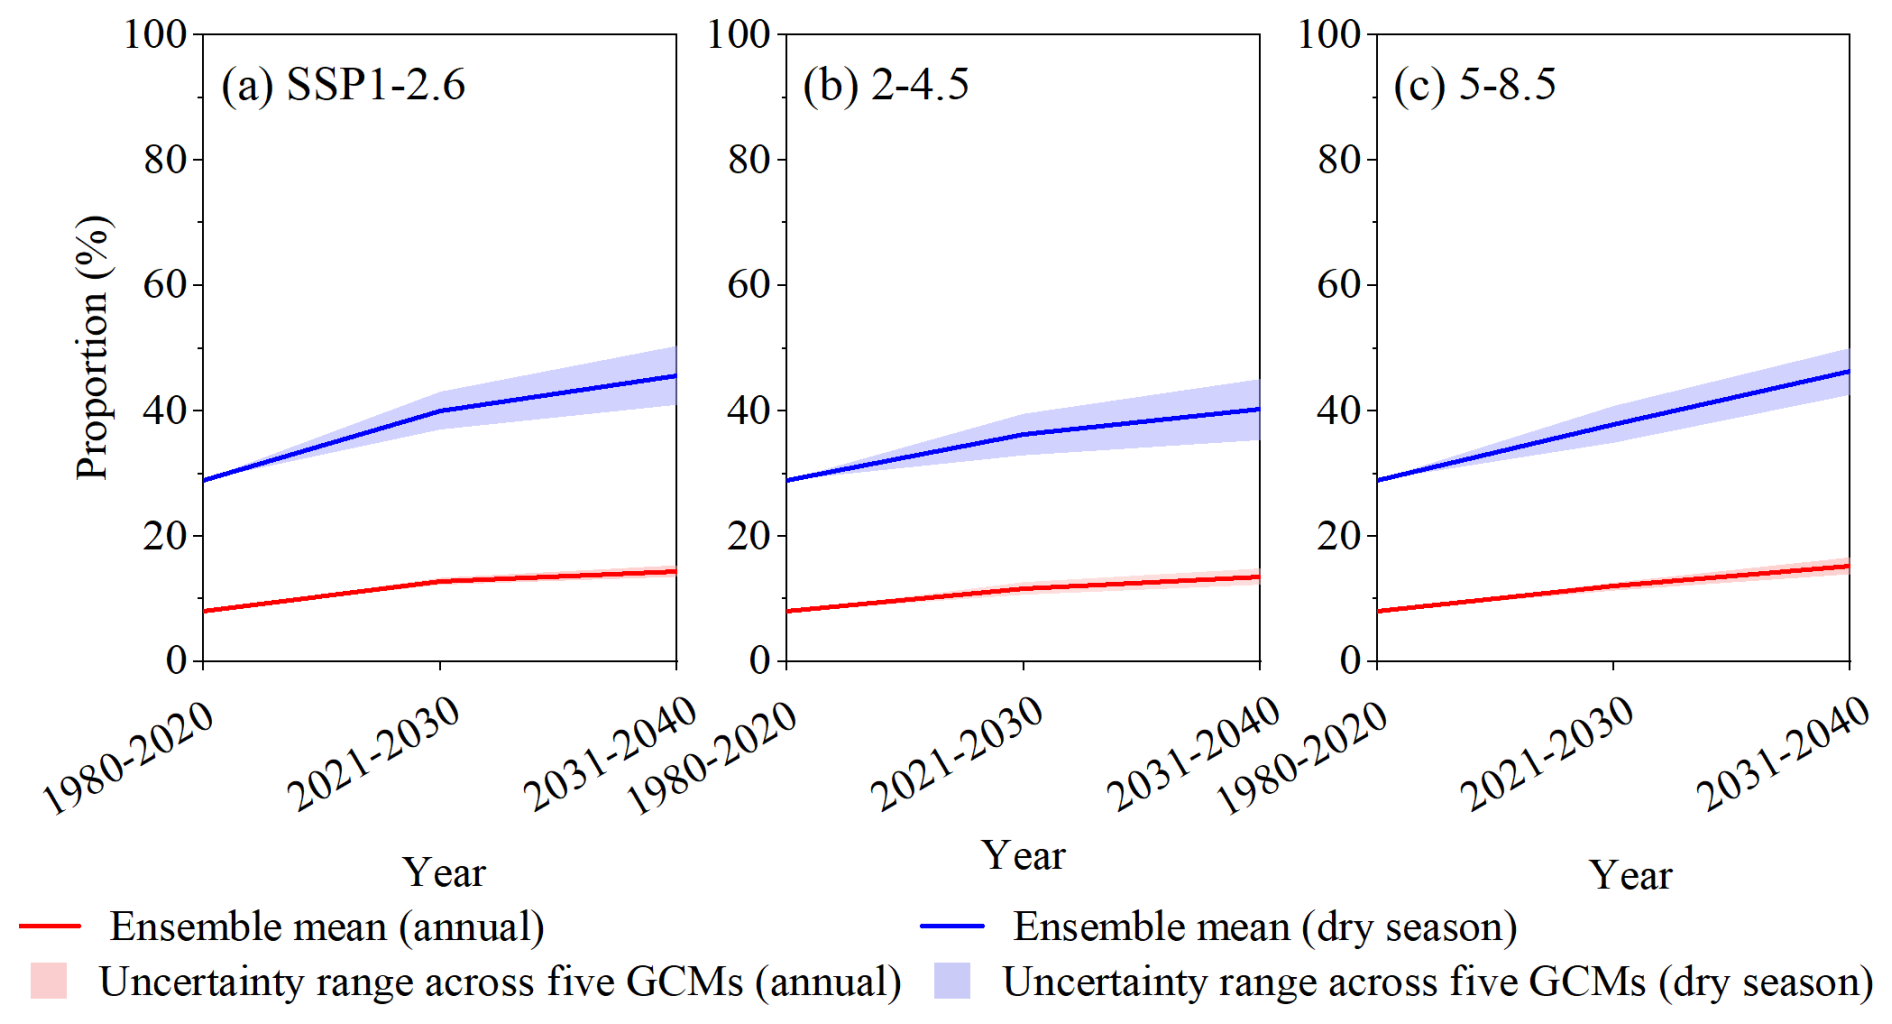
Figure 6Ratios of irrigation water withdrawal to available water under three climate scenarios of the basin: (a) SSP1–2.6, (b) SSP2–4.5, and (c) SSP5–8.5. The ratios are calculated for the historical baseline period 1980–2020 and two future periods 2021–2030 and 2031–2040. Blue and red lines denote the ensemble mean of five GCMs for annual and dry-season ratios, respectively. Shaded bands (blue and pink) represent the ±1 standard deviation (uncertainty range) across the five GCMs for the annual and dry-season ratios, respectively.
In terms of temporal evolution, 2021–2030 marks the period of the fastest increase in irrigation pressure. During this period, hydro-meteorological data for 2021–2025, which were derived from the ERA5-Land reanalysis dataset and represent historical conditions rather than future projections, were incorporated into the 2021–2030 interval to maintain consistency with the decadal framework of the scenario-based analysis. Relative to the historical baseline, the annual proportion of irrigation water withdrawal to available water rises by approximately 4 %–5 %, while the dry-season proportion increases more sharply by 7 %–11 % across all three scenarios. In 2031–2040, however, the growth rate slows, with annual proportions rising by only 1 %–3 % and dry-season proportions by 4 %–8 %, indicating a deceleration in the growth of irrigation pressure.
The uncertainty of the projected ratios of irrigation water withdrawal to available water was quantified using the standard deviation (±1σ) across the five CMIP6 GCMs. For the annual ratio, inter-model variability remains consistently low across all scenarios. Under SSP1–2.6, the standard deviation increases slightly from 0.6 % in 2021–2030 to 1 % in 2031–2040. Under SSP2–4.5, it rises modestly from 1.0 % to 1.3 %, while under SSP5–8.5, it increases from 0.6 % to 1.3 %. Overall, the uncertainty is limited (generally within ±1.5 %), indicating a high level of consistency among models in projecting annual irrigation water pressure.
For the dry season, under SSP1–2.6, the standard deviation increases from 3.1 % to 4.7 % between the two future periods. For SSP2–4.5, it rises from 3.3 % to 4.9 %, while under SSP5–8.5, a more moderate increase is observed from 3.0 % to 3.7 %. Although variability is relatively higher during the dry season than annual, the spread among models remains constrained, suggesting that projections are still reasonably consistent. The gradual increase in standard deviation over time reflects some divergence in model responses under future climate conditions, but does not alter the overall agreement in projected trends.
3.2.2 Spatiotemporal distribution of internal and external irrigation pressure across subregions
Relative to the historical period, the spatial pattern of internal water pressure in the basin shifts under future climate scenarios. Historically, Subregions 13, 8, and 1 exhibited the highest internal irrigation pressure, with the ranking at both annual and dry-season scales being Subregion 13 > Subregion 8 > Subregion 1. Under future climate scenarios, this pressure pattern is substantially altered (Fig. 7a–c). At the annual scale, internal pressure in Subregion 1 increases markedly, approaching or occasionally exceeding that of Subregion 13, while pressure in Subregion 8 declines, becoming the lowest among the three. At the dry-season scale, except under the low-radiative forcing scenario SSP1–2.6, internal irrigation pressure in Subregions 1 and 13 is roughly equal and remains higher than in Subregion 8.
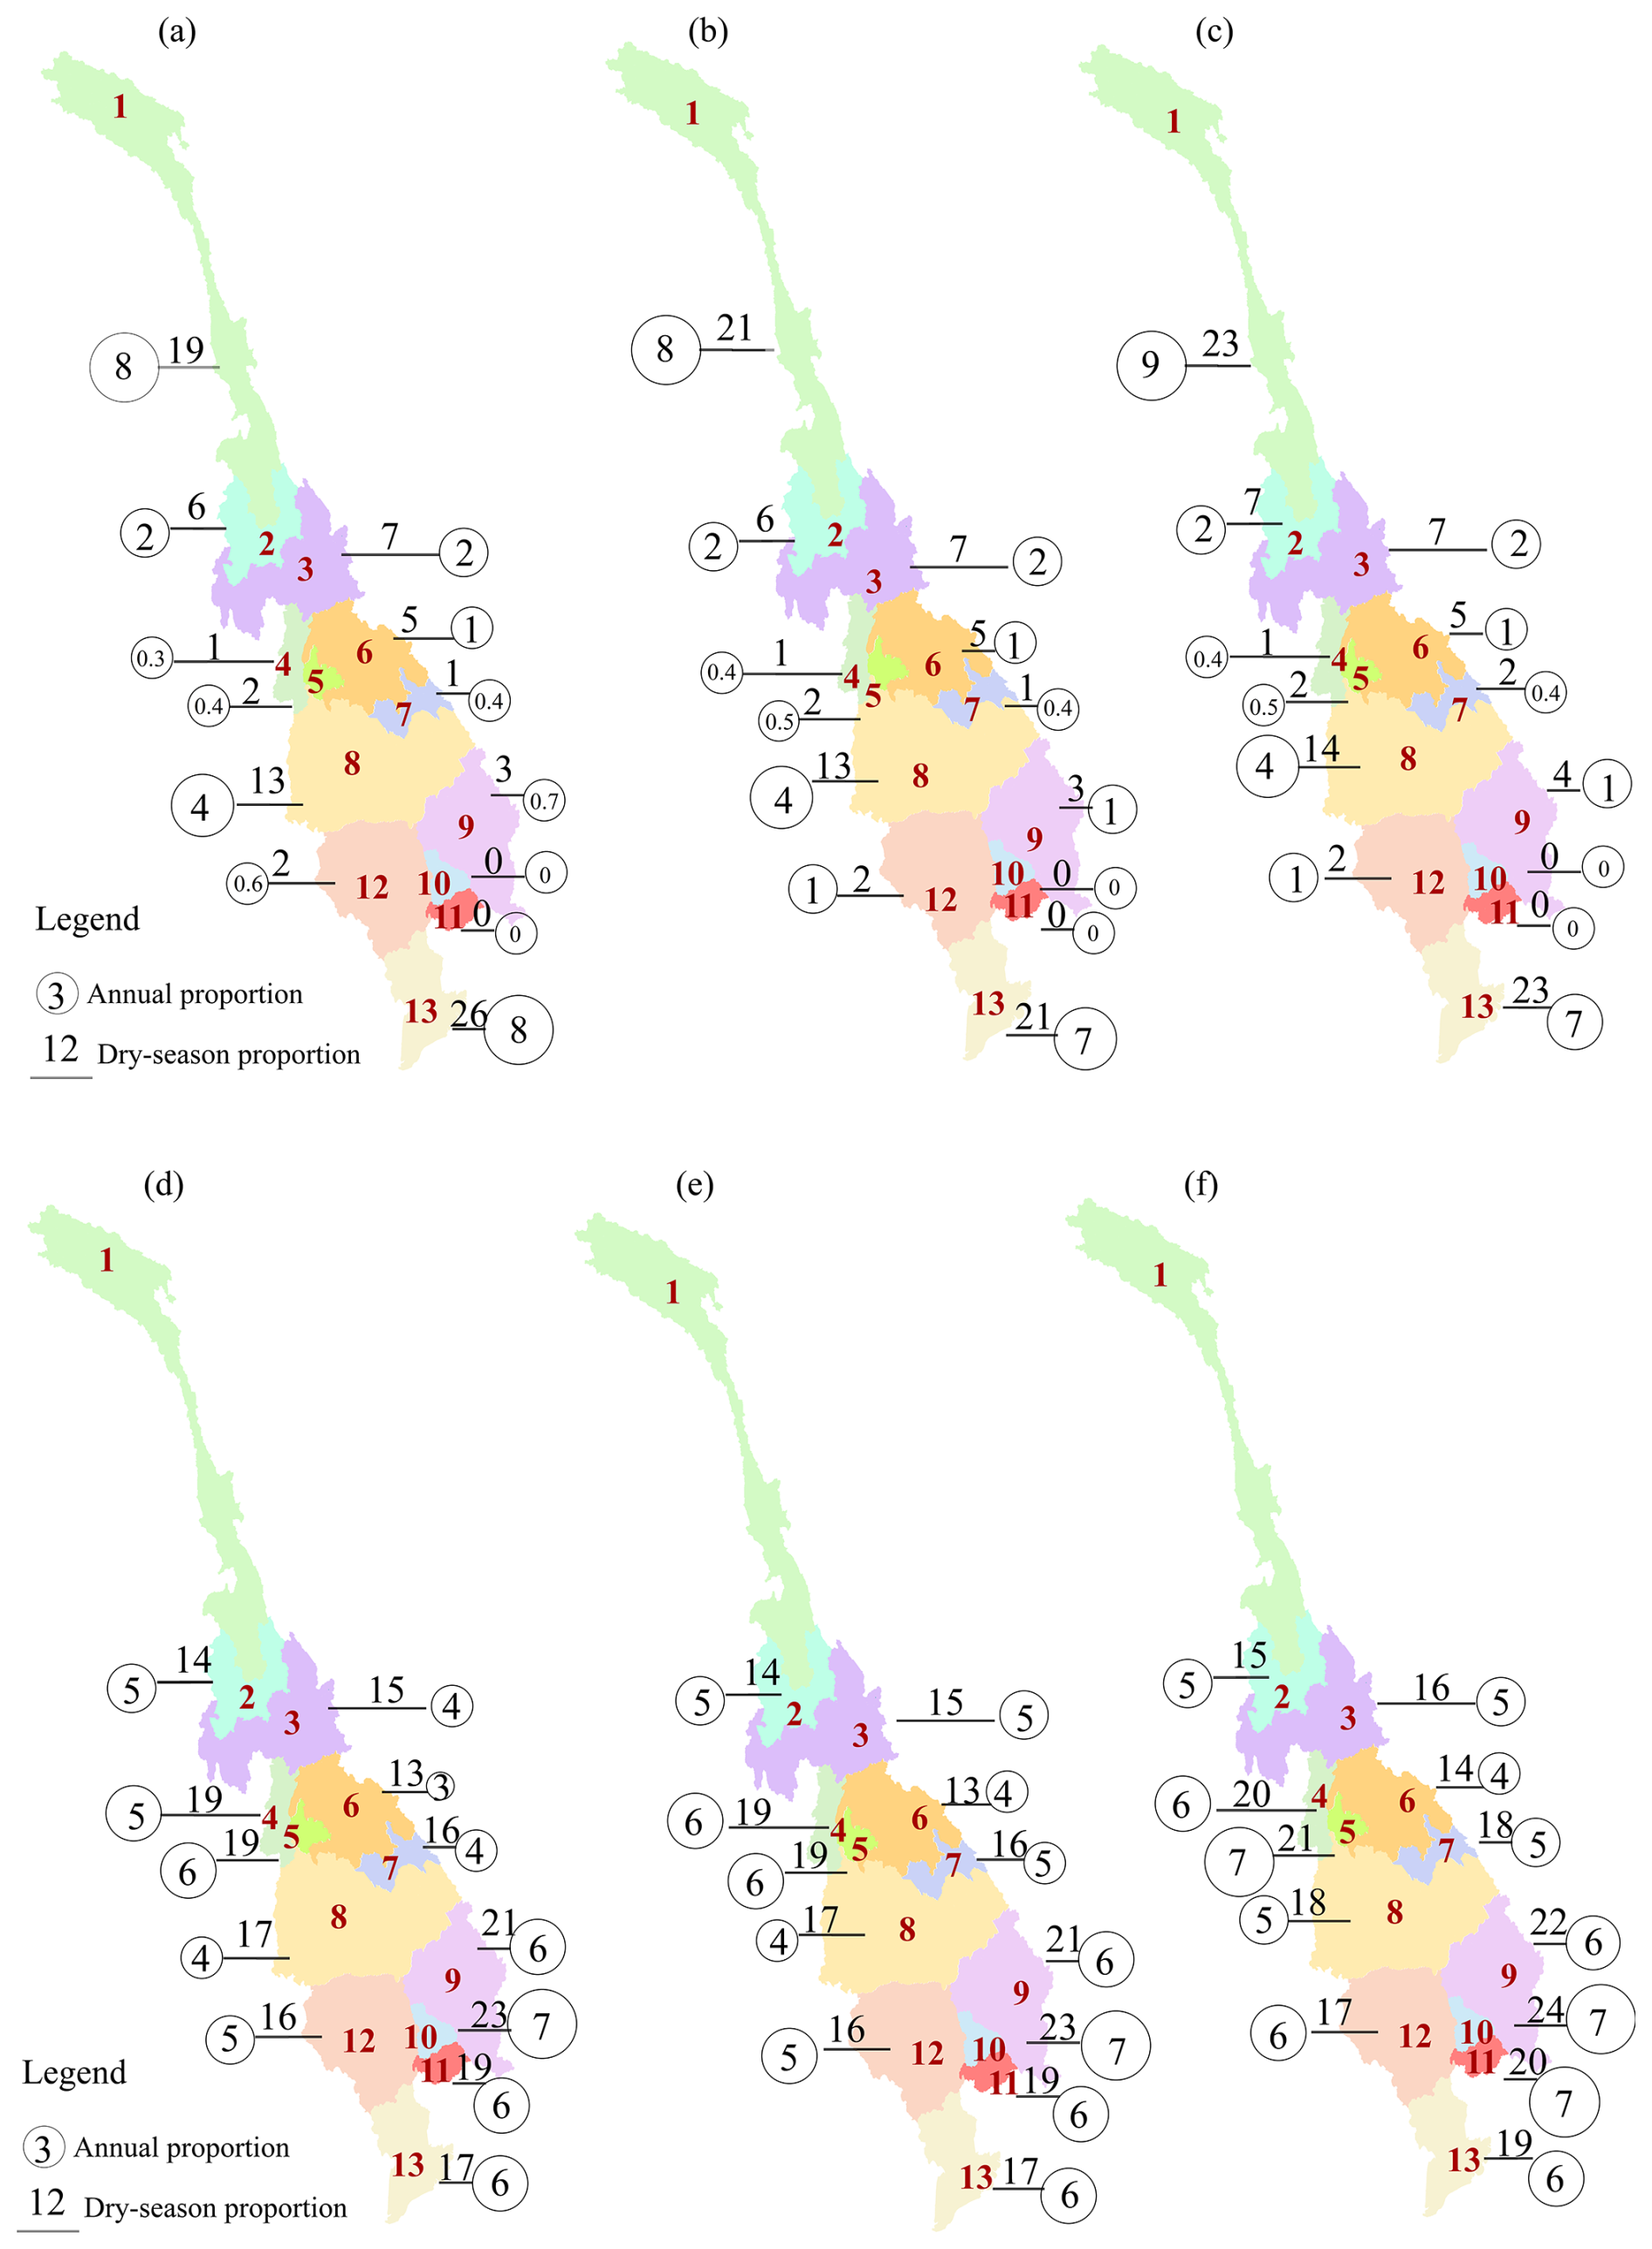
Figure 7Spatial patterns of projected irrigation pressure in the Lancang–Mekong Basin based on the ensemble mean of three SSP scenarios (SSP1–2.6, SSP2–4.5, and SSP5–8.5). Panels (a)–(c) show the average internal irrigation pressure, while panels (d)–(f) show the average external irrigation pressure.
As shown in Fig. 7d–f, the spatial pattern of state degradation (reductions in available water) induced by upstream irrigation pressure differs markedly from the historical period. At the annual scale, during the historical period, external irrigation pressure was clearly higher in the downstream subregions than in the upper- and midstream subregions. Under the three future climate scenarios, however, this pattern shifts. Specifically, in the upstream subregions, the proportion of available water reduced by upstream irrigation withdrawal ranges from approximately 4 % to 7 %, compared with 3 %–5 % in the midstream subregions and 5 %–7 % in the downstream subregions. Overall, midstream subregions experience the lowest external irrigation pressure, while upstream and downstream subregions are similar, indicating a relative strengthening of upstream-induced external pressure under future scenarios.
At the dry-season scale, the spatial heterogeneity largely follows the historical pattern. External pressure continues to exhibit the “highest downstream, intermediate upstream, lowest midstream” pattern. Specifically, the proportion of available water affected in the upstream subregions (2–5) ranges from 14 % to 21 %, in the midstream subregions (6–8) from 13 % to 18 %, and in the downstream subregions (9–13) reaches the highest values of 16 %–24 %. Subregions 1, 8, and 13 were primarily dominated by internal irrigation pressure during the historical period (2001–2020) at both annual and dry-season scales, while the other subregions were mainly dominated by external pressure. Under future climate scenarios, Subregion 8 shifts to external dominance, whereas the dominant pressure types in the other subregions remain unchanged, reflecting a structural change in Subregion 8's water pressure sources.
3.2.3 Changes in internal and external irrigation pressure across subregions
Under future climate scenarios (2021–2040), both internal and external irrigation pressure in the basin exhibit an overall increasing trend at the annual scale (Fig. 8a–c). However, the trajectories of change vary markedly among subregions, accompanied by a reordering of pressure growth rates. Relative to the historical periods, the growth rate of external irrigation pressure in the future slightly decreases in the downstream subregions (9–13), while it continues to intensify in the upper- and midstream subregions (2–8). Specifically, compared to 1980–2000, external pressure of 2001–2020 in Subregions 2–8 increased at an average annual rate of 1.3 %. Compared to 2001–2020, the 2021–2040 rises to 2.4 % under future scenarios. By contrast, Subregions 9–13 experienced a higher historical increase of 2.2 %, which moderates to 1.7 % in the future. For internal irrigation pressure, growth slows only in Subregions 3, 6, 8, 9, 12, and 13, whereas growth rates in Subregions 10–11 remain largely stable.
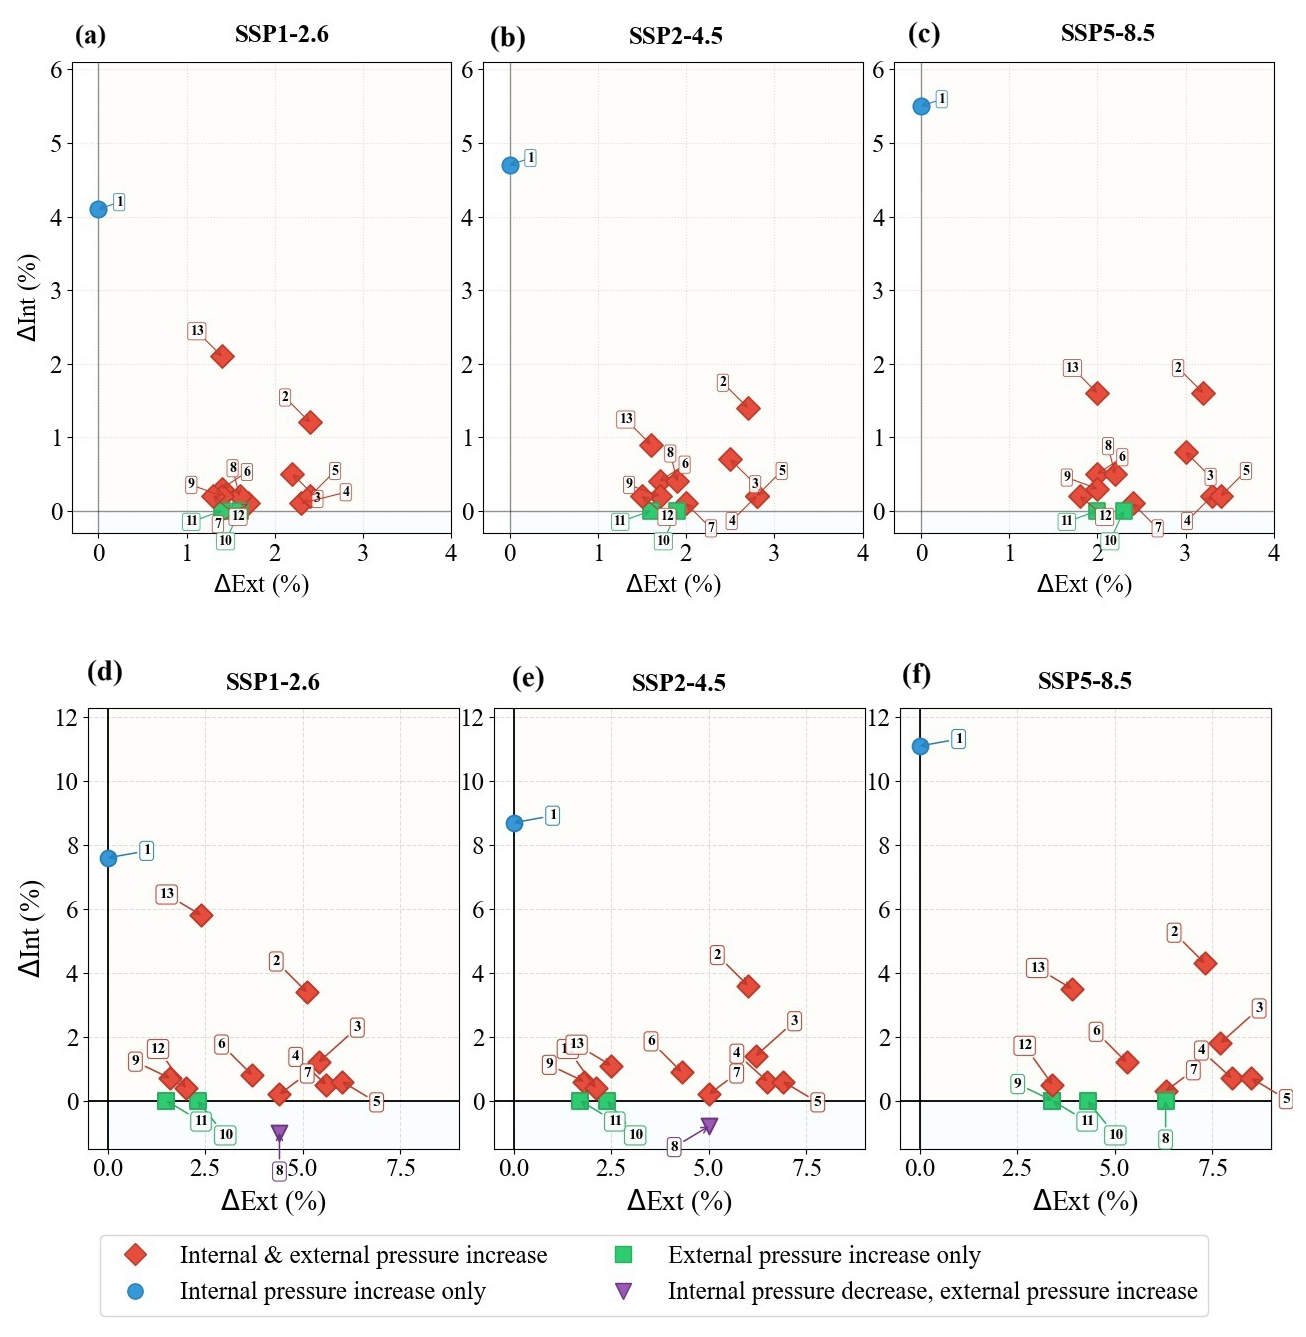
Figure 8Internal (ΔInt) and external (ΔExt) irrigation pressure changes under climate change scenarios, relative to 2001–2020, at annual (a–c) and dry-season (d–f) scales. Symbols represent subregions' pressure trends: red diamonds (both increased), green squares (external only), blue circles (internal only), and purple triangles (internal decreased, external increased). Numbered labels (1–13) identify specific subregions.
Under dry-season conditions (Fig. 8d–f), most subregions continue to experience increases in both internal and external irrigation pressure under the SSP1–2.6 and SSP2–4.5 scenarios relative to 2001–2020, although the magnitude of these increases is generally smaller than during the historical period. Subregion 8 is the only exception, showing a partial alleviation of internal irrigation pressure due to increased water availability. External irrigation pressure increases most strongly in the upstream subregions (2–5), followed by the midstream subregions (6–8), while the downstream subregions (9–13) exhibit comparatively smaller increases. Considering integrated pressure characteristics, Subregion 13 remains the most irrigation-water-stressed area under future scenarios, driven by its high internal irrigation water withdrawal relative to available water and reduced local availability caused by upstream withdrawal. Under the multi-year mean of the three climate scenarios, internal and external irrigation pressures in Subregion 13 reach approximately 23 % and 18 %, representing increases of about 3.5 % and 3.0 % relative to the historical period. This indicates that Subregion 13 is a critical hotspot of basin-scale irrigation water risk and highlights the need for integrated management measures. In terms of pressure growth magnitude, Subregion 2 exhibits the largest combined increase in internal and external pressure, indicating rapidly intensifying compound pressures under future scenarios. A closer examination of internal and external irrigation pressure reveals that Subregion 1 shows the largest increase in internal pressure among all subregions, with an average rise of about 9 % across three climate scenarios relative to the historical period. Although located in the uppermost part of the basin and characterized by a relatively small irrigation extent, low internal water-use efficiency results in disproportionately high local irrigation pressure, highlighting the urgent need for efficiency improvements. By contrast, Subregions 4 and 5 experience the strongest increases in external pressure, reflecting markedly intensified upstream water competition and a growing reliance on basin-scale water allocation and coordination mechanisms.
3.3 Classification of irrigation pressure system type
Based on the dominant irrigation pressure in each subregion, and through a joint analysis of changes direction in internal and external irrigation pressures, the irrigation pressure system type across the study area is classified into eight typical scenarios (Table 4). Within the PSR framework, changes in internal and external irrigation withdrawals represent the pressure factors, which influence the state of the regional water system by altering water availability and supply–demand relationships, while the resulting pressure-type classification reflects the system response. This scenario-based classification provides a systematic representation of the evolutionary pathways of different subregions under the combined or counteracting effects of internal and external irrigation pressures, thereby offering a framework for identifying structural differences in regional irrigation water pressure regimes and their underlying response mechanisms.
Table 4Criteria for classifying irrigation pressure system types.
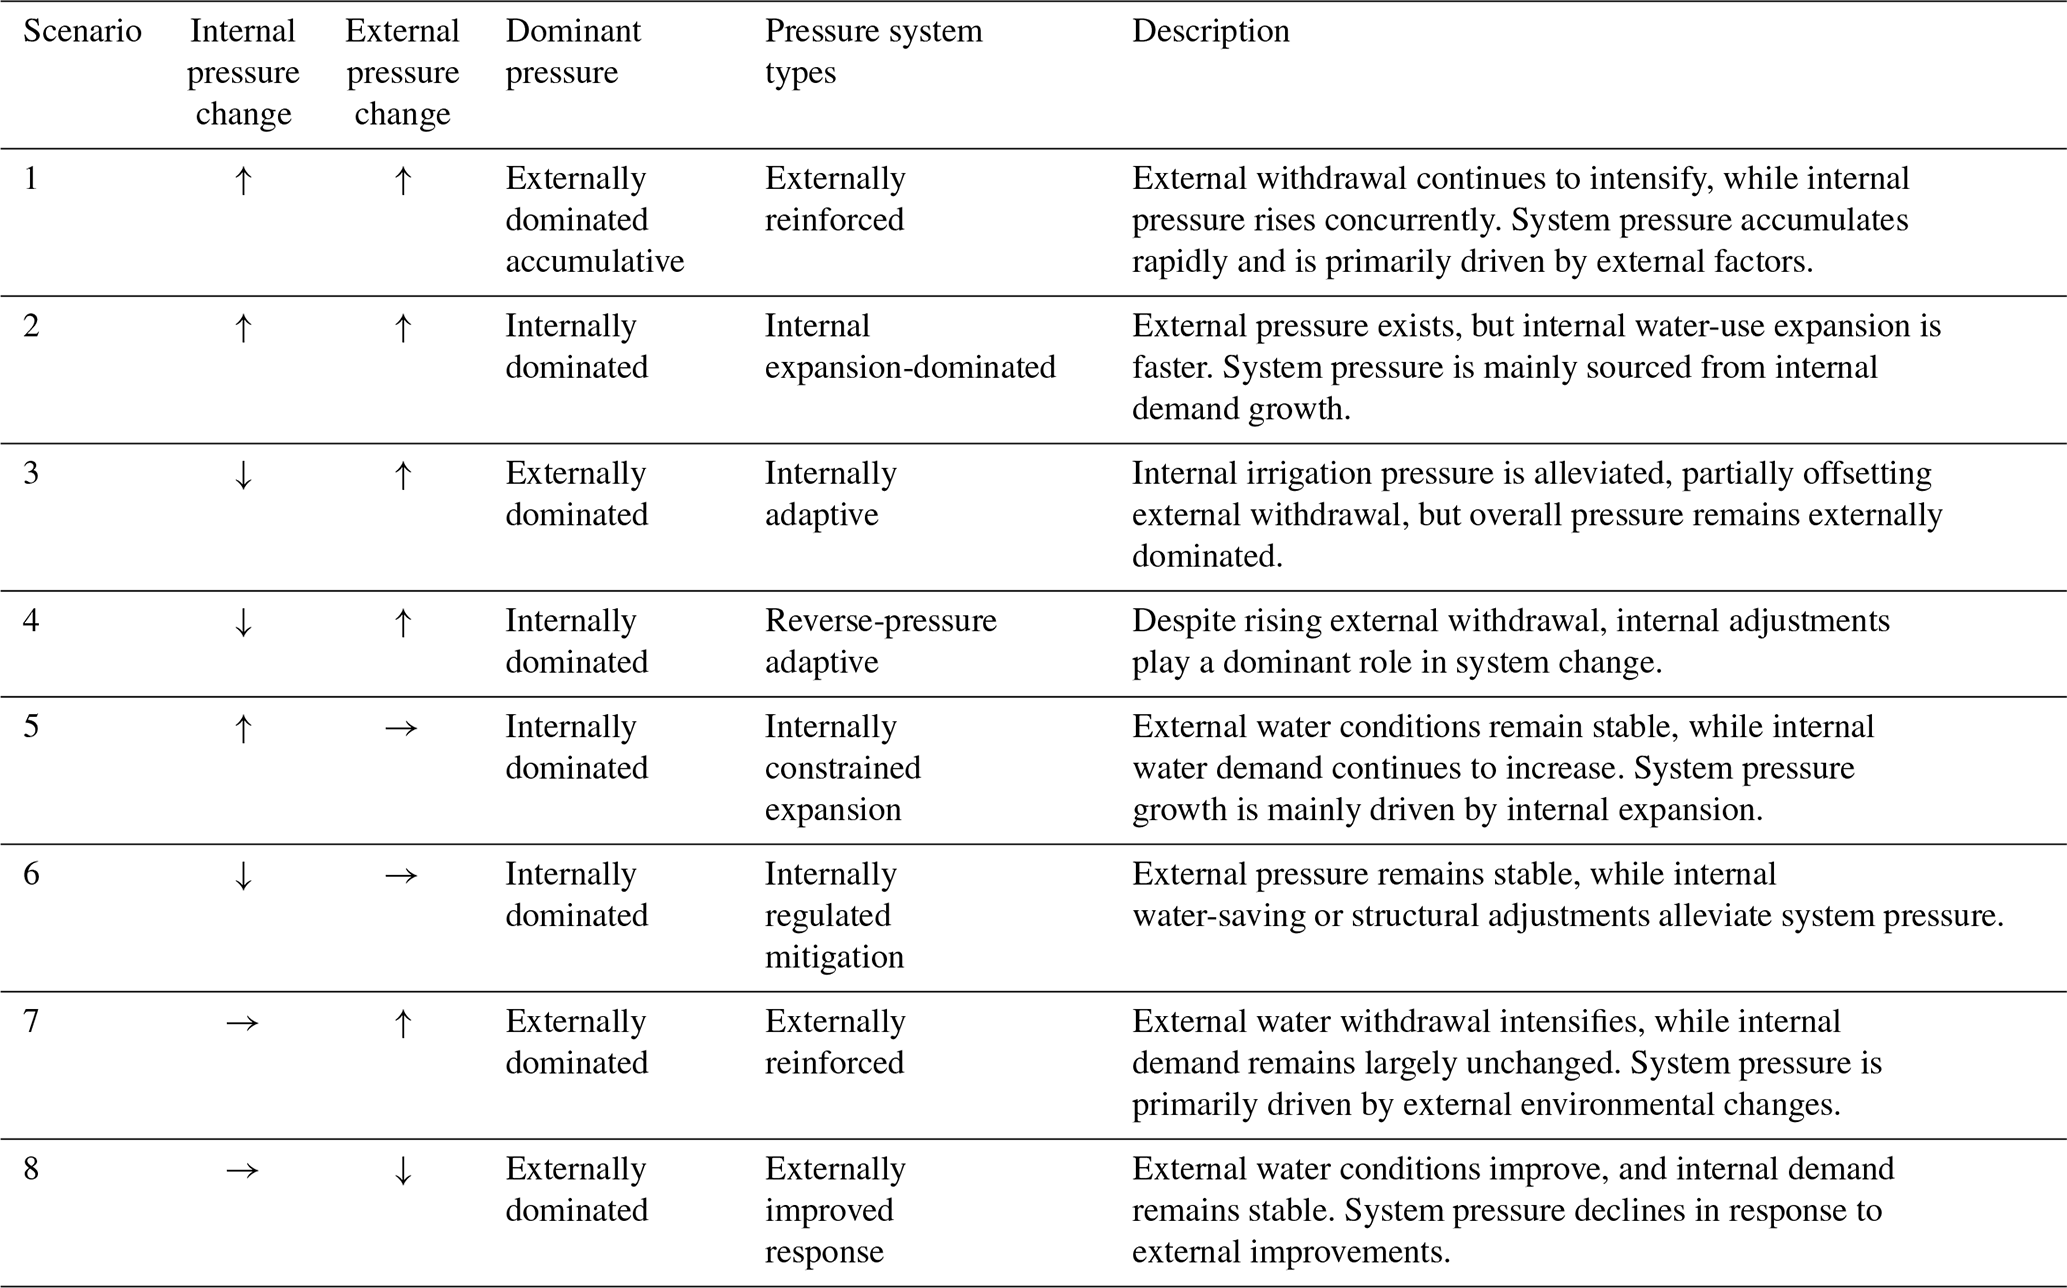
At the annual scale, pronounced spatial heterogeneity is observed in irrigation pressure system types across subregions during the historical period (Table 5). According to the criteria for classifying irrigation pressure system types, Subregion 1 is classified as an internally constrained expansion type, indicating that increasing local irrigation water demand is the primary source of system pressure. Subregions 8 and 13 are characterised by an internal expansion-dominated type, with substantial increases in internal irrigation pressure and system evolution largely governed by rapid growth in local irrigation water withdrawal. Subregions 10 and 11 exhibit an externally reinforced type, in which internal pressure changes are limited while external water resource occupation continues to strengthen. The remaining subregions are generally classified as an externally reinforced accumulative type, characterised by concurrent increases in both internal and external pressures, with external pressure dominating system evolution.
Table 5Irrigation pressure system types for each subregion during the historical and future periods.
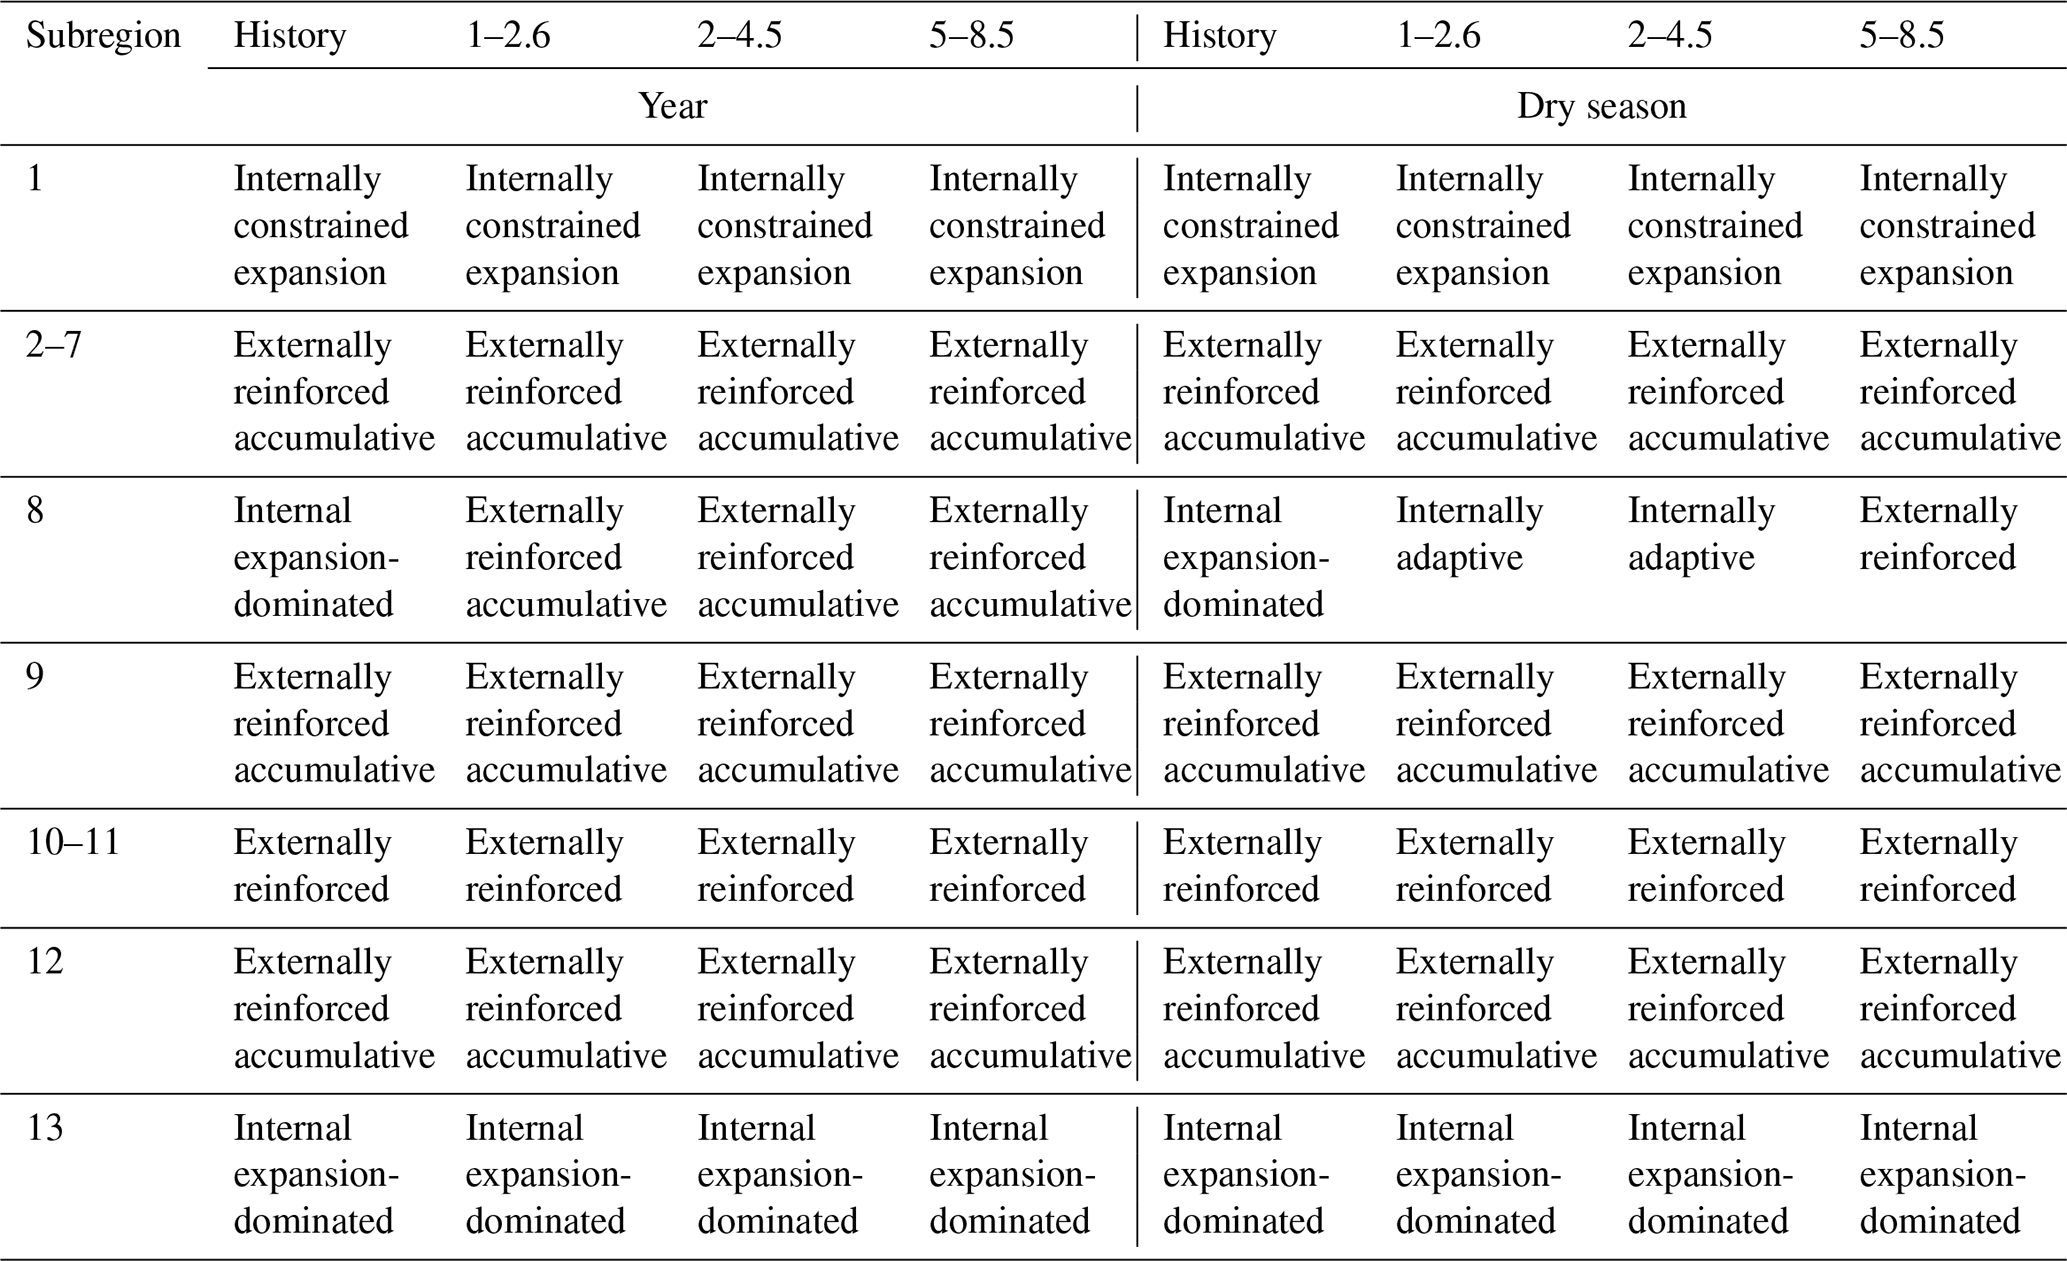
Annual-scale irrigation pressure system types remain largely stable under future climate scenarios, with a pronounced transition observed only in Subregion 8. Specifically, Subregion 8 shifts from an internal expansion-dominated type during the historical period to an externally reinforced accumulative type under future scenarios. This transition reflects a weakening of internal water withdrawal expansion and a gradual shift in the pressure structure from internal dominance toward external dominance.
At the dry-season scale, irrigation pressure system types in most subregions are consistent with those at the annual scale for both historical and future periods. Subregion 8 again represents an exception. During the historical period, it is characterised by an internal expansion-dominated in the dry season, with rapidly increasing local irrigation water demand serving as the dominant source of pressure. Under future climate scenarios, however, Subregion 8 exhibits a more pronounced and complex evolution of irrigation pressure structure. Under the SSP1–2.6 and SSP2–4.5 scenarios, partial alleviation or stabilisation of internal pressure, combined with continued increases in external pressure, leads to a transition toward an internally adaptive type. In contrast, under the SSP5–8.5 scenario, internal pressure remains largely unchanged while external occupation intensifies markedly, resulting in a further transition to an externally reinforced type. These results indicate that Subregion 8 is highly sensitive to climate scenario differences during the dry season and exhibits strong scenario dependence. From the perspective of the PSR dynamic interaction, increasing upstream irrigation withdrawals (pressure) interact with climate-induced hydrological changes to influence downstream water availability (state), ultimately triggering shifts in the dominant irrigation pressure regime (response). This behaviour highlights the complexity and uncertainty of future dry-season water resource risk structures in this subregion.
4.1 Comparison with previous studies
Downstream subregions experience markedly higher irrigation pressure than upstream areas, particularly during the dry season. These findings are consistent with previous studies on the impacts of irrigation water use in transboundary rivers. Several studies have shown that upstream irrigation expansion can significantly exacerbate water pressure in downstream agricultural systems of the Mekong River by altering river flow and its seasonal distribution (Hoang et al., 2019; Munia et al., 2016). Traditional studies often attribute downstream water pressure directly to increased upstream withdrawal or climate-driven runoff reductions, overlooking the amplifying or buffering role of local water use. In contrast, this study explicitly distinguishes between internally driven water-use expansion and externally imposed upstream pressure. This distinction enables a clearer identification of subregions where pressures can be mitigated through local management and those that require transboundary coordination, thereby providing a more nuanced characterization of basin-wide irrigation water-use structures. The results show that even when overall water availability does not change dramatically, different subregions may follow markedly different pressure evolution pathways due to variations in internal irrigation water-use patterns. At both annual and dry-season scales, during the historical period, Subregions 1, 8, and 13 were dominated by internal pressure, while the remaining subregions were primarily dominated by external pressure. Under future climate scenarios, Subregion 8 shifts from being internally dominated to externally dominated, whereas the dominant pressure in the other subregions remains unchanged. Furthermore, the transition of Subregion 8 from internal to external pressure dominance under future scenarios reflects the non-stationarity and path dependence of pressure-driving mechanisms in transboundary river basins.
In addition, the results of this study are compared with findings from other typical transboundary river basins. Previous studies have shown that during the dry season, upstream surface water demand in the Indus River continues to increase, in some sub-basins even exceeding the available water at the same time (Smolenaars et al., 2022). This creates pronounced spatiotemporal hotspots of water pressure in the downstream areas. In these hotspot regions, seasonal water availability is reduced by more than 25 % relative to natural conditions, significantly affecting the sharp decline in per capita seasonal water availability downstream in the future. Consequently, the continued increase in upstream water withdrawal may trigger local water shortages and is increasingly recognized as a major driver of downstream water pressure during the dry season. In the Zambezi River Basin, consumptive water use such as irrigation currently accounts for approximately 15 %–20 % of available water and is projected to increase to around 40 % by 2025 under existing development planning scenarios, indicating a significant growth trend in water use (Beck, 2010). In the absence of effective international water allocation cooperation, the combination of population and economic growth with expanding irrigated agriculture may have substantial impacts on basin runoff processes and transboundary water distribution. Compared with the aforementioned studies, the scenario simulations in this study suggest that under the SSP5–8.5 scenario in 2040, the annual proportion of irrigation water use relative to available water remains around 19 %, which is lower than the high annual water-use levels reported in the Zambezi River Basin. However, at the dry-season scale, irrigation water demand could rise to approximately 59 % of available water. Under this condition, upstream irrigation-induced reductions could lower available water in the delta region by about 31 % during the dry season under SSP5–8.5 in 2040. This magnitude of reduction is comparable to the dry-season water pressure hotspots identified in the Indus River Basin, indicating that even when annual water-use proportions are relatively moderate, dry-season water risks can be substantially amplified and should not be overlooked. These dry-season “stress hotspots” provide critical early warning signals for decision-makers. It is therefore recommended that transboundary cooperation prioritize minimum dry-season flow requirements rather than annual flow allocations, in order to prevent localized ecological and agricultural collapse.
4.2 Mechanisms underlying the dominance patterns of internal and external irrigation pressure
Climate change increases river flows in the Mekong Basin, which may affect downstream water availability, but it does not directly mitigate the impact of upstream irrigation expansion on downstream water pressure (Hoang et al., 2016). Under future climate scenarios, the dominant water pressure type (response) in Subregion 8 shifts from internal to external pressure, indicating a substantial structural change in the local water resource constraint mechanisms. This transition is not driven by a sole increase in internal water-use pressure, but rather results from the continued intensification of external pressure, both in magnitude and relative contribution. This asymmetry between upstream water use expansion and downstream hydrological response highlights the limitations of relying solely on climate-induced increases in river flows to buffer water scarcity. It calls for more proactive benefit-sharing mechanisms that explicitly balance upstream irrigation gains against the external costs imposed by increased downstream water stress.
Specifically, although local irrigation water withdrawal in Subregion 8 continues to increase under future scenarios, its growth rate is clearly lower than the rate of upstream irrigation expansion (Fig. 9a). From 2025 onward, upstream irrigation withdrawal exceeds the local water use in Subregion 8, representing a critical turning point in which the primary source of water pressure shifts from being internally dominated to externally dominated.
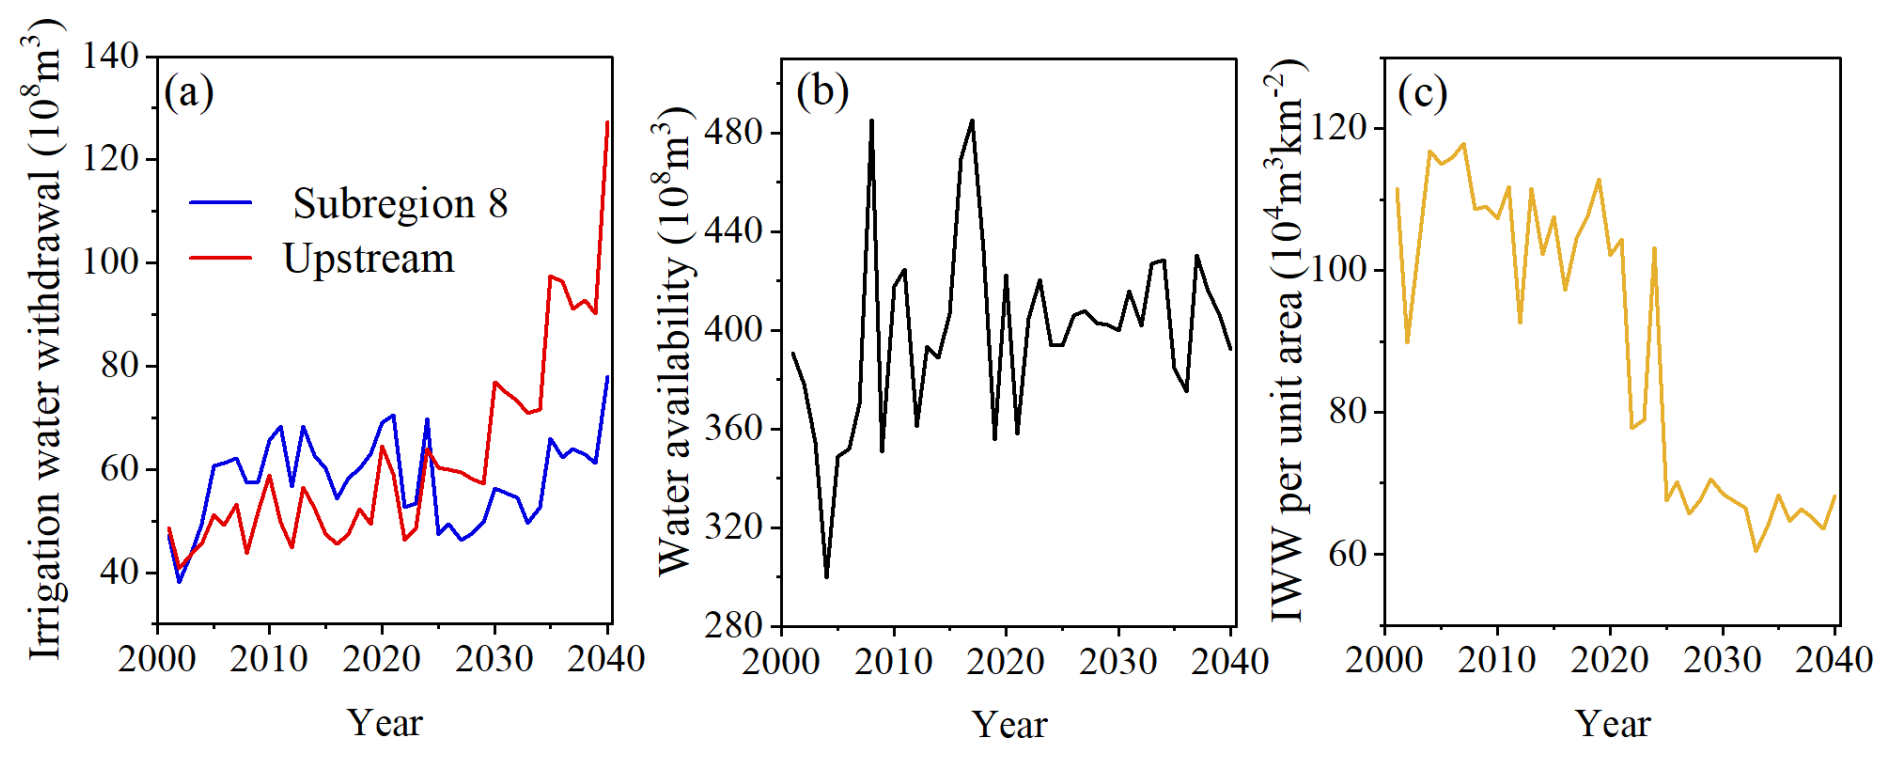
Figure 9Dry-season irrigation characteristics in Subregion 8: local and upstream irrigation withdrawal (a), water availability (b), and irrigation withdrawal (IWW) intensity (c).
Although future dry-season water availability (state) is projected to increase slightly under climate change, upstream irrigation withdrawal (pressure) is expected to grow much faster. Specifically, during 2001–2020, the multi-year average dry-season irrigation water withdrawal in the upstream region was approximately 5.0×10⁹ m3, increasing to about 7.4×10⁹ m3 in 2021–2040, a rise of 48 % (Fig. 9a). In contrast, the dry-season available water to Subregion 8 increased only modestly from about 39.4×10⁹ to 40.6×10⁹ m3 (Fig. 9b), an increase of roughly 3 %. This asymmetry between the escalating external pressure and the limited recovery of the regional state may be partially smoothed at the annual scale, but it is especially pronounced during the dry season, accelerating the structural shift in the system response from internal to external sources.
Meanwhile, analysis based on irrigation water withdrawal per unit area shows a significant decline in water withdrawal intensity in Subregion 8 after 2025. Prior to 2025, the multi-year average irrigation water withdrawal per unit area was approximately 1.05×10⁶ m3 km−2, dropping to about 0.67×10⁶ m3 km−2 after 2026, indicating an improvement in local water-use efficiency (Fig. 9c). Therefore, the transition in the dominant internal and external irrigation water pressure in Subregion 8 results from the combined effects of continued upstream irrigation expansion, dry-season hydrological responses under climate change, and local irrigation efficiency. This evolution reflects a typical pathway of irrigation water pressure transformation for downstream areas in transboundary river basins under future climate scenarios. Even when annual-scale conditions appear relatively moderate, external irrigation during the dry season may gradually become the dominant constraint.
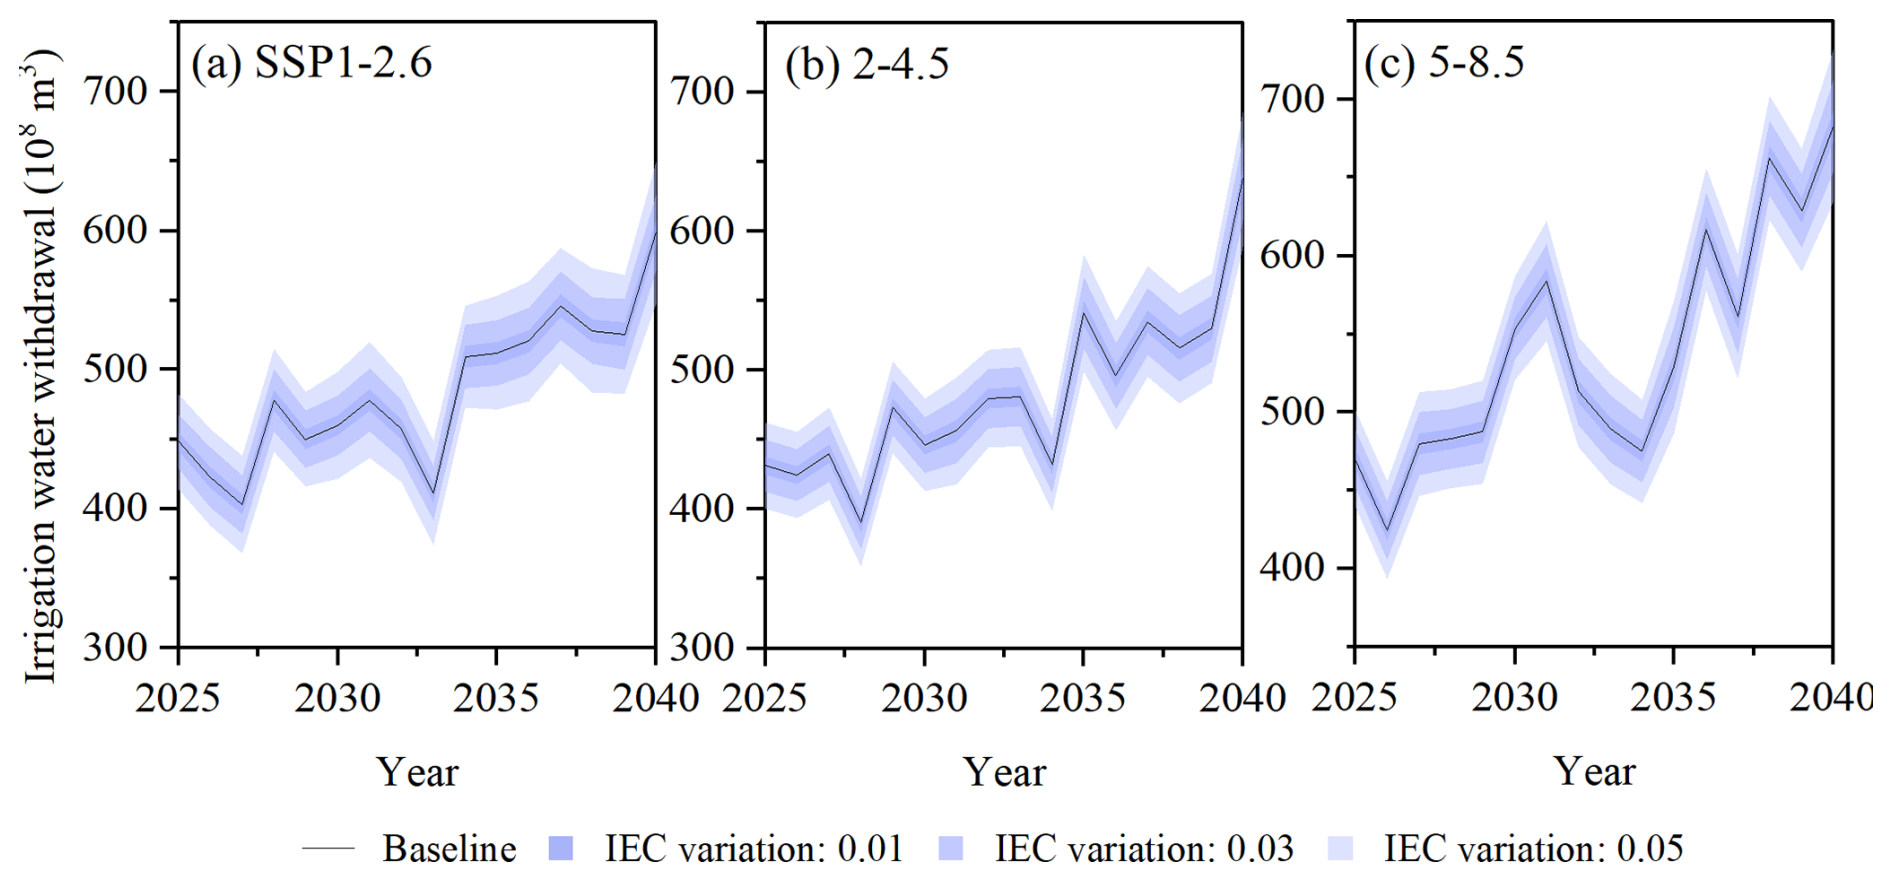
Figure 10Projected irrigation water withdrawal under different climate change scenarios in the Lancang-Mekong River Basin. Panels (a), (b), and (c) represent scenarios SSP1–2.6, SSP2–4.5, and SSP5–8.5, respectively. The solid blue line denotes the irrigation water withdrawal under the planning scenario (remains at the historical level, baseline). The color-shaded bands, ranging from dark to light blue, represent the corresponding water withdrawals under variations in irrigation efficiency coefficients (IEC) of 0.01, 0.03, and 0.05 relative to the historical period.
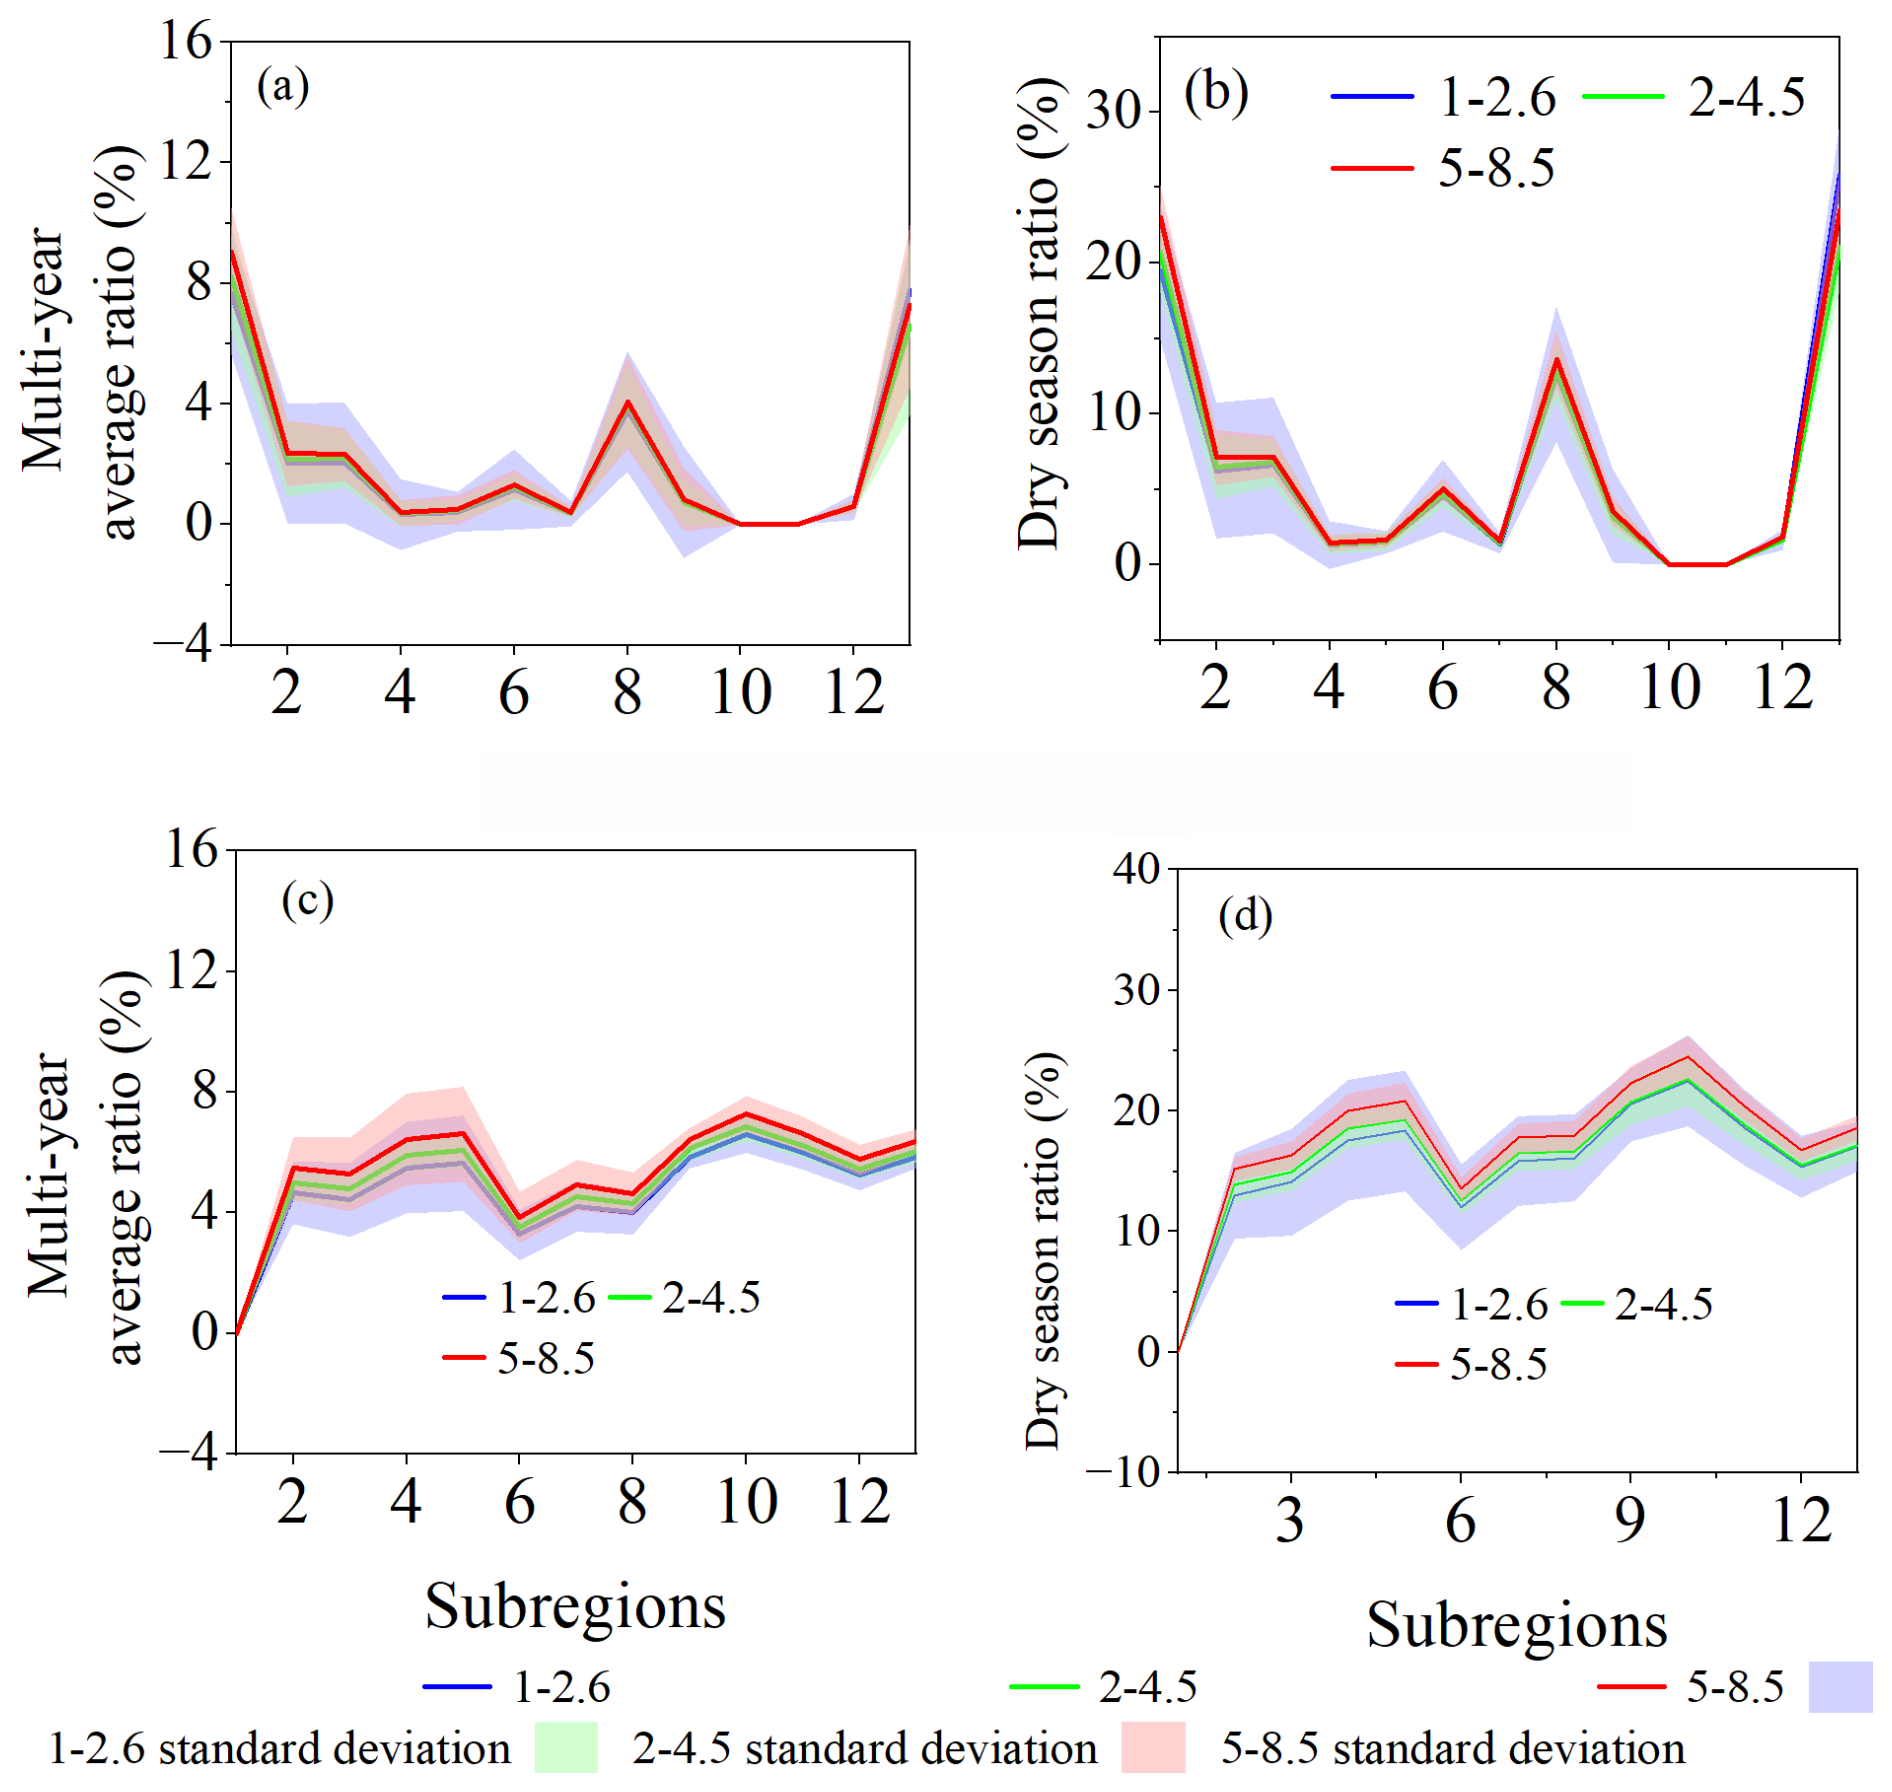
Figure 11Comparison of internal and external irrigation water stress ratios across subregions under different SSP scenarios. Panels (a) and (b) show the internal irrigation water stress at annual and dry-season scales, respectively; panels (c) and (d) represent the external irrigation water stress at annual and dry-season scales. Solid lines indicate the ensemble mean, while shaded areas denote the standard deviation across five GCMs.
4.3 Uncertainty
-
Runoff model. To evaluate the uncertainty associated with hydrological model parameters, a Monte Carlo simulation framework was implemented. Nine key parameters were considered for each sub-basin, including the fraction of potential transpiration over potential evaporation, slope roughness, exponential coefficient in subsurface runoff calculations, river channel roughness, linear coefficient in subsurface runoff calculations, shape coefficient, average water storage capacity, and Muskingum routing parameters.
Specifically, taking the calibrated parameter set for each sub-basin as the baseline, a ±10 % uniform perturbation range was assumed for each parameter. Based on this assumption, 1000 parameter sets were randomly generated for each sub-basin, and corresponding runoff simulations were conducted to derive statistical characteristics of the outputs. The results indicate that the variability of simulated runoff within each sub-basin is generally low. The coefficient of variation across all sub-basins has a mean value of 0.06, a median of 0.03, and a 90th percentile of 0.1. These results suggest that, under a ±10 % parameter perturbation, the variability of simulated runoff relative to its mean remains limited. This indicates that the model is relatively insensitive to parameter uncertainty and demonstrates good robustness.
-
Irrigation water withdrawal. The irrigation efficiency coefficients used for our historical baseline were derived from authoritative FAO and MRC reports. Given the limited availability of spatially explicit projections for future irrigation efficiency in this region, we maintained the historical coefficients in our future simulations. To evaluate the potential influence of this assumption on our results, we conducted a robust sensitivity analysis by increasing the baseline irrigation efficiency by variations of 0.01, 0.03, and 0.05 (as shown in Fig. 10). The key findings are as follows: Between 2025 and 2040, the projected basin irrigation water withdrawal across all three SSP scenarios varied by only approximately 2 %, 5 %, and 8 %, respectively. The ratio of irrigation withdrawal to available water showed even less sensitivity, with annual variations of ∼0.2 %, 0.6 %, and 1 %. Even during the dry season, these variations remained within a limited range of 0.5 % to 2.4 %. These results demonstrate that while irrigation efficiency does influence the absolute water demand, its impact on the overall irrigation-to-availability ratio is marginal. Therefore, our primary conclusions regarding regional irrigation water stress trends remain robust despite the inherent uncertainties in efficiency projections.
To minimize uncertainties in mapping irrigation infrastructure, we employed high-resolution (0.5 m) satellite imagery combined with a deep learning–based recognition model. This approach achieves a validation accuracy of over 90 %, providing a significantly more detailed representation than traditional coarse-resolution datasets. In our study, irrigation demand is computed using the FAO crop water-requirement approach (Allen et al., 1998), which depends on irrigated area, crop type, PET, and precipitation, rather than the absolute number of canals. Canal detection is primarily used to identify irrigation nodes and associate them with specific irrigation command areas via GIS overlay. These nodes determine whether water is withdrawn from a main stem or a tributary, ensuring the model accurately captures downstream discharge changes. As long as at least one canal/intake point is identified within a sub-basin to establish the connectivity between the river network and the command area, the total water withdrawal for that area is accurately captured (Zhao et al., 2026). Therefore, the slight omission in canal mapping does not significantly affect the aggregate irrigation demand or the regional water balance.
-
Climate scenario variability. For internal irrigation water stress (Fig. 11a and b), differences among SSP scenarios are generally limited at the annual scale, with deviations typically within 0.1 %–1.4 % across most subregions. Even during the dry season, although overall stress levels increase, the separation among SSP1–2.6, SSP2–4.5, and SSP5–8.5 remains relatively modest. This suggests that internal stress, which is primarily governed by local water availability and demand, is less sensitive to climate scenario differences.
In contrast, external irrigation water stress (Fig. 11c and d) exhibits a much stronger response to SSP scenarios, particularly during the dry season. While differences remain small at the annual scale, clear divergence emerges in the dry season, where SSP5–8.5 consistently produces higher stress levels than SSP2–4.5 and SSP1–2.6. In several subregions, the differences among scenarios can reach 1.4 %–2.5 %, indicating a pronounced sensitivity to climate forcing.
Overall, these results indicate that climate scenario uncertainty has a limited effect on internal irrigation water stress but plays a more significant role in external stress, especially during the dry season.
Across different subregions, the standard deviation of external irrigation water stress ranges from 0 % to 1.6 % at the annual scale and from 0 % to 5 % during the dry season (Fig. 11c and d). For internal irrigation water stress, the standard deviation ranges from 0 % to 2 % at the annual scale and from 0 % to 4.5 % during the dry season (Fig. 11a and b). Despite slight differences between internal and external components, the overall uncertainty remains within a narrow range. This, together with the high spatial synchrony of peaks and troughs across subregions, indicates that the identified irrigation-stress hotspots and the projected trends are highly reliable and only weakly affected by model structure and input variability.
-
Environmental flow. To evaluate the sensitivity of the results to the environmental flow assumption, additional calculations were conducted using environmental flow thresholds of 25 % and 20 % of simulated runoff, in addition to the baseline value of 30 %. The results indicate that during the historical period (1980–2020), the annual ratio of irrigation water withdrawal to available water changes by approximately 1 %–2 % (Fig. 12a), while the dry-season ratio varies by about 1 %–6 % under the alternative thresholds (Fig. 12b). Although the absolute magnitude of irrigation pressure changes slightly, the spatial patterns of irrigation pressure and the identification of dominant pressure types across subregions remain consistent.
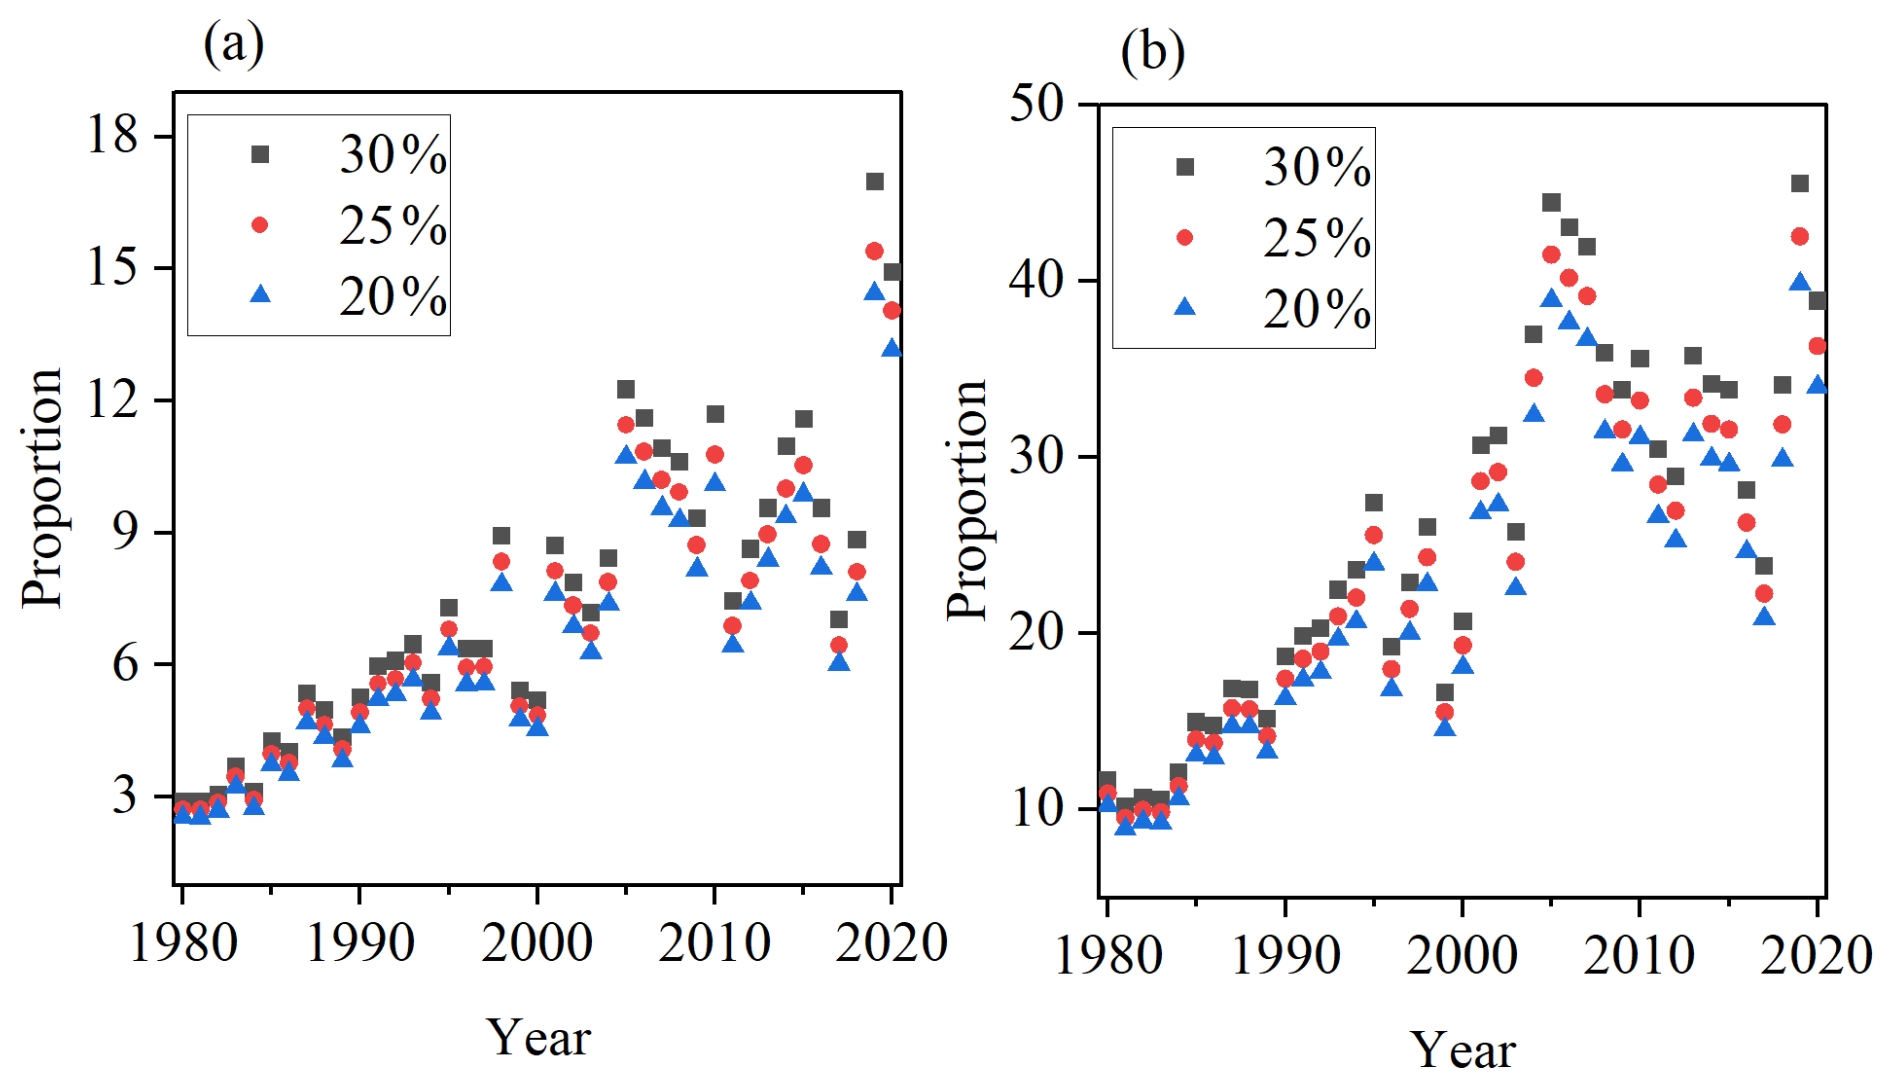
Figure 12Temporal variation in the proportion of irrigation water withdrawal relative to available water under different environmental flow thresholds (20 %, 25 %, and 30 %) in the basin from 1980 to 2020. (a) and (b) represent annual and dry-season conditions, respectively.
4.4 Policy implications for transboundary water governance
We recommend a differentiated management framework based on the dominant pressure type identified in each subregion. For subregions that remain dominated by internal pressure, such as Subregion 13 in the delta, policy should prioritize internal demand-side regulation, including the expansion of efficient irrigation technologies and adjustments in cropping patterns to decouple agricultural growth from water use. At the same time, because these areas also face persistent external vulnerability, such local measures should be supported by international agreements that safeguard minimum environmental flows. For subregions undergoing a shift from internally dominated to externally dominated pressure, governance should move from an efficiency-oriented approach to a coordination-oriented approach. In these areas, local water-saving gains are increasingly offset by upstream expansion. Therefore, policymakers should use the quantified PSR results to advocate for a fairer allocation of water rights within the basin and to ensure that upstream development does not exceed the adaptive capacity of downstream systems. Finally, the pronounced dry-season stress, which reaches as high as 59 % under some scenarios, calls for seasonal adaptive management. Specific measures include the coordinated operation of upstream reservoirs to supplement dry-season flows, as well as the establishment of real-time, basin-wide monitoring and data-sharing platforms for water use.
This study employs the “Pressure–State–Response (PSR)” analytical framework to systematically assess the spatial patterns and evolution of water pressure in the Lancang–Mekong Basin under the combined influences of irrigation water withdrawal and climate change. Within this framework, upstream irrigation withdrawal and climate change are treated as the primary pressure factors, changes in regional water availability characterize the system state, and the irrigation water withdrawal pressure system type of each subregion represents the system response. The results indicate that during the historical period, Subregions 1 (within China), 8 (mainly in Thailand), and 13 (mainly in Vietnam) were clearly dominated by internal irrigation pressure, with the proportion of local irrigation water use substantially exceeding the impact of upstream withdrawal. The remaining subregions were primarily influenced by upstream irrigation-induced pressure. Under future climate scenarios (2021–2040), both internal and external pressures across the basin exhibit an overall increasing trend and display pronounced nonlinear evolution and spatial heterogeneity. Compared with the historical periods (1980–2000 and 2001–2020), the growth rate of external irrigation pressure in downstream subregions (9–13) tends to slow, whereas the mid- and upper-stream subregions (2–8) continue to experience an increasing trend, indicating that evolving pressure conditions may further reshape regional water availability and the corresponding pressure system responses.
Subregion 8 is projected to undergo a structural shift in its dominant water pressure under future scenarios and exhibits multi-pathway evolution depending on the climate scenario. Under SSP1–2.6 and SSP2–4.5, internal pressure tends to stabilize while external pressure continues to rise, resulting in a transition from an internal expansion-dominated type to an internally adaptive type. In contrast, under SSP5–8.5, external withdrawal pressure intensifies markedly, driving further evolution toward an externally reinforced type. This transition provides a clear example of the dynamic interaction among PSR components, where changing irrigation pressures progressively alter the regional water availability state and may trigger adjustments in water management responses. By comparison, Subregions 13 and 9 consistently remain internally expansion-dominated and externally reinforced accumulative type, respectively, under both historical and future scenarios, indicating persistent structural vulnerability in these areas.
Based on the above findings, it is recommended that upstream regions prioritize alleviating water-use competition and continue improving irrigation water-use efficiency. Compound high-pressure areas in the mid- and lower basin (e.g., Subregion 13) require coordinated management of internal demand alongside mitigation of external pressures. In contrast, externally dominated regions must rely on effective transboundary basin coordination mechanisms to reduce the spatial propagation of competitive water use. The source-based subregion identification approach proposed in this study provides a quantitative tool for diagnosing water pressure in transboundary basins and offers a scientific basis for the equitable allocation of water governance responsibilities, thereby supporting more objective decision-making for negotiated water resources management.
Hydrological data are accessible at https://portal.mrcmekong.org/home (last access: 22 January 2026). Code for extracting canals across the lower Mekong can be obtained upon reasonable request from the primary author of the paper.
HZ and FT conceived and designed the study. HZ, ZZ, and KM contributed to model development, data analysis, and manuscript preparation. DZ contributed to manuscript revision. All authors participated in discussions throughout the study, provided critical feedback, and approved the final version of the manuscript.
At least one of the (co-)authors is a member of the editorial board of Hydrology and Earth System Sciences. The peer-review process was guided by an independent editor, and the authors also have no other competing interests to declare.
Publisher's note: Copernicus Publications remains neutral with regard to jurisdictional claims made in the text, published maps, institutional affiliations, or any other geographical representation in this paper. The authors bear the ultimate responsibility for providing appropriate place names. Views expressed in the text are those of the authors and do not necessarily reflect the views of the publisher.
The authors would like to thank the editors and the anonymous reviewers for their constructive comments that helped improve the manuscript. We also thank the Mekong River Commission for providing the datasets used in this study.
This research has been supported by the State Key Laboratory of Hydroscience and Engineering (grant no. sklhseTD-2024-C01) and the China Postdoctoral Science Foundation (grant no. 2024M761610).
This paper was edited by Bo Guo and reviewed by two anonymous referees.
Allen, R. G., Pereira, L. S., Raes, D., and Smith, M.: Crop evapotranspiration-Guidelines for computing crop water requirements-FAO Irrigation and drainage paper 56, Food and Agriculture Organization of the United Nations, Rome, ISBN 92-5-104219-5, 1998.
AQUASTAT: Irrigation water requirement and water withdrawals by country, https://openknowledge.fao.org/handle/20.500.14283/bc824e (last access: 12 August 2014), 2014.
Beck, L.: Transboundary water allocation in the Zambezi River Basin, ETH Zurich, https://doi.org/10.3929/ethz-a-006205803, 2010.
Chen, X., Zheng, Y., Xu, B., Wang, L., Han, F., and Zhang, C.: Balancing competing interests in the Mekong River Basin via the operation of cascade hydropower reservoirs in China: Insights from system modeling, J. Clean. Prod., 254, 119967, https://doi.org/10.1016/j.jclepro.2020.119967, 2020.
Do, P., Tian, F., Zhu, T., Zohidov, B., Ni, G., Lu, H., and Liu, H.: Exploring synergies in the water-food-energy nexus by using an integrated hydro-economic optimization model for the Lancang-Mekong River basin, Sci. Total Environ., 728, 137996, https://doi.org/10.1016/j.scitotenv.2020.137996, 2020.
Döll, P. and Siebert, S.: Global modeling of irrigation water requirements, Water Resour. Res., 38, 1–8, https://doi.org/10.1029/2001WR000355, 2002.
Eyring, V., Bony, S., Meehl, G. A., Senior, C. A., Stevens, B., Stouffer, R. J., and Taylor, K. E.: Overview of the Coupled Model Intercomparison Project Phase 6 (CMIP6) experimental design and organization, Geosci. Model Dev., 9, 1937–1958, https://doi.org/10.5194/gmd-9-1937-2016, 2016.
FAO: Crop Water Information [Land & Water], Food and Agriculture Organization of the United Nations Statistics Division, http://www.fao.org/land-water/databases-and-software/crop-information/en/ (last access: 19 January 2026), 2019.
Gidden, M. J., Riahi, K., Smith, S. J., Fujimori, S., Luderer, G., Kriegler, E., van Vuuren, D. P., van den Berg, M., Feng, L., Klein, D., Calvin, K., Doelman, J. C., Frank, S., Fricko, O., Harmsen, M., Hasegawa, T., Havlik, P., Hilaire, J., Hoesly, R., Horing, J., Popp, A., Stehfest, E., and Takahashi, K.: Global emissions pathways under different socioeconomic scenarios for use in CMIP6: a dataset of harmonized emissions trajectories through the end of the century, Geosci. Model Dev., 12, 1443–1475, https://doi.org/10.5194/gmd-12-1443-2019, 2019.
Hazbavi, Z., Sadeghi, S. H., Gholamalifard, M., and Davudirad, A. A.: Watershed health assessment using the pressure–state–response (PSR) framework, Land Degrad. Dev., 31, 3–19, https://doi.org/10.1002/ldr.3420, 2020.
Hoang, L. P., Lauri, H., Kummu, M., Koponen, J., van Vliet, M. T. H., Supit, I., Leemans, R., Kabat, P., and Ludwig, F.: Mekong River flow and hydrological extremes under climate change, Hydrol. Earth Syst. Sci., 20, 3027–3041, https://doi.org/10.5194/hess-20-3027-2016, 2016.
Hoang, L. P., van Vliet, M. T. H., Kummu, M., Lauri, H., Koponen, J., Supit, I., Leemans, R., Kabat, P., and Ludwig, F.: The Mekong's future flows under multiple drivers: How climate change, hydropower developments and irrigation expansions drive hydrological changes, Sci. Total Environ., 649, 601–609, https://doi.org/10.1016/j.scitotenv.2018.08.160, 2019.
IFPRI: Global Spatially-Disaggregated Crop Production Statistics Data for 2020 Version 1.0.0, Harvard Dataverse, V1 [data set], https://doi.org/10.7910/dvn/swpent, 2024.
Koponen, J., Paiboonvorachat, C., and Munoz, A.: The Council Study: Study on the sustainable management and development of the Mekong River, including impacts of mainstream hydropower projects, Mekong River Commission (MRC), Vientiane, Laos PDR, https://ebook.tnmc-is.org/read/53/pdf (last access: 24 April 2026), 2017.
Li, D., Long, D., Zhao, J., Lu, H., and Hong, Y.: Observed changes in flow regimes in the Mekong River basin, J. Hydrol., 551, 217–232, https://doi.org/10.1016/j.jhydrol.2017.05.061, 2017.
Li, D., Zhao, J., and Govindaraju, R. S.: Water benefits sharing under transboundary cooperation in the Lancang-Mekong River Basin, J. Hydrol., 577, 123989, https://doi.org/10.1016/j.jhydrol.2019.123989, 2019.
Liu, J., Chen, D., Mao, G., Irannezhad, M., and Pokhrel, Y.: Past and future changes in climate and water resources in the Lancang–Mekong River Basin: Current understanding and future research directions, Engineering, 13, 144–152, https://doi.org/10.1016/j.eng.2021.06.026, 2022.
Mehta, P., Siebert, S., Kummu, M., Deng, Q., Ali, T., Marston, L., Xie, W., and Davis, K. F.: Half of twenty-first century global irrigation expansion has been in water-stressed regions, Nat. Water, 2, 254–261, https://doi.org/10.1038/s44221-024-00206-9, 2024.
MERFI: Dataset on the Dams of the Greater Mekong, Mekong Region Futures Institute, Bangkok, 590, https://www.merfi.org/mekongregiondamsdatabase (last access: March 2025), 2024.
Morovati, K., Tian, F., Kummu, M., Shi, L., Tudaji, M., Nakhaei, P., and Olivares, M. A.: Contributions from climate variation and human activities to flow regime change of Tonle Sap Lake from 2001 to 2020, J. Hydrol., 616, 128800, https://doi.org/10.1016/j.jhydrol.2022.128800, 2023.
Morovati, K., Tian, F., Pokhrel, Y., Someth, P., Shi, L., Zhang, K., Nakhaei, P., and Ly, S.: Fishery and agriculture amidst human activities and climate change in the Mekong River: A review of gaps in data and effective approaches towards sustainable development, J. Hydrol., 644, 132043, https://doi.org/10.1016/j.jhydrol.2024.132043, 2024a.
Morovati, K., Zhang, K., Shi, L., Pokhrel, Y., Wu, M., Someth, P., Ly, S., and Tian, F.: On the cause of large daily river flow fluctuations in the Mekong River, Hydrol. Earth Syst. Sci., 28, 5133–5147, https://doi.org/10.5194/hess-28-5133-2024, 2024b.
Morovati, K., Kondolf, G. M., Pokhrel, Y., and Tian, F.: Saving Mekong River's ecosystem integrity before delta sinks, Sci. Bull., S2095-9273, https://doi.org/10.1016/j.scib.2026.01.031, 2026.
Munia, H., Guillaume, J., Mirumachi, N., Porkka, M., Wada, Y., and Kummu, M.: Water stress in global transboundary river basins: significance of upstream water use on downstream stress, Environ. Res. Lett., 11, 014002, https://doi.org/10.1088/1748-9326/11/1/014002, 2016.
Pokhrel, Y., Burbano, M., Roush, J., Kang, H., Sridhar, V., and Hyndman, D. W.: A review of the integrated effects of changing climate, land use, and dams on Mekong River hydrology, Water, 10, 266, https://doi.org/10.3390/w10030266, 2018.
Smakhtin, V., Revenga, C., and Döll, P.: A pilot global assessment of environmental water requirements and scarcity, Water Int., 29, 307–317, https://doi.org/10.1080/02508060408691785, 2004.
Smolenaars, W. J., Dhaubanjar, S., Jamil, M. K., Lutz, A., Immerzeel, W., Ludwig, F., and Biemans, H.: Future upstream water consumption and its impact on downstream water availability in the transboundary Indus Basin, Hydrol. Earth Syst. Sci., 26, 861–883, https://doi.org/10.5194/hess-26-861-2022, 2022.
Tatsumi, K. and Yamashiki, Y.: Effect of irrigation water withdrawals on water and energy balance in the Mekong River Basin using an improved VIC land surface model with fewer calibration parameters, Agric. Water Manag., 159, 92–106, https://doi.org/10.1016/j.agwat.2015.05.011, 2015.
Tennant, D. L.: Instream flow regimens for fish, wildlife, recreation and related environmental resources, Fisheries, 1, 6–10, https://doi.org/10.1577/1548-8446(1976)001<0006:IFRFFW>2.0.CO;2, 1976.
Tian, F., Li, H., and Sivapalan, M.: Model diagnostic analysis of seasonal switching of runoff generation mechanisms in the Blue River basin, Oklahoma, J. Hydrol., 418–419, 136–149, https://doi.org/10.1016/j.jhydrol.2010.03.011, 2012.
Tian, F., Liu, H., Hou, S., Li, K., Lu, H., Ni, G., Mu, X., and Baiyinbaoligao: Drought characteristics of the Lancang-Mekong basin and the role of reservoir regulation on streamflow, Int. J. Hydropower Dams, 5, 27, https://docslib.org/doc/12176561/drought-characteristics-of-lancang-mekong-river-basin-and-the-impacts-of-reservoir-regulation-on-streamflow (last access: 24 April 2026), 2020.
Tian, F., Wei, J., Haeffner, M., and Kreibich, H.: Coevolution and prediction of coupled human-water systems: a sociohydrologic synthesis of change in hydrology and society, Elsevier, https://doi.org/10.1016/C2024-0-03476-5, 2025.
USDA: Irrigation water requirements technical release no. 21, U.S. Dep. Agric. Soil Conserv. Serv., Washington D.C., ark:/13960/t4sj6229w, 1967.
Wang, G., Bibi, S., Zhu, T., and Tian, F.: Review analysis of irrigation and application of remote sensing in the lower Mekong river basin, Remote Sens., 15, 3856, https://doi.org/10.3390/rs15153856, 2023.
Wang, K., Liu, J., Xia, J., Wang, Z., Meng, Y., Chen, H., Mao, G., and Ye, B.: Understanding the impacts of climate change and socio-economic development through food-energy-water nexus: A case study of Mekong river delta, Resour. Conserv. Recycl., 167, 105390, https://doi.org/10.1016/j.resconrec.2020.105390, 2021.
Yu, Y., Bo, Y., Castelletti, A., Dumas, P., Gao, J., Cai, X., Liu, J., Kahil, T., Wada, Y., and Hu, S.: Transboundary cooperation in infrastructure operation generates economic and environmental co-benefits in the Lancang-Mekong River Basin, Nat. Water, 2, 589–601, https://doi.org/10.1038/s44221-024-00246-1, 2024.
Zafarmomen, N., Alizadeh, H., Bayat, M., Ehtiat, M., and Moradkhani, H.: Assimilation of sentinel-based leaf area index for modeling surface-ground water interactions in irrigation districts, Water Resour. Res., 60, e2023WR036080, https://doi.org/10.1029/2023WR036080, 2024.
Zhang, H., Bao, Y., He, X., Lv, J., Tang, Q., Qin, X., and Collins, A. L.: Prioritizing conservation sites for multi-pond systems to maintain protection of water quality in a fragmented agricultural catchment, Water Res., 268, 122763, https://doi.org/10.1016/j.watres.2024.122763, 2025.
Zhang, K., Morovati, K., Tian, F., Yu, L., Liu, B., and Olivares, M. A.: Regional contributions of climate change and human activities to altered flow of the Lancang-Mekong river, J. Hydrol. Reg. Stud., 50, 101535, https://doi.org/10.1016/j.ejrh.2023.101535, 2023.
Zhang, K., Zhao, Z., and Tian, F.: Mitigating the impact of increased drought-flood abrupt alternation events under climate change: the role of reservoirs in the Lancang-Mekong River Basin, Hydrol. Earth Syst. Sci., 30, 671–691, https://doi.org/10.5194/hess-30-671-2026, 2026.
Zhao, H., Tian, F., Zhang, K., Morovati, K., and Sun, J.: Intelligent remote sensing canal system detection and irrigation water use estimation: A case study in the transboundary Mekong River Basin, J. Hydrol., 657, 133110, https://doi.org/10.1016/j.jhydrol.2025.133110, 2025.
Zhao, H., Morovati, K., Tian, F., Lu, H., and Zhang, K.: Climate change, dams, and irrigation expansion reshape water–energy trade-offs in the Lancang–Mekong River Basin, J. Hydrol., 672, 135371, https://doi.org/10.1016/j.jhydrol.2026.135371, 2026.