the Creative Commons Attribution 4.0 License.
the Creative Commons Attribution 4.0 License.
Seasonal dynamics of closed shallow lakes nutrient status controlled by lacustrine groundwater discharge
Xiaoliang Sun
Yao Du
Hao Tian
Jiawen Xu
Huanhuan Shi
Yetong Liu
Yamin Deng
Yiqun Gan
Yanxin Wang
Lacustrine groundwater discharge (LGD) and its associated nitrogen (N) and phosphorus (P) inputs are increasingly recognized as the critical drivers of lake eutrophication. However, the intermonthly variability in LGD and its influence on lake nutrient dynamics remain poorly understood. In this study, high-frequency monitoring and hydrochemical analyses were conducted over a full hydrological year to investigate LGD-related nutrient fluxes and their effects in a typical oxbow lake in the central Yangtze Basin. Water level data and 222Rn tracing revealed a seasonal LGD pattern characterized by an increase from summer to winter, followed by a decline from winter to spring, with LGD rates ranging from 35.36–51.71 mm d−1. This pattern was regulated by monthly net precipitation, which controlled the lake level fluctuations and LGD rates. The corresponding N and P loads varied synchronously with LGD and showed seasonal synchrony with lake N and P concentrations. Moreover, variations in the NP ratio carried by LGD regulate the lake water NP ratio, thereby influencing its relationship with the dynamic changes in chlorophyll-a. A large number of typical closed shallow lakes similar to the studied cases exist worldwide, and therefore, the regulatory role of LGD on lake nutrient status revealed in this study can be reasonably extended to other closed shallow lake systems. This study provides the first evidence that groundwater-driven nutrient loading influences lake nutrient status on an intermonthly scale, offering new insights and management strategies for eutrophication control in closed shallow lake systems worldwide.
- Article
(5421 KB) - Full-text XML
-
Supplement
(599 KB) - BibTeX
- EndNote
Lakes are vital terrestrial ecosystems with ecological, environmental, and societal importance (Zedler and Kercher, 2005). A number of studies have highlighted that lacustrine groundwater discharge (LGD) not only sustains the lake water balance but also serves as a key pathway for nitrogen (N) and phosphorus (P) inputs, significantly influencing biogeochemical cycling (Meinikmann et al., 2015; Rosenberry et al., 2015; Luo et al., 2018; Kazmierczak et al., 2020; Lewandowski et al., 2024). By altering nutrient concentrations, LGD can regulate lake trophic status and contribute to eutrophication (Shi et al., 2022; Zheng et al., 2025). Thus, understanding LGD's impact on lake water environments is critical for elucidating eutrophication mechanisms.
The LGD rate exhibits pronounced temporal variability over the hydrological year, primarily influenced by the combined effects of hydrological and meteorological factors (Burnett et al., 2017; Shi et al., 2022). In relatively closed lake systems (lacking perennial surface river inflows or where inflowing runoff has minimal impact on hydrodynamics, water balance, or residence time), meteorological factors are generally the dominant drivers of LGD. However, the magnitude and direction of these influences vary considerably across regions. For example, studies in Lake Taihu indicate that evaporation can enhance LGD by regulating lake water levels (Shi et al., 2022) (four sampling campaigns); research in Huixian Lake in karst regions shows that precipitation can promote LGD by elevating groundwater levels (two sampling campaigns) (Zhang et al., 2024); whereas studies of subsidence lakes in coal mining areas have found that both precipitation and evaporation are negatively correlated with LGD, suggesting a complex influence mechanism of meteorological factors (four sampling campaigns) (Jiang et al., 2024). Although these studies have provided valuable insights, most observations are limited to extreme hydrological periods (e.g., wet and dry seasons) or are conducted at seasonal resolution (four sampling campaigns), generally lacking continuous monitoring with high-frequency. As a result, understanding of LGD dynamics at the monthly scale remains limited. However, the responses of lake water levels and groundwater levels to precipitation and evaporation typically occur on a monthly timescale, making it difficult for low-frequency or seasonal observations to effectively capture how water level fluctuations regulate LGD. In particular, along the process pathway of “precipitation/evaporation → lake/groundwater levels → LGD,” the mechanistic linkages remain insufficiently understood. Therefore, compared to the low-frequency monitoring commonly adopted in existing studies, high-frequency observations at the monthly scale can provide new insights and evidence for elucidating intra-seasonal LGD processes – an important scientific issue that has not yet received adequate attention in previous research.
In existing studies, groundwater is regarded not only as an important source of lake water recharge, but also as a major contributor of nitrogen and phosphorus inputs to lakes. In some lakes, LGD contributes more than 50 %, and in certain cases, over 90 % of the total nitrogen (N) and phosphorus (P) inputs often exceed those from surface inflows (Stets et al., 2010; Meinikmann et al., 2015; Shi et al., 2022). Once discharged, groundwater-derived nutrients undergo biogeochemical transformations or are assimilated by aquatic organisms, thereby affecting the primary productivity and eutrophication (Zheng et al., 2025). For instance, LGD-driven nutrient inputs have been shown to stimulate chlorophyll a (Chl a) production in closed lakes and alter nutrient limitation patterns via shifts in NP ratios (Xu et al., 2025). In Taihu Lake, LGD-derived N inputs were found to alleviate N limitation (Zheng et al., 2025). However, most studies have focused on nutrient flux quantification over discrete periods, with limited insight into the temporal variability and trophic responses of lakes. Understanding the monthly-scale variations and their controlling mechanisms is essential not only for predicting responses to extreme hydrological events but also for identifying critical periods of nutrient input that drive eutrophication.
Environmental tracers are increasingly applied in studies of LGD. An ideal tracer typically exhibits significant concentration differences between lake water and groundwater (often spanning orders of magnitude) and stable chemical properties (Arnoux et al., 2017; Petermann et al., 2018). Commonly used tracers include 222Rn, 226Ra, stable hydrogen and oxygen isotopes (δ2H, δ18O), Cl−, and electrical conductivity. Among these, 222Rn and 226Ra often show concentration differences of up to 2–3 orders of magnitude between the two water types, whereas differences in Cl− and electrical conductivity are generally smaller (sometimes only several times). Therefore, 222Rn and 226Ra are frequently the preferred tracers in LGD studies, with other indicators used as auxiliaries when conditions permit (Dimova and Burnett., 2011). The applicability of stable hydrogen and oxygen isotopes is strongly influenced by hydrological stability; in lakes with pronounced seasonal hydrological fluctuations, their quantitative accuracy may be significantly reduced (Sun et al., 2025a). Regarding radioactive tracers, 226Ra primarily desorbs from particles into the water phase in brackish or saline environments (Webster et al., 1995; Gonneea et al., 2008), and its concentration is typically low in freshwater lakes. Consequently, in freshwater lake LGD studies, 222Rn is more commonly used and effective due to its high solubility, large concentration gradient, and ease of detection.
The middle Yangtze River plain is characterized by a high density of lakes, and previous studies have shown that lakes of different types commonly exhibit groundwater discharge of varying intensities, along with associated nitrogen and phosphorus input fluxes (Jiang et al., 2022; Hu et al., 2023). However, its specific role in nutrient loading and eutrophication remains poorly understood. Heiwawu Oxbow Lake (HW lake), situated along a former Yangtze River channel, provides a valuable setting to examine the temporal dynamics of LGD due to its seasonal hydrological connectivity. Typically isolated from the Yangtze by November, HW lake experienced an earlier disconnection in August 2022 due to extreme drought. During this period, the lake's water and nutrient balance depended almost entirely on precipitation and groundwater, offering an ideal natural experiment to investigate LGD-driven nutrient loading and eutrophication over a complete hydrological year.
In this study, we quantified LGD and its associated nitrogen and phosphorus fluxes by conducting bi-monthly, high-frequency monitoring of groundwater and lake water levels, and by applying a 222Rn mass balance model to a typical closed lake in the middle reaches of the Yangtze River. Furthermore, we examined the influence of meteorological factors on LGD and the dynamic effects of LGD-driven nutrient inputs on lake trophic status. The results elucidate the role of precipitation and evaporation in regulating the seasonal dynamics of LGD and highlight the critical influence of LGD on the nutrient regime of closed lakes. These findings provide a valuable scientific basis for improving water quality management and mitigating eutrophication in closed-lake systems worldwide.
2.1 Study area
HW lake is situated in the southern Jianghan Plain on the northern bank of the middle reaches of the Yangtze River, between 29°45′10.98′′–29°48′52.10′′ N and 112°41′35.90′′–112°46′32.16′′ E (Fig. 1a and b). The region has a subtropical monsoon climate, with an annual mean temperature of 15–17 °C, average annual precipitation of approximately 1400 mm, and average annual evaporation of approximately 1100 mm (Jia et al., 2015). HW lake was formed in 1967 following the artificial cutoff of a meander of the Yangtze River, with a downstream channel providing hydrological connectivity between the lake and the river (Gao et al., 2016). During the wet season, elevated Yangtze River water levels induce the inflow into HW lake, whereas in the dry season, declining Yangtze River levels result in backflow from the lake into the river, ultimately leading to complete disconnection. In a typical hydrological year, HW lake experiences substantial water level fluctuations between the wet and dry seasons, with a magnitude of up to 8 m.
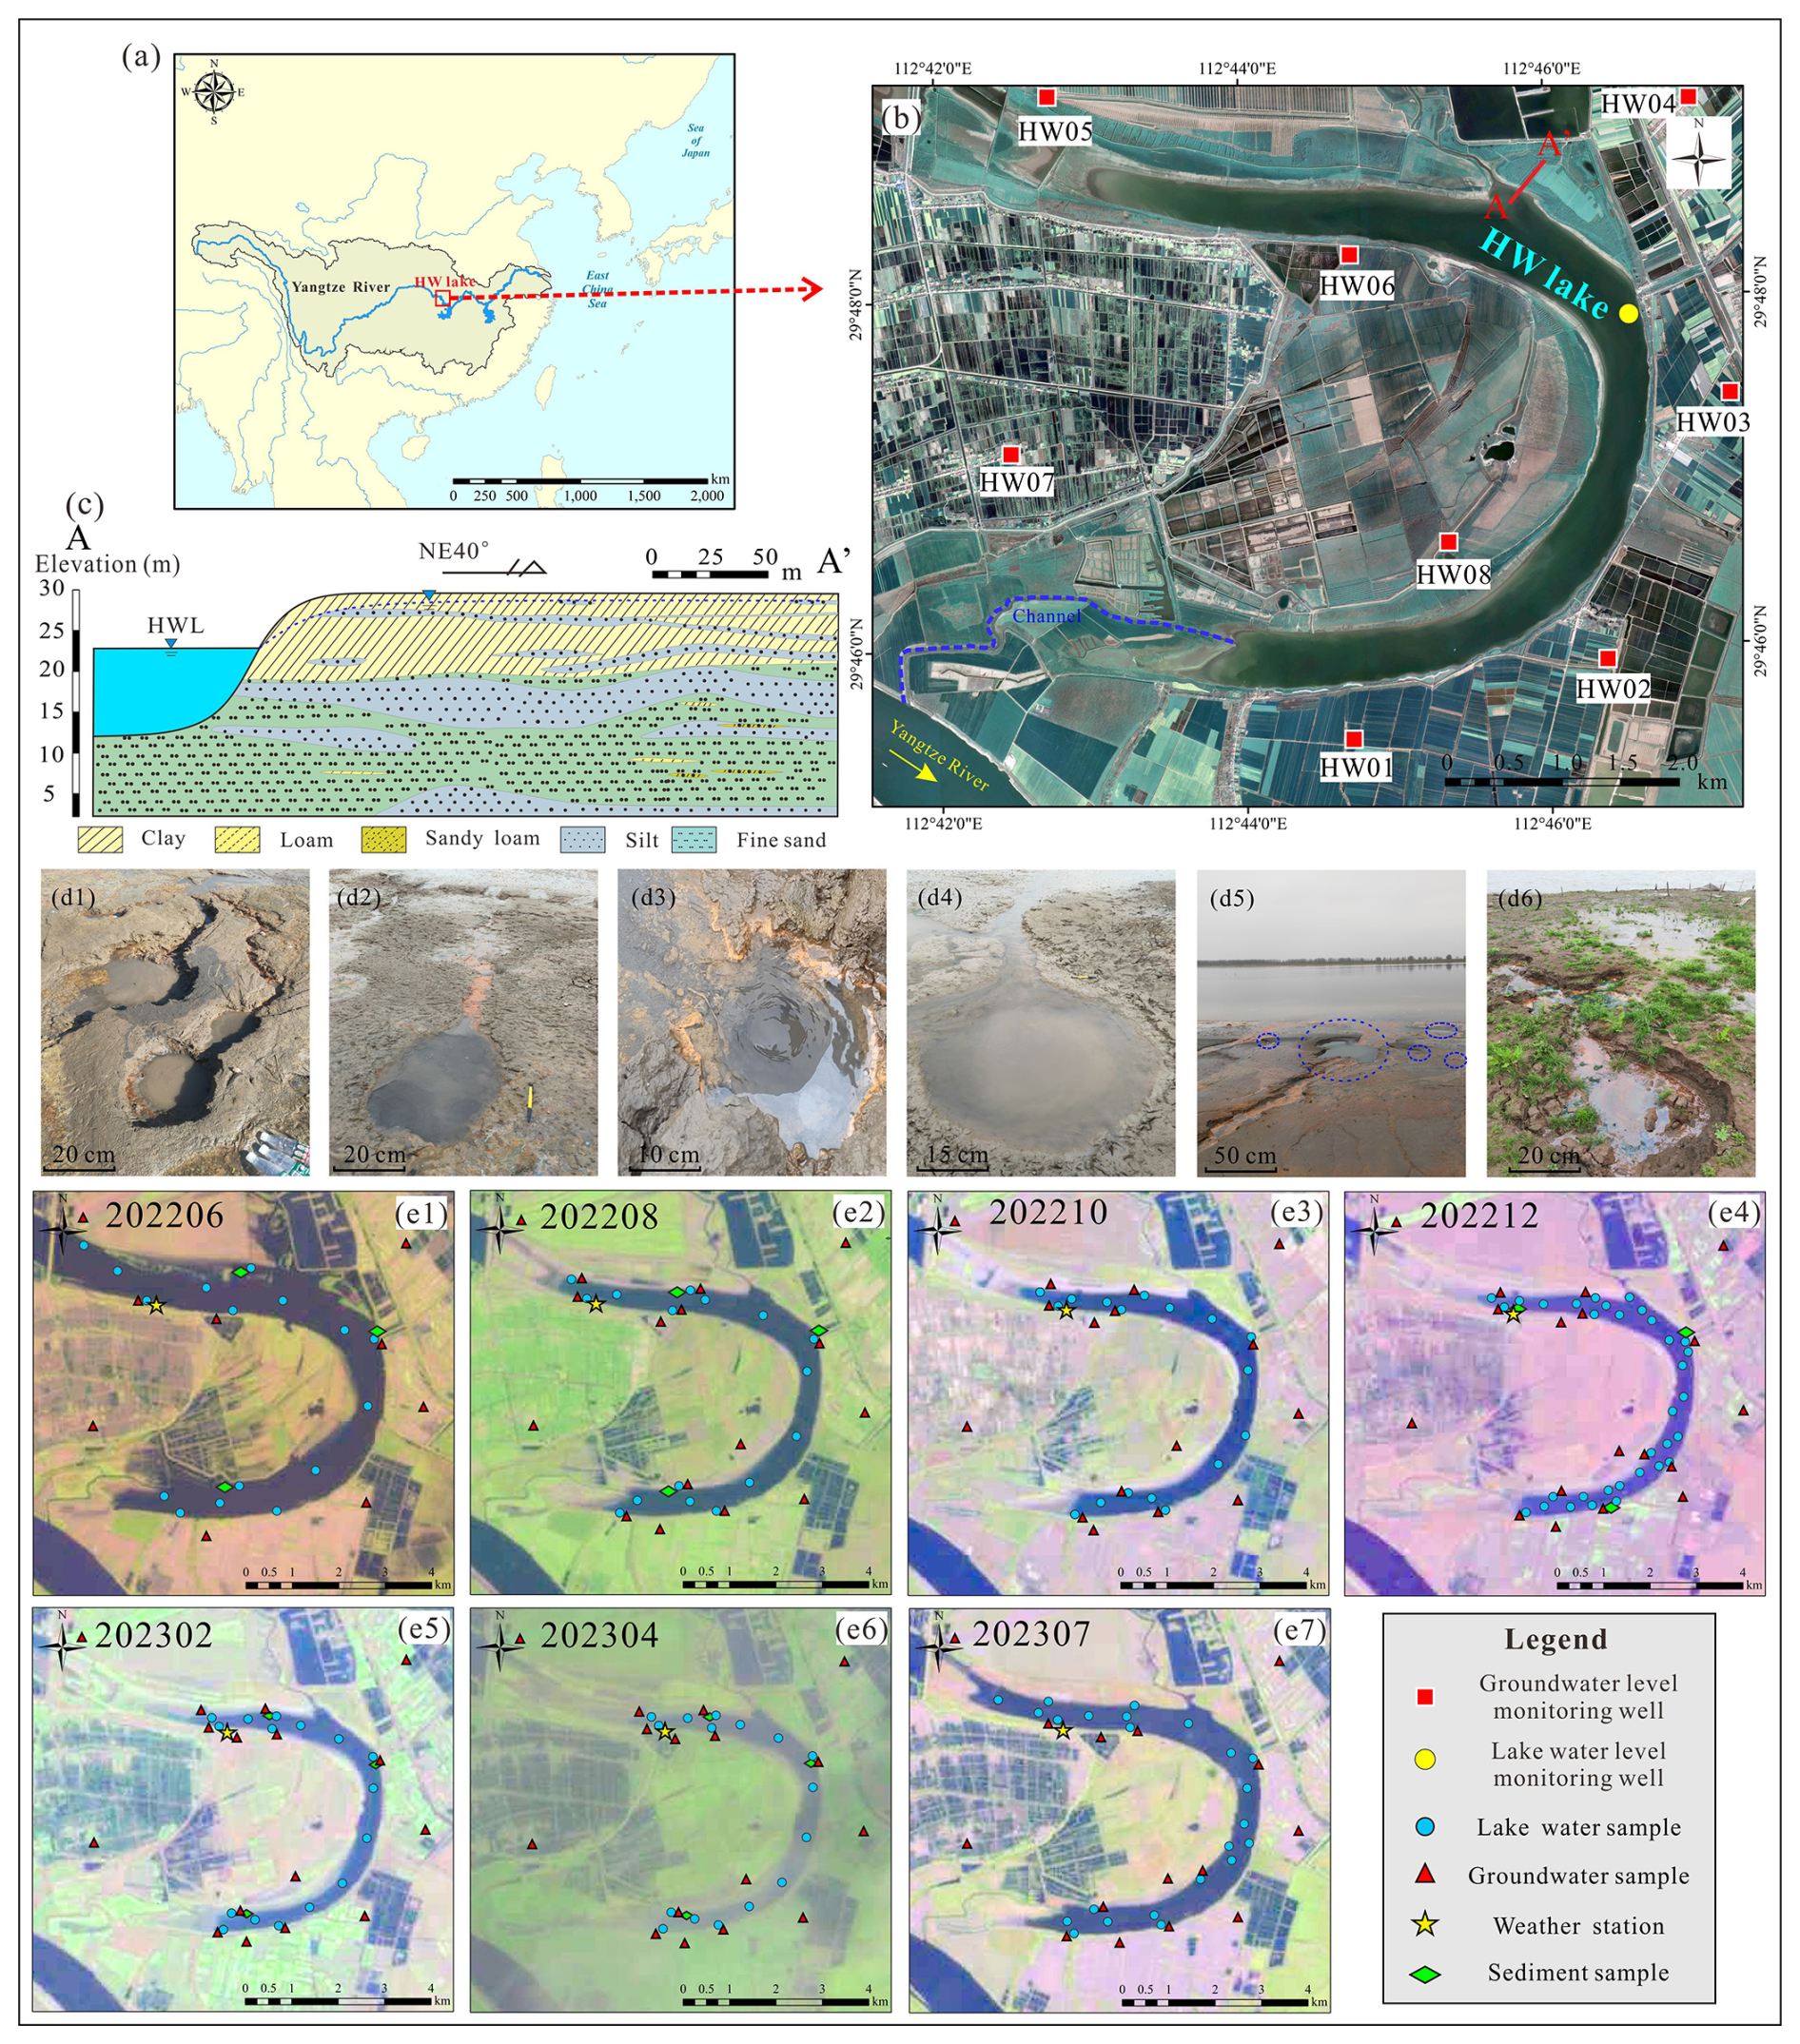
Figure 1Overview of the study area. (a) Geographical location of the HW lake (study area marked by a red box, from Esri | Powered by Esri). (b) satellite image of HW lake (Imagery © 2024 NASA, Map data © 2024 Google). (c) Hydrogeological cross-section along profile A–A′ (profile location indicated by line A–A′ in b). The cross-section shows only the upper part of the confined aquifer that interacts with the lake, and does not display the full thickness of the aquifer. (d1–d6) Zones of concentrated LGD phenomena in HW lake, primarily manifested as spring outlets. (e1–e7) Spatial distribution of field sampling sites collected between June and July 2022 (from Landsat 8). The numbers in the figure indicate the sampling periods. For example, 202208 represents August 2022. In June 2022 and July 2023, HW lake was connected to the Yangtze River through a channel, receiving inflow from the river, which led to higher water levels and an expanded inundated area. In the other months, HW lake was isolated from the Yangtze River, representing the period when LGD occurred.
The aquifer interacting with the oxbow lake comprises two distinct layers (Fig. 1c). The upper layer with 5–15 m thickness consists of low-permeability clay and silty clay with a hydraulic conductivity of approximately 1 m d−1 (Xue et al., 2021). In contrast, the lower layer is a confined aquifer 50–80 m thick, composed mainly of fine to coarse sand, and exhibits a higher hydraulic conductivity of approximately 5–15 m d−1. Owing to its greater permeability, the lower aquifer functions as the primary groundwater source directly connected to the lake. Previous studies have confirmed substantial LGD in HW lake, predominantly occurring as springs (Fig. 1d1–d6) and seepage flows (Sun et al., 2025b). The area surrounding HW lake is characterized by flat terrain with a slope of less than 0.1 ‰, and the dominant land use types include forest and farmland. This indicates that, except for runoff through artificial channels, surface runoff generated by other precipitation is almost negligible, and the water level gradient, rather than the terrain slope, becomes the key factor controlling groundwater-lake water exchange.
In 2022, a severe drought event in Yangtze River caused the water level of HW lake to decline in parallel with that of the Yangtze River, ultimately leading to complete disconnection from the river. Consequently, the lake entered the dry season approximately 2 months earlier than that in a typical hydrological year. During the groundwater discharge period, the water level of HW lake was minimally affected by hydrological fluctuations in the Yangtze River and was instead primarily controlled by meteorological factors such as precipitation and evaporation.
2.2 Field work and laboratory analysis
Systematic field sampling was conducted from June 2022–July 2023, with a sampling frequency of once every 2 months. Except for the July 2023 sampling conducted in early July, all other campaigns were performed at the end of the even-numbered months. Except for the campaigns in June 2022, December 2022, and July 2023, all sessions followed a standardized protocol involving the collection of 16 lake water samples, 8 well water samples, and 8 pore water samples. A total of 241 samples were collected (Table 1 and Fig. 1e1–e7), comprising 135 lake water samples, 56 well water samples, and 50 pore water samples. In addition to sample collection, each campaign included simultaneous measurements of environmental parameters, such as groundwater level, lake water level, lake depth, and wind speed. Due to seasonal fluctuations in lake water levels, the shoreline position shifted over time, resulting in slight spatial variations in the lakeshore sampling points across campaigns. The wind speed was continuously recorded at 15 min intervals using a weather station installed on the lakeshore, while the precipitation and evaporation data were sourced from the ECMWF reanalysis datasets.
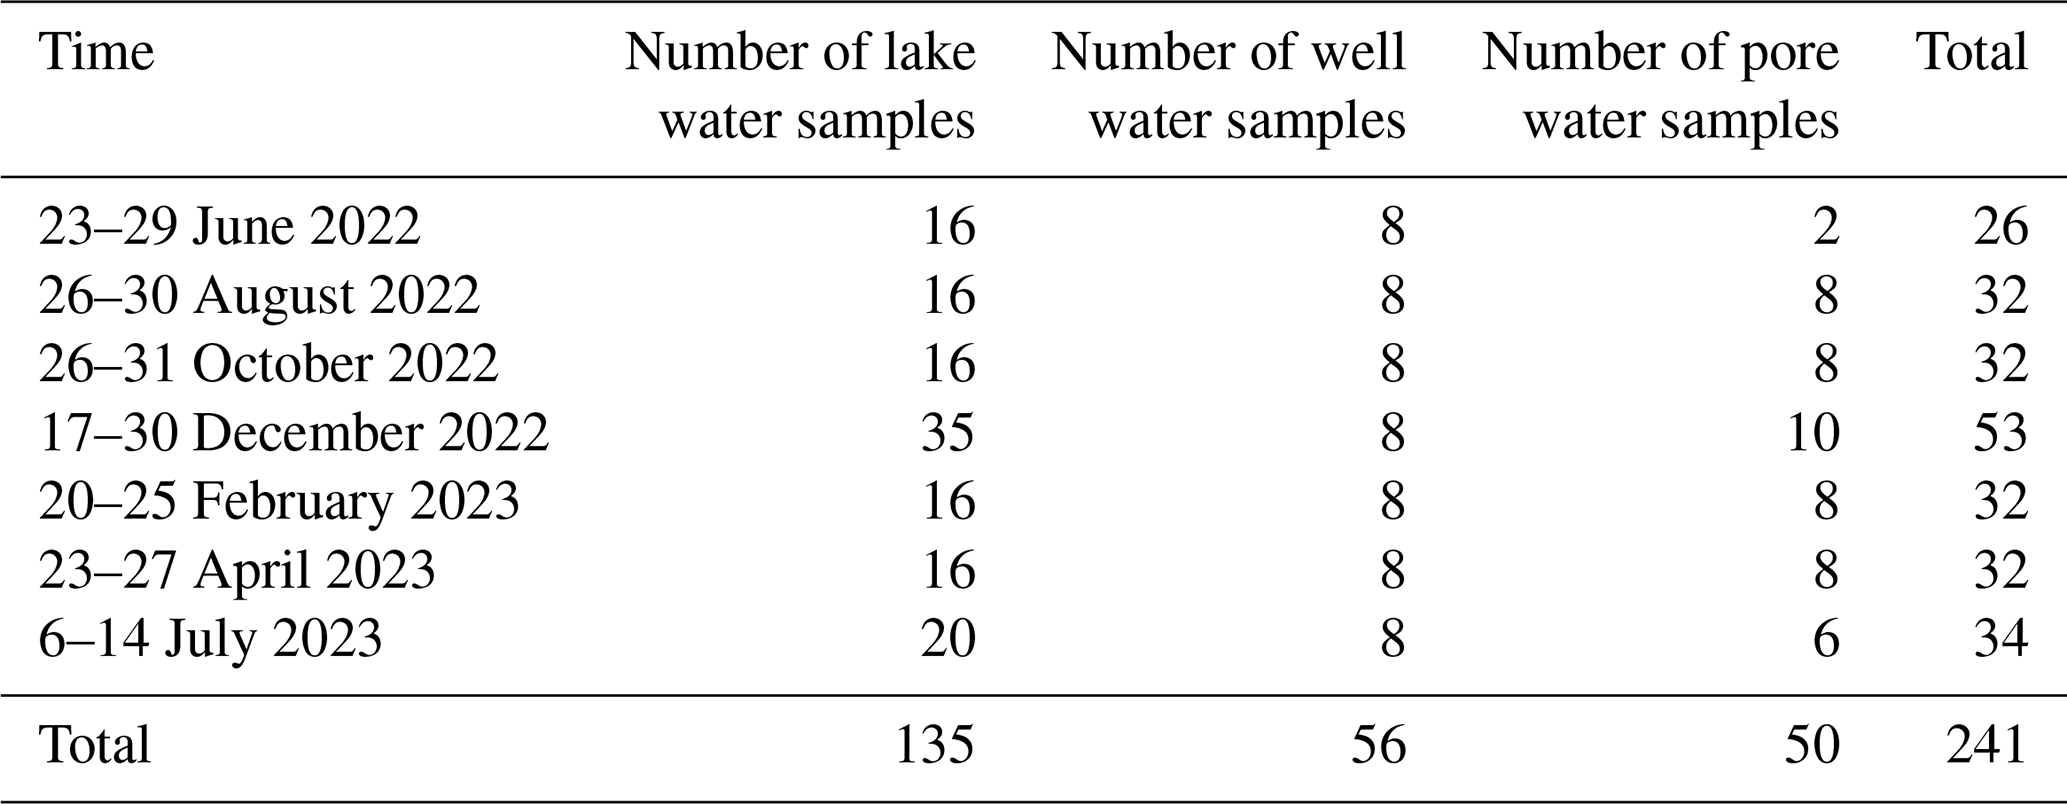
Samples from the lake center were collected by boat at fixed preselected locations. Surface water was sampled approximately 0.5 m below the surface using a specialized surface water sampler. The groundwater samples were categorized into two types: (1) well water collected from monitoring wells located 0.5–2.5 km from the lakeshore, with the depths between 15 and 30 m, and (2) spring water collected from natural springs situated within 15 m of the shoreline and in shallow lake zones, serving as the representative lakeshore pore water. In addition, three nearshore lakebed sediment samples were collected for incubation experiments to determine the 222Rn concentrations. The wind speed was continuously recorded at 15 min intervals using a weather station installed on the lakeshore, while the precipitation and evaporation data were sourced from the ECMWF reanalysis datasets.
For 222Rn analysis, the water samples were collected in 250 mL or 2.5 L glass bottles using an overflow method to eliminate residual air. 222Rn concentrations were quantified using a RAD7 system (Durridge Company, Inc.) equipped with RAD7-H2O and RAD7 Big Bottle accessories. To reduce the measurement uncertainty in lake water samples, the counting time was extended to 60 min per sample. All 222Rn analyses were completed within 24 h of sampling, using the RAD7 aqueous system.
where A0 represents the 222Rn concentration (Bq m−3) at the sampling time; A represents the 222Rn concentration (Bq m−3) at the measurement time; λ represents the decay coefficient of 222Rn, 0.181 d−1; and t represents the time interval (d) between sampling and measurement. The uncertainty in 222Rn testing for lake water was approximately 35 %, and the uncertainty in 222Rn testing for groundwater is approximately 25 %.
The samples for total nitrogen (TN) and total phosphorus (TP) analysis were field-filtered using a 0.45 µm membrane filter and then stored in 30 mL polyethylene bottles and 20 mL brown screw-cap glass bottles, respectively. The TP samples were acidified with concentrated HNO3 to a pH below 2, sealed, and subsequently analyzed using an inductively coupled plasma optical emission spectrometer (ICP-OES, iCAP 6000 series, Thermo Fisher Scientific, USA) at the School of Environmental Studies, China University of Geosciences (Wuhan), with a detection limit of 0.001 mg L−1. TN samples were analyzed using a total organic carbon/nitrogen analyzer at the Wuhan Botanical Garden, Chinese Academy of Sciences, with a detection limit of 0.01 mg L−1. Chl a concentrations were determined immediately after sampling using an AquaFluor fluorometer, with a detection limit of 0.5 µg L−1. Water quality parameters, including pH, temperature, DO, ORP, and EC, were measured in situ using a HACH-HQ40D multi-parameter probe.
2.3 222Rn mass balance model
In recent years, 222Rn has been widely used in studies of LGD. Derived from its parent isotope 226Ra, 222Rn has a half-life of 3.82 d. By treating lake water as a closed system, a mass balance model was developed based on both the sources and sinks of 222Rn. The 222Rn flux from the groundwater discharge was inferred as an unknown term (Schmidt et al., 2010; Luo et al., 2018; Adyasari et al., 2023). The 222Rn mass balance model is expressed as follows, and a conceptual diagram of its budget terms is shown in Fig. S1 in the Supplement:
where Fg, Fd, and Fa are the 222Rn fluxes () of groundwater discharge, sediment diffusion, and atmospheric escape, respectively; I226Ra and I222Rn are the pools of 226Ra and 222Rn in the lake water (Bq m−2), which are equal to the concentrations of 226Ra and 222Rn multiplied by the water depth; and the decay coefficients of 222Rn (λ222Rn) and 226Ra (λ226Ra) were 0.181 d−1 and , respectively. The measurement times before and after sampling were the first day and the last day of the sampling period, respectively. Since there is almost no difference in the lake water level and 222Rn concentration at the same location before and after sampling, the change in the 222Rn in lake water on the left side of the equation can be approximated as 0 (Kluge et al., 2007).
The 222Rn flux diffused from the sediment to the lake is one source of the 222Rn mass balance model, and it is calculated by the following formula:
where Cp (Bq m−3) and Cw (Bq m−3) are 222Rn concentrations of pore water in sediments and overlying lake water, respectively; Dm (cm2 s−1) is the 222Rn molecular diffusion coefficient in wet bulk sediment; n is the porosity of the sediment.
To determine the 222Rn concentrations in sediment pore water, a sediment equilibrium incubation experiment was carried out following the procedure proposed by Corbett et al. (1998). The Dm is expressed as:
where Tw is water temperature (°C). An equilibrium incubation experiment with lakebed sediments was carried out to obtain the 222Rn concentration in sediment pore water (Corbett et al., 1998).
The atmospheric loss of 222Rn is estimated based on the following empirical equation, which is related to temperature and wind speed (MacIntyre et al., 1995):
where K values are in cm h−1 but have been scaled to m d−1 for input into Eq. (5); Cw is the concentration of lake water 222Rn (Bq m−3); Ca is the concentration of 222Rn in the air (Bq m−3); α is the gas distribution coefficient (dimensionless) and is a temperature dependent function; 222Rn from the decay of dissolved 226Ra can be generally omitted for 222Rn mass balance model.
The LGD rate can be obtained by dividing the 222Rn flux from groundwater discharge by the 222Rn concentration of surrounding groundwater. The formula is as follows (Luo et al., 2018; Wang et al., 2019):
where V is the average LGD rate (m m d−1); Fg is the 222Rn flux of groundwater discharge (); Cg is the 222Rn concentrations in groundwater end member (Bq m−3). A more detailed description can be found in Sect. S1 in the Supplement.
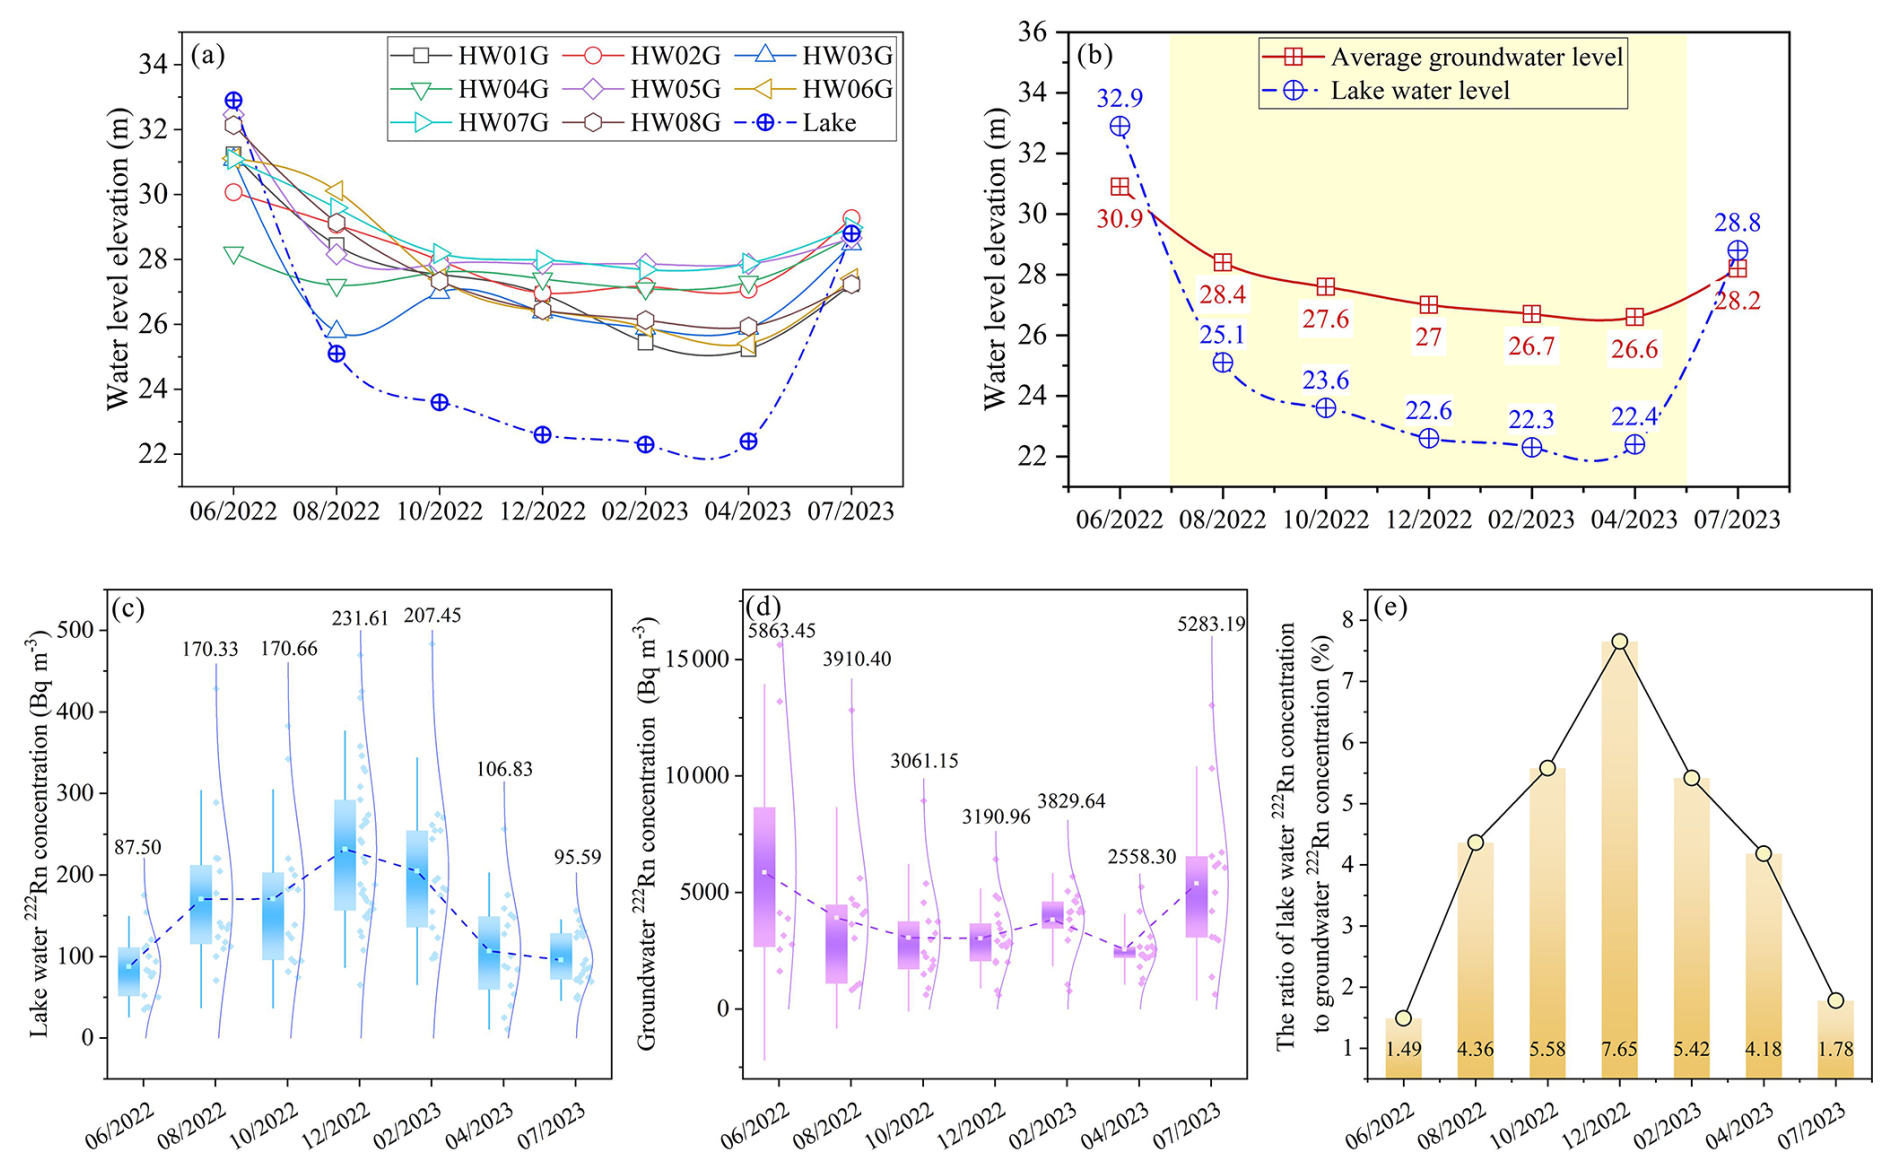
Figure 2(a) Variations in lake water level and groundwater levels across all groundwater monitoring points. (b) Variations in lake water levels compared with the average groundwater level, the yellow area indicates the period of LGD. (c) Variations in the lake water concentrations of 222Rn. (d) Variations in the groundwater concentrations of 222Rn. In (c, d), the top and bottom of each box represent the 75th and 25th percentiles of the data, respectively; the ends of the whiskers indicate the maximum and minimum values within 1.5 times the interquartile range; the small white square inside the box denotes the mean; the side curves illustrate the data's dispersion and distribution pattern; the dark blue dashed line connects the mean values across different periods. (e) Variations in the ratio of 222Rn concentrations in lake water to groundwater.
3.1 Seasonal variations in LGD rates
3.1.1 Identification of seasonal variations in LGD
-
Lake water and groundwater level
The fluctuations in lake water levels and groundwater levels reflect a pronounced interaction between groundwater and the lake. During the field monitoring period, both exhibited significant changes in water level.
From June 2022–July 2023, the lake water level fluctuated significantly between 22.30 and 32.90 m, with a peak in late June 2022 and a low in late February 2023, demonstrating a variation of 10.6 m (Fig. 2a). Initially, the HW lake's high water level was sustained by its connection to the Yangtze River, which was at a high level in June 2022. However, a severe drought from August to September 2022 caused a rapid decline in the Yangtze River level, resulting in a corresponding decrease in the HW lake level. From late October 2022 to early May 2023, as the Yangtze River fell below 26.5 m, HW lake became hydrologically isolated, with no surface water inflow or outflow. The rate of water level decline slowed from October 2022–February 2023 and began to rise in March 2023 because of increased precipitation. In May 2023, when the Yangtze River exceeded 26.5 m again, the HW lake level rose sharply due to the inflow.
The groundwater levels from the eight surrounding wells exhibited similar fluctuations, ranging from 26.6–30.9 m (Fig. 2a). From June 2022–April 2023, groundwater levels consistently declined, with a slight increase observed from April–July 2023. Generally, the groundwater level trends mirrored those of the lake, except for the period from February–April 2023, when the groundwater levels decreased while the lake levels increased. The difference between the average groundwater and lake levels ranged from , affecting the LGD rates over time. In June 2022, all eight wells had groundwater levels lower than those of the lake, indicating complete lake recharge. By July 2023, four wells presented lower groundwater levels, whereas four exhibited higher levels, suggesting simultaneous recharge and discharge. From August 2022–April 2023, groundwater consistently discharged into the lake, with the largest groundwater-lake level difference occurring in December 2022, indicating the highest LGD rate during that period (Fig. 2b).
-
Lake water and groundwater 222Rn concentration
As a limited tracer for LGD, the concentration of 222Rn can indicate changes in LGD. During the field monitoring period, both lake water and groundwater concentrations underwent some variations, with differing magnitudes.
The fluctuation in the lake water 222Rn concentration from June 2022–July 2023 (Fig. 2c) exhibited an initial increase followed by a decrease. The lowest concentration occurred in June 2022, whereas the highest was recorded in December 2022, with values of 87.50 and 231.61 Bq m−3, respectively. Similarly, groundwater also demonstrated a trend of initial decrease followed by an increase (Fig. 2d), with the highest values in June 2022 and the lowest values in April 2023, at 5863.45 and 2558.30 Bq m−3 respectively.
During the period of groundwater discharge to the lake, when groundwater levels were consistently above lake levels (August 2022–April 2023), the lake water 222Rn concentration ranged from 106.83–231.61 Bq m−3. While, the groundwater 222Rn concentration ranged from 2558.30–3910.40 Bq m−3. Based on the coefficient of variation (CV, used to measure the relative dispersion of data, defined as the ratio of the standard deviation to the arithmetic mean), the 222Rn concentration in groundwater (CV≈17.60 %) is more stable than that in lake water (CV≈26.62 %), indicating a relatively consistent 222Rn endmember value for groundwater. Because groundwater was the primary source of 222Rn in the lake, variations in lake water 222Rn concentrations reflected changes in the LGD rate. As shown in Fig. 2e, the ratio of lake water to groundwater 222Rn concentration initially increased and then decreased with a peak in December 2022, which suggested that the LGD rate was the highest during that period. This pattern is consistent with the relationship between groundwater and lake water levels.
Notably, as shown in Fig. 2a and c, during the two periods when the groundwater level was lower than the lake water level (June 2022 and July 2023), lake-water 222Rn concentrations were 87.50 and 95.59 Bq m−3, respectively, which are lower than those in the other periods, indicating that groundwater discharge was generally limited. Nevertheless, measurable 222Rn was still detected in the lake water, suggesting additional inputs from other water sources. Concurrently, 222Rn concentrations in the Yangtze River were 90.50 and 50.47 Bq m−3, respectively. In June 2022, the lake-water 222Rn concentration was very similar to that of the Yangtze River, indicating that the lake was mainly controlled by Yangtze River inputs during this period. In contrast, in July 2023 the lake-water 222Rn concentration was slightly higher than that of the Yangtze River; together with the observation that groundwater levels in some monitoring wells were still slightly higher than the lake level, this suggests the presence of weak, localized groundwater discharge during this period. In addition, intense summer precipitation led to increased catchment runoff into the lake, which generally exhibited high 222Rn concentrations, primarily derived from 222Rn released through interactions between rainfall and surface soils rather than from aquifer groundwater. Overall, the higher lake-water 222Rn concentration in July 2023 compared with June 2022 reflects the combined effects of Yangtze River input, localized weak groundwater discharge, and precipitation-driven runoff.
3.1.2 Quantification of LGD rates for each period
Based on the lake level and groundwater monitoring data, the period from late August 2022 to late April 2023 was characterized by consistently higher groundwater levels than the lake stage, during which the lake was hydrologically isolated from external surface water inputs. This interval was conservatively defined as the active phase of LGD (Fig. 2b). Using the 222Rn mass balance model, LGD rates were computed for each period of groundwater discharge during groundwater excretion.
Table 2 summarizes the detailed parameters and results for the source and sink terms across each sampling period. A comparison of the 222Rn fluxes associated with the source and sink terms in the 222Rn mass balance model for each period is shown in Fig. S2. In terms of source, the groundwater-derived 222Rn input flux ranged from , while the diffusive flux of 222Rn from sediment pore water varied between 18.82±2.88 and . In terms of sink, the radioactive decay flux of 222Rn in lake water ranged from , and atmospheric evasion accounted for a flux of .
Table 2The calculation parameters and results of the 222Rn mass balance model for each period.
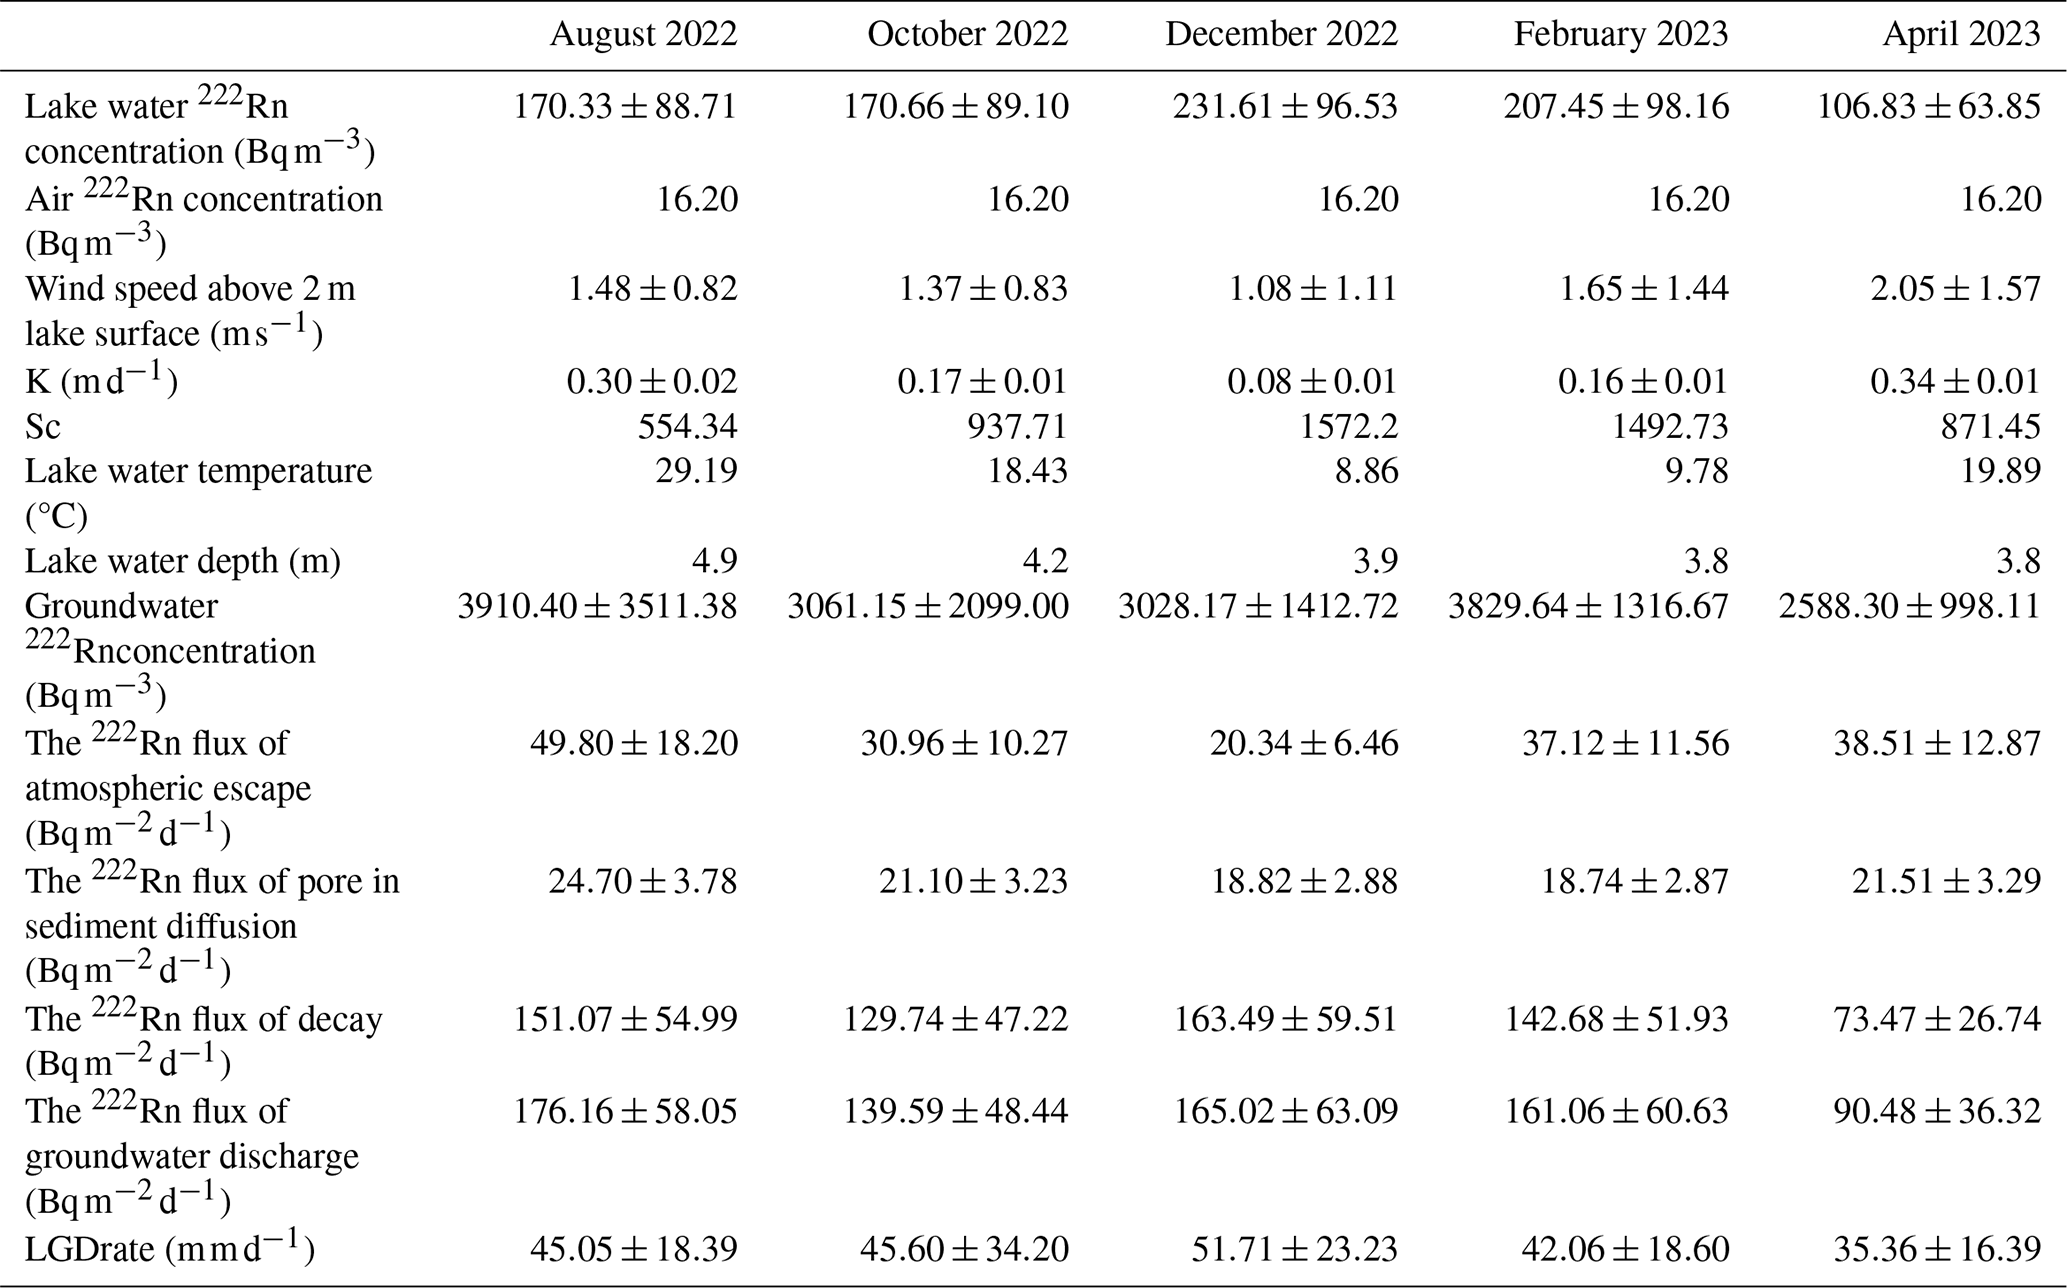
The LGD rates for each period were calculated by dividing the flux of 222Rn input from LGD by the corresponding groundwater 222Rn concentration (Fig. 3a). From August 2022–April 2023, the LGD rates ranged from , with the maximum value being 1.46 times the minimum value. Notably, an increasing trend in groundwater excretion rates was observed from August–December 2022, which was followed by a decreasing trend from December 2022–April 2023. The highest rate of groundwater excretion occurred in December 2022, whereas the lowest LGD rate was recorded in April 2023.
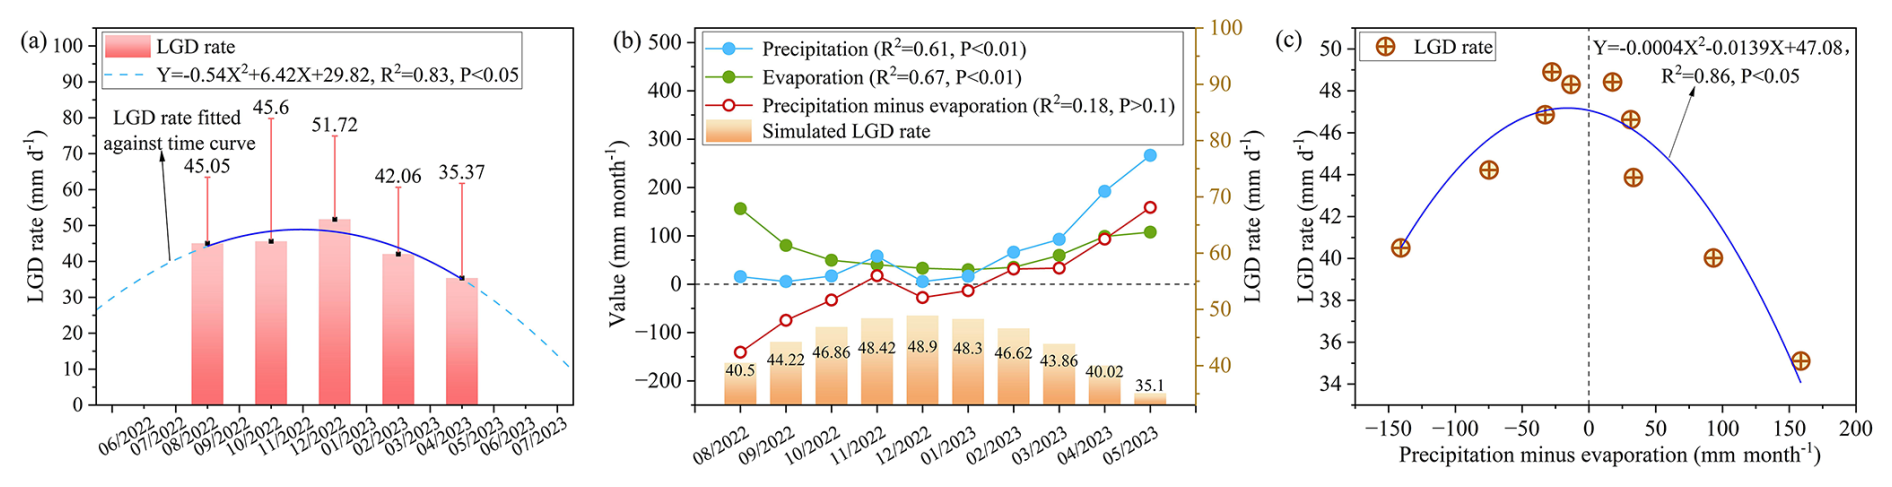
Figure 3(a) The LGD rate of different periods and their fitted relationship between LGD rate and time. (b) Relationship between simulated LGD rate and precipitation and evaporation, where R2 represents the linear correlation coefficient between this indicator and the LGD rate. (c) Relationship between PME and LGD rate.
3.2 Climatic controls on seasonal variations in LGD rates
3.2.1 Relationship between precipitation and evaporation and LGD rates
To obtain a high-frequency within the hydrological year, fitting equations were established to simulate the monthly LGD rates during groundwater discharge periods. The quadratic equation representing LGD rates based on the 222Rn mass balance model and time was , R2=0.83, P<0.05 (where X represents the time and Y represents the LGD rate) (Fig. 3a). Due to the small sample size, the robustness of the model's fit may be limited. Nonetheless, under the field observed conditions, the monthly fluctuations of lake and groundwater levels were relatively small and exhibited regular patterns, so the actual monthly variation of LGD showed a predictable “increase followed by decrease” pattern. Therefore, the predictions of this model are considered reliable. Using this equation, the LGD rates were estimated for the period from August 2022–May 2023. Although the water level at the Jianli station of the Yangtze River exceeded 26.5 m in May 2023 for just 10 d, the inflow from the Yangtze River to the HW lake was minimal and insufficient to raise the lake level above the groundwater level. Therefore, groundwater discharge into the lake continued in May 2023. The simulated LGD rates ranged from 35.10–48.90 mm d−1 between August 2022 and May 2023 (Fig. 3b), with an approximately 8 % error compared to the rates derived from the 222Rn mass balance model. These rates exhibited an increasing trend followed by a decreasing trend, peaking in the middle of the groundwater discharge period, and tapering at both the beginning and end stages.
During the groundwater discharge period, the changes in precipitation and evaporation were inversely related to the changes in LGD, demonstrating a clear negative correlation with LGD rates, with correlation coefficients of R2=0.61, P<0.01 and R2=0.67, P<0.01, respectively (Figs. 3b, S3a and b). This suggested that lower monthly precipitation and evaporation contributed to the larger LGD. This aligns with Jiang et al.'s (2024) results showing an inverse relationship between LGD rates and precipitation/evaporation. Additionally, the value of precipitation minus evaporation (PME) played a significant role in the hydrological cycle. By analyzing the relationship between the PME and LGD rates, a non-linear relationship was identified, with the fitted equation being , R2=0.86, P<0.05 (Fig. 3c). When PME was greater than 0, a larger PME resulted in a smaller LGD. When PME was less than 0, a smaller PME led to a smaller LGD. When both precipitation and evaporation were low and the PME approached 0, LGD reached its maximum value.
3.2.2 Dominance of precipitation and evaporation on seasonal variations in LGD rates
The hydraulic gradient determines the variation in the LGD rate. At different periods, a strong correlation was observed between the LGD rate and hydraulic gradient (R2=0.77, P<0.05) (Fig. 4a), with both showing a consistent trend of change, in accordance with Darcy's law (Tecklenburg and Blume; 2017) (Fig. 4a). The hydraulic gradient is controlled by the water level difference between groundwater and lake water – when this difference increases, the LGD rate rises; when it decreases, the LGD rate declines. From August to December 2022, the water level difference increased, leading to a rising LGD rate; from December 2022–April 2023, the difference decreased, resulting in a lower LGD rate (Fig. 4a). This variation is determined by the differences in groundwater level and lake water level. If the lake level drops more than the groundwater level, the gradient increases and LGD intensifies; if the groundwater level drops more, the gradient and LGD both decline (Fig. 4b).
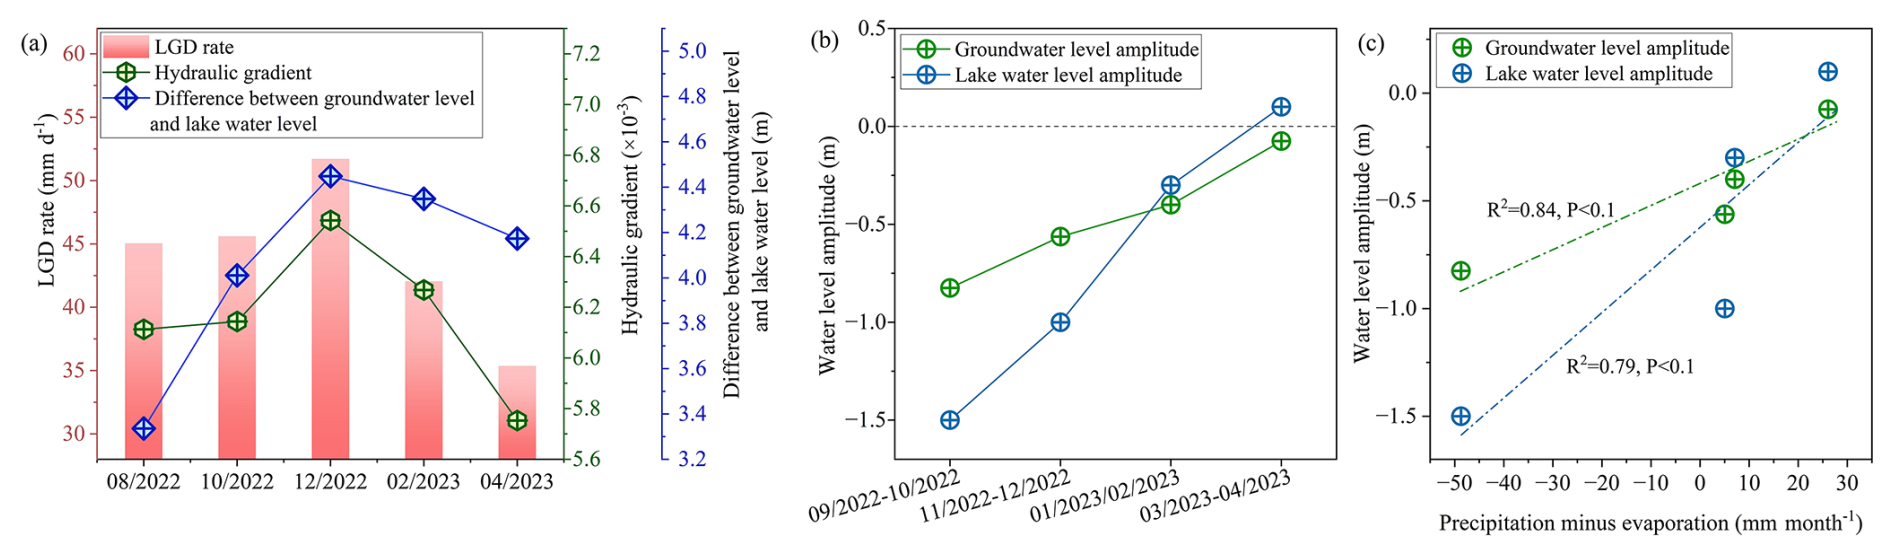
Figure 4(a) Temporal characteristics of LGD rate, hydraulic gradient, and difference in groundwater and lake water levels. (b) Temporal characteristics of groundwater and lake water level change amplitudes, negative values indicate the amplitudes of water level decline, while positive values represent the amplitudes of water level rise. (c) Relationship between groundwater level amplitude, lake water level amplitude, and PME.
Monitoring data show that lake levels consistently declined during the study period, though the rate of decline slowed, primarily due to low precipitation, reduced evaporation, cooler temperatures, and decreased water consumption by agriculture and aquatic organisms. After February 2023, increasing precipitation slightly raised lake levels. Groundwater levels also declined steadily, mainly due to continuous LGD to lake, with minimal influence from human extraction or evaporation. Between August and December 2022, groundwater levels fell more slowly than lake levels, increasing the hydraulic gradient and LGD. From February 2023 onward, the groundwater level declined more than the lake level, reducing the gradient and LGD rate. By April 2023, groundwater levels stabilized while lake levels rose slightly, further decreasing the hydraulic gradient and LGD.
Net precipitation (PME) indirectly controls seasonal variations in LGD by regulating the hydraulic gradient. Observations show that PME is closely associated with lake water level variations. During periods of higher PME, the decline in lake water level slows or even reverses, whereas under lower PME conditions, the rate of lake level decline accelerates. Meanwhile, groundwater levels exhibit a response pattern consistent with lake water level variations. From a mechanistic perspective, this relationship can be explained as follows: PME directly influences lake water level dynamics by regulating the lake water balance, and further alters the water level difference between the lake and groundwater. When the decline in lake water level is relatively small, groundwater discharge to the lake weakens, thereby suppressing the decline in groundwater levels. Conversely, when lake level decline intensifies, groundwater discharge is enhanced, leading to a further decrease in groundwater levels. Ultimately, this process regulates the seasonal variability of LGD rates by modifying the hydraulic gradient. On this basis, this process can be conceptualized as a coupled framework of “meteorological forcing–water level response–hydraulic gradient regulation–LGD variation” (Fig. 5).
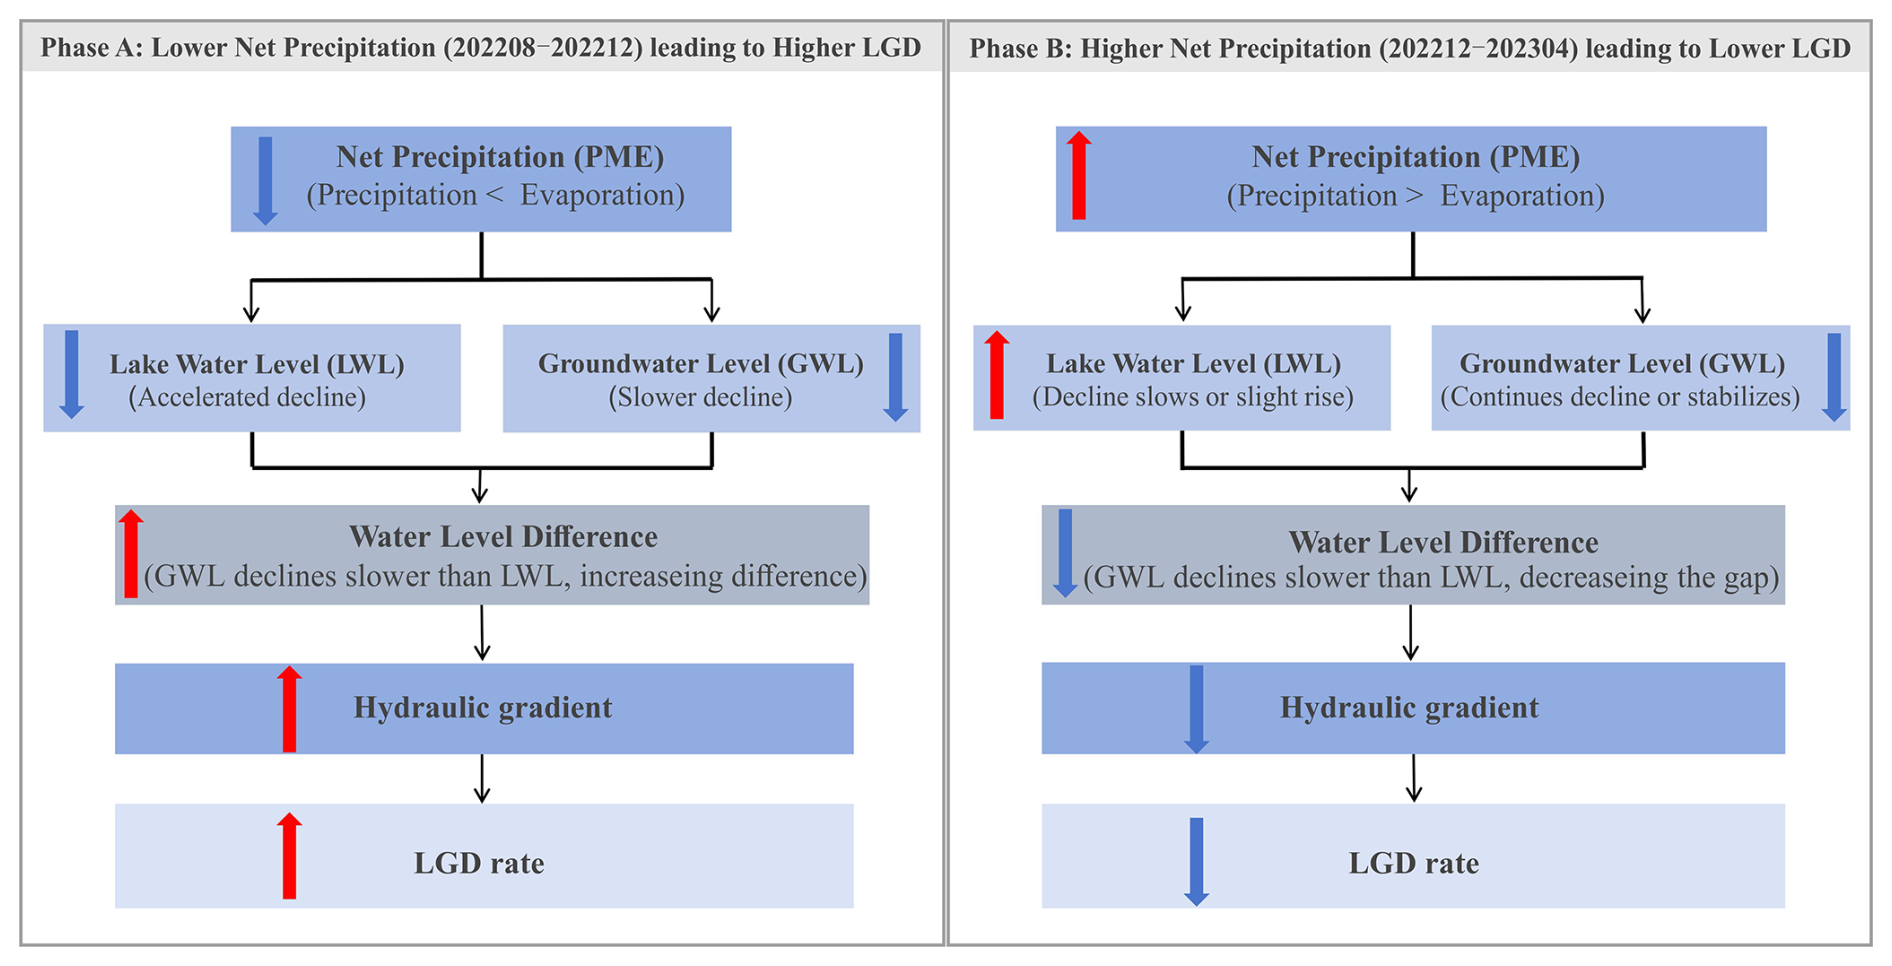
Figure 5Conceptual model illustrating the mechanisms by which precipitation and evaporation influence LGD rates. Red upward arrows and blue downward arrows indicate increasing and decreasing trends of the corresponding parameters, respectively.
3.3 Impact of LGD-carried N and P on seasonal nutrient status of lakes
3.3.1 Seasonal variations in TN and TP loads carried by LGD
Between August 2022 and April 2023, the concentration of TN in the groundwater exhibited notable temporal variability, ranging from 0.24–0.46 mmol L−1. The lowest concentration was observed in August 2022, whereas the peak was observed in December 2022 (Table 3). In comparison, the range of temporal variations in TP concentration in groundwater was wider, spanning from (Table 3). The lowest TP concentration was recorded in December 2022, whereas the highest occurred in February 2023. Based on Eh, DO, and EC results (Table S3 in the Supplement), TP concentration fluctuations likely result from the combined effects of internal adsorption and fixation, external input pulses, and geochemical competition under the background of an oxidation-enhanced environment driven by declining water levels (Eh and DO continuously increasing). For a detailed analysis, see the Supplement.
Table 3Concentrations of TN and TP in groundwater at various periods and loads of TN and TP carried by LGD.
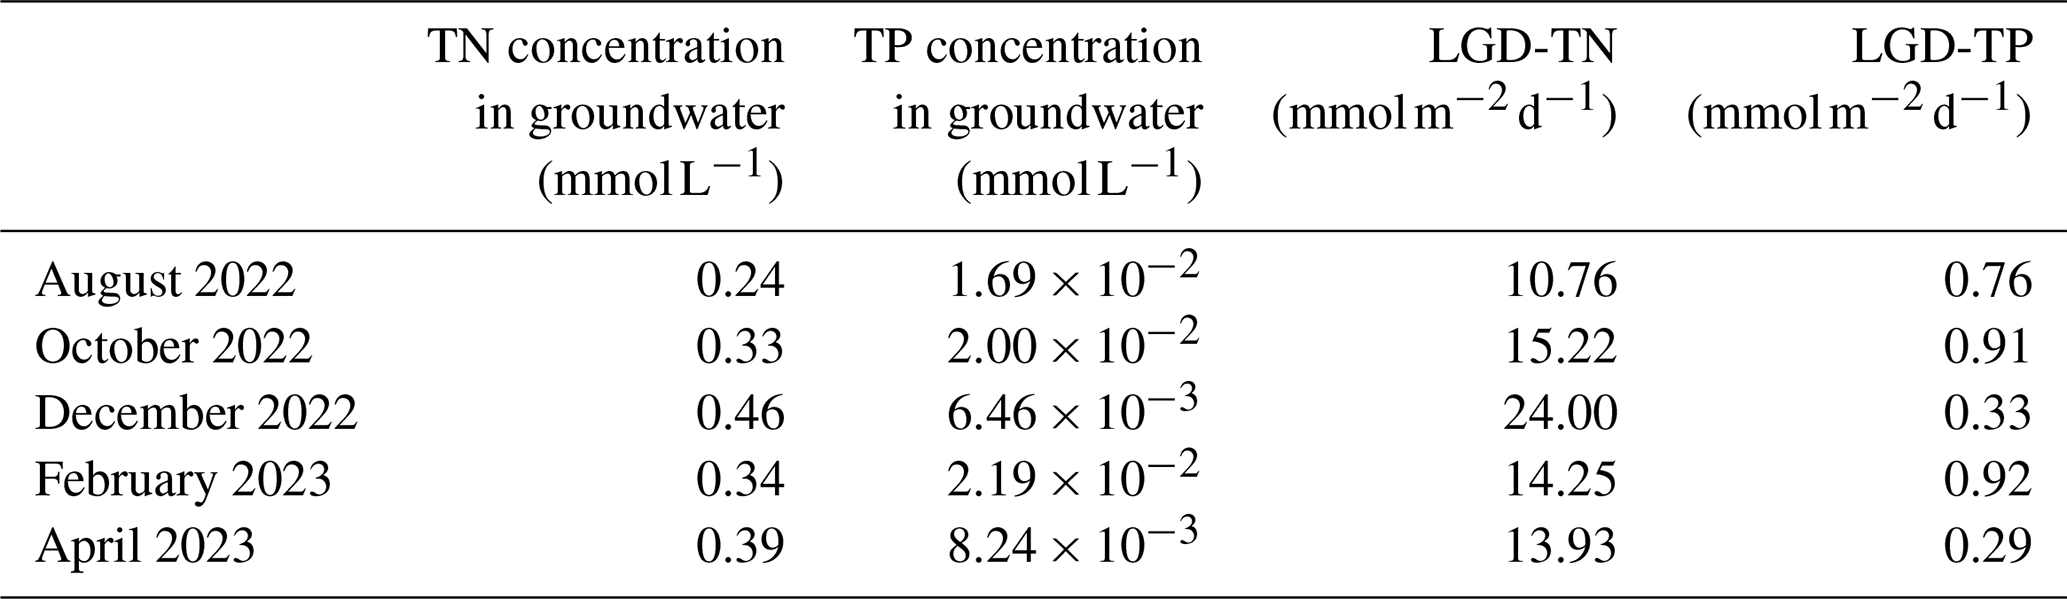
Multiplying the LGD rate by the concentrations of TN and TP in the groundwater demonstrated the nutrient load carried by LGD. The variations in nutrient loads from August 2022–April 2023 are shown in Fig. 6d and e. The loads of TN carried by LGD (LGD-TN) ranged from 10.76–24.00 , with the lowest load occurring in August 2022 and the highest in December 2022. Similarly, the loads of TP carried by LGD (LGD-TP) ranged from 0.29–0.92 , with the highest load observed in December 2022 and the lowest in April 2023. The temporal variation in LGD-TN loads followed the trend of the LGD rate and was primarily influenced by the LGD rate. In contrast, the variation in LGD-TP loads over time did not align with the LGD rate and was mainly controlled by the concentration of TP in the groundwater.
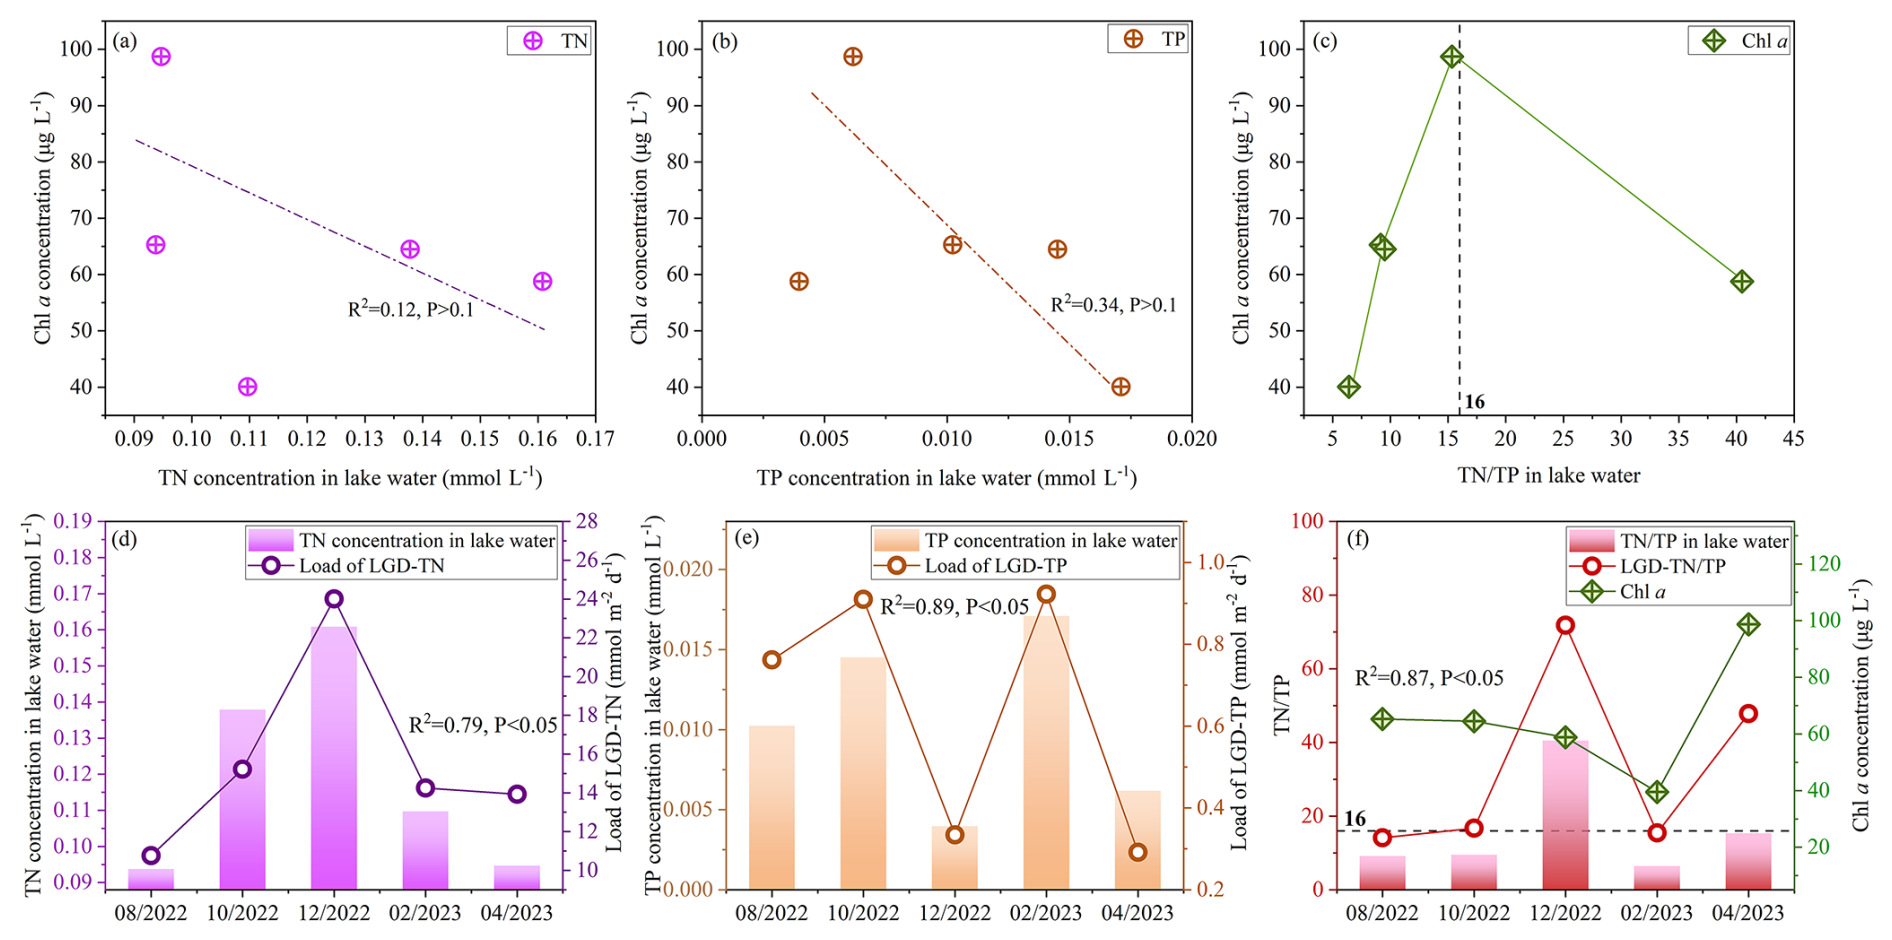
Figure 6Relationship between LGD-TN and TP loads and lake water TN and TP concentrations, as well as the lake water Chl a concentration. (a) Relationship between Chl a concentration and lake water TN concentration. (b) Relationship between Chl a concentration and lake water TP concentration. (c) Relationship between Chl a concentration and lake water TN TP. (d) Relationship between lake water TN concentration and LGD-TN load. (e) Relationship between lake water TP concentration and LGD-TP load. (f) Relationship between lake water TN TP and LGD-TN TP load.
3.3.2 Seasonal relationship between LGD-carried TN TP loads and nutrient status of lakes
The nutrient status of lakes is determined by various parameters, and the concentration of Chl a in lake water is considered particularly important. In this study, no significant correlation was observed between Chl a concentration and the concentrations of TN and TP (Fig. 6a and b). However, a correlation was identified with the TN to TP molar ratio (TN TP) (Fig. 6c). As the TN TP ratio approached the Redfield ratio of 16 (Fig. 6c), the Chl a concentration increased (Redfield, 1960), whereas a deviation from this ratio was associated with a decrease in Chl a concentration, which was consistent with the findings reported in other studies (Qin et al., 2020).
In the absence of surface water inflow and pollutant discharge from prohibited human activities, N and P enter the lake primarily through groundwater discharge, atmospheric deposition, and sediment release. To quantify TN and TP inputs from atmospheric deposition and sediment release, comprehensive field monitoring and experimental investigations were conducted during HW lake periods (Tables S1 and S2). The results indicated that the TN and TP loads from atmospheric deposition were 0.09 and , respectively. Simultaneously, the diffusive TN and TP loads from lakebed sediment were 0.08 and , respectively. In contrast, the LGD-TN and LGD-TP loads were 1–2 orders of magnitude higher than those from atmospheric deposition and sediment release, indicating that LGD-TN and LGD-TP constituted the primary sources of TN and TP in the lake. A strong correlation was observed between LGD-TN loads and TN concentrations in lake water (R2=0.79, P<0.05) (Fig. 6d), whereas the LGD-TP loads exhibited entirely consistent variations with TP concentrations in lake water (R2=0.89, P<0.05) (Fig. 6e), highlighting their significant influence.
The molar ratio of TN to TP in LGD (LGD-TN TP) exhibited variations that were entirely consistent with the TN TP ratio in the lake water, indicating a strong correlation (R2=0.82, P<0.05) (Fig. 6f), thereby indicating its regulatory effect on the lake water TN TP ratio. Based on the observed changes in LGD-TN TP and their reflection in lake water TN TP, when the lake water TN TP reached 15.35 in April 2023, the Chl a concentration was elevated. These results demonstrated that the LGD-derived TN and TP substantially influenced the lake's nutrient status by modulating the TN TP ratio, thereby affecting the Chl a concentration and the overall nutrient balance.
In addition, light availability and water temperature can also affect Chl a growth. Although higher temperatures and favorable light conditions in summer and autumn are theoretically conducive to phytoplankton proliferation, Fig. 6f shows that Chl a concentrations decreased continuously from August 2022–February 2023, but increased rapidly and reached a peak in April 2023. This increase may be partly related to improvements in light and temperature conditions. However, during the summer wet season, when temperature and light are most favorable and LGD is absent, the mean Chl a concentration was only , which is much lower than the 98.69 µg L−1 observed in April 2023. These results suggest that light and temperature are not the dominant drivers of Chl a variability; instead, nitrogen and phosphorus concentrations and their TN TP are the key controlling factors.
In lake eutrophication management, Chl a accumulation is governed not only by the absolute concentrations of nitrogen and phosphorus but also by the TN TP, which determines the dominant type of nutrient limitation. Low TN TP indicate nitrogen limitation, whereas high TN TP indicate phosphorus limitation. Given that present study has shown that groundwater can significantly alter lake TN TP, its influence should be explicitly considered when identifying nutrient limitation mechanisms and developing targeted nitrogen and phosphorus reduction strategies.
3.4 Implications
3.4.1 Advantages of high-frequency observations in LGD research
Traditional low-frequency sampling (e.g., single measurements or quarterly observations) is insufficient to capture short-term variability in LGD and its coupling with transient meteorological conditions and water level fluctuations. In contrast, high-frequency observations enable the resolution of rapid LGD responses to environmental drivers – such as meteorological forcing and water level changes – over shorter timescales. They also provide high-resolution hydrological time series, thereby offering robust data support for more accurate estimation of LGD fluxes.
More importantly, the continuous datasets obtained from high-frequency observations allow this study to reveal several key conceptual insights that cannot be captured by low-frequency sampling. First, LGD responses to meteorological forcing are not simply synchronous, but may exhibit significant lag effects and stage-dependent regulation. Second, the synchronous fluctuations between lake water levels and groundwater levels may follow different dominant control pathways under varying hydrological conditions, thereby highlighting the nonlinear characteristics of the “meteorological forcing → water level response → LGD variation” chain. In addition, the short-term contributions of LGD to lake nutrient inputs and ecological responses (e.g., variations in Chl-a or algal bloom events) can be detected in a timely manner, whereas such signals are often averaged out and obscured in low-frequency observations.
From a management perspective, high-frequency observations allow for a more refined characterization of the instantaneous contribution of LGD to lake nutrient loading and its relationship with eutrophication processes, thereby providing a scientific basis for early warning and refined regulation of lake water quality risks. Meanwhile, LGD predictive models developed based on high-frequency data can significantly improve the ability to capture groundwater input responses under extreme meteorological conditions, offering more timely decision support for lake water resource and ecosystem management.
Therefore, in LGD research, high-frequency observations not only improve the accuracy of flux estimation, but more importantly overcome the temporal limitations of low-frequency sampling, enabling the identification of dynamic mechanisms and ecological effects of LGD processes. As such, they should be prioritized in future research and applications.
3.4.2 Dominant factors controlling the seasonal variability of LGD
The seasonal variability of LGD is mainly influenced by three categories of factors – meteorological, hydrological, and anthropogenic – with the dominant controls differing across lake types.
(1) In open lakes (e.g., Poyang Lake and Tonle Sap Lake), hydrological processes are a major control on LGD dynamics. Their hydraulic connection with external rivers (such as the Yangtze and Mekong Rivers) causes rapid lake-level rises during the wet season and pronounced declines during the dry season, thereby modifying the hydraulic gradients between the littoral zone and aquifer and directly regulating groundwater discharge rates (Burnett et al., 2017; Li et al., 2020). (2) In closed lakes, where external fluvial influence is minimal, LGD dynamics are strongly influenced by the balance between precipitation and evaporation. Previous studies (Shi et al., 2022) have shown that under relatively stable groundwater levels, strong evaporation lowers lake levels, steepens the hydraulic gradient, and enhances LGD, whereas precipitation-dominated periods raise lake levels and suppress LGD. Hence, the seasonal oscillation of LGD in closed-basin systems can be interpreted as a periodic adjustment of lake–groundwater hydraulic connectivity driven by meteorological forcing. (3) Anthropogenic activities, such as artificial water regulation and groundwater abstraction, can further modify LGD by altering regional hydrological circulation and the hydraulic relationships between lakes and aquifers (Xiong et al., 2023).
3.4.3 Regulatory role of LGD in lake nutrient status
In closed lakes lacking significant surface inflow, LGD not only constitutes a key component of the water balance but also can play a significant role in nutrient transport and water quality evolution. The nitrogen and phosphorus fluxes carried by LGD can influence the spatial and temporal patterns of nutrient concentrations and Chl a within the lake. Several studies support this mechanism. For instance, Xu et al. (2025) showed that in small semi-arid lakes, LGD inputs play a key role in shaping the spatial distribution of Chl a, while Shi et al. (2022) reported a delayed response of lake trophic conditions to LGD-derived nutrient inputs. Such lakes are typically characterized by strong enclosure and long water residence times, conditions that can amplify the influence of groundwater in biogeochemical cycling and ecological processes.
Synthesizing current knowledge, the linkage from seasonal forcing to ecological response in closed lakes can be conceptualized as follows: meteorological conditions (precipitation–evaporation balance) serve as the initial driver, regulating lake–groundwater hydraulic gradients and thereby influencing the seasonal magnitude of LGD. LGD, in turn, acts as an important conduit for nutrient fluxes, with its temporal variability shaping nutrient and Chl a distributions and ultimately modulating nutrient dynamics.
Previous studies have long approached the issue of internal nutrient loading in lakes primarily from the perspective of nitrogen and phosphorus release from bottom sediments, emphasizing the role of sediment-derived nutrients in shaping lake trophic status (Donohue and Garcia Molinos, 2009). For lakes where LGD-derived nutrient loads are relatively small during specific seasons, sedimentary nutrient release can indeed constitute a major source to the overlying water column, consistent with traditional understanding (Xu et al., 2017). However, in systems where LGD inputs are substantial, focusing solely on sedimentary release may not fully capture the true structure of lake nutrient sources. Although systematic studies that simultaneously assess both sediment nutrient release and LGD-derived inputs remain limited, existing evidence indicates that LGD is likely a key mechanism sustaining nutrient cycling and ecological succession in closed-basin lakes, highlighting the need for more comprehensive and quantitative investigations.
HW lake and other study cases are all typical closed shallow lakes, with limited exchange between the lake water and surface inflows, making LGD the primary hydrological input. A large number of similar lakes exist worldwide (e.g., closed lakes in the North American Great Plains, inland lakes in Africa and Central Asia), which may also be significantly influenced by LGD. Moreover, the regulatory effect of LGD on the spatial distribution of nitrogen, phosphorus, Chl a, and algal growth is amplified in lakes with long water residence times and stable sediment–water exchange. Therefore, this mechanism is likely applicable to other closed shallow lakes, particularly those with pronounced seasonal climates and a high proportion of shallow areas.
3.4.4 Future recommendations for the lake management of closed shallow lakes
Based on the above understanding, future research should adopt a systems-based perspective, focusing on comparative analyses of LGD inputs versus internal sediment release and quantitatively identifying their relative importance across different lake types and temporal scales to better constrain the dominant nutrient sources. This approach can provide a scientific basis for designing targeted nitrogen and phosphorus reduction strategies, as well as effective lake management and ecological restoration measures, thereby improving water quality and ecological function in closed lakes.
Moreover, climate change is expected to modulate these processes. In the East Asian monsoon region, future precipitation is projected to become more concentrated in summer, while non-summer periods, particularly autumn and winter, may experience reduced rainfall and increased evaporation. Because LGD predominantly occurs during non-summer periods, increased net precipitation (precipitation minus evaporation) could enhance groundwater discharge, which may lead to increased LGD-derived nutrient loads. These considerations further highlight the important role of groundwater in regulating nutrient balances in closed lakes and emphasize the need for future nutrient management strategies to account for both LGD variability and climate-driven hydrological changes.
High-frequency monitoring and hydrochemical methods were employed to investigate the dynamics of LGD and associated nutrient loads in Heiwawu Oxbow Lake from August 2022–April 2023, revealing the regulatory mechanisms of precipitation-evaporation processes. The LGD flux exhibited an increasing-then-decreasing trend during the study period, ranging from 35.36–51.71 mm d−1, with a peak in December 2022 and a minimum in April 2023. The LGD rates were governed by the hydraulic gradient between groundwater and lake water, which responded nonlinearly to net monthly precipitation. Positive net precipitation induced rapid lake recharge, reduced the hydraulic gradient, and suppressed LGD rates. Conversely, negative net precipitation enhanced evaporation-driven lake discharge, steepened the hydraulic gradient, and increased LGD rates. When net precipitation approached zero, a critical hydraulic equilibrium was reached, yielding the highest LGD rates. The LGD was also a major nutrient pathway, with TN and TP loads significantly correlating with lake concentrations. The TN TP ratio of LGD aligned with lake water, influencing phytoplankton structure and Chl a levels. This study reveals the regulatory mechanisms by which LGD is controlled by the precipitation–evaporation balance at the monthly scale, quantitatively evaluates the impacts of groundwater-driven nutrient transport on lake eutrophication, and, by reference to related global case studies, provides environmental protection and management implications from a groundwater perspective. These findings offer new insights into eutrophication control in closed, shallow lakes, and suggest that the advantages of high-frequency LGD observations should be incorporated into lake management frameworks, along with the development of targeted control strategies during critical periods of groundwater–lake interactions.
The data that support the findings of this study are available at https://doi.org/10.5281/zenodo.19643423 (Sun, 2026).
The supplement related to this article is available online at https://doi.org/10.5194/hess-30-2357-2026-supplement.
Writing-review and editing, Writing-original draft, Methodology, Investigation, Data curation: XS. Writing-review and editing, Resources, Methodology, Funding acquisition: YDu. Investigation: HT, JX, HS, YL. Project administration: YDe. Funding acquisition: YG. Resources, Project administration: YW.
The contact author has declared that none of the authors has any competing interests.
Publisher's note: Copernicus Publications remains neutral with regard to jurisdictional claims made in the text, published maps, institutional affiliations, or any other geographical representation in this paper. The authors bear the ultimate responsibility for providing appropriate place names. Views expressed in the text are those of the authors and do not necessarily reflect the views of the publisher.
The research was funded by National Natural Science Foundation of China (nos. 42422707, U21A2026), and Fundamental and Interdisciplinary Disciplines Breakthrough Plan of the Ministry of Education of China (no. JYB2025XDXM911). The authors would like to thank all the reviewers who participated in the review, as well as MJEditor (https://www.mjeditor.com, last access: 8 October 2025) for providing English editing services during the preparation of this manuscript.
The research was funded by National Natural Science Foundation of China (grant nos. 42422707, U21A2026) and Fundamental and Interdisciplinary Disciplines Breakthrough Plan of the Ministry of Education of China (grant no. JYB2025XDXM911).
This paper was edited by Bo Guo and reviewed by three anonymous referees.
Adyasari, D., Dimova, N. T., Dulai, H., Gilfedder, B. S., Cartwright, I., McKenzie, T., and Fuleky, P.: Radon-222 as a groundwater discharge tracer to surface waters, Earth-Sci. Rev., 238, 104321, https://doi.org/10.1016/j.earscirev.2023.104321, 2023.
Arnoux, M., Gibert-Brunet, E., Barbecot, F., Guillon, S., Gibson, J., and Noret, A.: Interactions between groundwater and seasonally ice-covered lakes: using water stable isotopes and radon-222 multilayer mass balance models, Hydrol. Process., 31, 2566–2581, https://doi.org/10.1002/hyp.11206, 2017.
Burnett, W. C., Wattayakorn, G., Supcharoen, R., Sioudom, K., Kum, V., Chanyotha, S., and Kritsananuwat, R.: Groundwater discharge and phosphorus dynamics in a flood-pulse system: Tonle Sap Lake, Cambodia, J. Hydrol., 549, 79–91, https://doi.org/10.1016/j.jhydrol.2017.03.049, 2017.
Corbett, D. R., Burnett, W., Cable, P., and Clark, S.: A multiple approach to the determination of radon fluxes from sediments, J. Radioanal. Nucl. Ch., 236, 247–253, https://doi.org/10.1007/bf02386351, 1998.
Dimova, N. T. and Burnett, W. C.: Evaluation of groundwater discharge into small lakes based on the temporal distribution of radon-222, Limnol. Oceanogr., 56, 486–494, https://doi.org/10.4319/lo.2011.56.2.0486, 2011.
Donohue, I. and Garcia Molinos, J.: Impacts of increased sediment loads on the ecology of lakes, Biol. Rev., 84, 517–531, https://doi.org/10.1111/j.1469-185X.2009.00081.x, 2009.
Gao, X., Jia, T., Xu, Q., Wang, F., and Wang, A.: Records of lacustrine sedimentology and pollen–charcoal assemblages responding to climate change and human activities in Zhongzhouzi Oxbow Lake, Hubei Province for about 70 years, Quaternary Sci., 36, 1445–1455, https://doi.org/https://doi.org/10.11928/j.issn.1001-7410.2016.06.10, 2016 (in Chinese).
Gonneea, M. E., Morris, P. J., Dulaiova, H., and Charette, M. A.: New perspectives on radium behavior within a subterranean estuary, Mar. Chem., 109, 250–267, https://doi.org/10.1016/j.marchem.2007.12.002, 2008.
Hu, M., Zhou, P., and Chen, C.: Study on coupling of typical elements in surface water and groundwater in the middle reaches of the Yangtze River, China, J. Hydrol., 623, 130298, https://doi.org/10.1016/j.jhydrol.2023.130298, 2023.
Jia, T., Wang, F., and Yuan, S.: Sedimentation and its environmental significance of the Niuyu Lake along the middle reaches of the Yangtze River: a case study of Tian'e Island and Zhongzhouzi in the Jingjiang section of the Yangtze River, Geogr. Res., 34, 861–871, 2015, (in Chinese).
Jiang, C., Jiang, C., Wang, Q., Liu, H., Li, D., Zhu, Q., and Liu, F.: Seasonal characteristics of groundwater discharge controlled by precipitation and its environmental effects in a coal mining subsidence lake, eastern China, Sci. Total Environ., 915, 170067, https://doi.org/10.1016/j.scitotenv.2024.170067, 2024.
Jiang, X., Ma, R., Ma, T., and Sun, Z.: Modeling the effects of water diversion projects on surface water and groundwater interactions in the central Yangtze River Basin, Sci. Total Environ., 830, 154606, https://doi.org/10.1016/j.scitotenv.2022.154606, 2022.
Kazmierczak, J., Postma, D., Muller, S., Jessen, S., Nilsson, B., Czekaj, J., and Engesgaard, P.: Groundwater-controlled phosphorus release and transport from sandy aquifer into lake, Limnol. Oceanogr., 65, 1447–1463, https://doi.org/10.1002/lno.11447, 2020.
Kluge, T., Ilmberger, J., von Rohden, C., and Aeschbach-Hertig, W.: Tracing and quantifying groundwater inflow into lakes using a simple method for radon-222 analysis, Hydrol. Earth Syst. Sci., 11, 1621–1631, https://doi.org/10.5194/hess-11-1621-2007, 2007.
Lewandowski, J., Rosenberry, D. O., and Meinikmann, K.: Groundwater–lake interfaces, in: Ecohydrological Interfaces, edited by: Krause, S., Hannah, D. M., and Fleckenstein, J. H., Wiley, Hoboken, NJ, 103–122, https://doi.org/10.1002/9781119489702.ch5, 2024.
Li, Y., Zhang, Q., Liu, X., and Yao, J.: Water balance and flashiness for a large floodplain system: A case study of Poyang Lake, China, Sci. Total Environ., 710, 135499, https://doi.org/10.1016/j.scitotenv.2019.135499, 2020.
Luo, X., Kuang, X., Jiao, J. J., Liang, S., Mao, R., Zhang, X., and Li, H.: Evaluation of lacustrine groundwater discharge, hydrologic partitioning, and nutrient budgets in a proglacial lake in the Qinghai–Tibet Plateau: using 222Rn and stable isotopes, Hydrol. Earth Syst. Sci., 22, 5579–5598, https://doi.org/10.5194/hess-22-5579-2018, 2018.
MacIntyre, S., Wanninkhof, R., Chanton, J. P., Matson, P. A., and Harris, R. C.: Biogenic Trace Gases: Measuring Emissions from Soil and Water, John Wiley & Sons, New York, 52 pp., 1995.
Meinikmann, K., Hupfer, M., and Lewandowski, J.: Phosphorus in groundwater discharge – a potential source for lake eutrophication, J. Hydrol., 524, 214–226, https://doi.org/10.1016/j.jhydrol.2015.02.031, 2015.
Petermann, E., Gibson, J. J., Knöller, K., Pannier, T., Weiß, H., and Schubert, M.: Determination of groundwater discharge rates and water residence time of groundwater-fed lakes by stable isotopes of water (18O, 2H) and radon (222Rn) mass balances, Hydrol. Process., 32, 805–816, https://doi.org/10.1002/hyp.11401, 2018.
Qin, B., Zhou, J., Elser, J. J., Gardner, W. S., Deng, J., and Brookes, J. D.: Water depth underpins the relative roles and fates of nitrogen and phosphorus in lakes, Environ. Sci. Technol., 54, 3191–3198, https://doi.org/10.1021/acs.est.9b05835, 2020.
Redfield, A. C.: The biological control of chemical factors in the environment, Sci. Prog., 11, 150–170, 1960.
Rosenberry, D. O., Lewandowski, J., Meinikmann, K., and Nützmann, G.: Groundwater – the disregarded component in lake water and nutrient budgets. Part 1: effects of groundwater on hydrology, Hydrol. Process., 29, 2895–2921, https://doi.org/10.1002/hyp.10403, 2015.
Schmidt, A., Gibson, J. J., Santos, I. R., Schubert, M., Tattrie, K., and Weiss, H.: The contribution of groundwater discharge to the overall water budget of two typical Boreal lakes in Alberta/Canada estimated from a radon mass balance, Hydrol. Earth Syst. Sci., 14, 79–89, https://doi.org/10.5194/hess-14-79-2010, 2010.
Shi, X., Luo, X., Jiao, J. J., and Zuo, J.: Dominance of evaporation on lacustrine groundwater discharge to regulate lake nutrient state and algal blooms, Water Res., 219, 118620, https://doi.org/10.1016/j.watres.2022.118620, 2022.
Stets, E. G., Winter, T. C., Rosenberry, D. O., and Striegl, R. G.: Quantification of surface water and groundwater flows to open- and closed-basin lakes in a headwaters watershed using a descriptive oxygen stable isotope model, Water Resour. Res., 46, W03504, https://doi.org/10.1029/2009WR007793, 2010.
Sun, X., Du, Y., Wu, J., Xu, J., Tian, H., Han, P., and Wang, Y.: Spatial variability of lacustrine groundwater discharge at basin scale, J. Hydrol., 629, 134404, https://doi.org/10.1016/j.jhydrol.2025.134404, 2025a.
Sun, X., Du, Y., Xu, J., Tian, H., Deng, Y., Gan, Y., and Wang, Y.: Control of groundwater–lake interaction zone structure on spatial variability of lacustrine groundwater discharge in oxbow lake, Water Resour. Res., 61, e2024WR039334, https://doi.org/10.1029/2024WR039334, 2025b.
Sun, X.: Seasonal dynamics of closed shallow lakes nutrient status controlled by lacustrine groundwater discharge, Zenodo [data set], https://doi.org/10.5281/zenodo.19643423, 2026.
Tecklenburg, C. and Blume, T.: Identifying, characterizing and predicting spatial patterns of lacustrine groundwater discharge, Hydrol. Earth Syst. Sci., 21, 5043–5063, https://doi.org/10.5194/hess-21-5043-2017, 2017.
Wang, Q., Li, H., Zhang, Y., Wang, X., Zhang, C., Xiao, K., and Qu, W.: Evaluations of submarine groundwater discharge and associated heavy metal fluxes in Bohai Bay, China, Sci. Total Environ., 695, 133873, https://doi.org/10.1016/j.scitotenv.2019.133873, 2019.
Webster, I. T., Hancock, G. J., and Murray, A. S.: Modelling the effect of salinity on radium desorption from sediments, Geochim. Cosmochim. Ac., 59, 2469–2476, https://doi.org/10.1016/0016-7037(95)00141-7, 1995.
Xiong, L., Aldahan, A., Qian, R., Yi, P., Chen, X., Li, K., and He, P.: Spatio-temporal patterns and quantification of lake–groundwater interaction determined in a large water transfer lake, Hydrol. Process., 37, e14867, https://doi.org/10.1002/hyp.14867, 2023.
Xu, R., Du, Y., Wang, Z., Sun, X., Yang, L., Liu, J., and Gan, Y.: Contrasting lacustrine groundwater discharge in two small perennial lakes around dried-up Chahannaoer Lake, Northern China, J. Hydrol. Reg. Stud., 58, 102280, https://doi.org/10.1016/j.ejrh.2025.102280, 2025.
Xu, Y., Wu, Y., Han, J., and Li, P.: The current status of heavy metal in lake sediments from China: Pollution and ecological risk assessment, Ecology and Evolution, 7, 5454–5466, https://doi.org/10.1002/ece3.3124, 2017.
Xue, P., Wen, Z., Zhao, D., Jakada, H., and Liang, X.: Determination of hydraulic conductivity and its spatial variability in the Jianghan Plain using a multi-format, multi-method approach, J. Hydrol., 594, 125917, https://doi.org/10.1016/j.jhydrol.2020.125917, 2021.
Zedler, J. B. and Kercher, S.: Wetland resources: status, trends, ecosystem services, and restorability, Annu. Rev. Env. Resour., 30, 39–74, https://doi.org/10.1146/annurev.energy.30.050504.144248, 2005.
Zhang, Q., Zhao, Y., Li, Y., and Li, X.: Application of radon-222 to assess groundwater discharge andassociated nutrients input in the karst wetland, China, Environ. Sci., 44, 3226–3239, https://doi.org/10.19674/j.cnki.issn1000-6923.20240301.004, 2024 (in Chinese).
Zheng, J., Chen, K., Wu, J., and Wu, J.: Lacustrine groundwater discharge as an important hidden source of nutrients to a large eutrophic lake: implications for eutrophication management, Sci. Total Environ., 960, 178313, https://doi.org/10.1016/j.scitotenv.2024.178313, 2025.