the Creative Commons Attribution 4.0 License.
the Creative Commons Attribution 4.0 License.
 | 20 Apr 2026
The effects of upstream water abstraction for commercial export farming on drought risk and impact of agropastoral communities in the drylands of Kenya
Ileen N. Streefkerk
Jeroen C. J. H. Aerts
Jens de Bruijn
Khalid Hassaballah
Rhoda Achieng' Odongo
Teun Schrieks
Oliver Wasonga
Anne F. Van Loon
In the Horn of Africa Drylands (HAD) conflicts over water and vegetation are prominent. Additionally, large-scale land acquisitions (LSLAs) are increasing the competition of water, putting local communities at greater risk. A key impact of increasing LSLA's is the decrease in water and land availability for vulnerable agropastoral communities. Despite recent studies, there is still a lack of research that includes the influence of upstream-downstream dynamics on drought risk and impacts of agropastoralists. Therefore, this study further develops an agent-based model (ADOPT-AP) to investigate how upstream large-scale commercial farms influence downstream drought risk and impact of agropastoralists in the Upper Ewaso Ng'iro catchment in Kenya. After the model has been calibrated, we assess how commercial exporting farms affect drought risk and impact of downstream communities by simulating different scenarios where the farms are replaced by agropastoral communities or forests. Our results show how both drought hazard characteristics and impacts differ among these scenarios. The analysis shows that in the scenarios where these farms are replaced by forests or communities, drought conditions are alleviated by increasing soil moisture, streamflow, and groundwater tables during dry periods. These changes are linked to reduced water abstraction and increased infiltration, benefiting downstream communities by decreasing the distance to household water, and increasing crop production in times of dry periods. However, compared with the impact of drought hazard itself these differences are very small.
- Article
(2887 KB) - Full-text XML
-
Supplement
(1159 KB) - BibTeX
- EndNote


Drought poses a thread in the already existing water challenges in the Horn of Africa Drylands (HAD) (Solomon et al., 2018). Drought hazard and risk are, however, not merely a natural phenomenon driven by rainfall deficits and other hydrometeorological processes. Droughts are also shaped by human behaviour and interventions (Van Loon et al., 2016). For example, large-scale land acquisitions (LSLAs) for commercial farms that use large quantities of (ground-) water are further increasing the competition of water, putting local farmers and communities at increased risk to droughts (Chiarelli et al., 2022). These LSLA's may be in the form of large private ranches, industry, and commercial export farms (Mkutu and Mdee, 2020). A key impact of increasing LSLA's is the decrease in water and land availability for vulnerable agropastoral communities (Lanari et al., 2018). Agropastoralism is the main source of livelihood to millions of people in Kenya accounting for 10 %–44 % GDP (Nyariki and Amwata, 2019). For such communities, drought adaptation is key to anticipate current- and future drought risk (Pörtner et al., 2022).
To support drought adaptation for agropastoralists, it is important to understand the factors that influence adaptation behaviour they can take themselves, and how this behaviour interacts with large-scale water users (such as commercial farms) and governmental policies (Alam et al., 2022; Reckien et al., 2023). There is an emerging literature that captures the factors influencing drought risk management by agropastoral communities in Kenya and what policy interventions may stimulate drought adaptation. For example, Wens et al. (2021), show that mistrust in drought forecasting (−29 %) serves as a barrier to adaptation, while experience with past adaptation decisions (+44 %) stimulates the intention to adopt new drought adaptation measures. Streefkerk et al. (2023) found, for a case study in Kenya, that low levels of wealth and long distance to wells have a large effect on water availability. Furthermore, a recent study by Schrieks et al. (2023) shows that the likelihood that agropastoralists implement adaptation measures is positively influenced by, among others, the perceived efficacy of adaptation measures and confidence in their ability to adapt (perceived self-efficacy). Other factors influencing drought adaptation by agropastoralists are gender, education level, access to financial resources, and access to government support or aid.
Understanding the factors that influence local drought adaptation can inform (governmental policy) interventions that enhance the uptake of drought adaptation strategies. For example, Wens et al. (2022) highlight that ex-ante cash transfers and timely extension services can improve adaptation uptake. However, less is known about how large-scale commercial farms affect drought conditions for downstream agropastoralists, and which policies can best support risk reduction and the equitable water distribution (e.g. Giger et al., 2022). Studies have shown that drought risk tends to increase downstream due to water storage and abstraction in upstream areas (Van Oel et al., 2018; Veldkamp et al., 2017). Water abstraction by commercial horticulture farms may contribute in upstream – downstream water conflicts, with large farms already exceeding minimum water river flow requirements during the dry season (Lanari et al., 2018). In the longer term, this may lower groundwater tables and increase drought risk across the entire region, affecting all water users (e.g. Castilla-Rho et al., 2015).
What remains lacking in previous studies is a systematic assessment of upstream-downstream interactions and an evaluation of drought adaptation options for agropastoralists affected by upstream commercial farming (Kiteme et al., 2021). The main goal of this paper is, therefore, to develop a coupled hydrological and agent-based model (ADOPT-AP) to investigate the influence of upstream large-scale commercial export farms on downstream drought risk and adaptation by agropastoralists. We apply and test the ADOPT-AP model for the Ewaso Ng'iro north catchment in Kenya. The key novelty of our method is the ability to capture heterogeneous and dynamic drought-human interactions (including different water users) in a spatially-explicit manner. After the model has been calibrated, we test how commercial exporting farms affect drought risk and impact of downstream communities.
The Ewaso Ng'iro North catchment, spanning 210 000 km2, sources its water primarily from Mount Kenya and the Aberdare Range (Kiteme et al., 2021). These main water towers, located to the south of the catchment, contribute to the varied climatic zones observed in the region (Fig. 1). The upstream areas exhibit a humid climate with an altitude up to 5000 m and mean annual rainfall of 1500 mm, transitioning to semi-arid and arid conditions downstream with a minimum altitude of 500 m and mean annual rainfall of 350 mm (Mungai et al., 2004). This climatic gradient is essential in determining land use and the livelihoods of the local population.
The upstream regions, characterized by higher rainfall and more stable water supplies, are dominated by cropland and forests. This area supports large commercial export farms, particularly horticulture and floriculture, which benefit from the favourable year-round climate and abundant water resources (Lanari et al., 2018; Wiesmann et al., 2000). They are indicated in red, southeast of the catchment, in Fig. 1. These farms are primarily concentrated in sub-catchments 1 and 2, with greenhouse operations spread throughout these areas. Sub-catchment 3 has similar conditions but only upstream, while sub-catchment 4 houses open farms, such as those cultivating wheat. Conversely, the downstream regions (sampling area), marked by arid conditions and covered in grassland and shrubs, support agropastoralism and pastoralism. Local livelihoods here are heavily dependent on livestock herding due to the scarce water resources. Schrieks et al. (2023) highlight in their survey of the local farmers and agropastoralists, that in the humid to semi-humid and semi-arid zones, crop farming and agropastoralism prevails, respectively. While in the arid zones, pastoralism is the dominant livelihood (Kiteme et al., 2021).
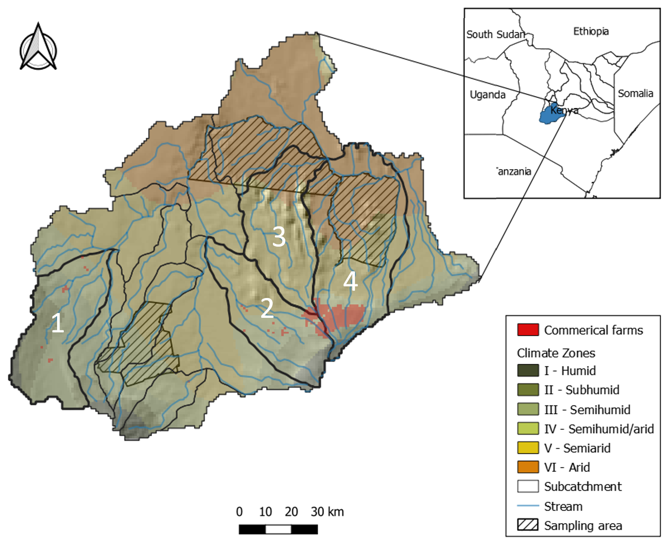
Figure 1Study area: aridity zones (Gichuki, 2002), rivers, commercial export farms in the Upper Ewaso Ng'iro catchment.
The expansion of commercial export farms has dual impacts: they create employment opportunities but also lead to conflicts over water resources with local agropastoral communities (Kiteme et al. 2021). The intensive water use by these farms, especially for irrigation in horticulture, has been shown to reduce streamflow by up to 32 % (Lanari et al., 2018). This significant reduction in water availability exacerbates the challenges faced by local communities, who already struggle with limited water resources.
Water resource management in Kenya has evolved over the years. The Water Resources Authority (WRA) is responsible for regulating and managing water resources at a national level. However, the governance structure has been increasingly decentralized, promoting more local participation (Dell'Angelo et al., 2016). The Water Resource Users Associations (WRUAs), established following the 2012 Water Act, play a critical role in local water management, including monitoring and enforcing water abstraction permits and implementing conservation programs (Baldwin et al., 2016). Despite these efforts, equitable water distribution remains a challenge (Lesrima et al., 2021).
The Ewaso Ng'iro North Development Authority is tasked with coordinating regional development initiatives within the basin, i.e., the case study area (Kiteme et al., 2021). Although the decentralized governance structure marks an improvement over the central governance model of the 2002 Water Act, disparities in water distribution persist, as noted by Dell'Angelo et al. (2016).
Figure 2 briefly describes our approach by further developing the ADOPT-AP model (Streefkerk et al., 2023), which integrates (1) Hydrology: the DRYP hydrological model (Quichimbo et al., 2025) with (2) an agent-based decision model (ABM), which simulates adaptation decisions by agropastoralists. These two parts are connected through (3) Socio-hydrological interactions. These interactions are modelled as rules that describe the feedback between decision making and the hydrological system.
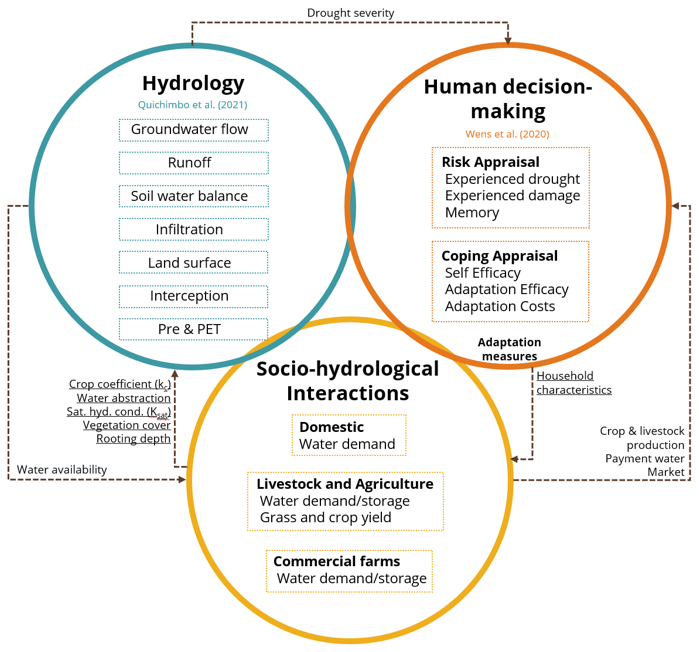
Figure 2ADOPT-AP modelling framework, consisting of three modules; hydrology, human decision-making, and socio-hydrological interactions.
This coupled model allows for assessing how the main water users (“agents”) respond to drought. In the model 15 000 agropastoralists are simulated that grow crops and tend livestock to sustain their livelihood. They can take six adaptation measures to cope with droughts to meet their water demand and required grass/crop yields. Adaptation decisions by agropastoralists are made following the Protection Motivation Theory (PMT), which is based on (a) the perceived threat of drought risk and (b) their perceived coping capacity to implement drought adaptation measures. The coupled model has a daily timestep (see Sect. 3.1), and agropastoralists exhibit daily to yearly decision making. Water is abstracted at the nearest available location, either at the river or groundwater well, for domestic, livestock and irrigation purposes. Irrigation decisions, following simple rule-based, are made every day during the growing season depending on soil moisture and available water. Major decisions are based on the psychological theories (see Sect. 3.2), and are made once a year (see Table 1). The agents have a heterogeneous and unique set of characteristics (e.g. location, income, age, etc.) at a spatial resolution of 1×1 km2. This means each grid cell has one agropastoralist agent, representing multiple households (depending on population density and household size). In addition, commercial export farms are represented through water management rules defining the required storage and abstraction of water. We run the model for three scenarios and assess the effect of each scenario using drought and impact metrics.
3.1 Hydrology
DRYP is a process-based distributed hydrological model developed to simulate hydrological processes in dryland regions (Quichimbo et al., 2023). Precipitation and potential evapotranspiration are the main parameters where precipitation is divided into infiltration and surface runoff, depending on soil moisture conditions. Runoff is generated using a routing routine based on elevation. Groundwater is discharged into the streams as baseflow above a certain channel stream stage threshold value. Water from groundwater aquifers and surface streams can be abstracted by users. In addition, irrigation water can be applied to the land (modelled as additional rainfall). Human-induced land use changes are included by altering the crop coefficient (kc), saturated hydrological conductivity (Ksat), vegetation cover, rooting depth, influencing hydrological processes such as interception, actual evaporation and infiltration. A more detailed description of the hydrological model can be found in Quichimbo et al. (2021, 2023, 2025).
Additional variables are added to the interception component of the hydrology component to enable simulating adaptation by individual agropastoralists and commercial farms. The monthly soil adjusted vegetation Index (SAVI) is obtained from Sentinel-2, and the fraction of vegetation cover is from Copernicus Global Land Service. The biome specific coefficient is taken from Kergoat (1998). Discharge is used for calibration and verification of the model and provided by the Centre of Training and Integrated research in ASAL Development (CETRAD).
3.2 Human decision-making
Following the Overview, Design Concepts and Details + Decisions (ODD + D) protocol (Müller et al., 2013), a detailed overview of the modelling structure and scheduling is given in Sect. S1 in the Supplement. We here briefly summarize the main procedures.
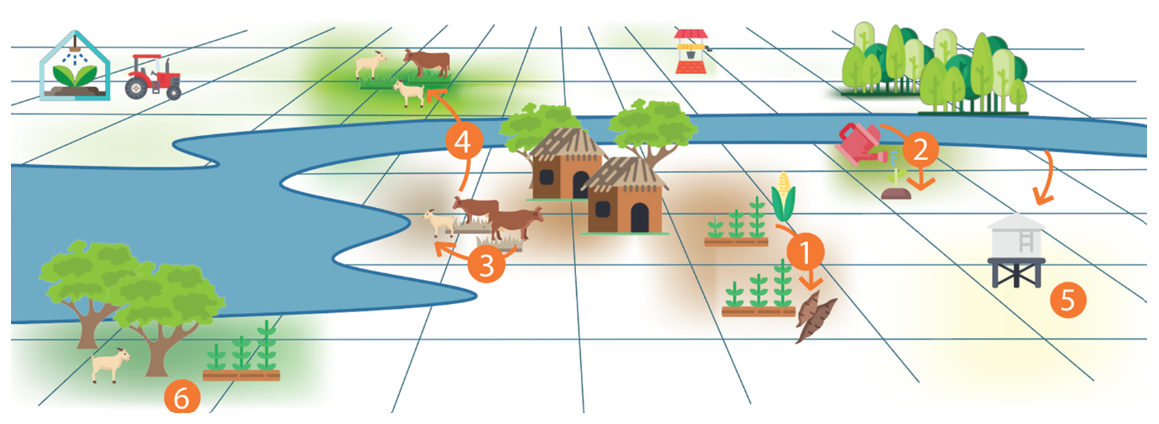
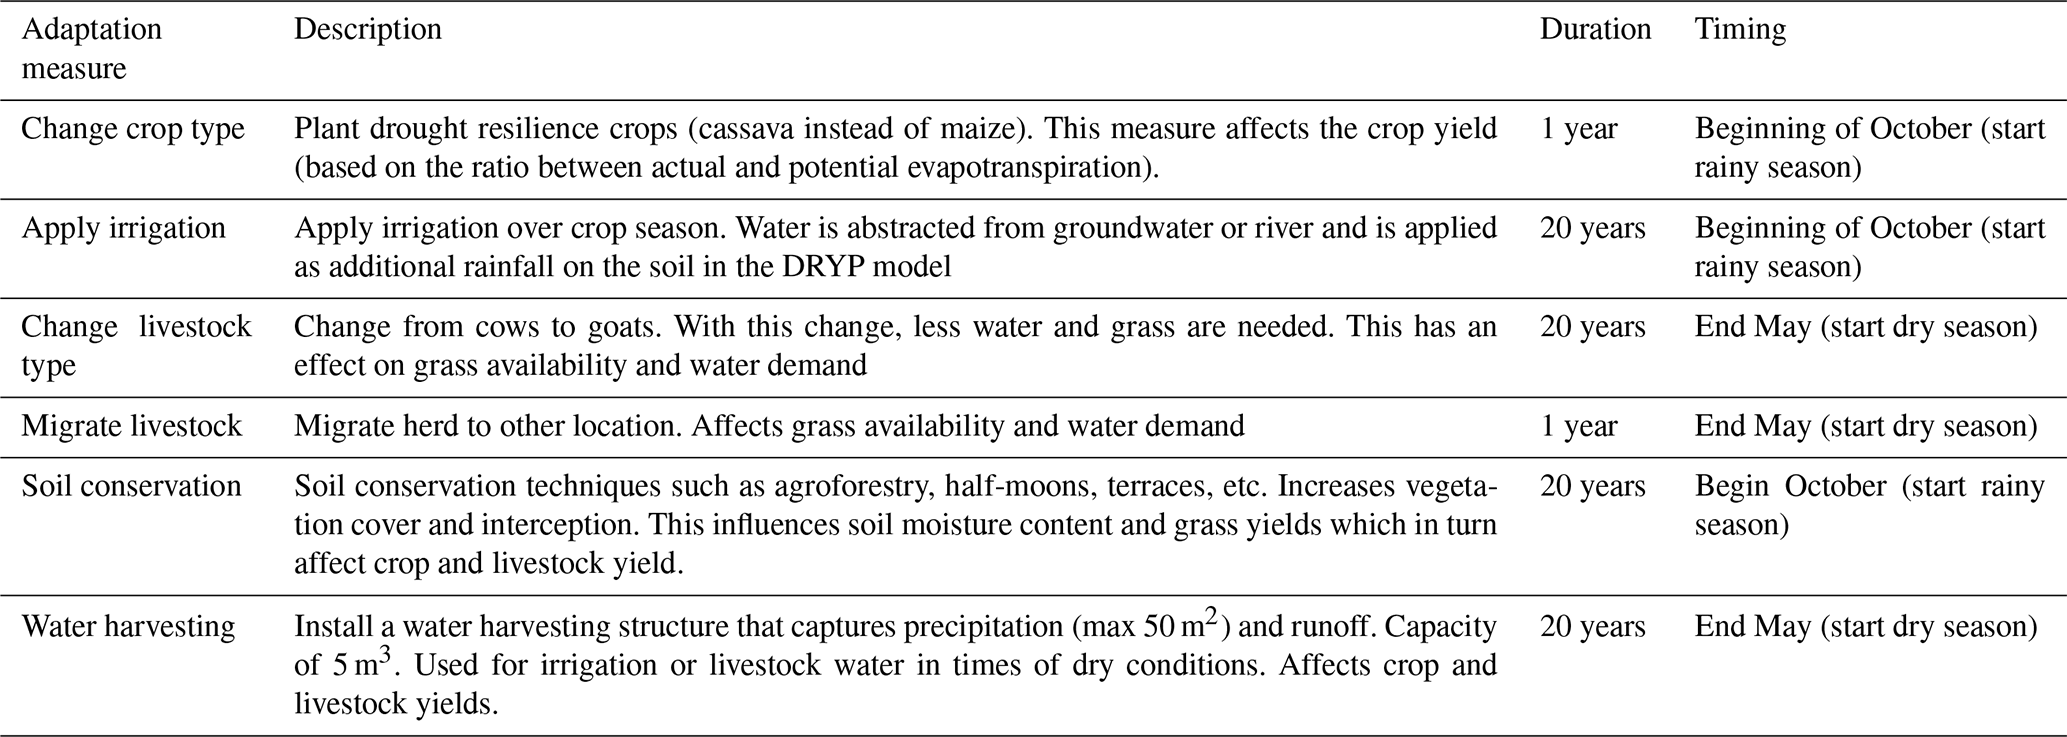
Figure 3All adaptation measures implemented in the model. Adaptation measures water harvesting (5), and soil moisture conservation (6) are added compared to Streefkerk et al. (2023).
Each year, agents decide whether to adopt an adaptation measure. Depending on the adaptation measure, agents decide whether to adopt a specific measure at different moments throughout the year (Table 1). They spend income on adaptation measures and the height of these expenditures is depending on their herd- and farm size. Income is determined by the crop and milk production remaining after consumption. Agropastoralists can take six drought adaptation measures at different moments in the year (numbered 1–6 in Fig. 3 and Table 1). Four of these have been described by Streefkerk et al. (2023): (1) change crop type, (2) apply irrigation, (3) change livestock type, and (4) migrate with livestock. In this paper we expand the model with two additional adaptation measures (Table 1): (5, Fig. 3) water harvesting and (6, Fig. 3) soil conservation techniques. These two additional measures have been selected as they are widely applied in the Isiolo area as described by Schrieks et al. (2023). Both have an influence on the environment (i.e. modify properties in the hydrological model when adopted) (see Tables 1, 2). Adaptation costs for the six measures are obtained from the World Overview of Conservation Approaches and Technologies (Kentainers, 2024; Kenyaseed, 2024; WOCAT, 2024).
The behavioral theory Protection Motivation Theory (PMT) (Eq. 1) is applied to simulate whether an agent implements an adaptation measure (m) (Maddux and Rogers, 1983). PMT is a common psychological theory to model people's intentions to adapt that has been applied in many ABM studies on natural hazard management (Hailegiorgis et al., 2018; Wens et al., 2020; Michaelis et al., 2020; Moradzadeh and Ahmadi, 2024). Recent household survey studies with farmers and pastoralists in East-Africa show that show that PMT is a suitable theory to explain adaptation behavior under drought risk conditions (Wens et al., 2021; Schrieks et al., 2024; Gebrehiwot and van der Veen, 2021). In this theory, the IntentionToAdaptt,m is the variable that determines whether an agent will implement a specific measure. Its value is compared with a probabilistic threshold based on the measure's lifespan (see Sect. S1.I). Crop-related adaptation measures (Table 1) are implemented at the beginning of October (the start of the long (main) rainy season). Livestock-related decisions are made at the end of May, before the long dry season. The IntentiontoAdaptt,m is based on two other components:
Risk appraisal includes the perceived probability of the drought risk by the farmers. The perception is high just after a drought event, and then decreases over time. Therefore, risk appraisal increases in relation to drought loss but decreases if no drought loss occurs. Drought loss is computed as the relative loss from decreasing livestock or crop production in a specific year compared to the average production of the previous 10 years (Di Baldassarre et al., 2013).
The perceived ability to adapt (Coping appraisal) is determined by three components: (a) the household's confidence in their ability to implement an adaptation measure (the perceived self-efficacy), which depends on household characteristics such as education level, household size, age, network and gender. (b) the households believe about the relative costs (“perceived adaptation costs”) (Van Duinen et al., 2015), and (c) the perceived degree to which the adaptation options are likely to have an effect (perceived adaptation efficacy). The perceived adaptation efficacy, in the model, depends on whether an agent receives information from extension services or not. If an agent does not have access to external adaptation information, they learn from what happens in their neighbors' field or within their neighbors' herd. Neighbors are the agents in the neighboring cells depending on the radius-settings in the model (8-connected if radius = 1).
The adaptation behavioral rules are informed by the survey data from Schrieks et al. (2023). The survey dataset contains information from 502 pastoral and agropastoral households in Isiolo county, Kenya (“Sample area”, Fig. 1), and has been collected in May 2022. The dataset contains questions on the intention to adapt for all adaptation measures that are included in the model. The survey also addressed the underlying components of drought risk and coping appraisal of the Protection Motivation Theory. Using survey data and other data sources, we parametrized the model as follows:
-
Household characteristics. Household characteristics (age, income, etc.) for agents are determined per climate zone (Fig. 1). We initialize agents (crop farmers) located in climate zones I–IV using data of the Tegemeo Institute (2010). Agents in climate zone V (agropastoral communities) and VI and VII (pastoral communities) are initialized with data by Schrieks et al. (2023). These initial socio-economic characteristics of agents are based on the best-fitted statistical distribution (e.g. gamma distribution) of the sampled data.
-
Self-efficacy. We used the household survey data to assess the influence of socio-economic variables (age, gender, etc.) on perceived self-efficacy. For this we estimated Ordinary Least Squares (OLS) regressions models (one for each adaptation measure) with as dependent variables the perceived self-efficacy score from the survey and as independent variables the socio-economic variables. We estimate the regression models with multiple different socio-economic variables and included the variables in the model that provided the best Aike's Information Criteria (AIC) scores (Cavanaugh and Neath, 2019). Table S6 in the Supplement gives a description and descriptive statistics of the variables that are used and Table S7 provides the regression tables.
-
PMT weights. To estimate the weights of the PMT variables in the model, we estimated a logistic regression model with clustered standard errors as in Schrieks et al. (2023). We created composite variables for the coping appraisal variables by taking the average of all adaptation measures in the dataset and we used the binary variable for intention to adapt for all adaptation measures as dependent variables (Schrieks et al., 2023). In Table S6 we included a table with an overview of all survey questions that have been used in the regression models.
3.3 Socio-hydrological interactions
Agropastoral households have livestock and cropland. By implementing an adaptation measure to fulfil domestic, agricultural or livestock purposes, they change the environment (water availability and land use). Water can be abstracted directly from a river or through groundwater abstraction points for all three purposes on a daily basis. Fulfilling domestic water demand is prioritized in the model, followed by livestock water demand, and lastly irrigation water demand.
3.3.1 Domestic
The domestic water demand for households in each cell is calculated for each (daily) time step. It is assumed that households abstract water from the nearest available source: either surface water from a river or groundwater from an abstraction point. Domestic water demand is calculated by multiplying the number of people in a grid cell by the daily water requirement per person (50 L d−1 per person) in rural areas (Oageng and Mmopelwa, 2014). Actual water abstraction is limited by the water available in the nearest (non-dry) water source (either river or well). Depending on the season, farmers have to pay for water (Merel Mattijssen, unpublished) if there is no water available in their neighbourhood (at walking distance).
3.3.2 Livestock and agriculture
Water demand
Water demand for irrigation is based on the soil moisture deficit (SMD; Eq. 2) during the crop growing season, calculated as follows:
where Droot is the rooting depth (mm), θ is the volumetric water content (m3 m−3) and θfc is the volumetric water content at field capacity (m3 m−3). Irrigation demand is derived by multiplying the SMD by the sum of the irrigated land area for each household in a cell. The agricultural field size and whether a household has adopted irrigation techniques is initialised based on the initialisation procedures of household characteristics (see Sect. 3.2). If an agent adopts an irrigation measure during the simulation period, land will be converted from rainfed to irrigated land. Irrigation water demand is compared to Jeptum et al. (2018) to confirm the correct calibration ranges of the irrigation factor.
Households own livestock, which they usually herd at home. However, livestock can graze in a different location when insufficient grass or water is available at home. The decision on where to migrate to is solely based on the maximum grass availability in the neighbourhood of the agent. Grass is consumed on a first-come first-serve basis. Due to the random activation order of the agents, the agent who is activated first has most grass available. At the destination location, livestock drink water and graze, thereby influencing each other's water and grass availability by consumption of these resources by livestock. Livestock water demand is calculated by multiplying the number of livestock in a grid cell by the daily water requirement per livestock type (see Streefkerk et al., 2023).
Crop and grass yield
Crop and grass yield is calculated based on the ratio between the crop's actual (AET) and potential evapotranspiration (PET) (Ratiocrop_yield; see Sect. SIII). This calculation follows Siebert and Döll (2010): if the ratio is 1 (AET = PET), crop yield is at its maximum, while a lower AET reduces crop yield. The crop coefficient kc in the DRYP model, with the reference evapotranspiration, determines a crop's PET. This indicates how much the crop would evaporate assuming it is healthy and well-watered. The crop coefficient depends on the crop type and its development stage (Allen et al., 1998). We used crop factors for maize and cassava from Siebert and Döll (2010). For determining grass yield, we used crop characteristics of fodder. Actual evapotranspiration indicates how much the crop evaporates based on the current water availability. Crop and grass yield (Yieldcrop) is then calculated by multiplying Ratiocrop_yield with the maximum (irrigated) yield (Yieldcrop_max) for those two crop types and fodder, following Siebert and Döll (2010):
Income from livestock and crops
We translate crop yield in a year to income by multiplying the yield with market prices of the crops. We address market fluctuations of crops prices by scaling the production of the year to the average production of the last ten years (Wens et al., 2020). We calibrated and verified the simulated maize crop production with data from Kenya's National Information Dashboard on Food Security and Nutrition (KNBS, 2024) of the counties within the model domain, and weighted accordingly. Livestock production (number of animals) is a function of grass yield and calculated on daily basis (Lopez, 2008; Pande and Savenije, 2016). In addition to these rules, we assume a birth rate and that livestock dies if they don't have water for a certain period: for cattle this is four days, while goats can last maximum eight days without water (King, 1983). Income from livestock is generated by selling livestock or milk. Livestock prices are fluctuating by scaling the current livestock production to the average livestock production of the last ten years. Livestock is only sold when a household does not have sufficient income to pay expenses. Milk production is calculated by multiplying the number of animals by the number of litres produced by the type of livestock. For goats this is 1.5 L d−1 and for cows 3 L d−1 (Merel Mattijssen, unpublished; Otte and Chilonda, 2002). Based on Tegemeo Institute (2010) and Merel Mattijssen (unpublished) region-specific milk and animal prices during different seasons and drought conditions are defined. Simulated milk production of the model is calibrated and verified with milk production data of Laikipia county of the National Drought Management Authority (NDMA, 2023).
3.3.3 Commercial export farms
Commercial export farms are included in the model as water and land users in the upstream areas of the catchment (Fig. 1). Each farm has specific characteristics including: number of grid cells they occupy; a greenhouse roof surface for rainwater harvesting; a reservoir to store water (from roof, river and groundwater); type of farm (flowers or vegetables/other); water abstraction limit (per water source). Commercial farms do not follow the PMT theory for their adaptation decisions, but they follow deterministic rules to meet their water demand by using water in the following order: (1) rainwater, (2) open water from rivers, and (3) groundwater. We differentiate between horticulture and crop farm types with the following decision rules:
-
Commercial horticulture farms. Commercial farms have a reservoir and a greenhouse. Greenhouses are modelled as “closed systems”. We assume all water added as irrigation is transpired by the flowers, so irrigation and transpiration balance each other out. However, as the greenhouses do not cover the entire grid cells, we take into account the percentage of coverage of a grid cell and calculate evaporation and transpiration for the part of the grid cell not occupied by greenhouses. Water is used on daily basis from the reservoir to fulfil irrigation requirements, set at 40 m3 ha−1 d−1 for flowers (de Hoog, 2001).
-
To fill the reservoir with rainwater, greenhouses catch water on their roofs and store it for later use.
-
If the reservoir is not full and there is water in the river, the reservoir is filled with river water.
-
If there is not enough water in the reservoir and the farm has a permit, then it is filled with groundwater.
-
-
Commercial crop farms. Commercial crop farms are modelled similarly to community crop farms in ADOPT-AP, including the season in which crops are grown (OND season) (Streefkerk et al., 2023), but it is assumed that these farm types grow wheat. The farms have no rainwater harvesting from greenhouses but can store river and groundwater in a reservoir. They can also directly irrigate from river and groundwater if they have a permit.
Data to characterize the commercial export farms is based on various sources. Dam greenhouse sizes are calculated though Google images. Farm sizes and crop types are obtained from the respective farm websites online. Furthermore, water abstraction limits and permits are specified per commercial farms and are based on abstraction permit data from the Kenya's Water Resources Authority.
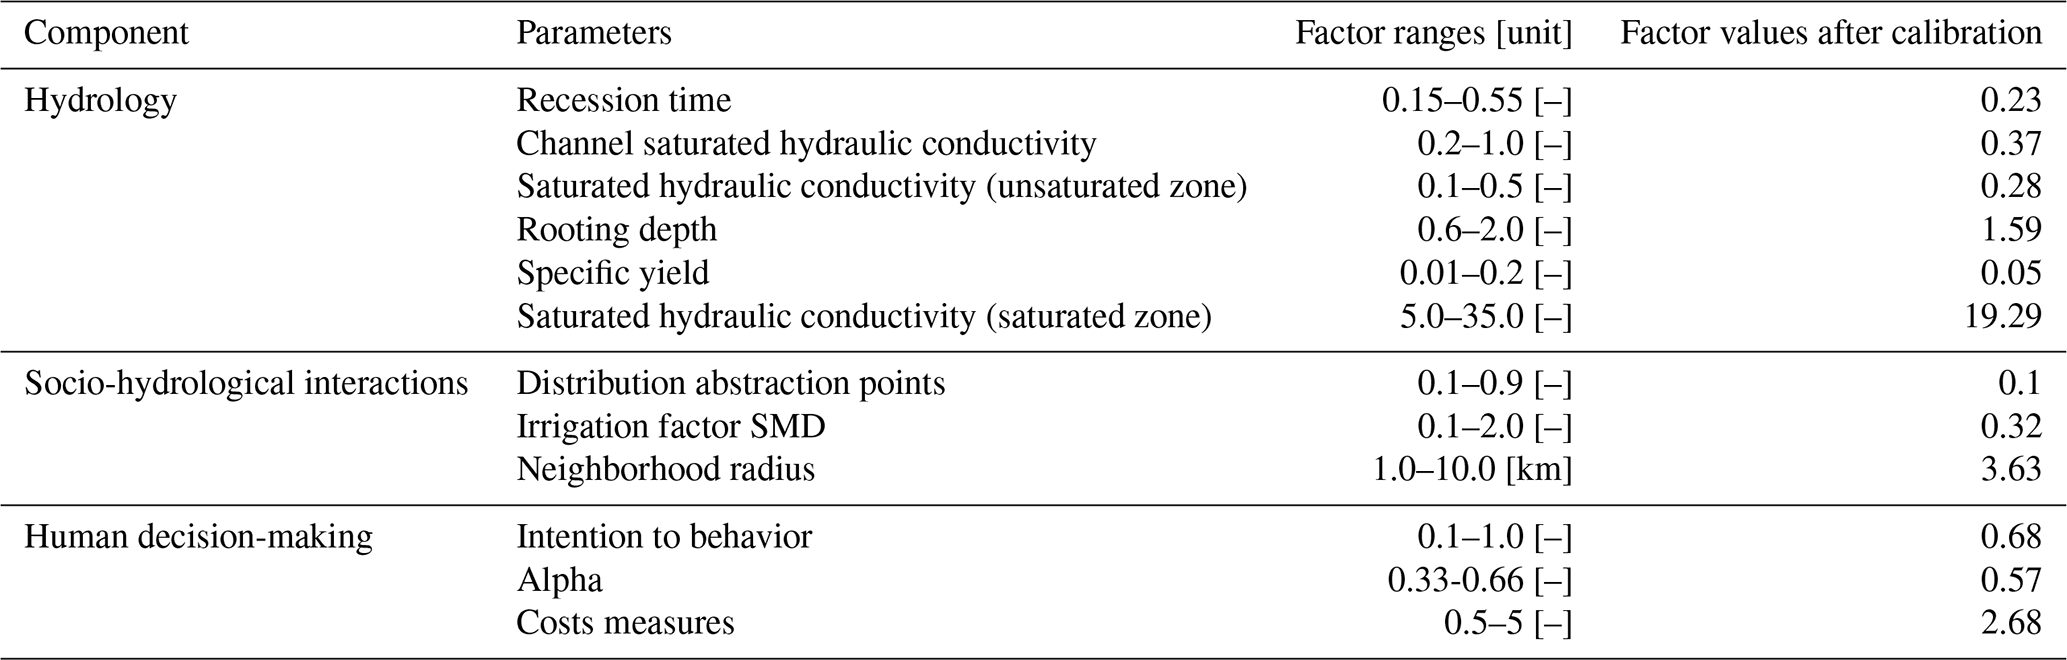
Table 2Overview of parameters included in calibration procedure.
3.4 Calibration and model performance
Calibration of parameters in all model components is performed using the Distributed Evolutionary Algorithms in Python (DEAP) software (Fortin et al., 2012), which makes use of the Non-Dominated Sorting Genetic Algorithm known as NSGA-II (Deb et al., 2002). Discharge at the outlet of the catchment, milk production, and crop production are the variables used for calibration. The difference between simulated and observed results is evaluated using a modified Kling-Gupta efficiency (KGE) score for discharge (Kling et al., 2012) and the bias ratio (BR; McEvoy et al., 2022) for milk and crop production. The hydrological model has a spin-up period of 11 years (1990–2000). The entire period after the spin-up period is available for calibration (Shen et al., 2022). The calibration algorithm DEAP initiates model runs in the first “generation”, which consists of 60 parameter sets (“individuals”). The values in these sets range as indicated in Table 2. The 10 best performing parameters sets are selected and are either combined (“mated”) or altered (“mutated”) – with a probability of 0.7 and 0.3 respectively. 12 new “individuals” are created in the process, and the model is run for these parameter sets. This procedure is repeated 10 times (“generations”). Of all generations, the best performing individual is selected and run to calculate the performance scores (de Bruijn et al., 2023). Table 2 gives an overview of the parameters which are included in the calibration procedure and the factor values used in the selected model after calibration. Note that the hydrology-related parameters are factors that in the model are multiplied by the actual values of the physical parameters (Quichimbo et al., 2023). The sensitivity of the hydrological parameters is assessed in Quichimbo et al. (2021), while the other parameters have been assessed by Streefkerk et al. (2023). The results of the sensitivity analysis showed that irrigation (demand) is the most influential variable for drought adaptation and hazard. An exception is the “intention to behaviour” parameter, which is newly added in this study.
3.5 Scenario analysis
Three scenarios are run to study the effects of the water and land use of commercial export farms of downstream users:
-
Scenario 1 “Baseline Commercial export farms”. This scenario is the baseline scenario and includes the current commercial export farms and their operational water management rules (Sect. 3.1.1).
-
Scenario 2 “Commercial as forest”. This scenario assumes that the commercial export farms are no longer present, and instead there is a natural forest area. This implies that there is no human water abstraction, and the land use is changed from crop land to forest. To accommodate this in the model, the parameters related to interception (SAVI, fraction vegetation cover and biome specific coefficient), and infiltration capacity (Ksat) are increased in the DRYP model (Ellison et al., 2017; Iacob et al., 2017; Mwangi et al., 2016).
-
Scenario 3 “Commercial as agropastoral communities”. In this scenario, the commercial export farms are converted into agropastoral communities, similarly to other grid cells, to simulate water and land use during the time before commercial farming was introduced.
We use different drought hazard and impact metrics to assess the effects of the three scenarios. Drought metrics include soil moisture, discharge and groundwater levels. Drought impact metrics include crop production, milk production, and livestock distance to water of agropastoral communities. To assess the effects of randomness in the initialization procedure of the model (which generates the heterogeneous agent population), we generate set of 10 randomness initialisations. For every run, a member of the set is run for the three scenarios to allow for comparison between scenarios. However, among the three scenarios the initialization is the same to allow for comparison between scenarios.
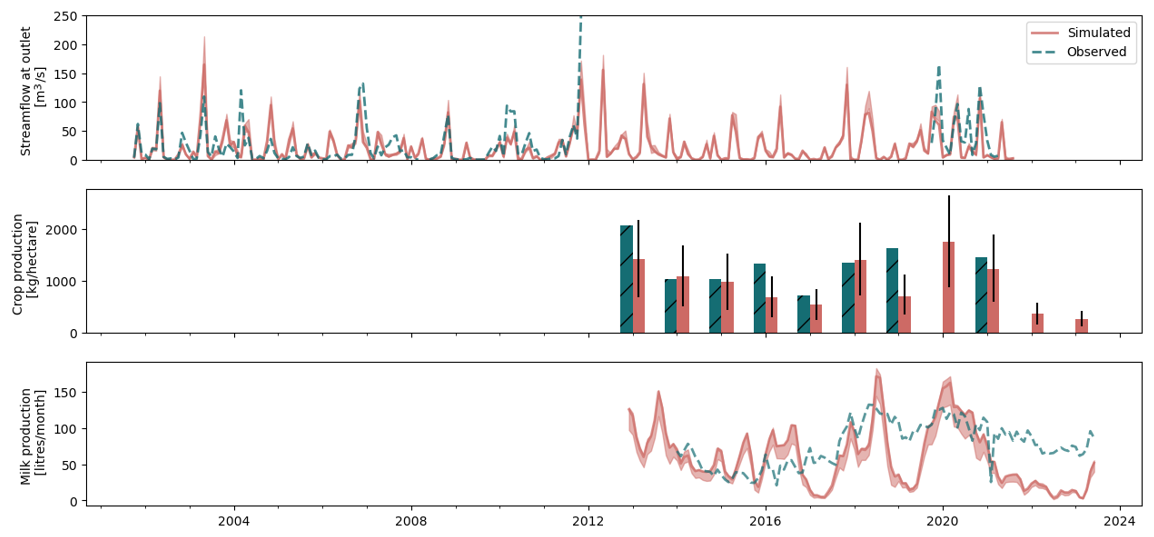
Figure 4Observed and simulated timeseries of streamflow at the outlet of the catchment (m3 s−1), crop production (kg ha−1), and milk production (L per month). The uncertainty ranges indicate the 10th and 90th percentile, resulting from the different parameter sets of the best ten performing runs.
4.1 Performance of model
The model performance is tested by comparing observed and simulated values of three variables (Fig. 4); discharge at the outlet of the catchment, milk production, and crop production (maize). The KGE score of discharge is ∼ 0.54 (composed of a bias ratio of 0.8, variance ratio of 0.74 and Pearson correlation of 0.67), and the BR is ∼ 0.63 for crop production and ∼ 0.62 for milk production. The simulated crop production in the best performing parameter set is lower than the observed production, and has a high variability within the ten best performing parameter sets obtained from the genetic calibration method (Sect. 3.4). The simulated milk production has a higher variability than the observed milk production. However, it follows the timing of the observed peaks very well. During the last period of the 2020/23 drought the model simulated a lower milk production than was observed.
4.2 Scenarios: effect of commercial farming activities on drought risk and impact
Before discussing the effect of different scenarios, we first look at water use by commercial farms in the Baseline scenario. Here, on average, irrigation water use by commercial flower farms is supplied as follows: ∼ 75 % of their irrigation is obtained from water that is stored in dams and reservoirs (previously collected via rainwater harvesting on the greenhouse roofs), 7 % from river discharge, and 18 % from groundwater sources. The irrigation water by commercial crop farms originates for ∼ 35 % from river discharge and the remaining ∼ 65 % from groundwater sources.
Next, we assess the effects of the three scenarios defined in Sect. 3.5: (1) Baseline commercial farms (2) Commercial farms converted into forest, and (3) Commercial farms converted in agropastoral communities. To allow for comparison, hazard and impact variables are simulated for two drought periods for each of the three scenarios, but limited to the OND seasons of the drought periods: OND 2016/2017 for the “2016/17” drought and OND 2021 and OND 2022 for the 2020/23 drought (in accordance with Odongo et al., 2025c). The effects on drought hazard are quantified using soil moisture, discharge and groundwater elevation indicators. Drought impacts are quantified using distance to water, crop- and milk production.
4.2.1 Aggregated drought hazard and impact over the drought periods
Figure 5 below shows the average of drought hazard and impact variables for the four sub-catchments, separated over three climate zones (climate zones I–IV, V and VI, see Fig. 1). These numbers exclude the upstream area that was modified in the scenario. When comparing drought hazard across the two drought periods, climate zones, and scenarios, we mostly see the difference between the drought periods and climate zones, and less difference across the scenarios. Across the climate zones, we observe highest soil moisture values in the most upstream climate zone I–IV (∼ 0.3), followed by the middle V (∼ 0.25) and lower zone IV (∼ 0.2). For streamflow this is the other way around, with highest streamflow values in the downstream climate zone, with 50 m3 d−1 in the 2016/17 drought period and 18 m3 d−1 in the 2020/23 drought period. Groundwater levels are similar in these two drought periods. However, groundwater levels vary among the climate zones, with shallowest groundwater depths in the upper climate zones (I–IV), followed by the lower zone (VI), and deepest groundwater levels in the middle zone (V) (around 48, 64 and 82 m depth, respectively). During both drought periods, the groundwater depth is higher (i.e., lower water table) in the “commercial farms” scenario, especially in the upper climate zone where the commercial farms are located, with an increase of 1.8 m in 2016/17 and 2.2 m in 2020/23. Overall, we can observe that drought hazard is slightly exacerbated in terms of groundwater levels in the commercial export farms scenario compared to the other scenarios, but soil moisture and streamflow show no significant differences among the scenarios.

Figure 5Average of drought hazard- (a) and impact variables (b) over the four sub-catchments, shown for different climate zones and two drought periods in the three scenarios. The error bars show the 25th and 75th percentile of the runs.
In terms of drought impacts, the crop production and milk production are both higher in the 2016/17 drought compared to the 2020/23 drought (Fig. 5b). During the 2016/17 and 2020/23 droughts, crop production is, respectively, 418 and 239 kg ha−1, with no significant variance among the runs, scenarios or climate zones. Milk production is higher during the 2016/17 and 2020/23 drought, with values around 250 and 140 L per month in the upstream zone and 165 and 105 L per month in the middle zone, respectively. In the lower zone less difference in these values can be observed among the drought periods, with average milk production of ∼ 60 L per month. The distance to household water is shorter in the 2016/17 drought; around 2.7 km for all scenarios, compared to 3.0 km during the 2020/23 drought (with variations around 0.6 km among the various runs). Slightly longer distances are observed in the middle zone (+0.2 km), which may be linked to deeper groundwater levels in the middle zone compared to the other two zones. The differences in distance to water among the scenarios are negligible.
While the differences across the scenarios are minimal, note, however, that we here assess the average effect over a large area, and only look at two time periods. On the other hand, it can be seen that the severity of the drought and the type of climate zone has a greater impact on households than the difference in scenarios. In the next paragraphs we will have a closer look at the temporal and spatial differences among the scenarios and among the agent population.
4.2.2 Spatial and temporal drought hazard effects
In this section the three scenarios are assessed in terms of their drought hazard characteristics. Figure 6 shows the effects of the two drought periods by comparing the forest (2) and communities scenario (3) with the baseline commercial farms scenario (1). The figure shows data for the four sub-catchments, excluding the scenario area. Over time the drought hazard variables are positively influenced (i.e. drought hazard reduced) due to the absence of the commercial farms in the forest and communities scenario. Results show that over time, there is an increase in soil moisture and streamflow. The increase of soil moisture coincides with the timing of the cropping season (OND). Within the scenario area, soil moisture is decreased due to less irrigation. During the cropping season, less water is abstracted for irrigation in the forest and communities scenario compared to the commercial farms scenario. The higher peaks in soil moisture in the communities scenario (up to ∼ 0.00025 difference) compared to the forest scenario (up to 0.0002 difference) can be explained by a higher evaporation rate and no irrigation at the scenario area leading to less runoff in the forest scenario (see Fig. S6 in the Supplement). There are larger variations in soil moisture levels among the communities scenarios, due to different initialization settings of agents, leading to variations in behavior and water use. Streamflow at the outlet of the catchment is increased in the community scenario (up to 1.5 m3 s−1). This varies in the forest scenario, with both decreases and increases in streamflow, due to increased evaporation leading to decreased runoff. Groundwater tables are up to 1.2 m higher in both the forest and communities scenarios. This effect is caused by the absence of abstraction of groundwater by the farms, and more infiltration because of the absence of greenhouses covering the land surface, causing less water taken out of the groundwater and an increase in groundwater recharge. In the forest scenario the evaporation is higher, leading to lower (∼ 0.1 m) groundwater tables compared to the communities scenario at the end of the simulation period. In the communities scenario, wheat is grown at the open farms instead of maize or casava, which results in different water demands. Streamflow and soil moisture are hydrologically connected to the groundwater table, which can explain the same upward trend in all the three variables. Note that there is no increase in groundwater level in absolute terms, but the increase is relative to the commercial farms scenario, which has a decreasing trend due to abstraction. Absolute values of the hydrological variables can be found in Fig. S6.
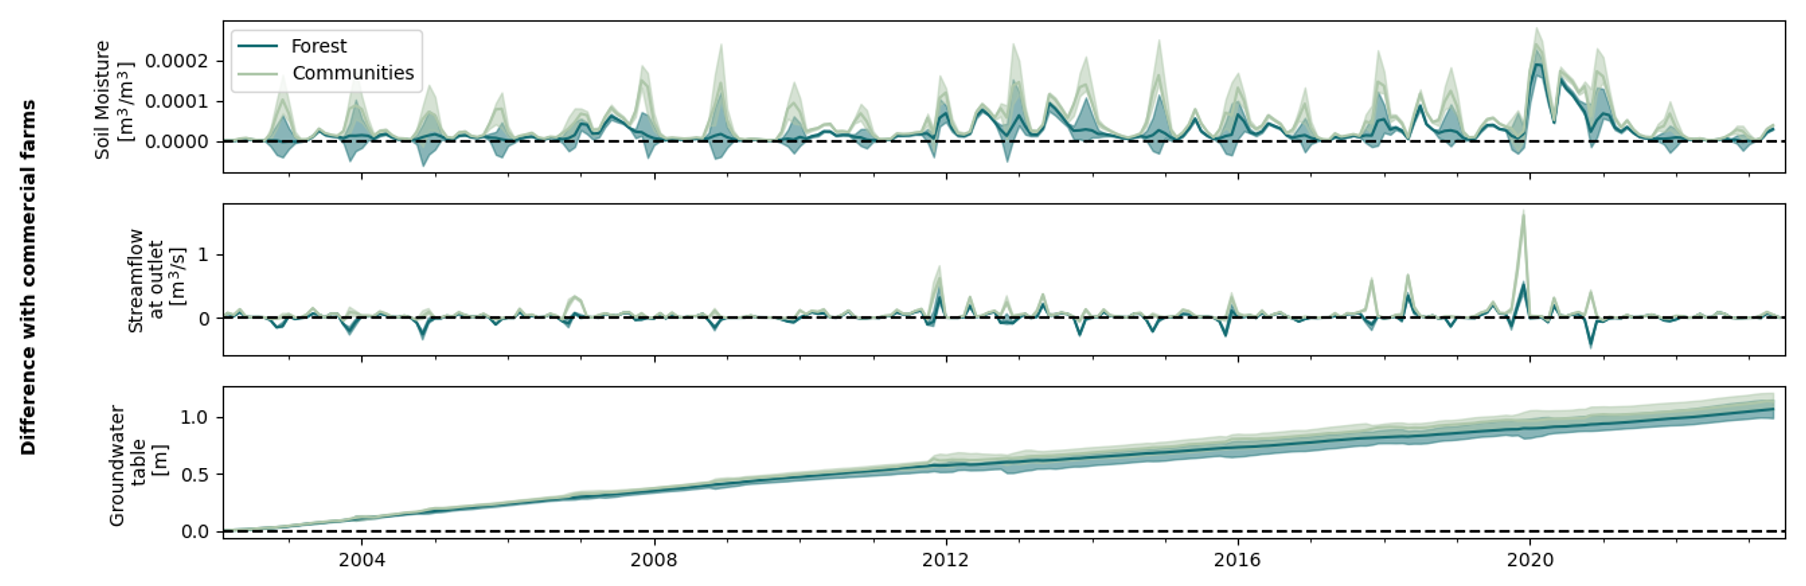
Figure 6Differences between baseline commercial farms (scenario 1), and forest (scenario 2) and communities scenario (scenario 3) in soil moisture (m3 m−3), discharge (m3 d−1) and groundwater level (m) aggregated over the four sub-catchments, excluding the scenario area. The spread indicates the 25th and 75th percentile over the different runs.
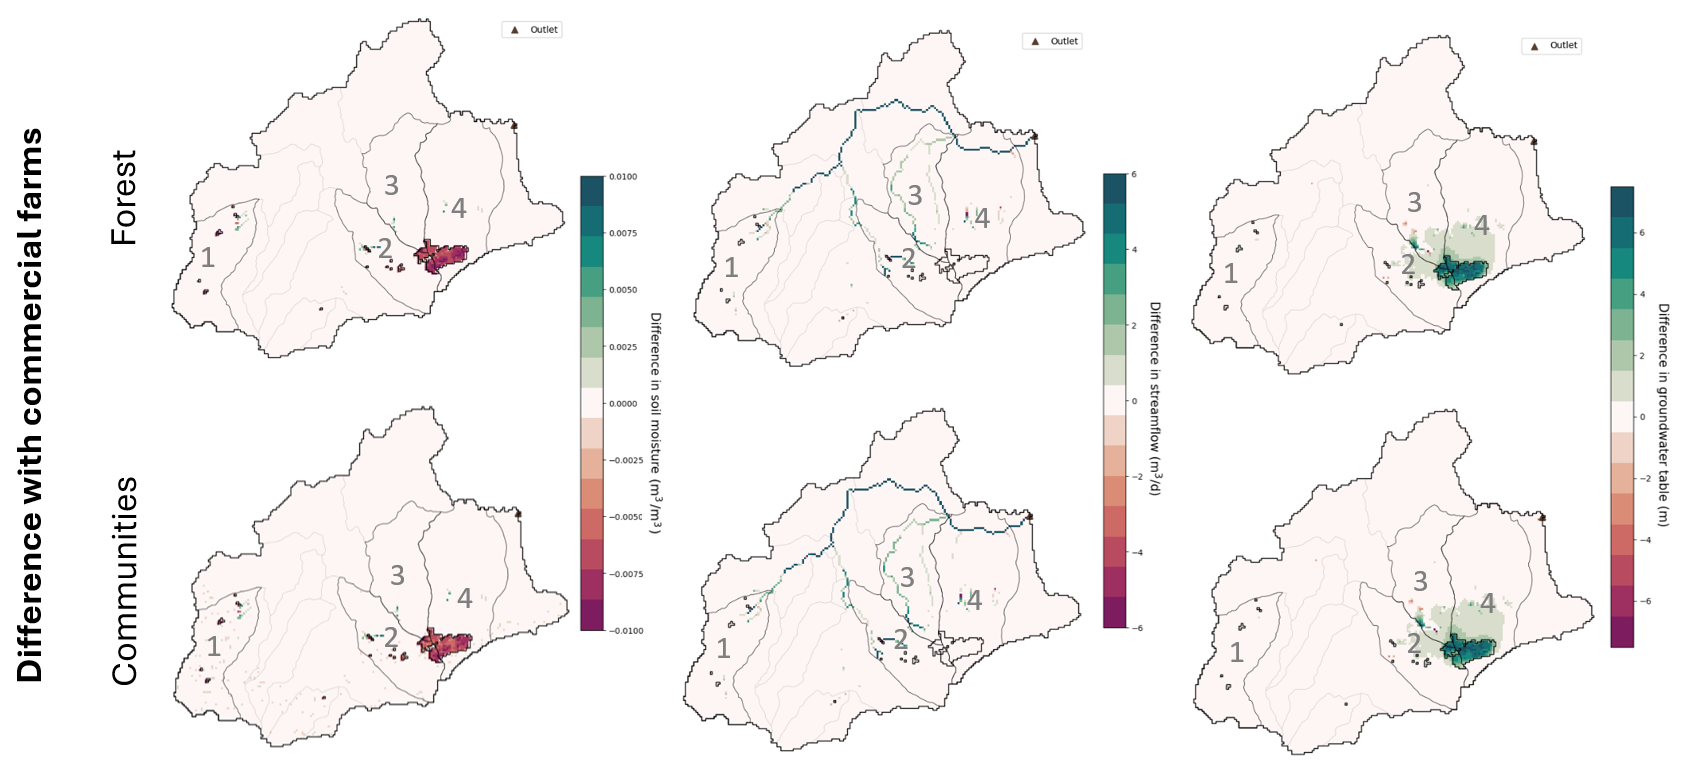
Figure 7Differences between commercial farms and forest scenario (2) and communities scenario (3) over the 2020–2023 drought period using hazard indicators: soil moisture (m3 m−3), discharge (m3 d−1), and groundwater table (m).
Figure 7 shows these effects spatially over the whole drought period of 2020–2023. The left panels show that the decrease in soil moisture (up to ∼ 0.01) is largely at the location of the commercial farms in the forest (2) and communities (3) scenarios during the whole drought. However, interestingly, there is an increase of soil moisture at some riparian zones downstream within the same sub-catchments (up to ∼ 0.005), which is linked to the increase in streamflow (Fig. 7, middle) downstream of the commercial farms. Maximum absolute increases of streamflow during the 2020–2023 drought are at the outlet of the catchment, up to 6 m3 d−1. Increases up to 20 % can be observed over OND seasons with an average of 5.8 % (between 2002 to 2012) in the Naru Moru river (see Fig. S7 in the Supplement), located in sub-catchment 2. Over the period of 2013 to 2023 the maximum increases over the OND season are 30 %, with an average of 7.3 %. Average streamflow differences in the Naru Moru river show an increase of 4.4 % over the period of 2002–2023. Note that during the dry seasons differences are often zero, as most of the time there is zero-flow in both scenarios during the dry seasons. Some areas in the most Eastern sub-catchment have a reduction of streamflow (up to −6 m3 d−1). Furthermore, the figure shows that the increase of the groundwater table is mostly observed in commercial farms area itself in both forest and communities scenario, with a difference of around 5 m over the 2020/23 period (with the average groundwater depth is round 50 m in the upper climate zone as shown in Fig. 5. The increase of the groundwater has an effect downstream: a rise of the groundwater table downstream of the scenario area (around 1 m over the 2020/23 period). There is no significant difference between the forest and communities scenarios, indicating that the commercial farms are most influential in modifying drought hazard characteristics.
4.2.3 Spatial temporal drought impacts
The spatial and temporal effects of the three scenarios are assessed in terms of their drought impact characteristics. We zoom in to role of different agent types: effects on impacts are assessed separately for agents close to the river and those located further away. Of the total amount of agents, 24 % are located close to the river.
Figure 8 shows the differences in crop production for forest scenario and communities scenario as compared to the baseline commercial farms scenario. Overall, crop production is more influenced in the forest and commercial scenario for agents located nearby a river stream, who are more affected by differences in streamflow. This group of agents would have a lower crop production in the forest and communities scenario (up to −0.8 %). However, in the drought periods at the end of the years 2010, 2016, and 2021 higher crop production is observed (up to 0.25 %). Crop production shows less difference with the baseline in the forest scenario than in the communities scenario. Note that the percentage difference is minimal (up to +0.4 %).
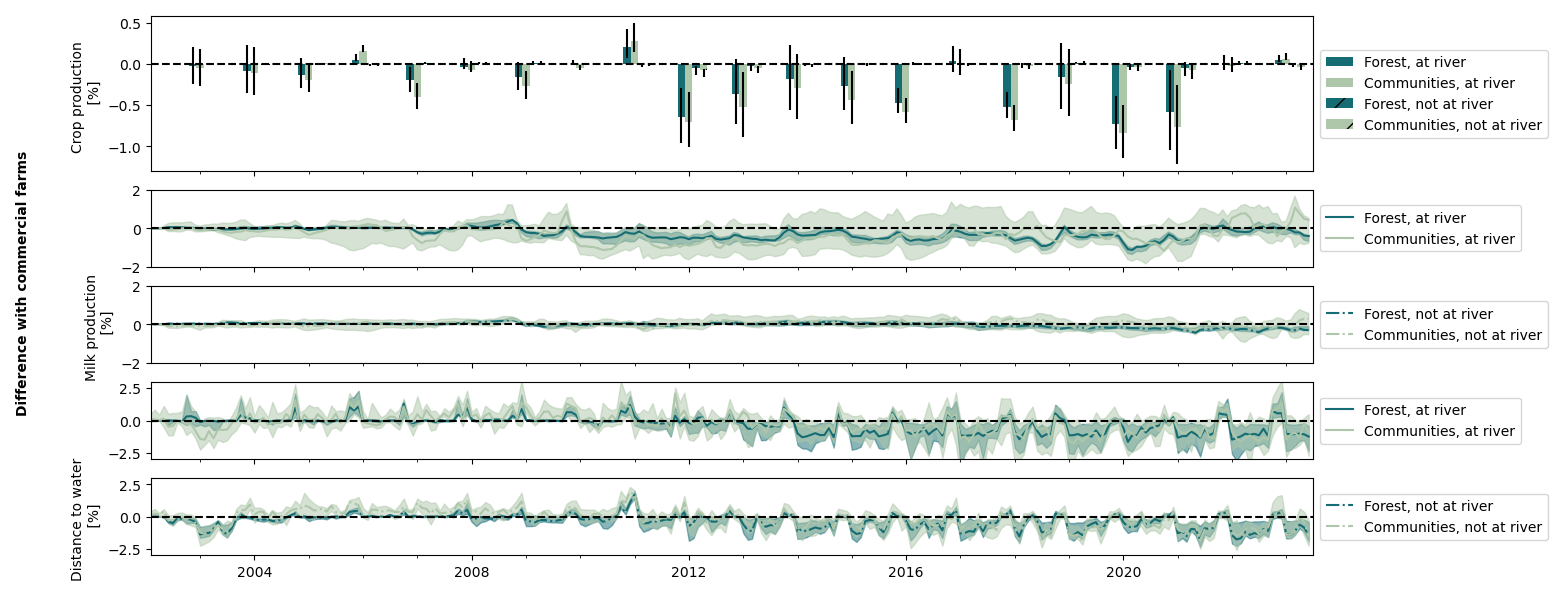
Figure 8Difference in forest and communities scenario compared to commercial farms scenario, expressed in crop production (%), milk production (%), and distance to household water (%). The figure also shows the impacts differentiated between agents located at the river. The spread indicates the 25th and 75th over the different runs.
Milk production is negatively affected by agents located near a river in both the communities and forest scenario. This decrease in milk production is not expected as there is an increase in soil moisture, streamflow and groundwater levels. However, agents can migrate and tend to migrate towards the riparion zones where grass production is higher. Therefore grass yields at riperian areas are shared among more livestock, resulting in lower milk production. If there is more water and grass available at the rivers in the communities and forest scenarios, agents might be more likely to migrate there with livestock and thus negatively affect agents already located at the rivers. Milk production of agents who are not located at a rivers are on average less influenced by the communities and forest scenarios, between −0.5 % and 0.5 % difference. Up to 2017 the forest and communities scenarios have a slight positive effect on milk production. However, in the forest scenario the milk production slightly decreases after 2017 (up to −0.5 %).
The distance to household water is decreased in the forest and communities scenarios during the dry season (up to −2.5 % for agents at the river, and −2 % for agents not at the river). However, in the rainy season this distance increases compared to the commercial scenario (up to 2.5 % for agents at the river, and 2 % for agents not at the river), which may be due to lower runoff rates compared to the commercial farms scenario. The distance to household water is influenced by both the streamflow and groundwater level. A higher variability of distance to household water can be observed with the agents located near a river. The distance to household water follows a similar pattern as the streamflow; an increase in streamflow results in a decrease in distance to household water and vice versa. Furthermore, a decreasing trend of the water distance can be linked to the increasing trend of groundwater levels in both the forest and the communities scenario.
We further look into the differences among agents by assessing the variety in drought impacts among the agent population per climate zone, illustrated in Fig. 9. We observe that among the agent population, crop production varies between −18.3 % to +10.7 % in the forest scenario and −16.6 % to +5.7 % in the community scenario, as compared to the commercial farms scenario. This effect is the strongest in the upper climate zone (I–IV) during the 2020 OND season – in alignment with previous results in this section. In terms of milk production, the difference among the scenarios and the agent population is only starting to emerge from 2011 onwards, with biggest differences in the community scenario where milk production ranges from −90 % to +910 % in the lower climate zone. These differences can likely be explained by the randomness of the grass consumption process, which influences milk production. In the community scenario more agents are competing over grass in the catchment, as the agents in the scenario area can also migrate outside of that area. Since the process of grass allocation is highly dependent on other agent's behavior by competing over the same resources, additional agents lead to cascading changes in the system. The agent population is the same in both the commercial farms and the forest scenario, resulting in smaller differences. Here, the largest differences can be observed in the upper climate zone (I-IV) with differences between −28 % and +25 % among the agent population. These differences decrease downstream, with −9.4 % to +4.2 % in the middle climate zone and no observable differences in the lower climate zone. The difference in “distance to water” shows peaks of which many are timed at the start or during the cropping season. Similarly to milk production, large variations can be observed in distances to water in the communities scenario with differences ranging from −100 % to +4330 %. This can again be due to the dependency of other agent's behavior on water availability. Differences up to −5 % to +13.5 % are observed in the forest scenario.
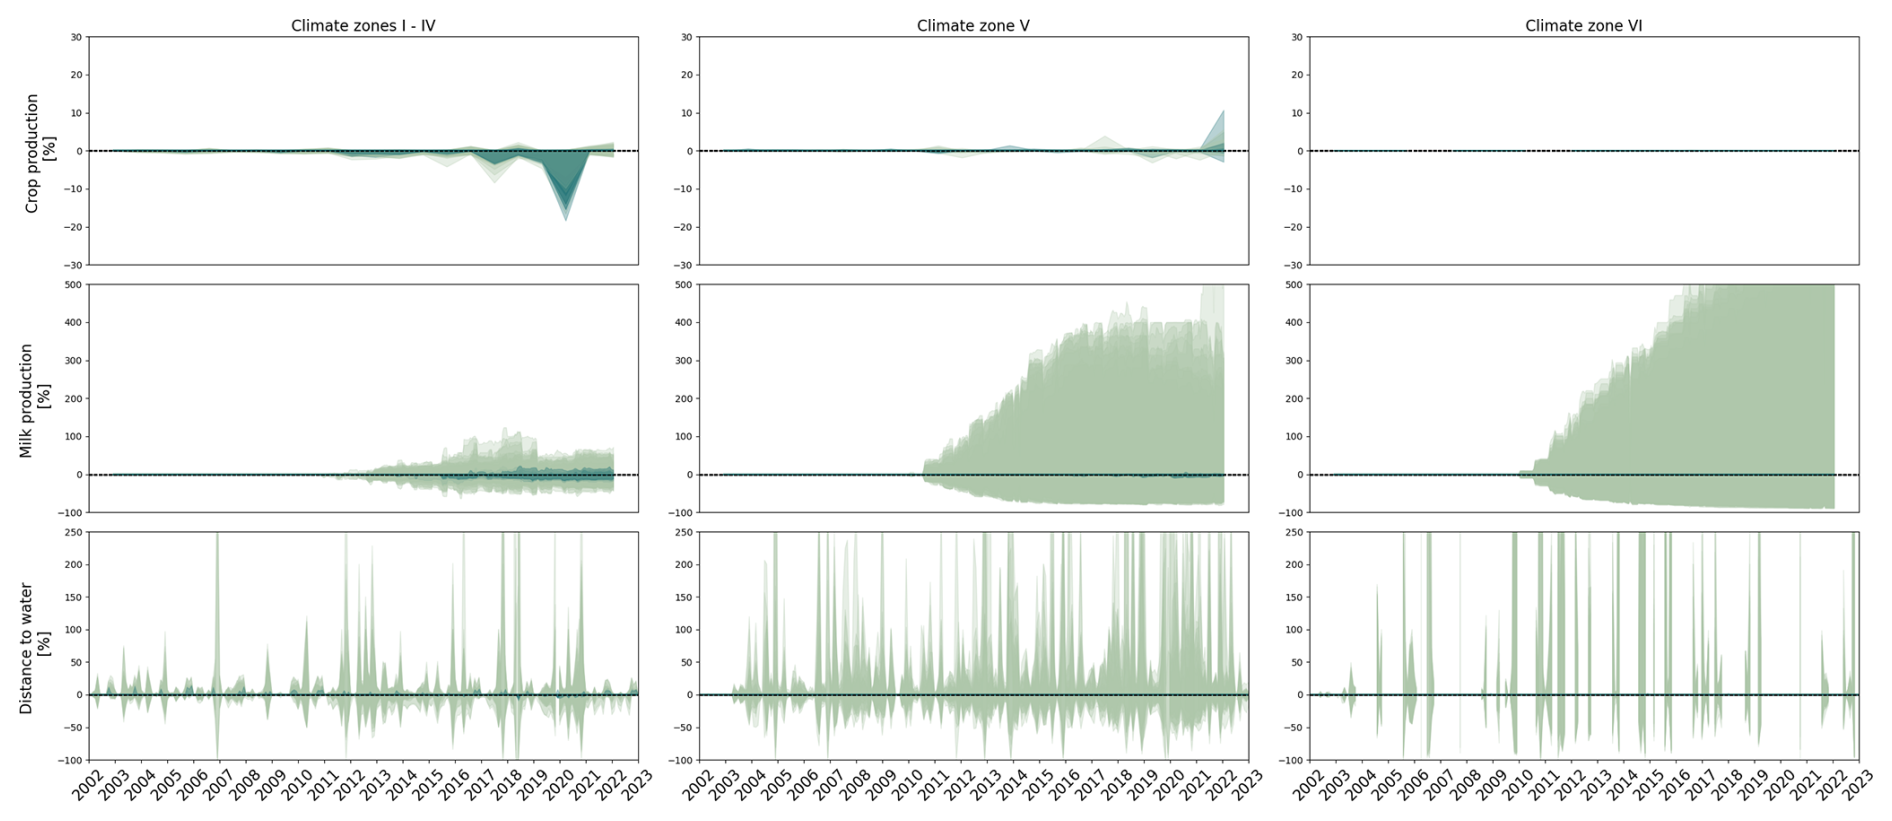
Figure 9Difference in forest and communities scenario compared to commercial farms scenario, expressed in crop production (%), milk production (%), and distance to household water (%). The spread indicates the 5th and 95th over the agent population, individually plotted for the ten different runs.
5.1 Reflections on modelling framework
The development of models like ADOPT-AP provides a valuable tool for capturing and understanding the interactions between human activities and drought impacts, in particularly by quantifying these processes and accessing the implications of various scenarios. ABMs can thus inform policy development by providing evidence-based insights into how different stakeholder behaviours and interactions influence system outcomes under various management scenarios. However, model uncertainties remain, which will be addressed in this section, together with a reflection on the model performance and modelling assumptions.
The model performance is considered acceptable, with a KGE score of ∼ 0.54 for discharge and a BR of ∼ 0.63 for crop production and ∼ 0.62 for milk production, respectively. However, the model underestimated the milk production compared to observed data in dry periods. This might indicate that milk production is not just influenced by environmental stressors such as droughts (Busker et al., 2023), but that responses of (non-)governmental organisations have perhaps decreased the impact of drought on milk production (e.g. people receiving cash transfers through humanitarian aid allowing people to buy water and hay). This finding is supported by Odongo et al. (2025a, b) who conducted a probabilistic modelling study of drought impacts in Kenya. They showed that vulnerability factors such as access to safe water, poverty, and aridity interact in non-linear and compounding ways, and better explained the magnitude of drought impacts as compared to only using environmental or hydrological indicators. This suggests that milk production responses to drought are at least partly mediated by socio-economic resilience, targeted humanitarian interventions, and other adaptive behaviours not captured in this study (e.g. saving groups and alternative income). However, we should also note that the observed data might not be accurate. Milk production does not reduce as much as one would expect from the severity of drought impact reported on food security (Reliefweb, 2023) – assuming milk production is strongly correlated with food insecurity (Jodlowski et al., 2016). Furthermore, the lack of data on adaptation measures over time hinders the validation of modelling the effects of adaptation measures and human-water feedbacks (Aerts, 2020). Although alternative calibration parameters can be used to calibrate and test the performance of the model, empirical longitudinal data from consecutive surveys on the uptake of adaptation measures would be valuable (Kalthof et al., 2025). Such panel data would give more certainty around calibrating the weighting of relative importance of the risk and coping appraisal parameters in our decision model and the threshold that drives the intention to adapt to actually implement measures (Bubeck et al., 2020).
We also reflect on the modelling framework by comparing the calibration results and the uncertainty ranges of model results. Here we distinguish (1) (calibrated) parameter sets which mostly control (socio-)hydrological properties (Fig. 4), and (2) different initialisation settings for the agents household characteristics (Fig. 5), which may indirectly impact the hydrological simulations.
These results show that the severity of the simulated drought hazards is not at all sensitive to our initialisation settings. Note that we do see a spatial-temporal pattern in the severity of drought events, but this pattern is not dependent on the initialisation settings. However, with regard to drought impacts, we do find that both the parameter sets and initialisation settings affect the results in different ways. For example, crop production is sensitive to different parameter sets but not to the initialisation settings. This indicates that crop production is not much influenced by household characteristics, but is mostly affected by water availability. This was also observed in the sensitivity analysis by Streefkerk et al (2023), using the same model setup, where the “irrigation factor” was found to be the most influential parameter for crop production outcomes. This may explain why in this paper limited differences among the scenarios are observed in terms of crop production, as the “irrigation factor” nor rainfall was changed between the scenarios. Only 11 % of the agent population have both access to irrigation and are located near a river. This can be an explaining factor of why the changes in streamflow and groundwater due to commercial farming activities have minimal effect on the drought impact variable crop production. The other drought impact variable distance to household water, however, is more sensitive to household characteristics than water availability, while the drought impact variable milk production is sensitive to both household characteristics and water availability. For example, the household characteristic “network radius” determines the extent of the area where agents can look for water and grass and thus influence the distance to water and milk production. This also relates to assumptions within the model decisions rules, for example the prioritisation of water allocation, whereby domestic water demand is prioritised over livestock and crop demand. This assumption is reflected in the results, as most of the effect on drought impacts among the different scenarios is observed in the distance to household water.
Notably, soil moisture appears to be only weakly connected to groundwater levels (Quichimbo et al., 2021). Only a small upward trend in difference of soil moisture levels over the simulation period is observed, despite the strong upward trend of difference of groundwater levels in the communities and forest scenarios (Fig. 6) caused by the strong downward trend in groundwater levels in the commercial farms scenario. Furthermore, the additional runoff generated by return flows from groundwater abstraction related to the commercial farming activities may partially offset the effects of river abstraction and groundwater levels on river discharge (De Graaf et al., 2014). Finally, the limited effect of commercial farms activities on river discharge and drought impacts may also be influenced by the spatial scale of the analysis, as the scenario area is relatively small compared to the studied area (200 km2 vs. 5500 km2). Other studies in the catchment area have found significant local effects on river discharge (Ngigi et al., 2008; Lanari et al., 2018; see Sect. 5.2), showing that strong local effects can average out on the larger catchment scale.
There are also model assumptions regarding the commercial farming activities (see also Sect. 5.2). One of which is that the groundwater extraction of the farms is limited by abstraction rate defined by their permits, and not by abstraction depth (i.e., physical limits on well depth) or increasing abstraction costs for example related to electricity or fuel costs. This could lead to both an overestimation or underestimation of groundwater abstraction compared to real values. Abstraction could be overestimated as farms may reach the maximum groundwater well depth in times of lower groundwater tables, limiting their abstraction. On the other hand, abstraction could also be underestimated, as abstraction rates reported by permits may not necessarily reflect actual maximum abstraction rates (Aeschbacher et al., 2005), with farmers possibly abstracting more than their permits. Also, the reservoirs of the commercial farms are perhaps modelled more efficiently than in reality: in our model, open water evaporation of the reservoirs is not included. Together, these two assumptions related to groundwater and surface water may result in an underestimation of river abstraction and over- or underestimation of groundwater abstraction in the commercial farm scenario.
Essentially, our model setup with a coupled agent-based and hydrological model allows to assess the impacts of humans on water, and of water on humans. Based on our results, we can conclude that the impact of commercial farming activity on water resources is quite limited within this basin, while the impact of water on human behaviour is significant (see Sect. 5.2). This is likely due to the relatively small area of commercial farms as compared to the entire basin. Therefore, one could argue that other model frameworks that do not include feedbacks between human behaviour and the water system could have led to similar outcomes. Examples of such other hydrological models are models that include human activities (e.g. Wada et al., 2014; Switzman et al., 2015), surface and groundwater interactions (e.g. De Graaf et al., 2014), and drought impacts (De Wit, 2013). However, we did not know this beforehand, so we could not have a priori excluded the impacts of human behaviour on the water system. Using the agent-based model to simulate the influence of water resources on human behaviour has allowed us to investigate some impacts and feedbacks that are unique to agent-based modelling (see Sect. 5.3). Furthermore, we argue that such a coupled model setup can be used in other contexts where the influence of human behaviour is more significant (e.g., the Bhima basin; Kalthof et al., 2025), and is thus more widely applicable than a model that only uses one-way and fixed effects.
In this study, households and commercial farms are incorporated as actors that influence the water balance. However, other water users may be important as well, especially considering population growth in urban areas (Wamucii et al., 2023) and the expansion of the tourism industry (Mutiga et al., 2010). Furthermore, this study represents the adaptive behaviour of households through the Protection Motivation Theory (PMT). Although research shows that PMT factors best explains the adaptive behaviour of farmers in Kenya (Wens et al., 2021), it should be noted that more factors may influence the adoption of drought measures, such as variables which are included in economic theories (e.g. risk and time preference) (Schrieks et al., 2023).
5.2 Influence of commercial export farms on drought hazard and impact
Previous research has already shown that water abstraction by commercial export farms reduces streamflow during the dry season (Ngigi et al., 2008). For example, Lanari et al. (2018) found that streamflow in Naru Moru River (tributary within the Ewaso Ng'iro catchment) is influenced by commercial export farms in the catchment, resulting in a streamflow reduction between 3 % and 32 % in the month of February (dry season). In this study, we observed minimal changes in the dry seasons, but observed large differences in streamflow during the cropping seasons of drought events (2010/11, 2015/16 and 2020/23). The average changes during OND season are 5.8 % in the period of 2013–2023. The effects of the commercial farms are at present primarily local, and while some effects are seen downstream, they remain limited (see Sect. 5.1). In the current modelling setup it is assumed that the crops of commercial farms only grow in the OND season (similar to the agents), which may not be the reality and this may underestimate water use, explaining the limited effect of the commercial farming activities on dry season flows. It is, therefore, expected that the ongoing expansion of commercial export farms will result in a further reduction of streamflow if no further water saving measure will be taken (Lanari et al., 2018), similarly to situations in other parts of the world with favourable horticulture conditions such as Ecuador (Mena-Vásconez et al., 2016, Mena-Vásconez, 2020) and Ethiopia (Woldeyohannes, 2016).
Besides these findings for streamflow effects that align with previous research, our results show a significant effect on groundwater, which was not previously investigated. Locally commercial farms lead to lower groundwater tables (up to 1.5 m difference averaged over four sub-catchments). Initially, groundwater levels may appear sufficient to support both commercial farming activities and local community needs. As groundwater is a hidden water source and there is a lack of groundwater monitoring, it may be difficult for communities and practitioners to perceive the extent of the problem. Additionally, the immediate economic benefits from export farming, such as employment opportunities and increased local revenue, may overshadow concerns about water consumption. Over time, the excessive withdrawal of groundwater may lead to unsustainable water management (Gaye and Tindimugaya, 2019) and thus high impacts in the long term (Hogeboom et al., 2015). Impacts may include wells running dry for domestic use, inequity in access to water, land subsidence, conflict, and ecosystem and biodiversity degradation (Perrone and Jasechko, 2017; Rafiei Emam et al., 2015; Sarkar, 2012). As illustrated in this research, small differences among the scenarios are observed in term of average drought impacts on communities. Average distances to water are slightly increasing over time during the dry seasons (up to 2.5 %) and crop production slightly decreased during drought seasons (up to 0.5 %) in the commercial farms scenarios. In non-drought periods, crop production for agents located near a river is lower in both the forest and communities scenario (up to −1 %), although the streamflow is often higher during the cropping season with a difference of up to 1.5 m3 s−1 at the outlet of the catchment (especially in the communities scenario). A possible reason can be the competition of water for different purposes and the way the model prioritizes water allocation (see Sect. 5.1). Increases in streamflow in the communities and forest scenario can lead to changes in agent's water sources from groundwater to river, resulting in an increase in water demand for domestic and livestock purposes at river locations. This increase in demand can result in less streamflow remaining for irrigation purposes (leading to a decrease in crop production).
Although minimal differences in drought impacts among the different scenarios are observed over the average population, large variations in drought impacts are observed within the agent population itself (5th and 95th percentile), when comparing the forest and communities to the commercial farms scenario. These findings suggest that the impacts of the commercial farming activities are spatially variable. The largest differences are observed with respect to the communities scenario, which can be explained by the additional agents that are present in the model in that scenario. This suggests that drought impacts are impacted by other agent's activities and that a cascading socio-hydrological interactions largely influence outcomes in drought impacts.
To mitigate the long-term impacts of lowering groundwater tables, it is essential to implement sustainable water management practices that balance the needs of commercial and local water users (Dalin et al., 2017), including; (i) Regulating (indirect) water use by enforcing existing regulations and/or establishing robust groundwater monitoring systems and regulations to ensure that extraction rates do not exceed recharge rates and abstraction permit limits. Not only for commercial export farms, but water abstraction in general (Mwaura et al., 2021); (ii) Supporting the implementation of sustainable agricultural practices. The adoption of water-efficient irrigation methods can be encouraged to reduce water consumption (Mulwa et al., 2021). Alternatively, water consumption can be decreased by decreasing bare soil evaporation through promoting soil moisture conservation techniques such as agroforestry (Mwangi et al., 2016) and mulching (Kader et al., 2019); (iii) Promoting equitable water distribution (especially in dry periods) by involving local communities in water management decisions and raising awareness about the importance of sustainable water use. The governance structure of the WRUA's is already a step forward in equitable water distribution (Dell'Angelo et al., 2016; Mwaura et al., 2021).
When reviewing experiences from drylands in other global regions, the question is whether producing water intensive commodities can be a sustainable water management practice in water-scarce dryland areas (Martínez-Valderrama et al., 2024). Especially when the commodity is exported and not contributing to the food security of the country itself. However, this is a political discussion, as there are also employment and economic benefits to this industry (Peter et al., 2018; Mekonnen et al., 2012). In addition, the importing countries can take virtual water (or energy) footprints into account in their supply chain (Mekonnen et al., 2012).
5.3 Drought impacts and human-water feedbacks
Drought impacts are a manifestation of complex system in which interaction between water and people exist and emerge (Van Loon et al., 2016). Drought impacts may be different for different people, as people have different capacities or respond differently. In turn, the drought responses of people (and other actors) may influence the propagation of drought. For example, irrigation may delay the drought impact of soil moisture drought, but may worsen the drought at a later stage during hydrological drought (Piemontese et al., 2024). Other feedbacks relate to behavioural factors. For example, results show how people influence each other's pasture availability and milk production. Agents tend to migrate towards the riparion zones where grass production is higher (Streefkerk et al., 2023). Therefore, in the forest and communities scenarios, grass yields at riperian areas are shared among more livestock, resulting in lower milk production for agents already located near rivers. The scenario analysis shows that the uptake of irrigation in the communities scenario and water harvesting is decreasing over time in the forest and communities scenario as compared to the scenario with commercial farms. This is probably due to the higher water availability in the scenario without commercial farms leading to a lower adaptation efficacy and risk perception, resulting in a lower uptake of water harvesting and irrigation. Understanding these interactions is crucial for developing effective drought adaptation strategies for agropastoral communities, and sustainable water management practices and governance (Wens et al., 2021). The results show, however, a wide range in the uptake of adaptation measures among the various model runs, highlighting the importance of heterogeneity and individual characteristics of agents in adaptation behaviour (Odongo et al., 2025c). The importance of heterogeneity is further highlighted by comparing agents located at the river and agents not located at the river. These results show that agents located at the river are more affected by commercial farming activities due to changes in streamflow. Moreover, large variances in drought impacts across the scenarios were observed among the agent population, while the average differences were minimal (as discussed in Sect. 5.1 and 5.2). This illustrates that at individual level large impacts (both positive and negative) can be observed due to the commercial farming activities. Potential inequalities can be arising from large variations among the population, however, further research would be needed to link these variations to initial socio-economic household characteristics (Savelli et al., 2023).
There is a broader scientific discussion on the (human-induced) conversion of agricultural land into forest, and what the effect is on (downstream) hydrology (Ellison et al., 2012). Some studies see forests as “demanders” of water (through higher evapotranspiration rates) (Malmer et al., 2010; Trabucco et al., 2008), while other see them as “providers” (through moisture transport, higher infiltration and lower soil evaporation) (Ellison et al., 2017; Sheil and Murdiyarso, 2009). In this study, the scenario analysis excludes the scenario area itself from the analysis and focusses on downstream effects of the scenarios, where we do see small differences. As mentioned in the results, soil moisture is higher in the both the communities and forest scenarios compared to commercial farms scenarios, with the communities scenario an increased soil moisture peak during the cropping season. When looking into the hydrological fluxes over the entire catchment, higher canopy evaporation can be observed in the forest scenario, resulting in lower potential evaporation and precipitation reaching the soil. Insignificant differences are observed in groundwater storage and recharge. The model does not take any potential benefits of moisture recycling of forest into account. Keeping the human-drought feedbacks of adoption behaviour in mind, it is difficult to point out what causes the higher soil moisture; the higher uptake of adaptation measures or differences in hydrological fluxes. Future research would be needed for that.
This study presents an evaluation of the effects of commercial export farms in terms of drought hazard and impacts within the Upper Ewaso Ng'iro catchment. The model was calibrated using NSGA-II technique and shows a performance of a KGE score of 0.54 for discharge, and a BR score of 0.63 and 0.62 for crop and milk production, respectively. Compared to the observed data, milk production is underestimated by the model during dry periods.
After calibration, we compared the base scenario, in which commercial farms are present in part of the catchment, to two scenarios where there are agropastoral communities or forests instead of the commercial farms. The analysis shows that in the scenarios where these farms are replaced by forests or communities, drought conditions are minimally affected in terms of soil moisture with a slight increase of up to 0.00025 (averaged over the sub-catchments). Groundwater tables are increased during dry periods with values of up to 1.2 m at the end of the simulation period average of the catchment area. Larger differences are observed downstream of the scenario area, with increased water tables of around 5 m during the 2020/23 drought. Streamflow at the outlet of the catchment is higher in the community scenario (up to 1.5 m3 s−1). This varies in the forest scenario, with both lower and higher in streamflow (between −0.5 and 0.5 m3 s−1), due to higher evaporation leading to lower runoff. These differences in drought conditions are related to lower water abstraction and higher infiltration of communities and forests compared to commercial farms. Downstream communities have slightly shorter distances to household water in the dry season (−2.5 % for agents near a river and −2 % for agents not located near a river) and minimal differences in crop production in times of drought (average up to +0.25 %). Milk production is minimally affected throughout the simulation period, although agents located at river see more change in the forest and communities scenario (ranging from −2 % to 2 % for agents at river, and −0.5 % and −0.5 % for agents not located at river). Differences in drought impacts among the different scenarios are on average over the agent population, however, low in comparison to the effect of drought itself. Nevertheless, large variations in drought impacts are observed among the agents population itself. In the forest and community scenarios, differences among the population (5th to 95th percentile), compared to the commercial farms scenario, range from −18.3 % to +10.7 % and −16.7 % and 5.7 % for crop production, −28 % to +25 % and −91 % and +910 % for milk production, −5 % to +13 % and −100 % and 4330 % for distance to water, respectively. These findings suggest that the impacts of the commercial farming activities are locally variable.
Future research can explore different actors that may influence drought impact of communities, and improve on longitudinal adaption behaviour data collection for model validation purposes. Furthermore, including moisture recycling feedbacks into these types of modelling frameworks would allow to assess the effect of forest or adaptation measures like agroforestry on drought risk more thoroughly. The increase of drought hazard and drought impacts during dry periods, due the commercial farming activities, highlight the need for equitable and sustainable water management practices.
The ADOPT-AP model code is publicly available in GitHub via https://github.com/istreefkerk/ADOPT-AP (last access: 10 April 2026; https://doi.org/10.5281/zenodo.7447665, Streefkerk, 2022). Model input and calibration data are referred to in the manuscript and in the Supplement. Further inquiries can be directed to the corresponding author.
The supplement related to this article is available online at https://doi.org/10.5194/hess-30-2225-2026-supplement.
IS, JB, AL, JA; conceptualization. IS, JB, AL, JA, TS; writing – original draft. IS; methodology and visualization. JB IS: software. TS: formal analysis. JB, AL, JA supervision. RO, KH, OW, investigation. KH, RO, OW: writing – reviewing & editing.
The contact author has declared that none of the authors has any competing interests.
Publisher's note: Copernicus Publications remains neutral with regard to jurisdictional claims made in the text, published maps, institutional affiliations, or any other geographical representation in this paper. The authors bear the ultimate responsibility for providing appropriate place names. Views expressed in the text are those of the authors and do not necessarily reflect the views of the publisher.
This article is part of the special issue “Drought, society, and ecosystems (NHESS/BG/GC/HESS inter-journal SI)”. It is not associated with a conference.
We would like to thank several people cooperating and contributing to this research. Firstly, Merel Mattijssen did her MSc thesis on the topic, and helped in the understanding of the drought impacts on agropastoral communities. Secondly, we would like to thank Timaflor for talking with us about the operations on the flower farm. Thirdly, thank you to Andrés Quichimbo for answering questions on the DRYP model. Lastly, we would like to thank research assistants, community members and officials for participating and contributing to this research. The project has been funded by the European Commission as part of EU Horizon 2020 under DOWN2EARTH project (Grand Agreement ID: 869550) and the ERC Coastmove project no. 8844442.
This research has been supported by the European Commission, EU Horizon 2020 Framework Programme (grant no. 869550) and the European Commission, European Research Council (grant no. 8844442).
This paper was edited by Loes van Schaik and reviewed by Maurits Ertsen and one anonymous referee.
Aerts, J. C.:. Integrating agent-based approaches with flood risk models: A review and perspective, Water Security, 11, 100076, https://doi.org/10.1016/j.wasec.2020.100076, 2020.
Aeschbacher, J., Liniger, H., and Weingartner, R.: River water shortage in a highland-lowland system: A case study of the impacts of water abstraction in the Mount Kenya region, Mt. Res. Dev., 155–162, 2005.
Alam, M. F., McClain, M., Sikka, A., and Pande, S.: Understanding human–water feedbacks of interventions in agricultural systems with agent based models: A review, Environ. Res. Lett., 17, 103003, https://doi.org/10.1088/1748-9326/ac91e1, 2022.
Allen, R. G., Pereira, L. S., Raes, D., and Smith, M.: Crop evapotranspiration-Guidelines for computing crop water requirements-FAO Irrigation and drainage paper 56, Fao, Rome, 300(9), D05109, https://www.fao.org/4/x0490e/x0490e00.htm (last acceess: 8 April 2026), 1998.
Baldwin, E., Washington-Ottombre, C., Dell'Angelo, J., Cole, D., and Evans, T.: Polycentric Governance and Irrigation Reform in Kenya, Governance, 29, 207–225, https://doi.org/10.1111/gove.12160, 2016.
Bubeck, P., Berghäuser, L., Hudson, P., and Thieken, A. H.: Using panel data to understand the dynamics of human behavior in response to flooding, Risk Anal., 40, 2340–2359, https://doi.org/10.1111/risa.13548, 2020.
Busker, T., de Moel, H., van den Hurk, B., and Aerts, J. C.: Impact-based seasonal rainfall forecasting to trigger early action for droughts, Sci. Total Environ., 898, 165506, https://doi.org/10.1016/j.scitotenv.2023.165506, 2023.
Castilla-Rho, J. C., Mariethoz, G., Rojas, R., Andersen, M. S., and Kelly, B. F.: An agent-based platform for simulating complex human–aquifer interactions in managed groundwater systems, Environ. Modell. Softw., 73, 305-323, https://doi.org/10.1016/j.envsoft.2015.08.018, 2015.
Cavanaugh, J. E. and Neath, A. A.: The Akaike information criterion: Background, derivation, properties, application, interpretation, and refinements, WIREs Computational Statistics, 11, e1460, https://doi.org/10.1002/wics.1460, 2019.
Chiarelli, D. D., D'Odorico, P., Müller, M. F., Mueller, N. D., Davis, K. F., Dell'Angelo, J., Penny, G. and Rulli, M. C.: Competition for water induced by transnational land acquisitions for agriculture, Nat. Commun., 13, 505, https://doi.org/10.1038/s41467-022-28077-2, 2022.
Dalin, C., Wada, Y., Kastner, T., and Puma, M. J.: Groundwater depletion embedded in international food trade, Nature, 543, 700–704, https://doi.org/10.1038/nature21403, 2017.
Deb, K., Pratap, A., Agarwal, S., and Meyarivan, T. A. M. T.: A fast and elitist multiobjective genetic algorithm: NSGA-II, IEEE T. Evolut. Comput., 6, 182–197, 2002.
de Bruijn, J. A., Smilovic, M., Burek, P., Guillaumot, L., Wada, Y., and Aerts, J. C. J. H.: GEB v0.1: a large-scale agent-based socio-hydrological model – simulating 10 million individual farming households in a fully distributed hydrological model, Geosci. Model Dev., 16, 2437–2454, https://doi.org/10.5194/gmd-16-2437-2023, 2023.
De Graaf, I. E. M., Van Beek, L. P. H., Wada, Y., and Bierkens, M. F. P.: Dynamic attribution of global water demand to surface water and groundwater resources: Effects of abstractions and return flows on river discharges, Adv. Water Resour., 64, 21–33, https://doi.org/10.1016/j.advwatres.2013.12.002, 2014.
de Hoog, J:. Handbook for modern greenhouse rose cultivation, Applied Plant Research, https://edepot.wur.nl/408821 (last access: 8 April 2026), 2001.
Dell'Angelo, J., McCord, P. F., Gower, D., Carpenter, S., Caylor, K. K., and Evans, T. P.: Community water governance on Mount Kenya: an assessment based on Ostrom's design principles of natural resource management, Mt. Res. Dev., 36, 102–115, https://doi.org/10.1659/MRD-JOURNAL-D-15-00040.1, 2016.
De Wit, M.: Improved decision-making on irrigation farming in arid zones using a system dynamics model, S. Afr. J. Sci., 109, 1–8, https://doi.org/10.1590/sajs.2013/20130191, 2013.
Di Baldassarre, G., Viglione, A., Carr, G., Kuil, L., Salinas, J. L., and Blöschl, G.: Socio-hydrology: conceptualising human-flood interactions, Hydrol. Earth Syst. Sci., 17, 3295–3303, https://doi.org/10.5194/hess-17-3295-2013, 2013.
Ellison, D., Futter, M. N., and Bishop, K.: On the forest cover–water yield debate: from demand-to supply-side thinking, Glob. Change Biol., 18, 806–820, https://doi.org/10.1111/j.1365-2486.2011.02589.x, 2012.
Ellison, D., Morris, C. E., Locatelli, B., Sheil, D., Cohen, J., Murdiyarso, D., Gutierrez, V., Van Noordwijk, M., Creed, I.F., Pokorny, J., Gaveau, D., Spracklen, D.V., Bargués Tobella, A., Ilstedt, U., Teuling, A. J., Gebrehiwot, S. G., Sands D. C., Muys, B., Verbist, B., Springgay, E., Sugandi, Y., and Sullivan, C. A.: Trees, forests and water: Cool insights for a hot world, Global Environ. Chang., 43, 51–61, https://doi.org/10.1016/j.gloenvcha.2017.01.002, 2017.
Fortin, F. A., De Rainville, F. M., Gardner, M. A. G., Parizeau, M., and Gagné, C.: DEAP: Evolutionary algorithms made easy, J. Mach. Learn. Res., 13, 2171–2175, 2012.
Gaye, C. B. and Tindimugaya, C.: Challenges and opportunities for sustainable groundwater management in Africa, Hydrogeol. J., 27, 1099–1110, https://doi.org/10.1007/s10040-018-1892-1, 2019.
Gebrehiwot, T. and van der Veen, A.: Farmers' drought experience, risk perceptions, and behavioural intentions for adaptation: Evidence from Ethiopia, Clim. Dev., 13, 493–502, https://doi.org/10.1080/17565529.2020.1806776, 2021.
Gichuki, F. N.: Water scarcity and conflicts: A case study of the Upper Ewaso Ng'iro North Basin. The changing face of irrigation in Kenya: Opportunities for anticipating change in eastern and southern Africa, 113–134, https://hdl.handle.net/10568/37008 (last access: 8 April 2026), 2002.
Giger, M., Reys, A., Anseeuw, W., Mutea, E., and Kiteme, B.: Smallholders' livelihoods in the presence of commercial farms in central Kenya, J. Rural Stud., 96, 343–357, https://doi.org/10.1016/j.jrurstud.2022.11.004, 2022.
Hailegiorgis, A., Crooks, A., and Cioffi-Revilla, C.: An agent-based model of rural households' adaptation to climate change, J. Artific. Soc. Soc. Simul., 21, 3812, https://doi/10.18564/jasss.3812, 2018.
Hogeboom, R. H., van Oel, P. R., Krol, M. S., and Booij, M. J.: Modelling the influence of groundwater abstractions on the water level of Lake Naivasha, Kenya under data-scarce conditions, Water Resour. Manag., 29, 4447–4463, https://doi/10.1007/s11269-015-1069-9, 2015.
Iacob, O., Brown, I., and Rowan, J.: Natural flood management, land use and climate change trade-offs: the case of Tarland catchment, Scotland, Hydrolog. Sci. J.,. 62, 1931–1948, https://doi.org/10.1080/02626667.2017.1366657, 2017.
Jeptum, I., Mati, B. M., Gathenya, J. M., and Thomas, M.: Effects of water abstraction on Burguret flows, Kenya, American Journal of Water Resources, 6, 189–202, http://pubs.sciepub.com/ajwr/6/5/2 (last access: 8 April 2026), 2018.
Jodlowski, M., Winter-Nelson, A., Baylis, K., and Goldsmith, P. D.: Milk in the data: food security impacts from a livestock field experiment in Zambia, World Dev., 77, 99–114, https://doi.org/10.1016/j.worlddev.2015.08.009, 2016.
Kader, M. A., Singha, A., Begum, M. A., Jewel, A., Khan, F. H., and Khan, N. I.: Mulching as water-saving technique in dryland agriculture, Bulletin of the National Research Centre, 43, 1–6, https://doi.org/10.1186/s42269-019-0186-7, 2019.
Kalthof, M. W. M. L., de Bruijn, J., de Moel, H., Kreibich, H., and Aerts, J. C. J. H.: Adaptive behavior of farmers under consecutive droughts results in more vulnerable farmers: a large-scale agent-based modeling analysis in the Bhima basin, India, Nat. Hazards Earth Syst. Sci., 25, 1013–1035, https://doi.org/10.5194/nhess-25-1013-2025, 2025.
Kentainers: Kentank, https://kentainers.co.ke/shop (last access: 8 April 2026) 2024.
Kenyaseed: Kenya Seed Company Limited, https://kenyaseed.com/ (last access: 8 April 2026), 2024.
Kergoat, L.: A model for hydrological equilibrium of leaf area index on a global scale, J. Hydrol., 212, 268–286, 1998.
King, J. M.: Livestock water needs in pastoral Africa in relation to climate and forage, International Livestock Centre for Africa, https://hdl.handle.net/10568/4673 (last access: 8 April 2026), 1983.
Kiteme, B., Breu, T., Bastide, J., Eckert, S., Fischer, M., González-Rojí, S. J., Hergarten, C., Hurni, K., Messmer, M., Raible, C. C., Snethlage, M., Stocker, T. F., Torre-Marin Rando, A., and Wiesmann, U.: Towards sustainable futures for nature and people: An appraisal report for the Mt. Kenya–Ewaso Ng'iro North landscape, Kenya. Wyss Academy Report 2, Wyss Academy for Nature, Bern, Switzerland, https://doi.org/10.48350/161382, 2021.
Kling, H., Fuchs, M., and Paulin, M.: Runoff conditions in the upper Danube basin under an ensemble of climate change scenarios, J. Hydrol., 424, 264–277, https://doi.org/10.1016/j.jhydrol.2012.01.011, 2012.
KNBS: National Platform for Food Security and Nutrition, https://nipfn.knbs.or.ke/nipfndashboard/ (last access: 8 April 2026), 2024.
Lanari, N., Schuler, R., Kohler, T., and Liniger, H.: The impact of commercial horticulture on river water resources in the Upper Ewaso Ng'iro River Basin, Kenya, Mt. Res. Dev., 38, 114–124, https://doi.org/10.1659/MRD-JOURNAL-D-16-00135, 2018.
Lesrima, S., Nyamasyo, G., and Karatu, K.: Constraints in water access in Laikipia County, case of Ewaso Ng'iro River Basin in Kenya, East African Journal of Science, Technology and Innovation, 2, https://doi.org/10.37425/eajsti.v2i2.199, 2021.
Lopez, S.: Non-linear functions in animal nutrition. In Mathematical modelling in animal nutrition, Wallingford UK: CABI, 47–88, https://doi.org/10.1079/9781845933548.0047, 2008.
Maddux, J. E. and Rogers, R.W.: Protection motivation and self-efficacy: a revised theory of fear appeals and attitude change, J. Exp. Soc. Psychol., 19, 469–479, https://doi.org/10.1016/0022-1031(83)90023-9, 1983.
Malmer, A., Murdiyarso, D., Bruijnzeel, L. A., and Ilstedt, U.: Carbon sequestration in tropical forests and water: a critical look at the basis for commonly used generalizations, Glob. Change Biol., 16, 599–604, https://doi.org/10.1111/j.1365-2486.2009.01984.x, 2010.
Martínez-Valderrama, J., Gartzia, R., Olcina, J., Guirado, E., Ibáñez, J., and Maestre, F. T.: Uberizing Agriculture in Drylands: A Few Enriched, Everyone Endangered, Water Resour. Manag., 38, 193–214, https://doi.org/10.1007/s11269-023-03663-1, 2024.
McEvoy, D. J., Roj, S., Dunkerly, C., McGraw, D., Huntington, J. L., Hobbins, M. T., and Ott, T.: Validation and Bias Correction of Forecast Reference Evapotranspiration for Agricultural Applications in Nevada. J. Water Res. Plan. Man., 148, https://doi.org/10.1061/(asce)wr.1943-5452.0001595, 2022.
Mekonnen, M. M., Hoekstra, A. Y., and Becht, R.: Mitigating the water footprint of export cut flowers from the Lake Naivasha Basin, Kenya, Water Resour. Manag., 26, 3725–3742, https://doi.org/10.1007/s11269-012-0099-9, 2012.
Mena-Vásconez, P.: Flowers, powers, and water flows: conflicts over Irrigation Water and Rose Farming in the Ecuadorian Andes, PhD dissertation, Wageningen University and Research, https://doi.org/10.18174/510268, 2020.
Mena-Vásconez, P., Boelens, R., and Vos, J.: Food or flowers? Contested transformations of community food security and water use priorities under new legal and market regimes in Ecuador's highlands, J. Rural Stud., 44, 227–238, https://doi.org/10.1016/j.jrurstud.2016.02.011, 2016.
Michaelis, T., Brandimarte, L., and Mazzoleni, M.: Capturing flood-risk dynamics with a coupled agent-based and hydraulic modelling framework, Hydrolog. Sci. J., 65, 1458–1473, https://doi.org/10.1080/02626667.2020.1750617, 2020.
Mkutu, K. and Mdee, A.: Conservancies, Conflict and Dispossession: The Winners and Losers of Oil Exploration in Turkana, Kenya, Afr. Stud. Rev., 63, 831–857, https://doi.org/10.1017/asr.2020.2, 2020.
Moradzadeh, M. and Ahmadi, M.: Unraveling the interplay of human decisions and flood risk: An agent-based modeling approach, Int. J. Disast. Risk Re., 107, 104486, https://doi.org/10.1016/j.ijdrr.2024.104486, 2024.
Müller, B., Bohn, F., Dreßler, G., Groeneveld, J., Klassert, C., Martin, R., Schlüter, M., Schulze, J., Weise, H., and Schwarz, N.: Describing human decisions in agent-based models–ODD+D, an extension of the ODD protocol, Environ. Model. Softw. 48, 37–48. https://doi.org/10.1016/j.envsoft.2013.06.003, 2013.
Mulwa, F., Li, Z., and Fangninou, F. F.: Water scarcity in Kenya: current status, challenges and future solutions, Open Access Library Journal, 8, 1–15, https://doi.org/10.4236/oalib.1107096, 2021.
Mungai, D. N., Ong, C. K., Kiteme, B., Elkaduwa, W., and Sakthivadivel, R.: Lessons from two long-term hydrological studies in Kenya and Sri Lanka, Agriculture, Ecosystems and Environment, 104, 135–143, https://doi.org/10.1016/j.agee.2004.01.011, 2004.
Mutiga, J. K., Mavengano, S. T., Zhongbo, S., Woldai, T., and Becht, R.: Water allocation as a planning tool to minimise water use conflicts in the Upper Ewaso Ng'iro North Basin, Kenya, Water Resour. Manag., 24, 3939–3959, https://doi.org/10.1007/s11269-010-9641-9, 2010.
Mwangi, H. M., Julich, S., Patil, S. D., McDonald, M. A., and Feger, K. H.: Modelling the impact of agroforestry on hydrology of Mara River Basin in East Africa, Hydrol. Process., 30, 3139–3155, https://doi.org/10.1002/hyp.10852, 2016.
Mwaura, S. N. A. A., Maina Kariuki, I., Kiprop, S., Muluvi, A. S., Obare, G., and Kiteme, B.: The impacts of community-based water development projects on rural poverty among small-holder farmers: Evidence from the Ewaso Ng'iro North Catchment Area, Kenya, Cogent Economics and Finance, 9, 1882763, https://doi.org/10.1080/23322039.2021.1882763, 2021.
Ngigi, S. N., Savenije, H. H., and Gichuki, F. N.: Hydrological impacts of flood storage and management on irrigation water abstraction in upper Ewaso Ng'iro river basin, Kenya, Water Resour. Manag., 22, 1859–1879, https://doi.org/10.1007/s11269-008-9257-5, 2008.
NDMA: County Early Warning Bullitins, http://knowledgeweb.ndma.go.ke/Public/Resources/CountyBulletins.aspx?ID=11 (last access: 22 February 2023), 2023.
Nyariki, D. M. and Amwata, D. A.: The value of pastoralism in Kenya: Application of total economic value approach, Pastoralism, 9, https://doi.org/10.1186/s13570-019-0144-x, 2019.
Oageng, I. and Mmopelwa, G. P.: Water consumption patterns in a rural setting in Ngamiland district, Botswana: the case of Boro village, J. Water Sanit. Hyg. De., 4, 720–726, https://doi.org/10.2166/washdev.2014.065, 2014.
Odongo, R. A., De Moel, H., Wens, M., Coumou, D., Limones, N., Otieno, V., and Van Loon, A. F.: From indices to impacts using environmental and socio-economic clustering in Kenya, J. Hydrol.: Regional Studies, 58, 102269, https://doi.org/10.1016/j.ejrh.2025.102269, 2025a.
Odongo, R. A., de Moel, H., Wens, M., and Van Loon, A.: Probabilistic modelling of drought impacts and current risk in Kenya, Authorea Preprints, https://doi.org/10.22541/essoar.173712590.09774016/v1, 2025b.
Odongo, R. A., Schrieks, T., Streefkerk, I., de Moel, H., Busker, T., Haer, T., Macleod, D., Michaelides, K., Singer, M., Assen, M., Otieno, G., and Van Loon, A. F.: Drought impacts and community adaptation: Perspectives on the 2020–2023 drought in East Africa, Int. J. Disast. Risk Re., 119, 105309, https://doi.org/10.1016/j.ijdrr.2025.105309, 2025c.
Otte, M. J. and Chilonda, P.: Cattle and small ruminant production systems in sub-Saharan Africa. A systematic review, https://openknowledge.fao.org/server/api/core/bitstreams/a20fe6e8-1c70-4eca-9f8f-6ba84ece1879/content (last access: 8 April 2026), 2002.
Pande, S. and Savenije, H. H.: A sociohydrological model for smallholder farmers in Maharashtra, India, Water Resour. Res., 52, 1923–1947, https://doi.org/10.1002/2015WR017841, 2016.
Perrone, D. and Jasechko, S.: Dry groundwater wells in the western United States, Environ. Res. Lett., 12, 104002, https://doi.org/10.1088/1748-9326/aa8ac0, 2017.
Peter, M. N., Bukachi, S. A., Olungah, C. O., and Haller, T.: Opportunities and challenges in export horticulture as an agro-industrial food system: case study of Northwest Mount Kenya region, International Journal on Food System Dynamics, 9, 470–483, https://doi.org/10.18461/ijfsd.v9i5.957, 2018.
Piemontese, L., Terzi, S., Di Baldassarre, G., Menestrey Schwieger, D. A., Castelli, G., and Bresci, E.: Over-reliance on water infrastructure can hinder climate resilience in pastoral drylands, Nat. Clim. Change, 14, 267–274, https://doi.org/10.1038/s41558-024-01929-z, 2024.
Pörtner, H. O., Roberts, D. C., Tignor M., Poloczanska, E.S., Mintenbeck, K., Alegría, A., Craig, M., Langsdorf, S., Löschke, S., Möller, V., Okem, A., and Rama, B. (Eds.): Climate change 2022: impacts, adaptation and vulnerability, Cambridge University Press, https://doi.org/10.1017/9781009325844, 2022.
Quichimbo, E. A., Singer, M. B., Michaelides, K., Hobley, D. E. J., Rosolem, R., and Cuthbert, M. O.: DRYP 1.0: a parsimonious hydrological model of DRYland Partitioning of the water balance, Geosci. Model Dev., 14, 6893–6917, https://doi.org/10.5194/gmd-14-6893-2021, 2021.
Quichimbo, E. A., Singer, M. B., Michaelides, K., Rosolem, R., MacLeod, D. A., Asfaw, D. T., and Cuthbert, M. O.: Assessing the sensitivity of modelled water partitioning to global precipitation datasets in a data-scarce dryland region, Hydrol. Process., 37, e15047, https://doi.org/10.1002/hyp.15047, 2023.
Quichimbo, E. A., Singer, M. B., Michaelides, K., and Cuthbert, M. O.: DRYP 2.0: A hydrological model for local and regional scale across aridity gradients, EGUsphere [preprint], https://doi.org/10.5194/egusphere-2025-5316, 2025.
Rafiei Emam, A., Kappas, M., Akhavan, S., Hosseini, S. Z., and Abbaspour, K. C.: Estimation of groundwater recharge and its relation to land degradation: case study of a semi-arid river basin in Iran, Environ. Earth Sci., 74, 6791–6803, https://doi.org/10.1007/s12665-015-4674-2, 2015.
Reckien, D., Magnan, A. K., Singh, C., Lukas-Sithole, M., Orlove, B., Schipper, E. L. F., and Coughlan de Perez, E.: Navigating the continuum between adaptation and maladaptation, Nat. Clim. Change, 1–12, https://doi.org/10.1038/s41558-023-01774-6, 2023.
ReliefWeb: Kenya 2022 Drought Response in Review, https://reliefweb.int/report/kenya/kenya-2022-drought-response- review (last access: 8 April 2026), 2023.
Sarkar, A.: Sustaining livelihoods in face of groundwater depletion: a case study of Punjab, India, Environ. Dev. Sustain., 14, 183–195, https://doi.org/10.1007/s10668-011-9315-7, 2012.
Savelli, E., Mazzoleni, M., Di Baldassarre, G., Cloke, H., and Rusca, M.: Urban water crises driven by elites' unsustainable consumption, Nat. Sustain., 6, 929–940, https://doi.org/10.1038/s41893-023-01100-0, 2023.
Schrieks, T., Botzen, W. W., Haer, T., Wasonga, O. V., and Aerts, J. C.: Assessing key behavioural theories of drought risk adaptation: Evidence from rural Kenya, Risk Anal., 44, 1681–1699, https://doi.org/10.1111/risa.14266, 2023.
Schrieks, T., Botzen, W. J., Haer, T., and Aerts, J. C. J. H.: Drought risk attitudes in pastoral and agro-pastoral communities in Kenya, J. Behav. Exp. Econ., 108, 102143, https://doi.org/10.1016/j.socec.2023.102143, 2024.
Sheil, D. and Murdiyarso, D: How forests attract rain: an examination of a new hypothesis, Bioscience, 59, 341–347, https://doi.org/10.1525/bio.2009.59.4.12, 2009.
Shen, H., Tolson, B. A., and Mai, J.: Time to update the split-sample approach in hydrological model calibration, Water Resour. Res., 58, e2021WR031523, https://doi.org/10.1029/2021WR031523, 2022.
Siebert, S. and Döll, P.: Quantifying blue and green virtual water contents in global crop production as well as potential production losses without irrigation, J. Hydrol., 384, 198–217, https://doi.org/10.1016/j.jhydrol.2009.07.031, 2010.
Solomon, N., Birhane, E., Gordon, C., Haile, M., Taheri, F., Azadi, H., and Scheffran, J.: Environmental impacts and causes of conflict in the Horn of Africa: A review, Earth-Sci. Rev., 177, 284–290, https://doi.org/10.1016/j.earscirev.2017.11.016, 2018.
Streefkerk, I. N.: istreefkerk/ADOPT-AP: Release of ADOPT-AP (v0.1), Zenodo [code], https://doi.org/10.5281/zenodo.7447665, 2022.
Streefkerk, I. N., de Bruijn, J., Haer, T., Van Loon, A. F., Quichimbo, E. A., Wens, M., Hassaballah, K., and Aerts, J. C.: A coupled agent-based model to analyse human-drought feedbacks for agropastoralists in dryland regions, Frontiers in Water, 4, https://doi.org/10.3389/frwa.2022.1037971, 2023.
Switzman, H., Coulibaly, P., and Adeel, Z.: Modeling the impacts of dryland agricultural reclamation on groundwater resources in Northern Egypt using sparse data, J. Hydrol., 520, 420–438, https://doi.org/10.1016/j.jhydrol.2014.10.064, 2015.
Tegemeo Institute: Tegemeo Agricultural Policy Research Analysis (TAPRA) Project–Household Survey 2010, Nairobi: Tegemeo Institute, https://tegemeo.egerton.ac.ke/images/_tegemeo_institute/downloads/data/2010_surveydocumentation.pdf (last access: 8 April 2026), 2010.
Trabucco, A., Zomer, R. J., Bossio, D. A., van Straaten, O., and Verchot, L. V.: Climate change mitigation through afforestation/reforestation: a global analysis of hydrologic impacts with four case studies, Agriculture, Ecosystems and Environment, 126, 81–97, https://doi.org/10.1016/j.agee.2008.01.015, 2008.
Van Duinen, R., Filatova, T., Geurts, P., and Veen, A. V. D.: Empirical analysis of farmers' drought risk perception: Objective factors, personal circumstances, and social influence, Risk Anal., 35, 741–755, https://doi.org/10.1111/risa.12299, 2015.
Van Loon, A. F., Gleeson, T., Clark, J., Van Dijk, A. I., Stahl, K., Hannaford, J., Di Baldassarre, G., Teuling, A. J., Tallaksen, L. M., Uijlenhoet, R., Hannah, D. M., Sheffield, J., Svoboda, M., Verbeiren, B., Wagener, T., Rangecroft, S., Wanders, N., and Van Lanen, H. A.: Drought in the Anthropocene, Nat. Geosci., 9, 89–91, https://doi.org/10.1038/ngeo2646, 2016.
Van Oel, P. R., Martins, E. S., Costa, A. C., Wanders, N., and Van Lanen, H. A.: Diagnosing drought using the downstreamness concept: the effect of reservoir networks on drought evolution, Hydrolog. Sci. J., 63, 979–990, https://doi.org/10.1080/02626667.2018.1470632, 2018.
Veldkamp, T. I. E., Wada, Y., Aerts, J. C. J. H., Döll, P., Gosling, S. N., Liu, J., Liu, J., Masaki, Y., Oki, T., Ostberg, S., Pokhrel, Y., Satoh, K. H., and Ward, P. J.: Water scarcity hotspots travel downstream due to human interventions in the 20th and 21st century, Nat. Commun., 8, 1–12, https://doi.org/10.1038/ncomms15697, 2017.
Wada, Y., Wisser, D., and Bierkens, M. F. P.: Global modeling of withdrawal, allocation and consumptive use of surface water and groundwater resources, Earth Syst. Dynam., 5, 15–40, https://doi.org/10.5194/esd-5-15-2014, 2014.
Wamucii, C. N., Teuling, A. J., Ligtenberg, A., Gathenya, J. M., and van Oel, P. R.: Human influence on water availability variations in the upper Ewaso Ng'iro river basin, Kenya, J. Hydrol.: Regional Studies, 47, 101432, https://doi.org/10.1016/j.ejrh.2023.101432, 2023.
Wens, M. L., Mwangi, M. N., van Loon, A. F., and Aerts, J. C.: Complexities of drought adaptive behaviour: Linking theory to data on smallholder farmer adaptation decisions, Int. J. Disast. Risk Re., 63, 102435, https://doi.org/10.1016/j.ijdrr.2021.102435, 2021.
Wens, M., Veldkamp, T. I., Mwangi, M., Johnson, J. M., Lasage, R., Haer, T., and Aerts, J. C.: Simulating small-scale agricultural adaptation decisions in response to drought risk: an empirical agent-based model for semi-arid Kenya, Frontiers in Water, 2, 15, https://doi.org/10.3389/frwa.2020.00015, 2020.
Wens, M. L. K., van Loon, A. F., Veldkamp, T. I. E., and Aerts, J. C. J. H.: Education, financial aid, and awareness can reduce smallholder farmers' vulnerability to drought under climate change, Nat. Hazards Earth Syst. Sci., 22, 1201–1232, https://doi.org/10.5194/nhess-22-1201-2022, 2022.
Wiesmann, U., Gichuki, F. N., Kiteme, B. P., and Liniger, H.: Mitigating conflicts over scarce water resources in the highland-lowland system of Mount Kenya, Mt. Res. Dev., 20, 10–15, 2000.
WOCAT: Global Database on Sustainable Land Management, https://wocat.net/en/database/ (last access: 8 April 2026), 2024.
Woldeyohannes, M.: Environmental regulation of commercial flower production in Ethiopia, PhD dissertation, University of Warwick, https://wrap.warwick.ac.uk/95268/ (last access: 8 April 2026), 2016.