the Creative Commons Attribution 4.0 License.
the Creative Commons Attribution 4.0 License.
 | 14 Apr 2026
Temporal inhomogeneities in high-resolution gridded precipitation products for the southeastern United States
Jeremy E. Diem
High-resolution gridded precipitation products are widely used in hydroclimatic analyses, yet their temporal stability has not been comprehensively evaluated. This study assesses temporal inhomogeneities in six datasets – Daymet, gridMET, nClimGrid, PRISM AN (All Networks), PRISM LT (Long Term), and TerraClimate – across the southeastern United States during 1980–2024. Annual precipitation totals derived from monthly and daily products were compared with a regional reference time series constructed from 120 U.S. Cooperative Observer Program (COOP) gauges. Residual-mass curves were used to diagnose departures from temporal homogeneity, and split-sample Mann–Whitney U tests identified statistically significant discontinuities. Trend magnitudes were estimated using the nonparametric Kendall–Theil robust line. Significant discontinuities closely aligned with changes in gauge-network composition and documented data-processing procedures. Wetting shifts in Daymet and PRISM AN coincided with rapid expansion of the Community Collaborative Rain, Hail, and Snow (CoCoRaHS) network and declining COOP coverage. Drying biases in nClimGrid and, to a lesser extent, PRISM LT were associated with increasing reliance on Automated Surface Observing System tipping-bucket gauges, which are known to underestimate rainfall. Abrupt step changes in TerraClimate and gridMET corresponded to modifications in input datasets and reprocessing of precipitation forcing fields. The inhomogeneities produced disparate multi-decadal trends ranging from 19 to 48 mm per decade compared with a non-significant reference trend of 30 mm per decade. Two product combinations – Daymet–nClimGrid and Daymet–nClimGrid–PRISM LT – showed no statistically significant discontinuities over 1980–2024 and produced trends within 10 % of the reference trend. These combinations provide homogeneous, temporally consistent datasets for multi-decadal precipitation analyses across the Southeast. Despite a significant but modest discontinuity, PRISM LT remains a viable individual product with appropriate homogenization, although continued declines in COOP coverage warrant caution. Overall, the results demonstrate that unrecognized inhomogeneities in gridded precipitation products can substantially bias trend assessments and underscore the need to evaluate and, when necessary, combine datasets to ensure temporal stability in long-term hydroclimatic studies.
- Article
(9266 KB) - Full-text XML
-
Supplement
(2188 KB) - BibTeX
- EndNote


High-quality, multi-decadal precipitation data are essential for research and decision-making. Such records enable rigorous assessment of variability and long-term trends (New et al., 2001) and provide a robust foundation for model calibration and evaluation (Döll et al., 2016; Tang et al., 2025). Reliable long-term observations also underpin integrated and adaptive management of water resources, supporting sustainable planning for agriculture, ecosystems, and regional development (Yang et al., 2021; Ferencz et al., 2024).
Spatial limitations remain a persistent challenge in precipitation measurement. Although gauge networks provide the foundation for precipitation observation, gauge distribution is often sparse and uneven (Kidd et al., 2017). These deficiencies are most pronounced in complex terrain and other data-sparse regions (Michelon et al., 2021).
To extend coverage beyond existing gauges, gridded precipitation products were developed. These datasets integrate gauge, satellite, and reanalysis information through interpolation or merging algorithms to generate spatially continuous precipitation estimates (Mankin et al., 2025). Gauge-informed products generally provide higher spatial accuracy than those derived solely from remote sensing or reanalysis (Zandler et al., 2019; Muche et al., 2020; De La Fraga et al., 2024; Mankin et al., 2025). However, the limited availability of gauges in complex terrain still constrains accuracy, and many products perform poorly in mountainous regions (Zandler et al., 2019; De La Fraga et al., 2024; Wang and Tian, 2025).
High-resolution gridded precipitation products are particularly well-suited to the needs of the hydrology community, which relies on them more than any other discipline. Gridded precipitation datasets provide the spatially distributed input data required to drive hydrologic models (Livneh et al., 2015; Newman et al., 2015; Shuai et al., 2022). Among many other applications, gridded precipitation products are also employed to quantify basin-scale water balances (Laiti et al., 2018) and to support hydrologic forecasting and management (Mankin et al., 2025).
Despite the widespread use of gridded precipitation products, especially within the hydrology community, the temporal stability of these datasets remains insufficiently evaluated. Apparent long-term trends can be distorted by inhomogeneities – systematic, non-climatic shifts in the statistical properties of a time series (Peterson et al., 1998). Only a handful of studies (e.g., Guentchev et al., 2010; Mizukami and Smith, 2012; McAfee et al., 2014; Ferguson and Mocko, 2017; Henn et al., 2018) have explicitly identified or investigated such inhomogeneities in gridded precipitation products. Accordingly, this study evaluates the temporal stability of multiple high-resolution precipitation datasets across a large, climatically uniform region during 1980–2024. The objectives are to (1) detect and characterize temporal inhomogeneities and the factors contributing to them, (2) quantify biases that influence multi-decadal trends, and (3) determine which individual products or product combinations exhibit the greatest temporal stability for regional trend analyses.
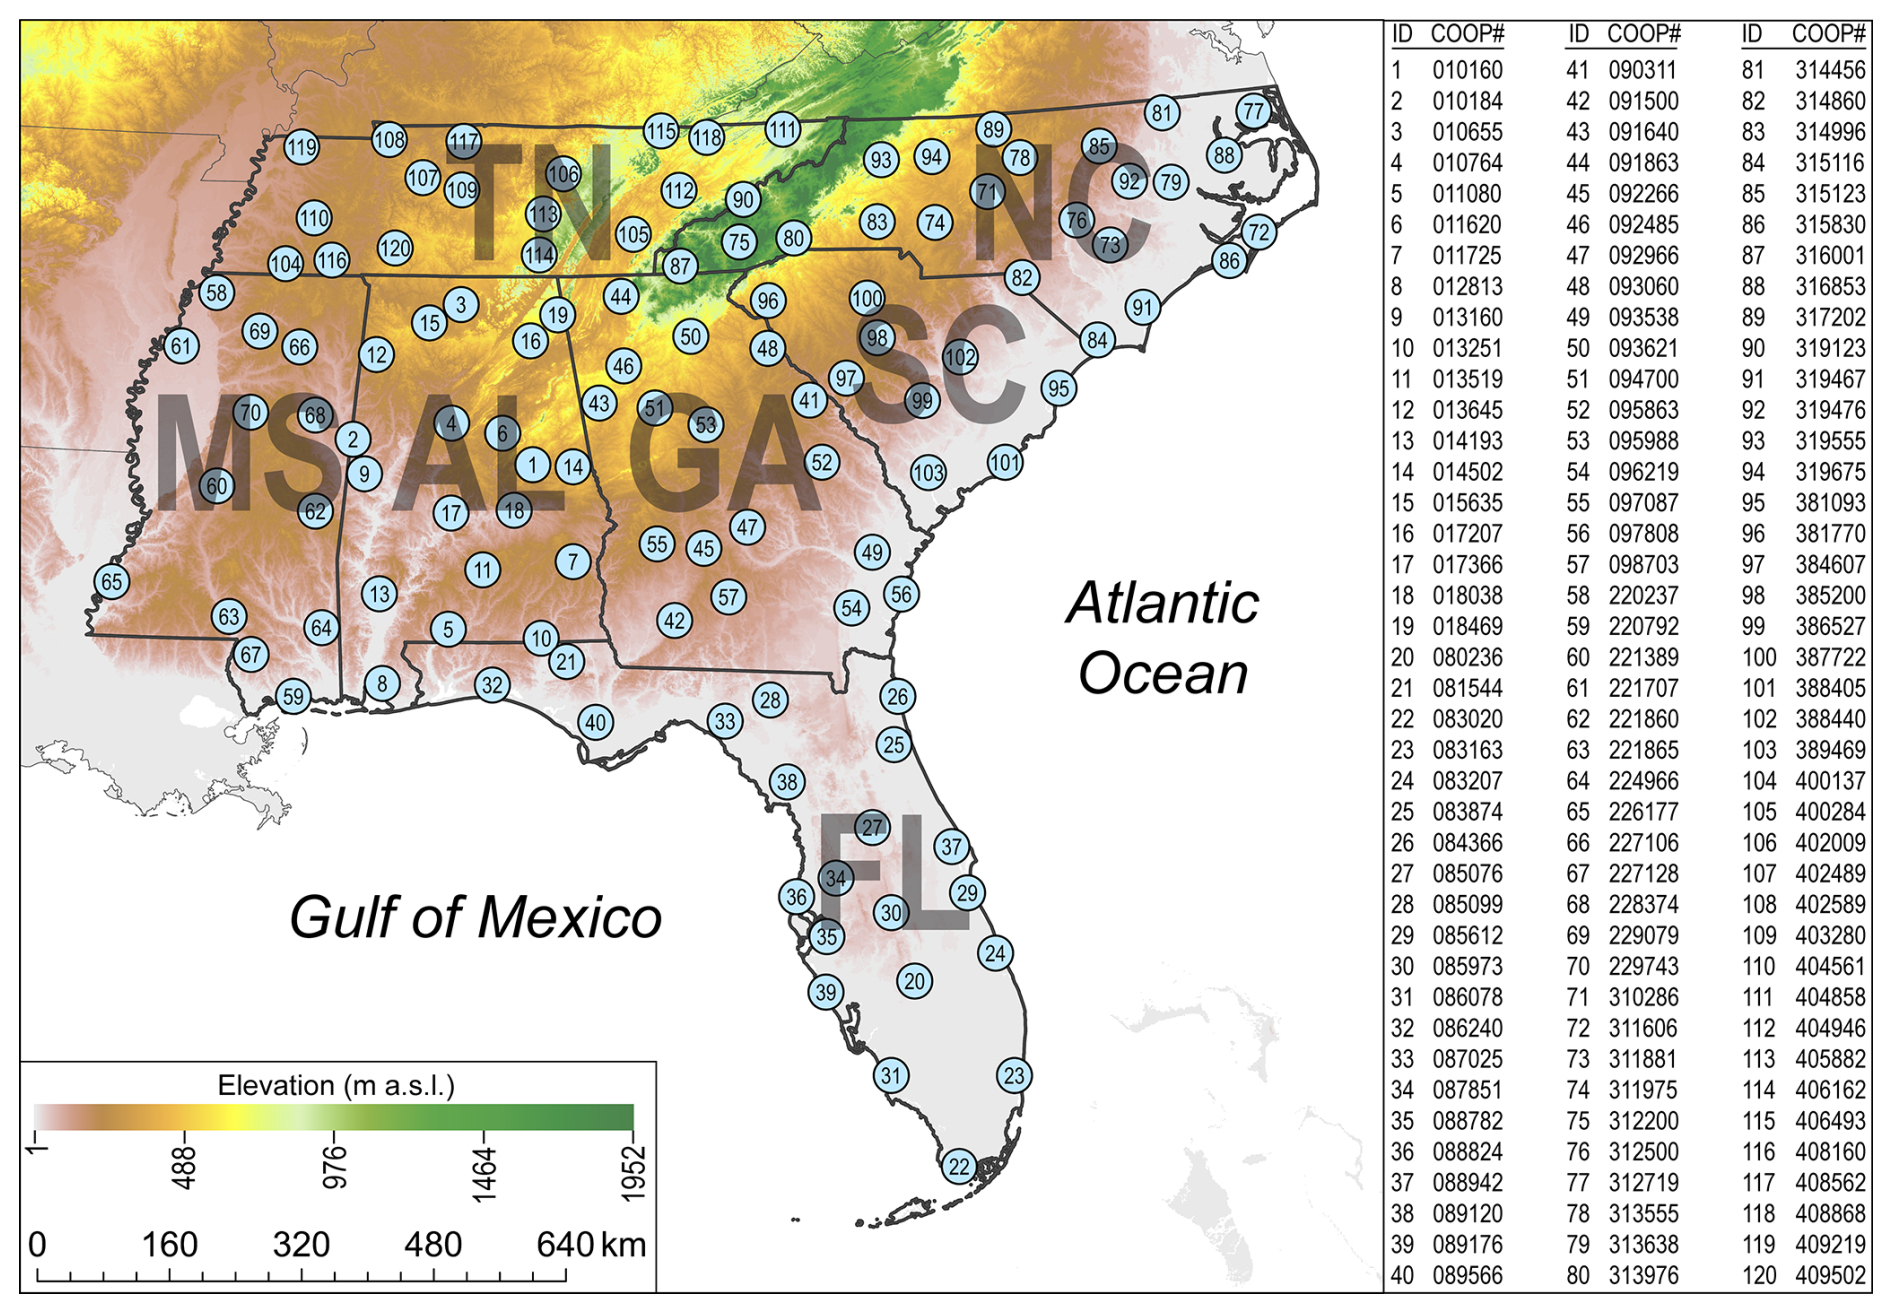
Figure 1Locations of the 120 reference gauges in the southeastern United States. All gauges are part of the U.S. Cooperative Observer Program (COOP). The seven states that comprise the southeastern United States are Alabama (AL), Florida (FL), Georgia (GA), Mississippi (MS), North Carolina (NC), South Carolina (SC), and Tennessee (TN).
This study focuses on the southeastern United States (Fig. 1), encompassing Alabama, Florida, Georgia, Mississippi, North Carolina, South Carolina, and Tennessee, with a total area of approximately 882 000 km2. The Southeast was selected because much of it has a humid subtropical climate – hot summers, mild winters, and high annual precipitation (Kunkel et al., 2013; Labosier and Quiring, 2013) – and includes numerous long-term reference gauges from the U.S. Cooperative Observer Program (COOP), the nation's most consistent climate network (National Research Council, 1998).
Monthly precipitation totals from a dispersed network of 120 COOP gauges across the Southeast during 1980–2024 were used to produce a reference time series (Fig. 1). All gauges had at least 90 % of months with precipitation totals. Only 1.6 % of gauge-months were missing. The missing monthly totals were replaced with the mean total from the three closest gauges. The gauges ranged in elevation from 1 to 668 m a.s.l.; therefore, none of the gauges were located in high-elevation areas. Monthly totals for each gauge were summed to produce annual precipitation values, which were then averaged across all gauges to form the regional reference time series. Although COOP provides the longest regional record, documented observer-related biases indicate that non-climatic variability may persist (Daly et al., 2007).
Precipitation estimates were obtained for 1980–2024 from the following high-resolution gridded products: Daymet, gridMET, nClimGrid, PRISM AN (All Networks), PRISM LT (Long Term), and TerraClimate. Daymet provides daily precipitation estimates for North America at 1 km resolution, with monthly values derived by aggregating daily fields (Thornton et al., 2021). nClimGrid provides daily and monthly precipitation estimates for the conterminous United States at ∼4 km resolution, generated independently using climatologically aided interpolation of station data (Vose et al., 2014). PRISM AN provides daily and monthly precipitation estimates for the United States at 30 arcsec (∼1 km nominal) spatial resolution, generated using station observations integrated with topographic and other spatial predictors (Daly et al., 2008). Because daily PRISM AN data were not available for 1980, annual totals for that year in the series were derived from monthly PRISM precipitation estimates to maintain a complete 1980–2024 record. PRISM LT data are similar to PRISM AN but are available only at monthly time steps and incorporate substantially fewer gauge networks than the AN product, a design choice intended to improve temporal stability for long-term analyses (Daly et al., 2021). gridMET provides daily precipitation estimates for the conterminous United States at ∼4 km resolution, generated by combining high-resolution PRISM climatologies with temporally varying fields from the North American Land Data Assimilation System (NLDAS-2) using the METDATA downscaling method (Abatzoglou, 2013). TerraClimate provides monthly precipitation estimates for the global land surface at ∼4 km resolution, generated by combining WorldClim climatologies with time-varying anomalies derived primarily from the Climatic Research Unit Time Series (CRU TS) and Japanese 55-year Reanalysis (JRA-55) datasets (Abatzoglou et al., 2018). When calculating regional means, which were compared with the mean of the 120 COOP gauges, approximately 2.5 % of grid cells (those exceeding 668 m a.s.l.) were excluded to restrict the analysis to low- and mid-elevation portions of the Southeast and minimize precipitation inaccuracies associated with mountainous areas.
Information on precipitation gauges underlying each gridded product was compiled for 1980–2024. Gauges were classified by network, and spatial coverage was assessed by identifying the 40 km grid cell containing each gauge across the Southeast. For each network, the number of grid cells containing at least one gauge was tallied and divided by the total number of grid cells in the region to calculate percent coverage.
In addition to analyzing each gridded product individually, time series were generated for all possible pairwise and multi-product combinations. Combinations were produced separately for the daily and monthly datasets, with each series calculated as the mean of the contributing products (e.g., Daymet and nClimGrid). At each temporal scale, four products were available, yielding six two-product combinations, four three-product combinations, and one four-product combination, for a total of 11 unique combinations.
3.1 Evaluating Spatial Agreement among Precipitation Products
To evaluate spatial agreement and quantify inter-product differences in annual precipitation totals, several complementary comparative analyses were conducted. All six precipitation products were resampled to a common 1 km spatial resolution to ensure direct cell-by-cell comparability across the southeastern United States. Cell-specific percent differences in mean annual precipitation totals over the 1980–2024 period (45-year mean) were calculated for all pairwise combinations of products (15 total comparisons). These calculations produced spatially explicit surfaces representing the magnitude and direction of inter-product differences. To quantify the overall level of agreement, the percentage of the 879 861 grid cells exhibiting absolute differences within ±5 % was computed for each pairwise comparison.
3.2 Residual-Mass Curves
Residual-mass curves were constructed as a diagnostic of the homogeneity of precipitation time series and combinations of those series. This approach originates from hydrological consistency testing, in which cumulative residuals are plotted over time to reveal systematic deviations (Searcy and Hardison, 1960). In this study, residuals were obtained from linear regressions in which the reference time series served as the predictor and the product time series as the predictand. For a homogeneous record, the cumulative residuals are expected to remain near zero, fluctuating randomly without systematic drift, whereas sustained deviations or changes in slope indicate shifts, biases, or other inconsistencies (Buishand, 1984; Helsel and Hirsch, 2002).
3.3 Testing for Differences
To identify the most significant discontinuity – defined here as an abrupt, non-climatic shift in a time series representing a temporal inhomogeneity – in each product time series, a nonparametric split-sample approach was applied. For each potential breakpoint year, residuals (i.e., observations minus product estimates) before and after that year were compared using the Mann–Whitney U test (α=0.01, two-tailed), with a minimum of eight years required in each group, yielding candidate breakpoints between 1988 and 2017. The Mann–Whitney U test has been shown to be effective for identifying shifts in hydroclimatic time series (Yue and Wang, 2002), and similar split-sample approaches have been applied in climate homogenization studies to test for differences before and after potential discontinuities (Easterling and Peterson, 1995).
3.4 Trend Analyses
Trends in annual precipitation for 1980–2024 were computed for each gridded product and the reference time series. The Kendall–Theil robust line, calculated as the median of the slopes between all pairs of observations (Helsel and Hirsch, 2002), provided a nonparametric estimate of the trend magnitude. The statistical significance of each trend was assessed with Kendall's tau correlation test (α=0.01, one-tailed).
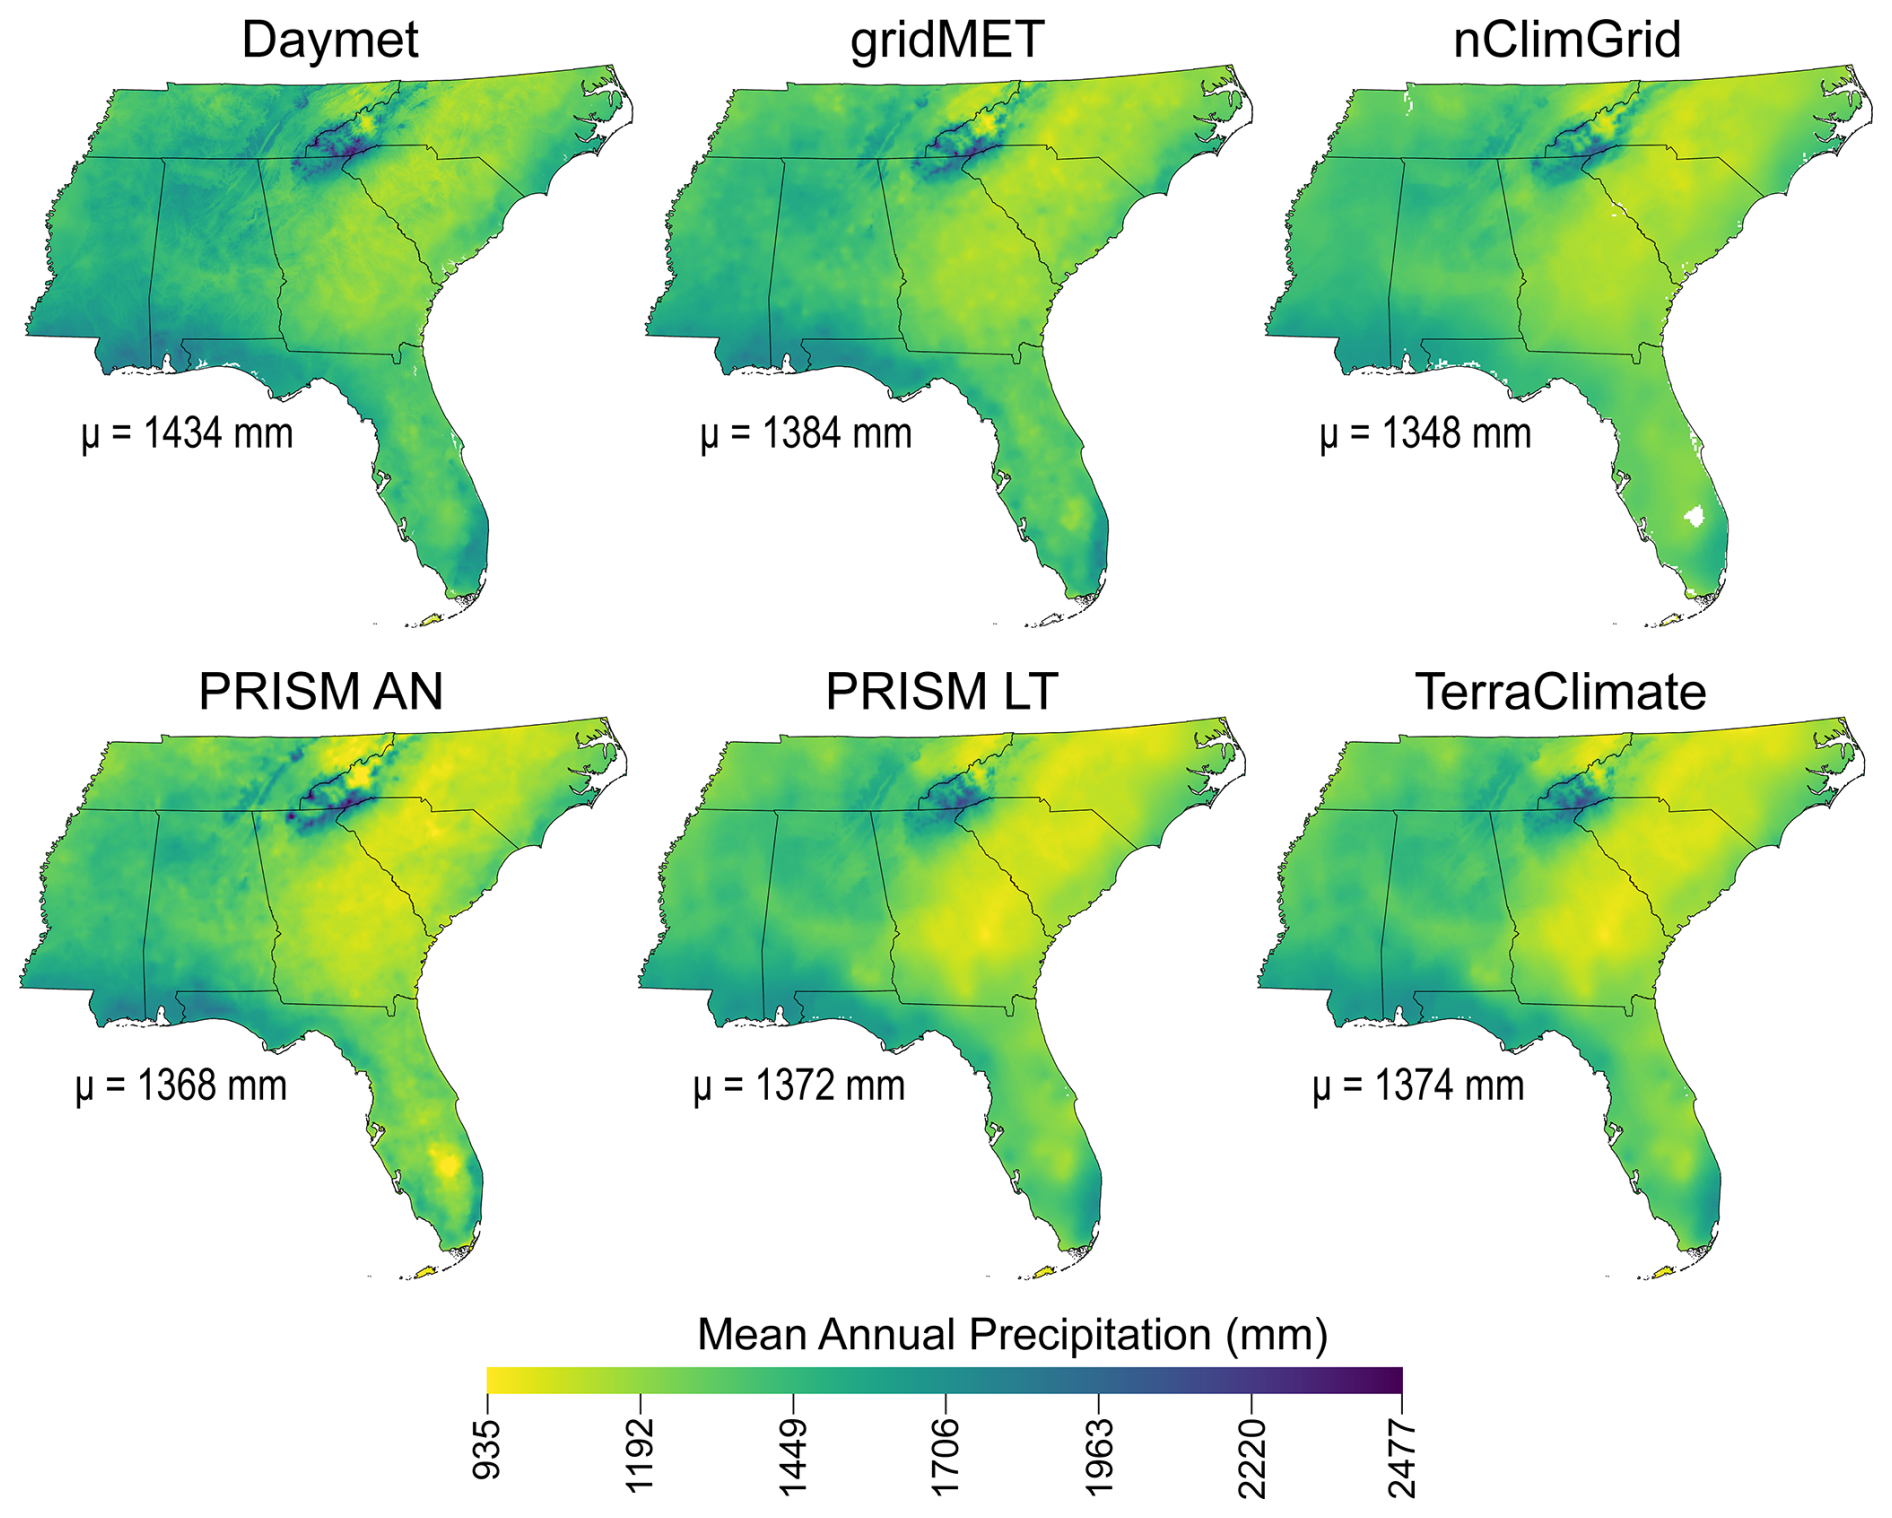
Figure 2Mean annual precipitation totals (in mm) during 1980–2024 for the six precipitation products. gridMET, nClimGrid, PRISM AN, PRISM LT, and TerraClimate have been resampled to 1-km resolution to match the resolution of Daymet.
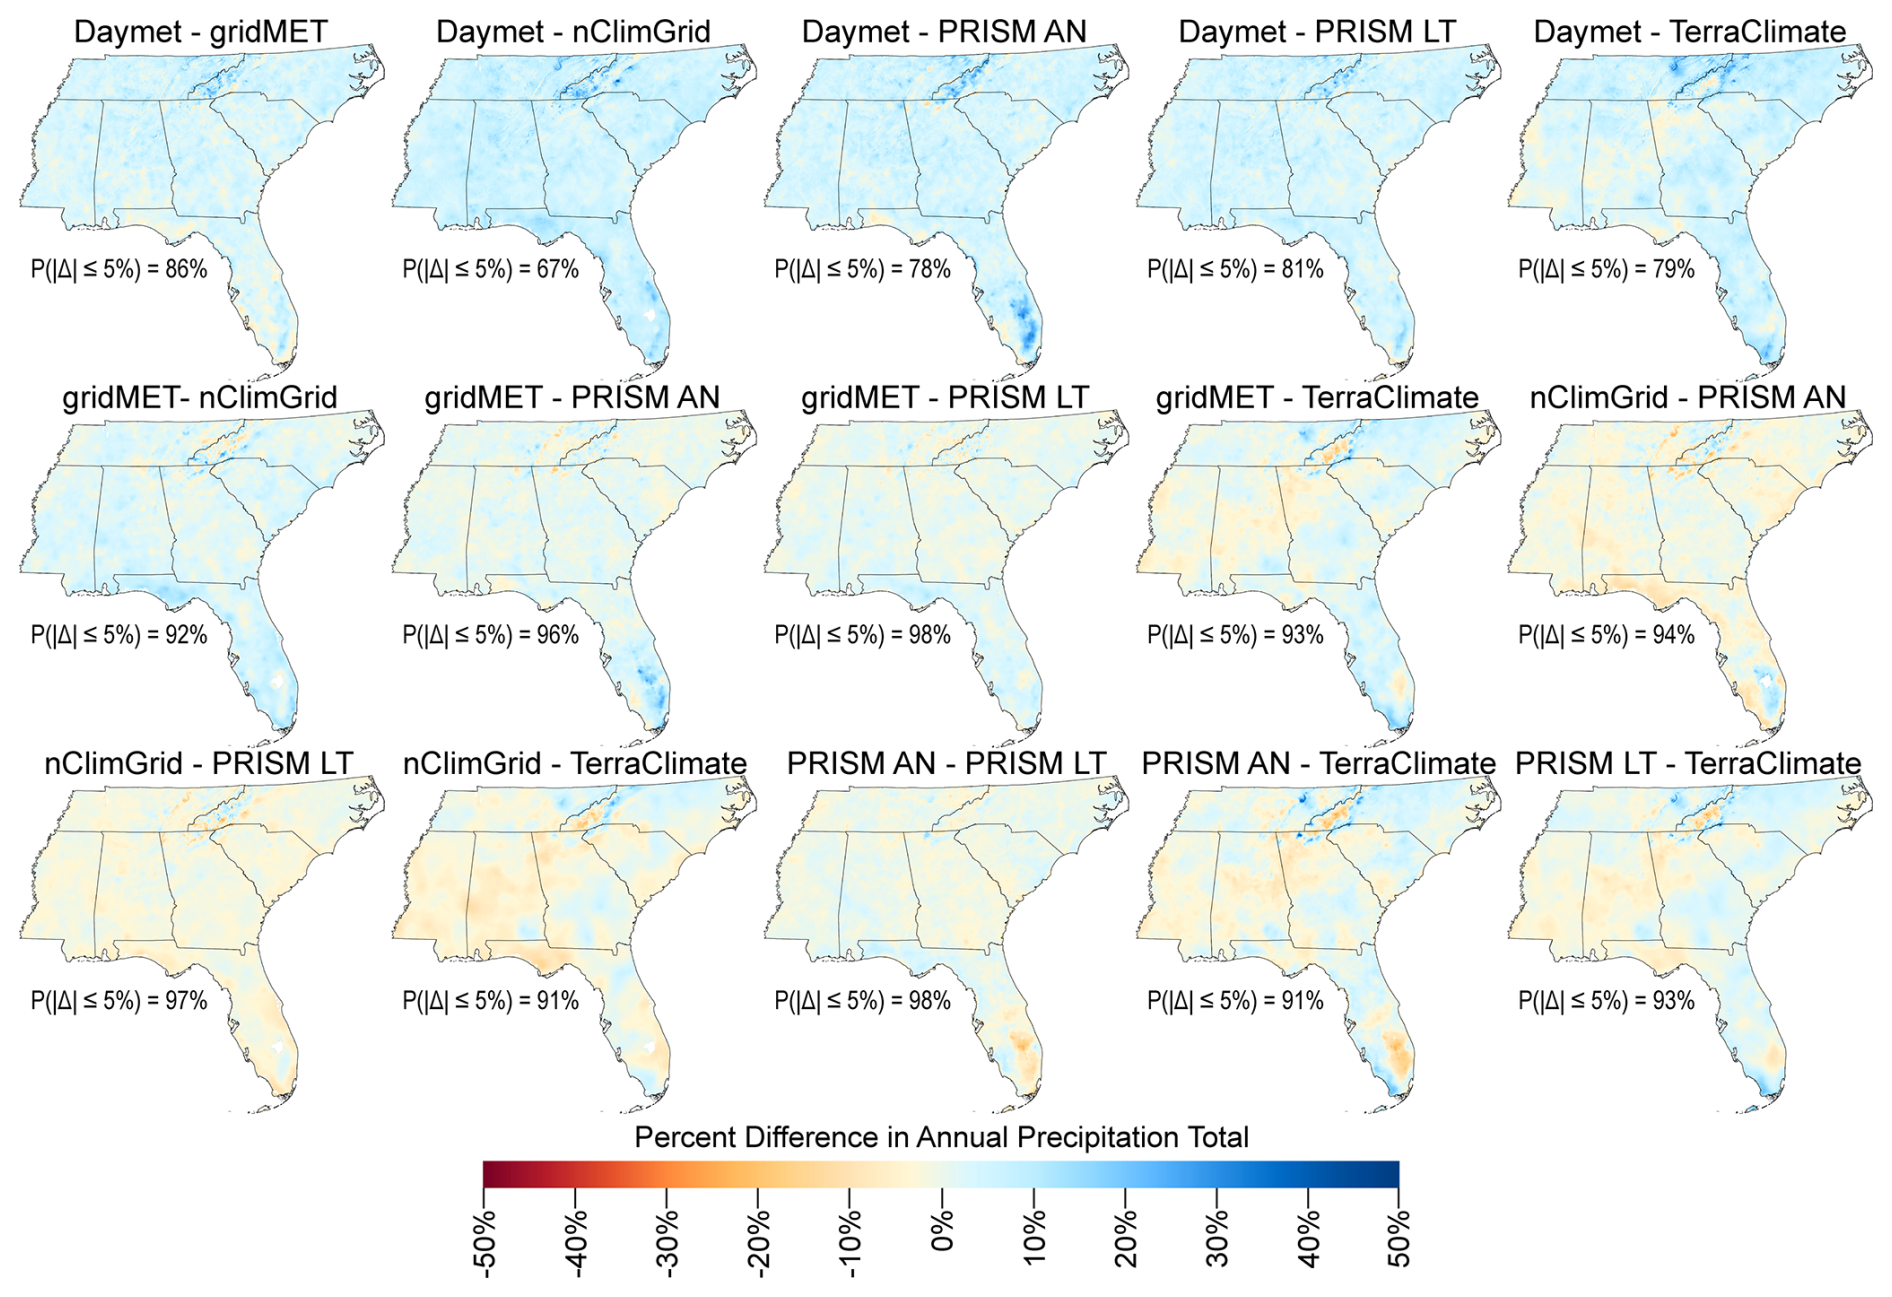
Figure 3Percent difference in mean annual precipitation totals (1980-2024) between pairs of products. %) is the percentage of grid cells with percent differences between −5 % and 5 %.
4.1 Spatial Agreement among Precipitation Products
Mean annual precipitation totals and spatial patterns were broadly consistent among the six precipitation products, with Daymet producing slightly higher totals and nClimGrid slightly lower totals than the others (Figs. 2 and 3). Mean annual totals for 1980–2024 ranged from 1348 mm for nClimGrid to 1434 mm for Daymet, with precipitation totals smallest (∼1100 mm) across central Georgia, South Carolina, and North Carolina and largest (∼2000 mm) in the Blue Ridge and Cumberland Mountains (Fig. 2). Inter-product differences in mean annual totals were remarkably small: among the 15 pairwise combinations, 67 % to 98 % of grid cells differed by no more than ±5 %, with a mean of 89 % of cells meeting this threshold (Fig. 3). The largest discrepancies were concentrated in the Appalachian and Cumberland Mountains and in southeastern Florida, although differences exceeding 15 % were rare even in these areas. On average, Daymet produced totals 4.7 % higher on average than the other products, whereas nClimGrid produced totals 2.3 % lower on average, indicating modest wet and dry biases relative to the other products.
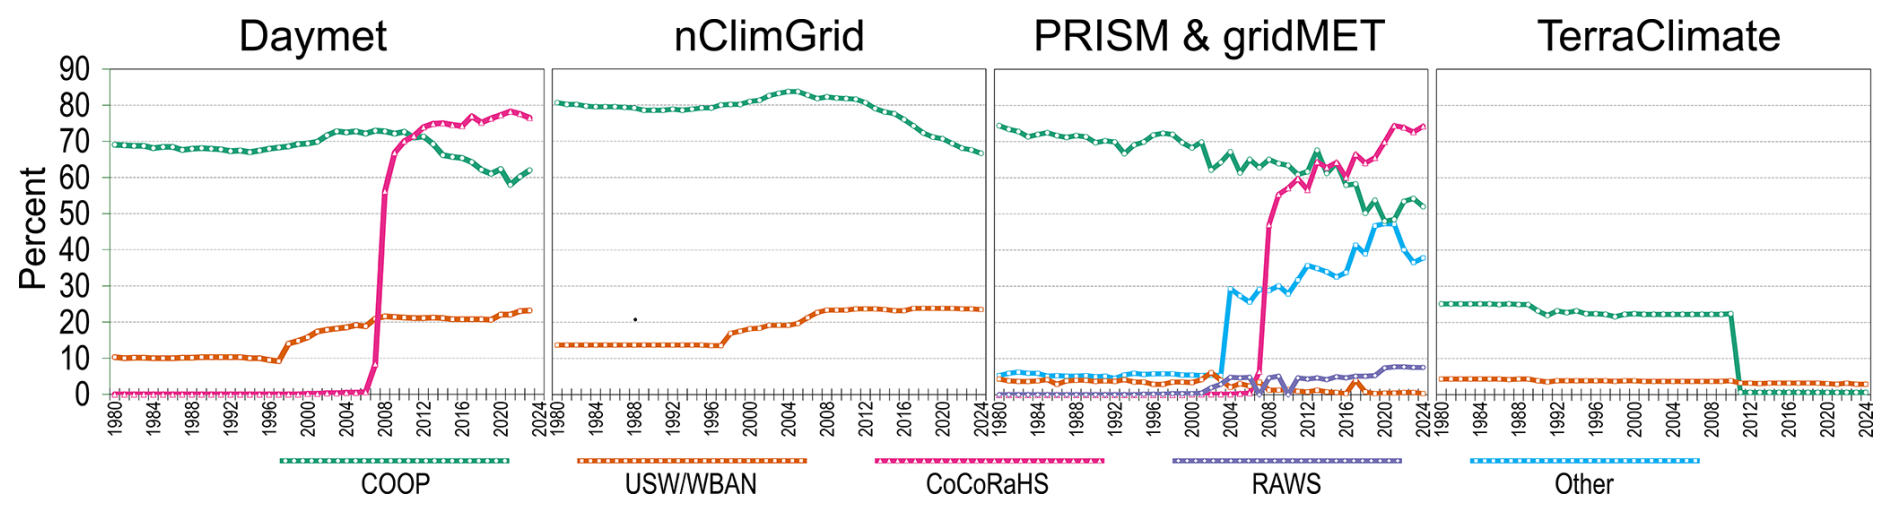
Figure 4Percent coverage of the southeastern United States over time by gauge networks used in the precipitation products. COOP is the U.S. Cooperative Observer Program. USW/WBAN gauges are first-order airport surface observing stations. CoCoRaHS is the Community Collaborative Rain, Hail and Snow network. RAWS is the Remote Automated Weather Stations network. With respect to the PRISM and gridMET panel, only COOP, RAWS, and first-order airport (WBAN) gauges are used to develop the PRISM LT product.
4.2 Changes in Gauges
All products showed substantial temporal changes in gauge numbers across 1980–2024, most notably increasing coverage by CoCoRaHS (Community Collaborative Rain, Hail, and Snow Network) gauges and decreasing coverage by COOP gauges (Fig. 4). Daymet was initially dominated by COOP gauges but by the end of the period CoCoRaHS gauges were most prevalent. Both CoCoRaHS and first-order airport surface observing stations (hereafter, first-order gauges) increased in coverage, with CoCoRaHS rising from <1 % in 2006 to 78 % in 2021, while COOP gauges began decreasing around 2011. nClimGrid consistently relied more on COOP than first-order gauges, but the difference in 2024 (67 % vs. 24 %) was much smaller than in 1980 (81 % vs. 14 %). Coverage by first-order gauges began increasing in 1998, while COOP coverage declined after 2012. PRISM AN and gridMET, which used gauges from 15 networks, showed a similar pattern, with increasing CoCoRaHS and decreasing COOP coverage. CoCoRaHS coverage rose from <1 % in 2006 to ∼75 % in 2021. There was also an increase in gauges from other networks and a steady decline in COOP coverage. PRISM LT was dominated by COOP gauges throughout the period, with COOP comprising between 48 % and 74 % of all gauges, while first-order gauges accounted for ∼4 % of coverage from 1980 to the early 2000s, after which RAWS coverage increased to ∼8 % by 2024. TerraClimate had much less gauge coverage overall, with a maximum of 25 % from cooperative gauges and an abrupt decline from 22 % to <1 % between 2010 and 2011.
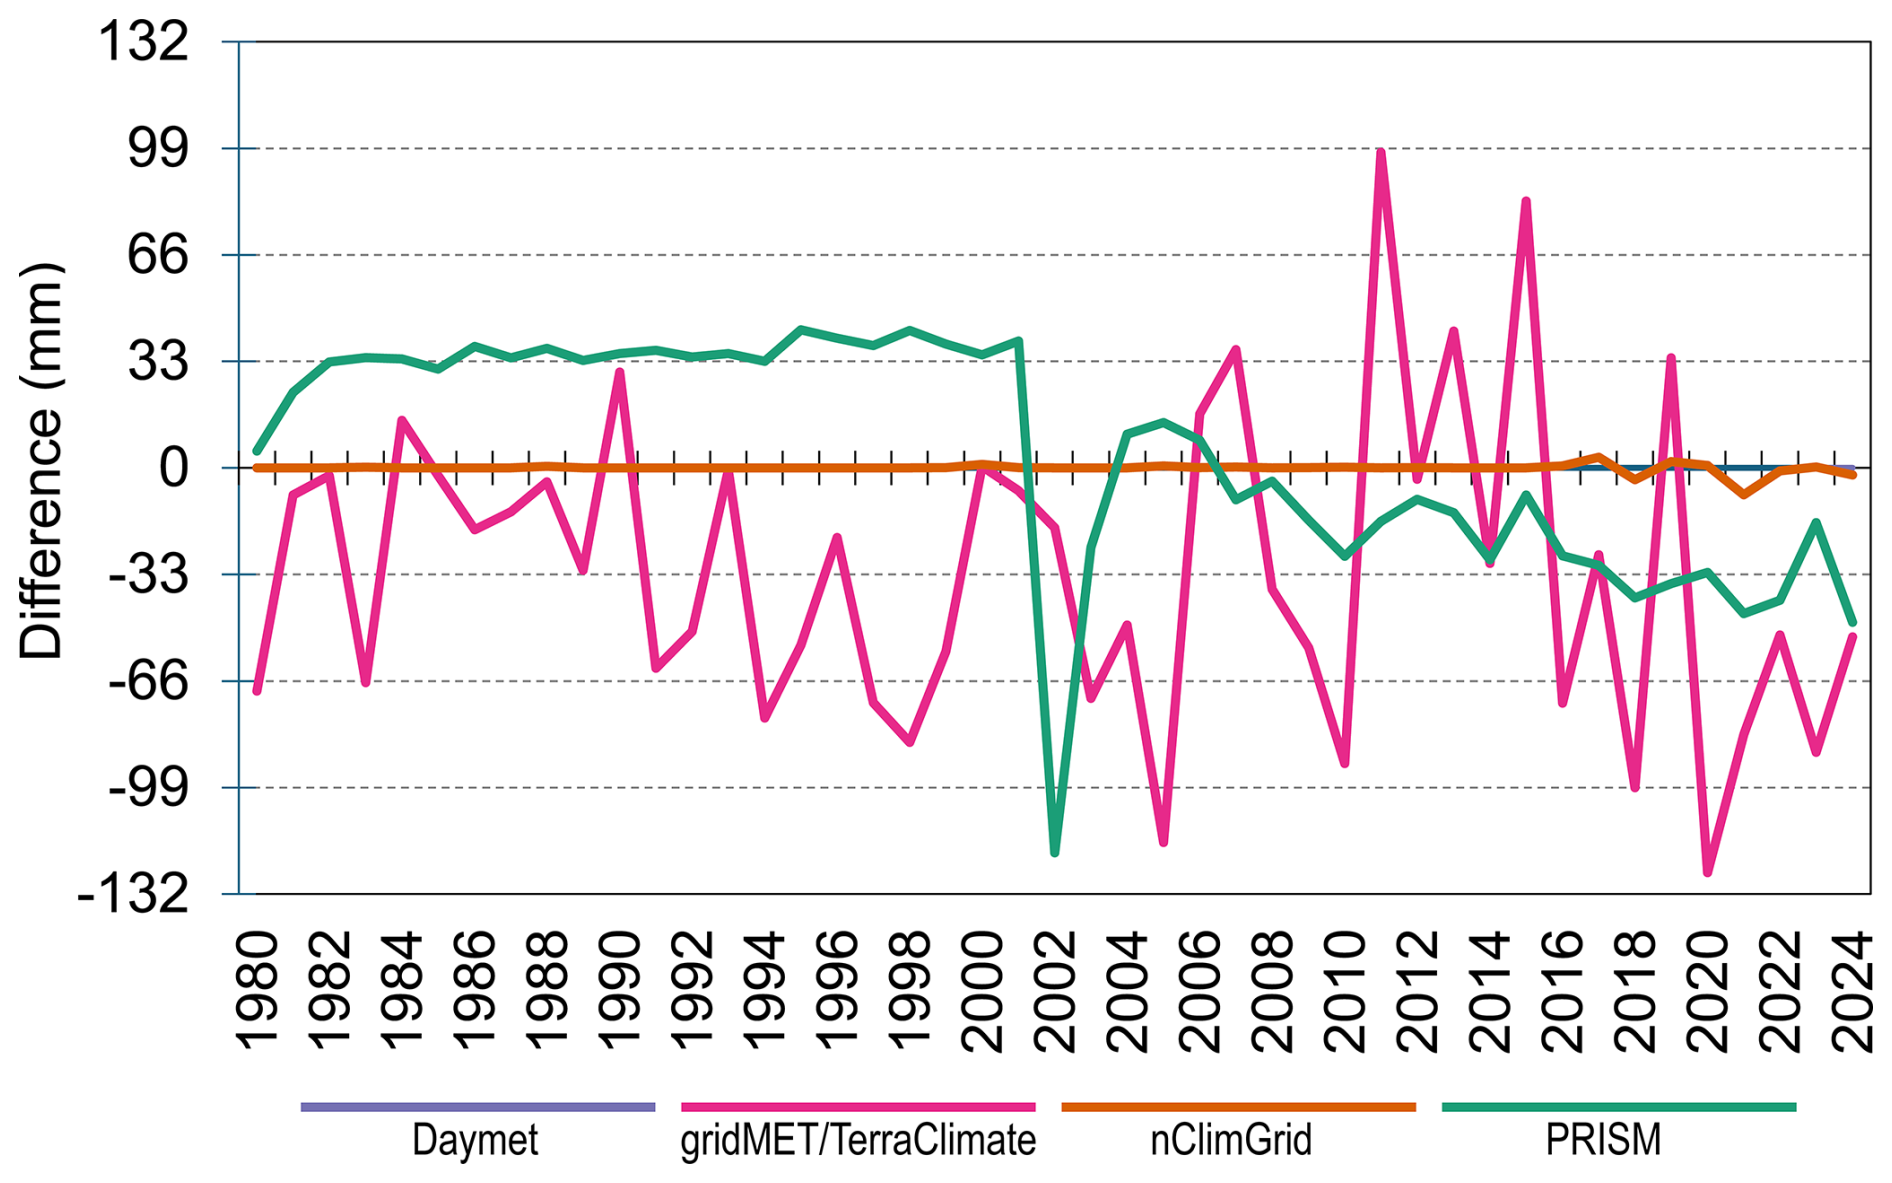
Figure 5Differences in annual precipitation totals derived from monthly versus daily products, 1980–2024. For PRISM, the monthly product is PRISM LT and the daily product is PRISM AN.
4.3 Comparison of Monthly and Daily Versions of Products
Comparisons of monthly and daily product versions revealed consistent behaviour for some datasets but notable temporal differences for others (Fig. 5). Monthly and daily versions of Daymet and nClimGrid produced either identical or nearly identical results. In contrast, PRISM AN and PRISM LT exhibited distinct temporal behaviour and are therefore treated separately in subsequent analyses. Consequently, monthly results – which include TerraClimate and PRISM LT – are shown in the paper, while the daily results – which include gridMET and PRISM AN – are presented in the Supplement.
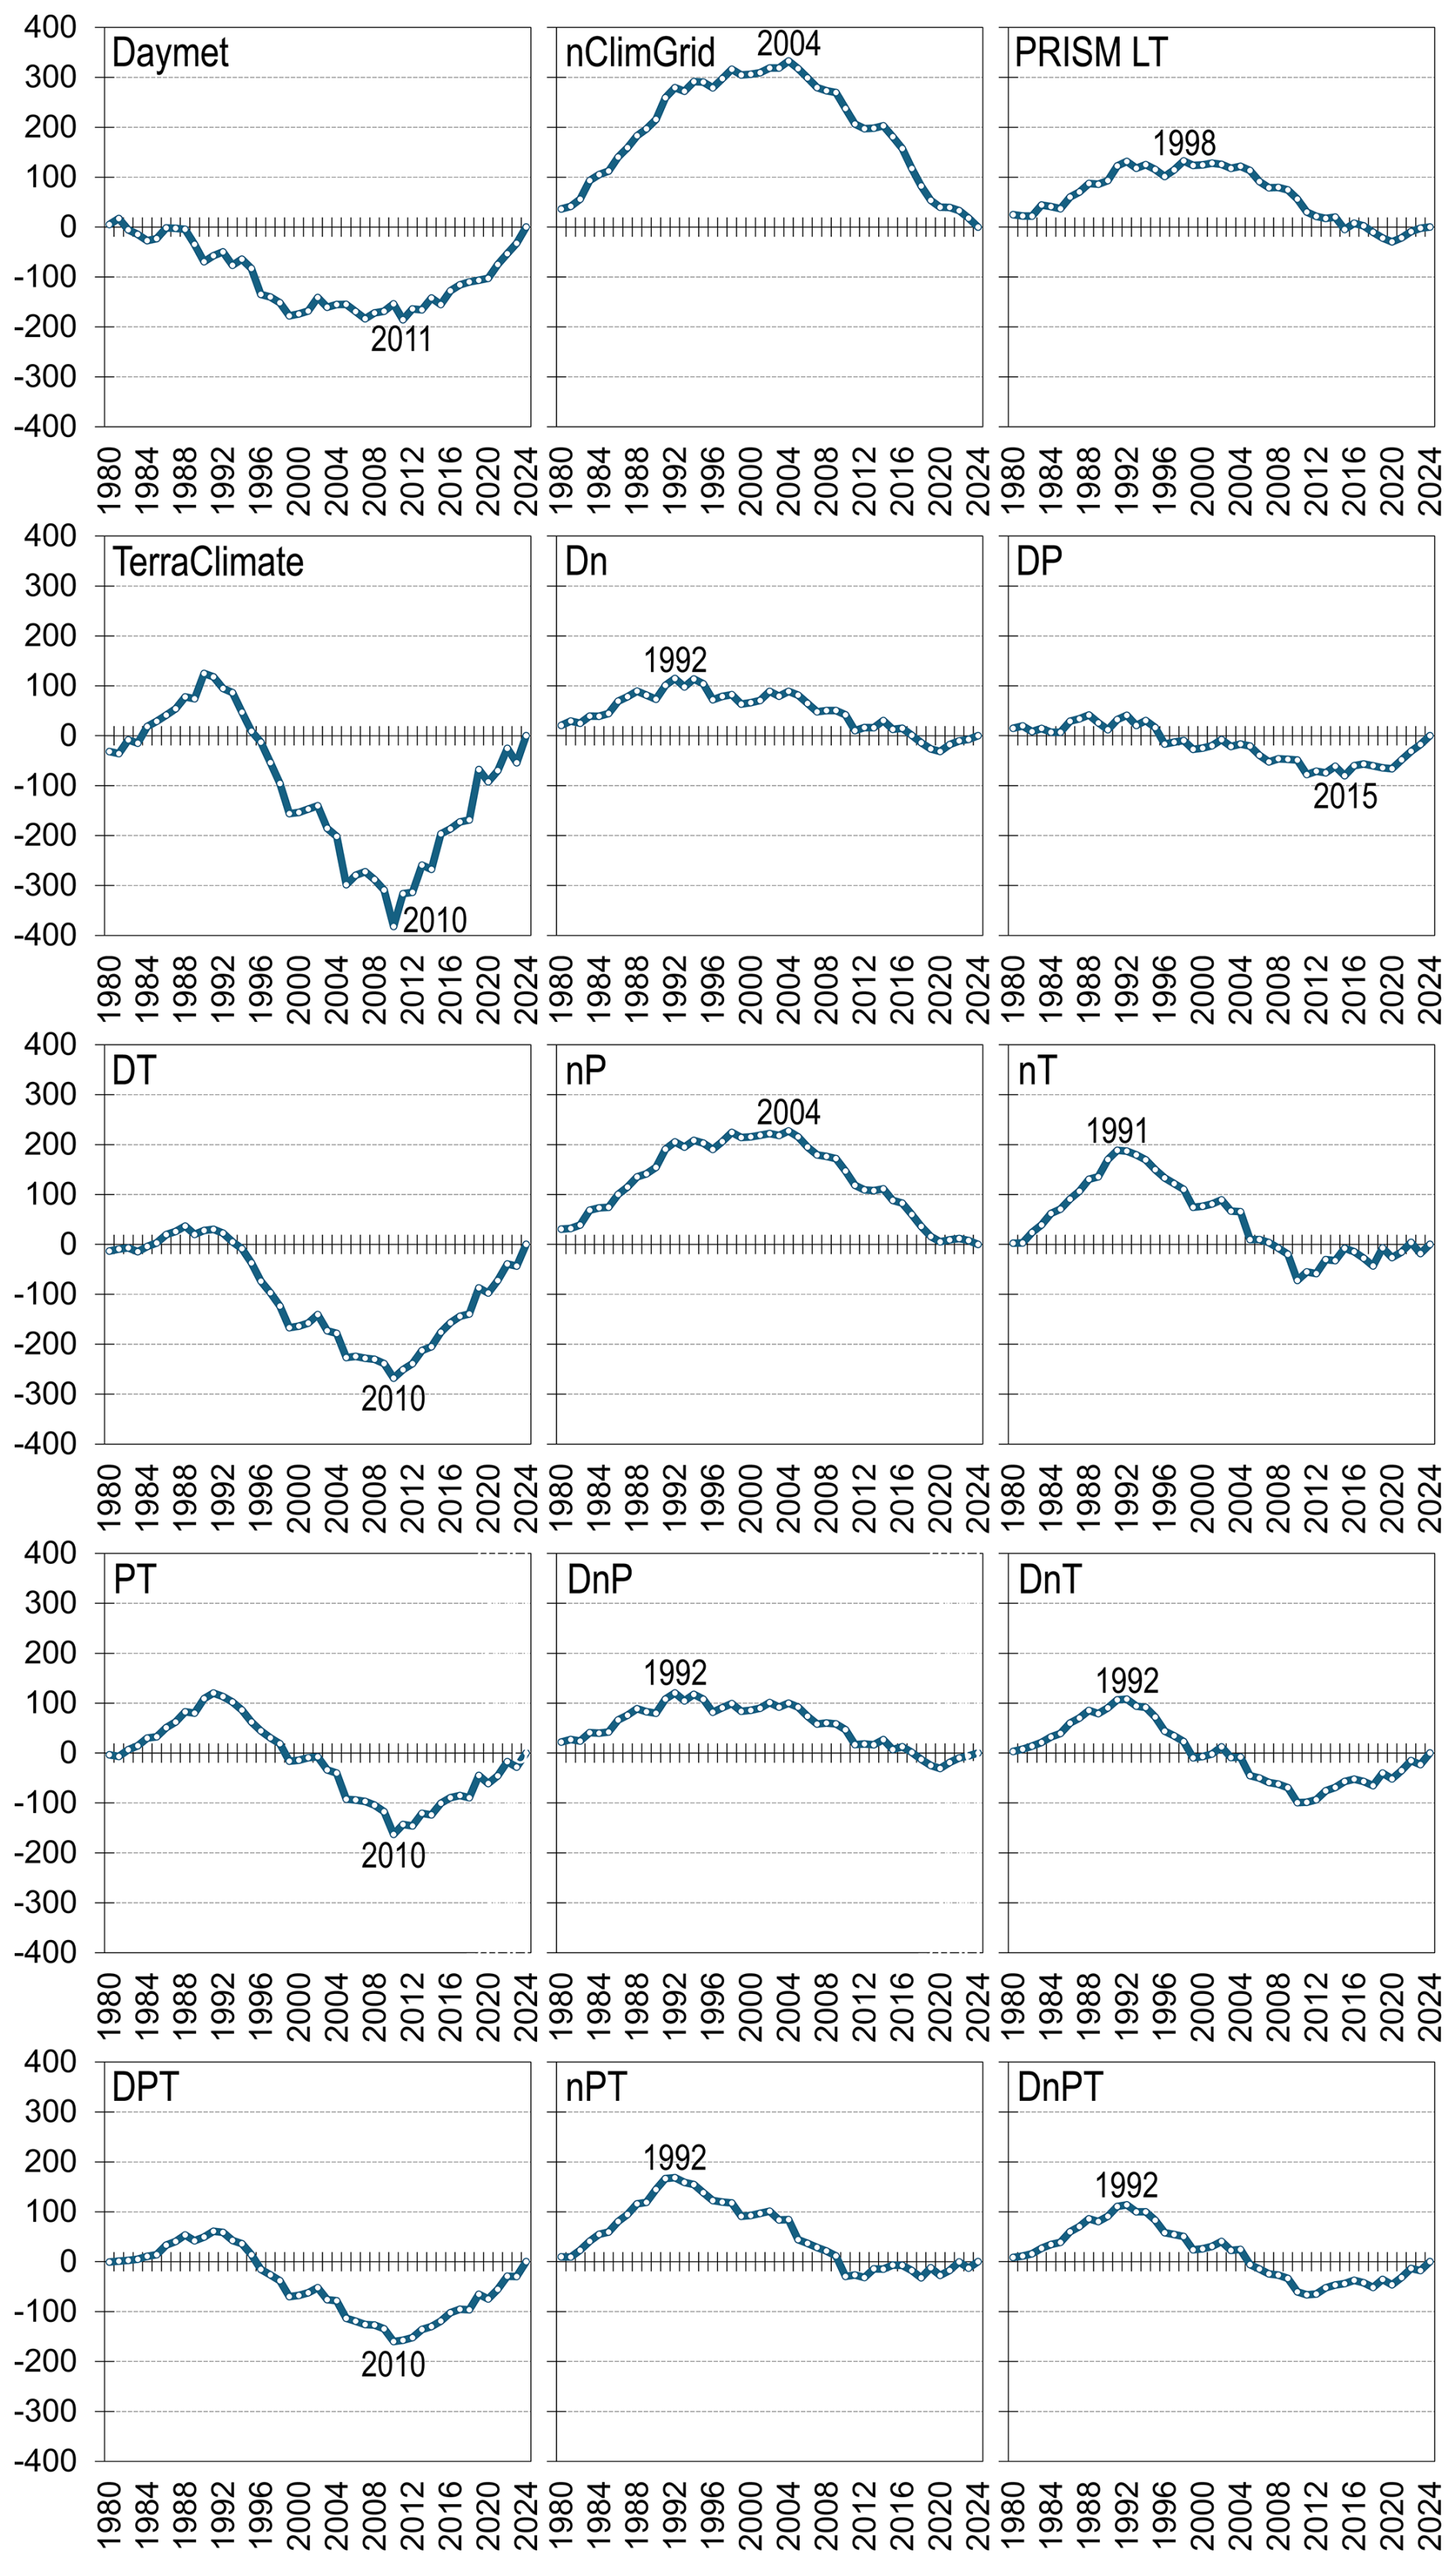
Figure 6Residual-mass curves for products and combination of products. Abbreviations for Daymet, nClimGrid, PRISM LT, and TerraClimate, are D, n, P, and T, respectively. Units are mm.
4.4 Residual-Mass Curves
Combinations of products produced the most optimal residual-mass curves overall, while performance among individual products varied substantially (Figs. 6 and S1). Optimal curves were characterized by relatively small cumulative sums of the absolute residuals. Among the individual products, PRISM LT exhibited the lowest cumulative residual total, whereas PRISM AN exhibited the highest total. The lowest cumulative sums overall were achieved by several multi-product combinations, including (in ascending order) nClimGrid–PRISM, Daymet–nClimGrid–TerraClimate, Daymet–nClimGrid–PRISM, Daymet–gridMET–nClimGrid, Daymet–nClimGrid, Daymet–nClimGrid–PRISM AN, and Daymet–nClimGrid–PRISM LT.
The residual-mass curves also revealed potential discontinuities, which occurred between the early 1990s and 2016 (Figs. 6 and S1). In each panel of the figures, the year associated with the largest absolute residual corresponded to the year preceding the potential discontinuity. For Daymet, gridMET, nClimGrid, PRISM AN, PRISM LT, and TerraClimate, the potential discontinuities were centered on 2012, 2016, 2005, 2002, 1999, and 2011, respectively. Across all products and product combinations, 50 % of the potential discontinuities occurred in 1993 and 2016 combined.
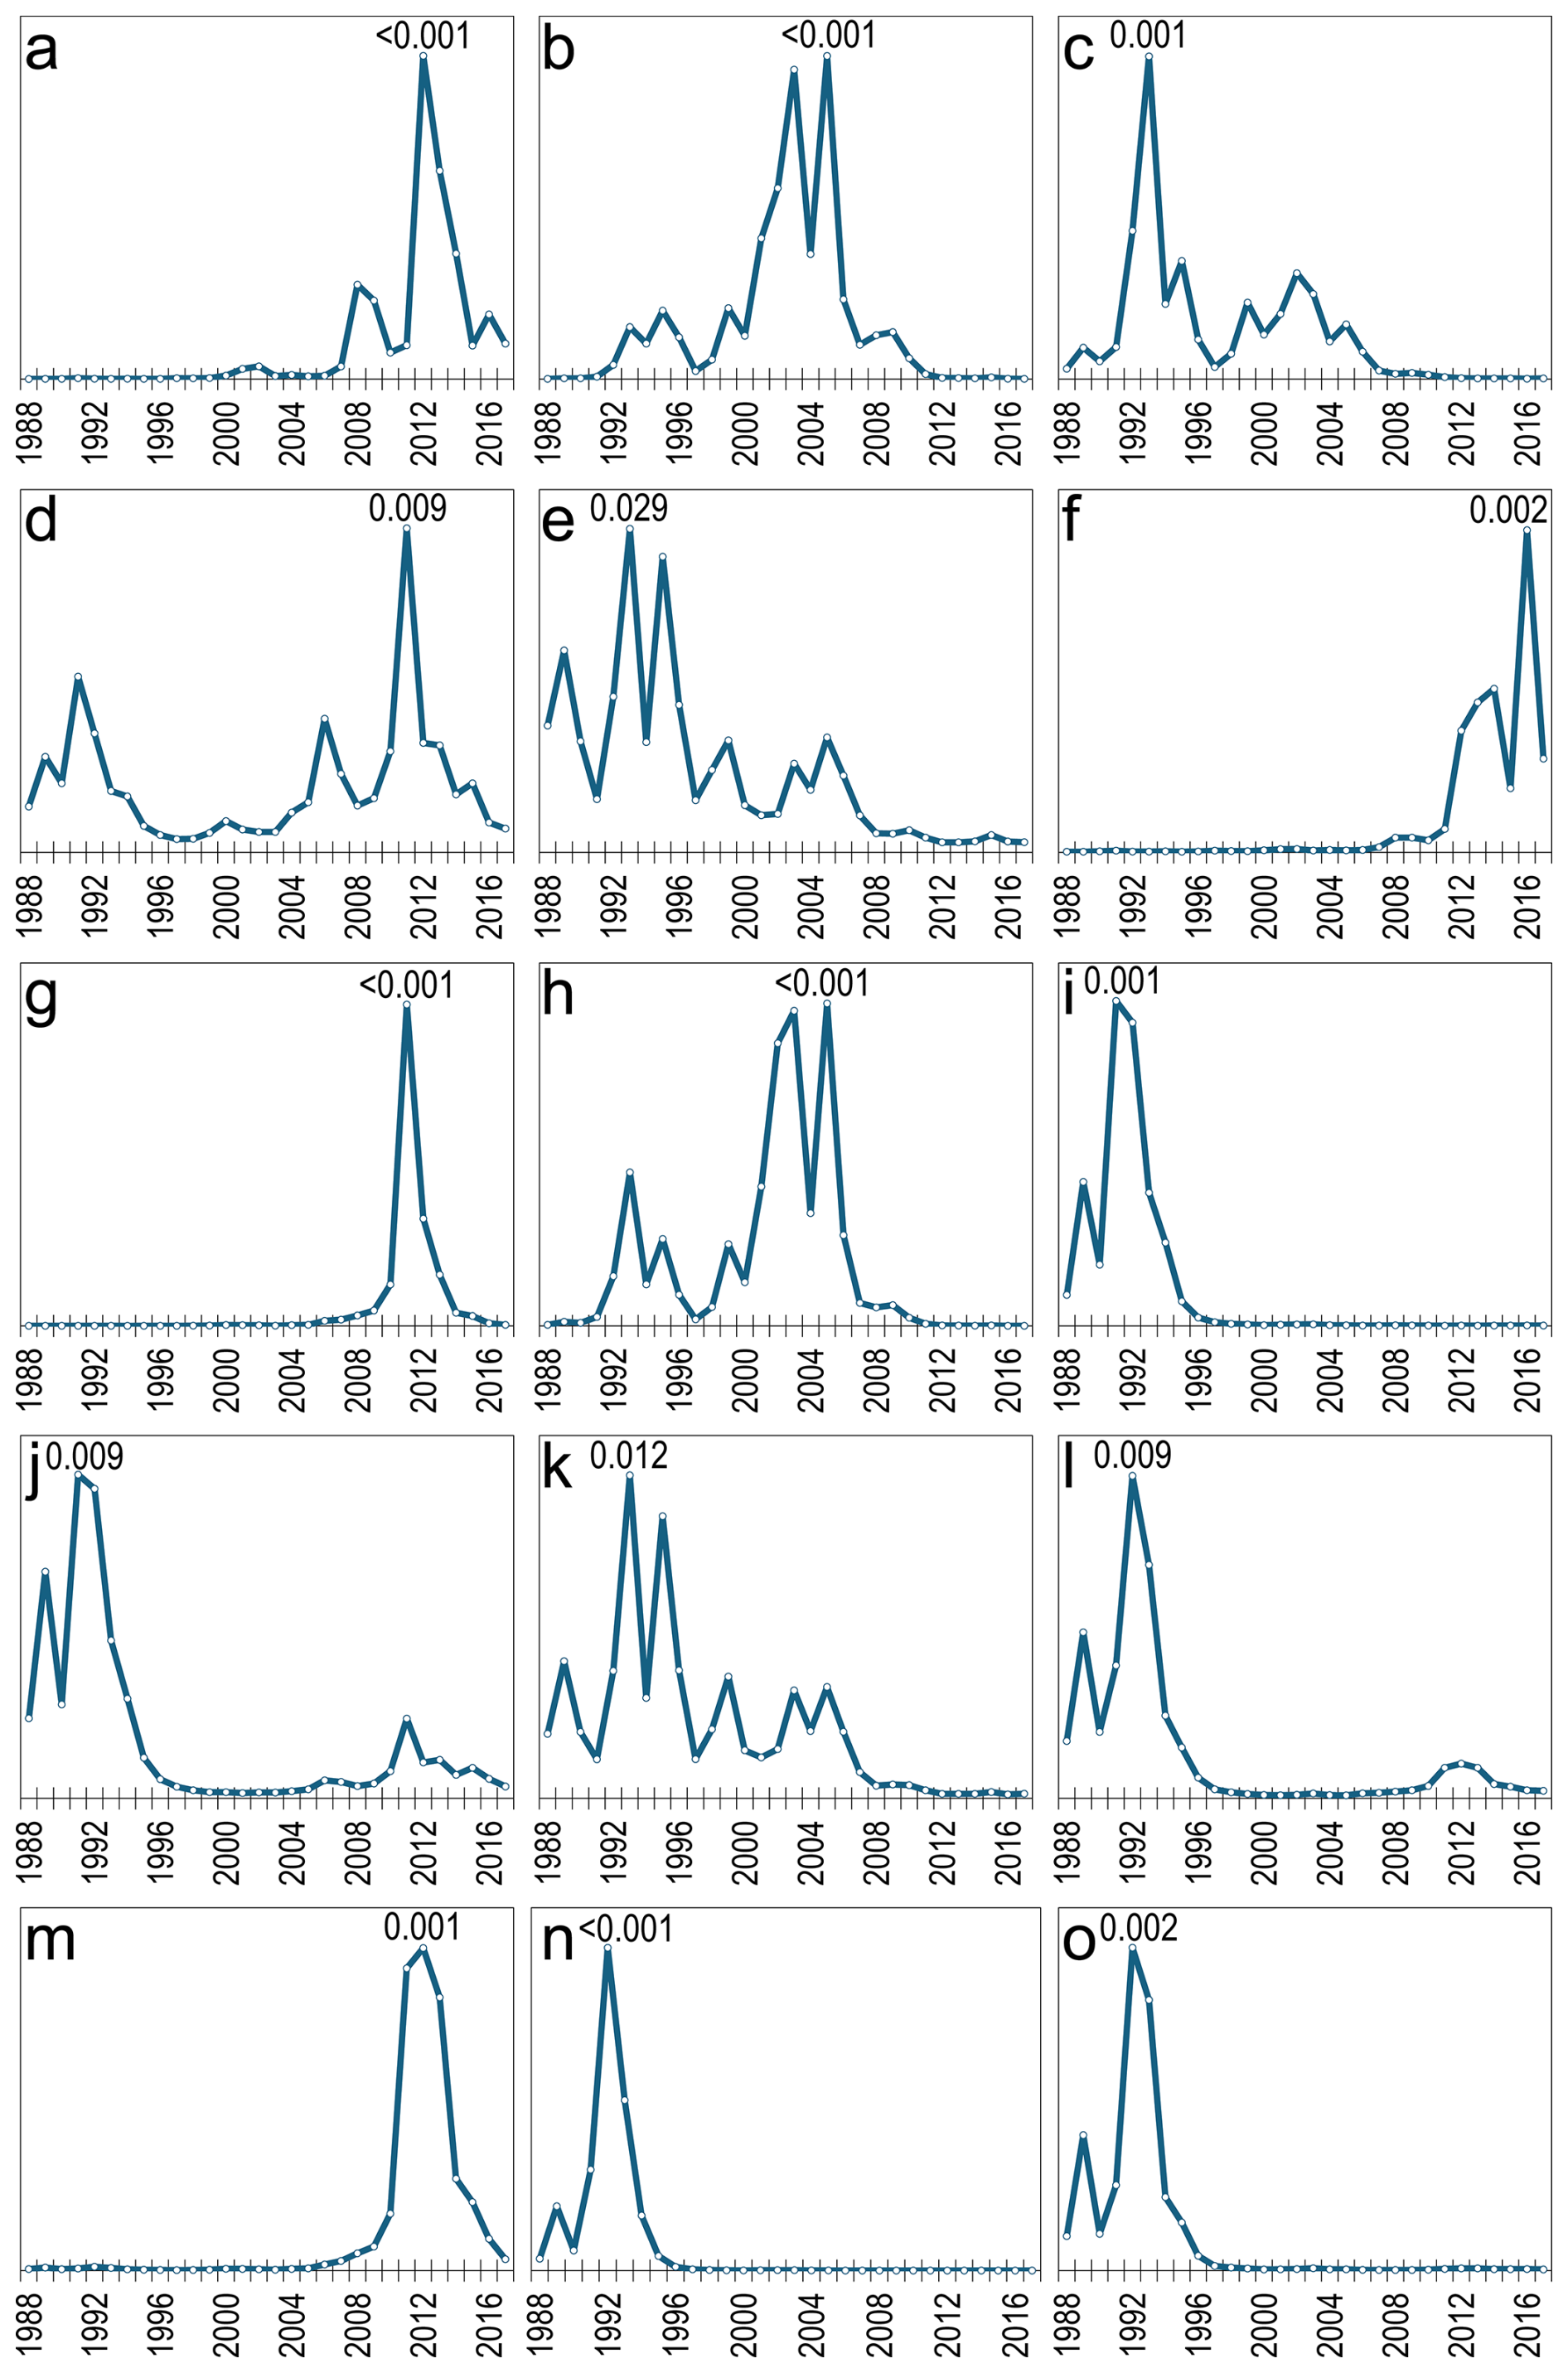
Figure 7Inverse p values for (a) Daymet, (b) nClimGrid, (c) PRISM LT, (d) TerraClimate, (e) Dn, (f) DP, (g) DT, (h) nP, (i) nT, (j) PT, (k) DnP, (l) DnT, (m) DPT, (n) nPT, and (o) DnPT. Abbreviations for Daymet, nClimGrid, PRISM LT, and TerraClimate, are D, n, P, and T, respectively. The two-tailed p values are from Mann-Whitney U tests that compared differences from the reference time series before and after each of the years shown (i.e., 1988–2017).
4.5 Discontinuities
Most products exhibited significant discontinuities, and the timing of these shifts generally aligned with the potential discontinuities identified from the residual-mass curves (Figs. 7 and S2). All but three products showed at least one significant discontinuity. The individual products – Daymet, gridMET, nClimGrid, PRISM AN, PRISM LT, and TerraClimate – had discontinuities centered on 2012, 2016, 2005, 2002, 1993, and 2011, respectively. Collectively, discontinuities across all products clustered within five periods: 1991–1993, 2002, 2005, 2011–2012, and 2016. The only products without detectable discontinuities were Daymet–nClimGrid, Daymet–nClimGrid–PRISM LT, and nClimGrid–PRISM AN.
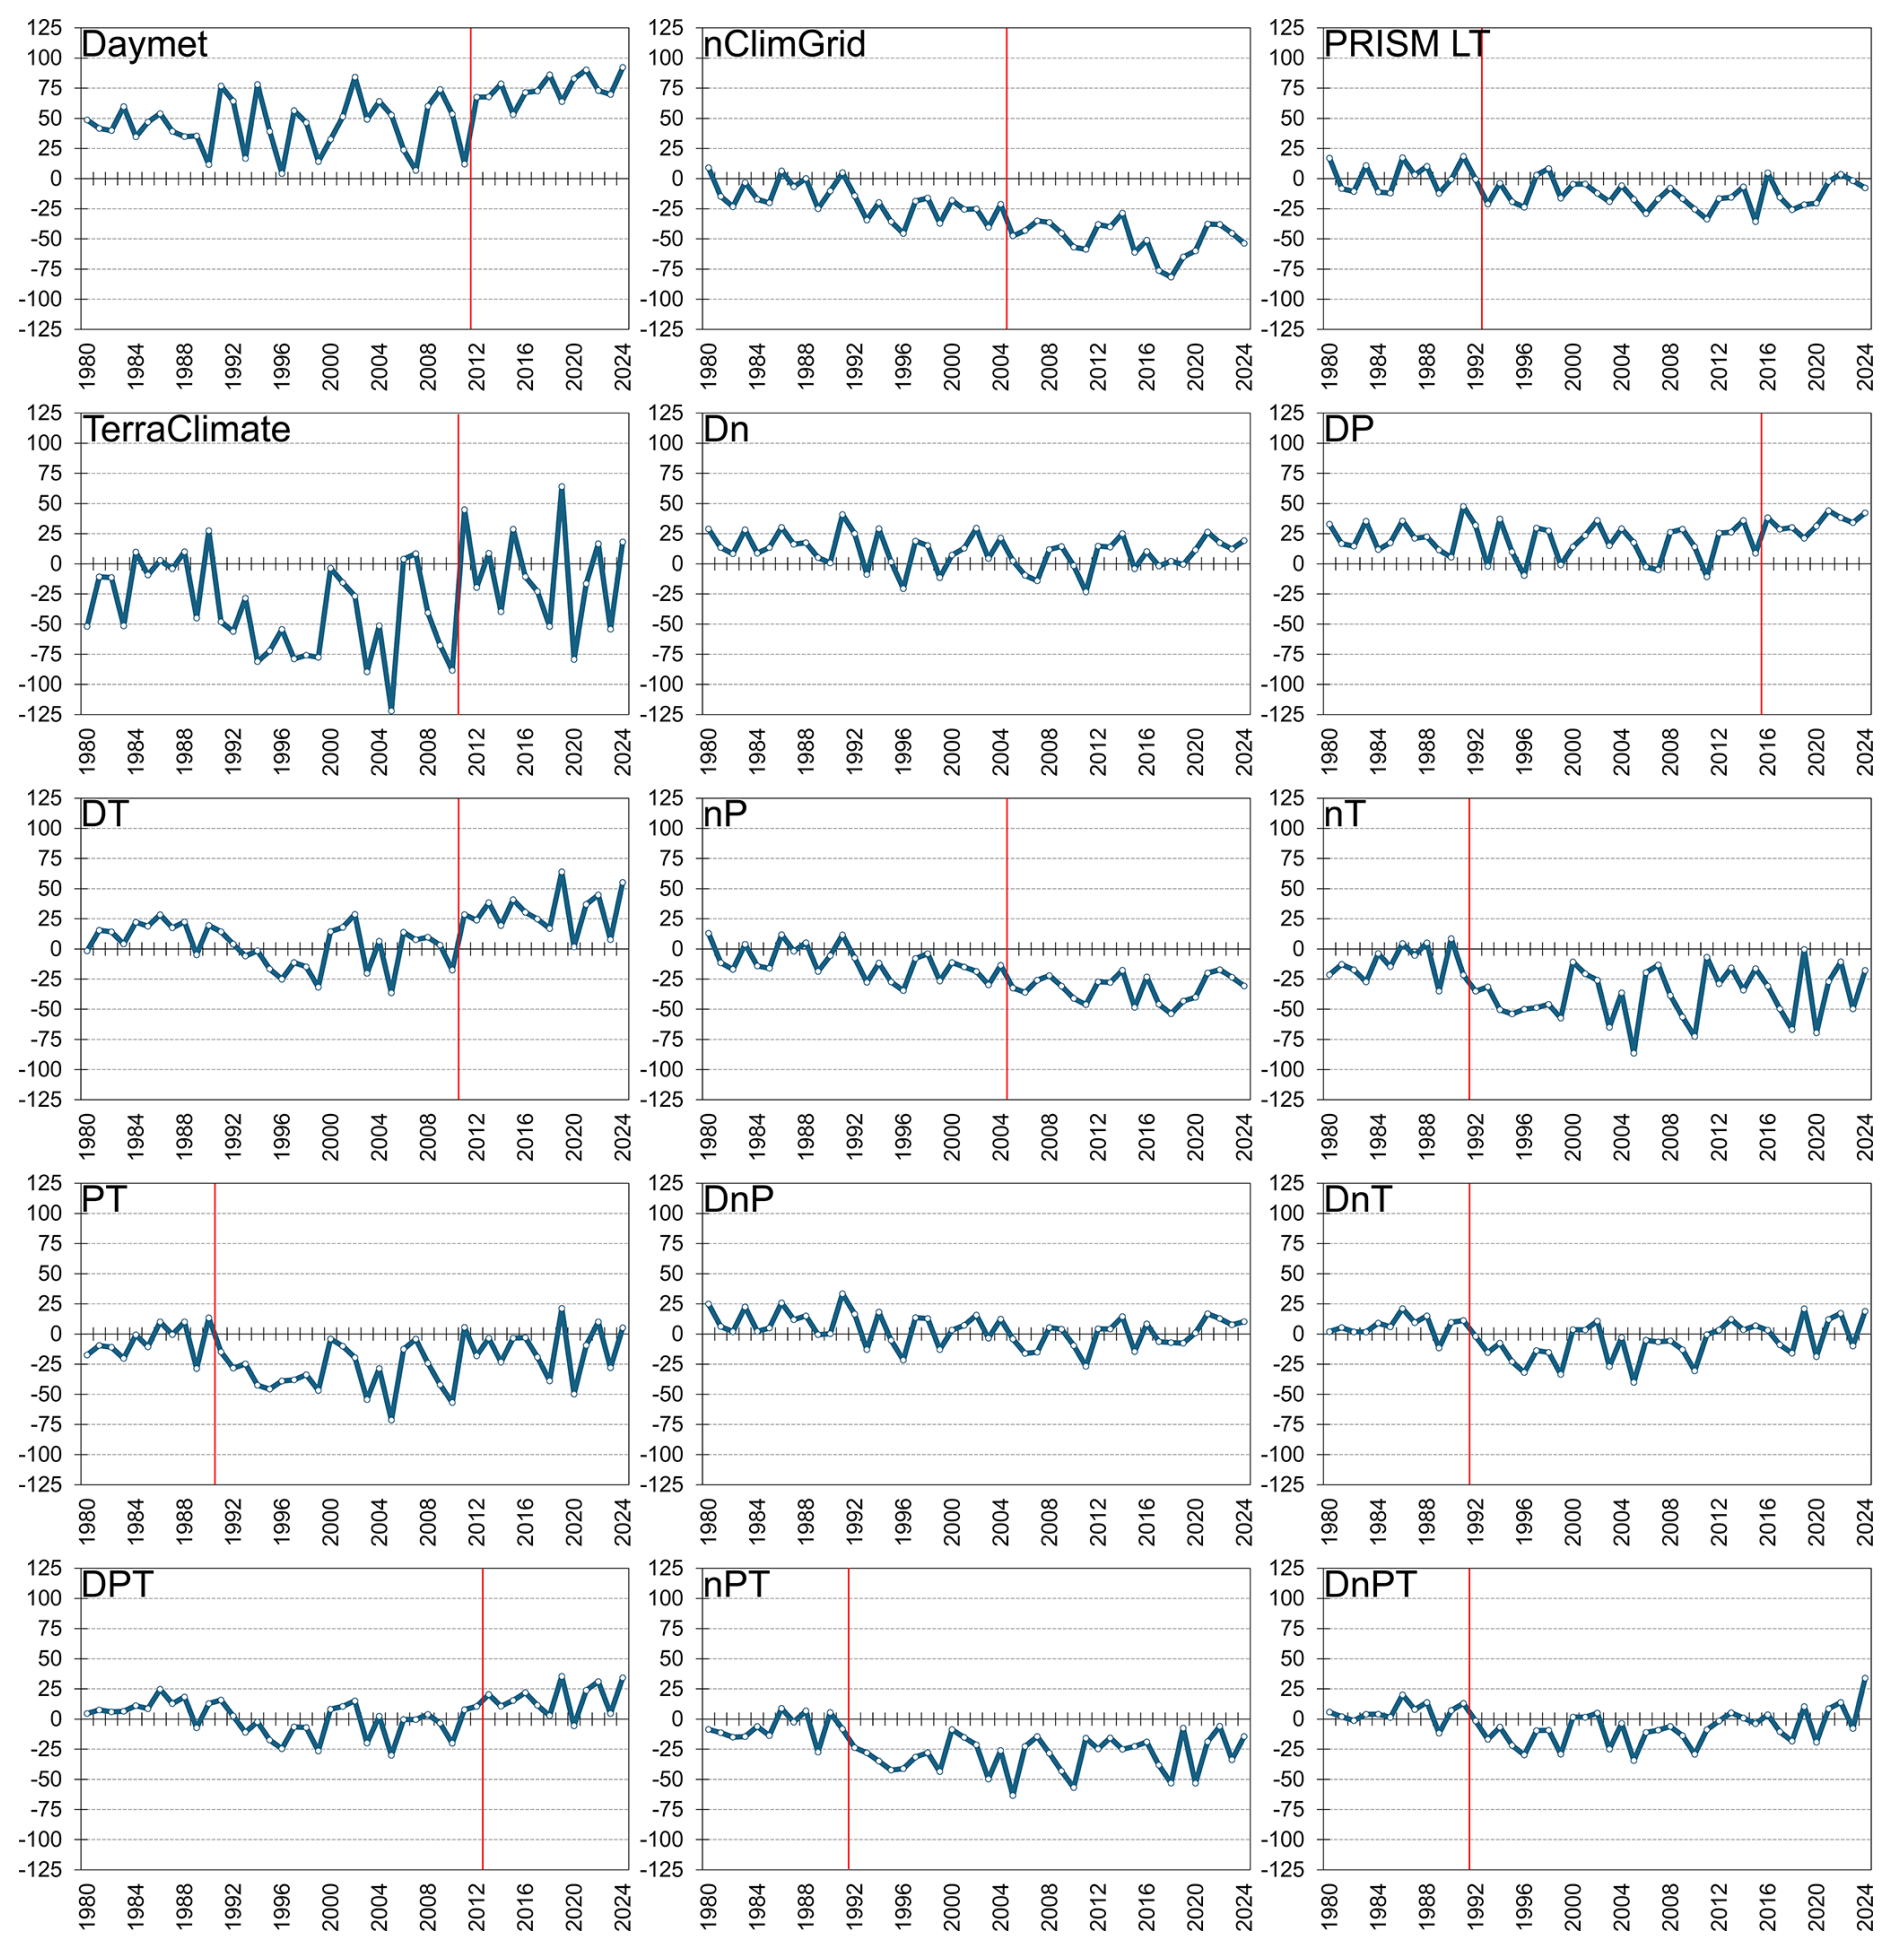
Figure 8Time series of differences (in mm) between the mean of the 120 references gauges and the means for the southeastern United States that area specific to products and combination of products. Abbreviations for Daymet, nClimGrid, PRISM LT, and TerraClimate, are D, n, P, and T, respectively.
4.6 Time Series of Differences
With respect to differences from the reference time series before and after a discontinuity, most products shifted from either overestimates to larger overestimates, underestimates to larger underestimates, or underestimates to overestimates (Figs. 8 and S3). Daymet shifted from overestimates to larger overestimates. Both gridMET and PRISM AN shifted from underestimates to overestimates. nClimGrid shifted from underestimates to larger underestimates. PRISM LT and TerraClimate were relatively unique among all the products, since PRISM LT shifted from overestimates to underestimates and TerraClimate shifted from underestimates to smaller underestimates.
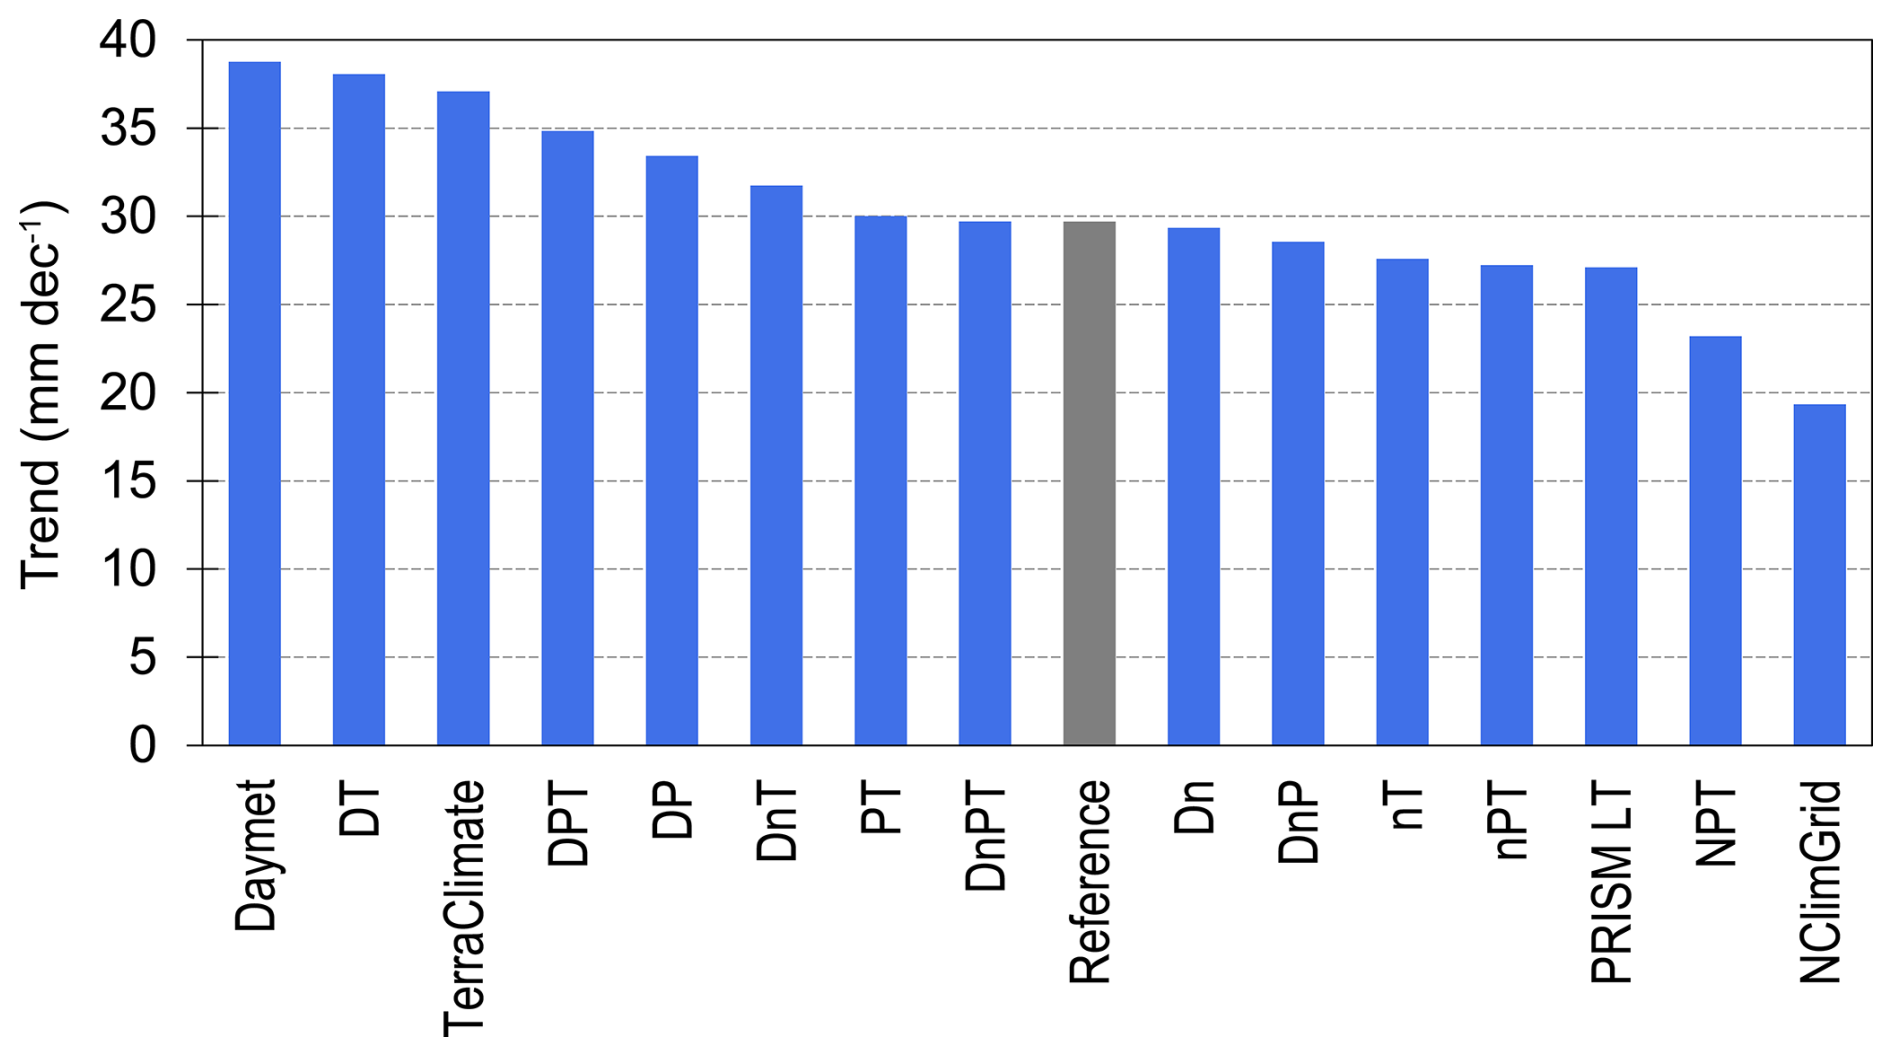
Figure 9Precipitation increases per decade (in mm) for the reference and 15 other time series. Abbreviations for Daymet, nClimGrid, PRISM LT, and TerraClimate, are D, n, P, and T, respectively.
4.7 Trends
The products exhibited a wide range of precipitation trends, with only a few approximating the reference trend of 30 mm per decade, which was not statistically significant (Figs. 9 and S4). For the individual products, Daymet, gridMET, nClimGrid, PRISM AN, PRISM LT, and TerraClimate had trends of 39, 39, 19, 48, 27, and 37 mm per decade, respectively. Among all products, trends ranged from 19 mm per decade (nClimGrid) to 48 mm per decade (PRISM AN), with PRISM AN being the only product with a statistically significant trend. Products within 10 % of the reference trend, listed in ascending order of deviation (with the first product closest to the reference), were Daymet–nClimGrid–PRISM LT–TerraClimate, Daymet–nClimGrid, PRISM LT–TerraClimate, gridMET–nClimGrid, Daymet–nClimGrid–PRISM LT, Daymet–nClimGrid–TerraClimate, nClimGrid–TerraClimate, nClimGrid–PRISM–TerraClimate, and PRISM LT.
5.1 Inhomogeneities and Biased Trends of Products
The proliferation of CoCoRaHS gauges – and to a lesser degree the decline of COOP gauges – caused a wetting bias in the Daymet and PRISM AN time series. Decadal precipitation increases were 28 % and 62 % larger, respectively, than those from the reference gauges (Figs. 9 and S4). CoCoRaHS gauges generally record slightly higher precipitation totals than COOP gauges, with increases of about 1 %–5 % (Doesken, 2005; CoCoRaHS, 2019; Goble et al., 2019). CoCoRaHS coverage in the Southeast was negligible in 2006 but reached about 75 % by 2021, surpassing all other networks by 2012 and 2014 for Daymet and PRISM AN, respectively (Fig. 4). The largest inhomogeneity in the Daymet series occurred in 2012, coinciding with this expansion. Although PRISM AN experienced similar network shifts, its main inhomogeneity appeared in 2002 due to anomalously high precipitation; correcting those values shifts the discontinuity to 2007, aligning with the network transition.
The introduction and subsequent expansion of ASOS (Automated Surface Observing Systems) gauges – primarily deployed at airports – along with the decline of COOP gauges, produced a drying bias in nClimGrid and, to a much lesser degree, PRISM LT. The decadal precipitation increases for nClimGrid and PRISM LT were 34 % and 9 % smaller, respectively, than that of the reference series (Fig. 9). ASOS instruments use heated tipping-bucket gauges in which each tip represents 0.254 mm of liquid-equivalent precipitation (Wade, 2003). These gauges underestimate rainfall (Dunn et al., 2025), with undercatch of 2 %–10 % relative to COOP observations (National Research Council, 2012). ASOS coverage rose from <1 % in 1993 to 19 % in 2021 (Fig. 10), while COOP coverage declined from 80 % to 70 % in nClimGrid and from 67 % to 54 % in PRISM LT (Fig. 4). The largest inhomogeneity in nClimGrid occurred in 2005, coinciding with growing ASOS influence, whereas the largest inhomogeneity in PRISM LT occurred in 1993, coinciding with the introduction of ASOS gauges.
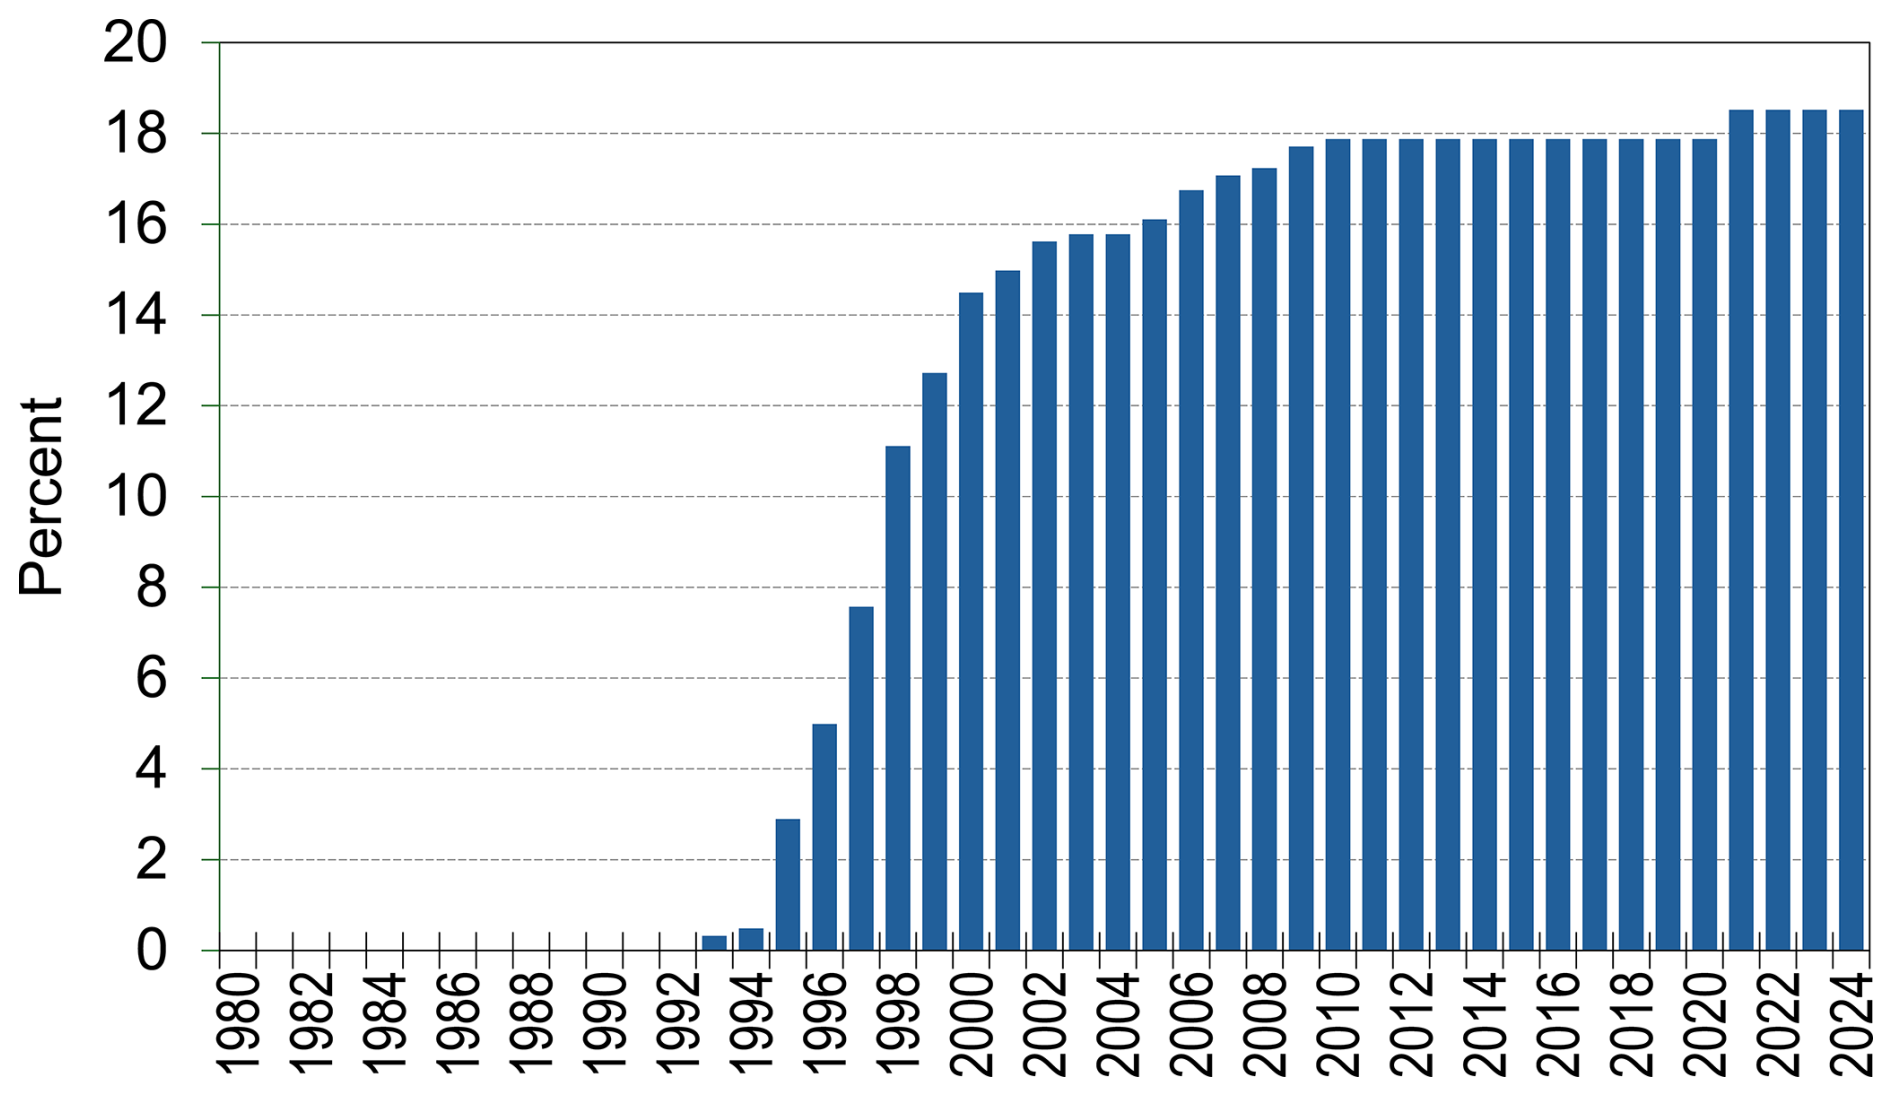
Figure 10Percent coverage of the southeastern United States over time by Automated Surface Observing Systems (ASOS) gauges.
Abrupt increases in TerraClimate precipitation totals in 2011 and gridMET totals in 2016 were attributable to changes in input data. Increases in decadal precipitation for TerraClimate and gridMET were 23 % and 28 % larger than those of the reference gauges (Figs. 6 and S5). The TerraClimate shift likely reflected increased influence of JRA-55 anomalies following a sharp decline in gauge observations (Abatzoglou et al., 2018), while the gridMET inhomogeneity coincided with a reprocessed precipitation forcing that incorporated late-reporting gauges (Xia et al., 2016).
5.2 Optimal Datasets for Multi-Decadal Precipitation Analyses
Multiple products are suitable for multi-decadal analyses of annual precipitation totals for the southeastern United States. An optimal product should have three characteristics: (1) a relatively small cumulative residual total in the residual-mass analysis; (2) no statistically significant discontinuities; and (3) a precipitation trend within 10 % of the reference trend. Two product combinations – Daymet–nClimGrid and Daymet–nClimGrid–PRISM LT – meet these criteria. In these combinations, the wetting bias in Daymet is offset by the drying biases in nClimGrid and, to a lesser extent, PRISM LT. The result is a temporally stable series that exhibits no detectable discontinuities and produces a trend closely aligned with the reference time series. A limitation of these combined datasets is the reduction in spatial resolution resulting from use of nClimGrid, which has ∼4 km grid cells that are at least 16 times larger than the ∼1 km grids of Daymet and PRISM LT. For applications requiring finer spatial detail, this loss of resolution may be undesirable.
PRISM LT also merits consideration as a viable individual product for multi-decadal precipitation analyses. Although the product has a statistically significant discontinuity in 1993, it produced the smallest cumulative residual total among the individual products, and its decadal trend (27 mm per decade) is within 10 % of the reference trend. The 1993–2024 period can be homogenized by applying a multiplicative adjustment factor of 1.0095 derived using the mean-ratio approach outlined by Peterson et al. (1998). However, a potential long-term limitation of PRISM LT is the continued decline in COOP gauge coverage, as the product is dominated by COOP observations and further reductions in that network could decrease spatial representativeness and potentially reduce accuracy over time.
Gridded precipitation datasets commonly used for hydroclimatic analyses exhibit substantial temporal inhomogeneities that can distort long-term trend assessments. Evaluation of six high-resolution products and their combinations for the southeastern United States during 1980–2024 revealed statistically significant discontinuities in most series, with shifts clustering in 1991–1993, 2002, 2005, 2011–2012, and 2016 and largely coinciding with changes in gauge networks or data processing. Wetting biases in Daymet and PRISM AN reflected the expansion of CoCoRaHS and decline of COOP gauges, whereas a drying bias in nClimGrid and, to a lesser degree, PRISM LT were associated with increasing influence of ASOS tipping-bucket gauges. Abrupt step changes in TerraClimate and gridMET corresponded to documented shifts in input data and processing. These inhomogeneities produced precipitation trends ranging from 19 to 48 mm per decade, compared with a non-significant reference trend of 30 mm per decade. Two product combinations – Daymet–nClimGrid and Daymet–nClimGrid–PRISM LT – removed detectable discontinuities and produced trends within 10 % of the reference, indicating improved temporal stability through offsetting wetting and drying biases. Despite a modest discontinuity, PRISM LT also represented a defensible standalone option because of its comparatively small cumulative residuals and near-reference trend. These findings pertain to temporal consistency rather than overall accuracy. Thus, datasets identified as temporally stable may not be optimal for applications requiring accurate day-to-day or location-specific estimates. Overall, the findings underscore the necessity of explicitly evaluating temporal consistency before applying gridded precipitation products in long-term hydroclimatic analyses.
Data used in this paper are available at https://doi.org/10.17632/37bm8hvpmk.2 (Diem, 2026).
The supplement related to this article is available online at https://doi.org/10.5194/hess-30-1999-2026-supplement.
The author has declared that there are no competing interests.
Publisher's note: Copernicus Publications remains neutral with regard to jurisdictional claims made in the text, published maps, institutional affiliations, or any other geographical representation in this paper. The authors bear the ultimate responsibility for providing appropriate place names. Views expressed in the text are those of the authors and do not necessarily reflect the views of the publisher.
This paper was edited by Markus Hrachowitz and reviewed by Christopher Daly and one anonymous referee.
Abatzoglou, J. T.: Development of gridded surface meteorological data for ecological applications and modelling, Int. J. Climatol., 33, 121–131, https://doi.org/10.1002/joc.3413, 2013.
Abatzoglou, J. T., Dobrowski, S. Z., Parks, S. A., and Hegewisch, K. C.: TerraClimate, a high-resolution global dataset of monthly climate and climatic water balance from 1958–2015, Sci. Data, 5, 170191, https://doi.org/10.1038/sdata.2017.191, 2018.
Buishand, T. A.: Tests for detecting a shift in the mean of hydrological time series, J. Hydrol., 73, 51–69, https://doi.org/10.1016/0022-1694(84)90032-5, 1984.
CoCoRaHS (Community Collaborative Rain, Hail & Snow Network): Why CoCoRaHS requires manual measurements, CoCoRaHS Headquarters, Fort Collins, CO, https://media.cocorahs.org/docs/Why CoCoRaHS requires manual measurements.pdf (last access: 16 November 2025), 2019.
Daly, C., Gibson, W. P., Taylor, G. H., Doggett, M. K., and Smith, J. I.: Observer bias in daily precipitation measurements at United States Cooperative Network stations, B. Am. Meteorol. Soc., 88, 899–912, https://doi.org/10.1175/BAMS-88-6-899, 2007.
Daly, C., Halbleib, M., Smith, J. I., Gibson, W. P., Doggett, M. K., Taylor, G. H., Curtis, J., and Pasteris, P. P.: Physiographically sensitive mapping of climatological temperature and precipitation across the conterminous United States, Int. J. Climatol., 28, 2031–2064, https://doi.org/10.1002/joc.1688, 2008.
Daly, C., Doggett, M. K., Smith, J. I., Olson, K. V., Halbleib, M. D., Dimcovic, Z., Keon, D., Loiselle, R. A., Steinberg, B., Ryan, A. D., Pancake, C. M., and Kaspar, E. M.: Challenges in observation-based mapping of daily precipitation across the conterminous United States, J. Atmos. Ocean. Technol., 38, 1979–1992, https://doi.org/10.1175/JTECH-D-21-0054.1, 2021.
De La Fraga, P., Del-Toro-Guerrero, F. J., Vivoni, E. R., Cavazos, T., and Kretzschmar, T.: Evaluation of gridded precipitation datasets in mountainous terrains of Northwestern Mexico, J. Hydrol.: Reg. Stud., 56, 102019, https://doi.org/10.1016/j.ejrh.2024.102019, 2024.
Diem, J.: Data for Asessing the Temporal Stability of Gridded Precipitation Products in the Southeastern United States, Mendeley Data, V2 [data set], https://doi.org/10.17632/37bm8hvpmk.2, 2026.
Doesken, N.: A ten-year comparison of daily precipitation from the 4′′ diameter clear plastic rain gauge versus the 8′′ diameter metal standard rain gauge, Preprints, 13th Symposium on Meteorological Observations and Instrumentation, Savannah, GA, Amer. Meteor. Soc., https://media.cocorahs.org/docs/AMS_NJD_GaugeComparison_AppldClimate_2-2.pdf (last access: 16 November 2025), 2005.
Döll, P., Douville, H., Güntner, A., Müller Schmied, H., and Wada, Y.: Modelling freshwater resources at the global scale: challenges and prospects, Surv. Geophys., 37, 195–221, https://doi.org/10.1007/s10712-015-9343-1, 2016.
Dunn, R. E., Fowler, H. J., Green, A. C., and Lewis, E.: Tipping‐bucket rain gauges: a review of the undercatch phenomenon, and methods for its reduction and correction, Weather, 80, 196–205, https://doi.org/10.1002/wea.7736, 2025.
Easterling, D. R. and Peterson, T. C.: A new method for detecting undocumented discontinuities in climatological time series, Int. J. Climatol., 15, 369–377, https://doi.org/10.1002/joc.3370150403, 1995.
Ferencz, S. B., Sun, N., Turner, S. W. D., Smith, B. A., and Rice, J. S.: Multisectoral analysis of drought impacts and management responses to the 2008–2015 record drought in the Colorado Basin, Texas, Nat. Hazards Earth Syst. Sci., 24, 1871–1896, https://doi.org/10.5194/nhess-24-1871-2024, 2024.
Ferguson, C. R. and Mocko, D. M.: Diagnosing an artificial trend in NLDAS-2 afternoon precipitation, J. Hydrometeorol., 18, 1051–1070, https://doi.org/10.1175/JHM-D-16-0251.1, 2017.
Goble, P. E., Doesken, N. J., Durre, I., Schumacher, R. S., Stewart, A., and Turner, J.: Who received the most rain today?: An analysis of daily precipitation extremes in the contiguous United States using CoCoRaHS and COOP reports, B. Am. Meteorol. Soc., 101, E710–E719, https://doi.org/10.1175/BAMS-D-18-0310.1, 2019.
Guentchev, G., Barsugli, J. J., and Eischeid, J.: Homogeneity of gridded precipitation datasets for the Colorado River Basin, J. Appl. Meteorol. Climatol., 49, 2404–2415, https://doi.org/10.1175/2010JAMC2484.1, 2010.
Helsel, D. R. and Hirsch, R. M.: Statistical methods in water resources, Techniques of Water-Resources Investigations, Book 4, Chapter A3, U.S. Geological Survey, https://pubs.usgs.gov/twri/twri4a3/twri4a3.pdf (last access: 16 November 2025), 2002.
Henn, B., Newman, A. J., Livneh, B., Daly, C., and Lundquist, J. D.: An assessment of differences in gridded precipitation datasets in complex terrain, J. Hydrol., 556, 1205–1219, https://doi.org/10.1016/j.jhydrol.2017.03.008, 2018.
Kidd, C., Becker, A., Huffman, G. J., Muller, C. L., Joe, P., Skofronick-Jackson, G., and Kirschbaum, D. B.: So, How much of the Earth's surface is covered by rain gauges?, B. Am. Meteorol. Soc., 98, 69–78, https://doi.org/10.1175/BAMS-D-14-00283.1, 2017.
Kunkel, K. E., Stevens, L. E., Stevens, S. E., Sun, L., Janssen, E., Wuebbles, D., Konrad, C. E. II, Fuhrman, C. M., Keim, B. D., Kruk, M. C., Billot, A., Needham, H., Shafer, M., and Dobson, J. G.: Regional climate trends and scenarios for the U.S. National Climate Assessment. Part 2: Climate of the Southeast U.S., NOAA Tech. Rep. NESDIS 142-2, National Oceanic and Atmospheric Administration, Washington, DC, 2013.
Labosier, C. and Quiring, S.: Hydroclimatology of the Southeastern USA, Clim. Res., 57, 157–171, https://doi.org/10.3354/cr01166, 2013.
Laiti, L., Mallucci, S., Piccolroaz, S., Bellin, A., Zardi, D., Fiori, A., Nikulin, G., and Majone, B.: Testing the hydrological coherence of high-resolution gridded precipitation and temperature data sets, Water Resour. Res., 54, 1999–2016, https://doi.org/10.1002/2017WR021633, 2018.
Livneh, B., Bohn, T. J., Pierce, D. W., Munoz-Arriola, F., Nijssen, B., Vose, R., Cayan, D. R., and Brekke, L.: A spatially comprehensive, hydrometeorological data set for Mexico, the U.S., and Southern Canada 1950–2013, Sci. Data, 2, 150042, https://doi.org/10.1038/sdata.2015.42, 2015.
Mankin, K. R., Mehan, S., Green, T. R., and Barnard, D. M.: Review of gridded climate products and their use in hydrological analyses reveals overlaps, gaps, and the need for a more objective approach to selecting model forcing datasets, Hydrol. Earth Syst. Sci., 29, 85–108, https://doi.org/10.5194/hess-29-85-2025, 2025.
McAfee, S., Guentchev, G., and Eischeid, J.: Reconciling precipitation trends in Alaska: 2. Gridded data analyses, J. Geophys. Res.-Atmos., 119, https://doi.org/10.1002/2014JD022461, 2014.
Michelon, A., Benoit, L., Beria, H., Ceperley, N., and Schaefli, B.: Benefits from high-density rain gauge observations for hydrological response analysis in a small alpine catchment, Hydrol. Earth Syst. Sci., 25, 2301–2325, https://doi.org/10.5194/hess-25-2301-2021, 2021.
Mizukami, N. and Smith, M. B.: Analysis of inconsistencies in multi-year gridded quantitative precipitation estimate over complex terrain and its impact on hydrologic modeling, J. Hydrol., 428–429, 129–141, https://doi.org/10.1016/j.jhydrol.2012.01.030, 2012.
Muche, M. E., Sinnathamby, S., Parmar, R., Knightes, C. D., Johnston, J. M., Wolfe, K., Purucker, S. T., Cyterski, M. J., and Smith, D.: Comparison and evaluation of gridded precipitation datasets in a Kansas agricultural watershed using SWAT, J. Am. Water Resour. Assoc., 56, 486–506, https://doi.org/10.1111/1752-1688.12819, 2020.
National Research Council: Future of the National Weather Service Cooperative Observer Network, National Weather Service Modernization Committee, Commission on Engineering and Technical Systems, National Academy Press, Washington, DC, 1998.
National Research Council: The National Weather Service modernization and associated restructuring: a retrospective assessment, Committee on the Assessment of the National Weather Service’s Modernization Program, Board on Atmospheric Sciences and Climate, Division on Earth and Life Studies, National Academies Press, Washington, DC, 2012.
New, M., Todd, M., Hulme, M., and Jones, P.: Precipitation measurements and trends in the twentieth century, Int. J. Climatol., 21, 1889–1922, https://doi.org/10.1002/joc.680, 2001.
Newman, A. J., Clark, M. P., Sampson, K., Wood, A., Hay, L. E., Bock, A., Viger, R. J., Blodgett, D., Brekke, L., Arnold, J. R., Hopson, T., and Duan, Q.: Development of a large-sample watershed-scale hydrometeorological data set for the contiguous USA: data set characteristics and assessment of regional variability in hydrologic model performance, Hydrol. Earth Syst. Sci., 19, 209–223, https://doi.org/10.5194/hess-19-209-2015, 2015.
Peterson, T. C., Easterling, D. R., Karl, T. R., Groisman, P., Nicholls, N., Plummer, N., Torok, S., Auer, I., Boehm, R., Gullett, D., Vincent, L., Heino, R., Tuomenvirta, H., Mestre, O., Szentimrey, T., Salinger, J., Førland, E. J., Hanssen-Bauer, I., Alexandersson, H., Jones, P., and Parker, D.: Homogeneity adjustments of in situ atmospheric climate data: a review, Int. J. Climatol., 18, 1493–1517, https://doi.org/10.1002/(SICI)1097-0088(19981115)18:13<1493::AID-JOC329>3.0.CO;2-T, 1998.
Searcy, J. K. and Hardison, C. H.: Double-mass curves, in: Manual of Hydrology: Part 1, General Surface-Water Techniques, U.S. Geological Survey Water-Supply Paper 1541-B, 31–66, 1960.
Shuai, P., Chen, X., Mital, U., Coon, E. T., and Dwivedi, D.: The effects of spatial and temporal resolution of gridded meteorological forcing on watershed hydrological responses, Hydrol. Earth Syst. Sci., 26, 2245–2276, https://doi.org/10.5194/hess-26-2245-2022, 2022.
Tang, G., Clark, M. P., Knoben, W. J. M., Liu, H., Gharari, S., Arnal, L., Wood, A. W., Newman, A. J., Freer, J., and Papalexiou, S. M.: Uncertainty hotspots in global hydrologic modeling: the impact of precipitation and temperature forcings, B. Am. Meteorol. Soc., 106, E146–E166, https://doi.org/10.1175/BAMS-D-24-0007.1, 2025.
Thornton, P. E., Shrestha, R., Thornton, M., Kao, S.-C., Wei, Y., and Wilson, B. E.: Gridded daily weather data for North America with comprehensive uncertainty quantification, Sci. Data, 8, 190, https://doi.org/10.1038/s41597-021-00973-0, 2021.
Vose, R. S., Applequist, S., Squires, M., Durre, I., Menne, M. J., Williams, C. N., Fenimore, C., Gleason, K., and Arndt, D.: Improved historical temperature and precipitation time series for U.S. climate divisions, J. Appl. Meteorol. Climatol., 53, 1232–1251, https://doi.org/10.1175/JAMC-D-13-0248.1, 2014.
Wade, C. G.: A multisensor approach to detecting drizzle on ASOS, J. Atmos. Ocean. Tech., 20, 820–832, https://doi.org/10.1175/1520-0426(2003)020<0820:AMATDD>2.0.CO;2, 2003.
Wang, F. and Tian, D.: Hourly Evaluation of eight gridded precipitation datasets over the contiguous United States: intercomparison of satellite, radar, reanalysis, and merged products, J. Hydrometeorol., 26, 1717–1733, https://doi.org/10.1175/JHM-D-25-0063.1, 2025.
Xia, Y., Mocko, D., and Rodell, M.: An upgrade from current OPS NLDAS-2 system, in: Conference Presentation, NASA Goddard Space Flight Center, 7 July 2016.
Yang, D., Yang, Y., and Xia, J.: Hydrological cycle and water resources in a changing world: a review, Geogr. Sustain., 2, 115–122, https://doi.org/10.1016/j.geosus.2021.05.003, 2021.
Yue, S. and Wang, C. Y.: Power of the Mann-Whitney test for detecting a shift in median or mean of hydro-meteorological data, Stoch. Environ. Res. Risk Assess., 16, 307–323, https://doi.org/10.1007/s00477-002-0101-9, 2002.
Zandler, H., Haag, I., and Samimi, C.: Evaluation needs and temporal performance differences of gridded precipitation products in peripheral mountain regions, Sci. Rep., 9, 15118, https://doi.org/10.1038/s41598-019-51666-z, 2019.