the Creative Commons Attribution 4.0 License.
the Creative Commons Attribution 4.0 License.
 | 02 Apr 2026
From grid to ground: how well do gridded products represent soil moisture dynamics in natural ecosystems during precipitation events?
Daniel A. Núñez-Ibarra
Mauricio Zambrano-Bigiarini
Mauricio Galleguillos
Soil moisture (SM) is a critical variable governing land–atmosphere interactions and influencing ecohydrological and climatic processes. Despite substantial progress in estimating SM through remote sensing and land surface models, considerable uncertainties still remain, especially in near-natural and poorly monitored ecosystems interacting with deeper soil layers. In this study, the performance of four state-of-the-art gridded SM products (SMAP-L4, GLDAS-Noah, ERA5 and ERA5-Land) is evaluated against in situ observations at ten natural monitoring sites in central and southern Chile, covering different hydroclimatic conditions (five semi-arid and five humid sites). The evaluation is performed at a 3-hourly temporal resolution, using well-known statistical metrics of performance, including unbiased root mean square error, modified Kling–Gupta efficiency (KGE′), deseasonalised Spearman's rank correlation coefficient, and percent bias, each applied separately for surface soil moisture (SSM) and root zone soil moisture (RZSM). Finally, the dynamic SM responses to precipitation events is evaluated using rising time and amplitude SM signatures during the first and the most intense precipitation events of the year.
Our results show that ERA5 and ERA5-Land consistently outperform SMAP-L4 and GLDAS-Noah on most metrics and in most regions, with ERA5-Land being particularly strong in humid areas. However, SMAP-L4 achieved the best SSM performance in selected northern arid locations, based on KGE′; while GLDAS-Noah performed the worst overall, with the exception of moderate correlation values in southern RZSM. During the first precipitation event of the year, all products systematically overestimated both rising times and amplitudes in the arid north, indicating challenges in capturing SM responses under dry antecedent conditions. In contrast, all the gridded products aligned more closely with in situ measurements during intense precipitation events, particularly in humid regions. Our findings suggest that both ERA5 and ERA5-Land are valuable datasets for monitoring SM variability in near-natural and data-scarce ecosystems, while highlighting the value of event-based SM signatures to complement traditional performance metrics. Finally, we recommend the use of the deseasonalised Spearman rank correlation to better detect inconsistencies in temporal dynamics, especially in regions with strong seasonal cycles, such as arid environments.
- Article
(5994 KB) - Full-text XML
-
Supplement
(16696 KB) - BibTeX
- EndNote


A sound representation of the spatio-temporal dynamics of soil moisture (SM) is essential for improving our understanding of eco-hydrological processes and for enhancing the accuracy of hydrological and climate models, particularly in regions with complex hydroclimatic conditions. SM has a direct influence on important hydrological processes such as infiltration, runoff, and evaporation; mediates the exchange of energy and mass between land and atmosphere (Vereecken et al., 2022), and actively regulates the water resources available to vegetation in space and time (Peng et al., 2021). Surface soil moisture (SSM) refers to the moisture content within the top layer of soil, typically the first 5–10 cm. In contrast, root zone soil moisture (RZSM) refers to the moisture available in deeper soil layers (typically 100 cm or more), where plant roots can extract water. Understanding the dynamic fluctuations of these two variables across different ecosystems is essential for improving drought monitoring, hydrological modelling, long-term water availability estimates, and water resources management, among others.
Dynamic fluctuations of SSM and RZSM are primarily governed by changes in precipitation (P), the primary source of soil water recharge. In particular, the spatial and temporal variability of SSM is directly influenced by the frequency and intensity of P events, affecting its immediate availability in the top soil layer (Zheng et al., 2022b; Xi et al., 2023). In contrast, RZSM responds to precipitation changes with a delay, as water must infiltrate into deeper soil layers before being stored in the root zone (Tian et al., 2019). This temporal difference plays a fundamental role in water transfers in the soil, particularly in regions with irregular precipitation patterns, where RZSM retains water for extended periods of time (Hao et al., 2019; Räsänen et al., 2020).
Accurately representing SM dynamics across different ecosystems requires reliable and spatially continuous data. SM data are derived from diverse sources, including in situ measurements, satellite observations, land surface models (LSMs), and reanalysis datasets. In situ measurements provide highly accurate data, although their spatial coverage is limited, with monitoring networks concentrated predominantly in the Northern Hemisphere (Beck et al., 2021). Noteworthy networks; such as TERENO (Zacharias et al., 2011), OzNet (Smith et al., 2012), COSMOS-UK (Evans et al., 2016), and the International Soil Moisture Network (ISMN; Dorigo et al., 2021); provide valuable long-term datasets. However, most of these networks only provide estimates for the first few centimetres of the soil profile (Dorigo et al., 2021), have limited coverage in the Southern Hemisphere, and rarely include natural ecosystems with minimally disturbed soils.
On the other hand, satellite observations provide a consistent and (near-)global estimates of SSM at varying spatial and temporal resolutions. Passive microwave sensors, such as those onboard Soil Moisture Active Passive (SMAP; Entekhabi et al., 2010) and the Advanced Microwave Scanning Radiometer 2 (AMSR2; Imaoka et al., 2012; Parinussa et al., 2015), estimate SM by detecting variations in land surface emissivity; while active microwave sensors, like those used in Sentinel-1, leverage radar backscatter to retrieve SSM at higher spatial resolution (Paloscia et al., 2013). However, satellite-based SM retrievals are generally limited to the top soil layer, typically within the upper 10 cm, and are affected by factors such as vegetation cover and radio frequency interference. As a result, integrating multiple data sources is often necessary to enhance their accuracy (Peng et al., 2021; Dorigo et al., 2021). More critically, satellite observations cannot capture SM dynamics in deeper soil layers (i.e., in the RZSM), which is vital for understanding long-term water availability and plant growth dynamics.
To address some of the limitations of satellite estimates, in the last decades several LSMs and reanalysis datasets have been used to estimate SM across multiple soil depths. Land surface models, such as NOAH-MP (Niu et al., 2011) and the Community Land Model (CLM; Lawrence et al., 2019), simulate physical, chemical, and biological processes at the land–atmosphere interface by solving equations that govern the balances of energy, water, momentum, and carbon. Their inputs typically include atmospheric forcing data (e.g., P, radiation, wind, temperature) and they simulate SM at multiple depths based on soil, vegetation, and terrain characteristics (Van Den Broeke et al., 2018; Zhuo et al., 2019). On the other hand, reanalysis like ERA5-Land (Muñoz Sabater et al., 2021) and MERRA-2 (Gelaro et al., 2017) aim to create a comprehensive and time-consistent representation of atmospheric, oceanic, and land variables, by using data assimilation to combine observations (e.g., satellites, weather stations) with output from a global numerical weather prediction (NWP) model. Land surface models are often embedded within a reanalysis system to simulate land variables, resulting in high temporal and spatial resolution datasets covering last decades (Gelaro et al., 2017; Hersbach et al., 2020). However, the accuracy of reanalysis depends on the quality of the assimilated observations and model parameterisations, requiring validation against in situ measurements to improve regional applicability (Beck et al., 2021).
Despite advances in LSMs, satellite observations, and reanalysis datasets, the limited availability of in situ SM data in the Southern Hemisphere poses a significant challenge for validating these (near-global) estimates. The lack of a comprehensive ground-based SM network hinders our ability to analyse SM variability, particularly in heterogeneous landscapes. Furthermore, while gridded SM products have demonstrated good performance in studies with many observations (Beck et al., 2021; Lai et al., 2023; Zheng et al., 2023, 2024; Brocca et al., 2024), their applicability in data-sparse regions remains uncertain and requires evaluation before widespread adoption.
Direct evaluation of gridded SM datasets against in situ observations are complicated by differences in spatial and temporal resolution, which might lead to misinterpretations of SM dynamics (Colliander et al., 2018). In addition, time series comparisons for medium to long-term periods fail to capture the complete SM dynamics, as they do not adequately reflect short-term fluctuations and retention patterns that influence hydrological and ecological processes (Araki et al., 2022). To overcome these limitations, SM signatures have emerged over the last decade as valuable metrics for analysing gridded datasets and assessing the dynamic response of SM to precipitation events in different ecological contexts (Branger and McMillan, 2020; Araki et al., 2022). In contrast to traditional full-time series comparisons, SM signatures allow a more detailed characterisation of SM dynamics and provide insights into key hydrological soil processes, such as wetting and drying cycles, water retention and infiltration (Branger and McMillan, 2020; Araki et al., 2022, 2023). With climate projections suggesting further declines in SM and increasing aridification in semi-arid regions (such as central Chile) by the end of the 21st century (Lai et al., 2023), an exhaustive evaluation of the SM responses to P events is critical to better understand the spatio-temporal dynamics of SM.
Chile's diverse ecosystems, ranging from semi-arid shrublands to temperate native forests, exhibit distinct water retention and infiltration processes (Bown et al., 2018); making the region an excellent natural laboratory for evaluating soil moisture dynamics under contrasting hydroclimatic conditions. For instance, the limited water retention capacity of soils in the semi-arid Petorca River Basin leads to rapid SM depletion after the occurrence of P events (Muñoz et al., 2020). In contrast, the deep soils and dense native vegetation typical of the Trancura River Basin allow for longer water storage (Frêne et al., 2020). By evaluating gridded SM products under such contrasting hydroclimatic and ecological conditions, this study will contribute to filling the existing gap in their assessment on natural, undisturbed ecosystems, especially in under-represented regions of the Southern Hemisphere. Our results will help to improve our understanding of eco-hydrological processes and increase the accuracy of hydrological and climatic modelling applications. To this end, we present the first evaluation of 3-hourly gridded SM datasets for native ecosystems in South America, focusing on their ability to capture surface and root zone dynamics during precipitation events. Specifically, we address the following two research questions:
-
How well do 3-hourly gridded products represent SSM and RZSM dynamics in natural ecosystems of the Southern Hemisphere during precipitation events?
-
How reliably do gridded datasets represent SM signatures across diverse hydroclimatic conditions?
2.1 Study area
The study area is situated in central-southern Chile, between 32.01 and 39.64° S, and is characterised by a wide variety of elevations, land cover, soil properties, and aridity, as shown in Fig. 1. In the north, the Petorca River Basin (PRB, in the Valparaíso region) is semi-arid, dominated by sparse shrublands and low P amounts. The Mapocho en Los Almendros River Basin (MRB, in the Metropolitan region) transitions to a moderate climate with shrublands and agricultural fields. The Cauquenes River Basin (CRB, in the Maule and Ñuble regions) is more humid, with a predominance of pine plantations and native shrublands. Further south, the Trancura River Basin (TRB, in the Araucanía region) is characterised by dense native forests, high P amounts, and elevations exceeding 2000 m a.s.l. The aridity index (, where PET stands for potential evapotranspiration), derived from the Global-AI-PET-v3 dataset (Zomer et al., 2022), emphasises the pronounced climatic gradient in the study area, which ranges from arid conditions in the PRB (AI < 0.3) to very humid conditions in the TRB (AI > 1.25).
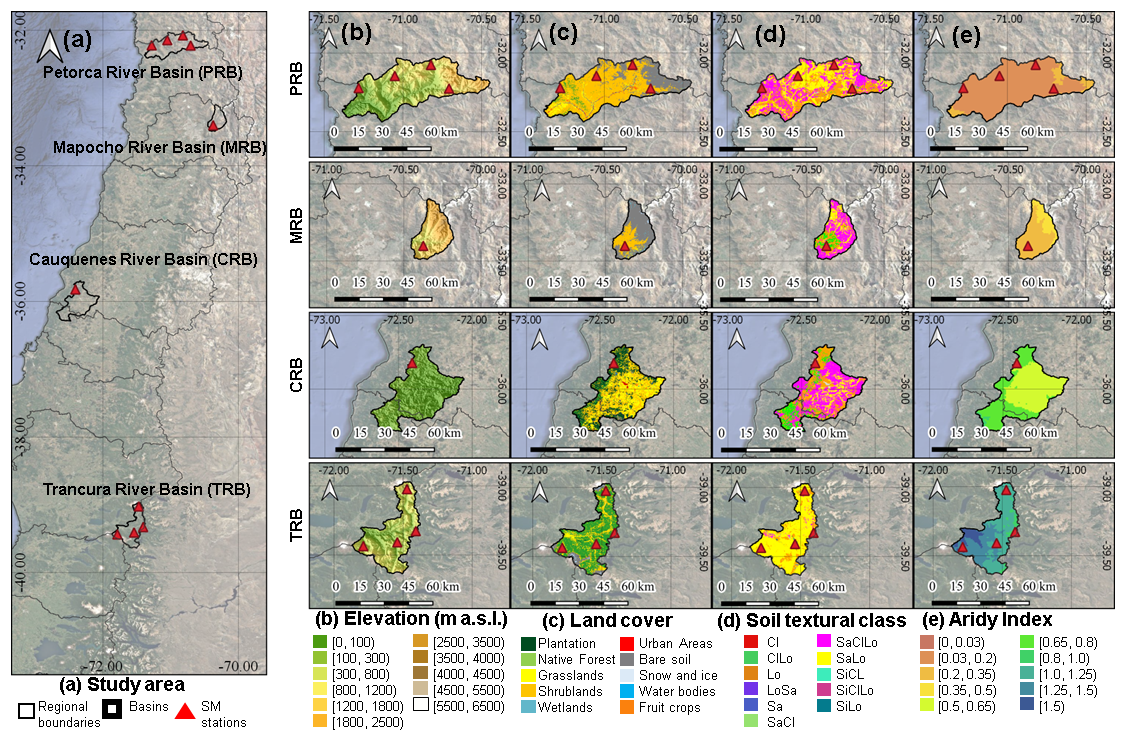
Figure 1Study area: (a) catchment location (CAMELS-CL; Alvarez-Garreton et al., 2018); (b) elevation (SRTMv4.1; Jarvis et al., 2008); (c) land cover classification (CLDynamicLandCover.V2; Galleguillos et al., 2024); (d) soil properties (CLSoilMaps; Dinamarca et al., 2023); and (e) aridity index () 1970–2000 (Global-AI-PET-v3; Zomer et al., 2022). Imagery © 2024 Landsat/Copernicus, Map data © 2025 Google (Google LLC, 2025).
2.2 Gridded SM datasets
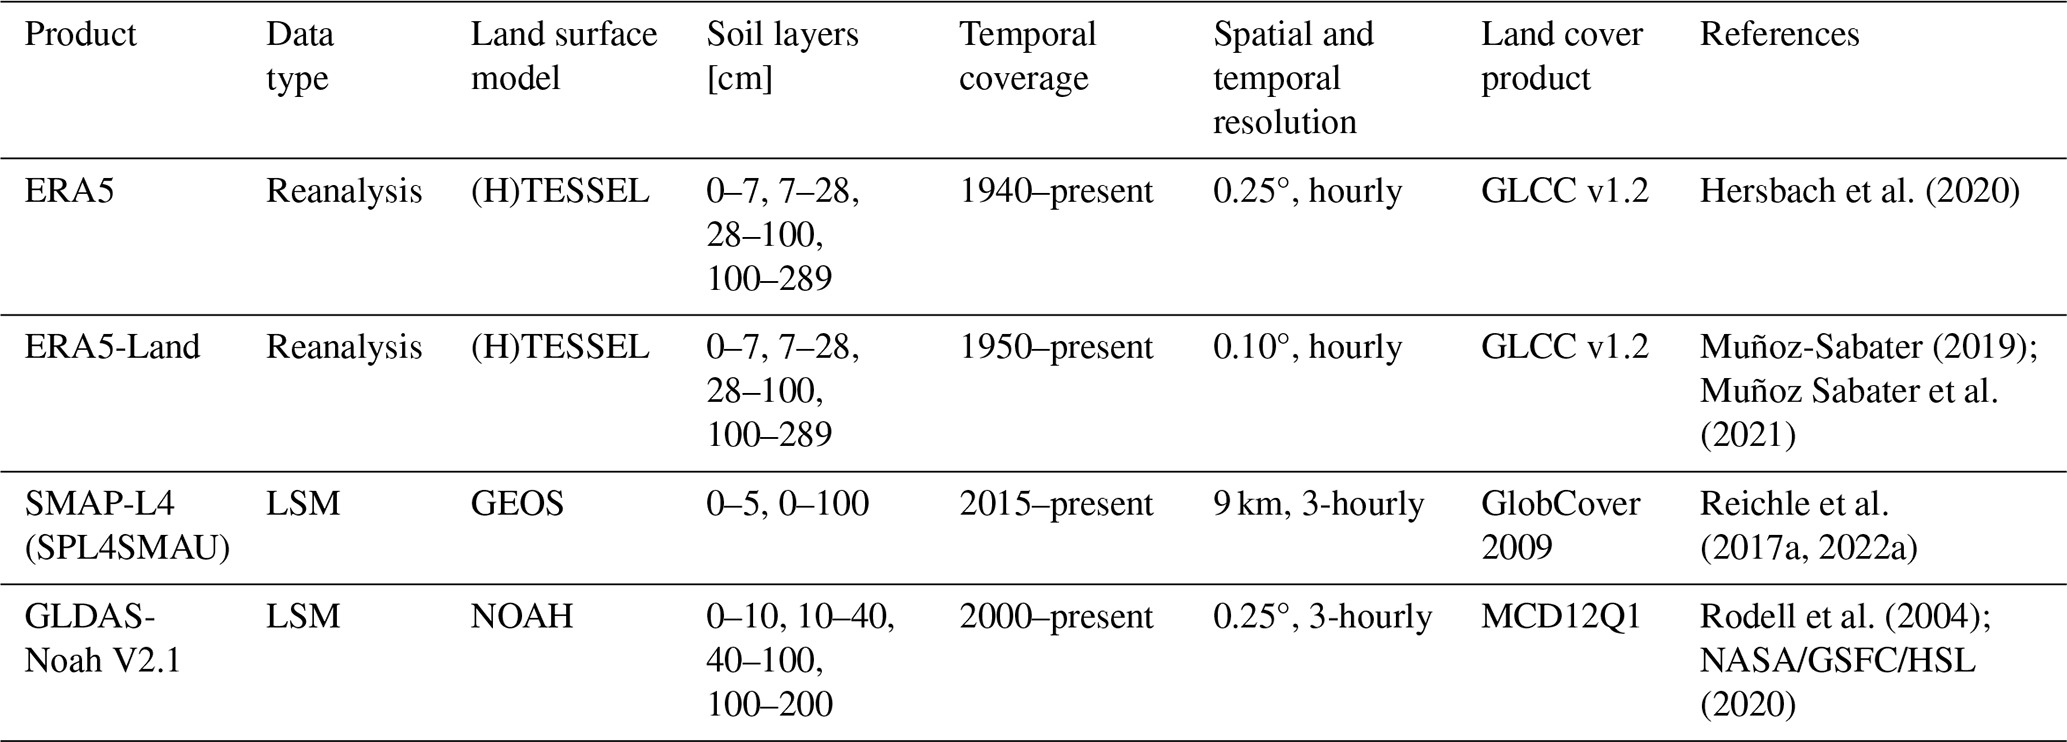
We evaluate four gridded soil moisture datasets selected to represent distinct modelling frameworks and assimilation strategies. Our selection includes ERA5 and ERA5-Land reanalysis products, which share atmospheric forcing but differ in resolution (31 km in ERA5, 9 km in ERA5-Land) and assimilation (active in ERA5, absent in ERA5-Land); this pairing allows us to isolate the specific impacts of spatial downscaling and satellite data assimilation. Furthermore, we selected GLDAS-Noah and SPL4SMAU to complement the reanalysis products by using two additional and widely used global frameworks. In particular, SMAP Level 4 (SPL4SMAU) represents the state-of-the-art in L-band satellite data assimilation for root-zone estimates, while GLDAS-Noah serve as the standard open-loop model benchmark. This selection encompasses the full spectrum of available global products: reanalysis, high-resolution land replay, satellite-driven assimilation, and model-only simulations. These four products are briefly described below.
2.2.1 ERA5
ERA5 is the fifth-generation reanalysis product developed by the European Centre for Medium-Range Weather Forecasts (ECMWF; Hersbach et al., 2020). It uses the Hydrology Tiled ECMWF Scheme for Surface Exchanges over Land (HTESSEL) to effectively simulate SM dynamics, capturing complex interactions among precipitation, evaporation, infiltration, and runoff. These hydrological processes are modelled through advanced equations that elucidate the energy and water exchanges between soil, vegetation, and the atmosphere. A key feature of ERA5 is the integration of remote sensing data for SM over land, using backscatter data from C-band scatterometers. Although SM retrievals from satellite sources such as the Advanced Scatterometer (ASCAT; Wagner et al., 2013) are not directly assimilated into ERA5, they have a important impact on the modelled surface fluxes and soil states, enhancing the accuracy of the simulated SM. This dataset contains high-resolution data on volumetric soil water content in four vertical layers: 0–7 cm for SSM and 7–28, 28–100 and 100–289 cm for RZSM; with an hourly temporal resolution and a native spatial resolution of 31 km, from 1940 to present. This high-resolution and globally uniform coverage proves essential for various applications, ranging from hydrological modelling to agricultural planning. Here we used the hourly ERA5 single-levels reanalysis data, from the Copernicus Climate Data Store (Hersbach et al., 2023).
2.2.2 ERA5-Land
ERA5-Land is a reanalysis dataset that further refines the land component of ERA5, providing a high-resolution and consistent overview of land variables over several decades (Muñoz Sabater et al., 2021). ERA5-Land operates at a spatial resolution of 0.10° and extends from 1950 to present, using the HTESSEL as land surface model, driven by downscaled ERA5 meteorological data to account for elevation differences (Muñoz-Sabater, 2019). In contrast to ERA5, which involves indirect assimilation of observational data, ERA5-Land relies exclusively on physical modelling within HTESSEL to simulate SM dynamics in the four vertical soil layers without direct data assimilation. This method ensures a complete derivation of SM from high-resolution meteorological data, which maintains the physical consistency of the land surface simulations and avoids artifacts due to corrections of the observational data. This dataset provides volumetric soil water content in the same four vertical layers of ERA5, allowing a more detailed visualisation of the local-scale variations of SM, as influenced by topography, vegetation and soil properties (Muñoz Sabater et al., 2021; Nogueira et al., 2020; Liu et al., 2024). Here we used the hourly data obtained from the Copernicus Climate Data Store (Muñoz Sabater et al., 2021).
2.2.3 SMAP-L4 (SPL4SMAU)
The NASA Soil Moisture Active and Passive (SMAP; Entekhabi et al., 2010) Level-4 Soil Moisture (Reichle et al., 2022a, b) product (SMAP-L4) provides comprehensive global estimates of SM at the surface (0–5 cm) and in the root zone (0–100 cm) with a spatial resolution of 9 km, updated every 3 h from March 2015 onwards. This dataset integrates L-band brightness temperature observations from the SMAP radiometer into the Catchment Land Surface Model (CLSM; Reichle et al., 2022b). The data assimilation system used in this product corresponds to the Goddard Earth Observing System Version 7 (GEOS-5 LDAS), which contains a spatially distributed ensemble Kalman filter with a 3-hourly update interval for the integration of observations and model simulations (Rienecker et al., 2008; Reichle et al., 2022b). The meteorological surface data of the GEOS-5 Forward Processing (FP) system drives the CLSM model, using the daily CPCU precipitation observations to adjust and scale the GEOS-5 FP precipitation data to the climatology of the Global Precipitation Climatology Project version 2.2 (GPCP v2.2; Adler et al., 2020). The SMAP L4 product also integrates soil properties from the Harmonized World Soil Database (HWSD) V1.2 (Wieder et al., 2014) and land cover data from the GlobCover 2009 (Arino et al., 2012). Here we used the SMAP L4 Global 3-hourly 9 km EASE-Grid grid Surface and Root Zone Soil Moisture Analysis Update (SPL4SMAU; Reichle et al., 2022a) data version 7 available from the NSIDC (https://nsidc.org/data/spl4smau/versions/7, last access: 24 March 2026).
2.2.4 GLDAS-Noah
The Global Land Data Assimilation System (GLDAS; Rodell et al., 2004) NOAH version 2.1 (Beaudoing et al., 2020) is developed by NASA's Goddard Earth Sciences Data and Information Services Center (GES DISC), and delivers optimal land surface states and fluxes without incorporating data assimilation. Operating offline, the Noah Land Surface Model is driven by a combination of atmospheric fields from NOAA's Global Data Assimilation System, precipitation data from the Global Precipitation Climatology Project (GPCP) V1.3 Daily Analysis (Huffman et al., 1997), and radiation inputs from AGRMET (Meng et al., 2001). Soil moisture dynamics are represented in a four-layer soil column, simulated by the diffusive form of the Richards equation. Additionally, GLDAS-Noah utilizes a hybrid STATSGO/FAO World Soil Map (Dy and Fung, 2016) and applies a modified MODIS vegetation classification scheme with 20 categories (Rui et al., 2021). Unlike ERA5, the GLDAS-Noah product is available at 3 h intervals. Here we used the GLDAS-Noah v2.1 data from GES DISC (NASA/GSFC/HSL, 2020).
Hersbach et al. (2020)Muñoz-Sabater (2019); Muñoz Sabater et al. (2021)Reichle et al. (2017a, 2022a)Rodell et al. (2004); NASA/GSFC/HSL (2020)Table 1Gridded global soil moisture products used in this study.
2.3 In situ SM observations
To evaluate the four gridded SM datasets described in Sect. 2.2, we used the Kimün-Ko SM monitoring network, which has been fully operational since 2022. It was developed to characterise SM variability in undisturbed ecosystems of central and southern Chile, which are under-represented in global monitoring networks that primarily focus on agricultural areas in the Northern Hemisphere. (Dorigo et al., 2021; Beck et al., 2021).
The Kimün-Ko network estimate SM dynamics using TEROS 10 and TEROS 12 capacitance sensors, installed at depths ranging from 10 to 200 cm and connected to ZL6 data loggers for high-frequency data acquisition. Ten monitoring sites were selected within the study area (Fig. 2); five in the semi-arid north (PRB and MRB, Fig. 2b) and five in the humid south (CRB and TRB, Fig. 2c); to reflect a range of hydroclimatic conditions and land cover types. All ten SM monitoring sites are situated in areas classified as Sandy Loam (SaLo) based on CLSoilMaps (Dinamarca et al., 2023). The placement of each station also ensures spatial correspondence with the cells of the gridded SM products being evaluated. At each site, volumetric soil water content (m3 m−3) is recorded at an hourly temporal resolution.
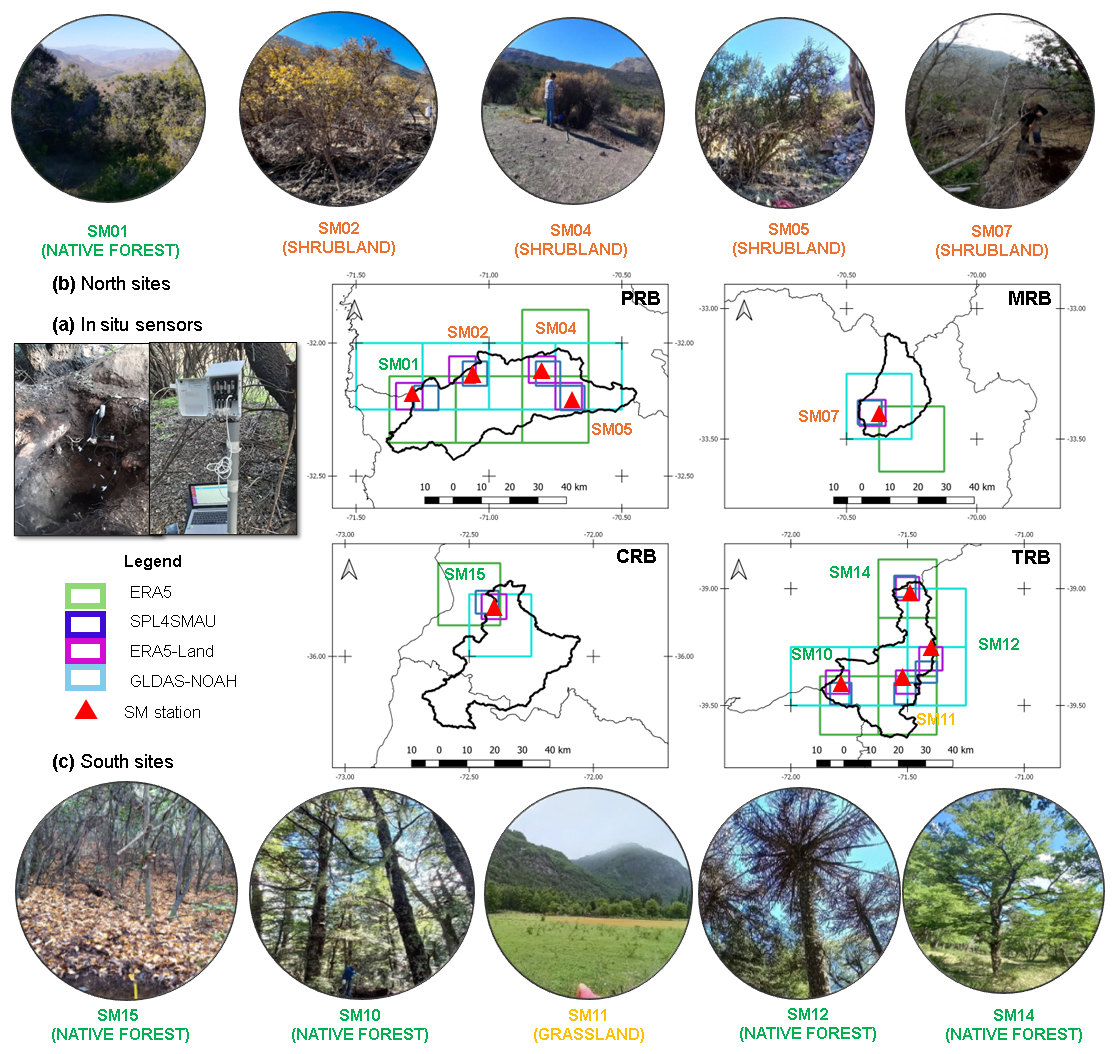
Figure 2Locations of in situ TEROS 10 and TEROS 12 sensors. (a) Example of TEROS 10 and TEROS 12 sensors installed across various land cover types; (b) northern arid sites in the Petorca (PRB) and Mapocho (MRB) river basins; and (c) southern humid sites in the Cauquenes (CRB) and Trancura (TRB) river basins. Red triangles indicate the locations of in situ SM monitoring sites. Grid cell boundaries of each gridded SM product are shown for ERA5 (green), ERA5-Land (purple), SPL4SMAU (blue), and GLDAS-Noah (lightblue).
TEROS-10 and TEROS-12 sensors operate under the manufacturer's factory calibration for mineral soils, which provides a typical accuracy of ± 3 %–4 % volumetric water content for non-saline mineral textures (METER Group, 2023). The sensors estimate soil dielectric permittivity using a high-frequency (70 MHz) capacitance/frequency-domain technique, which minimises sensitivity to salinity and temperature variations (METER Group, 2023). This configuration is well suited for long-term monitoring in the low-salinity mineral soils characterising the Kimün-Ko sites.
An additional source of uncertainty might arise from the use of capacitive sensors as reference measurements. Although soil-specific calibration can reduce absolute bias, available procedures rely on disturbed or repacked samples (METER Group, 2023) and cannot preserve the natural soil structure, macroporosity, and aggregation that govern hydrological responses in undisturbed forest and shrubland soils. Given the remoteness and limited accessibility of several sites, extracting large intact monoliths was not operationally feasible. Consequently, factory calibration was adopted, introducing modest absolute uncertainty while retaining reliable temporal soil moisture dynamics.
Details of sensor depths and site characteristics are summarised in Tables 2 and 3, respectively. Each monitoring site is equipped with a rain gauge that is close enough to the SM sensor to be considered representative of the precipitation falling over the site. Table 2 show a summary of the sensor depths, location, elevation and land cover of each monitoring site, while Table 3 summarise the soil texture in each site. Detailed descriptions of the specific profiles used in this study are available in Sect. S1 of the Supplement.
Table 2Summary of in situ soil moisture sensors and main characteristics of each monitoring site.
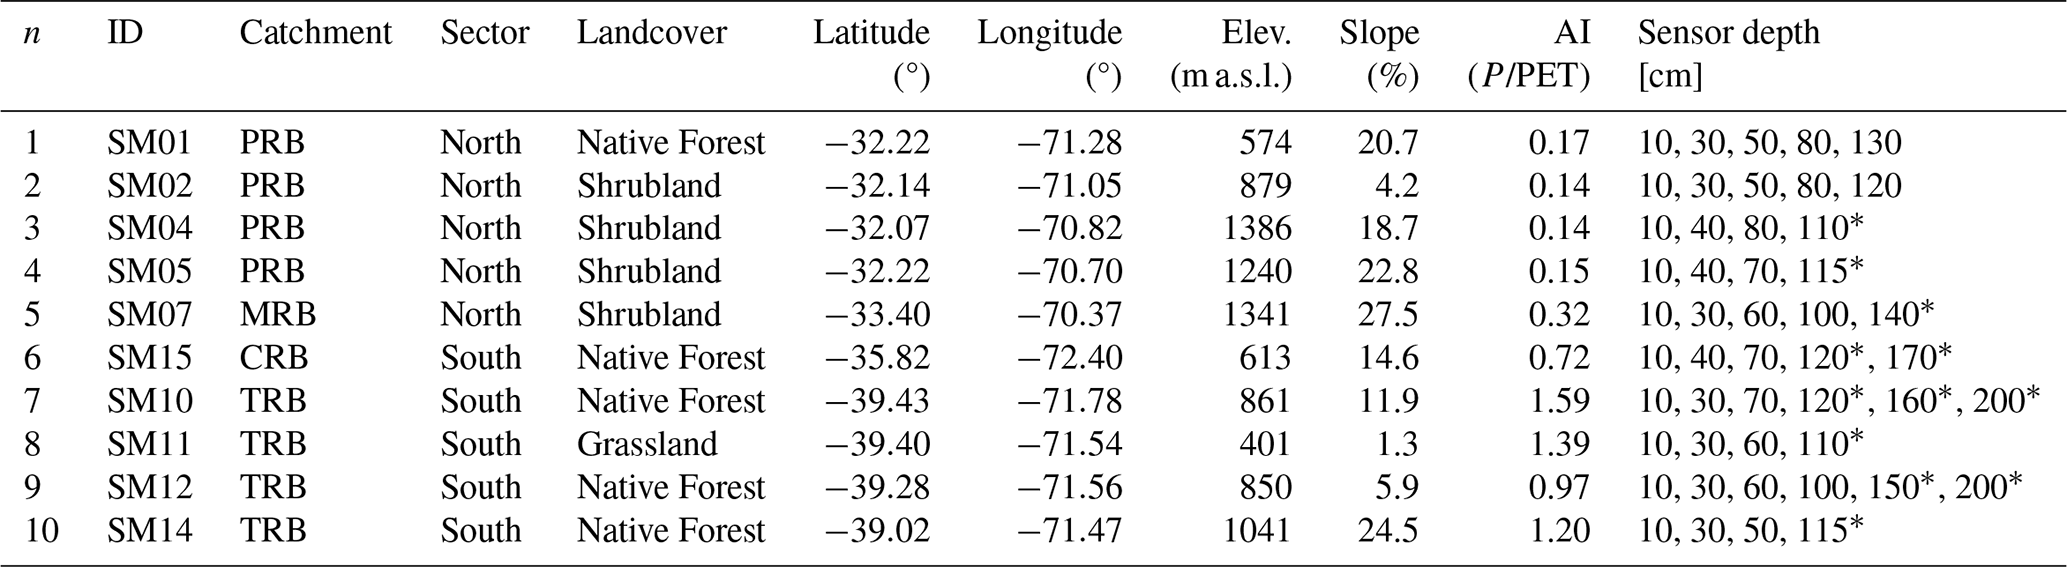
PRB: Petorca River Basin, MRB: Mapocho River Basin, CRB: Cauquenes River Basin, TRB: Trancura River Basin. * The sensors at these depths were not used in the present study. AI: Aridity index.
Table 3Soil texture for each in situ monitoring site for surface soil moisture (0–10 cm) and root zone soil moisture (0–100 cm).
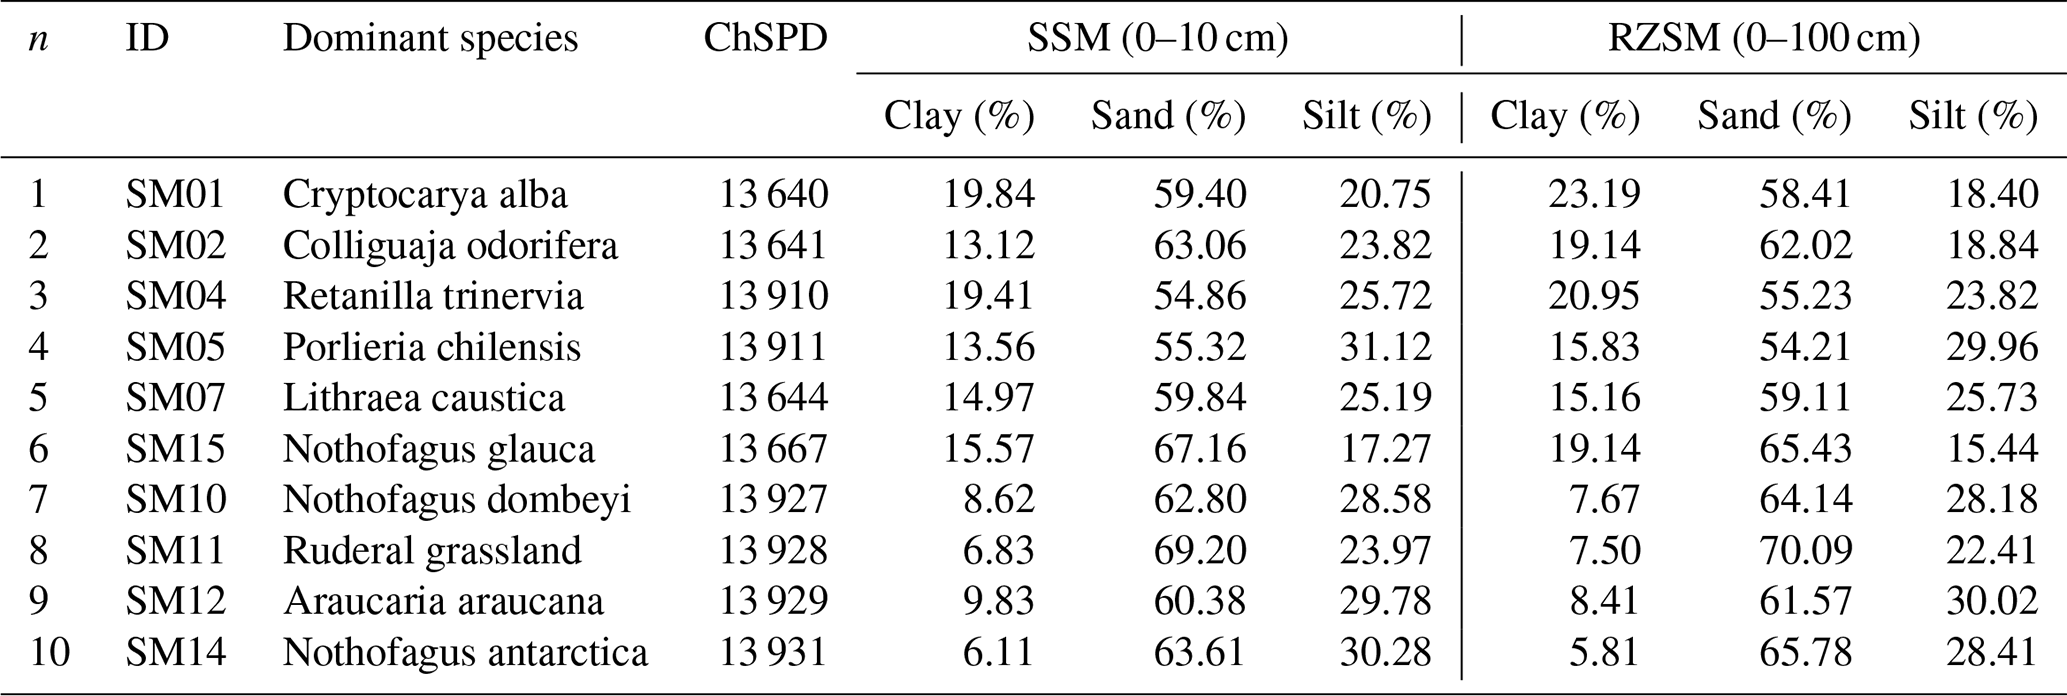
Clay, silt, and sand percentages are obtained from CLSoilMaps (Dinamarca et al., 2023), which provides data for the following layers: 0–5, 5–15, 15–30, 30–60, 60–100, and 100–200 cm. In addition, the corresponding ChSPD code (Seguel et al., 2024) is shown for each site, referencing the original database of 14 029 soil profile descriptions across Chile. Detailed descriptions of the specific profiles used in this study are available in Sect. S1 of the Supplement.
3.1 Data processing
3.1.1 Common temporal resolution
All gridded SM datasets were downloaded at their highest temporal resolution, and time series were extracted at the grid cell corresponding to each in situ monitoring site. To ensure temporal consistency across datasets, hourly outputs from ERA5, ERA5-Land, and in situ measurements were aggregated to 3 h intervals starting at 00:00:00 UTC. This harmonisation avoids unequal temporal comparison among products and minimises phase mismatches between precipitation forcing and soil moisture response, while preserving the temporal variability relevant for event-scale analyses. Similar aggregation strategies have been adopted in previous global soil moisture validation studies to ensure methodological consistency across datasets (Beck et al., 2021).
3.1.2 Surface soil moisture
Table 2 shows that all top soil in situ SM measurements were taken at 10 cm depth and, therefore, this depth was adopted as representative of in situ SSM. On the other hand, each gridded dataset defines SSM over different soil depths and, therefore, a single definition of SSM was adopted to ensure a fair comparison between all SM datasets and in situ observations. For ERA5 and ERA5-Land, the top layer of 0–7 cm was selected to represent SSM, as it is closest to the surface conditions measured by in situ sensors. On the other hand, GLDAS-Noah defines SSM as the 0–10 cm layer, and SPL4SMAU provides direct SSM estimates for the 0–5 cm layer, which are very close to the in situ sensor depth and require no additional adjustments.
3.1.3 Root zone soil moisture
Table 1 shows the different number of soil layers used all gridded datasets to estimate the SM dynamics in the root zone of the soil profile. In particular, ERA5 and ERA5-Land provide SM estimates for four layers up to 289 cm depth. GLDAS-Noah also provides SM estimates for four layers, but up to 200 cm; and SPL4SMAU provides only a single RZSM estimate from 0 to 100 cm depth. Therefore, in this work, root-zone soil moisture was harmonised to the 0–100 cm layer across all datasets to ensure consistency and enable a fair comparison among products with differing vertical resolutions and modelling schemes. This integration depth represents the active root zone for most natural ecosystems in Chile and is commonly adopted in global validation studies (Guo et al., 2023; Liu et al., 2024; Zheng et al., 2024). Consequently, the RZSM for all gridded datasets, except SPL4SMAU, was computed as a weighted average of the soil water content of the top three soil layers (0–100 cm), as shown in Fig. 3a and described in Eq. (1a).
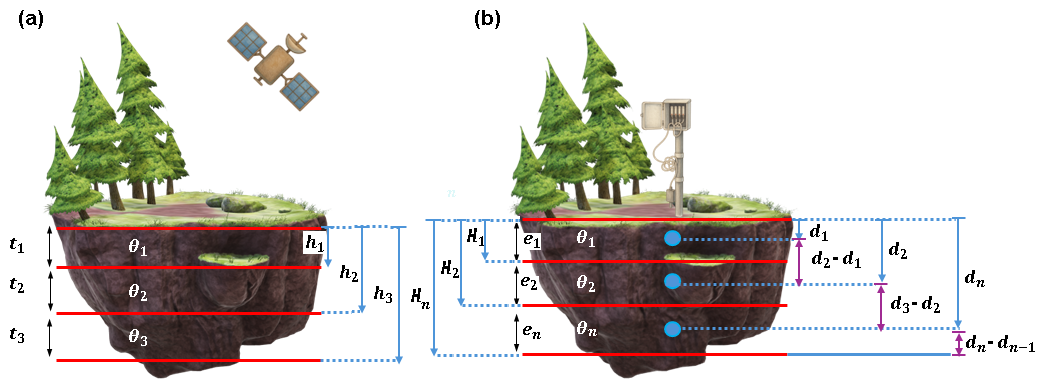
Figure 3Panel (a) illustrates the computation of the RZSM for all gridded datasets, except SPL4SMAU, using the first three soil layers of each SM product. Panel (b) illustrates the computation of the RZSM for each in situ monitoring site, using n SM sensors installed at depths .
On the other hand, each in situ monitoring site has a different number of SM sensors, each located at a different depth (see Table 2). Therefore, in order to be compared against the gridded RZSM, a single estimate of RZSM was calculated for each site, using a weighted average of all in situ measurements to the depth closest to 100 cm, following Xing et al. (2021), as shown in Fig. 3b and described in Eqs. (1b) and (2).
In Fig. 3 and Eqs. (1) and (2), θi represents the volumetric soil moisture, [m3 m−3], at the ith soil layer; ti and ei are the thickness of the ith soil layer in the gridded SM dataset and in situ monitoring site, respectively; di is the depth of the ith in situ SM sensor; are the depths of to bottom of each gridded soil layer; and are the depths of to bottom of the ith soil layer associated to the in situ θi. This method provides a representative estimate of RZSM by integrating data from multiple depths to capture variability across the soil profile.
3.2 Evaluation of gridded SM datasets
The evaluation of the gridded SM datasets involved the application of two different methods: (i) a traditional time series comparison of gridded SM estimates with in situ observations using statistical metrics of performance, and (ii) a comparison of SM signatures to assess important aspects of SM dynamics at each site. The following sections provide a detailed description of both methods.
3.2.1 Statistical metrics of performance
To evaluate the gridded SM estimates against in situ observations we first used four well-known statistical metrics: (i) the unbiased root mean square error (ubRMSE; Entekhabi et al., 2014), (ii) the percent bias (PBIAS; Yapo et al., 1996), (iii) the Spearman rank correlation coefficient (ρ; Kling et al., 2012), and (iv) the modified Kling-Gupta efficiency (KGE′; Kling et al., 2012). ubRMSE removes the mean bias in traditional RMSE caused by differences in spatial representativeness between in situ SM measurements and gridded datasets, making it a more reliable metric for evaluating deviations from in situ observations (Entekhabi et al., 2014). A lower ubRMSE indicates superior model performance. PBIAS quantifies the systematic overestimation or underestimation of the gridded dataset (Yapo et al., 1996), with values equal to zero indicating unbiased representation of in situ values, and positive (negative) values indicate overestimation (underestimation). The Spearman rank correlation coefficient (ρ), unlike its Pearson counterpart, evaluates the strength and direction of a monotonic relationship between gridded and observed values. As a non-parametric metric, it is less affected by outliers or deviations from normality (Helsel and Hirsch, 1993), making it particularly suitable for SM time series with non-linear dynamics (Wang et al., 2021). In this study, ρ was calculated using deseasonalised time series, where each SM value is adjusted by subtracting the monthly mean SM value, to remove the seasonal component and ensure a consistent evaluation of temporal variability. This approach follows the general framework proposed by Albergel et al. (2012) to account for seasonal influences when evaluating SM time series, but instead of applying a centred 35 d moving average window, we used the long-term monthly mean for each calendar month as seasonal reference. The modified KGE′ combines the Pearson correlation, bias, and variability into a single metric to provide a comprehensive view of performance (Kling et al., 2012). Higher KGE′ values, with an optimum of 1, indicate a well-performing gridded dataset, which accurately captures both the temporal dynamics and distributional characteristics of in situ SM. The four selected metrics have been widely used in the evaluation of remotely-sensed SM datasets (e.g., Beck et al., 2021; Peng et al., 2021; Liu et al., 2024; Zheng et al., 2024). Detailed formulas and their interpretations are provided in Table 4, and all the computations were made with the hydroGOF R package (Zambrano-Bigiarini, 2024).
These metrics were calculated at a 3 h time step to match the temporal resolution of the GLDAS-Noah and SPL4SMAU products and to allow accurate assessment of SM dynamics across different temporal scales. This temporal adjustment also takes into account the availability of in situ measurements and ERA5 products at hourly intervals. This structured approach categorises performance from excellent to unsatisfactory, facilitating a comprehensive comparison between datasets and highlighting the different capabilities of each SM product in representing the observed soil moisture dynamics.
Finally, a regional-scale assessment beyond individual point-to-pixel comparisons was carried out, where all 3-hourly in situ and gridded SM time series were aggregated separately for the northern and southern regions. For the northern region, in situ time series from SM01, SM02, SM04, SM05, and SM07 were averaged to create a single representative time series, while for the southern region, the same was made for SM15, SM10, SM11, SM12, and SM14. These two regional in situ averages were then compared to the corresponding gridded averages, which were obtained by averaging all grid cells from each SM product located within the northern (PRB, MRB) and southern (SRB, TRB) catchments, respectively.
Entekhabi et al. (2014)Yapo et al. (1996)Beck et al. (2021)Kling et al. (2012)Table 4Performance metrics, including formulas, ranges of variation, ideal values, and interpretation criteria.
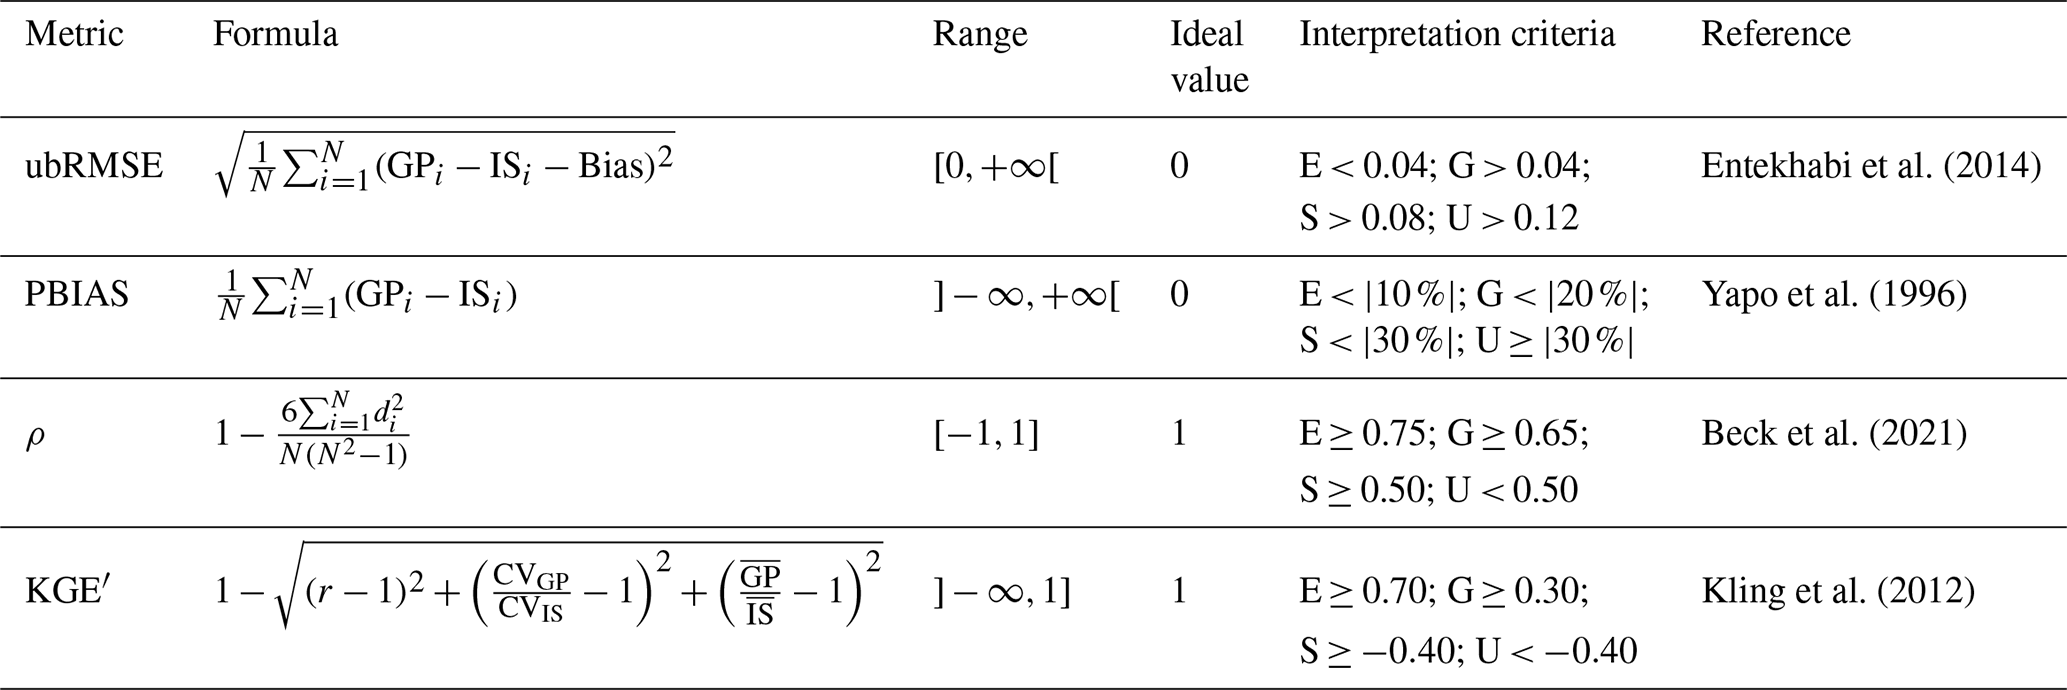
GP: gridded product; IS: in situ observation; CV: coefficient of variation; E: Excellent; G: Good; S: Satisfactory; U: Unatisfactory.
3.2.2 Soil moisture signatures
In addition to the standard statistical metrics, we used two SM signatures to provide a comprehensive evaluation of the gridded products. SM signatures provide a process-oriented approach to evaluate SM dynamics and capture the SM response to P events that are often overlooked by statistical metrics of performance (Branger and McMillan, 2020; Araki et al., 2022). In particular, they characterise processes such as infiltration and water retention, which are important for understanding the mechanisms of runoff generation and water storage capacity in different ecosystems (Liang et al., 2011; Tian et al., 2019).
We adapted the methodology proposed by Branger and McMillan (2020) and Araki et al. (2022) to calculate two key SM signatures: rising time (RT) and amplitude (A). RT represents the time delay between the onset of a P event and the maximum of the SM, and reflects the response time of the soil. On the other hand, A represents the change in SM during the precipitation event, which is calculated as the difference between the maximum SM value and its initial state. Figure 4 shows a conceptual representation of the two SM signatures used in this study, and illustrates how RT and A capture the timing and magnitude of SM responses to different P events.
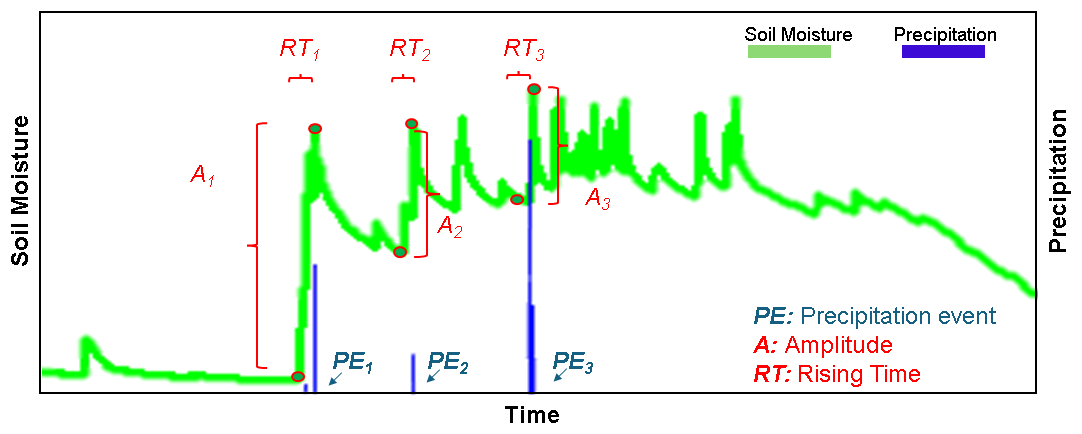
Figure 4Soil moisture signatures: rising time (RT) and amplitude (A) for selected precipitation events (PEs).
To assess the sensitivity of SM dynamics to different combinations of P characteristics and antecedent SM conditions, for each site we analysed two precipitation events, considered as extreme cases of the wide range of P and SM combinations that a site experiences during a year: (i) the first precipitation event of the year (FE), i.e., when the SM is at its driest condition; and (ii) the most intense precipitation event within the wet season of the year (IE), i.e., when the SM should be close to field capacity. Precipitation events were identified using the criteria described in Sect. 3.2.3 to ensure consistency between sites and datasets.
3.2.3 Identification of precipitation events
To identify individual P events (PEs) for the SM signature analysis at each site, we used hourly P data from 1 January 2022 to 31 December 2023, recorded by the rain gauge nearest to each in situ SM monitoring site. The identification method, illustrated in Fig. 5, follows the approach of Dunkerley (2019) and Araki et al. (2022). A P event is defined as any period with an intensity larger or equal to 0.2 mm h−1, separated from other events by at least six consecutive dry hours (i.e., hours with less than 0.2 mm of P). The end of a P event is defined as when a new P event began or five days after the last recorded P amount. This five-day buffer after the last recorded P amount is important to clearly distinguish individual storms, as it helps to avoid biases due to evapotranspiration effects that could otherwise influence the SM response (Araki et al., 2022). The adopted identification framework ensures that SM signatures associated with storm events are accurately captured and provides a robust and complementary basis for assessing SM dynamics in response to P events.
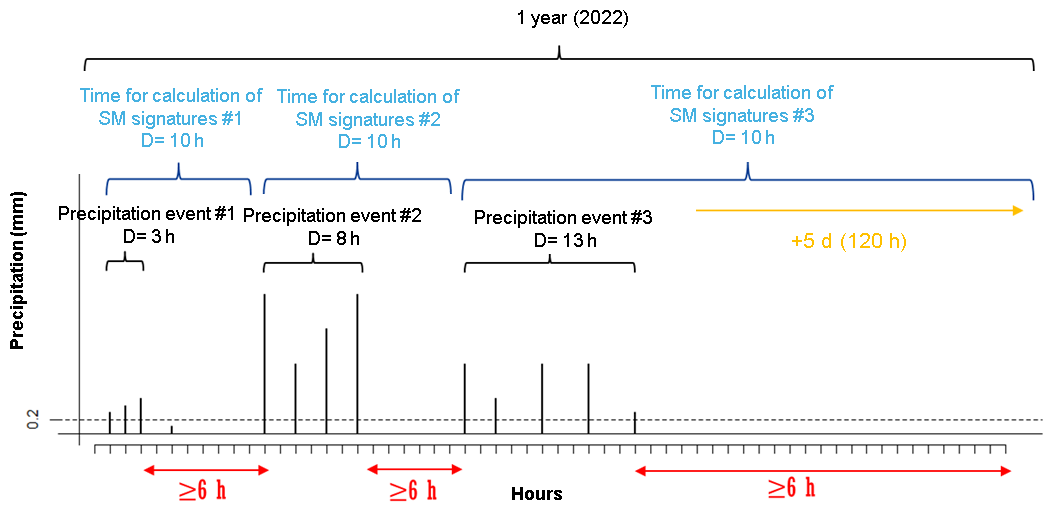
Figure 5Selection of P events and their corresponding SM signature computation periods. Each storm event is separated by dry intervals of at least six hours, and the SM signature computations extend beyond the P event itself, with a five-day buffer period to ensure proper distinction between successive P events.
4.1 Overall soil moisture dynamics
Figures 6 and 7 show the temporal dynamics of SSM, RZSM and P for four monitoring sites that are representative of the arid shrublands that predominate in the north (SM05 and SM07) and the humid native forests in the south (SM15 and SM14), respectively. They show a distinct event-driven SM response that emphasises different SM responses to P events. The remaining time series are available in Sect. S2.
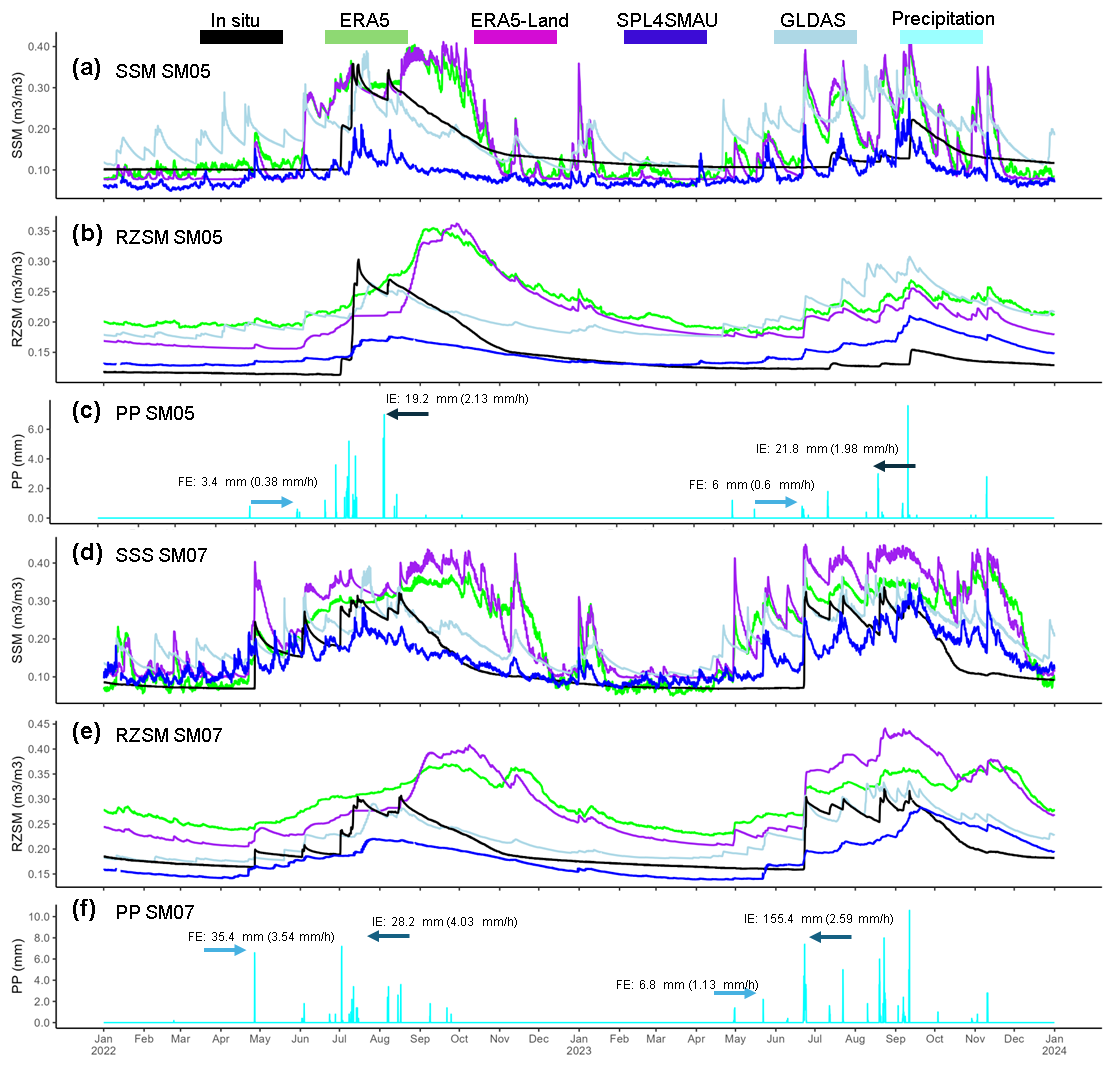
Figure 6Panels (a), (b), and (c) show time series of surface soil moisture (SSM), root zone soil moisture (RZSM), and precipitation (P), respectively, for 2022–2023 at site SM05 (shrubland in PRB). Panels (d), (e), and (f) present the same variables for site SM07 (shrubland in MRB). The labels FE and IE indicate the first and the most intense precipitation event of the year, respectively.
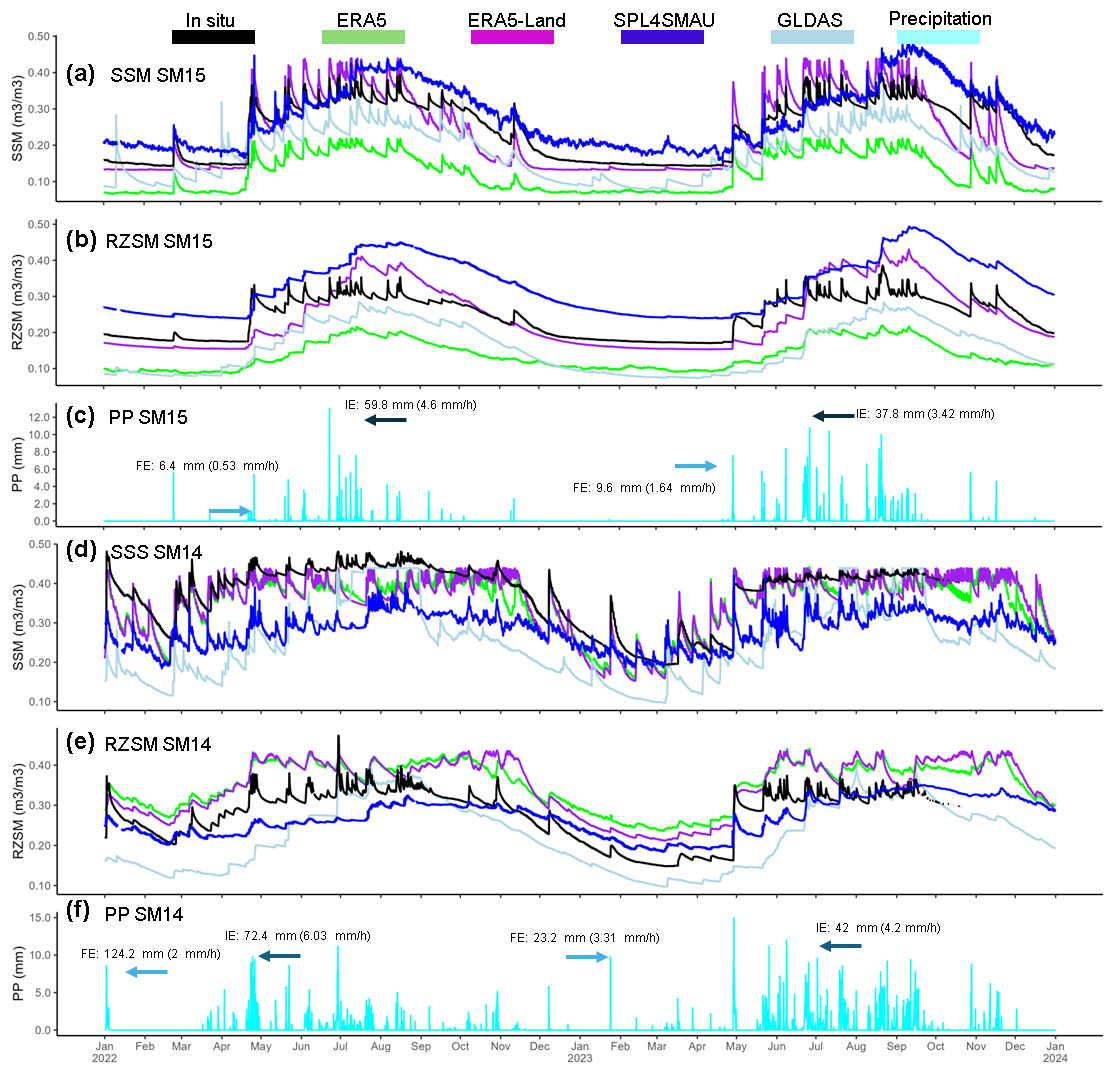
Figure 7Panels (a), (b), and (c) show time series of surface soil moisture (SSM), root zone soil moisture (RZSM), and precipitation (P), respectively, for 2022–2023 at site SM15 (native forest in the CRB). Panels (d), (e), and (f) present the same variables for site SM14 (native forest in the TRB). The labels FE and IE indicate the first and the most intense precipitation event of the year, respectively.
Figure 6 shows that at SM05 (PRB, panels a–c), both in situ SSM and RZSM remained consistently low during the dry season (January to May), with average values close to 0.1 m3 m−3. The first P event of 2022 (1 June, 21:00 to 3 June, 18:00 UTC; 3.4 mm total) had no noticeable impact on either SSM or RZSM. A sharp increase in August 2022 corresponded to the soil response to an intense P event (19.2 mm in 21 h), with SSM and RZSM reaching values of 0.34 and 0.27 m3 m−3, respectively. On the other hand, all gridded SM products exhibited an important variability in SSM during the dry season, which contrasts with the relatively flat response observed in the in situ measurements. While this variability was largely dampened in the root zone, all products still overestimated RZSM. During the most intense P event of the year, GLDAS-Noah closely followed in situ SSM and RZSM, while ERA5 and ERA5-Land overestimated it (particularly during the recession curve) and SPL4SMAU underestimated it. At SM07 (MRB, panels d–f), the overall behaviour of both in situ and gridded SSM and RZSM was similar to that observed at SM05. However, SPL4SMAU showed a much closer agreement with the in situ SSM. It is noteworthy that in September 2022, while in situ RZSM was decreasing at both sites, ERA5 and ERA5-Land showed some increases. This discrepancy suggests that the P data used in these gridded products exhibit a substantial difference in time from the in situ observations.
Figure 7 shows that at SM15 (CRB, panels a–c), both in situ SSM and RZSM presented a gradual decline in SM during the dry season (October–March), reaching average values of 0.16 m3 m−3 for both SSM and RZSM, which is much higher than the value observed at the northern sites, especially for SSM. After the first P event of the year (26 April, 18:00 to 27 April, 12:00 UTC; 6.4 mm total), an important increase in in situ SM was observed, which had a greater impact on SSM than on RZSM. During the rainy season (April–September), both SSM and RZSM showed high variability in their response to P events, with average values of about 0.35 and 0.30 m3 m−3, respectively. On the other hand, all gridded products captured well the seasonal patterns in both soil layers. ERA5-Land most closely matched the timing and magnitude of the in situ observations, while ERA5 and GLDAS-Noah tend to underestimate soil water content, and SPL4SMAU slightly overestimated it. During the dry season, the underestimation of SM by ERA5 and GLDAS-Noah was about 0.10 m3 m−3. At SM14 (TRB, panels d–f), the frequency and intensity of P events were higher than in SM15. This led to greater variability and higher mean values of both the in situ SSM and the RZSM, including several P events during the dry season (October–March). All gridded SSM products captured the temporal pattern of in situ observations, but consistently underestimated their magnitude. For RZSM, ERA5 and ERA5-Land overestimated soil water content, while GLDAS-Noah consistently underestimated it. SPL4SMAU underestimated RZSM during the wet season, but overestimated it during the dry season.
4.2 Statistical metrics of performance
4.2.1 Surface soil moisture
Figure 8 summarises the time series comparison of gridded products against in situ observations of SSM at all monitoring sites, using the four statistical metrics defined in Sect. 4.2.1. In each panel, monitoring sites are ordered from left to right following a north-south latitudinal gradient, from the most arid sites to the most humid ones, and the yellow shaded area stands for an excellent performance. Panel (a) shows that most products had good (ubRMSE between 0.04 and 0.08) to excellent (ubRMSE < 0.04) performance. Errors were higher at the northern sites than in the southern ones. In the north, SPL4SMAU generally achieved the lowest ubRMSE values, ranging from 0.034 to 0.052 m3 m−3, while the other products typically showed ubRMSE values between 0.051 and 0.080 m3 m−3. At the southern sites, most products achieved excellent ubRMSE values (below 0.040 m3 m−3), with ERA5 performing best at SM14 and SM15 (0.033 and 0.039 m3 m−3, respectively). The full set of performance values for all products and in situ monitoring sites is provided in Appendix A and in Sects. S2 and S4. In particular, sites SM05 and SM07 (previously discussed in Sect. 4.1) exhibited good ubRMSE values for ERA5 (0.066 and 0.080 m3 m−3, respectively) and ERA5-Land (0.077 m3 m−3 in both sites), which was in line with the overestimations described in Sect. 4.1. In contrast, SPL4SMAU and GLDAS-Noah presented lower errors at SM05 and SM07, with ubRMSE values of 0.046 and 0.052 m3 m−3 for SPL4SMAU and 0.057 and 0.049 m3 m−3 for GLDAS-Noah, respectively. At the southern sites, in particular SM14 and SM15, most products achieved excellent ubRMSE values (below 0.040 m3 m−3). It is worth noting that ERA5 performed best at these two southern sites, with ubRMSE values of 0.033 and 0.039 m3 m−3 for SM14 and SM15, respectively. Panel (b) shows that all northern arid sites exhibited PBIAS values above 25 % for ERA5, ERA5-Land and GLDAS, while SPL4SMAU presented PBIAS lower than −25 % in most monitoring sites. In the humid south, most products showed PBIAS values below 25 %, except in SM11 and SM10. Panel (c) shows that in the northern sites, the Spearman rank correlations (ρ) between deseasonalised time series were lower than 0.5 for all gridded products, with GLDAS-Noah showing negative values in all arid monitoring sites but SM07. The ρ values showed an important increase in the humid south, with ERA5 and ERA5-Land reaching values above 0.75 for all gridded products and monitoring sites but SM11. Finally, panel (d) shows good KGE′ values in al northern sites (KGE′ ≤ 0.3) but SM02, and higher values in most humid southern sites.
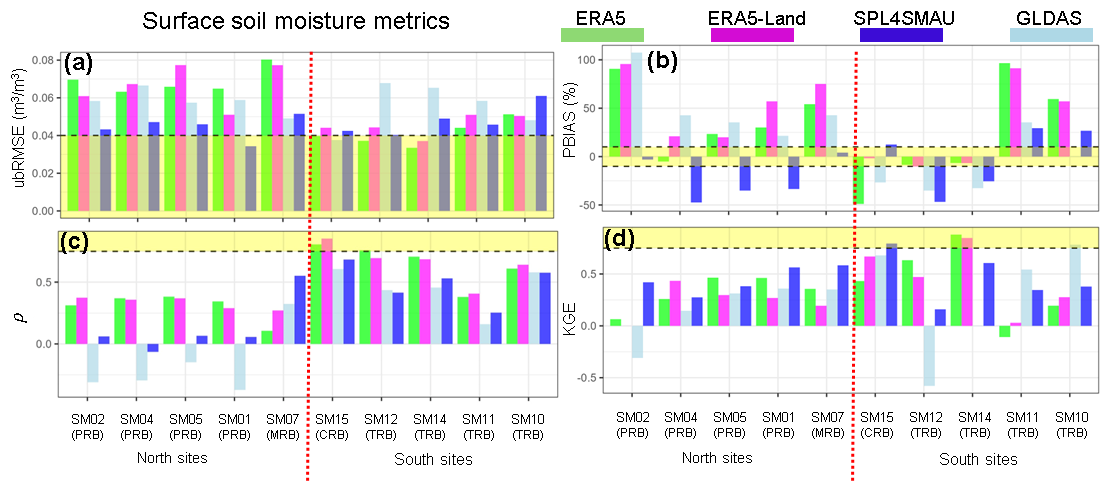
Figure 8Panels (a), (b), (c) and (d) shows the ubRMSE, PBIAS, ρ and KGE′ performance metrics obtained for surface soil moisture (SSM) at each in situ monitoring site, respectively. The in situ monitoring sites are shown on the x-axis, from the most arid (left) to the most humid (right) ones. The yellow shaded area indicate an excellent performance range based on Table 4. The colours represent the data sources: green for ERA5, pink for ERA5-Land, blue for SPL4SMAU, and light blue for GLDAS-Noah.
SPL4SMAU generally aligned well with in situ SSM measurements across northern monitoring sites, as evidenced by low ubRMSE values and relatively high KGE′ scores (Fig. 8). These findings are consistent with previous studies that highlight the robustness of SPL4SMAU in arid and semi-arid regions (Reichle et al., 2017a, b; Xu, 2020; Zheng et al., 2024). Notably, SPL4SMAU showed stable behaviour during dry periods, avoiding the spurious SSM peaks seen in other gridded products. For instance, during December 2022, SPL4SMAU closely tracked observed SSM, while other datasets recorded abrupt increases not supported by ground observations. A similar, though slightly weaker, performance was observed at SM05. However, the deseasonalised Spearman rank correlation (ρ) revealed poor to very poor performance for both GLDAS-Noah and SPL4SMAU at most sites, with the exception of SM07 (Mapocho River Basin), a transitional arid ecosystem that recorded the highest KGE′ among northern stations and reliably captured dry-season dynamics (Fig. 6).
ERA5 and ERA5-Land showed stronger performance in humid southern sites (Fig. 7), particularly SM14 and SM15, where they achieved excellent ubRMSE values (<0.040 m3 m−3) and high Spearman correlations (ρ>0.75), indicating good agreement with in situ SSM. The good performance of ERA5 in humid environments is likely due to the assimilation of surface variables such as air temperature and humidity, which allows for more realistic lower boundary conditions and, consequently, improves the accuracy of RZSM estimations in humid climates (Liu et al., 2024). On the other hand, the good correlation of ERA5-Land retrievals with empirical measurements in humid environments, where soil moisture plays a crucial role in influencing evapotranspiration and local climate patterns, confirms previous findings by Schönauer et al. (2024) and Zheng et al. (2024). These results confirm the capability of ERA5 and ERA5-Land in capturing SSM dynamics in humid regions, supporting their use for long-term hydrological monitoring in those regions (Lal et al., 2022; Wu et al., 2021). A key distinction between both reanalysis products is that ERA5 assimilates ASCAT C-band surface soil moisture observations, whereas ERA5-Land is an offline simulation that does not incorporate any satellite-based soil moisture information (Hersbach et al., 2020; Muñoz Sabater et al., 2021).
However, in arid northern sites, the performance of ERA5 and ERA5-Land declined, with higher ubRMSE and PBIAS values and lower deseasonalised correlations (ρ<0.5), reflecting limitations under dry conditions. This limited capability of ERA5 and ERA5-Land to effectively capture soil moisture dynamics in arid environments has been already documented in the literature (Chang et al., 2020; Ling et al., 2021; Andaryani et al., 2021; Jiao et al., 2024). Their coarse spatial resolution and oversimplified representation of land-atmosphere interactions is not able to incorporate local climatic and geological conditions adequately (Ling et al., 2021). This, limits their ability to represent rapid evaporation processes characteristic of dry regions, which are significantly underestimated by reanalysis products (Chang et al., 2020; Jiao et al., 2024). These deficiencies often result in biased soil moisture estimates, particularly under high evaporative demand and limited precipitation conditions (Jiao et al., 2024). Additionally, these reanalysis products show reduced sensitivity to extreme climatic events, such as prolonged droughts, and may lag in responding to abrupt meteorological changes, further compromising their reliability in arid environments (Andaryani et al., 2021). To enhance their performance, incorporating local observations and integrating additional atmospheric datasets sensitive to soil moisture variability has been recommended in literature to avoid low performances in ecohydrologically complex and under-monitored arid regions (e.g. Sanchez-Mejia and Papuga, 2017; Sehgal et al., 2017; Senanayake et al., 2022).
4.2.2 Root zone soil moisture
Figure 9, analogous to Fig. 8, summarises the evaluation metrics for RZSM. Panel (a) shows that most products performed well in terms of ubRMSE, with excellent (ubRMSE < 0.04) or good (0.04 ≤ ubRMSE < 0.08) match with in situ observations across sites. ERA5-Land performed best in the arid northern sites, while ERA5 achieved the highest performance in the humid southern regions. In contrast, GLDAS-Noah overestimated RZSM across most locations. Panel (b) indicates that humid southern sites generally had lower PBIAS values than the northern sites. SPL4SMAU showed the lowest PBIAS at most sites, while GLDAS-Noah underestimated in situ values in the south. ERA5 and ERA5-Land presented PBIAS values close to or larger than 50 % in al northern sites but SM04; however, this bias decreased to less than 25 % in the south. Panel (c) shows a general better agreement between deseasonalised time series in the southern sites compared to the northern ones, in terms of the Spearman rank correlations (ρ). ERA5 and ERA5-Land achieved good to excellent correlations (ρ>0.65 and ρ>0.75, respectively) in most sites, whereas GLDAS-Noah and SPL4SMAU often led to negative ρ values in northern sites. Finally, panel (d) shows that most of the products had higher KGE′ values at the humid sites in the south than in the arid north. ERA5 and ERA5-Land achieved good KGE′ values (>0.3) and the best overall performance at all sites except SM02, while GLDAS-Noah performed the worst, even with negative KGE′ values at two southern sites (SM12 and SM14). The full set of performance values for all products and in situ monitoring sites is provided in Appendix A and in Sects. S2 and S4.
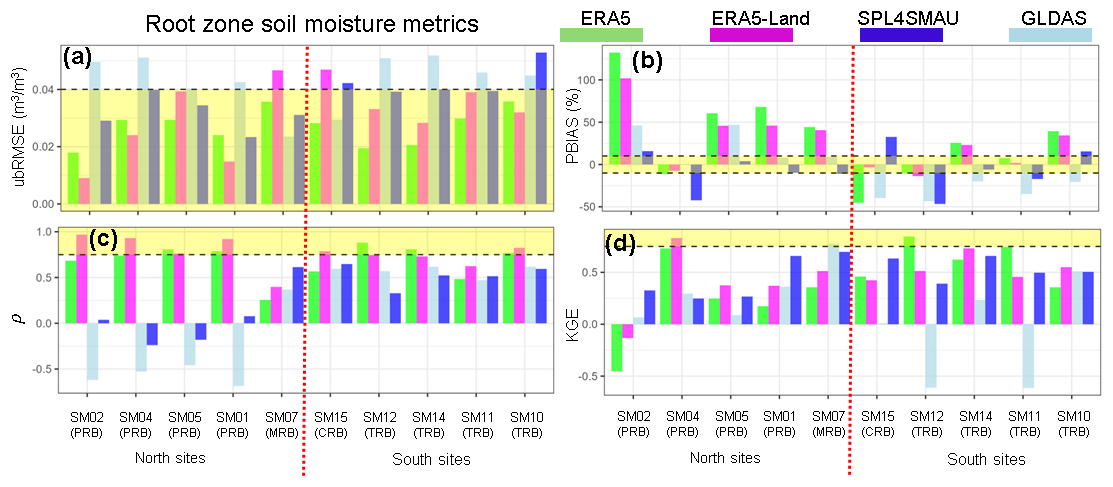
Figure 9Panels (a), (b), (c) and (d) shows the ubRMSE, PBIAS, ρ and KGE′ performance metrics obtained for RZSM at each in situ monitoring site, respectively. The in situ monitoring sites are shown on the x-axis, from the most arid (left) to the most humid (right) ones. The yellow shaded area indicate an excellent performance range based on Table 4. The colours represent the data sources: green for ERA5, pink for ERA5-Land, blue for SPL4SMAU, and light blue for GLDAS-Noah.
In general, gridded products performed better for RZSM than for SSM, with higher KGE′ values and lower errors across most sites. An exception was observed at SM05, where all products performed better for SSM than for RZSM. This behaviour may be explained by the local soil profile, characterised by sandy loam with high gravel content and minimal clay, which is known to limit water retention in deeper layers and hinder the accurate representation of RZSM in land surface models (Al-Yahyai et al., 2006; Beck-Broichsitter et al., 2023). The mismatch between SSM and RZSM primarily reflects their contrasting characteristic timescales. SSM responds rapidly to precipitation and atmospheric demand, whereas RZSM evolves more slowly as infiltration, percolation, root uptake, and soil water storage integrate surface inputs over time. As a result, the vadose zone acts as a low-pass filter, attenuating and phase-shifting high-frequency surface signals as wetting fronts propagate downward. This leads to systematically delayed and dampened RZSM responses relative to the more dynamic SSM, as observed in the event-based analysis (Faúndez Urbina et al., 2023)
ERA5 and ERA5-Land showed strong performance in representing RZSM, with high Spearman correlations (ρ>0.65 and ρ>0.75, respectively), low ubRMSE, and good KGE′ values across most sites, particularly in the humid southern regions. These findings support the applicability of ERA5 and ERA5-Land in ecohydrological studies requiring accurate root-zone estimates (Balocchi et al., 2023).
SPL4SMAU exhibited weak Spearman correlations in southern humid sites but showed a mixed performance in the northern arid regions. At SM07 (Mapocho River Basin), SPL4SMAU achieved ρ=0.55 and KGE′ = 0.58, suggesting reasonable skill in capturing RZSM dynamics. Conversely, at sites within the Trancura River Basin (SM01–SM05), where passive microwave retrievals are theoretically favoured by dry conditions and sparse vegetation (Xu, 2020; Nadeem et al., 2022), SPL4SMAU performed poorly. Spearman correlations ranged from 0.06 at SM01 and SM02 to 0.07 at SM05, with a negative correlation of −0.06 at SM04. GLDAS-Noah consistently underestimated both SSM and RZSM, particularly at southern humid sites during high-intensity precipitation events. This is reflected in PBIAS values below −30 % (Fig. 9b) and low KGE′ values across the network. Such systematic underestimation under wet conditions limits the suitability of GLDAS-Noah for monitoring SM dynamics in humid environments (Spennemann et al., 2015; Araki et al., 2023).
The definition of RZSM as the 0–100 cm integrated layer was adopted to ensure comparability among products with different soil layering schemes. This harmonisation allows a consistent regional assessment, yet we acknowledge that it may smooth vertical gradients and mask depth-dependent soil processes. Future analyses will explore vertical sensitivity using sublayers (e.g., 0–10, 10–40, 40–100 cm) to better capture infiltration dynamics and the role of deeper storage in root-zone responses.
4.2.3 Summary of regional performance
Table 5 summarises the performance of gridded SM products for SSM and RZSM across northern and southern regions, based on average performance metrics calculated from all in situ monitoring sites within each respective region. For SSM, SPL4SMAU achieved the lowest ubRMSE in the north (0.037 m3 m−3), while ERA5-Land performed best in the south (0.031 m3 m−3). For RZSM, ERA5 achieved the lowest ubRMSE in both regions, 0.015 m3 m−3 in the north and 0.024 m3 m−3 in the south, indicating a strong agreement with in situ measurements at greater depths. In terms of PBIAS, SPL4SMAU obtained relatively low percent bias values in both regions. In contrast, ERA5-Land exhibited significant overestimation in the north, with PBIAS values of 51.2 % for SSM and 39.1 % for RZSM. In the south, biases were more balanced across products, although GLDAS-Noah consistently underestimated SM, with PBIAS values of −20 % for SSM and −30.1 % for RZSM. The Spearman rank correlation coefficient (ρ) showed that ERA5 obtained the highest correlation for SSM in the north (ρ=0.53), while ERA5-Land performed best for RZSM (ρ=0.92). In the south, ERA5-Land achieved the highest correlations for both SSM (ρ=0.74) and RZSM (ρ=0.75), suggesting a strong temporal agreement with in situ measurements in humid ecosystems. In terms of the KGE′, SPL4SMAU performed best for RZSM in the north (KGE′ = 0.73), while ERA5-Land showed the highest performance in the south (KGE′ = 0.85). Conversely, GLDAS-Noah generally had the lowest KGE′ values, particularly for RZSM in the northern catchments.
Table 5Summary of the performance of gridded soil moisture products for SSM (RZSM) across northern and southern regions, based on average performance metrics calculated from all in situ monitoring sites within each respective region. Metrics include ubRMSE, PBIAS, ρ, and KGE′. Bold values indicate the best performance for each metric in the respective region.
The regional contrasts identified in this study are consistent with patterns reported across a range of hydroclimatic settings worldwide. Large-scale evaluations in China have shown that soil moisture products tend to exhibit reduced performance in steep or topographically heterogeneous regions, where coarse-resolution models struggle to represent local water retention and drainage processes (Wu et al., 2021; Zhang et al., 2021; Zheng et al., 2022a). Extensive validations at more than one thousand ground stations across China further indicate that performance varies strongly with vegetation density and soil texture, particularly for root-zone soil moisture (Tian and Zhang, 2023; Nadeem et al., 2022). Similar behaviour has been reported in Central Asia, where ERA5 showed the highest temporal correlation with in situ observations (mean r=0.59), while GLDAS exhibited lower overall uncertainty but systematically underestimated soil moisture under arid conditions (Yu et al., 2023). In the Upper Blue Nile Basin, satellite-based products such as SMAP and SMOS were found to better capture temporal soil moisture dynamics than reanalysis datasets, underscoring the importance of dense monitoring networks in African basins (Alaminie et al., 2024). Over the Tibetan Plateau, SMAP outperformed other satellite products, with performance primarily constrained by elevation, vegetation biomass, and surface roughness (Zeng et al., 2021a). Collectively, these international studies reinforce the conclusion that no single soil moisture product performs consistently best across all environments; rather, performance is strongly modulated by vegetation characteristics, soil texture, topography, and climatic regime. In this context, the pronounced hydroclimatic gradient of Chile provides a valuable natural laboratory for identifying the strengths and limitations of different soil moisture products under contrasting arid and humid conditions in the Southern Hemisphere.
4.3 Soil moisture signatures
4.3.1 Event-scale evaluation
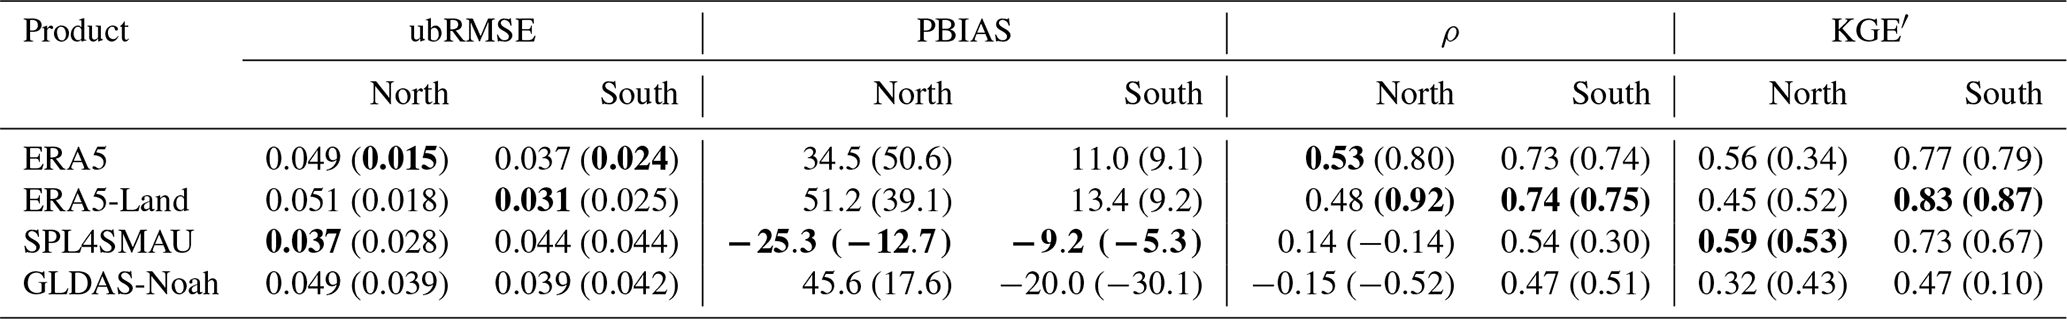
In order to provide a closer look to the SM signatures analysed in this study, Fig. 10 shows 3-hourly time series of SSM (panels a and b) and RZSM (panels c and d) recorded in 2022 at SM05, a shrubland site in the arid PRB. This figure also shows the amplitude (A) and rising time (RT) obtained during the first P event (FE) and the most intense event (IE) of the year 2022, for the in situ observations (black line) and all gridded datasets (coloured lines).
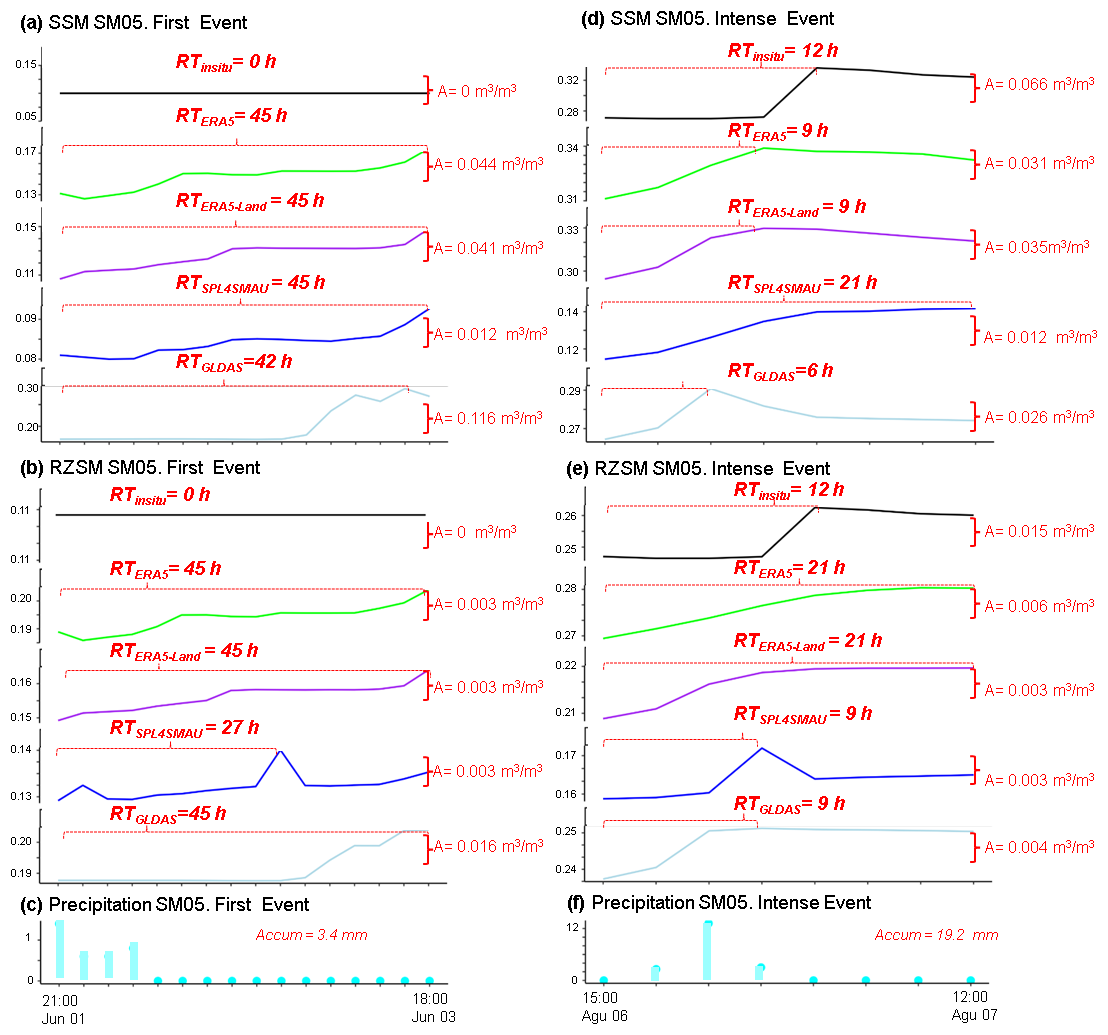
Figure 10Amplitude (A) and rising time (RT) for the first precipitation event of 2022 in SM05 (Shrubland in Petorca). Results are shown for both surface soil moisture (SSM) and root zone soil moisture (RZSM) across observed (in situ) and gridded products. The bottom panel shows cumulative precipitation for the first event (accumulated P = 3.4 mm) and the most intense event of year 2022 (accumulated P = 19.2 mm).
For the FE, the in situ observations showed no response in either SSM or RZSM (A = 0 m3 m−3, RT = 0 h). In contrast, all the gridded datasets reported a soil response for this event, overestimating both in situ amplitudes and rising times. In particular, the amplitudes derived from gridded products were in [0.012, 0.116] m3 m−3 and [0.003, 0.016] m3 m−3 for SSM and RZSM, respectively; while rising times were in [42, 45] and [27, 45] h for SSM and RZSM, respectively. It is worth mentioning that most of the products agreed on a rising time of 42–45 h for both SSM and RZSM, except SPL4SMAU which showed a shorter RT of 27 h for RZSM.
For the most intense P event of the year, in situ measurements showed a strong SM response in both SSM and RZSM, with amplitudes of 0.066 and 0.015 m3 m−3, respectively, and a rising times (RT) of 12 h for both layers. In contrast, all gridded datasets underestimated the amplitude and showed inconsistent rising times. For SSM, amplitudes ranged from 0.012 to 0.031 m3 m−3, and for RZSM, from 0.004 to 0.006 m3 m−3. On the other hand, most products underestimated RT for SSM (6–9 h), except SPL4SMAU, which overestimated it (21 h). For RZSM, ERA5 and ERA5-Land overestimated RT (21 h), while SPL4SMAU and GLDAS-Noah underestimated it (9 h each). These discrepancies highlight the challenges of accurately capturing SM dynamics during intense P events.
Figure 11 is analogous to Fig. 10, but for a native forest in the southern humid TRB (SM14). In contrast to the arid SM05 site, during the FE of the year the in situ observations showed a sharp increase in both SSM and RZSM, with amplitudes of 0.185 and 0.153 m3 m−3, respectively, and rising times of 18 h in both soil layers. Similarly, all the gridded datasets showed an important response of SSM and RZSM during this event, underestimating the amplitudes and overestimating the rising times. In particular, amplitudes derived from gridded products were in [0.007, 0.179] m3 m−3 and [0.007, 0.063] m3 m−3 for SSM and RZSM, respectively; while rising times were in [18, 45] and [21, 63] h for SSM and RZSM, respectively.
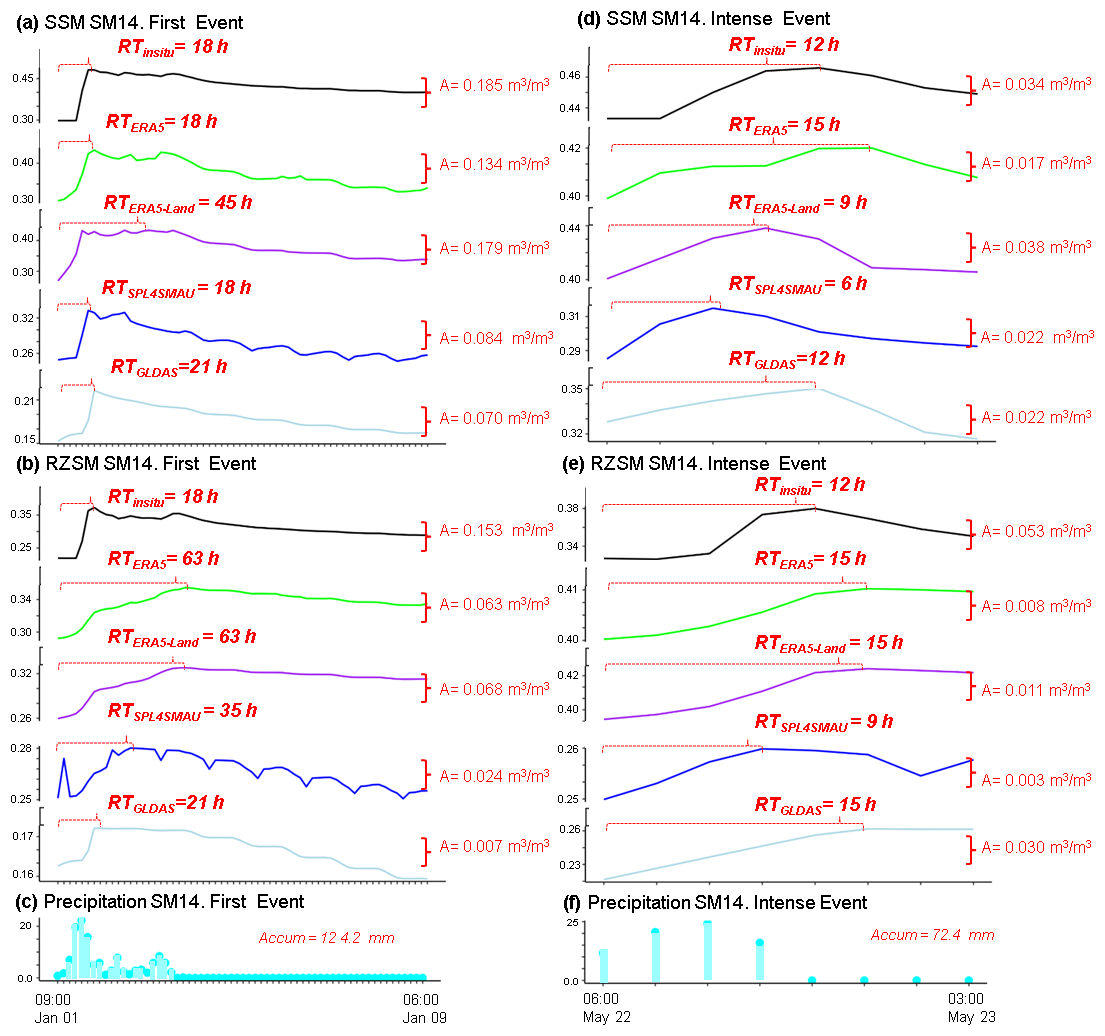
Figure 11Amplitude (A) and rising time (RT) for the first precipitation event of 2022 in SM05 (Native Forest in Trancura). Results are shown for both surface soil moisture (SSM) and root zone soil moisture (RZSM) across observed (in situ) and gridded products. The bottom panel shows cumulative precipitation for the first event (accumulated P = 124.2 mm) and the most intense event of year 2022 (accumulated P = 72.4 mm).
For the most intense P event of the year, in situ measurements also showed an important SM response in both soil layers (though less pronounced), with amplitudes of 0.034 and 0.053 m3 m−3, respectively, and a rising times (RT) of 12 h for both layers. For SSM, ERA5-Land had the amplitude (0.038 m3 m−3) and rising time (RT = 9 h) closest to the corresponding in situ values, followed by ERA5 (A=0.017 m3 m−3, RT = 15 h). For RZSM, all gridded datasets underestimated the amplitude (0.003–0.030 m3 m−3); and most of them overestimated the rising time (RT = 15 h), except SPL4SMAU (RT = 9 h). During the most intense P event of the year, in situ measurements showed an important, but less abrupt, SM response in both layers; with amplitudes of 0.034 and 0.053 m3 m−3 for SSM and RZSM, respectively, and rising times of 12 h in both cases. On the other hand, all the gridded datasets showed important responses in SSM and RZSM. For SSM, ERA5-Land provided the best match with in situ observations, with an amplitude of 0.038 m3 m−3 and a rising time of 9 h, followed by ERA5, which reported an amplitude of 0.017 m3 m−3 and a rising time of 15 h. For RZSM, all gridded datasets underestimated the amplitude, with values ranging from 0.003 to 0.030 m3 m−3, and most products overestimated the rising time (RT = 15 h), except SPL4SMAU, which had a shorter RT of 9 h.
The evaluation of SM responses to P events offered additional insights beyond conventional statistical metrics of performance, further highlighting the regional variability identified in earlier sections. In particular, it revealed marked discrepancies between in situ observations and gridded datasets, especially across contrasting natural ecosystems.
Products such as SPL4SMAU and ERA5-Land aligned more closely with in situ SM dynamics under certain conditions; however, their performance presented large variations depending on the ecosystem type and intensity of the P event (Figs. 10 and 11). This variability is illustrated by two representative sites: SM05, located in a northern shrubland, and SM14, situated in a humid native forest in the south. At SM05, the in situ sensor registered no detectable response during the first P event of the year, with both the amplitude (A) and response time (RT) equal to zero. In contrast, the gridded products did simulated a response, overestimating both variables. These discrepancies highlight the challenges of capturing localised SM responses to small-scale precipitation events. Conversely, at SM14, ERA5-Land closely followed the observed dynamics during both the first and the most intense P event of the year. It accurately reproduced the amplitude (A = 0.179 vs. 0.185 m3 m−3 measured in situ) and response time (RT = 18 h), demonstrating its capability in more humid ecosystems.
Figure 12 confirms a recurring tendency among gridded products to simulate SM increases at northern sites that were not observed in situ. This discrepancy may be attributed to the mismatch between the coarse spatial resolution of the P fields used in land surface models and the localized P measurements recorded by individual rain gauges, which can induce artificial SM responses. For instance, ERA5-Land assimilates multiple satellite- and radar-based P sources (e.g., AMSR-2, GPM, TRMM, FY-3C) (Liu et al., 2024). However, a direct comparison between these gridded P estimates and in situ observations was beyond the scope of this work.
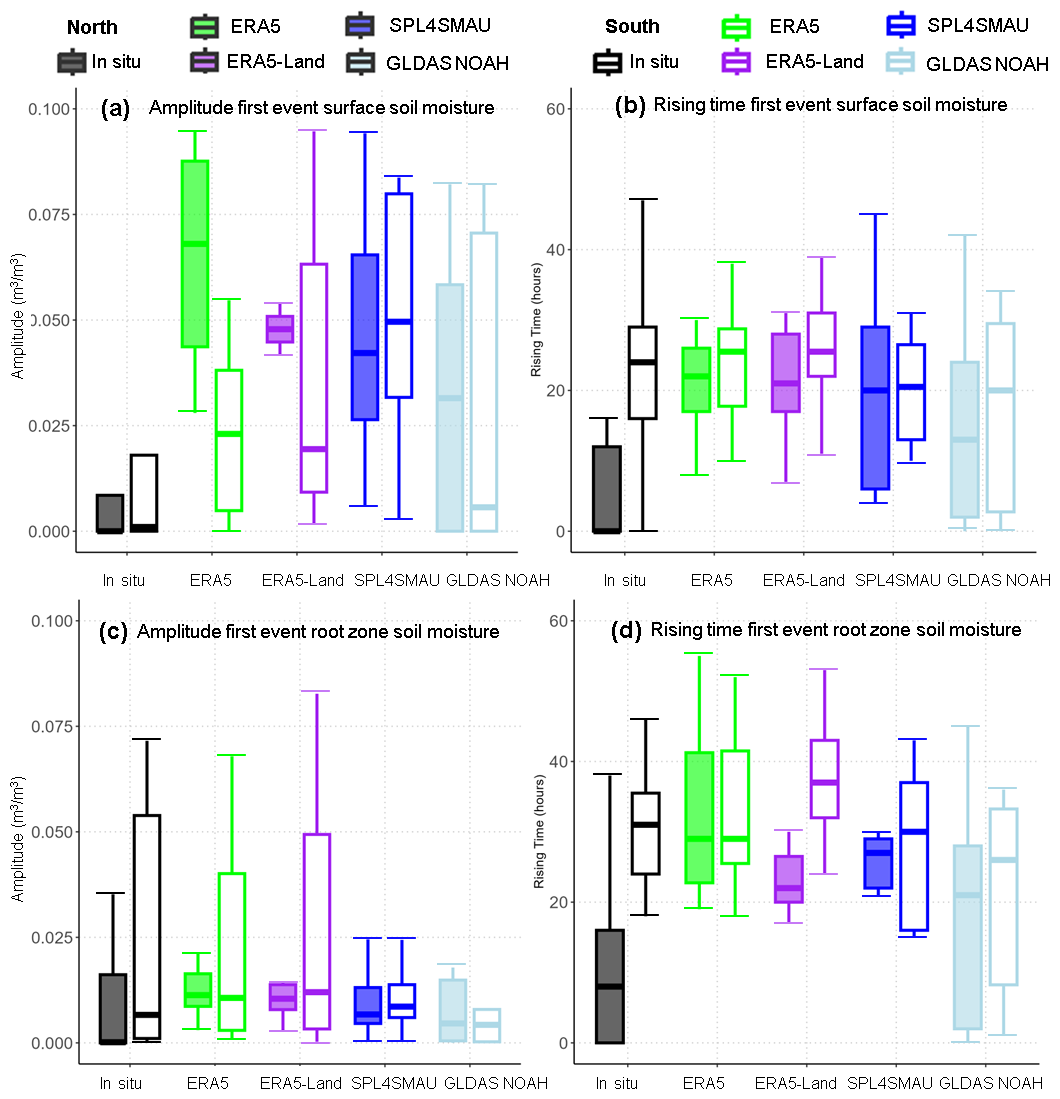
Figure 12Boxplots summarising the amplitude (a, b) and rising times (c, d) for SSM and RZSM during the first P event of the year. Filled boxplots corresponds to the northern arid sites (SM01 to SM07) and non-filled boxplots corresponds to the southern humid sites (SM10 to SM15).
Figure 13 shows that, during the first P event of the year, gridded datasets generally underestimated the amplitude of in situ SM responses, particularly in northern arid ecosystems. Although estimates of rising time were somewhat closer to in situ observations, substantial variability remained among products. Our findings confirm the difficulty of accurately representing rapid infiltration and retention processes in arid environments, where P events are infrequent and exhibit a high spatial and temporal variability, as already discussed in previous studies (Lal et al., 2022; Dai et al., 2022). Moreover, while the 3-hourly temporal resolution of the datasets may be adequate for capturing large-scale SM dynamics, it might be not goo enough to resolve short-term fluctuations associated with high-intensity P events. Previous studies have shown that reanalysis products tend to smooth out high-frequency variability, potentially missing short-lived anomalies in SM response (e.g. Zheng et al., 2024).
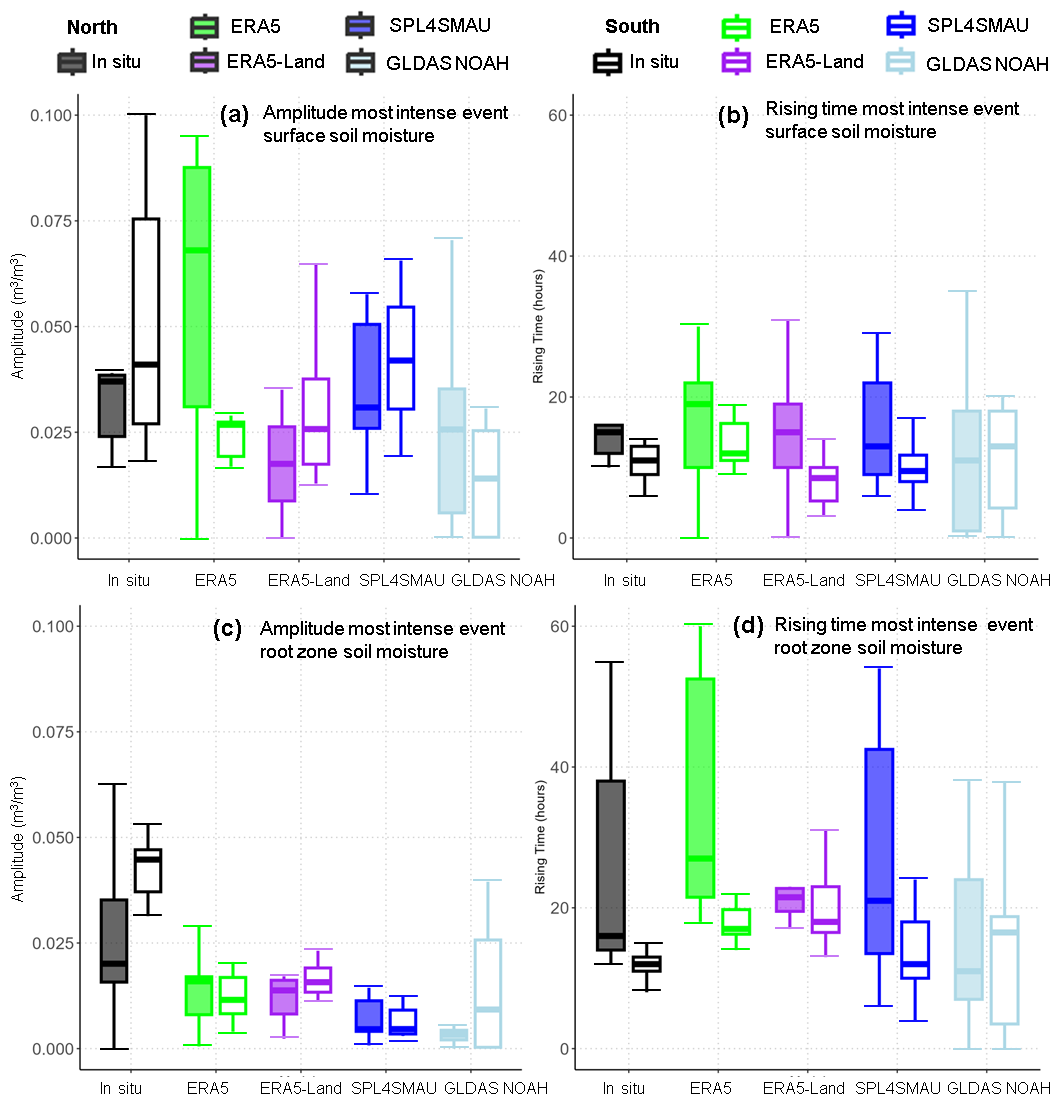
Figure 13Boxplots summarising the amplitude (a, b) and rising times (c, d) for SSM and RZSM during the most intense P event of the year. Filled boxplots corresponds to the northern arid sites (SM01 to SM07) and non-filled boxplots corresponds to the southern humid sites (SM10 to SM15).
To better understand the sources of discrepancy between gridded and in situ SM observations, future work should compare P inputs from gridded datasets with in situ observations, thus enhancing the performance and regional applicability of gridded products in poorly monitored, and ecohydrologically heterogeneous regions.
4.3.2 Regional performance
In order to provide a regional summary (i.e., arid north vs. humid south) of the capability of each gridded dataset of reproducing the in situ SM signatures, Figs. 12 and 13 show boxplots summarising the amplitude (panels a and b in each figure) and rising times (panels c and d in each figure) for SSM and RZSM during the first P event and the most intense P event of the year, respectively.
Figure 12a shows that in situ SSM amplitudes presented lower median values and reduced variability in the arid north compared to the humid south. Most gridded datasets overestimated both the median amplitude and its variability relative to in situ data. Additionally, all gridded datasets, except SPL4SMAU, showed lower median SSM amplitudes in the south than in the north, which contrasts with in situ observations. Figure 12b illustrates that rising times for SSM were generally shorter in the north than in the south, consistent across both in situ observations and all gridded datasets. The median in situ rising times were about 1 h in the north and 25 h in the south, while gridded datasets report median rising times ranging from 15 to 25 h.
A similar pattern was observed for RZSM. Figure 12c shows that in situ RZSM amplitudes were lower and less variable in the north. Most gridded datasets overestimated the in situ amplitudes, with median values about 0.05 m3 m−3 for all gridded datasets vs. less than 0.015 m3 m−3 for in situ measurements. In terms of variability, ERA5 and ERA5-Land underestimated in situ variability in the north but aligned more closely with them in the south. In contrast, SPL4SMAU and GLDAS-Noah underestimated in situ variability in both regions. Finally, Fig. 12d shows that rising times in the root zone followed a regional pattern similar to SSM, with shorter times in the north across both observation types. Median rising times from in situ data were about 10 h in the north and 30 h in the south, while gridded datasets showed median values ranging from 22 to 37 h.
Figure 13 presents results analogous to those in Fig. 12, but for the amplitudes (panels a and b) and rising times (panels c and d) of SSM and RZSM in response to the most intense precipitation (P) event of the year.
Figure 13a shows that in situ SSM amplitudes presented lower median values and reduced variability in the arid north compared to the humid south. Unlike the response to the first P event, most gridded datasets underestimated both the amplitude and its variability, with the exception of ERA5 in the north, which was more closely aligned with the in situ observations. In the south, ERA5 and GLDAS-Noah underestimated both the median amplitude and their variability, whereas ERA5-Land and SPL4SMAU overestimated the median values and presented similar levels of variability in both regions. In contrast to the first event of the year, Fig. 13b indicates that SSM rising times were generally shorter in the south than in the north, a pattern observed in both in situ data and all gridded datasets but GLDAS-Noah. Median rising times from in situ observations were about 15 h in the north and 10 h in the south, while gridded datasets presented values ranging from 10 to 18 h.
Figure 13c shows that in situ RZSM amplitudes were lower and more variable in the north than in the south. All gridded datasets substantially underestimated the in situ median amplitudes, with gridded values ranging from 0.007 to 0.015 m3 m−3, compared to 0.020 to 0.045 m3 m−3 for in situ measurements. Among the datasets, ERA5 and ERA5-Land provided the estimates closest to the in situ median amplitudes in both regions. Although all products except GLDAS-Noah exhibited higher variability in the north, they consistently underestimated the in situ variability, with the bias being more pronounced in that region. Finally, Fig. 13d reveals that rising times in the root zone followed the same regional pattern observed for SSM, with shorter times in the south across all data sources. Median rising times from in situ observations were about 18 h in the north and 15 h in the south, while gridded datasets presented values ranging from 15 to 27 h.
Our results revealed consistent regional patterns in the SM responses to precipitation events, with pronounced differences in amplitudes (A) and rising times (RT) between the arid northern and humid southern sites. Some gridded products, such as SPL4SMAU and ERA5-Land, showed better agreement with in situ observations, particularly in capturing rising times. In contrast, other products, such GLDAS-Noah, presented greater discrepancies, especially in the northern sites where both A and RT had large differences with observed values. These findings highlight region-dependent variations in the performance of gridded SM datasets, which will be further examined in the following section.
4.4 Challenges of temporal and spatial comparisons
Temporal mismatches between gridded and in situ SM further contribute to evaluation uncertainty. Most gridded SM products are produced at fixed temporal intervals (e.g., hourly, 3-hourly), which may not capture the timing of rapid SM responses to precipitation events. Such mismatch can obscure key hydrological signatures, such as response amplitude and rising time, particularly in regions characterised by high rainfall variability or pronounced seasonal transitions. In addition, while the harmonisation of RZSM to 0–100 cm used in this study facilitates inter-product comparison, but it might partially smooth out vertical moisture gradients and mask out depth-dependent moisture storage or redistribution processes, particularly in clay-rich soils (Faúndez Urbina et al., 2023). Future research could explore a multi-layer evaluation (e.g., 0–7, 7–28, and 28–100 cm) to better assess the sensitivity of vertical soil moisture dynamics and infiltration processes across contrasting soil textures.
On the other hand, terrain heterogeneity plays a critical role in shaping SM dynamics (Larson et al., 2022). Variations in elevation, slope, and soil composition across the study area influence water retention, infiltration, and lateral flow, thereby affecting SM estimates from both in situ sensors and gridded datasets. For instance, steeper slopes tend to enhance surface runoff and limit infiltration, while clay-rich soils typically retain more moisture than sandy soils. Incorporating these topographic and pedological factors is essential for interpreting spatial discrepancies in product performance and for improving the physical realism of SM simulations across heterogeneous ecosystems.
Beyond these spatial controls, differences in the atmospheric forcing used by each modelling system also contribute to uncertainty in the comparison. Although precipitation strongly controls soil moisture dynamics, our analysis evaluates the products as integrated outputs generated by their respective modelling frameworks. ERA5, ERA5-Land, and GLDAS-Noah each combine precipitation, evapotranspiration, and land–surface processes in different ways (Hersbach et al., 2020; Muñoz Sabater et al., 2021; Rodell et al., 2004; Reichle et al., 2017a). On the other hand, in SMAP-L4 precipitation is not directly observed but is incorporated as a bias-corrected meteorological forcing to the land surface model, derived from combined gauge and satellite products, while soil moisture states are subsequently refined through the assimilation of SMAP brightness temperature.
To provide additional context for the interpretation of soil moisture responses, we compared gridded precipitation from ERA5 and ERA5-Land with in situ rainfall observations at each site (Sect. S3). In addition to time series comparisons, basic statistical metrics (correlation, ubRMSE, KGE′, and PBIAS) are reported to characterise the agreement between reanalysis precipitation and local observations.
Overall, the results indicate a moderate temporal correspondence between reanalysis precipitation and observed rainfall events, while also revealing substantial biases in precipitation magnitude at several sites, particularly in arid and topographically complex environments. These results are not intended as a standalone validation of precipitation products, but rather to contextualise the uncertainty associated with atmospheric forcing when interpreting soil moisture dynamics at the event scale. Evaluating soil moisture in this final, integrated form reflects how these products are commonly used in hydrological and climate studies and provides a practical basis for comparing their behaviour across contrasting hydroclimatic regions.
In point-to-pixel evaluations, the spatial representativeness of in situ SM measurements is limited by heterogeneity in soil properties, land cover, and P gradients. These factors can introduce representativeness errors, where point-scale observations fail to reflect the broader-scale dynamics captured by gridded datasets (Brocca et al., 2010; Xia et al., 2014; Gruber et al., 2020; Yu et al., 2024; Schmidt et al., 2024). In contrast, spatial averaging reduces local noise and better reflects regional SM patterns, thereby enhancing correlation and reducing bias (Wang and Zeng, 2012; Xia et al., 2014; Bi et al., 2016; Zheng et al., 2022a, 2024). However, recent studies indicate that higher spatial resolution does not necessarily translate into improved agreement with in situ data. For example, Schmidt et al. (2024) demonstrated that factors such as land cover, mean SM conditions, and retrieval algorithms often have a greater influence on performance than spatial resolution alone. Likewise, Degano et al. (2024) and Ortenzi et al. (2024) found that high-resolution datasets (e.g., SMAP/Sentinel-1 at 1 and 3 km) often produced larger errors compared to coarser products (e.g., SMAP at 9 or 36 km), particularly in the absence of local validation. These findings warn against assuming improved accuracy based solely on higher spatial resolution.
As discussed in previous sections, scale-related challenges affect the interpretation of product performance and complicate the evaluation of gridded SM datasets. While spatial aggregation can partially alleviate some representativeness issues, temporal desynchronisation remains a major source of uncertainty, particularly when assessing SM dynamics at the P event scale. This limitation is especially critical when evaluating how accurately gridded products capture the timing and evolution of SM responses to P. Furthermore, in regions with sparse monitoring networks, such as many areas in the Southern Hemisphere, spatial averaging is often impractical due to the limited number of in situ stations available per grid cell. In these contexts, one-to-one comparisons between individual in situ stations and the corresponding grid cells, as used in this study, remain a practical and essential approach for evaluating SM products in under-monitored and data-scarce ecosystems.
The temporal coverage of this study (2022–2023) limits the assessment of inter-annual variability. Nevertheless, high-frequency analyses spanning one or two hydrological years have been shown to be effective in identifying dominant error sources and sensitivities in gridded soil moisture products, particularly in regions characterised by strong seasonal contrasts (Albergel et al., 2012; Brocca et al., 2010; Beck et al., 2021). In semi-arid and temperate ecosystems, soil water content typically undergoes pronounced intra-annual transitions, from near-saturated conditions during winter to minimal plant-available water at the end of the dry season, driven by precipitation pulses, atmospheric evaporative demand, and vegetation water use (Dai et al., 2022; Sun et al., 2015; Räsänen et al., 2020). Capturing these transitions is critical for evaluating the capacity of soil moisture products to reproduce key hydrological processes.
The spatial diversity of the monitoring sites across contrasting hydroclimatic regimes partially compensates for the limited temporal extent, by enabling a process-oriented evaluation across a broad range of hydrological responses. Nonetheless, extending the in situ observational record and integrating complementary gridded datasets would enhance the robustness of the present analysis.
Finally, our study highlights the importance of incorporating deseasonalised statistical metrics in the evaluation of SM products (Schmidt et al., 2024; Peng et al., 2021), particularly in arid regions where strong seasonal fluctuations may obscure short-term dynamics. Given the lower spatial variability of SM anomalies compared to absolute values, deseasonalisation offers a more challenging basis for product assessment (Brocca et al., 2014; Albergel et al., 2012; Gruber et al., 2020; Peng et al., 2021; Schmidt et al., 2024). We recommend its routine use in future validation efforts to improve robustness and comparability across studies.
4.5 Influence of vegetation representation
The performance of gridded SM products is influenced not only by P inputs and soil parameterisation within land surface models, but also by how vegetation and land cover are represented. These models typically rely on global land cover datasets to define surface characteristics that affect key hydrological processes such as infiltration, evaporation, and runoff (Liu et al., 2024). However, such datasets often oversimplify vegetation structure and rooting depth; particularly in regions like Chile, where strong climatic and ecological gradients occur over short distances. These generalisations can introduce systematic biases in SM estimates, as products differ in their land cover classifications and associated vegetation parameters. For instance, GLDAS-Noah uses the AVHRR-based classification from the University of Maryland (Rui et al., 2021), while SPL4SMAU relies on MODIS-derived or GLCC-based categories (Reichle et al., 2022b). These classification schemes directly affect modelled processes such as canopy interception and transpiration, thereby influencing SM retention and temporal variability.
The previous limitations become particularly evident when comparing ecologically distinct sites (see Tables 2 and 3). In the semi-arid north (e.g., SM05), sparse vegetation and shallow-rooted species facilitate rapid infiltration and drying, resulting in brief SM responses with low amplitude and short rising times. Conversely, southern humid sites such as SM14 exhibit longer SM retention due to dense canopy cover and deep-rooted vegetation, which attenuate short-term fluctuations. These structural and functional vegetation differences are not adequately captured by current gridded SM products, leading to discrepancies in event-scale SM dynamics.
These patterns are clearly illustrated in the event-based evaluation of SM signatures. At SM05 (Fig. 10), in situ observations showed no discernible SM response during the first precipitation event of the year, whereas most gridded products simulated a response, overestimating both amplitude and rising time. This indicates a limited ability to capture rapid depletion processes typical of arid shrubland ecosystems. At SM14 (Fig. 11), gridded products overestimated post-event moisture retention, with rising times exceeding those observed in situ – likely due to oversimplified representations of forest transpiration and rooting depth in the land surface models.
This study contributes to better understand how gridded SM products simulate hydrological dynamics across ecologically diverse regions in the Southern Hemisphere. The evaluation of event-based SM signatures (amplitude and rising time) provided a process-oriented complement to traditional statistical metrics, allowing for a more exhaustive assessment of SM dynamics. Our results reveal consistent spatial and product-specific biases and underscore the importance of regionally contextualized validation in under-monitored natural ecosystems.
4.6 Practical implications
Identifying SM products that exhibit superior performance under specific hydroclimatic regimes can guide the choice of data sources for operational applications in poorly monitored regions. Such applications include the calibration and forcing of hydrological models (Rajib et al., 2016; Probst and Mauser, 2022; Silwimba et al., 2025; Zeng et al., 2021b), digital soil mapping (Aljanabi and Dedeoğlu, 2025; Luo et al., 2025), improving the spatio-temporal analysis of drought propagation (Lin et al., 2023), evaluating surface water stress monitoring in semi-arid environments (Ceppi et al., 2025), and deepening dendrochronological analyses that depend on soil moisture availability or antecedent water balance as key controls on tree growth in Chilean forests (Álvarez et al., 2024).
4.7 Future research
Building on our findings, future research should aim to strengthen the spatial and temporal representativeness of soil moisture assessments in natural ecosystems. Although the spatial diversity of monitoring sites across contrasting hydroclimatic regimes partially offsets the limited temporal coverage by enabling a process-oriented evaluation of diverse hydrological responses, extending the in situ observational record remains essential to enhance robustness. This effort would benefit from the integration of complementary gridded datasets. For example, combining three independent soil moisture products within a triple-collocation framework would allow the estimation of error characteristics (e.g., variance and bias) even in the absence of absolute ground truth (e.g. Gruber et al., 2016). High-resolution active microwave observations, such as those from Sentinel-1, offer a promising pathway to bridge the scale gap between point-scale measurements and coarse-resolution gridded products (e.g. Bauer-Marschallinger et al., 2019; Madelon et al., 2023). In parallel, incorporating vegetation information, such as leaf area index and related indices from MODIS or Copernicus, would support a more explicit evaluation of vegetation–soil moisture coupling (e.g. Chen et al., 2015), while high-resolution soil property maps could help quantify the influence of soil texture and water-holding capacity on discrepancies between in situ and gridded estimates (e.g. Coopersmith et al., 2014). Additional hydrological variables may further serve as soft data for process-level validation, including streamflow records to assess integrated soil moisture–streamflow responses and drought indices to evaluate the consistency of soil moisture anomalies at seasonal scales (e.g. Popat and Döll, 2021; Afshar et al., 2022). Finally, expanding the Kimün-Ko monitoring network to encompass a broader range of ecohydrological settings and conducting systematic cross-comparisons with global databases such as the International Soil Moisture Network (ISMN) would enhance interregional consistency and contribute to the development of harmonised soil moisture validation frameworks, particularly in under-represented regions of the Southern Hemisphere.
This study presents a comprehensive evaluation of state-of-the-art gridded soil moisture (SM) products using high-temporal-resolution (3-hourly) in situ observations from the Kimün-Ko monitoring network, which spans ecologically diverse native ecosystems across Chile. By examining product performance under contrasting hydroclimatic conditions, the analysis enhances understanding of SM dynamics in data-scarce regions of the Southern Hemisphere. The results, summarised in Fig. 14 and discussed below, reveal both the strengths and limitations of widely used gridded SM datasets for hydrological monitoring and modelling, and provide practical guidance for their application in heterogeneous and under-monitored environments.
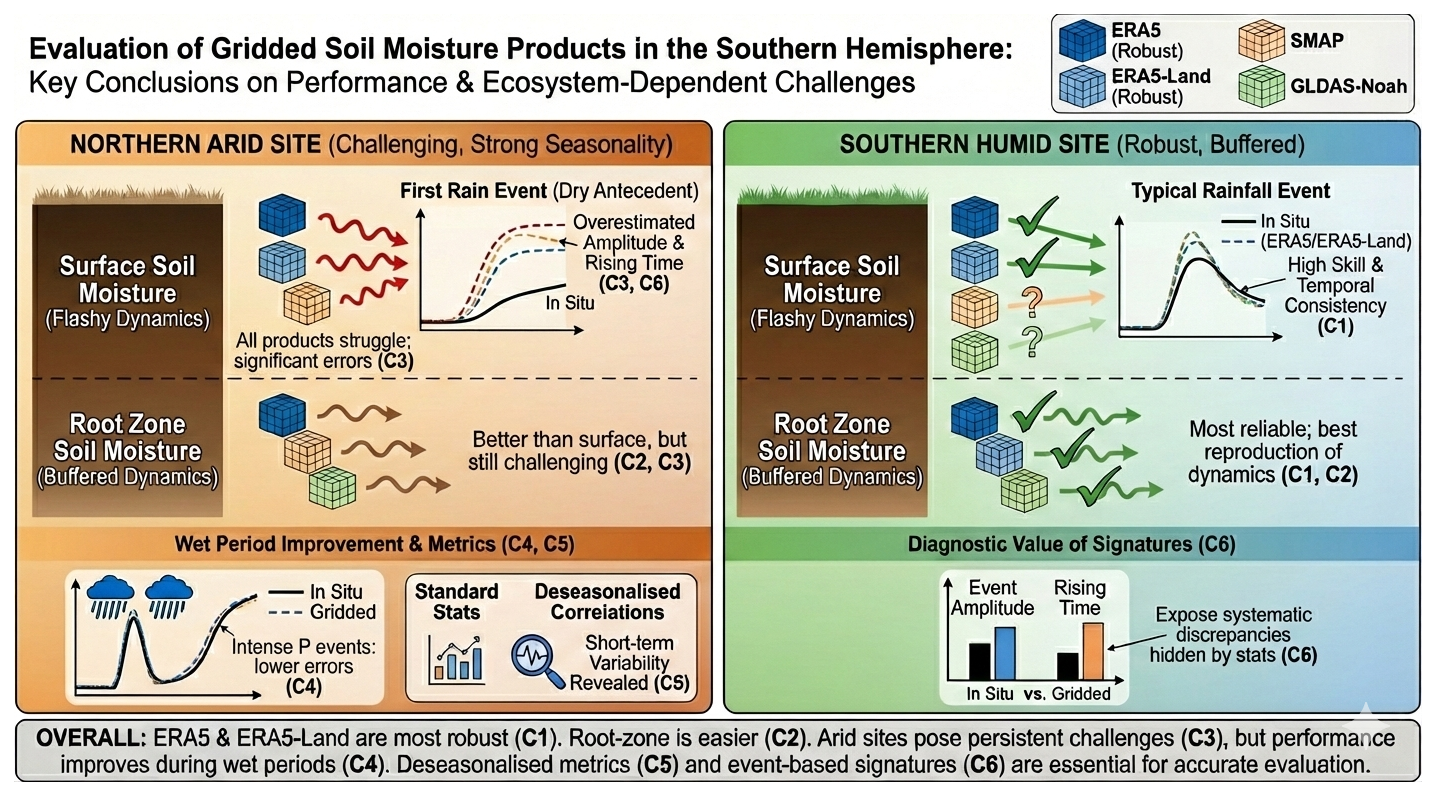
Figure 14Schematic summary of the main conclusions of this article. Image generated using Google Gemini 3 Pro (Gemini Team and Google, 2025), with prompt by the second author (MZB).
-
General performance for SSM: Gridded SM products demonstrated moderate skill in representing SSM dynamics, with varying performance across datasets. Among the evaluated products, ERA5 and ERA5-Land consistently performed best, achieving average 3-hourly KGE′ values of 0.63 and Spearman rank correlations ranging from 0.53 in the arid north to 0.74 in the humid south. Their strong agreement with in situ temporal patterns suggests their suitability for monitoring SSM conditions in natural ecosystems. In contrast, GLDAS-Noah and SPL4SMAU showed lower performance, with a systematic tendency to overestimate SM, particularly at arid northern sites.
-
General performance for RZSM: All gridded SM products showed stronger performance in representing RZSM than SSM, with greater consistency across monitoring sites. ERA5 and ERA5-Land achieved the highest overall performance, with mean 3-hourly KGE′ values of 0.66 and 0.70, respectively, and Spearman correlation coefficients (ρ) above 0.5 for deseasonalised time series at all monitoring sites. This strong performance likely reflects their capacity to capture the slower, more buffered dynamics of deeper soil layers, which are less sensitive to short-term variability. In contrast, GLDAS-Noah and SPL4SMAU showed notable deficiencies in reproducing RZSM patterns in natural ecosystems, with a low average KGE′ of 0.27 and poor correlation with in situ measurements.
-
Enhanced performance of ERA5 and ERA5-Land in humid ecosystems: At the humid southern monitoring sites, ERA5 and ERA5-Land consistently outperformed other gridded products in capturing both SSM and RZSM dynamics. Their performance was particularly robust during wetter periods, with ERA5-Land achieving KGE′ values of 0.83 for SSM and 0.87 for RZSM, among the highest obtained for all the monitoring sites of the Kimün-Ko network. These results highlight the effectiveness of ERA5 and ERA5-Land in representing SM variability in humid ecosystems, where frequent P events and higher soil moisture levels prevail.
-
Challenges in representing SM dynamics in arid ecosystems: In the northern arid ecosystems, all gridded products consistently overestimated both the amplitude and rising time of SSM and RZSM during the first precipitation event of the year. Across gridded datasets, amplitude overestimations exceeded 0.02 m3 m−3, and rising times were overestimated by more than 20 h (ca. 100 %). Although SPL4SMAU showed comparatively better performance in arid sites based on statistical metrics such as ubRMSE and KGE′, its Spearman rank correlation exhibited substantial variability across monitoring locations, indicating inconsistencies in capturing temporal dynamics.
-
Improved performance during intense precipitation events: Gridded SM products demonstrated better agreement with in situ observations during intense precipitation events compared to the first dry event of the year. In the northern arid ecosystems, amplitude overestimations were reduced to approximately 0.01 m3 m−3, and rising time overestimation decreased by around 10 h (∼ 50 %). Similarly, in the southern humid sites, both amplitude and rising time discrepancies were smaller than those observed during the first precipitation event of the year. These findings suggest that product performance improves under wetter conditions, likely due to more pronounced and sustained SM levels.
-
Deseasonalised metrics for soil moisture products evaluation: The use of Spearman rank correlation (ρ) applied to deseasonalised time series proved effective in identifying discrepancies between observed and gridded SM estimates. This approach was particularly valuable in arid regions, where strong seasonal patterns can obscure short-term SM dynamics. In contrast, humid regions, characterised by more frequent P events, exhibited weaker seasonality, reducing the relative impact of deseasonalistion.
-
Complementary value of SM signatures in SM evaluations: While conventional statistical metrics of performance, such as KGE′, suggest acceptable to good performance across gridded SM datasets, event-based analysis of SM signatures (amplitude and rising times) revealed systematic discrepancies not captured by these aggregate statistics. For instance, ERA5-Land, which performed well in humid ecosystems, presented important timing and magnitude biases under dry conditions during the first P precipitation event of the year. These findings demonstrate that SM signatures offer valuable and complementary diagnostic insights beyond statistical metrics, and highlight the importance of incorporating ecosystem-specific evaluation approaches when assessing SM dataset performance.
Despite inherent spatial uncertainties and dataset limitations, this study provides valuable contributions by: (i) offering a comprehensive evaluation of gridded SM datasets in natural ecosystems of the Southern Hemisphere, regions that remain largely under-monitored and under-evaluated in global studies; and (ii) presenting an exhaustive assessment of both surface and root-zone SM responses to P events, revealing key spatial patterns and product-specific strengths and limitations.
-
ERA5 and ERA5-Land provide the most robust performance across ecosystems. They reproduce both surface and root-zone soil moisture dynamics with the highest skill, particularly in humid southern sites, and offer strong temporal consistency for ecohydrological applications.
-
Root-zone soil moisture is generally easier to reproduce than surface soil moisture. All SM products perform better for deeper layers due to their more buffered dynamics. ERA5 and ERA5-Land remain the most reliable datasets for studies requiring accurate representation of root-zone variability.
-
Arid ecosystems continue to pose important challenges for all datasets. At northern sites, all products overestimate both the amplitude and the rising time of the SM response to the first precipitation event of the year, highlighting persistent limitations under dry antecedent conditions and low soil water storage.
-
Performance improves substantially during wetter periods. Amplitude and timing errors, in both arid and humid regions, are substantially lower during intense precipitation events; indicating that gridded products more effectively capture soil moisture dynamics when hydrological signals are strong.
-
Deseasonalised correlations provide clearer insights into short-term dynamics. The Spearman rank correlation computed on deseasonalised time series is particularly informative in arid climates, where strong seasonality can mask short-term variability. Seasonality-adjusted metrics should therefore be incorporated more routinely in product evaluation.
-
Soil-moisture signatures reveal diagnostic information overlooked by standard statistics. Event-based signatures, such as amplitude and rising time, expose systematic discrepancies not visible in traditional statistical metrics; demonstrating the value of integrating process-based diagnostics in future assessments of gridded soil moisture products.
This appendix shows the performance values (ubRMSE, PBIAS, ρ, KGE′) obtained by each gridded soil moisture product (i.e., ERA5, ERA5-Land, SMAP-L4 (SPL4SMAU), GLDAS-Noah) at each in situ monitoring site. To facilitate the identification of the performance level (i.e., excellent, good, satisfactory, or unsatisfactory), colour-coded versions of Tables A1, A2, A3, and A4 can be found in Sect. S4.
Table A1Surface soil moisture metrics: ubRMSE and PBIAS obtained by each gridded soil moisture product at each in situ monitoring site.
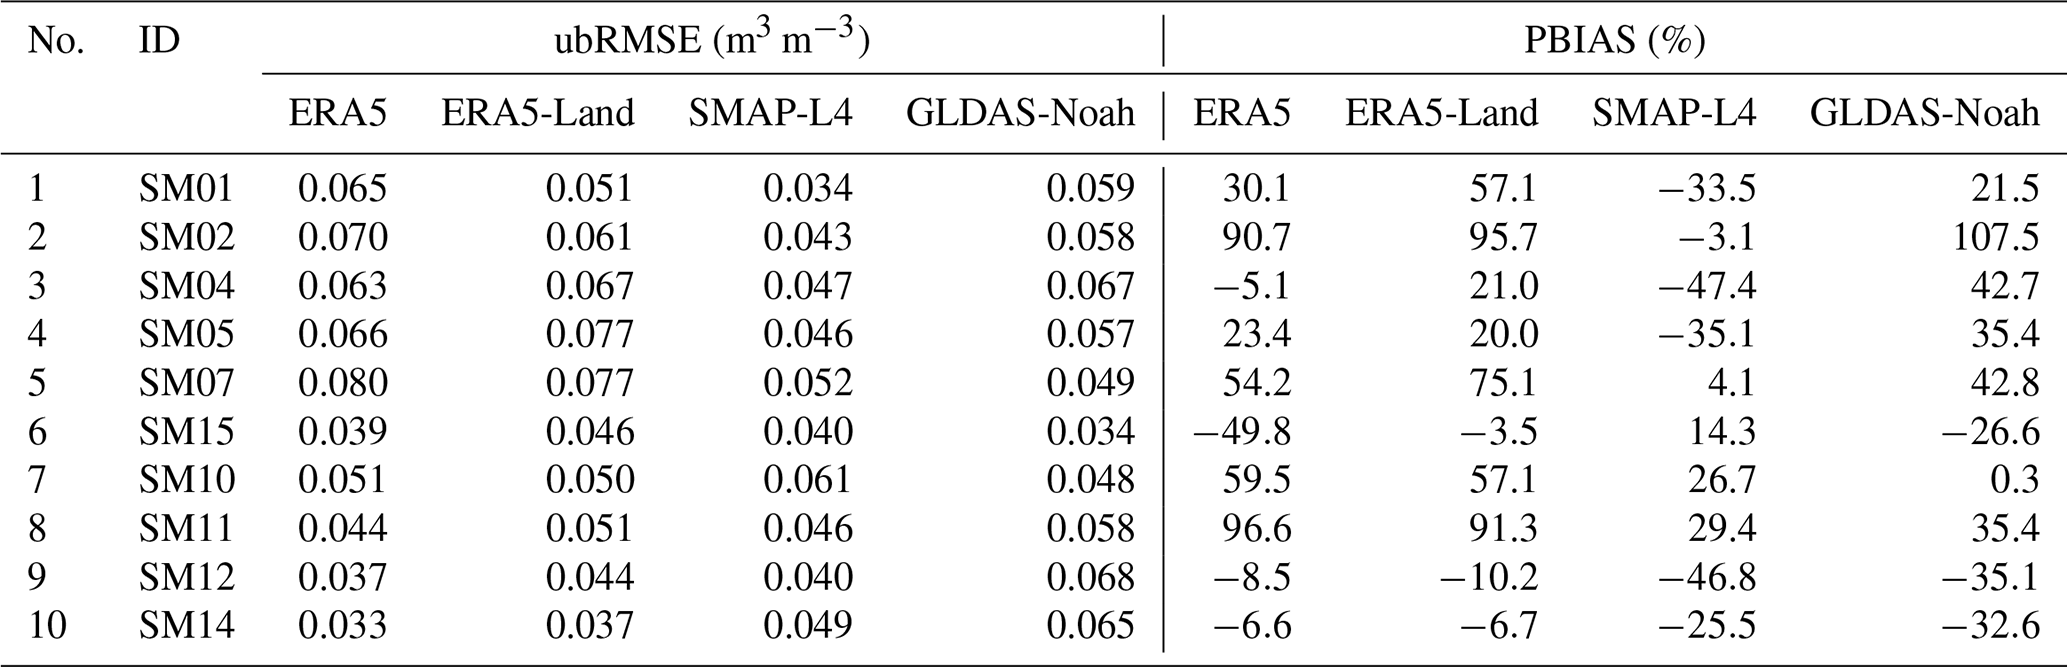
Table A2Surface soil moisture metrics: Spearman correlation (ρ) and modified Kling-Gupta Efficiency (KGE′) obtained by each gridded soil moisture product at each in situ monitoring site.
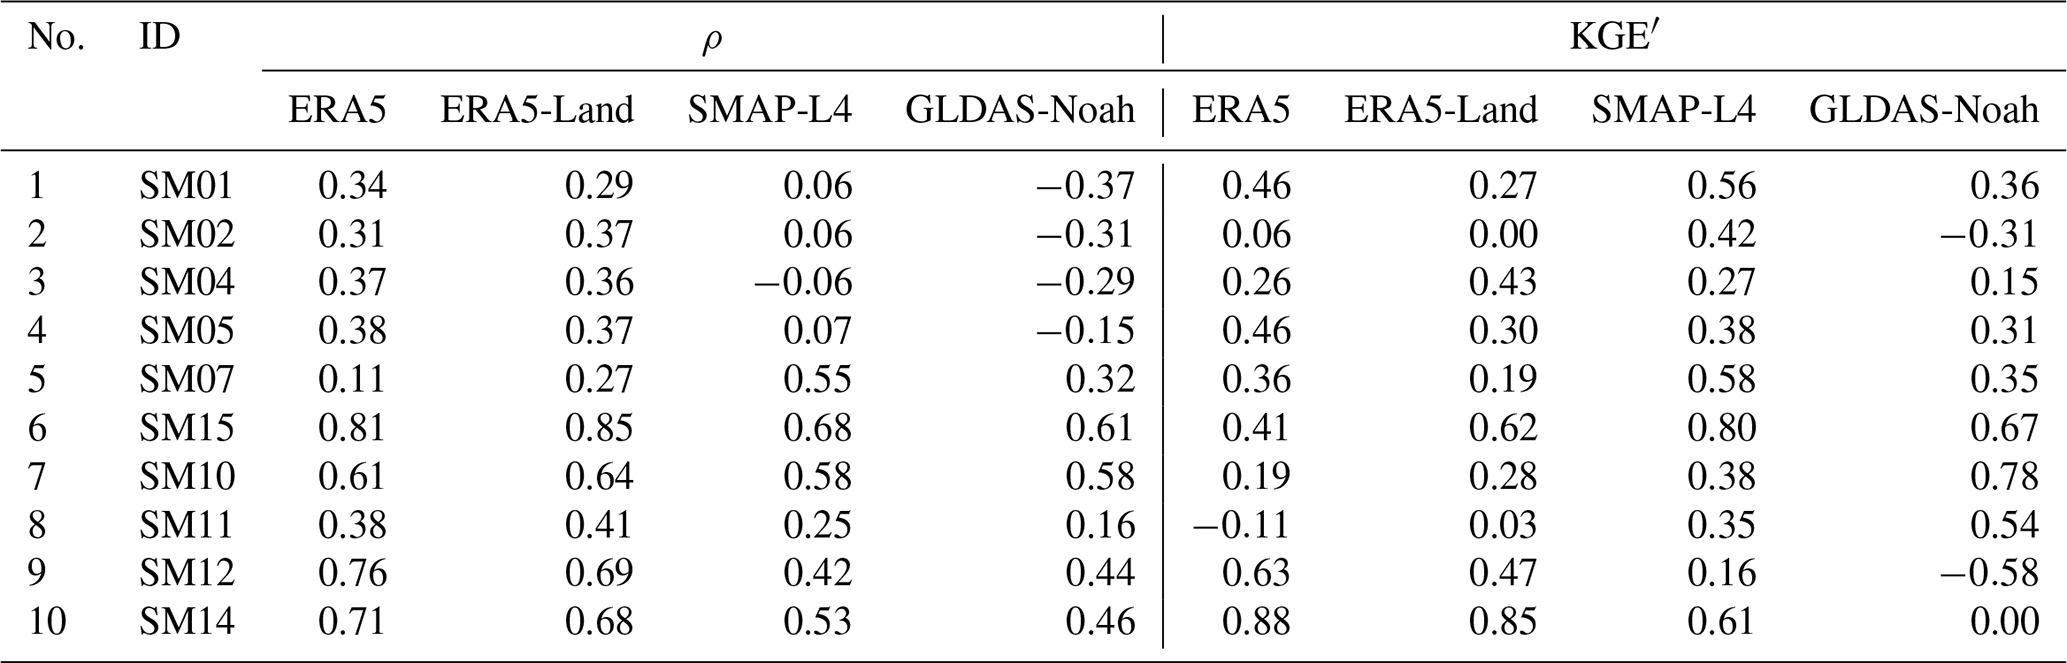
Table A3Root zone soil moisture metrics: ubRMSE and PBIAS obtained by each gridded soil moisture product at each in situ monitoring site.
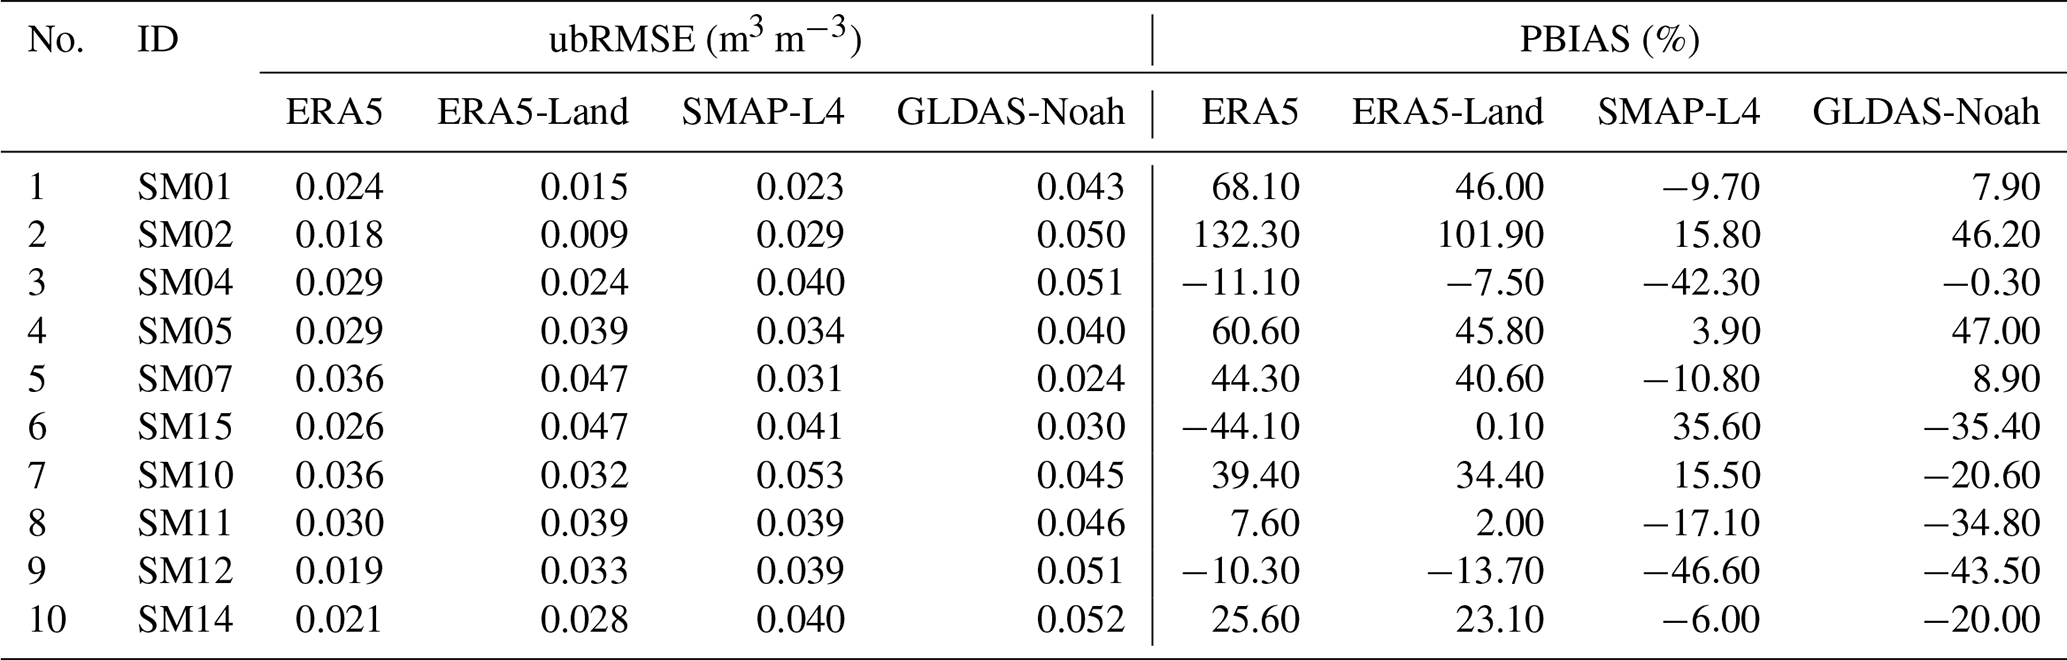
Table A4Root zone soil moisture metrics: Spearman correlation (ρ) and modified Kling-Gupta Efficiency (KGE′) obtained by each gridded soil moisture product at each in situ monitoring site.
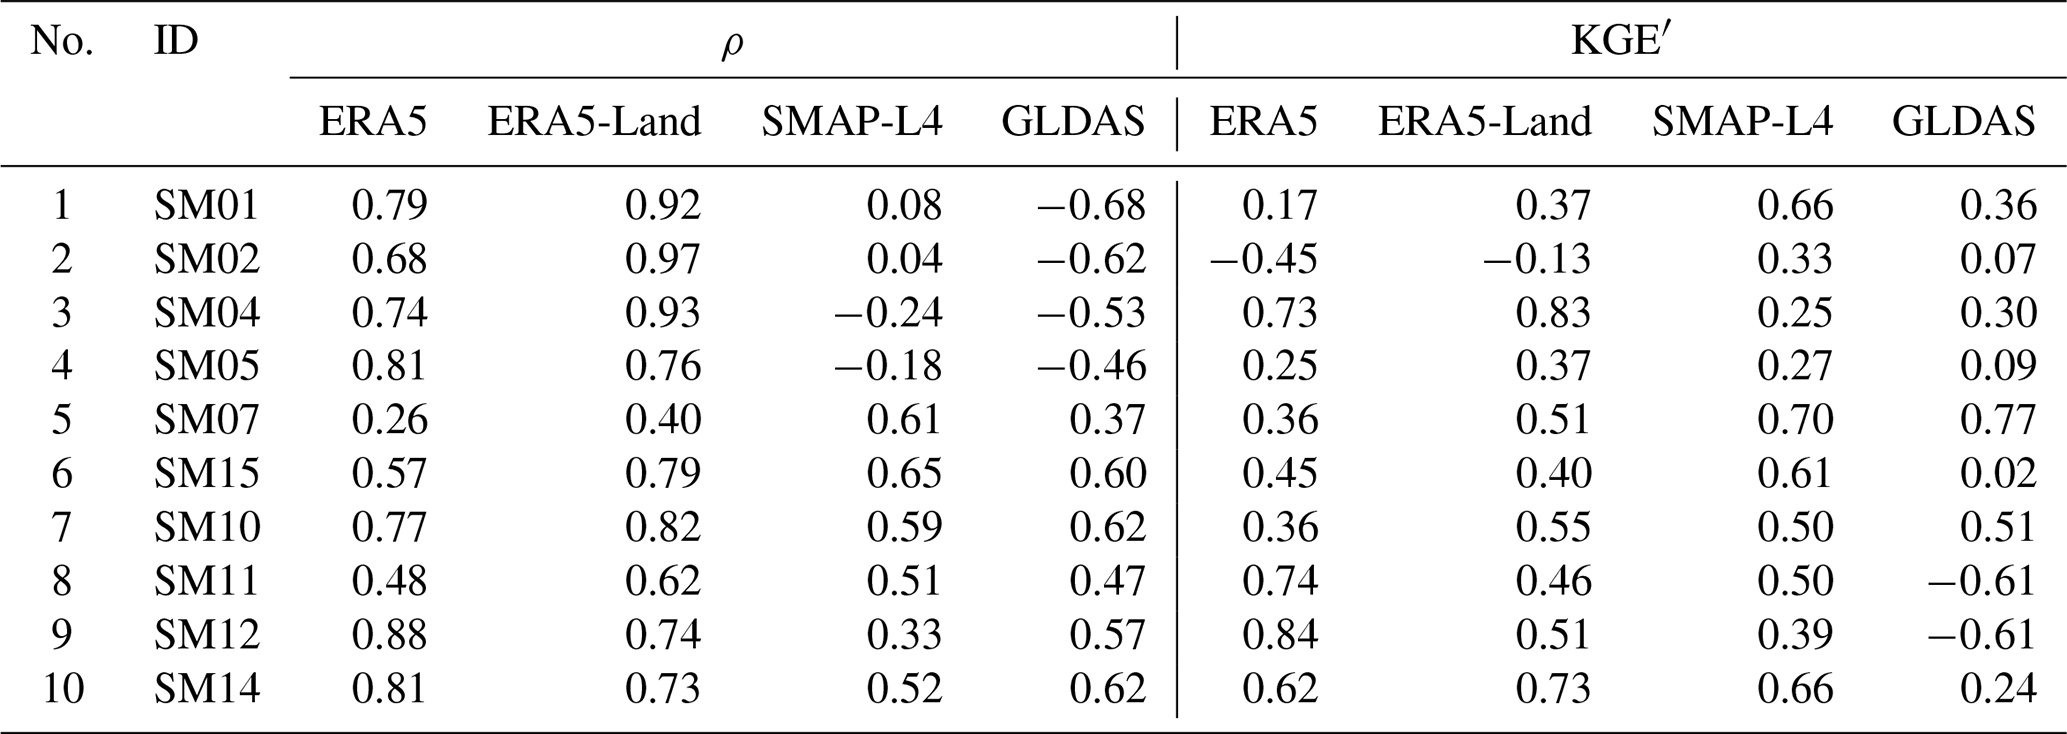
The code that support the findings of this study are available from the corresponding author, MZB, upon reasonable request.
The soil moisture observations from Kimün-Ko SM monitoring network are available at https://chi2.ufro.cl/Datos-en/ (last access: 24 March 2026) and will soon be hosted by the ISMN (Dorigo et al., 2021); in the meantime, they can be obtained from the corresponding author (MZB). All data are freely available. ERA5 data are available at https://doi.org/10.24381/cds.adbb2d47 (Hersbach et al., 2023). ERA5-Land data can be downloaded from https://doi.org/10.24381/cds.e2161bac (Muñoz-Sabater, 2019). The SMAP L4 dataset (SPL4SMAU, Version 7) is accessible at https://doi.org/10.5067/LWJ6TF5SZRG3 (Reichle et al., 2022a). GLDAS-Noah v2.1 data are provided at https://doi.org/10.5067/E7TYRXPJKWOQ (NASA/GSFC/HSL, 2020). Detailed time series and calculated statistical metrics for each site are available in Sect. S2 in the Supplement.
The supplement related to this article is available online at https://doi.org/10.5194/hess-30-1813-2026-supplement.
MZB and MG conceptualised the research. DNI downloaded and processed all the gridded and in situ SM data. All authors agreed on the methodology. DNI carried out the formal analysis under the guidance of MZB and MG. DNI developed the R code to analyse all the data and created all the figures, with contributions from MG and MZ. DNI wrote an early draft with contributions from MG and MZB. MZB and MG contributed to the interpretation of the results. MZB and MG were in charge of funding acquisition, project administration and supervision. MZB edited the final manuscript submitted to HESS based on several drafts elaborated by all co-authors.
The contact author has declared that none of the authors has any competing interests.
Our results contain modified Copernicus Climate Change Service information 2020. Neither the European Commission nor ECMWF is responsible for any use that may be made of the Copernicus information or data it contains.
Publisher's note: Copernicus Publications remains neutral with regard to jurisdictional claims made in the text, published maps, institutional affiliations, or any other geographical representation in this paper. The authors bear the ultimate responsibility for providing appropriate place names. Views expressed in the text are those of the authors and do not necessarily reflect the views of the publisher.
This research has been supported by the Chilean Agencia Nacional de Investigación y Desarrollo (ANID) through the following projects: ANID-Fondecyt Regular 1212071 and 1210932, ANID-PCI NSFC 190018, ANID-FONDAP 1523A0002, ANID DO21000, and Fondecyt 1250718.
This paper was edited by Roberto Greco and reviewed by two anonymous referees.
Adler, R. F., Gu, G., Huffman, G. J., Sapiano, M. R., and Wang, J.-J.: GPCP and the Global Characteristics of Precipitation, Satellite Precipitation Measurement: Volume 2, Springer Nature, 677–697, https://doi.org/10.1007/978-3-030-35798-6_11, 2020. a
Afshar, M., Bulut, B., Duzenli, E., Amjad, M., and Yilmaz, M.: Global spatiotemporal consistency between meteorological and soil moisture drought indices, Agricultural and Forest Meteorology, 316, 108848, https://doi.org/10.1016/j.agrformet.2022.108848, 2022. a
Al-Yahyai, R., Schaffer, B., Davies, F. S., and Munoz-Carpena, R.: Characterization of soil-water retention of a very gravelly loam soil varied with determination method, Soil Science, 171, 85–93, https://doi.org/10.1097/01.ss.0000187372.53896.9d, 2006. a
Alaminie, A. A., Annys, S., Nyssen, J., Jury, M. R., Amarnath, G., Mekonnen, M. A., and Tilahun, S. A.: A comprehensive evaluation of satellite-based and reanalysis soil moisture products over the upper Blue Nile Basin, Ethiopia, Scientific African, 19, e0100173, https://doi.org/10.1016/j.srs.2024.100173, 2024. a
Albergel, C., De Rosnay, P., Gruhier, C., Muñoz-Sabater, J., Hasenauer, S., Isaksen, L., Kerr, Y., and Wagner, W.: Evaluation of remotely sensed and modelled soil moisture products using global ground-based in situ observations, Remote Sensing of Environment, 118, 215–226, https://doi.org/10.1016/j.rse.2011.11.017, 2012. a, b, c
Aljanabi, F. K. and Dedeoğlu, M.: Soil texture approach to drought risk management using long-term ERA5 dataset and geospatial techniques in a semi-arid ecosystem, Soil Science Annual, 76, https://doi.org/10.1016/j.ecolind.2025.114249, 2025. a
Álvarez, C., Christie, D. A., González-Reyes, Á., Veblen, T. T., Helle, G., LeQuesne, C., Rodriguez-Caton, M., Szejner, P., Flores-Sáez, F., Gipoulou-Zúñiga, T., Suazo-Álvarez, M., Muñoz Salazar, T., Aliste, D., Morales, M. S., Muñoz, A., and Villalba, R.: Hydroclimate variability in the Tropical Andes recorded by δ18O isotopes from a new network of Polylepis tarapacana tree-rings, Global and Planetary Change, 239, 104503, https://doi.org/10.1016/j.gloplacha.2024.104503, 2024. a
Alvarez-Garreton, C., Mendoza, P. A., Boisier, J. P., Addor, N., Galleguillos, M., Zambrano-Bigiarini, M., Lara, A., Puelma, C., Cortes, G., Garreaud, R., McPhee, J., and Ayala, A.: The CAMELS-CL dataset: catchment attributes and meteorology for large sample studies – Chile dataset, Hydrol. Earth Syst. Sci., 22, 5817–5846, https://doi.org/10.5194/hess-22-5817-2018, 2018. a
Andaryani, S., Nourani, V., Ball, J., Jahanbakhsh Asl, S., Keshtkar, H., and Trolle, D.: A comparison of frameworks for separating the impacts of human activities and climate change on river flow in existing records and different near-future scenarios, Hydrological Processes, 35, e14301, https://doi.org/10.1002/hyp.14301, 2021. a, b
Araki, R., Branger, F., Wiekenkamp, I., and McMillan, H.: A signature‐based approach to quantify soil moisture dynamics under contrasting land‐uses, Hydrological Processes, 36, https://doi.org/10.1002/hyp.14553, 2022. a, b, c, d, e, f, g
Araki, R., Mu, Y., and McMillan, H.: Evaluation of GLDAS soil moisture seasonality in arid climates, Hydrological Sciences Journal, 68, 1109–1126, https://doi.org/10.1080/02626667.2023.2206032, 2023. a, b
Arino, O., Ramos Perez, J. J., Kalogirou, V., Bontemps, S., Defourny, P., and Van Bogaert, E.: Global Land Cover Map for 2009 (GlobCover 2009), PANGAEA [data set], https://doi.org/10.1594/PANGAEA.787668, 2012. a
Balocchi, F., Galleguillos, M., Rivera, D., Stehr, A., Arumi, J. L., Pizarro, R., Garcia-Chevesich, P., Iroumé, A., Armesto, J. J., Hervé-Fernández, P., Oyarzún, C., Barría, P., Little, C., Mancilla, G., Yépez, S., Rodriguez, R., White, D. A., Silberstein, R. P., Neary, D. G., and Ramírez de Arellano, P.: Forest hydrology in Chile: Past, present, and future, Journal of Hydrology, 616, 128681, https://doi.org/10.1016/j.jhydrol.2022.128681, 2023. a
Bauer-Marschallinger, B., Freeman, V., Cao, S., Paulik, C., Schaufler, S., Stachl, T., Modanesi, S., Massari, C., Ciabatta, L., Brocca, L., and Wagner, W.: Toward Global Soil Moisture Monitoring With Sentinel-1: Harnessing Assets and Overcoming Obstacles, IEEE Transactions on Geoscience and Remote Sensing, 57, 520–539, https://doi.org/10.1109/TGRS.2018.2858004, 2019. a
Beaudoing, H., Rodell, M., and NASA/GSFC/HSL: GLDAS Noah Land Surface Model L4 3 hourly 0.25 × 0.25 degree V2.1, GES DISC [data set], https://doi.org/10.5067/E7TYRXPJKWOQ, 2020. a
Beck, H. E., Pan, M., Miralles, D. G., Reichle, R. H., Dorigo, W. A., Hahn, S., Sheffield, J., Karthikeyan, L., Balsamo, G., Parinussa, R. M., van Dijk, A. I. J. M., Du, J., Kimball, J. S., Vergopolan, N., and Wood, E. F.: Evaluation of 18 satellite- and model-based soil moisture products using in situ measurements from 826 sensors, Hydrol. Earth Syst. Sci., 25, 17–40, https://doi.org/10.5194/hess-25-17-2021, 2021. a, b, c, d, e, f, g, h
Beck-Broichsitter, S., Rizvi, Z. H., Horn, R., and Wuttke, F.: Effect of gravel content on soil water retention characteristics and thermal capacity of sandy and silty soils, Journal of Hydrology and Hydromechanics, 71, 1–10, https://doi.org/10.2478/johh-2023-0001, 2023. a
Bi, H., Ma, J., Zheng, W., and Zeng, J.: Comparison of soil moisture in GLDAS model simulations and in situ observations over the Tibetan Plateau, Journal of Geophysical Research: Atmospheres, 121, 2658–2678, https://doi.org/10.1002/2015jd024131, 2016. a
Bown, H. E., Fuentes, J. P., and Martínez, A. M.: Assessing water use and soil water balance of planted native tree species under strong water limitations in Northern Chile, New Forests, 49, 871–892, https://doi.org/10.1007/s11056-018-9689-6, 2018. a
Branger, F. and McMillan, H. K.: Deriving hydrological signatures from soil moisture data, Hydrological Processes, 34, 1410–1427, https://doi.org/10.1002/hyp.13645, 2020. a, b, c, d
Brocca, L., Melone, F., Moramarco, T., and Morbidelli, R.: Spatial-temporal variability of soil moisture and its estimation across scales, Water Resources Research, 46, https://doi.org/10.1029/2009WR008016, 2010. a, b
Brocca, L., Zucco, G., Mittelbach, H., Moramarco, T., and Seneviratne, S. I.: Absolute versus temporal anomaly and percent of saturation soil moisture spatial variability for six networks worldwide, Water Resources Research, 50, 5560–5576, https://doi.org/10.1002/2014WR015684, 2014. a
Brocca, L., Gaona, J., Bavera, D., Fioravanti, G., Puca, S., Ciabatta, L., Filippucci, P., Mosaffa, H., Esposito, G., Roberto, N., Dari, J., Vreugdenhil, M., and Wagner, W.: Exploring the actual spatial resolution of 1 km satellite soil moisture products, Science of the Total Environment, 945, 174087, https://doi.org/10.1016/j.scitotenv.2024.174087, 2024. a
Ceppi, A., Achite, M., Toubal, A., and Caloiero, T.: Mapping drought characteristics in northern Algerian Basins using the ERA5-Land dataset, Scientific Reports, 15, 10720, https://doi.org/10.1038/s41598-025-95418-8, 2025. a
Chang, L.-L., Yuan, R., Gupta, H. V., Winter, C. L., and Niu, G.-Y.: Why is the terrestrial water storage in dryland regions declining? A perspective based on gravity recovery and climate experiment satellite observations and Noah land surface model with multiparameterization schemes model simulations, Water Resources Research, 56, e2020WR027102, https://doi.org/10.1029/2020wr027102, 2020. a, b
Chen, M., Willgoose, G. R., and Saco, P. M.: Investigating the impact of leaf area index temporal variability on soil moisture predictions using remote sensing vegetation data, Journal of Hydrology, 522, 274–284, https://doi.org/10.1016/j.jhydrol.2014.12.027, 2015. a
Colliander, A., Jackson, T. J., Chan, S. K., O'Neill, P., Bindlish, R., Cosh, M. H., Caldwell, T., Walker, J. P., Berg, A., McNairn, H., Thibeault, M., Martínez-Fernández, J., Jensen, K. H., Asanuma, J., Seyfried, M. S., Bosch, D. D., Starks, P. J., Holifield Collins, C., Prueger, J. H., Su, Z., Lopez-Baeza, E., and Yueh, S. H.: An assessment of the differences between spatial resolution and grid size for the SMAP enhanced soil moisture product over homogeneous sites, Remote Sensing of Environment, 207, 65–70, https://doi.org/10.1016/j.rse.2018.02.006, 2018. a
Coopersmith, E. J., Minsker, B. S., and Sivapalan, M.: Using similarity of soil texture and hydroclimate to enhance soil moisture estimation, Hydrol. Earth Syst. Sci., 18, 3095–3107, https://doi.org/10.5194/hess-18-3095-2014, 2014. a
Dai, L., Fu, R., Guo, X., Du, Y., Zhang, F., and Cao, G.: Soil moisture variations in response to precipitation across different vegetation types on the northeastern Qinghai-Tibet plateau, Frontiers in Plant Science, 13, 854152, https://doi.org/10.3389/fpls.2022.854152, 2022. a, b
Degano, M. F., Beninato, S., Holzman, M. E., Bayala, M. I., Rivas, R. E., and Massari, C.: Soil Moisture: analysis of SMAP satellite products in plain zones, in: 2024 IEEE Biennial Congress of Argentina (ARGENCON), 1–8, IEEE, https://doi.org/10.1109/ARGENCON62399.2024.10735898, 2024. a
Dinamarca, D. I., Galleguillos, M., Seguel, O., and Faúndez Urbina, C.: CLSoilMaps: a national soil gridded database of physical and hydraulic soil properties for Chile, Scientific Data, 10, 630, https://doi.org/10.1038/s41597-023-02536-x, 2023. a, b, c
Dorigo, W., Himmelbauer, I., Aberer, D., Schremmer, L., Petrakovic, I., Zappa, L., Preimesberger, W., Xaver, A., Annor, F., Ardö, J., Baldocchi, D., Bitelli, M., Blöschl, G., Bogena, H., Brocca, L., Calvet, J.-C., Camarero, J. J., Capello, G., Choi, M., Cosh, M. C., van de Giesen, N., Hajdu, I., Ikonen, J., Jensen, K. H., Kanniah, K. D., de Kat, I., Kirchengast, G., Kumar Rai, P., Kyrouac, J., Larson, K., Liu, S., Loew, A., Moghaddam, M., Martínez Fernández, J., Mattar Bader, C., Morbidelli, R., Musial, J. P., Osenga, E., Palecki, M. A., Pellarin, T., Petropoulos, G. P., Pfeil, I., Powers, J., Robock, A., Rüdiger, C., Rummel, U., Strobel, M., Su, Z., Sullivan, R., Tagesson, T., Varlagin, A., Vreugdenhil, M., Walker, J., Wen, J., Wenger, F., Wigneron, J. P., Woods, M., Yang, K., Zeng, Y., Zhang, X., Zreda, M., Dietrich, S., Gruber, A., van Oevelen, P., Wagner, W., Scipal, K., Drusch, M., and Sabia, R.: The International Soil Moisture Network: serving Earth system science for over a decade, Hydrol. Earth Syst. Sci., 25, 5749–5804, https://doi.org/10.5194/hess-25-5749-2021, 2021. a, b, c, d, e
Dunkerley, D. L.: Rainfall intensity bursts and the erosion of soils: an analysis highlighting the need for high temporal resolution rainfall data for research under current and future climates, Earth Surf. Dynam., 7, 345–360, https://doi.org/10.5194/esurf-7-345-2019, 2019. a
Dy, C. Y. and Fung, J. C. H.: Updated global soil map for the Weather Research and Forecasting model and soil moisture initialization for the Noah land surface model, Journal of Geophysical Research: Atmospheres, 121, 8777–8800, https://doi.org/10.1002/2015JD024558, 2016. a
Entekhabi, D., Njoku, E. G., O'Neill, P. E., Kellogg, K. H., Crow, W. T., Edelstein, W. N., Entin, J. K., Goodman, S. D., Jackson, T. J., Johnson, J., Kimball, J., Piepmeier, J. R., Koster, R. D., Martin, N., McDonald, K. C., Moghaddam, M., Moran, S., Reichle, R., Shi, J. C., Spencer, M. W., Thurman, S. W., Tsang, L., and Van Zyl, J.: The Soil Moisture Active Passive (SMAP) Mission, Proceedings of the IEEE, 98, 704–716, https://doi.org/10.1109/JPROC.2010.2043918, 2010. a, b
Entekhabi, D., Yueh, S., O'Neill, P., Kellogg, K., Allen, A., Bindlish, R., Brown, M., Chan, S., Colliander, A., Crow, W., Das, N., De Lannoy, G., Dunbar, R., Edelstein, W., Entin, J., Escobar, V., Goodman, S., Jackson, T., Jai, B., Johnson, J., Kim, E., Kim, S., Kimball, J., Koster, R., Leon, A., McDonald, K., Moghaddam, M., Mohammed, P., Moran, S., Njoku, E., Piepmeier, J., Reichle, R., Rogez, F., Shi, J., Spencer, M., Thurman, S., Tsang, L., Van Zyl, J., Weiss, B., and West, R.: SMAP Handbook: Soil Moisture Active Passive, Mapping Soil Moisture Freeze/Thaw From Space, National Aeronautics and Space Administration, Jet Propulsion Laboratory, Pasadena, California, NASA Technical Report, https://lirias.kuleuven.be/retrieve/39da983c-34bd-49ea-a465-e478f23e9b2d (last access: 24 March 2026), 2014. a, b, c
Evans, J. G., Ward, H. C., Blake, J. R., Hewitt, E. J., Morrison, R., Fry, M., Ball, L. A., Doughty, L. C., Libre, J. W., Hitt, O. E., Rylett, D., Ellis, R. J., Warwick, A. C., Brooks, M., Parkes, M. A., Wright, G. M. H., Singer, A. C., Boorman, D. B., and Jenkins, A.: Soil water content in southern England derived from a cosmic-ray soil moisture observing system – COSMOS-UK, Hydrological Processes, 30, 4987–4999, https://doi.org/10.1002/hyp.10929, 2016. a
Faúndez Urbina, C. A., Alanís, D. C., Ramírez, E., Seguel, O., Fustos, I. J., Donoso, P. D., de Miranda, J. H., Rakonjac, N., Palma, S. E., and Galleguillos, M.: Estimating soil water content in a thorny forest ecosystem by time-lapse electrical resistivity tomography (ERT) and HYDRUS 2D/3D simulations, Hydrological Processes, 37, e15002, https://doi.org/10.1002/hyp.15002, 2023. a, b
Frêne, C., Dörner, J., Zuniga, F., Cuevas, J. G., Alfaro, F. D., and Armesto, J. J.: Eco-hydrological functions in forested catchments of Southern Chile, Ecosystems, 23, 307–323, https://doi.org/10.1007/s10021-019-00404-7, 2020. a
Galleguillos, M., Ceballos, A., Gimeno, F., and Zambrano-Bigiarini, M.: CLDynamicLandCover, Zenodo, https://doi.org/10.5281/zenodo.13153631, 2024. a
Gelaro, R., McCarty, W., Suárez, M. J., Todling, R., Molod, A., Takacs, L., Randles, C., Darmenov, A., Bosilovich, M. G., Reichle, R., Wargan, K., Coy, L., Cullather, R., Draper, C., Akella, S., Buchard, V., Conaty, A., da Silva, A., Gu, W., Kim, G.-K., Koster, R., Lucchesi, R., Merkova, D., Nielsen, J. E., Partyka, G., Pawson, S., Putman, W., Rienecker, M., Schubert, S. D., Sienkiewicz, M., and Zhao, B.: The Modern-Era Retrospective Analysis for Research and Applications, Version 2 (MERRA-2), J. Clim., 30, 5419–5454, https://doi.org/10.1175/JCLI-D-16-0758.1, 2017. a, b
Gemini Team and Google: Developers can build with Nano Banana Pro (Gemini 3 Pro Image), announcement of Gemini 3 Pro Image (Nano Banana Pro) and updated technical capabilities, https://blog.google/innovation-and-ai/technology/developers-tools/gemini-3-pro-image-developers/ (last access: 24 December 2025), 2025. a
Google LLC: Google Earth Imagery, https://earth.google.com (last access: 1 February 2025), 2025. a
Gruber, A., Su, C.-H., Zwieback, S., Crow, W., Dorigo, W., and Wagner, W.: Recent advances in (soil moisture) triple collocation analysis, International Journal of Applied Earth Observations and Geoinformation, 45, 200–211, https://doi.org/10.1016/j.jag.2015.09.002, 2016. a
Gruber, A., De Lannoy, G., Albergel, C., Al-Yaari, A., Brocca, L., Calvet, J.-C., Colliander, A., Cosh, M., Crow, W., Dorigo, W., Draper, C., Hirschi, M., Kerr, Y., Konings, A., Lahoz, W., McColl, K., Montzka, C., Muñoz-Sabater, J., Peng, J., Reichle, R., Richaume, P., Rüdiger, C., Scanlon, T., van der Schalie, R., Wigneron, J.-P., and Wagner, W.: Validation practices for satellite soil moisture retrievals: What are (the) errors?, Remote Sens. Environ., 244, 111806, https://doi.org/10.1016/j.rse.2020.111806, 2020. a, b
Guo, X., Fang, X., Zhu, Q., Jiang, S., Tian, J., Tian, Q., and Jin, J.: Estimation of Root-Zone Soil Moisture in Semi-Arid Areas Based on Remotely Sensed Data, Remote Sensing, 15, 2003, https://doi.org/10.3390/rs15082003, 2023. a
Hao, Y., Liu, Q., Li, C., Kharel, G., An, L., Stebler, E., Zhong, Y., and Zou, C. B.: Interactive effect of meteorological drought and vegetation types on root zone soil moisture and runoff in rangeland watersheds, Water, 11, 2357, https://doi.org/10.3390/w11112357, 2019. a
Helsel, D. R. and Hirsch, R. M.: Statistical methods in water resources, vol. 49, Elsevier, https://doi.org/10.3133/tm4A3, 1993. a
Hersbach, H., Bell, B., Berrisford, P., Hirahara, S., Horányi, A., Muñoz Sabater, J., Nicolas, J., Peubey, C., Radu, R., Schepers, D., Simmons, A., Soci, C., Abdalla, S., Abellan, X., Balsamo, G., Bechtold, P., Biavati, G., Bidlot, J., Bonavita, M., Chiara, G., Dahlgren, P., Dee, D., Diamantakis, M., Dragani, R., Flemming, J., Forbes, R., Fuentes, M., Geer, A., Haimberger, L., Healy, S., Hogan, R. J., Hólm, E., Janisková, M., Keeley, S., Laloyaux, P., Lopez, P., Lupu, C., Radnoti, G., Rosnay, P., Rozum, I., Vamborg, F., Villaume, S., and Thépaut, J.: The ERA5 global reanalysis, Quarterly Journal of the Royal Meteorological Society, 146, 1999–2049, https://doi.org/10.1002/qj.3803, 2020. a, b, c, d, e
Hersbach, H., Bell, B., Berrisford, P., Biavati, G., Horányi, A., Muñoz Sabater, J., Nicolas, J., Peubey, C., Radu, R., Rozum, I., Schepers, D., Simmons, A., Soci, C., Dee, D., and Thépaut, J.-N.: ERA5 hourly data on single levels from 1940 to present, Climate Data Store [data set], https://doi.org/10.24381/cds.adbb2d47, 2023. a, b
Huffman, G. J., Adler, R. F., Arkin, P., Chang, A., Ferraro, R., Gruber, A., Janowiak, J., McNab, A., Rudolf, B., and Schneider, U.: The global precipitation climatology project (GPCP) combined precipitation dataset, Bulletin of the American Meteorological Society, 78, 5–20, https://doi.org/10.1175/1520-0477(1997)078<0005:TGPCPG>2.0.CO;2, 1997. a
Imaoka, K., Maeda, T., Kachi, M., Kasahara, M., Ito, N., and Nakagawa, K.: Status of AMSR2 instrument on GCOM-W1, in: Earth observing missions and sensors: Development, implementation, and characterization II, vol. 8528, 201–206, SPIE, https://doi.org/10.1117/12.977774, 2012. a
Jarvis, A., Reuter, H. I., Nelson, A., and Guevara, E.: Hole-filled SRTM for the globe Version 4, CGIAR-CSI SRTM 90m Database, http://srtm.csi.cgiar.org (last access: 8 December 2024), 2008. a
Jiao, Y., Zhu, G., Lu, S., Ye, L., Qiu, D., Meng, G., Wang, Q., Li, R., Chen, L., Wang, Y., Si, D., and Li, W.: The Cooling Effect of Oasis Reservoir‐Riparian Forest Systems in Arid Regions, Water Resources Research, 60, https://doi.org/10.1029/2024WR038301, 2024. a, b, c
Kling, H., Fuchs, M., and Paulin, M.: Runoff conditions in the upper Danube basin under an ensemble of climate change scenarios, Journal of Hydrology, 424–425, 264–277, https://doi.org/10.1016/j.jhydrol.2012.01.011, 2012. a, b, c, d
Lai, E. N., Wang-Erlandsson, L., Virkki, V., Porkka, M., and van der Ent, R. J.: Root zone soil moisture in over 25 % of global land permanently beyond pre-industrial variability as early as 2050 without climate policy, Hydrol. Earth Syst. Sci., 27, 3999–4018, https://doi.org/10.5194/hess-27-3999-2023, 2023. a, b
Lal, P., Singh, G., Das, N. N., Colliander, A., and Entekhabi, D.: Assessment of ERA5-land volumetric soil water layer product using in situ and SMAP soil moisture observations, IEEE Geoscience and Remote Sensing Letters, 19, 1–5, https://doi.org/10.1109/LGRS.2022.3223985, 2022. a, b
Larson, J., Lidberg, W., Ågren, A. M., and Laudon, H.: Predicting soil moisture conditions across a heterogeneous boreal catchment using terrain indices, Hydrol. Earth Syst. Sci., 26, 4837–4851, https://doi.org/10.5194/hess-26-4837-2022, 2022. a
Lawrence, D. M., Fisher, R. A., Koven, C. D., Oleson, K. W., Swenson, S. C., Bonan, G., Collier, N., Ghimire, B., van Kampenhout, L., Kennedy, D., Kluzek, E., Lawrence, P. J., Li, F., Li, H., Lombardozzi, D., Riley, W. J., Sacks, W. J., Shi, M., Vertenstein, M., Wieder, W. R., Xu, C., Ali, A. A., Badger, A. M., Bisht, G., van den Broeke, M., Brunke, M. A., Burns, S. P., Buzan, J., Clark, M., Craig, A., Dahlin, K., Drewniak, B., Fisher, J. B., Flanner, M., Fox, A. M., Gentine, P., Hoffman, F., Keppel-Aleks, G., Knox, R., Kumar, S., Lenaerts, J., Leung, L. R., Lipscomb, W. H., Lu, Y., Pandey, A., Pelletier, J. D., Perket, J., Randerson, J. T., Ricciuto, D. M., Sanderson, B. M., Slater, A., Subin, Z. M., Tang, J., Thomas, R. Q., Val Martin, M., and Zeng, X.: The Community Land Model Version 5: Description of New Features, Benchmarking, and Impact of Forcing Uncertainty, Journal of Advances in Modeling Earth Systems, 11, 4245–4287, https://doi.org/10.1029/2018MS001583, 2019. a
Liang, W.-L., Kosugi, K., and Mizuyama, T.: Soil water dynamics around a tree on a hillslope with or without rainwater supplied by stemflow, Water Resources Research, 47, https://doi.org/10.1029/2010WR009856, 2011. a
Lin, H., Yu, Z., Chen, X., Gu, H., Ju, Q., and Shen, T.: Spatial-temporal dynamics of meteorological and soil moisture drought on the Tibetan Plateau: Trend, response, and propagation process, Journal of Hydrology, 626, 130211, https://doi.org/10.1016/j.jhydrol.2023.130211, 2023. a
Ling, X., Huang, Y., Guo, W., Wang, Y., Chen, C., Qiu, B., Ge, J., Qin, K., Xue, Y., and Peng, J.: Comprehensive evaluation of satellite-based and reanalysis soil moisture products using in situ observations over China, Hydrol. Earth Syst. Sci., 25, 4209–4229, https://doi.org/10.5194/hess-25-4209-2021, 2021. a, b
Liu, E., Zhu, Y., Calvet, J.-C., Lü, H., Bonan, B., Zheng, J., Gou, Q., Wang, X., Ding, Z., Xu, H., Pan, Y., and Chen, T.: Evaluation of root zone soil moisture products over the Huai River basin, Hydrol. Earth Syst. Sci., 28, 2375–2400, https://doi.org/10.5194/hess-28-2375-2024, 2024. a, b, c, d, e, f
Luo, D., Xie, Y., Tang, J., Xu, J., Zhang, M., Cheng, H., Luo, H., and Ouyang, W.: Improving the prediction accuracy of soil organic matter: Addressing the challenge of soil moisture variability, Ecological Indicators, 179, 114249, https://doi.org/10.1016/j.ecolind.2025.114249, 2025. a
Madelon, R., Rodríguez-Fernández, N. J., Bazzi, H., Baghdadi, N., Albergel, C., Dorigo, W., and Zribi, M.: Soil moisture estimates at 1 km resolution making a synergistic use of Sentinel data, Hydrol. Earth Syst. Sci., 27, 1221–1242, https://doi.org/10.5194/hess-27-1221-2023, 2023. a
Meng, C., Meng, C., Houser, P., Mitchell, K., Gayno, G., Rodell, M., Jambor, U., Gottschalck, J., Cosgrove, B., Radakovich, J., Arsenault, K., Bosilovich, M., Entin, J. K., Walker, J. P., and Pan, H.: Implementation of the AFWA AGRMET Solar Radiation Scheme in GLDAS, in: AGU Fall Meeting Abstracts, vol. 2001, H31D–0268, https://ui.adsabs.harvard.edu/abs/2001AGUFM.H31D0268M/abstract (last access: 5 February 2026), 2001. a
METER Group: Soil-specific calibrations for meter soil moisture sensors, https://publications.metergroup.com/Sales%20and%20Support/METER%20Environment/Website%20Articles/how-calibrate-soil-moisture-sensors.pdf?_gl=1*9si4cb*_gcl_au*MTQ3ODI3ODA0My4xNzczMTUyNzMw (last access: 25 March 2026), 2023. a, b, c
Muñoz, A. A., Klock-Barría, K., Alvarez-Garreton, C., Aguilera-Betti, I., González-Reyes, A., Lastra, J. A., Chávez, R. O., Barría, P., Christie, D., Rojas-Badilla, M., and LeQuesne, C.: Water Crisis in Petorca Basin, Chile: The Combined Effects of a Mega-Drought and Water Management, Water, 12, 648, https://doi.org/10.3390/w12030648, 2020. a
Muñoz-Sabater, J.: ERA5-Land hourly data from 1950 to present, Copernicus Climate Change Service (C3S) Climate Data Store (CDS) [data set], https://doi.org/10.24381/cds.e2161bac, 2019. a, b, c
Muñoz-Sabater, J., Dutra, E., Agustí-Panareda, A., Albergel, C., Arduini, G., Balsamo, G., Boussetta, S., Choulga, M., Harrigan, S., Hersbach, H., Martens, B., Miralles, D. G., Piles, M., Rodríguez-Fernández, N. J., Zsoter, E., Buontempo, C., and Thépaut, J.-N.: ERA5-Land: a state-of-the-art global reanalysis dataset for land applications, Earth Syst. Sci. Data, 13, 4349–4383, https://doi.org/10.5194/essd-13-4349-2021, 2021. a, b, c, d, e, f, g
Nadeem, A. A., Zha, Y., Shi, L., Ran, G., Ali, S., Jahangir, Z., Afzal, M. M., and Awais, M.: Multi-scale assessment of SMAP level 3 and level 4 soil moisture products over the soil moisture network within the ShanDian River (SMN-SDR) Basin, China, Remote Sensing, 14, 982, https://doi.org/10.3390/rs14040982, 2022. a, b
NASA/GSFC/HSL: GLDAS Noah Land Surface Model L4 3 hourly 0.25 × 0.25 degree V2.1, GES DISC, https://doi.org/10.5067/E7TYRXPJKWOQ, 2020. a, b, c
Niu, G.-Y., Yang, Z.-L., Mitchell, K. E., Chen, F., Ek, M. B., Barlage, M., Kumar, A., Manning, K., Niyogi, D., Rosero, E., Tewari, M., and Xia, Y.: The community Noah land surface model with multiparameterization options (Noah-MP): 1. Model description and evaluation with local-scale measurements, Journal of Geophysical Research: Atmospheres, 116, D12109, https://doi.org/10.1029/2010JD015139, 2011. a
Nogueira, M., Albergel, C., Boussetta, S., Johannsen, F., Trigo, I. F., Ermida, S. L., Martins, J. P. A., and Dutra, E.: Role of vegetation in representing land surface temperature in the CHTESSEL (CY45R1) and SURFEX-ISBA (v8.1) land surface models: a case study over Iberia, Geosci. Model Dev., 13, 3975–3993, https://doi.org/10.5194/gmd-13-3975-2020, 2020. a
Ortenzi, S., Cencetti, C., Mincu, F.-I., Neculau, G., Chendeş, V., Ciabatta, L., Massari, C., and Di Matteo, L.: Comparing Satellite Soil Moisture Products Using In Situ Observations over an Instrumented Experimental Basin in Romania, Remote Sensing, 16, 3283, https://doi.org/10.3390/rs16173283, 2024. a
Paloscia, S., Pettinato, S., Santi, E., Notarnicola, C., Pasolli, L., and Reppucci, A.: Soil moisture mapping using Sentinel-1 images: Algorithm and preliminary validation, Remote Sensing of Environment, 134, 234–248, https://doi.org/10.1016/j.rse.2013.02.027, 2013. a
Parinussa, R. M., Holmes, T. R., Wanders, N., Dorigo, W. A., and de Jeu, R. A.: A preliminary study toward consistent soil moisture from AMSR2, Journal of Hydrometeorology, 16, 932–947, https://doi.org/10.1175/JHM-D-13-0200.1, 2015. a
Peng, J., Tanguy, M., Robinson, E. L., Pinnington, E., Evans, J., Ellis, R., Cooper, E., Hannaford, J., Blyth, E., and Dadson, S.: Estimation and evaluation of high-resolution soil moisture from merged model and Earth observation data in the Great Britain, Remote Sensing of Environment, 264, 112610, https://doi.org/10.1016/j.rse.2021.112610, 2021. a, b, c, d, e
Popat, E. and Döll, P.: Soil moisture and streamflow deficit anomaly index: an approach to quantify drought hazards by combining deficit and anomaly, Nat. Hazards Earth Syst. Sci., 21, 1337–1354, https://doi.org/10.5194/nhess-21-1337-2021, 2021. a
Probst, E. and Mauser, W.: Evaluation of ERA5 and WFDE5 forcing data for hydrological modelling and the impact of bias correction with regional climatologies: A case study in the Danube River Basin, Journal of Hydrology: Regional Studies, 40, 101023, https://doi.org/10.1016/j.ejrh.2022.101023, 2022. a
Rajib, M. A., Merwade, V., and Yu, Z.: Multi-objective calibration of a hydrologic model using spatially distributed remotely sensed/in-situ soil moisture, Journal of Hydrology, 536, 192–207, https://doi.org/10.1016/j.jhydrol.2016.02.037, 2016. a
Räsänen, M., Merbold, L., Vakkari, V., Aurela, M., Laakso, L., Beukes, J. P., Van Zyl, P. G., Josipovic, M., Feig, G., Pellikka, P., Rinne, J., and Katul, G. G.: Root‐zone soil moisture variability across African savannas: From pulsed rainfall to land‐cover switches, Ecohydrology, 13, e2213, https://doi.org/10.1002/eco.2213, 2020. a, b
Reichle, R. H., De Lannoy, G. J., Liu, Q., Ardizzone, J. V., Colliander, A., Conaty, A., Crow, W., Jackson, T. J., Jones, L. A., Kimball, J. S., Koster, R. D., Mahanama, S. P., Smith, E. B., Berg, A., Bircher, S., Bosch, D., Caldwell, T. G., Cosh, M., González-Zamora, a., Collins, C. D., Jensen, K. H., Livingston, S., Lopez-Baeza, E., Martínez-Fernández, J., McNairn, H., Moghaddam, M., Pacheco, A., Pellarin, T., Prueger, J., Rowlandson, T., Seyfried, M., Starks, P., Su, Z., Thibeault, M., van der Velde, R., Walker, J., Wu, X., and Zeng, Y.: Assessment of the SMAP level-4 surface and root-zone soil moisture product using in situ measurements, Journal of Hydrometeorology, 18, 2621–2645, https://doi.org/10.1175/JHM-D-17-0063.1, 2017a. a, b, c
Reichle, R. H., De Lannoy, G. J. M., Liu, Q., Koster, R. D., Kimball, J. S., Crow, W. T., Ardizzone, J. V., Chakraborty, P., Collins, D. W., Conaty, A. L., Girotto, M., Jones, L. A., Kolassa, J., Lievens, H., Lucchesi, R. A., and Smith, E. B.: Global Assessment of the SMAP Level-4 Surface and Root-Zone Soil Moisture Product Using Assimilation Diagnostics, Journal of Hydrometeorology, 18, 3217–3237, https://doi.org/10.1175/JHM-D-17-0130.1, 2017b. a
Reichle, R. H., De Lannoy, G. J. M., Koster, R. D., Crow, W. T., Kimball, J. S., Liu, Q., and Bechtold, M.: SMAP L4 Global 3-hourly 9 km EASE-Grid Surface and Root Zone Soil Moisture Analysis Update, Version 7, https://doi.org/10.5067/LWJ6TF5SZRG3, 2022a. a, b, c, d
Reichle, R. H., Liu, Q., Koster, R. D., Ardizzone, J. V., Colliander, A., Crow, W. T., De Lannoy, G. J. M., and Kimball, J. S.: Soil Moisture Active Passive (SMAP) Project Assessment Report for Version 7 of the L4_SM Data Product, Tech. rep., Technical Report Series on Global Modeling and Data Assimilation, Vol. 58, https://nsidc.org/sites/default/files/documents/user-guide/multi_spl4smau-v007-userguide.pdf (last access: 11 February 2024), 2022b. a, b, c, d
Rienecker, M. M., Suarez, M. J., Todling, R., Bacmeister, J., Takacs, L., Liu, H.-C., Gu, W., Sienkiewicz, M., Koster, R. D., Gelaro, R., Stajner, I., and Nielsen, J. E.: The GEOS-5 Data Assimilation System – Documentation of Versions 5.0.1, 5.1.0, and 5.2.0, Tech. rep., NASA Tech. Rep. Series on Global Modeling and Data Assimilation, https://ntrs.nasa.gov/api/citations/20120011955/downloads/20120011955.pdf (last access: 11 February 2024), 2008. a
Rodell, M., Houser, P. R., Jambor, U., Gottschalck, J., Mitchell, K., Meng, C.-J., Arsenault, K., Cosgrove, B., Radakovich, J., Bosilovich, M., Entin*, J. K., Walker, J. P., Lohmann, D., and Toll, D.: The Global Land Data Assimilation System, Bulletin of the American Meteorological Society, 85, 381–394, 85, 381–394, https://doi.org/10.1175/BAMS-85-3-381, 2004. a, b, c
Rui, H., Beaudoing, H., and Loeser, C.: README Document for NASA GLDAS Version 2 Data Products, https://hydro1.gesdisc.eosdis.nasa.gov/data/GLDAS/GLDAS_NOAH025_3H.2.1/doc/README_GLDAS2.pdf (last access: 17 May 2024), 2021. a, b
Sanchez-Mejia, Z. M. and Papuga, S. A.: Empirical modeling of planetary boundary layer dynamics under multiple precipitation scenarios using a two-layer soil moisture approach: An example from a semiarid shrubland, Water Resources Research, 53, 8807–8824, https://doi.org/10.1002/2016wr020275, 2017. a
Schmidt, T., Schrön, M., Li, Z., Francke, T., Zacharias, S., Hildebrandt, A., and Peng, J.: Comprehensive quality assessment of satellite-and model-based soil moisture products against the COSMOS network in Germany, Remote Sensing of Environment, 301, 113930, https://doi.org/10.1016/j.rse.2023.113930, 2024. a, b, c, d
Schönauer, M., Ågren, A. M., Katzensteiner, K., Hartsch, F., Arp, P., Drollinger, S., and Jaeger, D.: Soil moisture modeling with ERA5-Land retrievals, topographic indices, and in situ measurements and its use for predicting ruts, Hydrol. Earth Syst. Sci., 28, 2617–2633, https://doi.org/10.5194/hess-28-2617-2024, 2024. a
Seguel, O., Galleguillos, M., Dinamarca, D., Pfeiffer, M., Pérez-Quezada, J., Zambrano-Bigiarini, M., Zamorano, C., Fustos, I., and Casanova, G.: ChSPD Chilean soil profile database V2 (Version 2), Zenodo [data set], https://doi.org/10.5281/zenodo.13870760, 2024. a
Sehgal, V., Sridhar, V., and Tyagi, A.: Stratified drought analysis using a stochastic ensemble of simulated and in-situ soil moisture observations, Journal of Hydrology, 545, 226–250, https://doi.org/10.1016/j.jhydrol.2016.12.033, 2017. a
Senanayake, I. P., Yeo, I.-Y., Hancock, G. R., and Willgoose, G. R.: A decadal record of soil moisture space–time variability over a south-east Australian catchment, Hydrological Processes, 36, e14770, https://doi.org/10.1002/hyp.14770, 2022. a
Silwimba, K., Flores, A. N., Cionni, I., Billings, S. A., Sullivan, P. L., Ajami, H., Hirmas, D. R., and Li, L.: Soil parameterization in land surface models drives large discrepancies in soil moisture predictions across hydrologically complex regions of the contiguous United States, Geosci. Model Dev., 18, 7707–7734, https://doi.org/10.5194/gmd-18-7707-2025, 2025. a
Smith, A. B., Walker, J. P., Western, A. W., Young, R., Ellett, K., Pipunic, R., Grayson, R., Siriwardena, L., Chiew, F. H., and Richter, H.: The Murrumbidgee soil moisture monitoring network data set, Water Resources Research, 48, https://doi.org/10.1029/2012WR011976, 2012. a
Spennemann, P. C., Rivera, J. A., Saulo, A. C., and Penalba, O. C.: A comparison of GLDAS soil moisture anomalies against standardized precipitation index and multisatellite estimations over South America, Journal of Hydrometeorology, 16, 158–171, https://doi.org/10.1175/JHM-D-13-0190.1, 2015. a
Sun, F., Lü, Y., Wang, J., Hu, J., and Fu, B.: Soil moisture dynamics of typical ecosystems in response to precipitation: A monitoring-based analysis of hydrological service in the Qilian Mountains, Catena, 129, 63–75, https://doi.org/10.1016/j.catena.2015.03.001, 2015. a
Tian, J. and Zhang, Y.: Comprehensive validation of seven root zone soil moisture products at 1153 ground sites across China, International Journal of Digital Earth, 16, 4008–4022, https://doi.org/10.1080/17538947.2023.2261902, 2023. a
Tian, J., Zhang, B., He, C., Han, Z., Bogena, H. R., and Huisman, J. A.: Dynamic response patterns of profile soil moisture wetting events under different land covers in the Mountainous area of the Heihe River Watershed, Northwest China, Agricultural and Forest Meteorology, 271, 225–239, https://doi.org/10.1016/j.agrformet.2019.03.006, 2019. a, b
Van Den Broeke, M. S., Kalin, A., Alavez, J. A. T., Oglesby, R., and Hu, Q.: A warm-season comparison of WRF coupled to the CLM4.0, Noah-MP, and Bucket hydrology land surface schemes over the central USA, Theoretical and Applied Climatology, 134, 801–816, https://doi.org/10.1007/s00704-017-2301-8, 2018. a
Vereecken, H., Amelung, W., Bauke, S. L., Bogena, H., Brüggemann, N., Montzka, C., Vanderborght, J., Bechtold, M., Blöschl, G., Carminati, A., Javaux, M., Konings, A. G., Kusche, J., Neuweiler, I., Or, D., Steele-Dunne, S., Verhoef, A., Young, M., and Zhang, Y.: Soil hydrology in the Earth system, Nature Reviews Earth & Environment, 3, 573–587, https://doi.org/10.1038/s43017-022-00324-6, 2022. a
Wagner, W., Hahn, S., Kidd, R., Melzer, T., Bartalis, Z., Hasenauer, S., Figa-Saldaña, J., de Rosnay, P., Jann, A., Schneider, S., Komma, J., Kubu, G., Brugger, K., Aubrecht, C., Züger, J., Gangkofner, U., Kienberger, S., Brocca, L., Wang, Y., Blöschl, G., Eitzinger, J., Steinnocher, K., Zeil, P., and Rubel, F.: The ASCAT Soil Moisture Product: A Review of its Specifications, Validation Results, and Emerging Applications, Meteorologische Zeitschrift, 22, 5–33, https://doi.org/10.1127/0941-2948/2013/0399, 2013. a
Wang, A. and Zeng, X.: Evaluation of multireanalysis products with in situ observations over the Tibetan Plateau, Journal of Geophysical Research: Atmospheres, 117, https://doi.org/10.1029/2011JD016553, 2012. a
Wang, Y., Mao, J., Jin, M., Hoffman, F. M., Shi, X., Wullschleger, S. D., and Dai, Y.: Development of observation-based global multilayer soil moisture products for 1970 to 2016, Earth Syst. Sci. Data, 13, 4385–4405, https://doi.org/10.5194/essd-13-4385-2021, 2021. a
Wieder, W., Boehnert, J., Bonan, G., and Langseth, M.: Regridded harmonized world soil database v1.2, Ornl Daac, https://doi.org/10.3334/ORNLDAAC/1247, 2014. a
Wu, Z., Feng, H., He, H., Zhou, J., and Zhang, Y.: Evaluation of soil moisture climatology and anomaly components derived from ERA5-land and GLDAS-2.1 in China, Water Resources Management, 35, 629–643, https://doi.org/10.1007/s11269-020-02743-w, 2021. a, b
Xi, X., Zhuang, Q., Kim, S., and Gentine, P.: Evaluating the effects of precipitation and evapotranspiration on soil moisture variability within CMIP5 using SMAP and ERA5 data, Water Resources Research, 59, e2022WR034225, https://doi.org/10.1029/2022WR034225, 2023. a
Xia, Y., Sheffield, J., Ek, M. B., Dong, J., Chaney, N., Wei, H., Meng, J., and Wood, E. F.: Evaluation of multi-model simulated soil moisture in NLDAS-2, Journal of Hydrology, 512, 107–125, https://doi.org/10.1016/j.jhydrol.2014.02.027, 2014. a, b
Xing, Z., Fan, L., Zhao, L., De Lannoy, G., Frappart, F., Peng, J., Li, X., Zeng, J., Al-Yaari, A., Yang, K., Zhao, T., Shi, J., Wang, M., Liu, X., Hu, G., Xiao, Y., Du, E., Li, R., Qiao, Y., Shi, J., Wen, J., Ma, M., and Wigneron, J.-P.: A first assessment of satellite and reanalysis estimates of surface and root-zone soil moisture over the permafrost region of Qinghai-Tibet Plateau, Remote Sensing of Environment, 265, 112666, https://doi.org/10.1016/j.rse.2021.112666, 2021. a
Xu, X.: Evaluation of SMAP level 2, 3, and 4 soil moisture datasets over the Great Lakes region, Remote Sensing, 12, 3785, https://doi.org/10.3390/rs12223785, 2020. a, b
Yapo, P. O., Gupta, H. V., and Sorooshian, S.: Automatic calibration of conceptual rainfall-runoff models: sensitivity to calibration data, Journal of Hydrology, 181, 23–48, https://doi.org/10.1016/0022-1694(95)02918-4, 1996. a, b, c
Yu, T., Jiapaer, G., Bao, A., Zhang, J., Tu, H., Chen, B., De Maeyer, P., and Van de Voorde, T.: Evaluating surface soil moisture characteristics and the performance of remote sensing and analytical products in Central Asia, Journal of Hydrology, 617, 128921, https://doi.org/10.1016/j.jhydrol.2022.128921, 2023. a
Yu, Y., Malone, B. P., and Renzullo, L. J.: Empirical Upscaling of Point-scale Soil Moisture Measurements for Spatial Evaluation of Model Simulations and Satellite Retrievals, arXiv [preprint], https://doi.org/10.1109/IGARSS53475.2024.10642763, 2024. a
Zacharias, S., Bogena, H., Samaniego, L., Mauder, M., Fuß, R., Pütz, T., Frenzel, M., Schwank, M., Baessler, C., Butterbach-Bahl, K., Bens, O., Borg, E., Brauer, A., Dietrich, P., Hajnsek, I., Helle, G., Kiese, R., Kunstmann, H., Klotz, S., Munch, J. C., Papen, H., Priesack, E., Schmid, H. P., Steinbrecher, R., Rosenbaum, U., Teutsch, G., and Vereecken, H.: A Network of Terrestrial Environmental Observatories in Germany, Vadose Zone Journal, 10, 955–973, https://doi.org/10.2136/vzj2010.0139, 2011. a
Zambrano-Bigiarini, M.: hydroGOF: Goodness-of-fit functions for comparison of simulated and observed hydrological time series, r package version 0.6-0.1, Zenodo, https://doi.org/10.5281/zenodo.839854, 2024. a
Zeng, J., Shi, P., Chen, K.-S., Ma, H., Bi, H., and Cui, C.: Assessment and error analysis of satellite soil moisture products over the Third Pole, IEEE Transactions on Geoscience and Remote Sensing, 60, 1–17, https://doi.org/10.1109/TGRS.2021.3116078, 2021a. a
Zeng, J., Yuan, X., Ji, P., and Shi, C.: Effects of meteorological forcings and land surface model on soil moisture simulation over China, Journal of Hydrology, 603, 126978, https://doi.org/10.1016/j.jhydrol.2021.126978, 2021b. a
Zhang, R., Li, L., Zhang, Y., Huang, F., Li, J., Liu, W., Mao, T., Xiong, Z., and Shangguan, W.: Assessment of agricultural drought using soil water deficit index based on ERA5-land soil moisture data in four southern provinces of China, Agriculture, 11, 411, https://doi.org/10.3390/agriculture11050411, 2021. a
Zheng, C., Jia, L., and Zhao, T.: A 21-year dataset (2000–2020) of gap-free global daily surface soil moisture at 1-km grid resolution, Scientific Data, 10, 139, https://doi.org/10.1038/s41597-023-01991-w, 2023. a
Zheng, J., Zhao, T., Lü, H., Shi, J., Cosh, M. H., Ji, D., Jiang, L., Cui, Q., Lu, H., Yang, K., Wigneron, J.-P., Li, X., Zhu, Y., Hu, L., Peng, Z., Zeng, Y., Wang, X., and Kang, C. S.: Assessment of 24 soil moisture datasets using a new in situ network in the Shandian River Basin of China, Remote Sensing of Environment, 271, 112891, https://doi.org/10.1016/j.rse.2022.112891, 2022a. a, b
Zheng, Y., Bourassa, M. A., and Ali, M.: The impact of rainfall on soil moisture variability in four homogeneous rainfall zones of India during strong, weak, and normal Indian summer monsoons, Water, 14, 2788, https://doi.org/10.3390/w14182788, 2022b. a
Zheng, Y., Coxon, G., Woods, R., Power, D., Rico-Ramirez, M. A., McJannet, D., Rosolem, R., Li, J., and Feng, P.: Evaluation of reanalysis soil moisture products using cosmic ray neutron sensor observations across the globe, Hydrol. Earth Syst. Sci., 28, 1999–2022, https://doi.org/10.5194/hess-28-1999-2024, 2024. a, b, c, d, e, f, g
Zhuo, L., Dai, Q., Han, D., Chen, N., and Zhao, B.: Assessment of simulated soil moisture from WRF Noah, Noah-MP, and CLM land surface schemes for landslide hazard application, Hydrol. Earth Syst. Sci., 23, 4199–4218, https://doi.org/10.5194/hess-23-4199-2019, 2019. a
Zomer, R. J., Xu, J., and Trabucco, A.: Version 3 of the Global Aridity Index and Potential Evapotranspiration Database, Scientific Data, 9, 409, https://doi.org/10.1038/s41597-022-01493-1, 2022. a, b
- Abstract
- Introduction
- Datasets
- Methodology
- Results and discussion
- Conclusions
- Concluding remarks
- Appendix A: Performance metrics at each in situ monitoring site
- Code availability
- Data availability
- Author contributions
- Competing interests
- Disclaimer
- Financial support
- Review statement
- References
- Supplement