the Creative Commons Attribution 4.0 License.
the Creative Commons Attribution 4.0 License.
 | 30 Mar 2026
Influence of groundwater recharge projections on climate-driven subsurface warming: insights from numerical modeling
Mikhail Tsypin
Viet Dung Nguyen
Mauro Cacace
Guido Blöcher
Magdalena Scheck-Wenderoth
Elco Luijendijk
Charlotte Krawczyk
Groundwater warming due to rising surface temperatures has been documented in both urban and natural settings. However, the potential for long-term changes in the magnitude and seasonality of groundwater recharge to modulate this warming trend has not yet been systematically investigated. In this study, we integrate a stochastic weather generator, distributed hydrologic modeling, and regional thermo-hydraulic groundwater modeling into a unified workflow and apply it to the area of Brandenburg (northeastern Germany). We conduct numerical simulations to assess changes in the subsurface thermal field between present day and 2100, evaluating two climate change scenarios, and incorporate a spectrum of ensemble-based and discrete recharge projections. Our results demonstrate that, while surface temperature rise is the primary driver of the projected groundwater warming of up to 2.5 °C, groundwater flow is responsible for its regional variability in magnitude and affected depths. Higher hydraulic gradients on topographic highs and increased thickness of the permeable Quaternary unit may allow the warming signal to propagate below 200 m depth, whereas groundwater discharge in the river valleys tends to limit it to <200 m. By the late century, the difference in groundwater temperatures between recharge-reduction and recharge-increase scenarios can reach 0.4 °C. Under the high-emissions pathway, a 20 % recharge reduction, from a mean of 75 to 60 mm a−1, causes a 2–5 m water level decline, reducing the area of unconfined aquifer subjected to seasonal temperature fluctuations. Model experiments show that even a hypothetical increase in winter recharge does not suffice to counteract the groundwater warming induced by rising surface temperatures. Changes in advection rates are not expected to affect net climate-driven heat accumulation in the subsurface due to counterbalancing of heat gains and losses between recharge and discharge areas. Nevertheless, long-term reconfiguration of the potentiometric surface may further impact both the annual and long-term thermal state of key aquifers targeted for water supply and shallow geothermal energy utilization.
- Article
(27182 KB) - Full-text XML
- BibTeX
- EndNote


The ongoing climate change modifies components of the Earth's water and energy balance, thereby affecting the hydraulic, thermal, chemical, and biological states of groundwater systems (Taylor et al., 2013; Riedel, 2019). In line with other climate change impact assessment studies (Seneviratne et al., 2010; Gosling et al., 2011), predictive modeling of these groundwater states requires a consistent set of climate scenarios, ideally based on ensembles of general circulation models (GCMs) and CO2 emission pathways. Among GCM outputs, temperature and precipitation are considered key variables controlling surface-groundwater fluxes, such as infiltration, evapotranspiration, and recharge (Moeck et al., 2016; Rossman et al., 2014).
On global and regional scales, groundwater availability for human consumption and irrigation strongly depends on recharge rates (Cuthbert et al., 2019; Reinecke et al., 2021). A prediction of future groundwater levels (GWLs) using analytical, numerical, and machine learning tools has been widely explored across various timescales, being increasingly adopted by water management authorities for planning purposes (Scibek and Allen, 2006; Dams et al., 2012; Goderniaux et al., 2011; Seidenfaden et al., 2022; Wunsch et al., 2022). A major uncertainty though still exists in future recharge estimates, as there is a lack of consistency across models concerning both the magnitude and the sign of recharge trends (Smerdon, 2017). This stems largely from uncertainty in the intensity and distribution of precipitation rather than potential evapotranspiration (PET) due to the dependence of the former on circulation patterns and its higher spatiotemporal variability (Reinecke et al., 2021; Berghuijs et al., 2024). Recharge estimates are therefore sensitive to the choice of GCM, Shared Socioeconomic Pathway (SSP), the downscaling approach, and hydrologic model parameters (Kurylyk et al., 2015).
More recently, the thermal response of aquifers to climate change came into the spotlight, following reports of groundwater warming in urban centers (Menberg et al., 2013; Tissen et al., 2019) and due to the growing utilization of shallow geothermal energy (Hemmerle et al., 2022). Implications of a sustained increase in groundwater temperatures, induced by climate change and urbanization, include the potential for shallow subsurface heat recycling and impacts on temperature-sensitive aquifer and stream ecosystems and groundwater quality (Kurylyk et al., 2015; Riedel, 2019; Hemmerle and Bayer, 2020; Benz et al., 2024).
Subsurface temperatures are projected to rise due to the concomitant rise in surface temperatures, which are expected to reach 1.5 to 5 °C above the pre-industrial levels by the end of the century, depending on the emission scenario (IPCC, 2023). However, the additional effect of changes in groundwater recharge in modifying subsurface heat transport rates has received less attention to date (Klepikova, 2024), being mostly described by analytical 1-D models (Taniguchi et al., 1999; Kurylyk et al., 2017) or conceptual 2-D numerical models of conduction-advection (Kurylyk et al., 2014; Irvine et al., 2016; Benz et al., 2024; Zhang et al., 2024).
To our knowledge, there is so far no consensus on whether projected recharge trends can offset, if not counterbalance the conductive rise of groundwater temperatures. A study by Benz et al. (2024) stated that downward propagation of the surface warming signal caused by climate change is primarily driven by thermal diffusion, with changes in advection rates due to groundwater recharge playing a minor role globally. Other authors argued that changes in precipitation amount and seasonality, and thus recharge temperature and/or groundwater fluxes, could alter the groundwater warming trend from rising surface temperatures (Kurylyk et al., 2013; Burns et al., 2017; Epting et al., 2021).
The modification of the conductive geothermal gradient by advection has been used to quantify vertical groundwater fluxes from temperature profiles (Stallman, 1965; Bredehoeft and Papadopulos, 1965; Anderson, 2005; Bense and Kurylyk, 2017; Bense et al., 2017; Kurylyk et al., 2019). Likewise, an inversion of borehole temperature logs may provide information about past land surface temperatures for paleoclimatic studies, though this normally assumes only conductive heat transport (Shen and Beck, 1993). It remains uncertain whether changes in groundwater recharge of up to ±100 mm a−1, projected globally by the end of the century (Reinecke et al., 2021), are sufficient to alter aquifer thermal responses to surface temperature forcing. Stronger but localized evidence of the thermal response to changes in groundwater flux has been found through repeated temperature logging of aquifers subjected to multi-year groundwater abstraction (Bense et al., 2020; Klepikova et al., 2025). A major challenge in assessing recharge effects lies in the influence of preferential flow in the unsaturated zone and the predominance of the lateral flow in the saturated zone due to topographic gradients.
Topography-driven groundwater flow exerts a footprint on the subsurface thermal field, leading to decreased heat flow in recharge areas and increased heat flow in discharge areas, an aspect that has been demonstrated in basin- and lithosphere-scale thermo-hydraulic models (Kooi, 2016; Noack et al., 2013; Tsypin et al., 2024; Smith and Chapman, 1983). However, field evidence of regional temperature variability from advective groundwater flow has been limited to favorable settings for deep meteoric water circulation, such as mountainous terrains and rift basins (Deming et al., 1992; Luijendijk, 2012). The extent of groundwater cooling depends on both hydraulic gradients and rock permeability, though some authors argued that rates of groundwater flow are often too small to perturb the regional thermal field (Bachu, 1988).
The objective of the present study is to investigate the coupled effects of rising surface temperatures and temporal trends of groundwater recharge on the subsurface thermal field from the present day to the end of the century, while considering regional controls on heat advection, such as multidimensional groundwater flow and geological heterogeneities.
To achieve this, we employ a non-stationary weather generator to produce an ensemble of downscaled climate projections, corresponding to different GCM-SSP combinations. The weather forcing is used to calculate groundwater recharge fluxes via a hydrologic model, which, along with projected surface temperatures, are subsequently assigned as time-variable boundary conditions to a regional 3-D groundwater model. We then conduct a series of transient thermo-hydraulic simulations to assess long-term changes in hydraulic heads, groundwater flux, and heat in place, and discuss potential implications for groundwater storage and geothermal energy availability.
We apply our modeling approach to the study area of Brandenburg, NE Germany, where a periglacial geology and geomorphology result in complex deep-to-shallow groundwater dynamics, and where ongoing climate change has already increased stress on water and energy resources (Alencar et al., 2025; Brill et al., 2024). The presented model, while being limited in covered area and timespan, provides an opportunity to assess the role of the individual co-players (temperate climate, recharge uncertainty, permeable shallow section, undulating water table) affecting the groundwater system response under long-term climatic changes.
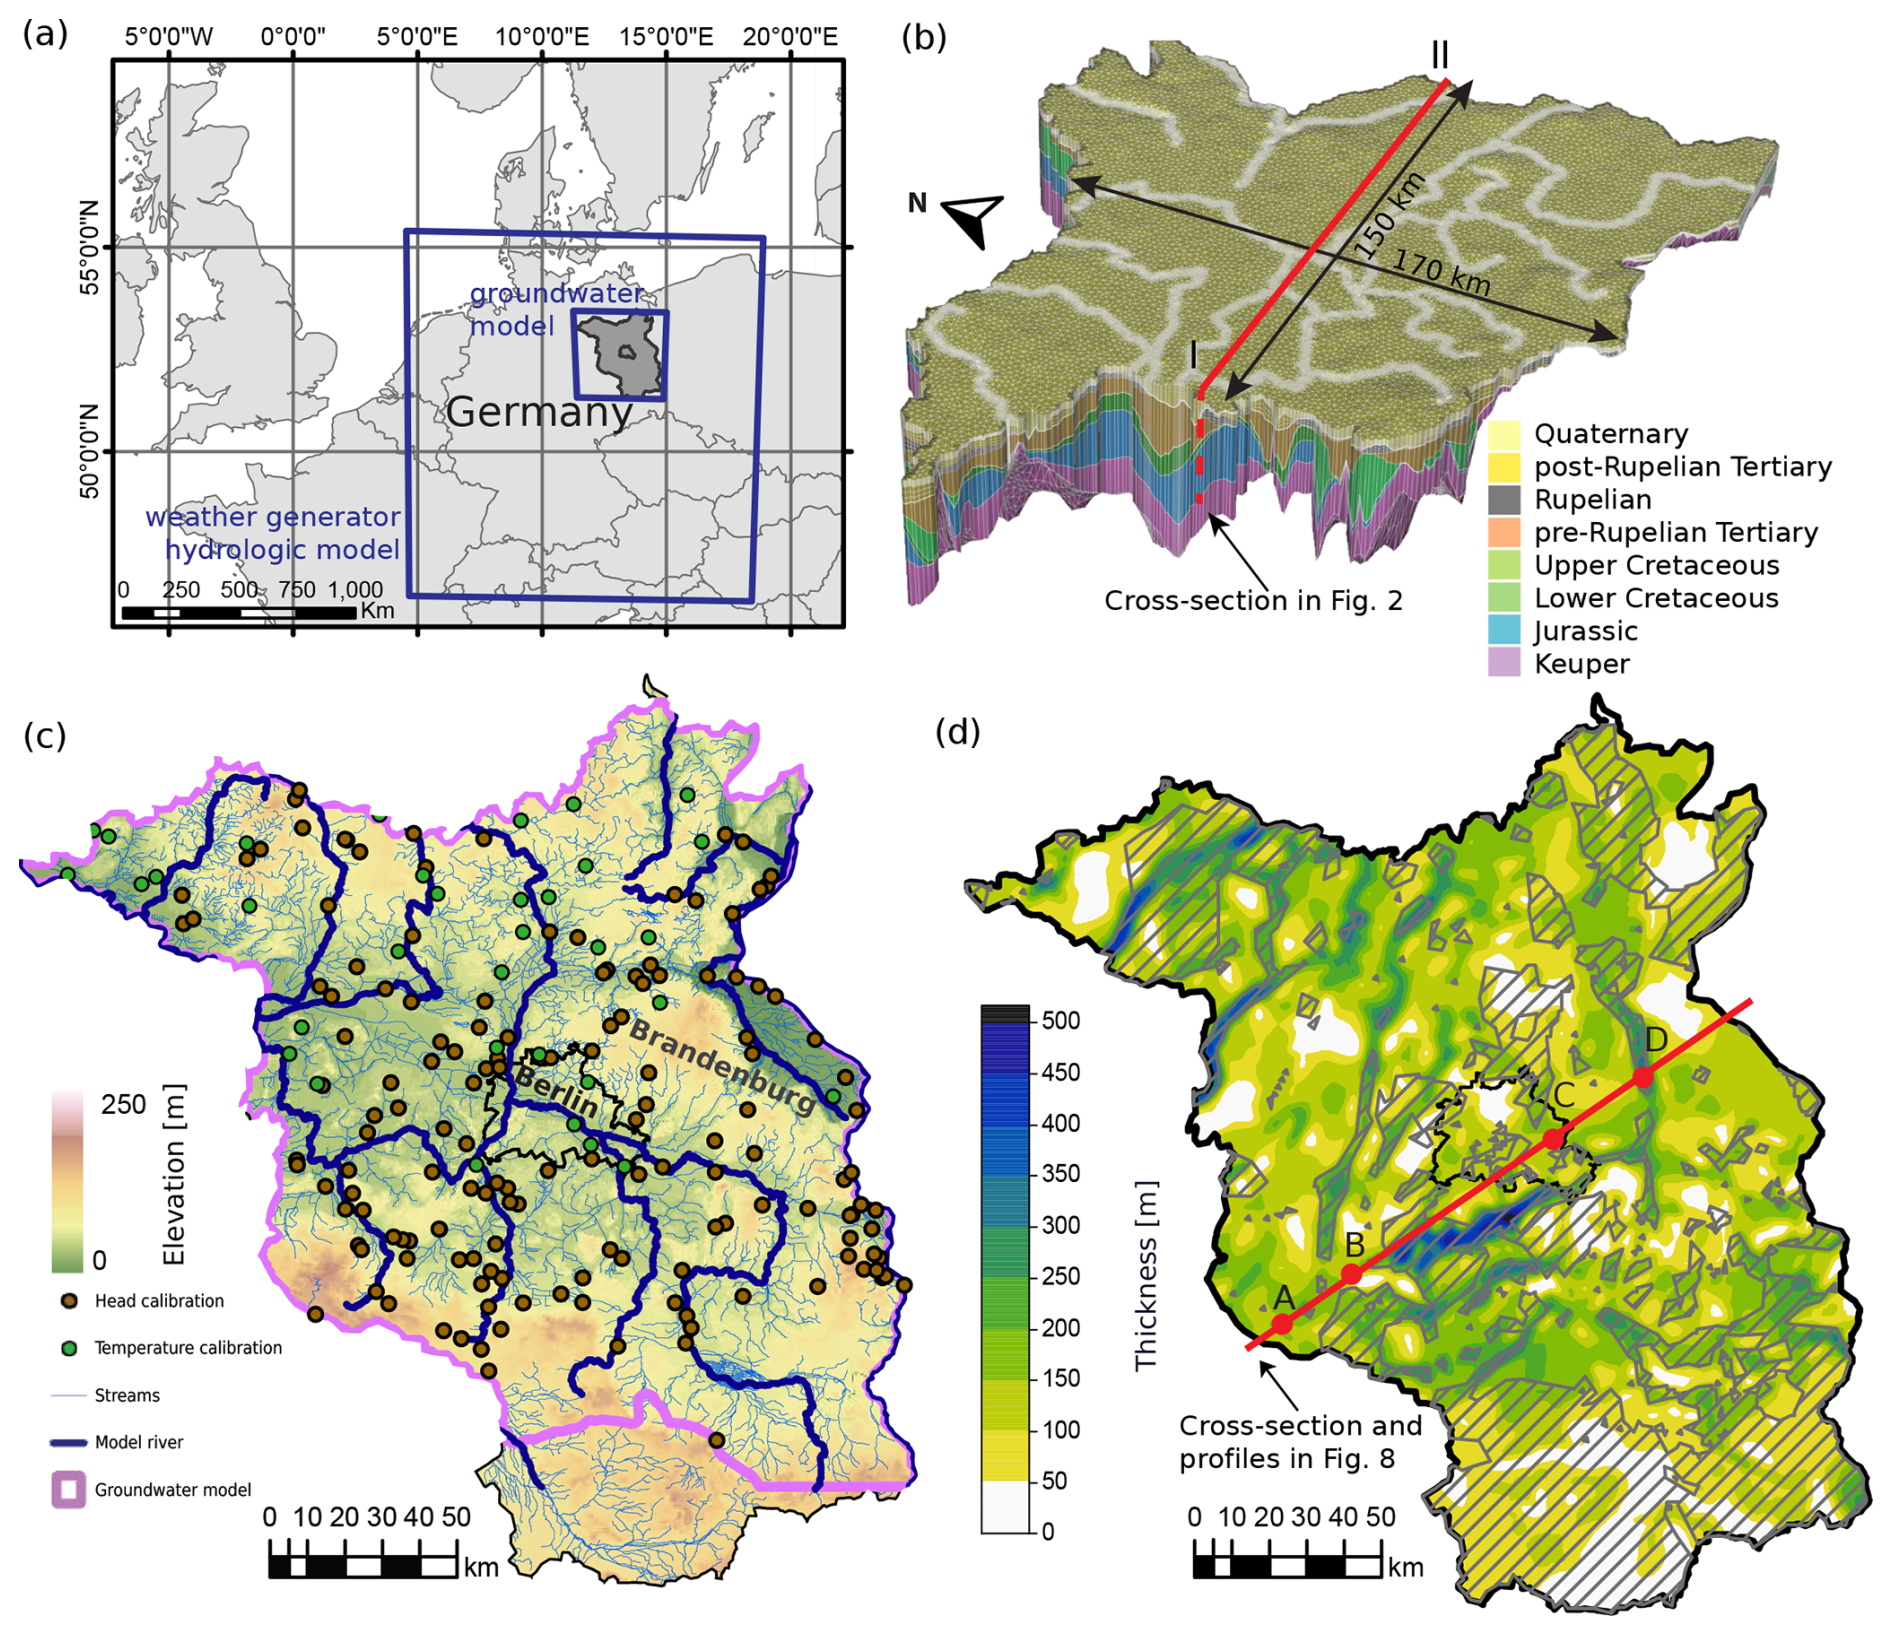
Figure 1Overview of the study area: (a) geographical location and models' extent; (b) 3-D view of the groundwater model mesh; (c) topography of Berlin-Brandenburg and locations of the groundwater model calibration points; (d) thickness of the Quaternary unit. Dashed polygons indicate absence of the Rupelian aquitard.
The study area, spanning Germany's federal states of Brandenburg and Berlin, exhibits climatic and geological conditions typical of north-central Europe (Fig. 1a). The region has a temperate continental climate, with a mean annual air temperature of +9.0 °C, January being the coldest month and July the warmest. Mean precipitation is 550 mm a−1, February being the driest and June the wettest month (GERICS – Climate-Service Center Germany, 2019).
Geologically, the study area delimits the southeastern margin of the intracontinental North German Basin. The basin fill is composed of Permo-Cenozoic sedimentary and volcanic rocks, with total thickness increasing from <100 m on uplifted basement highs in the south to >8 km in the basin center, northwest of the study area (Littke et al., 2008; Krawczyk and Schulze, 2015). The deep lithospheric structure, basement composition, and sedimentary cover blanketing contribute to an average surface heat flow of 65–75 mW m−2 (Fuchs et al., 2022). Local heat flow variations are influenced by Upper Permian Zechstein salt diapirs and walls, acting as vertical conduits for heat. The Middle Triassic Muschelkalk formation, composed of marine carbonates and mudstones, is often viewed as an aquitard in basin-scale modeling (Frick et al., 2022a). Consequently, our modeling effort focuses on the overlying Upper Triassic to Quaternary portion of the basin, characterized by the presence of permeable and locally interconnected reservoirs, and hence a more active groundwater circulation.
Keuper (uppermost Triassic), Jurassic, and Lower to Upper Cretaceous deposits consist of interbedded mudstones, sandstones, and limestones, with a total thickness of up to 3 km (Stackebrandt and Manhenke, 2010). These saline aquifers are utilized for low-enthalpy geothermal resource extraction and for heat and gas storage (Bruhn et al., 2023).
Tertiary deposits include a mix of shallow marine, nearshore, and continental clastic sediments, including coal deposits. Within the Tertiary section, the Rupelian Clay is a key marine transgressive layer, acting as a basin-wide aquitard between predominantly freshwater aquifers above and brackish to saline aquifers below (Stackebrandt and Franke, 2015).
Quaternary sediments consist of poorly consolidated fluvioglacial and alluvial deposits: sand, silt, clay, and gravel. The retreat of pressurized subglacial meltwater during the Pleistocene led to the formation of SW-NE-oriented tunnel valleys, incised up to 550 m deep, locally eroding the Rupelian Clay (Lang et al., 2025) (Fig. 1d). These valleys are filled with coarse-grained clastic deposits that allow for focused cross-flows between deep and shallow aquifers, locally leading to freshwater salinization. The heterogeneous architecture of Quaternary glacial deposits has produced a complex hydrogeological system, with several hydrodynamically interconnected aquifer complexes. These aquifer complexes are used for drinking water supply and are increasingly targeted by ground-source heat pumps (GSHP) and low-temperature aquifer thermal energy storage (LT-ATES) systems (Ministerium für Wirtschaft, 2023; Stemmle et al., 2025).
The present-day relief, shaped during Pleistocene glaciations, consists of alternating glacial plateaus and ice-marginal valleys, hosting major rivers (Sirocko et al., 2008). Absolute elevations range between 50–200 m a.s.l. on glacial plateaus to 0–30 m a.s.l. in river valleys (Fig. 1c). The depth to the water table varies from 0–10 m in floodplains and river valleys to up to 50 m on glacial plateaus. Soils are dominated by sands and loamy sands with low water-holding capacity (Stackebrandt and Franke, 2015).
3.1 Simulation of downscaled weather time-series
We employed a stochastic weather generator to derive ensemble-based, spatially and temporally consistent downscaled precipitation and temperature inputs for the hydrologic and groundwater modeling. Weather generators have been widely used to simulate probabilities of extreme hydrologic events such as droughts and heavy precipitation and are also valuable for modeling the stochastic component of climatic variability in groundwater (Goderniaux et al., 2011). In our study, we rely on the non-stationary Regional Weather Generator (nsRWG; Nguyen et al., 2024). This tool simulates daily weather sequences that capture both natural variability and evolving climate conditions, making it well-suited for long-term hydrological assessments. nsRWG combines a multivariate auto-regressive spatio-temporal structure for the weather variables of interest with marginal distributions conditioned on large-scale climate drivers. These drivers include circulation patterns (CPs) derived from mean sea level pressure and regional daily mean temperatures, capturing both synoptic-scale variability and thermodynamic trends.
The model was configured for a Germany-wide domain realization, covering 540 grid cells, using the gridded observational dataset E-OBS version 25.0e (Cornes et al., 2018). This dataset provides daily precipitation and minimum, maximum, and mean near-surface air temperatures for the period 1950–2021. nsRWG has been rigorously evaluated and has demonstrated good performance in reproducing site-specific and spatial characteristics of precipitation and temperature (Nguyen et al., 2024).
In this study, we use nsRWG to simulate long-term daily weather series for both the historical (1950–2021) and future (2022–2100) periods. Historical simulations are driven by CPs and regional temperatures derived from the ERA5 reanalysis dataset (Hersbach et al., 2020). Future simulations are based on projections of CPs and regional temperatures from seven representative GCMs of the IPCC Coupled Model Intercomparison Project Phase 6 (CMIP6): CNRM-CM6-1, INM-CM5-0, GFDL-ESM4, MPI-ESM1-2-HR, MRI-ESM2-0, CESM2, and IPSL-CM6A-LR. The selection of this set of GCMs was justified in Nguyen et al. (2024) using a combination of performance- and independence-based criteria. Quantitative performance metrics, originally introduced in the ClimWIP method (Brunner et al., 2020) and implemented in ESMValTool v2.6.0 (Eyring et al., 2016), included each model's distance to ERA5 over Europe during 1985–2014 for temperature and sea-level pressure climatology, annual variability, and trends. Qualitative considerations of model independence and ensemble spread followed the recommendations of Merrifield et al. (2023).
We consider two climate scenarios: SSP245, a moderate-emission pathway where mitigation efforts balance sustainability measures with economic growth, and SSP585, a high-end emission scenario driven by fossil fuel development with minimal mitigation and thus with substantially higher global warming levels (IPCC, 2023). We generate 50 stochastic realizations both for the historical case and for each GCM–SSP combination, resulting in a total of 750 realizations.
3.2 Recharge estimation
Meteorological forcing generated by nsRWG served as input to the mesoscale Hydrologic Model (mHM) (Samaniego et al., 2010, 2019), which is used to simulate groundwater recharge. mHM is a spatially distributed, process-based model that approximates hydrologic fluxes such as soil moisture dynamics, infiltration, surface runoff, evapotranspiration, groundwater recharge, and discharge generation.
Conceptually, mHM includes three subsurface storage compartments: a multi-layer soil reservoir, an unsaturated subsurface reservoir, and a groundwater reservoir. Fluxes between these compartments are computed locally at each grid cell, while runoff routing follows the steepest topographic gradient.
mHM applies a Multiscale Parameter Regionalization (MPR) technique (Kumar et al., 2013), which considers morphological variables as predictors to derive spatially coherent parameter fields. This approach enables the model to produce seamless and physically consistent outputs across regions with diverse hydrological behavior.
The model was set up over a domain encompassing Germany and upstream contributing areas in neighboring countries (Fig. 1a). The model was forced with daily precipitation, near-surface air temperature, and PET. The latter was estimated using the Samani–Hargreaves method based on daily minimum, mean, and maximum temperatures (Hargreaves and Samani, 1985). Physiographic inputs comprised a digital elevation model, along with maps detailing soil properties, land use, land cover, and reservoir lithology. Meteorological forcings were organized at a spatial resolution of 25 km, whereas the physiographic inputs were prepared at a finer resolution of 5 km.
The model was calibrated with a primary focus on high-flow conditions and therefore shows robust performance for total discharge (Guse et al., 2024; Han et al., 2025). As expected, baseflow performance is lower than that of total discharge; however, Nash–Sutcliffe Efficiency (NSE) values fall within a range of 0.3–0.6, which is considered acceptable for large-scale hydrological applications, suggesting a reasonable representation of recharge–discharge partitioning. Groundwater recharge have been additionally validated against GWL in a transient groundwater model of Brandenburg (Tsypin et al., 2025a).
A high-performance computing system enabled efficient parallel execution of model realizations across 50 compute nodes. Each node provided 40 GB of RAM, and each task used four CPU cores. With this configuration, a combined chain from nsRWG simulations to mHM modeling required approximately 10 d of wall-clock time.
3.3 Groundwater flow and heat transport modeling
We conducted coupled groundwater flow and heat transport simulations using FEFLOW 8.0 (Diersch, 2013) and PEST calibration package (Doherty, 2015). Groundwater flow was solved according to the equation:
where Ss is specific storage [m−1], h: hydraulic head [m], t: time [s], R: volumetric source/sink term [s−1] (e.g., groundwater recharge), and q: groundwater flux [m s−1], which, according to Darcy's law, is defined as:
where K is the hydraulic conductivity [m s−1].
3-D heat transport equation accounted for changes in thermal storage, advective and conductive heat exchange, and radiogenic heat production:
where ρ: density [kg m−3], c: specific heat capacity [J kg−1 K−1], “b” and “f” subscripts refer to bulk and fluid properties, respectively, T: temperature [K], λ: thermal conductivity [W m−1 K−1], and Qr: radiogenic heat production [W m−3].
Dispersion effects and free convection were neglected for the heat transport, given the regional scale of the model with a focus on shallow groundwater circulation, and fluid density and viscosity were assumed constant.
The finite-element mesh incorporated structural surfaces from the regional geological model of Brandenburg (Noack et al., 2024). The generated mesh covers an area of 27 600 km2 and is up to 2.5 km deep, consisting of 8 stratigraphic units, described in Sect. 2 (Fig. 1b). Edges of the mesh followed topographic elements (major rivers and divides). The Quaternary unit was subdivided into 10 simulation layers, and post-Rupelian Tertiary and Rupelian units were split into 3 layers each, proportional to the unit vertical thickness. The mesh was further refined along 19 major streams to improve computational stability and accuracy in simulating the shallow subsurface thermal and hydraulic behavior. The final mesh consists of 1.15 million triangular prismatic elements and 615 000 nodes.
Thermal and hydraulic properties for stratigraphic units were kept identical across scenarios to isolate climatic controls (Table A1) and were taken from previous studies (Scheck and Bayer, 1999; Noack et al., 2013) except for the Quaternary and post-Rupelian Tertiary, whose properties were calibrated, as they are the upper two units directly experiencing the impact of varying boundary conditions.
The base of the model was taken as a no-flow boundary, corresponding to the Middle Triassic Muschelkalk formation. Along the lateral model edges, a time- and depth-constant head Type I (Dirichlet) boundary condition (BC) was assigned. The assumption of open model edges reflects the fact that most aquifers extend beyond the area of Brandenburg, although alternative approaches to BC conceptualization for this domain are possible (Tsypin et al., 2024). At the top, a Type II (Neumann) BC was specified, using recharge rates derived from mHM, except for cells corresponding to river elements, where we applied a Type III (Cauchy) BC, with a time-invariant reference elevation across all scenarios (Fig. 2). The choice of this BC stems from the fact that most streams in the study area have regulated levels with limited sensitivity to recharge fluctuations.
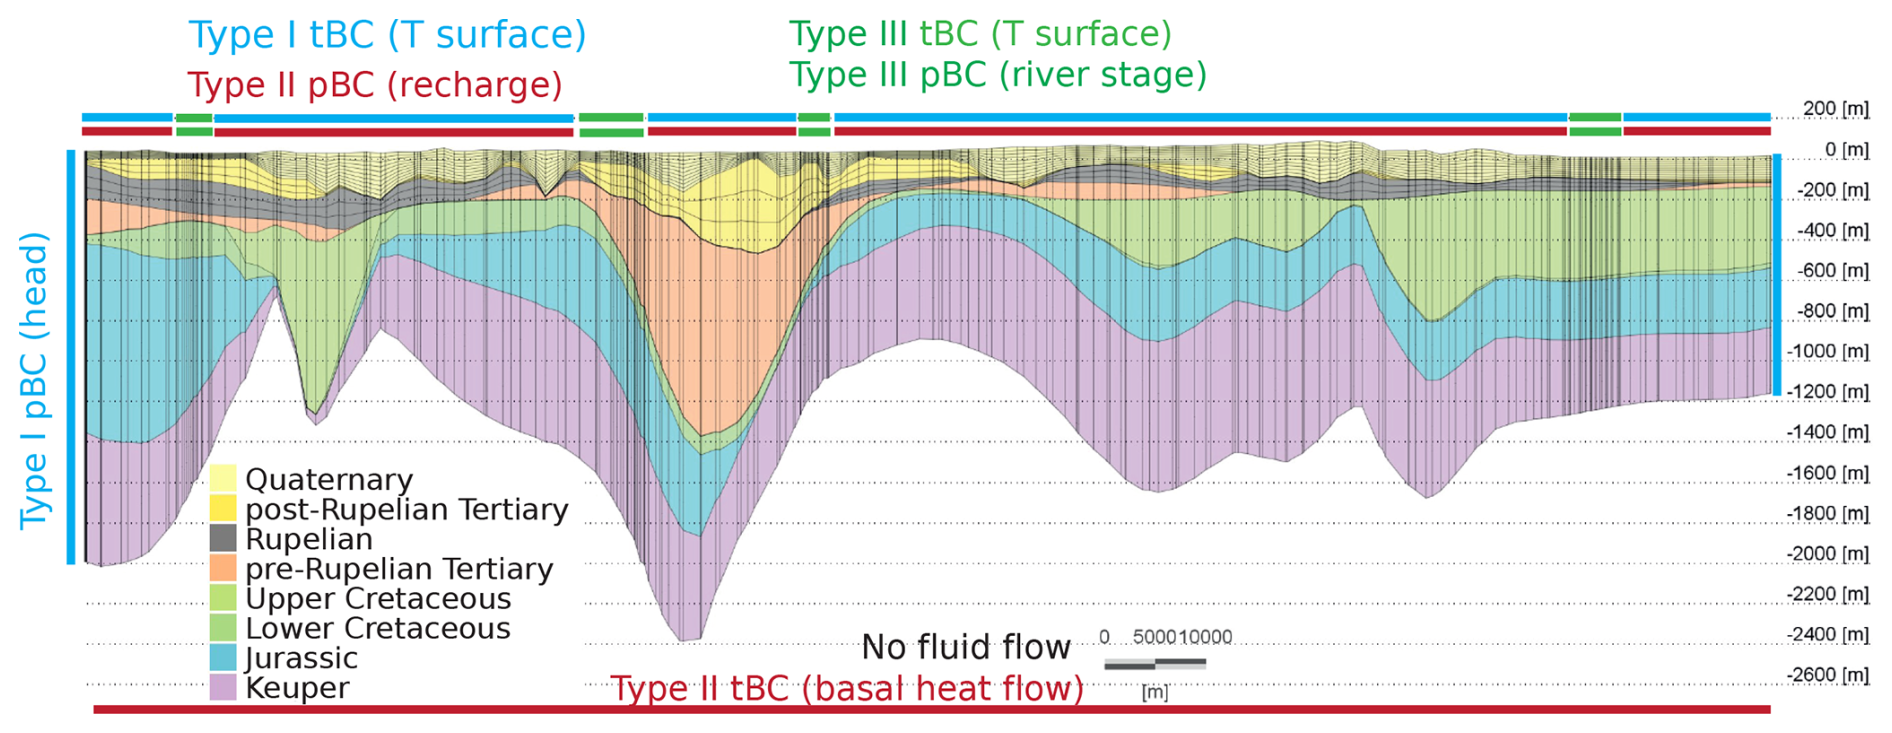
Figure 2Layering and the setup of the hydraulic (pBC) and thermal (tBC) boundary conditions of the groundwater model. The location of the cross-section is shown in Fig. 1b.
We assigned a spatially variable basal heat flux as the lower thermal BC, derived from a lithosphere-scale thermal model of Brandenburg, ranging 55–95 mW m−2 (Noack et al., 2012). Surface temperature was assigned as Type I BC or as Type III BC along the river nodes to allow for variable discharge temperature. To maintain consistency between the hydrologic and groundwater models, we used near-surface air temperature as a proxy for land surface temperature. This approximation is justified for the study area by the short snow cover period, the low level of urbanization, and the use of monthly aggregated values. Monthly near-surface air temperature is lower than surface temperature by <0.4 °C in CMIP6 projections and by <1.2 °C in historical data, suggesting that our simulations of subsurface warming could be conservative.
The unsaturated zone was approximated via a phreatic surface approach (Desai and Li, 1983; Diersch, 2013). Saturated hydraulic conductivity in partially saturated elements was linearly scaled by saturation, with a minimum residual saturation threshold of 1 %.
As initial conditions to the transient groundwater model, we selected the pressure-temperature (PT) state in 1955, given that the difference in the measured air temperature between the onset of industrialization in the 1880s and 1950s is <0.3 °C in the study area (DeutscherWetterDienst – Climate Data Center, 2021). To derive initial heads and temperature conditions for the transient model, we assigned a 5-year mean surface temperature and recharge from the earliest available historical period and ran the model until a steady state.
The transient groundwater model was calculated for 1955–2100 with adaptive time steps not exceeding monthly increments. Each model scenario, run on a 16-core processor with 32 GB of RAM, required approximately 3500 computational time steps, resulting in an average simulation time of about 19 h.
Post-processing focused on comparing model outputs between two 20-year-long intervals: a control present period (2002–2021) and a late-century period (2081–2100). The model only considers natural climatic (exogenic) forcing, without including effects of urban climate/infrastructure or groundwater abstraction/irrigation. Therefore, the magnitude of simulated pressure-temperature (PT) effects primarily represents gross regional trends.
We computed the incremental accumulated subsurface heat-in-place as:
with Vi being the volume of the ith element [m3], ϕi: porosity of the ith element, C: volumetric heat capacity of water (w) and solid (s) [J m−3 K−1], Ti,t2 and Ti,t1: mean temperatures in the respective time periods, and N: total number of finite elements in the model.
4.1 Ensemble scenarios
For the two climate scenarios (SSP245 and SSP585), we constructed ensembles of temperature, precipitation, PET, groundwater recharge and baseflow time series. Each ensemble combined seven GCMs with 50 realizations per GCM. For the historical period, the ensemble likewise consisted of 50 realizations. We then considered monthly mean values for each ensemble for the entire Brandenburg area, as the modeled forcing showed only limited spatial variability in long-term trends (Figs. A1 and A2).
The historical increase in mean annual temperature since 1950 (excluding the city of Berlin) is 1.1 °C. For SSP585, surface temperature in Brandenburg is projected to rise by an additional 3 °C on average by 2100 (P90 (ensemble's 90th percentile value): 3.5 °C, P10 (10th percentile): 2.5 °C), while under SSP245 the projected mean increase is 1.5 °C (P90: 2.0 °C, P10: 1.2 °C) (Fig. 3a).
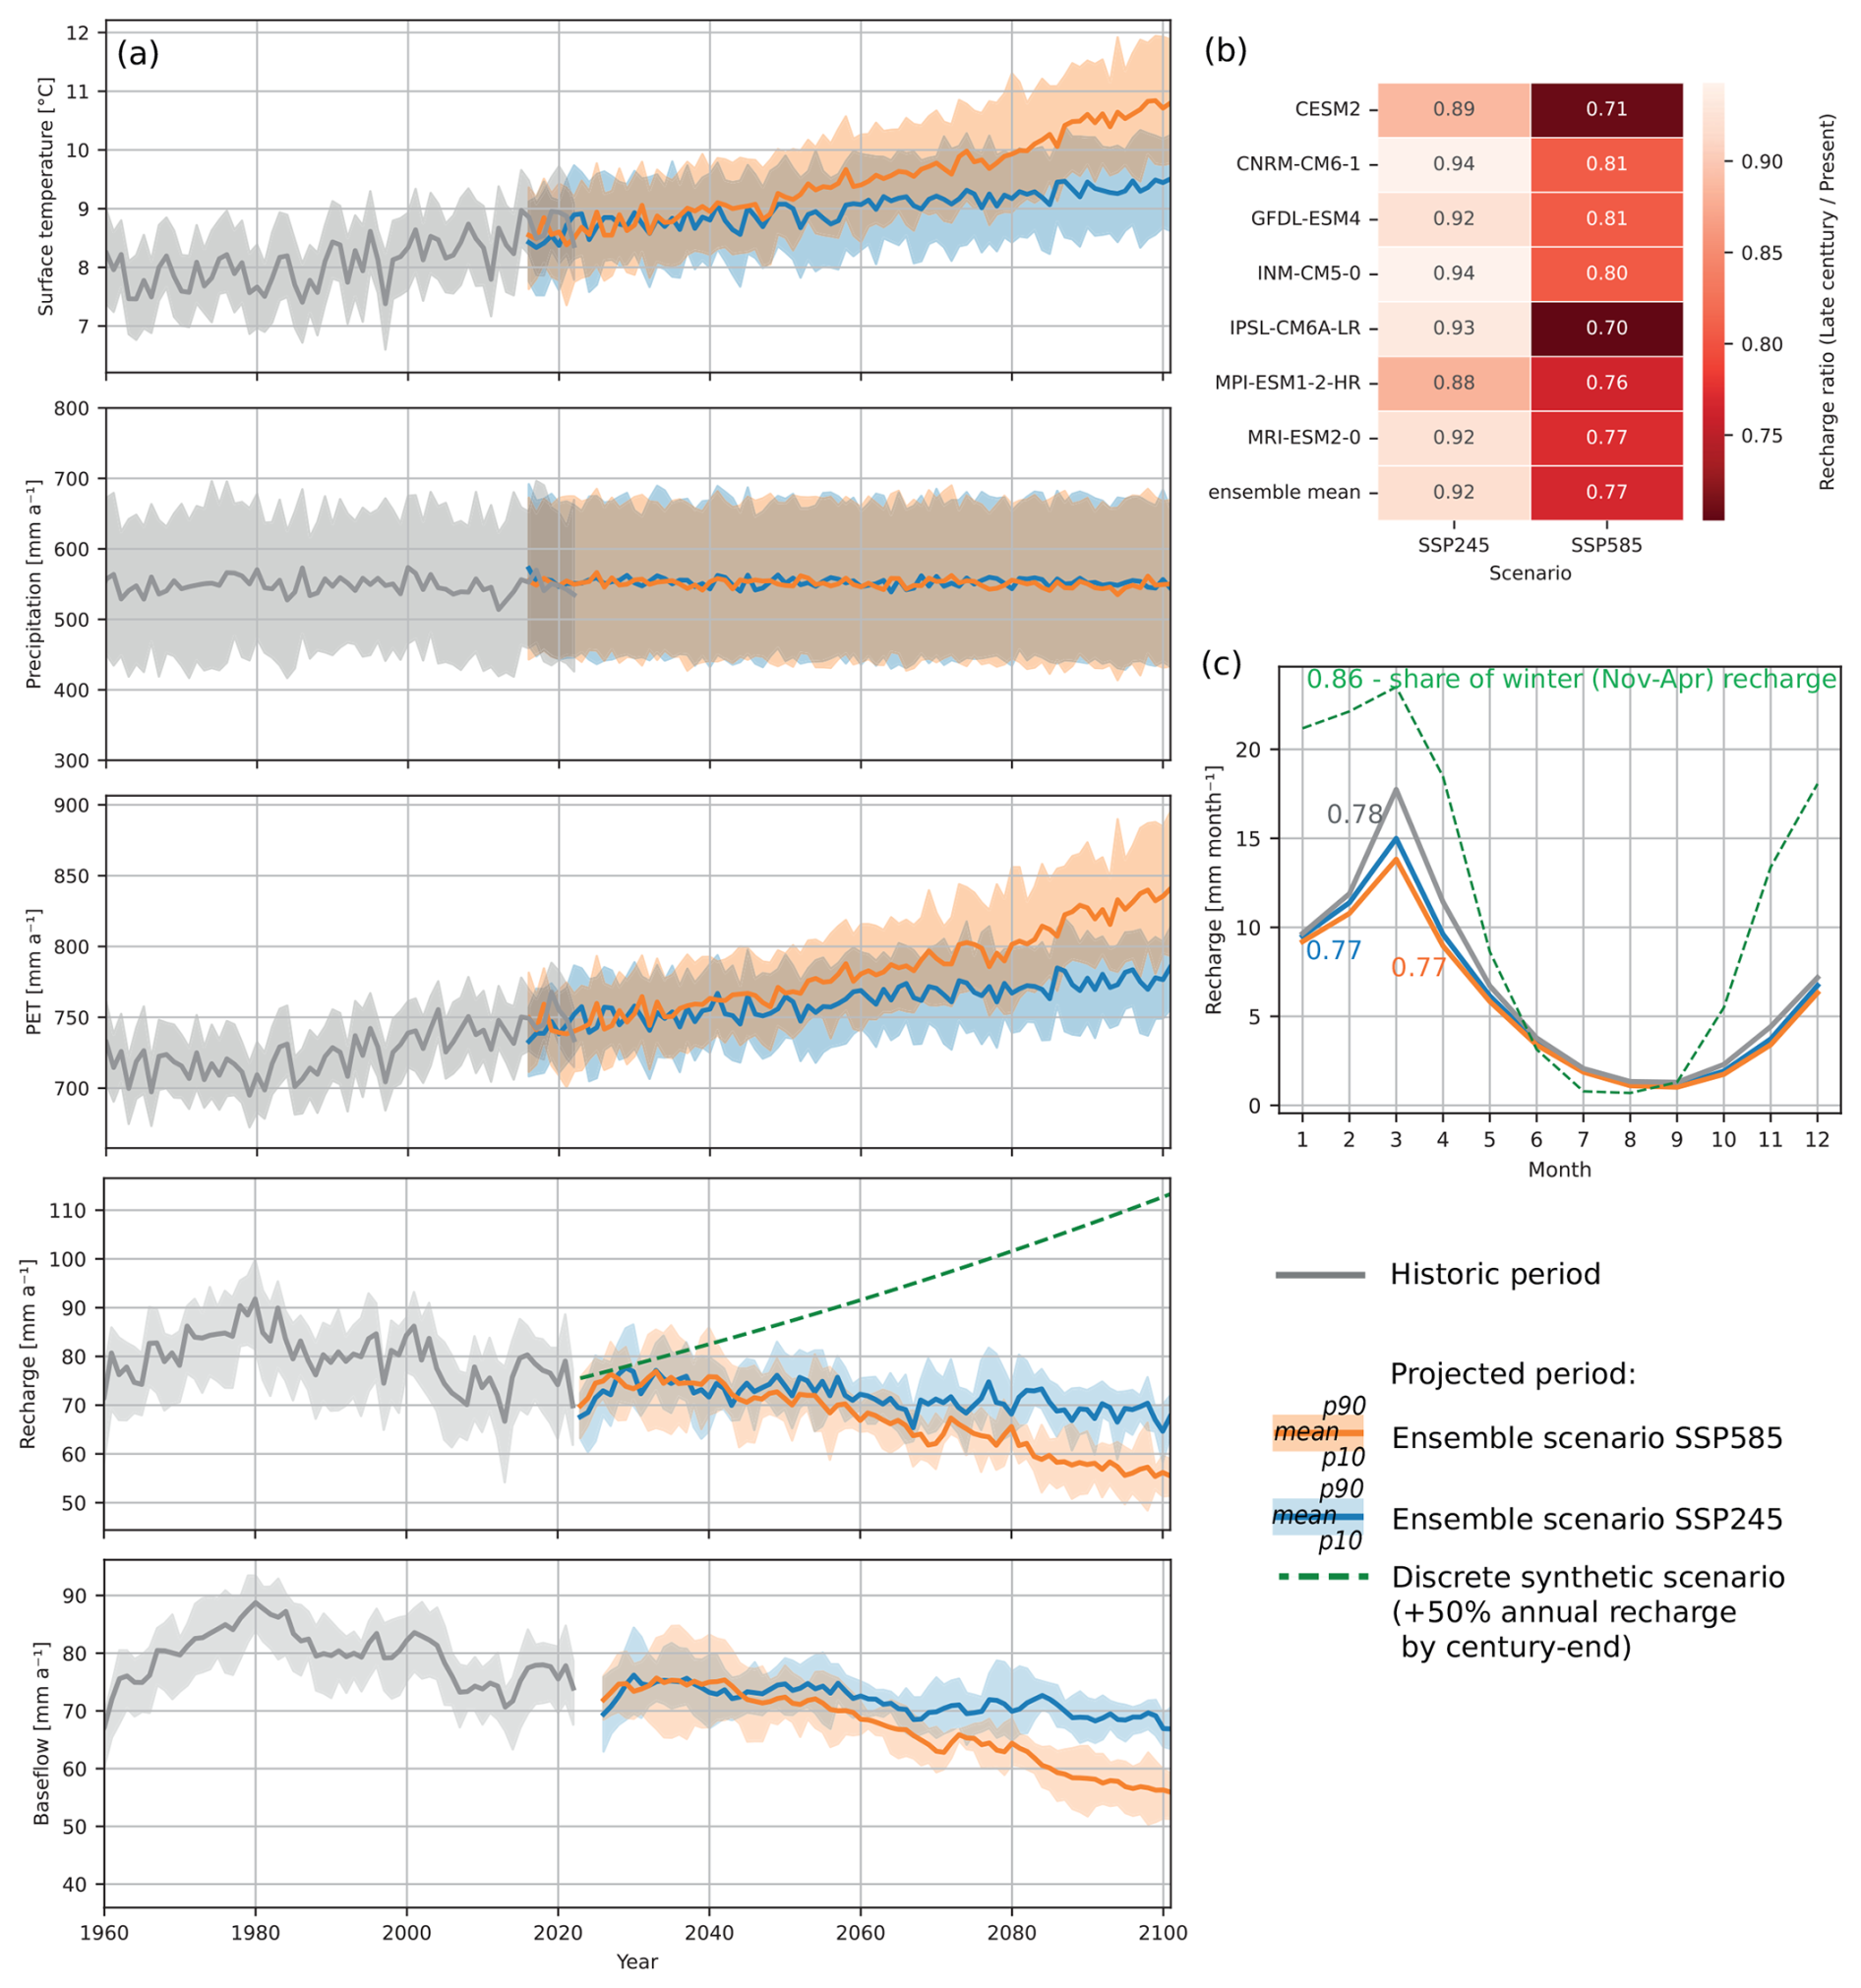
Figure 3(a) historical and projected annual time series of surface temperature, precipitation, PET, groundwater recharge, and baseflow. Solid lines represent the ensemble mean (historical: across nsRWG realizations; SSP scenarios: across GCMs and realizations) and shaded areas indicate the P10–P90 range; (b) ratio of late-century to present period mean recharge; (c) monthly recharge means. The green line represents a discrete synthetic scenario (Sect. 4.2).
Precipitation, despite year-to-year variability driven by the stochastic component, does not exhibit a statistically significant long-term trend in the annual mean. Projections differ between the two scenarios only after 2075, with SSP585 portraying slightly lower annual precipitation.
PET time series closely follow temperature variations and, given relatively steady precipitation, point to a long-term decrease in climatic water balance and increasing aridity.
Simulated recharge shows a decline beginning in the late 1970s with a mean trend of −4 mm a−1 per decade. This lies at the lower end of the trend of −21 to −4 mm a−1 per decade, estimated for Brandenburg, and is supported by falling GWL in the observation wells, decreasing stream discharge, and groundwater storage reductions based on satellite hydrogravimetry (Güntner et al., 2023; Francke and Heistermann, 2025). This negative recharge trend has been attributed to climate change and increasing leaf area index (LAI) (Francke and Heistermann, 2025). An analysis of groundwater trends in watersheds minimally affected by anthropogenic forces suggests hydraulic heads declining at rates of −20 to −80 mm a−1, resulting in up to 2.5 m cumulative decline from mid-1970s to the present.
Simulated future recharge exhibits a continued negative long-term trend under both climate scenarios. Given that projected precipitation remains relatively stable, the decline is attributed to increasing PET and actual evapotranspiration. The total reduction of recharge during the projection period for SSP585 and SSP245 ranges from −25 % to −30 % and from −6 % to −12 %, respectively, in agreement with predictions based on an empirical relationship linking groundwater recharge with precipitation to PET ratio (Berghuijs et al., 2024). Projected baseflow exhibits the same reduction levels with no delay, though with smaller year-to-year variability due to the aquifer buffering effect.
Recharge projections show consistency across GCMs (Figs. 3b, A2). CESM2 tends to give lower recharge in both climate scenarios, while MPI-ESM1-2-HR and IPSL-CM6A provide the largest change only for SSP245 and SSP585, respectively. CNRM-CM6-1 exhibits the smallest change between the reference and the future periods.
Simulated recharge also displays a strong seasonal signal, with >70 % of recharge occurring during the colder months (November to April) for both historical and projected periods (Fig. 3c).
We calculated groundwater flow and heat transport using cross-GCM statistical ensembles (mean, P10 and P90 time series of the nsRWG suite) for each SSP, as well as for six deterministic nsRWG realizations with the smallest Root Mean Square Error (RMSE) relative to the aggregate scenarios. The ensemble approach captures the long-term uncertainty range, while the deterministic cases retain temporal variability and extremes, helping to offset potential artifacts from ensemble smoothing.
4.2 Synthetic scenarios
The use of the weather generator enabled us to capture recharge variability while conditioning on large-scale circulation patterns and atmospheric thermodynamic effects. However, as demonstrated in multi-model hydrological studies (Moeck et al., 2016; Reinecke et al., 2021; Kumar et al., 2025), uncertainties in future recharge estimates arise not only from the choice of GCMs, with their diverse precipitation projections, but also from hydrologic model setup (e.g., vegetation processes considered and PET estimation method) and its dynamic inputs (e.g., LAI and land use change).
While the scope of the current study does not include a multi-model ensemble analysis, we examined available alternative recharge projections for the region of interest (Kumar et al., 2025; Berghuijs et al., 2024; Hattermann et al., 2008; Marx et al., 2021). Central Europe lies in a transitional climatic zone between the Mediterranean region, where projections show a pronounced decrease in recharge, and Northern Europe/Scandinavia, where most projections indicate an increase. To account for these contrasting regional trends, specifically the implications of increasing recharge despite rising PET, we included a scenario based on a projected end-century increase of 23 % (overall for Germany) and up to 50 % (in Brandenburg) (Marx et al., 2021). Despite concerns over such “optimistic” projections driven by increased winter precipitation (Francke and Heistermann, 2025), we found such a “what if” scenario valuable for assessing potential subsurface feedbacks. Taking this projected increase, we generated synthetic monthly recharge time series assuming exponential growth over time and a higher winter share of total recharge (Fig. 3). We tested the effect of increasing recharge with moderate (Scenario M1, Table 1) and strong surface warming (M2). In order to isolate the flux effects, we also tested two reference cases where we maintain surface temperature at their present values and consider a 20 % recharge decline (M3) or a hypothetical increase of 50 % (M4).
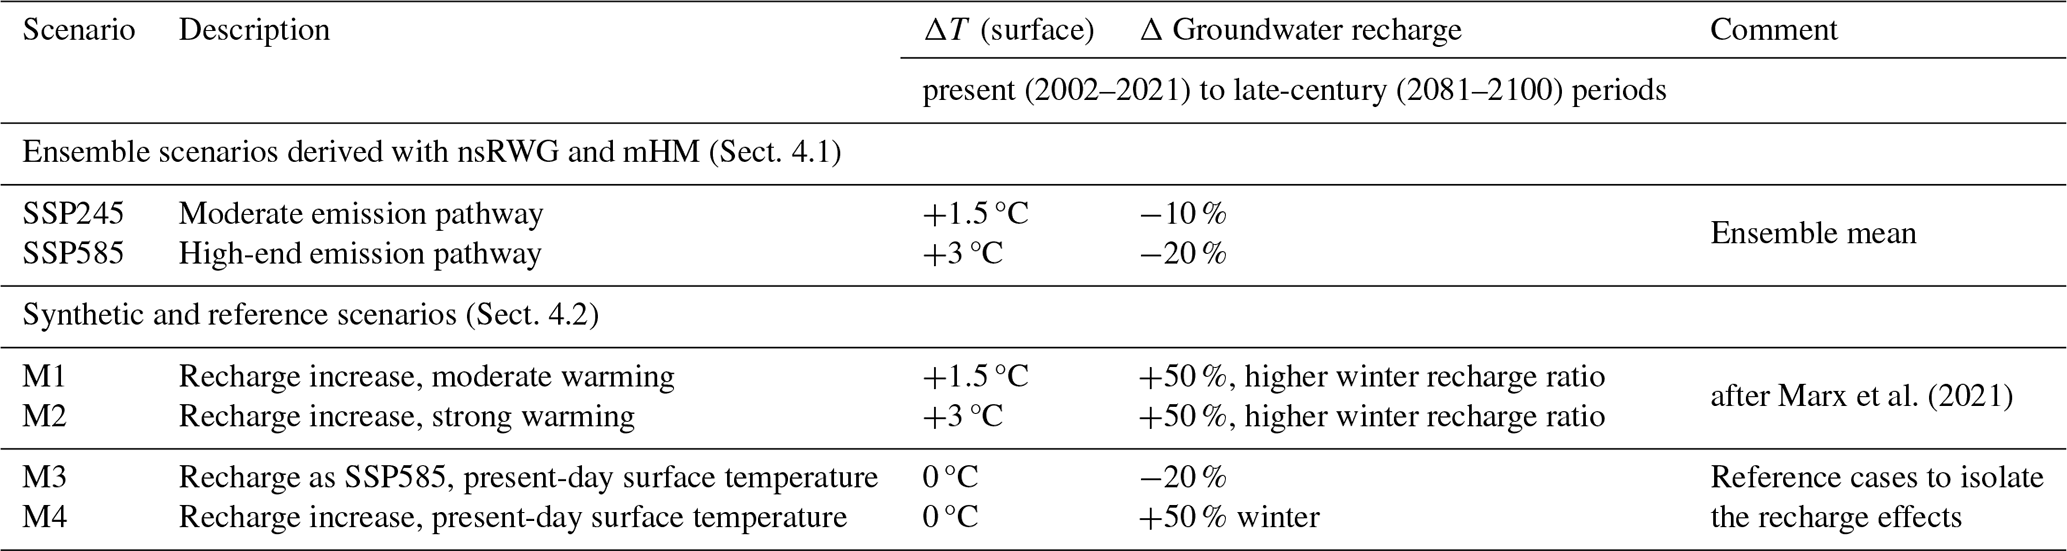
The resulting layout of scenarios for groundwater simulations allows us to compare the difference between two SSPs and a potential impact of diverging recharge trends on the subsurface flow and temperature distribution (Fig. 4).
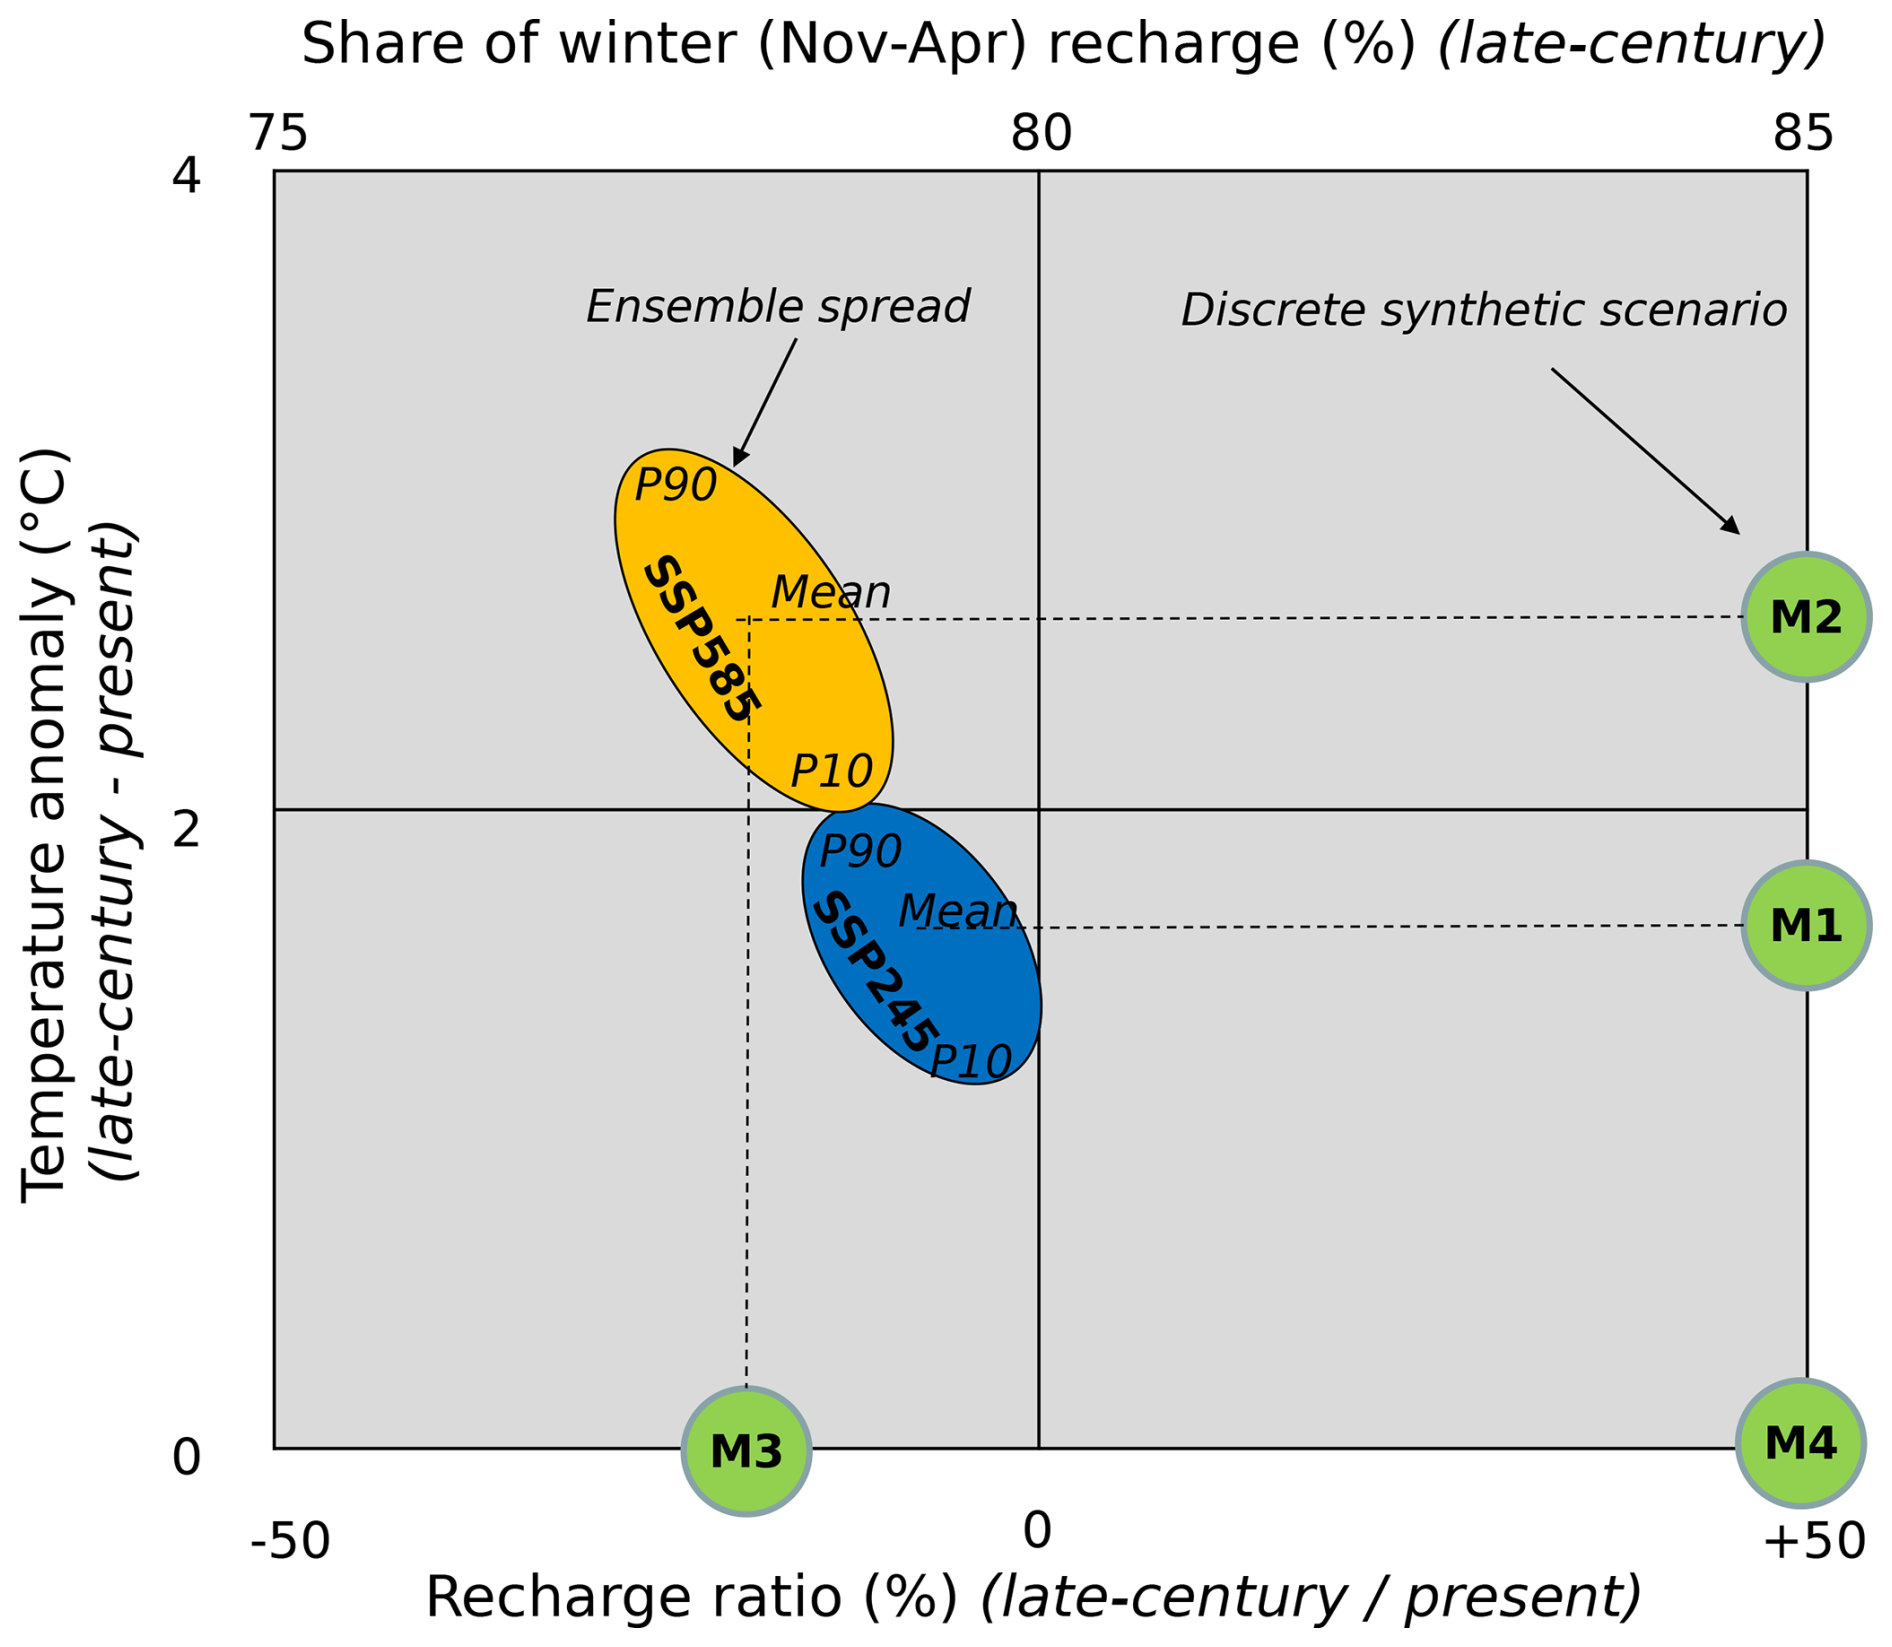
Figure 4Schematic representation of the groundwater modeling scenarios. See Table 1 for the detailed description.
5.1 Groundwater model calibration and validation
Steady-state hydraulic heads were calibrated against historical GWL observations from 47 monitoring points in Brandenburg (LfU, 2023). The calibrated parameters included hydraulic conductivity and storativity, with the best-estimate values provided in Table A1. RMSE after calibration was 6.6 m, which we find acceptable for a regional-scale model of this complexity (Fig. 5a).
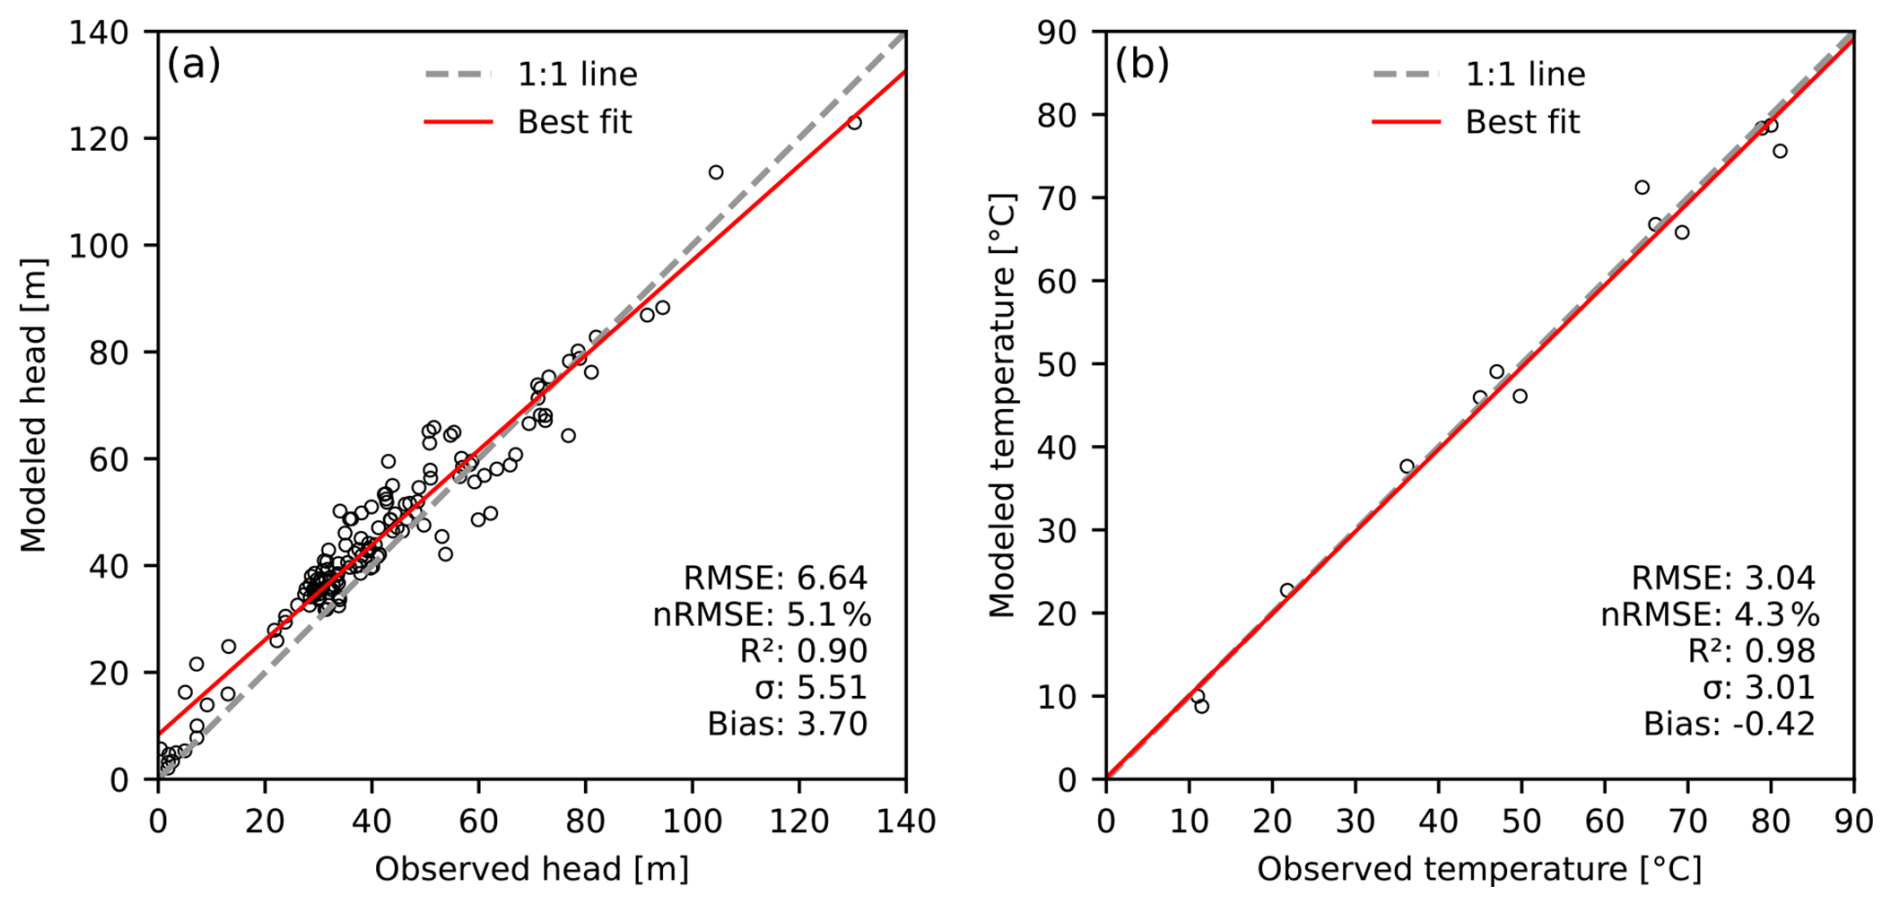
Figure 5Steady-state groundwater model calibration results: simulated versus observed hydraulic head and temperature at monitoring points (locations shown in Fig. 1c). RMSE – Root Mean Square Error, nRMSE: normalized to value range; R2: coefficient of determination; σ: standard deviation.
Available groundwater temperature data are sparser (14 locations) with a large gap between shallow groundwater monitoring points and deep petroleum exploration boreholes. The latter consist of bottom-hole temperatures corrected using the Horner plot method and empirically corrected continuous cased-hole temperature logs (Förster, 2001). RMSE for temperature in the steady-state case was 3.0 °C (Fig. 5b), which is comparable to the estimated measurement error.
For both variables, RMSE normalized to the range of observations was <10 % (Fig. 5).
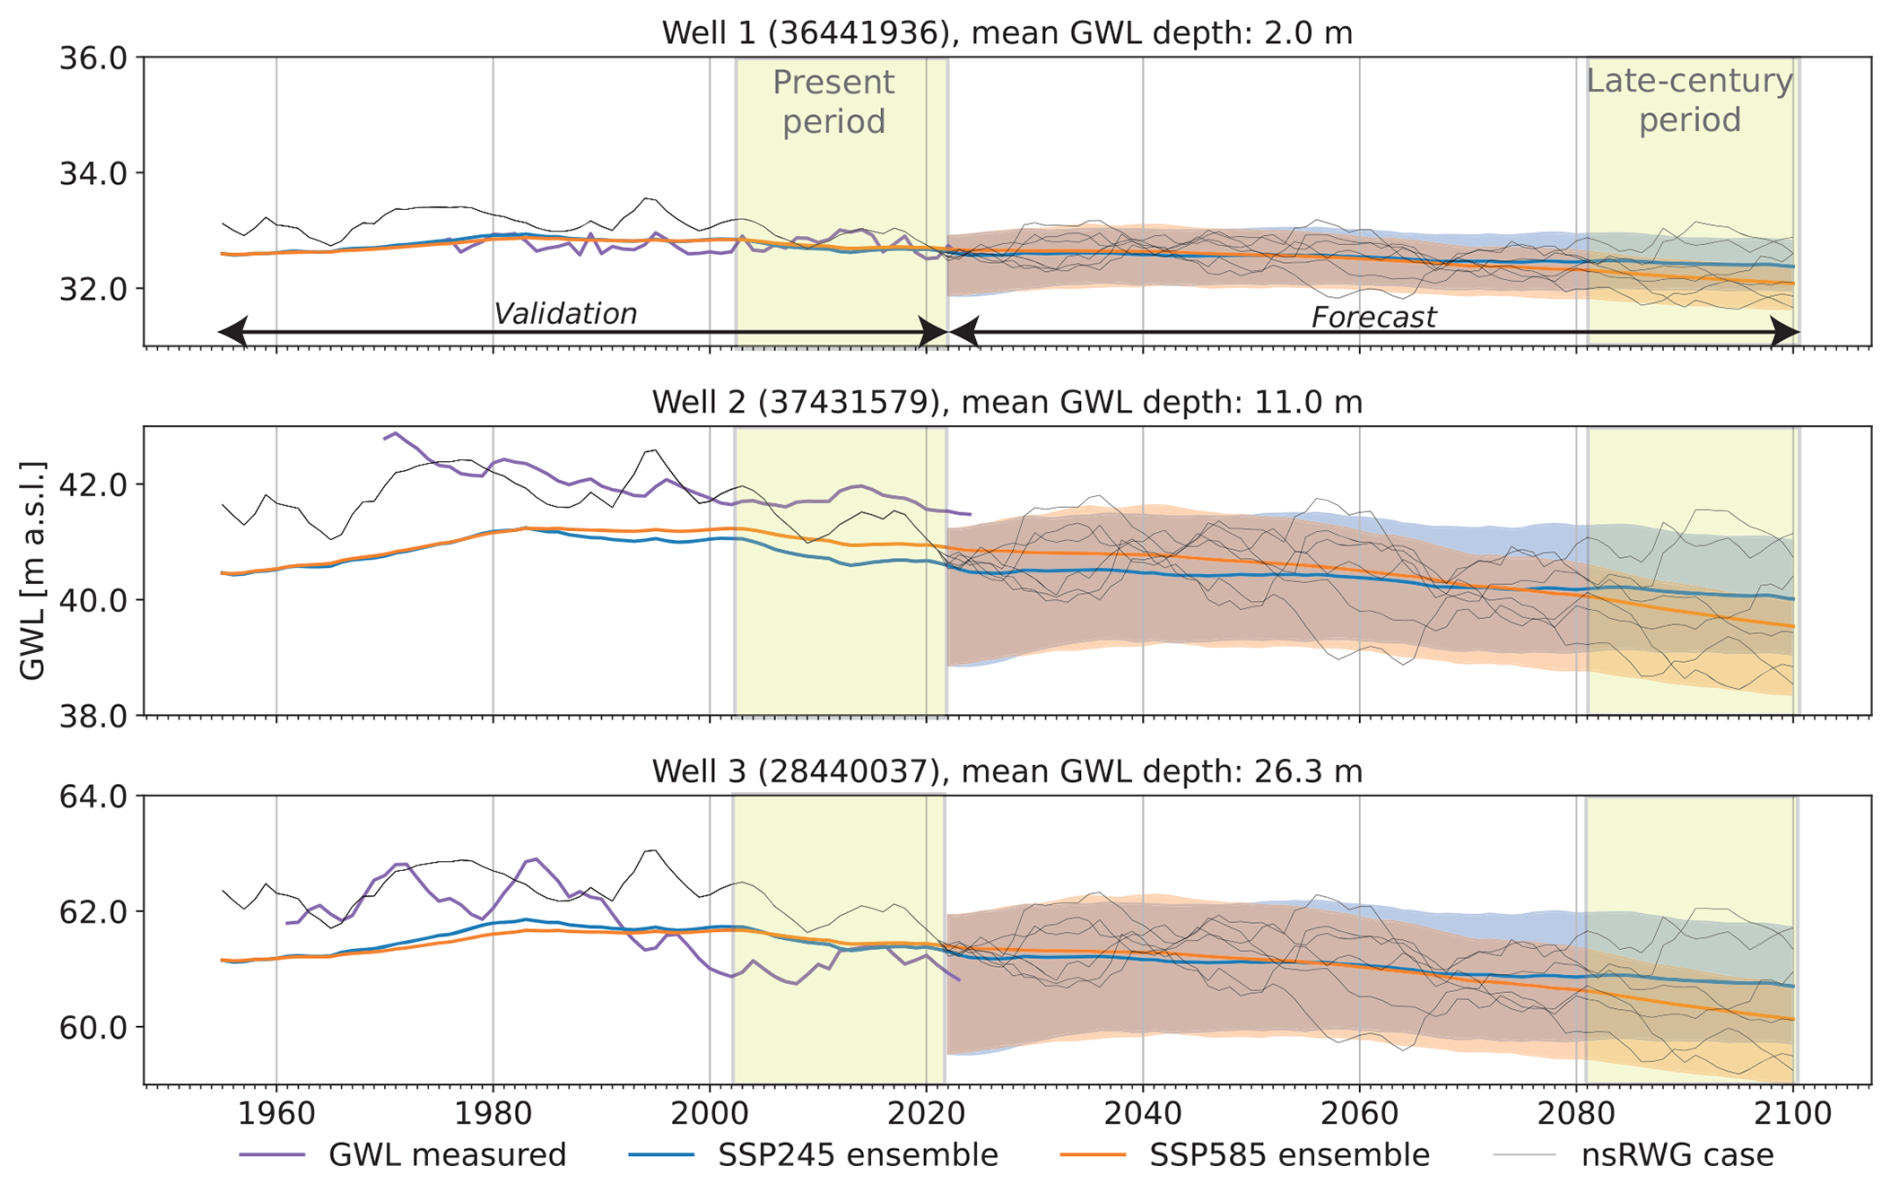
Figure 6GWL time series for (a) shallow, (b) intermediate, and (c) deep monitoring wells (locations shown in Fig. 7a). Colored lines indicate ensemble mean, shaded areas represent P10–P90 range of the ensemble distribution, black lines are examples of individual nsRWG realizations. Numbers in brackets denote well ID from the state monitoring network (LfU, 2023).
Transient hydraulic heads were validated against historical GWL time series (Fig. 6). The model successfully reproduced the magnitude of the historical GWL decline between 1980 and 2021. Proper validation of transient groundwater temperatures was not feasible due to the lack of repeated long-term measurements in areas not affected by urban heat island effects and uncertainties in sensor depth relative to the water table.
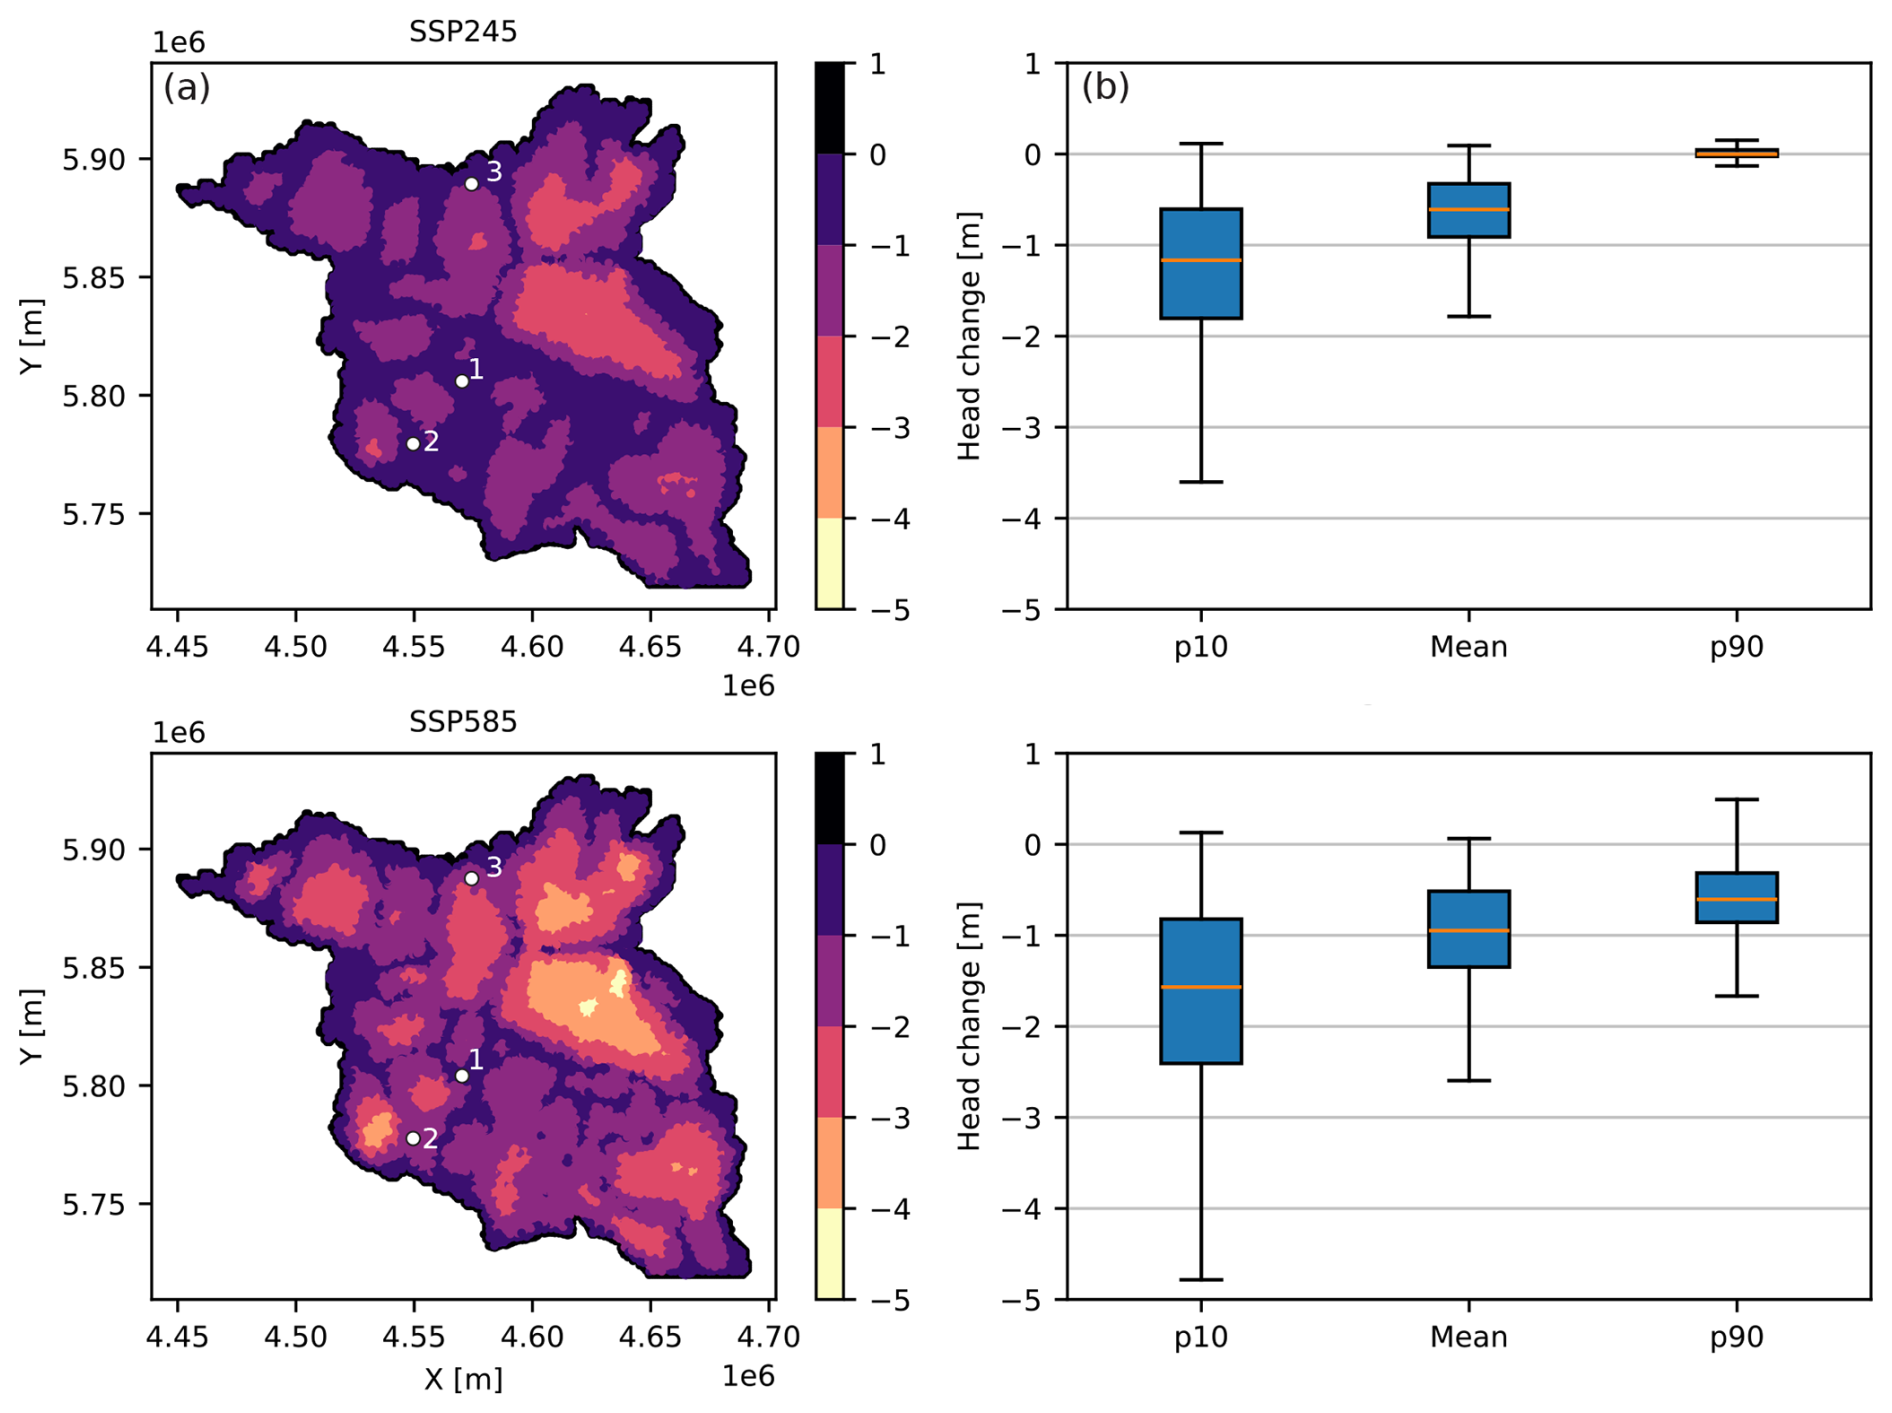
Figure 7Projected changes in hydraulic heads between the present and late-century periods: (a) spatial distribution of head changes for the SSP ensemble mean; coordinates are shown in DHDN/3° Gauss-Krüger zone 4; labels refer to wells, shown in Fig. 6; (b) comparison of P10, mean, and P90 ranges.
5.2 Hydraulic heads
The projected evolution of hydraulic heads between the present and late-century periods closely follows trends imposed by changes in groundwater recharge. In both climate scenarios, the largest long-term changes are modeled at watershed divides, whereas the lowest changes occur adjacent to river valleys (Fig. 7a). Under SSP585, head declines at watershed divides may reach up to 4.8 m, compared to 3.6 m under SSP245. Minimal changes in lowlands can be linked to regulated water levels in rivers, making groundwater less responsive to recharge variability.
For the mean SSP585 ensemble, heads are projected to decline at approximately the same rate as observed during the historical period, while under SSP245, the rate of decline slows down after 2070 (Fig. 6). Simulated heads for discrete nsRWG cases reveal a potential temporary reversal in head trends, with head increases lasting up to 10 years (Fig. 6). Such behavior has been frequently observed in the historical data and attributed to impact of inter-annual climatic fluctuations, such as North Atlantic Oscillation (Liesch and Wunsch, 2019).
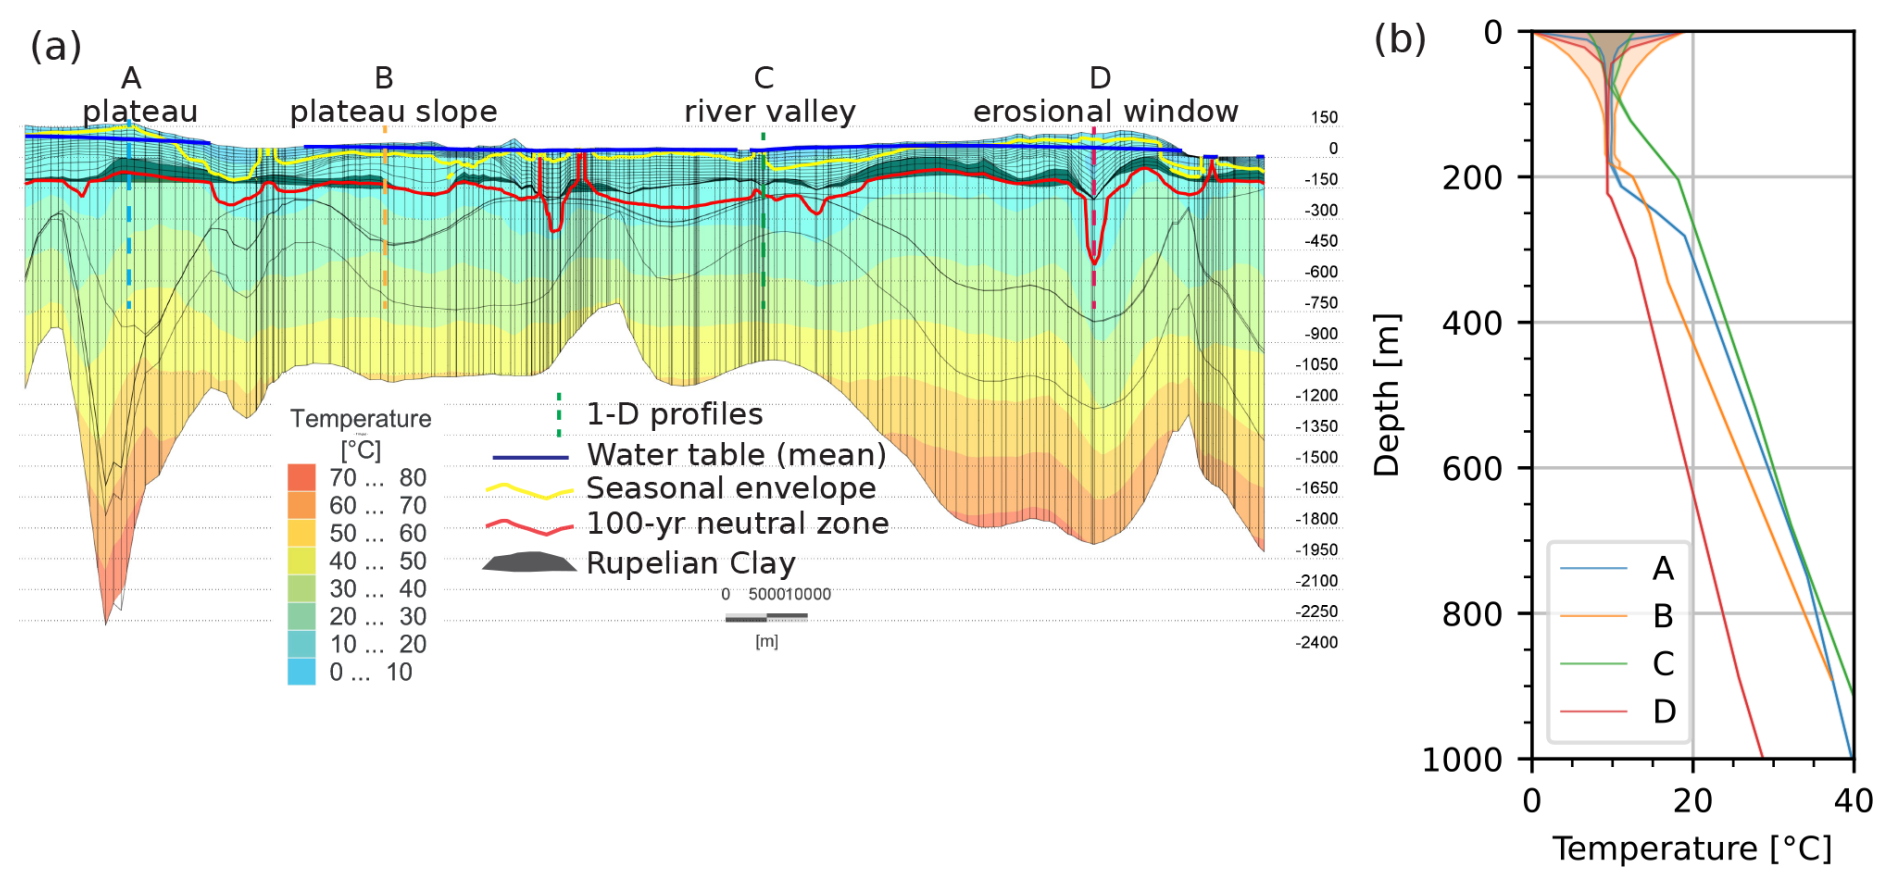
Figure 8(a) cross-section of the initial subsurface thermal field, showing variability in the maximum depth of thermal disturbance (100 years neutral zone) and a seasonal envelope; (b) initial temperature profiles (lines) and seasonal envelopes (shaded areas). The location of the cross-section is shown in Fig. 1d.
5.3 Subsurface thermal field
Vertical temperature profiles at four representative locations, each characterized by different local geology and hydraulic conditions, reveal spatial variability in the geothermal gradient, depth of the seasonal envelope, and the extent of thermal disturbance from the projected global warming (Fig. 8).
The first-order difference in modeled geotherms, reaching 11 °C at 1000 m between the selected locations, is driven by the basal heat flux, which varies due to heterogeneities in the underlying geology, such as depth of the Moho, sediment thickness, and the distribution of salt structures (Noack et al., 2012).
Profiles A, B, and D exhibit relatively low modeled geothermal gradients in the upper 100–200 m, suggesting a strong influence of recharge and downward advection of cold meteoric water. A distinct inflection at 150–200 m coincides with the depth of the Rupelian aquitard. In profile D, penetration of advective cooling and the gradient inflection are deeper due to erosion of the Rupelian (Fig. 8a). Profile C, extracted from a river valley, shows a higher geothermal gradient and a smaller magnitude of seasonal fluctuations, reflecting discharge conditions with some flow contribution from the deeper aquifers. Profiles A and D, located on a glacial plateau, have a shallow seasonal envelope, entirely above the water table, suggesting damping of the seasonal thermal signal within the unsaturated zone.
To isolate the contribution from the changing climate, we examined the difference in groundwater temperature and flux between the present and late-century periods (Fig. 9).
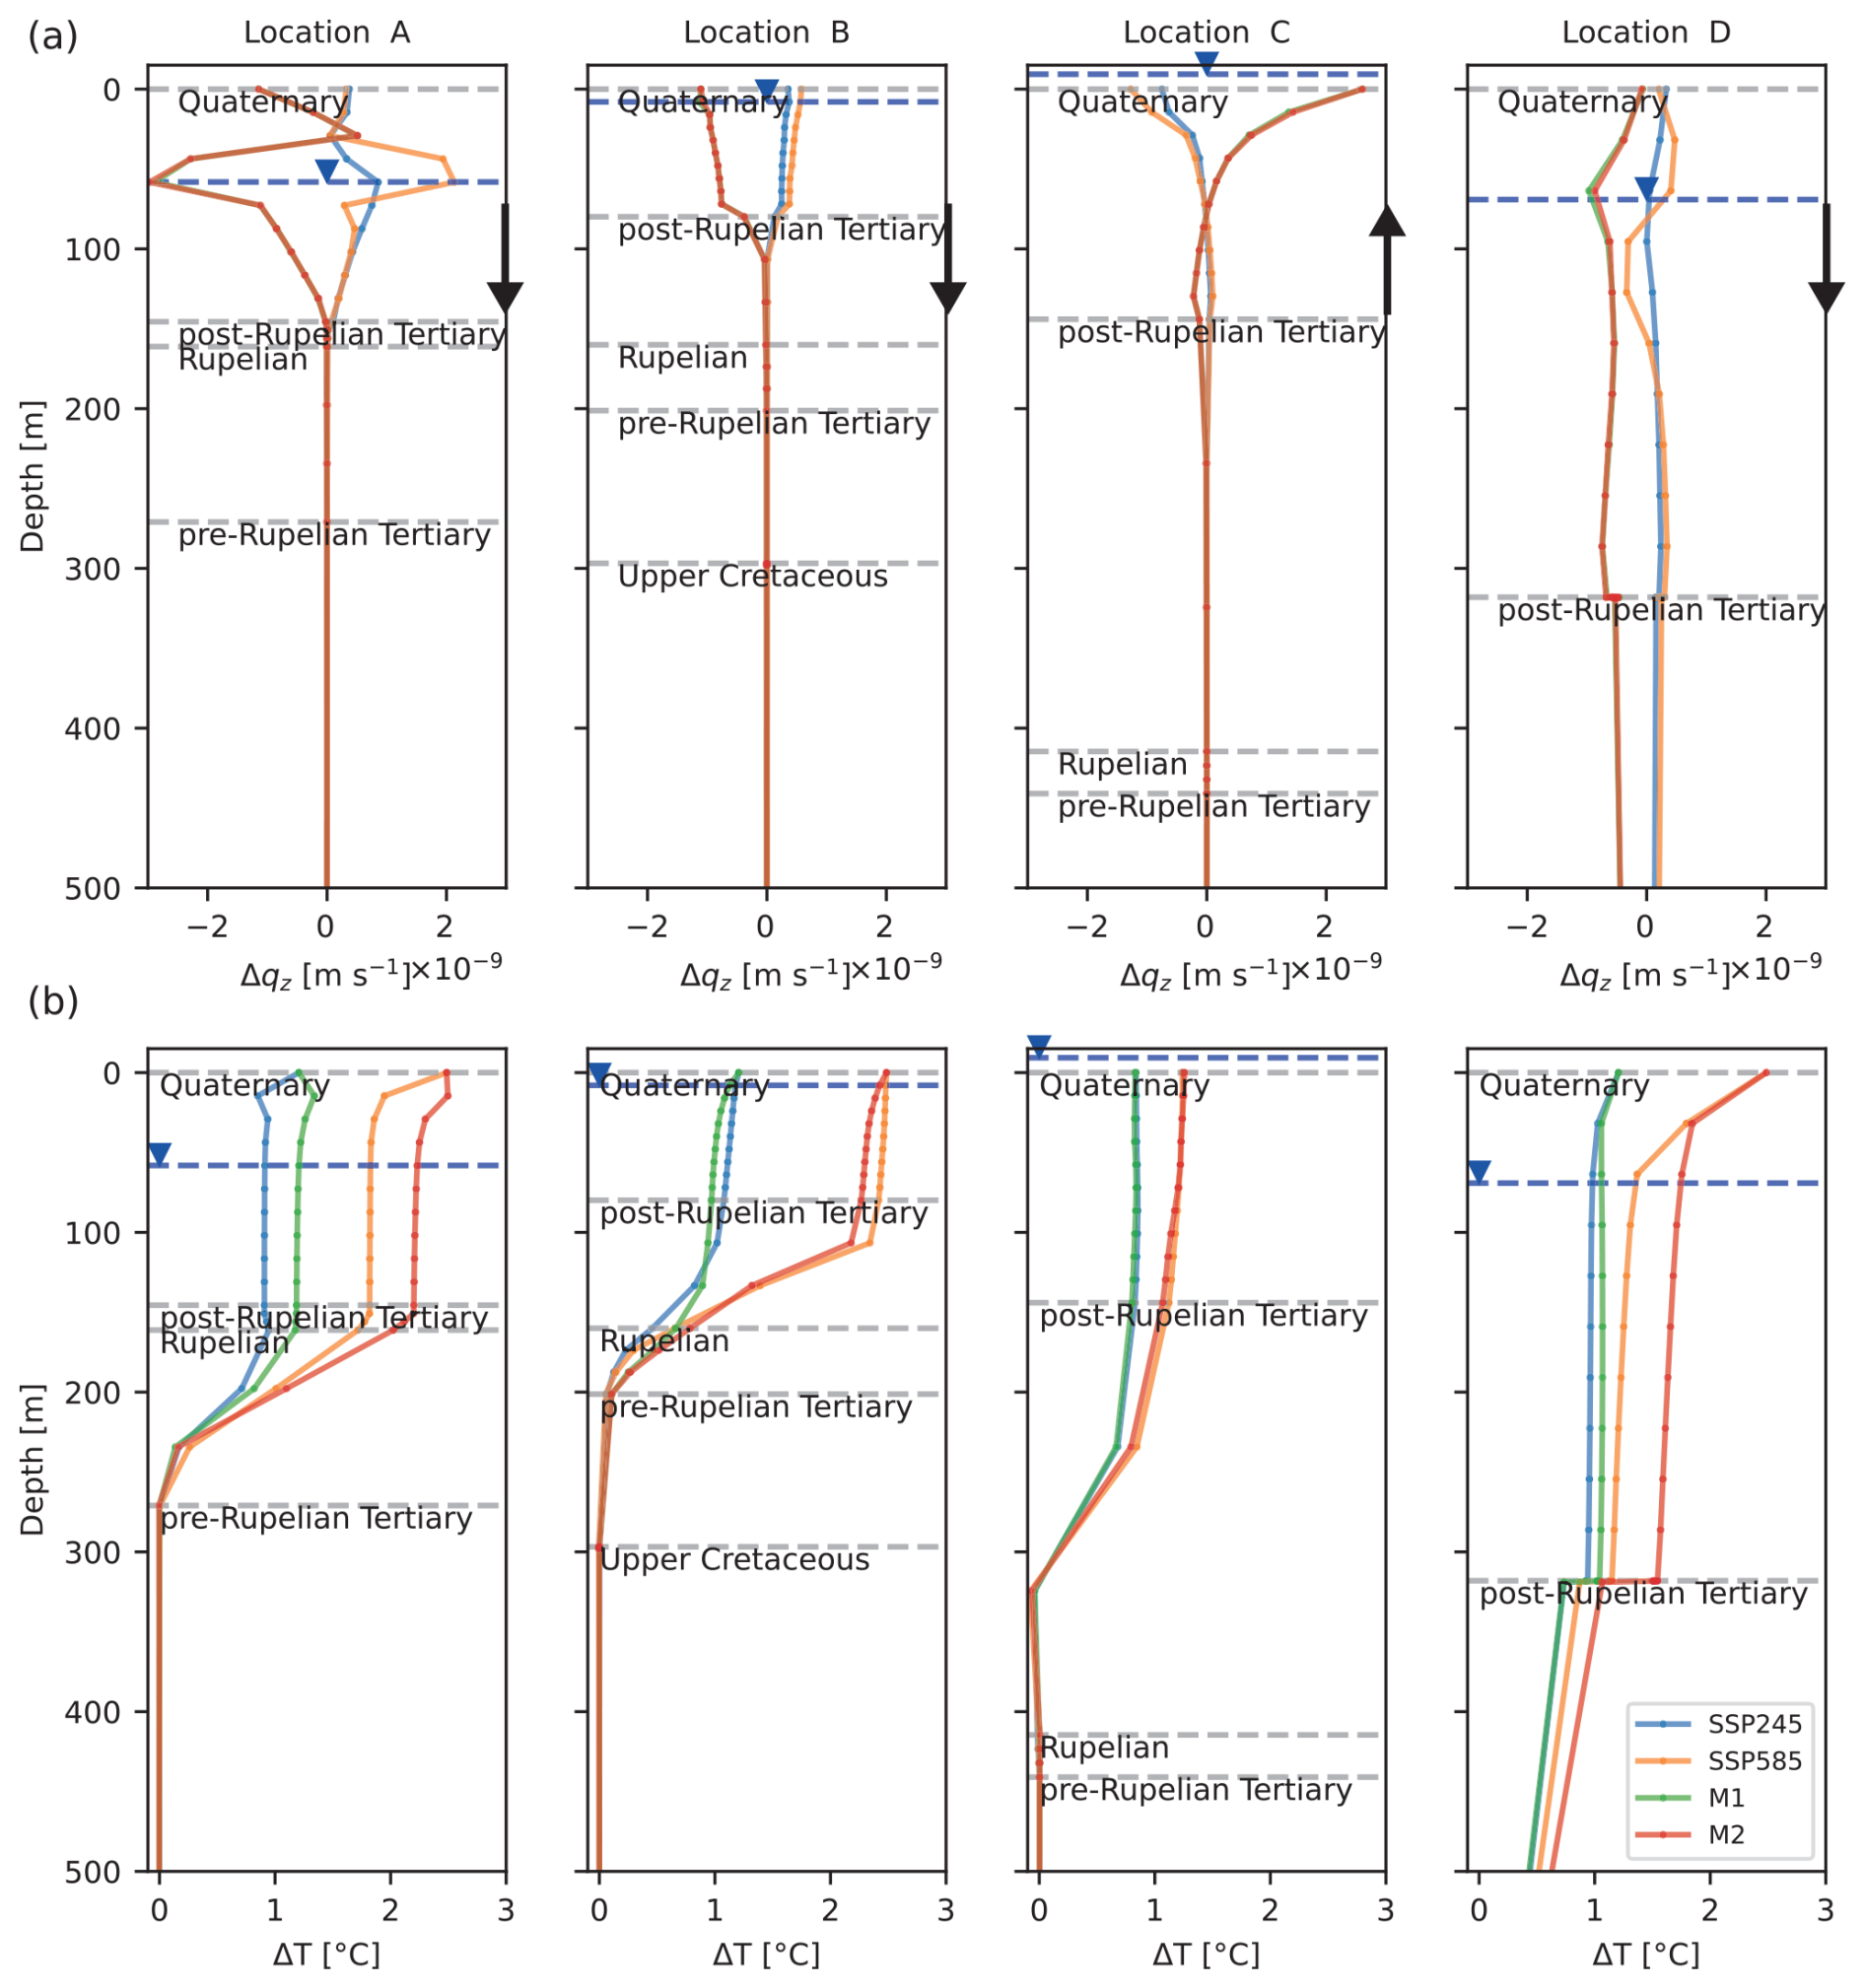
Figure 9Changes in (a) vertical groundwater flux and (b) temperature vs. depth between the present and late-century periods. The scenario pairs SSP245/M1 and SSP585/M2 assume the same degrees of surface warming but decreasing/increasing groundwater recharge, respectively. The blue line indicates water table depth. The arrow shows the direction of vertical groundwater flow (qz vector is always oriented upward).
Relatively high groundwater flux in the Quaternary (10−8 to 10−6 m s−1) indicates that advection dominates local groundwater temperature variability in the interval of meteoric water circulation, whereas conduction controls basin-scale heat accumulation in the pre-Rupelian section. Projected changes in the vertical component of the groundwater flux (qz) in the late-century period relative to the present period are m s−1 or 5 %–40 %. (Fig. 9a). In the saturated part of the Quaternary, decreasing recharge (SSP245 and 585) reduces downward flux at locations A, B, and D and correspondingly lowers upward flux for location C (and vice versa for high recharge scenarios, M1 and M2).
Climate-induced thermal disturbance penetrates the first few hundred meters, being controlled by the depth of the Rupelian aquitard in locations A and B (Fig. 9b). In location C, temperature disturbance does not reach the Rupelian due to the thicker post-Rupelian section. In location D, where the Rupelian is locally eroded, the warming signal penetrates into the older strata.
Projected groundwater warming at the water table reaches 2.5 and 1.1 °C under SSP585 and SSP245, respectively, except at location C, where surface warming is buffered by upward flow. In contrast, the isolated effect of recharge is weaker, as seen in profiles A and D, where higher recharge scenario (M2), despite a larger fraction of winter recharge, results in a groundwater temperature difference relative to SSP585 not exceeding 0.4 °C.
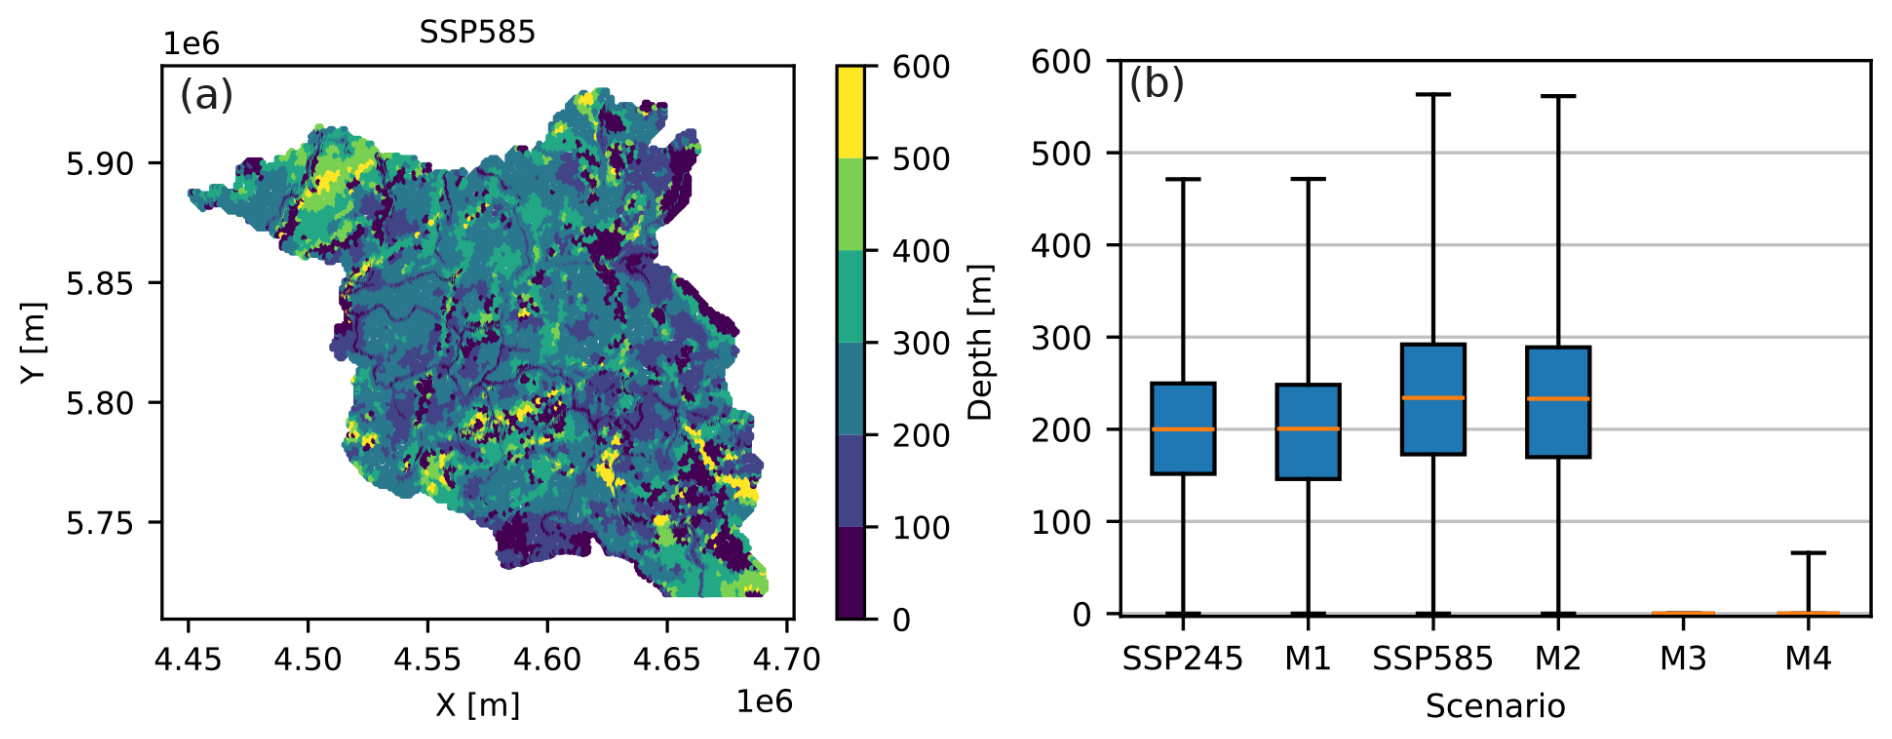
Figure 10Depth to long-term steady groundwater temperatures: (a) spatial variability under SSP585; (b) comparison of the depth variability between scenarios. Scenarios M3 and M4 assume changes in recharge and constant surface temperatures.
We derive maps of the stable long-term groundwater temperatures by extracting the depth below which the temperature difference between the present and late-century periods is <0.2 °C (Fig. 10a). This steady temperature level varies spatially, being shallowest (<200 m) along river valleys and in areas of thin sedimentary cover along the southern model boundary. The deepest penetration of the warming signal (450–550 m) occurs in the northwestern part of the area within the Quaternary tunnel valleys and in the east, where the Rupelian aquitard is largely absent (Fig. 1d). Under SSP585 the depth of the surface warming propagation is projected on average 50 m deeper than under SSP245 (Fig. 10b). Changes in recharge flux alone, in contrast, have a negligible impact on this depth.
The depth of the seasonal envelope is expected to rise under decreased downward flux. Combined with projected water table decline under SSP585, this would expand over time the modeled area where seasonal subsurface temperature fluctuations are fully damped before reaching the water table from 5 % to 9 % (Fig. A4).
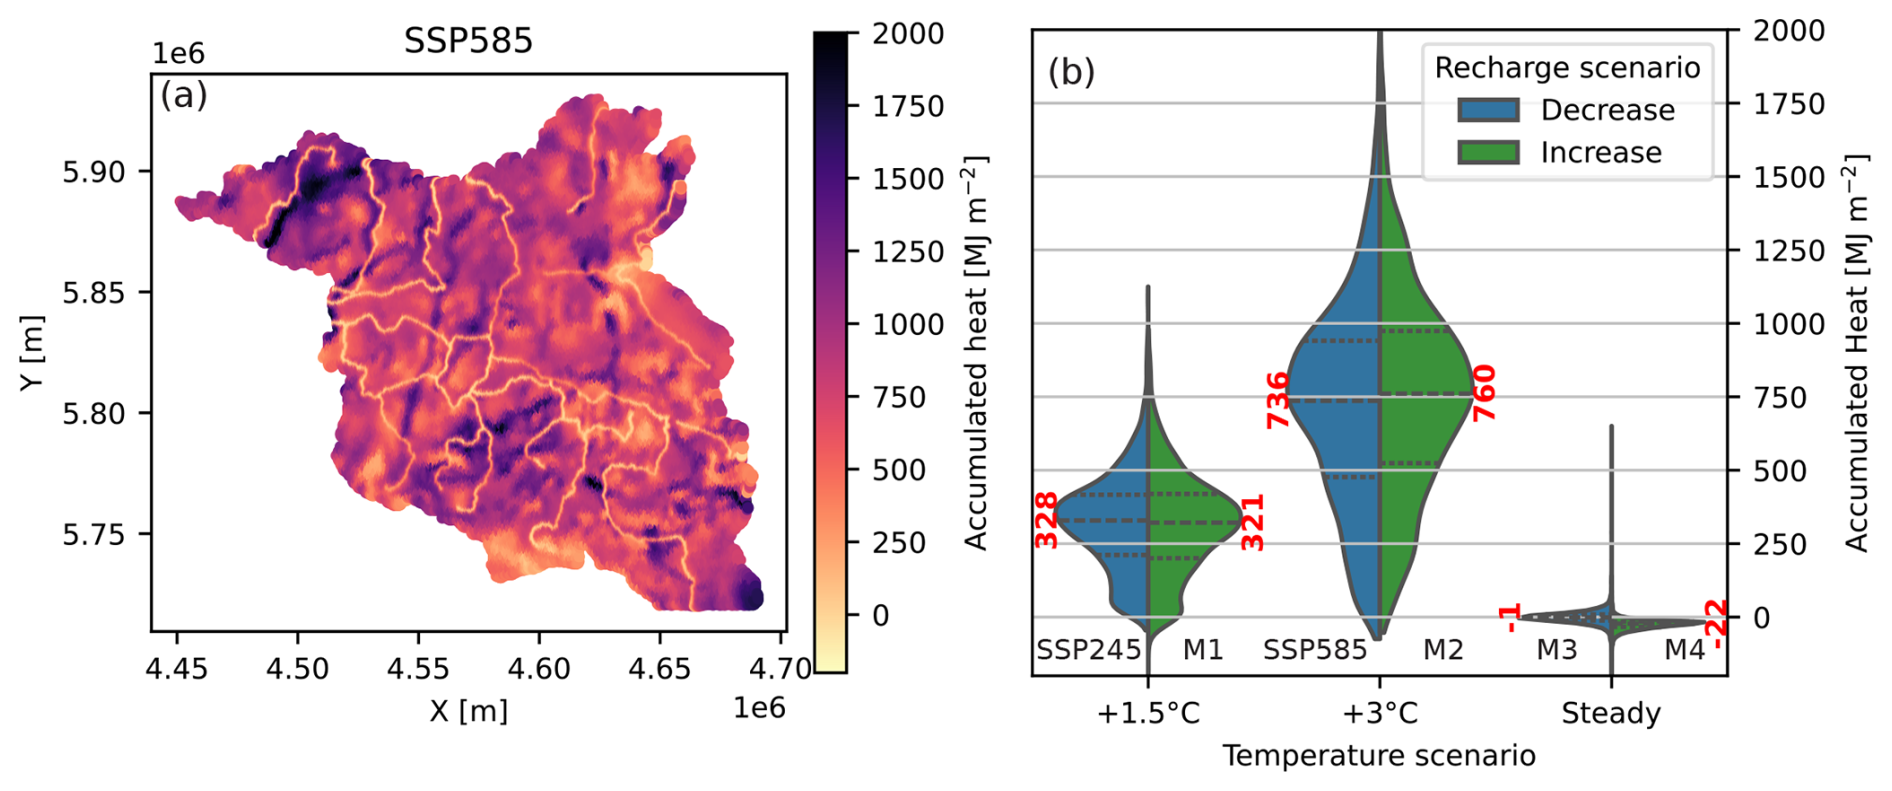
Figure 11Accumulated heat-in-place: (a) map for scenario SSP585, (b) violin plots (equal-width-normalized) comparing probability distributions of accumulated heat-in-place per m2 between the scenarios. Red labels indicate P50 values; black labels refer to model scenarios.
5.4 Accumulated heat
Figure 11 shows the modeled spatial variability of the accumulated subsurface heat due to climate change and compares distributions between the simulated scenarios. Surface temperature rise exerts a first-order control on the amount of incremental accumulated thermal energy. Under SSP585, mean accumulated heat is expected to be more than twice that of SSP245 (736 vs. 328 MJ m−2). The groundwater recharge effect is significantly weaker: a change from declining recharge to increasing annual/winter recharge led to almost no difference in mean accumulated heat for SSP245 warming levels, and resulted in a 5 % increase for SSP585, and a slight reduction when steady surface temperatures are assumed.
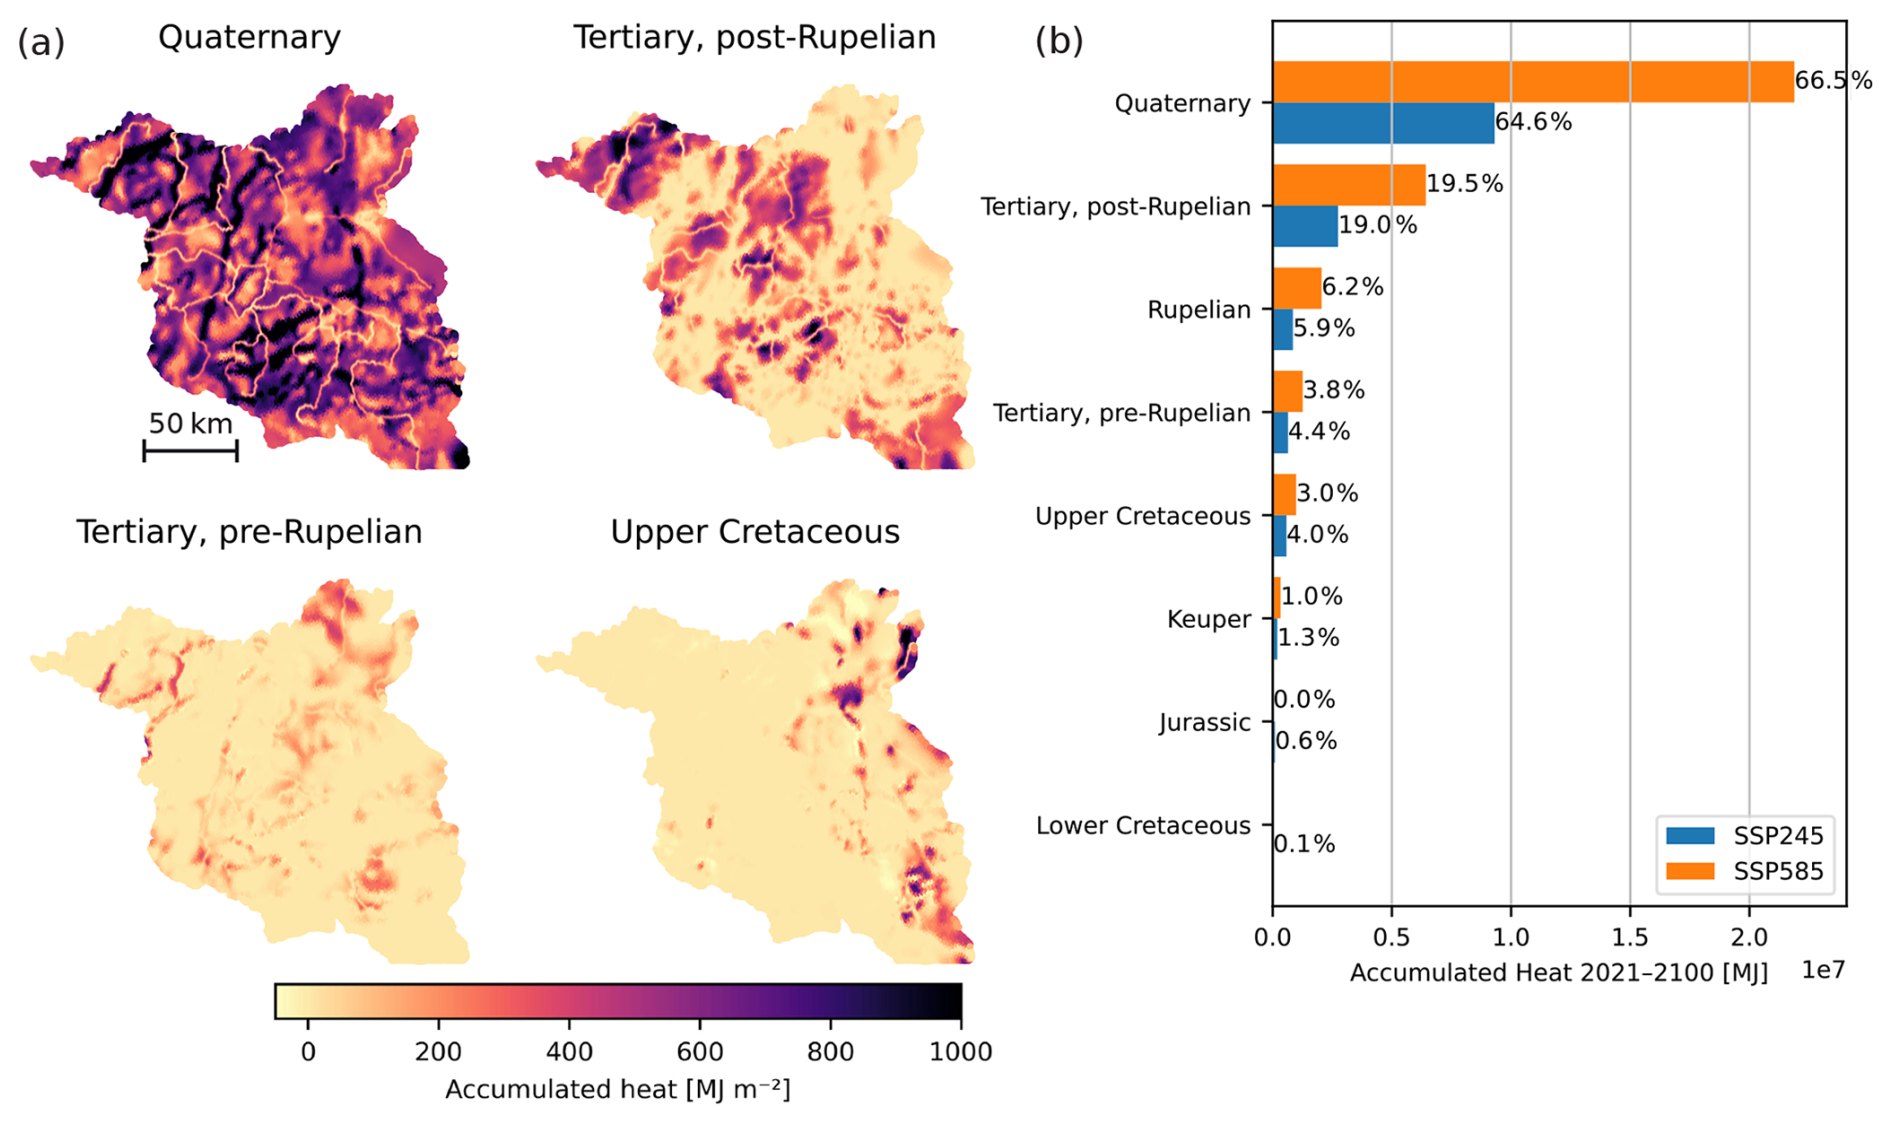
Figure 12Accumulated heat by geological unit between the present and late-century periods: (a) maps for scenario SSP585, (b) comparison between SSP585 and SSP245 with percent labels indicating unit contribution to the total accumulated heat.
Most heat accumulates in the Quaternary unit, with the contribution from other stratigraphic units decreasing with depth (Fig. 12). Within individual units, the spatial distribution of accumulated heat is strongly controlled by the gross thickness variability. In the Quaternary, the largest gains are modeled in thick SW-NE-oriented tunnel valleys. In contrast, the subsurface beneath river valleys does not accumulate much heat, because upward flow and groundwater discharge buffer surface heat transfer. In the post-Rupelian Tertiary unit, the most heat in place is accumulated in the northwest of the study area, consistent with the basin-wide stratigraphic thickening trend. In the pre-Rupelian Tertiary and Upper Cretaceous units, climate-driven heat accumulation is scattered, being tied to areas where the overlying Rupelian aquitard has been eroded, and where the thickness is increased, associated with syn-tectonic sedimentation in rim synclines of Zechstein salt diapirs.
6.1 Intrinsic controls on groundwater dynamics and thermal field
Spatial analysis of the groundwater modeling results presented in Sect. 5 allows us to distinguish several surface and geological domains that have a distinct control on flow and heat transport in the subsurface and, accordingly, portray different feebacks to climate change (Fig. 13). We briefly characterize them below for further referencing in the subsequent discussion.
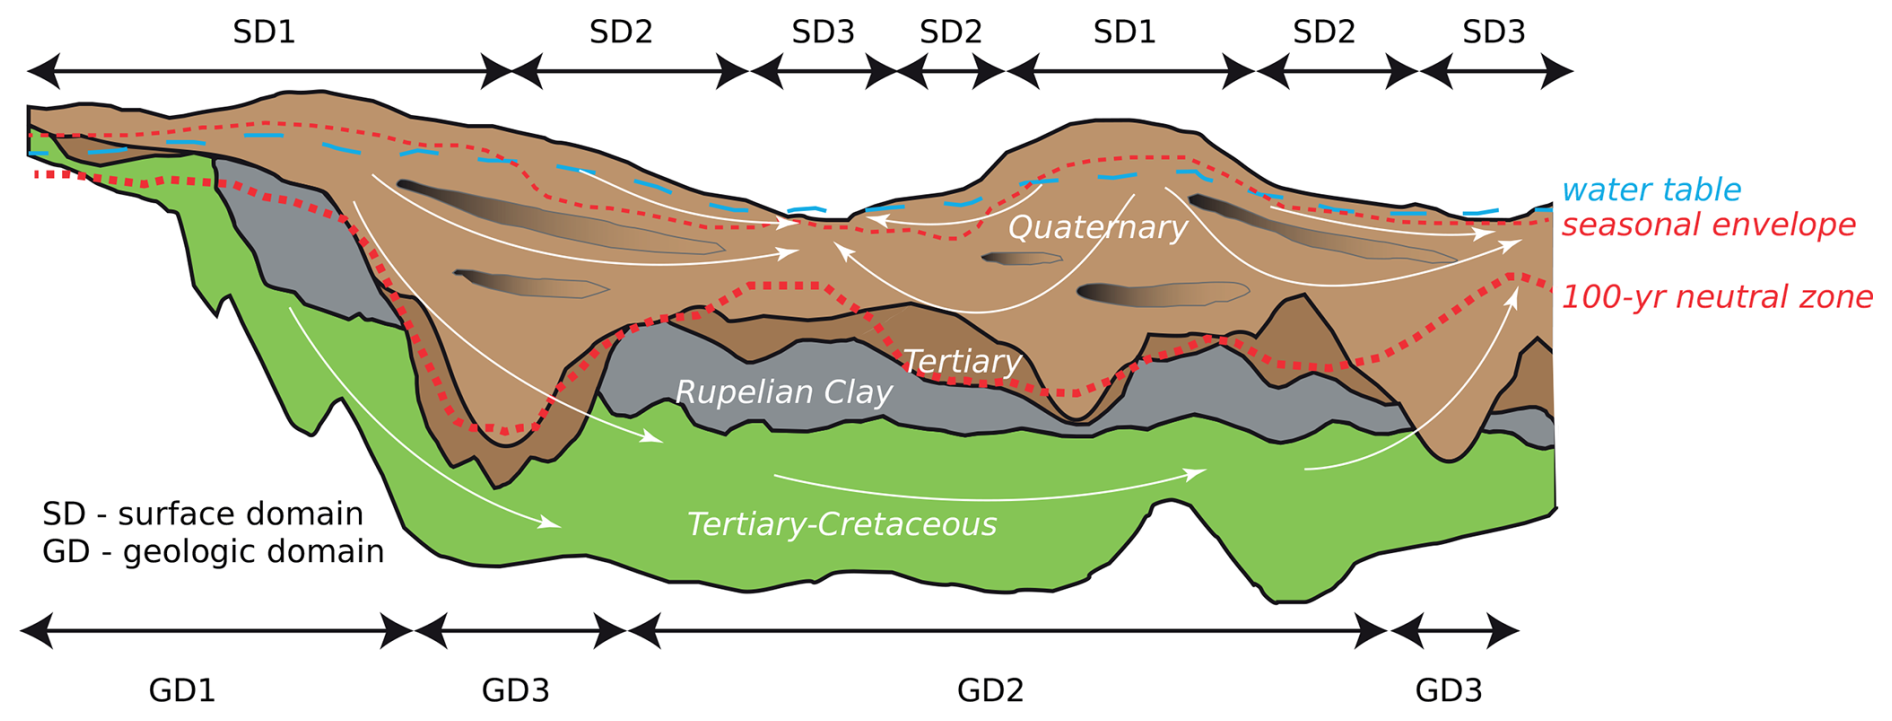
Figure 13Schematic cross-section, illustrating patterns of groundwater flow and the thermal field for different surface and geological domains (see text for the domains description).
Surface domains (SD).
-
SD1 – glacial plateaus, characterized by a thick unsaturated zone (depth to water table >10 m). Annual fluctuations in surface temperature and precipitation are effectively damped before reaching the phreatic zone. Instead, the aquifers respond primarily to inter-annual and long-term climatic perturbations. After reaching the water table, the climate signal may be transmitted by advection laterally but also vertically down to >200 m. Notably, these fluxes are driven not by elevated recharge rates but by steep hydraulic gradients: SD1 is characterized by the highest magnitudes of advective overprinting of the conductive thermal field.
-
SD2 – plateau slopes with a shallow water table (<10 m). A thin unsaturated zone allows both annual and inter-annual recharge and surface temperature fluctuations to reach the unconfined aquifer. Groundwater flow has a strong lateral component, directing the thermal signal from recharge areas toward discharge areas along the flow paths.
-
SD3 – floodplains and river valleys with a water table at or near the surface. Groundwater flow has a distinct upward component. Surface temperature fluctuations, both annual and long-term, are modulated by discharging groundwater. Discharge temperatures depend on the contribution of deeper groundwater, originating at stable temperature depths (if geology allows for such connection). Upward advection leads to relatively higher geothermal gradients.
Geological domains (GD).
-
GD1 – less than 100 m-thick Quaternary, underlain by the Rupelian. In such configuration, the Rupelian Clay acts as both a hydraulic and thermal barrier, isolating pre-Rupelian aquifers from climatic perturbations within the simulated timeframe. Groundwater dynamics is characterized by shallow circulation, with a predominantly lateral flow component towards streams, and a greater sensitivity to recharge variability due to a lower storage.
-
GD2 – 100–500 m-thick Quaternary, underlain by the Rupelian. As such, permeable Quaternary sediments essentially accumulate all the excess heat from surface warming. The temperature disturbance does not reach the Rupelian aquitard within the modeled period.
-
GD3 – 100–500 m-thick Quaternary, incising into the Rupelian. In this configuration, erosional windows allow direct hydraulic connection between the Quaternary aquifers and the deeper formations. The cross-flow direction depends on the spatial relationship with surface domains. If GD3 is found below SD1, surface warming propagates deep into the Tertiary units due to downward advective flux. When GD3 underlies SD3, conditions favor the influence from deep groundwater, e.g., preferential warm water discharge.
6.2 Effects of recharge projections on groundwater dynamics
Changes in groundwater recharge directly affect the storage of unconfined layers. Projected recharge decreases under SSP245 and SSP585 ensembles means cause hydraulic head declines of 0.1–1.8 and 0.5–2.6 m across Brandenburg, respectively (Fig. 7b). To a lesser extent, this result in a reduction of groundwater flux due to a preferential decline of heads on glacial plateaus (SD1) and consequently a lower hydraulic gradient. Beyond this hydrodynamic effect, it remains uncertain which surface domain would experience a greater reduction in net recharge: SD2 and SD3, where groundwater is depleted due to evaporation from the water table and root transpiration (Francke and Heistermann, 2025) or SD1, where thick unsaturated zone accumulates multi-year drought effects (Tsypin et al., 2025a).
In addition to water table elevation, changes in recharge rates have been shown to affect modeled groundwater travel times, flow rates, and stream discharge (Jing et al., 2020; Dams et al., 2012), although there has been no evidence of modifications to the regional flow regime (i.e., groundwater trajectories and catchment boundaries). Our results also indicate that projected recharge changes of −10 % to −20 % only influence hydraulic gradients and advective flux to a limited extent, as compared with stronger impacts due to pumping (Bense et al., 2020; Klepikova et al., 2025).
More fundamental changes in basin-scale flow due to climatic variability would require sustained forcing beyond the 2100 horizon and evaluation of thermo-hydraulic-mechanical interactions. In the absence of long-term climatic projections, modeling such changes over thousands of years to millennia typically relies on synthetic scenarios, often inferred from paleoclimatic trends. Alternating wet-dry climatic cycles may result in amplitudes of GWL fluctuations up to 80 m (Zhou et al., 2020). Emplacement and subsequent retreat of continental ice sheets forces large pressure redistribution that may lead to reorganization or even a reversal of basin-scale groundwater flow (Frick et al., 2022a; Lemieux et al., 2008; Boulton et al., 1996). Simulation of such long-term climatic forcing therefore relies on prescribed transient boundary conditions with sufficient spin-up to account for system memory, while hydraulic and thermal properties are assumed time-invariant.
The sustained decline in heads on plateaus relative to floodplains and river valleys, if exceeds 10–20 m, would approach magnitudes of the local terrain rise (for Brandenburg), being able to modify the basin-wide groundwater dynamics. A reduction of hydraulic gradients leads to a smoother potentiometric surface, which has been shown to suppress local groundwater circulation and enhance regional flow systems (Havril et al., 2018). This is manifested by longer flow paths between areas of recharge and discharge, as the potentiometric surface falls below local drainage levels. To investigate such changes, attention must be given to the assumed density of the river network, since the inclusion of only the highest-order streams tends to enhance the regional flow systems (Haitjema and Mitchell-Bruker, 2005) and influence the resulting advection circulation patterns. Given the likelihood of river network contraction in response to prolonged droughts (Li et al., 2025), discharge dynamics may differ between the present model, which assumes time-invariant river stages (Sect. 3.3) and systems with freely adjusting river stages.
6.3 Effects of recharge projections on the subsurface thermal field
As shown in Sect. 5.3, sustained land surface warming – approximated in the present study by near-surface air temperature – due to influence of groundwater advection is projected to affect groundwater temperatures down to depths of 100–550 m by the end of the century. While the mean depth of penetration depends on the magnitude of imposed surface warming, lateral variations in advection rates can be explained by changes in hydraulic gradients between surface domains and by the hydraulic conductivity distribution, which is controlled by geological domains.
6.3.1 Heat advection
The contrasting sensitivity of surface domains to climate change supports the conclusions of Burns et al. (2017) and Taniguchi (2021) that the thermal response of groundwater to surface warming is amplified in topographically elevated recharge areas (SD1) and buffered in low-lying discharge areas (SD3). Such spatial differentiation in the magnitude of subsurface warming is controlled by the downward and upward components of the regional groundwater flow field, respectively.
Under the same degree of surface warming, the difference in recharge projections becomes a source of advection-driven variability in groundwater temperatures within the meteoric water circulation zone (SSP245 vs. M1, SSP585 vs. M2, M3 vs. M4). However, scenarios with higher total recharge and a higher fraction of winter recharge (M1, M2, M4) did not reveal a reversal or a widespread buffering of the groundwater warming, because recharge temperatures increase concurrently with rising surface temperatures under climate change.
Present-day mean annual recharge temperature is approximately 3 °C lower than surface temperature, since recharge mostly occurs between December and May (Fig. 3c). However, when the effect of global warming is excluded, the isolated effect of further shifting recharge from warm to cold months is only −0.1 to −0.2 °C (Fig. A3).
A higher total recharge transfers more heat to the subsurface in the recharge areas compared with declining recharge scenarios, which becomes more evident under the stronger warming levels, leading to up to 0.4 °C of additional increase locally. Under steady-state conditions, advection-driven “cooling” may reach tens of degrees (Noack et al., 2013). However, in a transient model, subsurface cooling would require an increased advective flux to reach conduction-dominated reservoirs, transporting colder than in situ fluid, despite the parallel effects of surface warming. This is, however, unlikely because subsurface temperatures are more sensitive to changes in surface temperature than to changes in recharge, as inferred from 1-D analytical solutions of advection-diffusion sensitivity to upper boundary conditions (Kurylyk et al., 2017).
Thus, while advection plays a major role in heat transport in the first hundred meters, local enhancements and buffering of the climatic signal spatially compensate each other, irrespective of the recharge trend. This implies that projected changes in advection rates and seasonality have only minor effects on the basin-wide heat budget and can counteract the regional net heat gain from the surface warming only to a limited extent (Fig. 11b).
These findings contrast with the results by Epting et al. (2021), who, in their modeling study of Swiss alluvial aquifers, inferred that under a high-end climate change scenario the cooling effect of increased winter recharge may overcome the warming due to rising surface temperatures. One possible explanation lies in the different hydrogeological conditions between the two study areas: in the study by Epting et al. (2021) groundwater is largely fed from rivers, potentially leading to a more direct response to runoff seasonality. This highlights how such feedback depends on local conditions, such as the type of infiltration (precipitation vs. snowmelt and/or effluent conditions), vadose zone thickness and the presence of preferential flow pathways, and the water table type (recharge-controlled vs. topography-controlled).
6.3.2 Hydraulic conductivity distribution
The downward component of groundwater flow is sensitive to the hydrostratification, particularly to the presence of units impermeable to flow. Regional aquitards force a shift in the dominant heat transport mechanism from advection to conduction and enhance lateral groundwater flow. In our regional model, the penetration depth of the warming signal largely coincides with the first resolved hydraulic barrier, the Rupelian Clay, at depths of 50–500 m, provided it is sufficiently thick. Potential exceptions occur due to the cross-flow through erosional windows in the Rupelian, allowing the global warming signal to reach underlying aquifers within the simulated timeframe (Fig. 12a).
Local-scale models that additionally consider second-order heterogeneities within the Quaternary unit have demonstrated how intermediate aquitards or transitions between reservoir facies further control shallow-to-deep groundwater interactions (manifested, for example, in saltwater upconing) and lateral flow patterns (Chabab et al., 2022; Stackebrandt and Franke, 2015; Baldwin and Sprenger, 2024). This highlights that the degree of heterogeneity resolved by a model, particularly the depth and continuity of the first hydraulic barrier, is an important factor in the simulated extent of the subsurface response to climatic forcing.
6.3.3 Water table elevation
Given that the amplitude of the annual surface temperature cycle remains steady, the depth of the annual thermal envelope responds to changes in groundwater flux in a similar way to the penetration of the long-term warming discussed above. The regional decline of the water table combined with a reduced vertical flux is expected to increase temperature damping at the water table, almost doubling the extent of the unconfined aquifer not subjected to annual variability under SSP585 (Fig. A4). Moreover, a water table decline below a certain level may deactivate the feedback mechanism between groundwater and the land-surface energy fluxes by restraining evapotranspiration from the saturated zone (Maxwell and Kollet, 2008).
Since the impact of evolving surface conditions was simulated in the groundwater model at monthly time steps, this study did not address the influence of the frequency and intensity of extreme precipitation events, which are projected to increase by up to 30 % in the study region (Nguyen et al., 2024; Pfeifer et al., 2021). Whether a reduced diffuse recharge from percolation via the unsaturated zone may enhance the role of heat conduction, yet intermittent extreme precipitation events could still generate rapid preferential flow. Simulating the impact of preferential flow on the heat transport would require adding new physics or discrete elements to the simulation and much shorter, hourly to daily time steps (Beven and Germann, 2013).
6.4 Implications for geothermal energy utilization
We have demonstrated that SSP245 and SSP585 scenarios lead to a mean net increase of 330 and 740 MJ m−2 of stored thermal energy in the studied aquifers between the present and late-century periods, respectively (Fig. 11). The estimated accumulated heat in the upper 100 m amounts to 180–380 MJ m−2, which is comparable to the 130–250 MJ m−2 projected by Benz et al. (2024) for the same region as part of their global assessment. Further refinement of heat density distribution could be achieved by considering facies heterogeneity and accounting only for net reservoir volume within stratigraphic units (Frick et al., 2022b).
The accumulated thermal energy has the potential to be recycled in shallow geothermal systems, such as GSHP or borehole thermal energy storage (BTES). In the target installation interval between the water table and the depth of 100 m, our model predicts a mean increase of 1.5 °C for SSP585 (0.8 °C for SSP245). While current rates of the subsurface warming still require further validation against long-term observational time-series (Sect. 5.1), the projected accumulated heat could correspond to several months to a year of space-heating demand for a single household in Germany (Odyssee-Mure, 2024).
In urban environments, waste heat may contribute 40 %–50 % more to the accumulated subsurface heat compared to natural settings (Menberg et al., 2013; Rivera et al., 2017; Bayer et al., 2016). Surface temperature in the Berlin metropolitan area is up to 3 °C higher than in predominantly rural Brandenburg, leading to an incremental heat accumulation below the city (SenStadt, 2020; Tsypin et al., 2024). The assigned surface temperature BC for our study was assumed uniform in space. A potential effect of the additional variability associated with the urban heat island effect and a surface sealing is shown in Appendix B.
Despite aquifer net heat gains projected regionally, at a site-specific scale climate change and urbanization can degrade the performance of open systems, such as LT-ATES: increased cooling demand in summer would result in a disproportional expansion of the warm plume, leading to a strong decline in cold well performance, driven by a mismatch between injection and production rates (Godinaud et al., 2025). Aquifers with high ambient groundwater velocities ( m s−1) pose a risk for additional thermal energy losses in ATES systems due to groundwater displacement (Bloemendal and Hartog, 2018), while in closed systems, such as GSHP, elevated groundwater fluxes above m s−1 typically enhance subsurface heat exchange capacity, helping to sustain operating temperatures (Abesser et al., 2023). Over a typical 30-year lifespan of shallow geothermal installations, ambient groundwater flux may change by ±10 %, depending on the recharge scenario.
These regional-scale predictions point to the relevance of including transient surface temperature and recharge BC when modeling a system performance during the design phase to account for the potential impact of climate evolution under specific local settings.
We investigated the joint effects of surface warming and evolving recharge patterns on regional groundwater dynamics and subsurface heat transport in a temperate, low-relief, post-glacial setting of north-central Europe. The advantage of testing these effects with regional groundwater models is the ability to simulate complex 3-D flow patterns emerging from the interplay of topographic gradients and a heterogeneous permeability field.
Active shallow groundwater circulation in Quaternary fluvioglacial deposits is responsible for a deeper propagation of the surface warming signal on glacial plateaus, while buffering climatic impacts in floodplains and river valleys. The first regional aquitard imposes the lower limit on downward advective heat transport, except where it is eroded.
The magnitude of groundwater temperature increase depends primarily on the global warming levels: the mean sensitivity to surface temperature scenario is approximately 1.4 °C at the water table, while the difference between recharge scenarios contributes up to 0.4 °C between the present (2002–2021) and late-century (2081–2100) periods. A projected late-century decrease in annual recharge of 10 %–20 % or even a hypothetical increase in the share of colder winter recharge has no capacity to reverse the ongoing groundwater warming trend. A decrease of vertical groundwater flux may locally buffer the progradation of the surface warming, however this will have minimal net effect on the total accumulated subsurface heat due to the long-term counterbalance of advective effects in recharge versus discharge zones. Related to this is a projected decline in hydraulic heads of up to 2–5 m under SSP585, leading to greater damping of the seasonal temperature fluctuations at the water table.
While global-scale assessments focus on conductive surface-groundwater heat exchange, local differences in hydraulic gradients can significantly modulate spatial patterns of subsurface warming. Repeated temperature logs are rarely able to test variations between recharge and discharge areas, or they are acquired in urban areas where recharge effects are hindered. Extending monitoring networks to link groundwater warming with landscape hydrology can help to advance field evidence of the coupled effects discussed in this study.
Our study suggests that while future recharge rates will undoubtedly have direct implications on groundwater availability, they should also be taken into account when assessing the shallow geothermal potential and temperature-dependent ecosystems under climate change.
Table A1Hydraulic and thermal properties of the groundwater model units: K: hydraulic conductivity, φ: porosity, Sy: specific yield, Ss: specific storage, C: volumetric heat capacity, λ: thermal conductivity, and Qr: heat production. Properties were kept identical across scenarios to isolate climatic controls and were taken from previous studies (Scheck and Bayer, 1999; Noack et al., 2013) except Quaternary and post-Rupelian Tertiary units, which were subject to calibration.
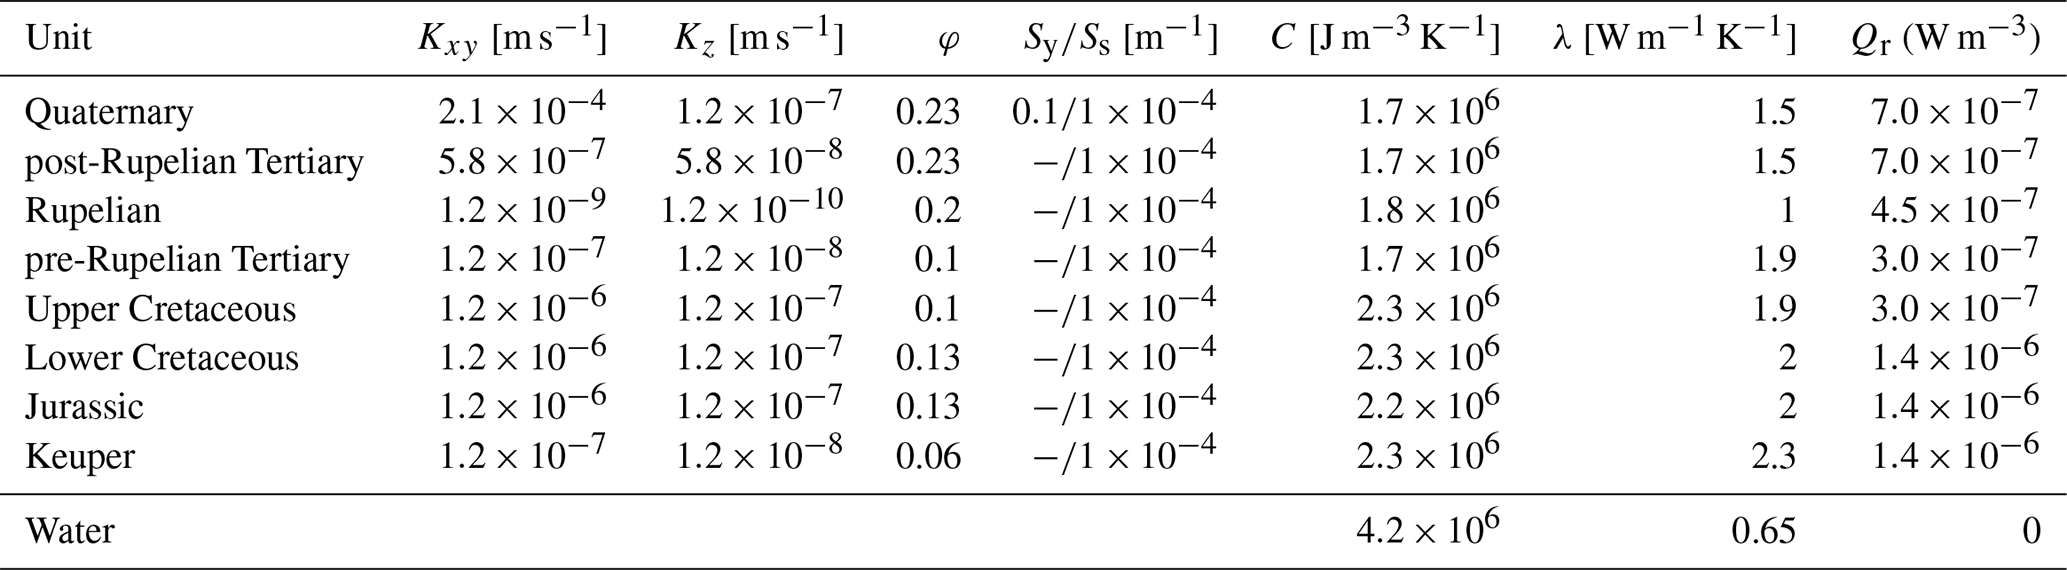
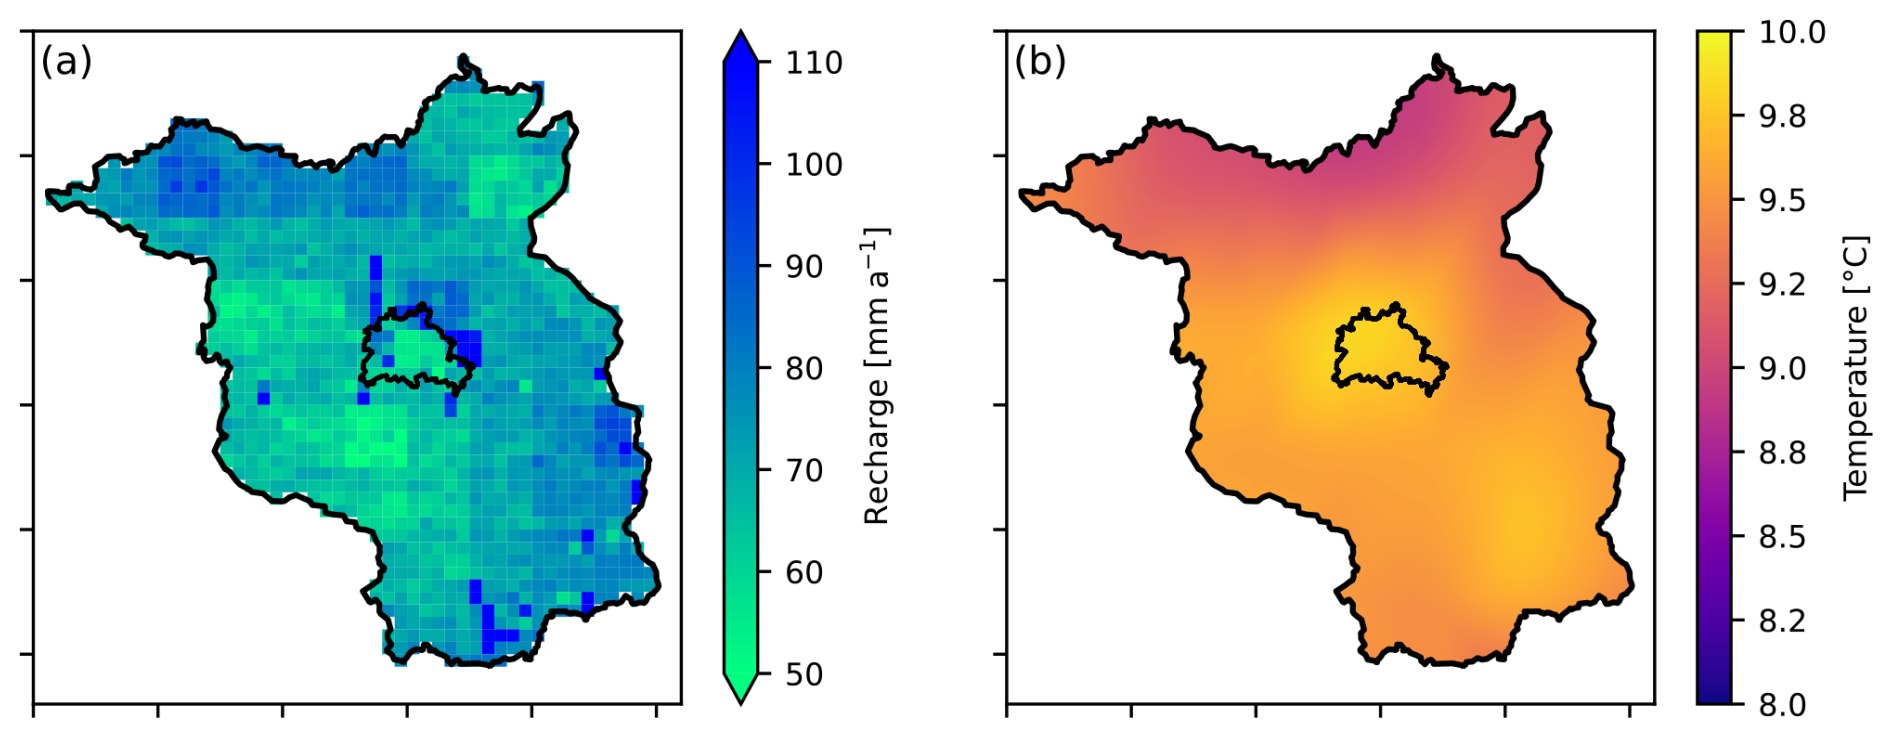
Figure A1Variability of groundwater recharge and near-surface air temperature across the study area for the present period.
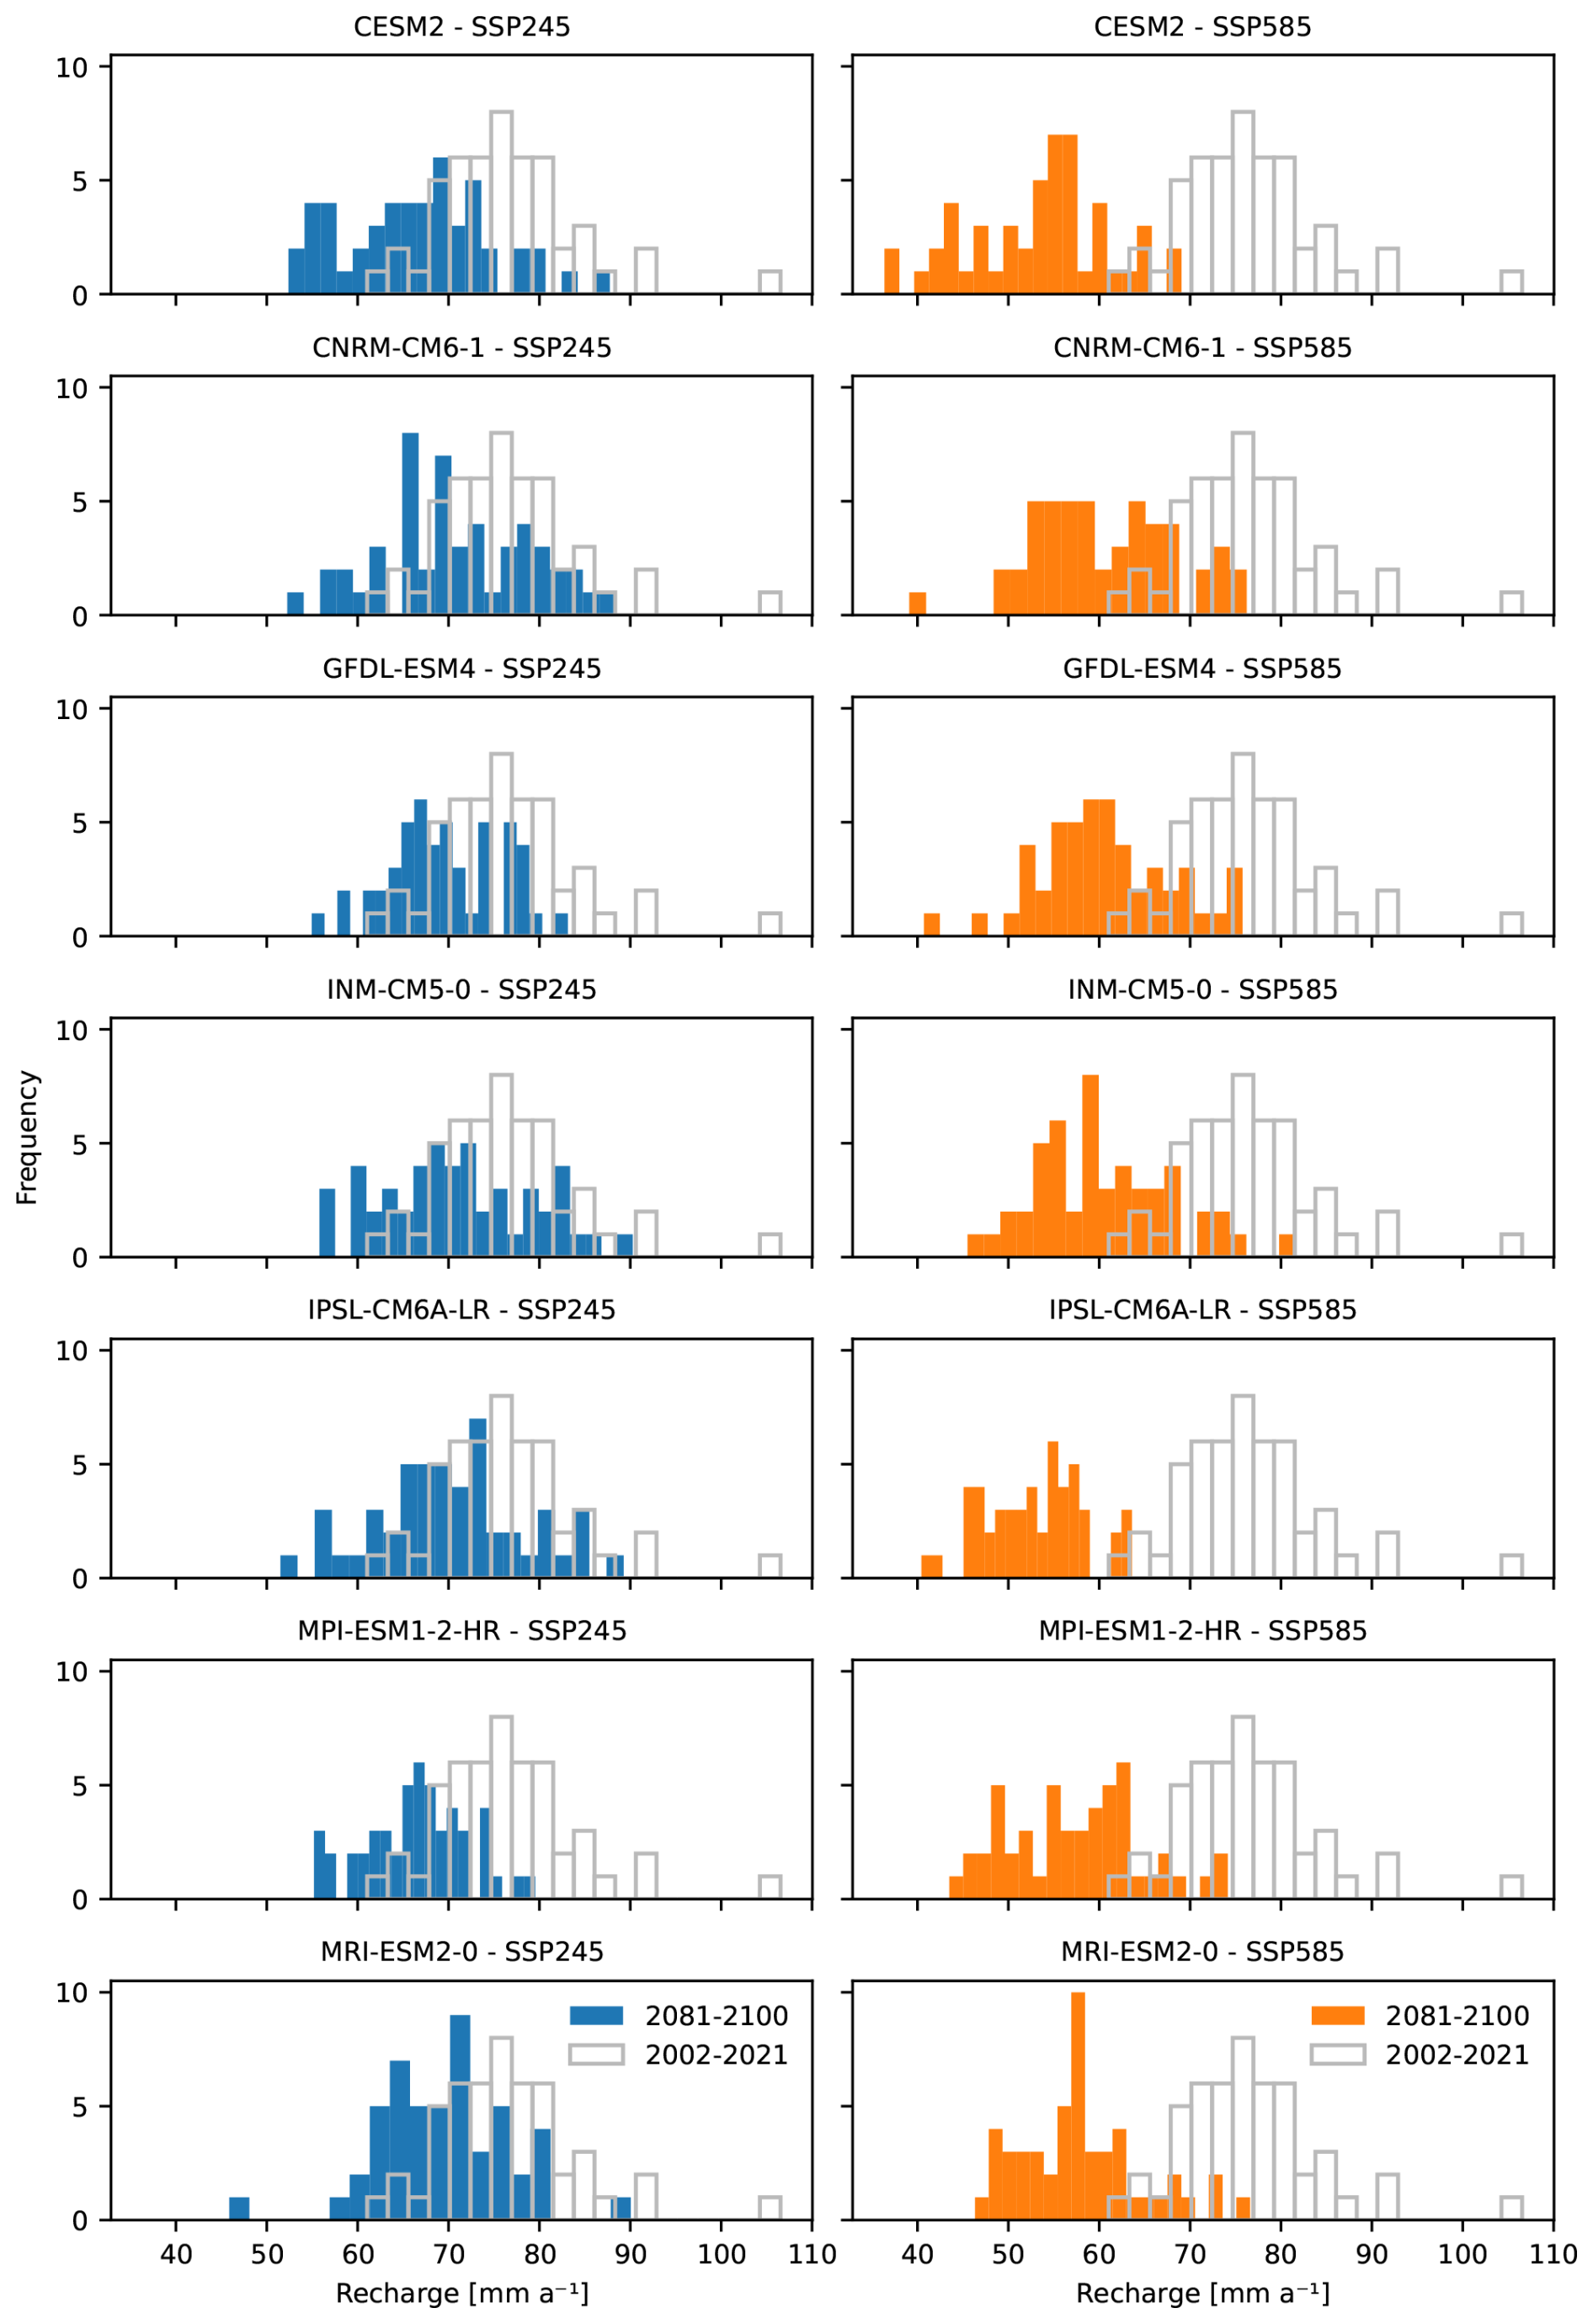
Figure A2Histograms of mean annual recharge for Brandenburg, showing the distribution of 50 nsRWG realizations between the present and late-century periods for each GCM. Left: SSP245; right: SSP585.
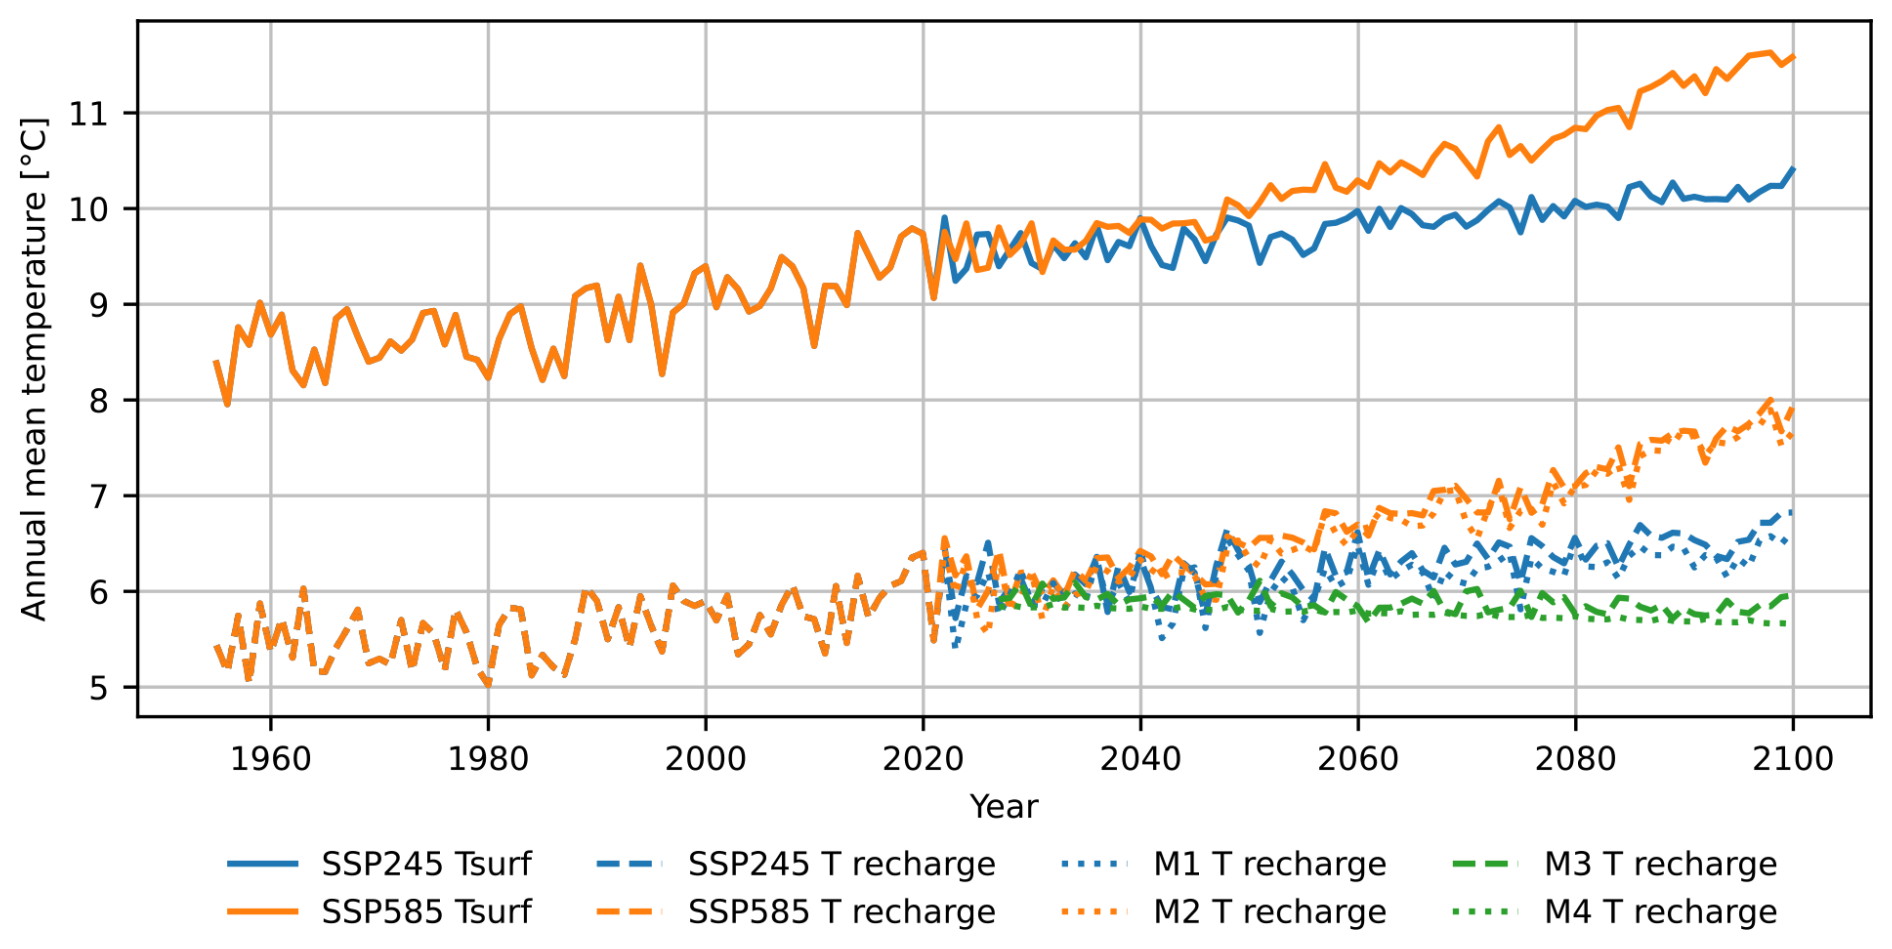
Figure A3Comparison between mean surface temperature and recharge temperatures, with the latter derived as a weighted average of monthly surface temperatures by groundwater recharge rate.
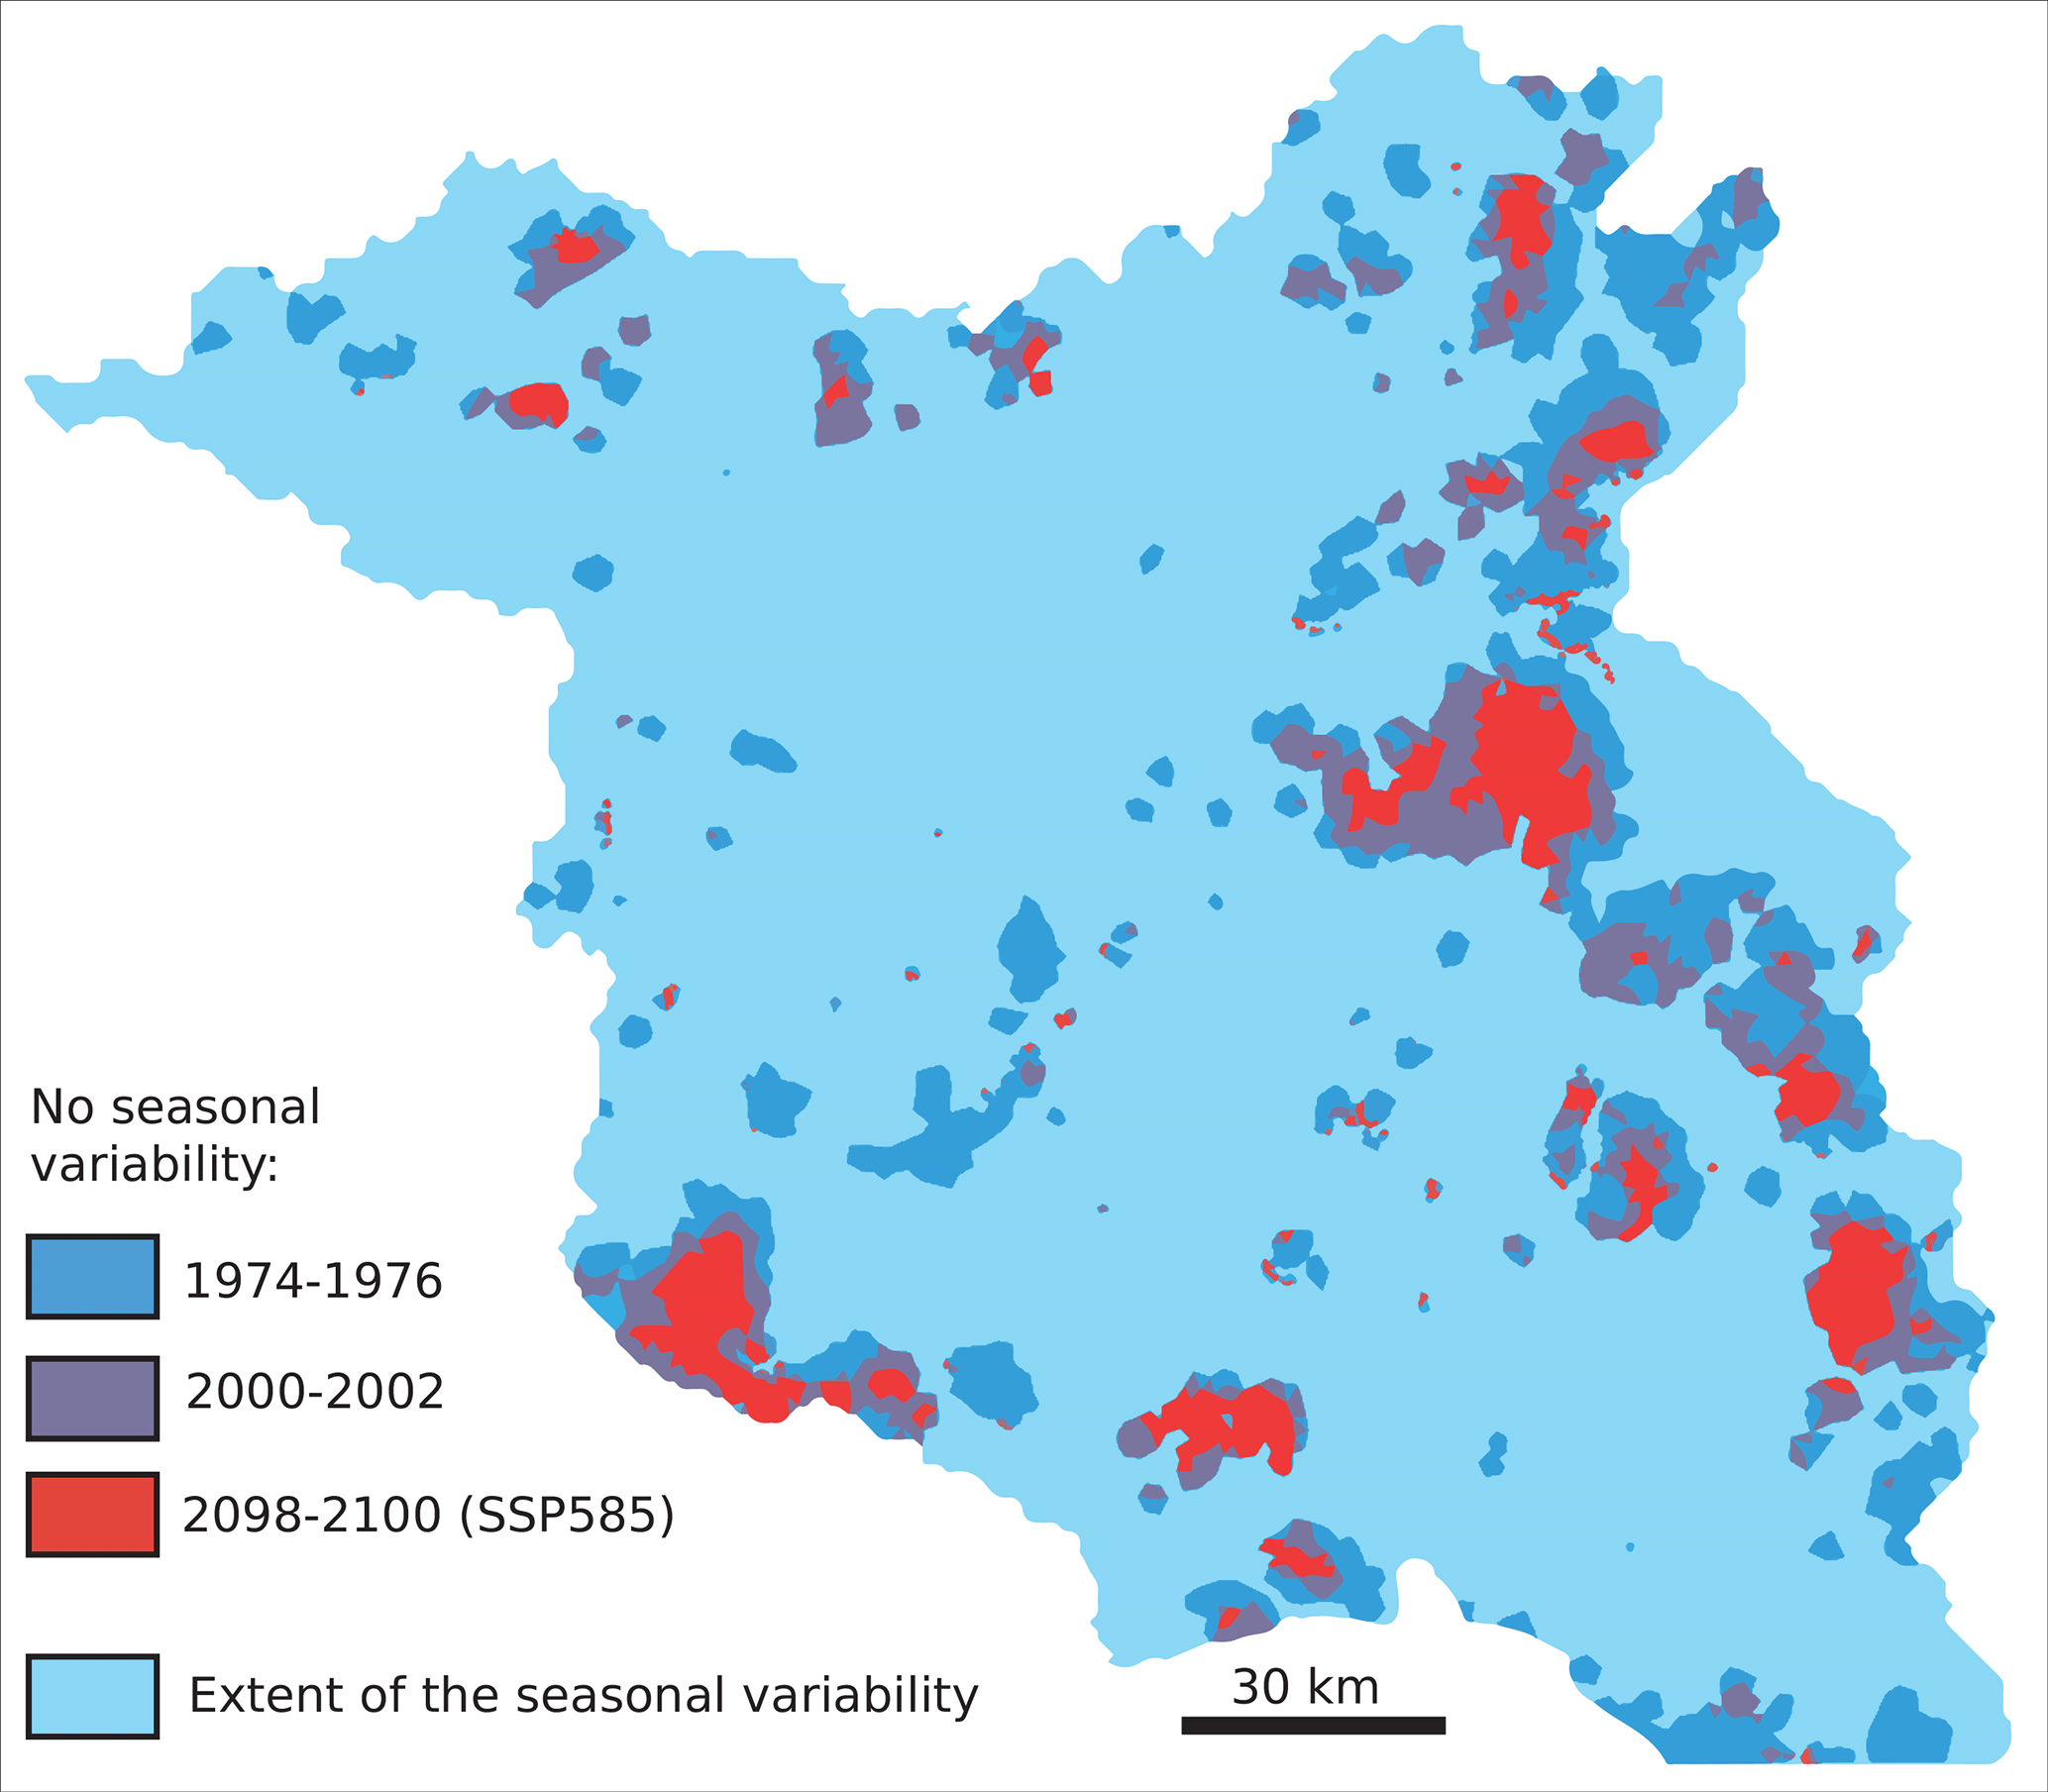
Figure A4Extent of seasonal temperature damping at the water table during three periods. As a threshold for damping, we used a magnitude of temperature fluctuations <1 °C.
Urban environments exhibit distinct peculiarities in their shallow subsurface PT field due to excess heat from the urban climate and infrastructure, extensive surface sealing, altered soil structure, and controlled water levels. Although the study area is predominantly rural, with agricultural and natural land cover, approximately 4 % is occupied by the city of Berlin with the artificial land cover.
Most of the repeated vertical temperature profiles suitable for model validation were obtained within the city limits. The measurements obtained over the past four decades showcase a reversal of the geothermal gradient, associated with the anthropogenic warming (Fig. B1). In the study area, an inflection point, where the temperature gradient shifts from negative to positive, commonly occurs at 60–70 m depth. The maximum depth of the recorded subsurface temperature increase occurs at 90–120 m (SenStadt, 2020). The shape of the temperature profiles indicates gradual, conduction-dominated groundwater warming with low advection rates due to low percolation rates and enhanced surface heating. We conducted a sensitivity realization in the groundwater model by locally adjusting BCs and calibrating model properties within the urban domain. The following modifications were assumed for the model inputs:
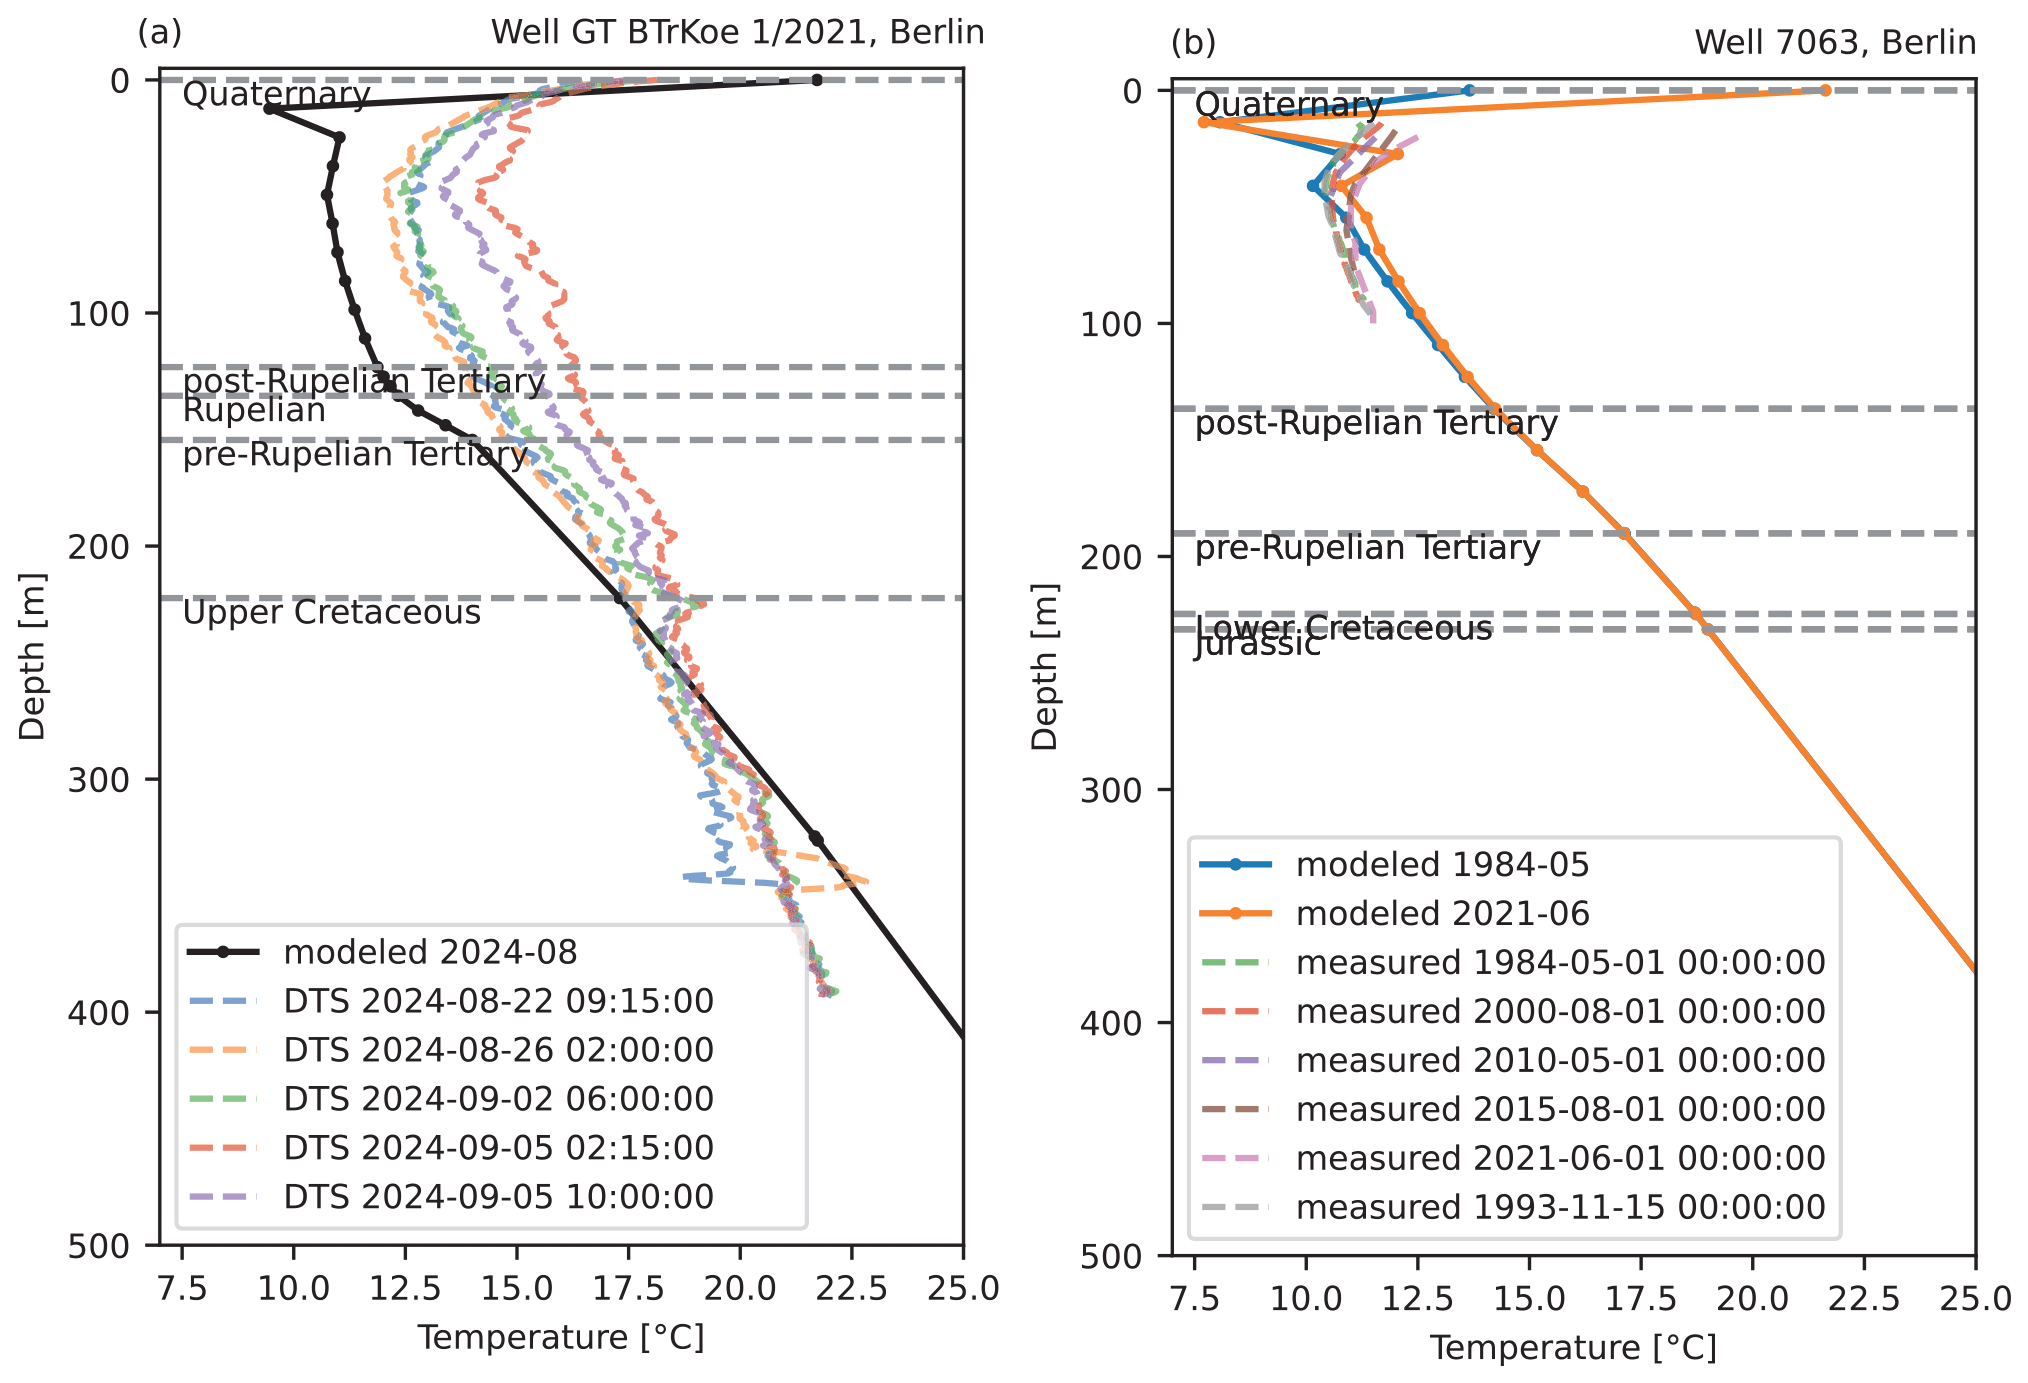
Figure B1Comparison between the simulated depth-temperature profile (solid line) and (a) distributed temperature sensing (DTS) fiber-optic cable measurements in the ATES research well in Adlershof, Berlin and (b) temperature logging in a monitoring well in Neukölln, Berlin (dashed lines). Temperature difference in repeated DTS profiles result from a cementation job and other technical interferences. Marked geological units are derived from the geological model. Measured data is taken from Pei et al. (2024), Singer (2025), and SenStadt (2020).
-
surface temperature forcing adjusted to reach a mean annual temperature of +11.1 °C by 2024, compared to +9.7 °C for the entire study area;
-
groundwater recharge reduced by a factor of 10 to represent high surface sealing;
-
Quaternary permeability in selected layers reduced by a factor of 100 to represent intermediate aquitards.
This model scenario was simulated for the period 1955–2024. Modeled 1-D temperature profiles demonstrate overall good consistency with the measured data in the depth of the inflection point and penetration of long-term thermal disturbance (Fig. B1). Lower absolute temperatures relative to Distributed Temperature Sensing (DTS) data can be due to local heat sources and DTS interpretation uncertainty.
Overall, this sensitivity scenario confirms higher historical rates of warming within the subsurface urban heat island under conditions of impeded recharge and additional heat inputs. Such a trend presents both an opportunity for waste heat recovery and a risk to groundwater quality and replenishment. Further improvement in reproducing the absolute magnitude of subsurface warming would require development of localized models with refined geological structure, parametrization, and a higher mesh resolution.
Mesoscale Hydrologic Model – mHM source code can be openly accessed via https://doi.org/10.5281/zenodo.8279545 (Samaniego et al., 2023).
The simulated nsRWG weather forcings, values of recharge, groundwater heads, and temperatures are available for download via associated data publication (https://doi.org/10.5880/GFZ.CUEG.2025.001; Tsypin et al., 2025b).
MT, VDN, and MC conceptualized the study and developed the methodology, with further contributions from GB and EL. VDN conducted weather generator and hydrologic model simulations. MT carried out groundwater modeling, performed the formal analysis, and prepared the visualization. MSW and CK provided supervision. MT prepared the original draft of the manuscript, with all co-authors contributing to the review and editing.
The contact author has declared that none of the authors has any competing interests.
Publisher's note: Copernicus Publications remains neutral with regard to jurisdictional claims made in the text, published maps, institutional affiliations, or any other geographical representation in this paper. The authors bear the ultimate responsibility for providing appropriate place names. Views expressed in the text are those of the authors and do not necessarily reflect the views of the publisher.
This work utilized high-performance computing resources made possible by funding from the Ministry of Science, Research and Culture of the State of Brandenburg (MWFK) and are operated by the IT Services and Operations unit of the Helmholtz Centre Potsdam. An academic license for FEFLOW software was kindly provided by DHI A/G. The style and grammar of the manuscript were improved using AI tools (OpenAI, Perplexity AI).
The authors would like to thank Andreas Güntner, Mark Grmek, and Alan Yu for their valuable discussions.
MT received financial support for the research and publication of this article from GFZ Helmholtz Centre for Geosciences. Open Access funding enabled and organized by Project DEAL. VDN was supported by the German Federal Ministry of Education and Research (projects 01LP1903E and 01LP2324E) within the ClimXtreme network (FONA3).
The article processing charges for this open-access publication were covered by the GFZ Helmholtz Centre for Geosciences.
This paper was edited by Gabriel Rau and reviewed by three anonymous referees.
Abesser, C., Schincariol, R. A., Raymond, J., García-Gil, A., Drysdale, R., Piatek, A., Giordano, N., Jaziri, N., and Molson, J.: Case Studies of Geothermal System Response to Perturbations in Groundwater Flow and Thermal Regimes, Groundwater, 61, 255–273, https://doi.org/10.1111/gwat.13086, 2023.
Alencar, P. H. L., Arndt, S., Namba, K., Somogyvári, M., Bart, F., Brill, F., Dueñas, J. F., Feindt, P., Johnson, D., Mahmoodi, N., Merz, C., Mukherjee, S., Nissen, K., Paton, E. N., Sauter, T., Tetzlaff, D., Tügel, F., Vogelpohl, T., Vulova, S. V., Zamani, B., and Zhang, H. H.: Brief communication: What do we need to know? Ten questions about climate and water challenges in Berlin-Brandenburg, Nat. Hazards Earth Syst. Sci., 25, 4043–4051, https://doi.org/10.5194/nhess-25-4043-2025, 2025.
Anderson, M. P.: Heat as a Ground Water Tracer, Groundwater, 43, 951–968, https://doi.org/10.1111/j.1745-6584.2005.00052.x, 2005.
Bachu, S.: Analysis of heat transfer processes and geothermal pattern in the Alberta Basin, Canada, J. Geophys. Res.-Sol. Ea., 93, 7767–7781, https://doi.org/10.1029/JB093iB07p07767, 1988.
Baldwin, D. and Sprenger, C.: Simplified model of a two-layer aquifer system under stress of geogenic groundwater salinization, Kompetenzzentrum Wasser Berlin gGmbH, https://www.kompetenz-wasser.de/de/forschung/publikationen/simplified-model-of-a-two-layer-aquifer-system-under-stress-of-geogenic-groundwater-salinization (last access: 20 March 2026), 2024.
Bayer, P., Rivera, J. A., Schweizer, D., Schärli, U., Blum, P., and Rybach, L.: Extracting past atmospheric warming and urban heating effects from borehole temperature profiles, Geothermics, 64, 289–299, https://doi.org/10.1016/j.geothermics.2016.06.011, 2016.
Bense, V. F. and Kurylyk, B. L.: Tracking the Subsurface Signal of Decadal Climate Warming to Quantify Vertical Groundwater Flow Rates, Geophys. Res. Lett., 44, 12244-12253, https://doi.org/10.1002/2017GL076015, 2017.
Bense, V. F., Kurylyk, B. L., van Daal, J., van der Ploeg, M. J., and Carey, S. K.: Interpreting Repeated Temperature-Depth Profiles for Groundwater Flow, Water Resour. Res., 53, 8639–8647, https://doi.org/10.1002/2017WR021496, 2017.
Bense, V. F., Kurylyk, B. L., de Bruin, J. G. H., and Visser, P.: Repeated Subsurface Thermal Profiling to Reveal Temporal Variability in Deep Groundwater Flow Conditions, Water Resour. Res., 56, e2019WR026913, https://doi.org/10.1029/2019WR026913, 2020.
Benz, S. A., Irvine, D. J., Rau, G. C., Bayer, P., Menberg, K., Blum, P., Jamieson, R. C., Griebler, C., and Kurylyk, B. L.: Global groundwater warming due to climate change, Nat. Geosci., 17, 545–551, https://doi.org/10.1038/s41561-024-01453-x, 2024.
Berghuijs, W. R., Collenteur, R. A., Jasechko, S., Jaramillo, F., Luijendijk, E., Moeck, C., van der Velde, Y., and Allen, S. T.: Groundwater recharge is sensitive to changing long-term aridity, Nat. Clim. Change, 14, 357–363, https://doi.org/10.1038/s41558-024-01953-z, 2024.
Beven, K. and Germann, P.: Macropores and water flow in soils revisited, Water Resour. Res., 49, 3071–3092, https://doi.org/10.1002/wrcr.20156, 2013.
Bloemendal, M. and Hartog, N.: Analysis of the impact of storage conditions on the thermal recovery efficiency of low-temperature ATES systems, Geothermics, 71, 306–319, https://doi.org/10.1016/j.geothermics.2017.10.009, 2018.
Boulton, G. S., Caban, P. E., van Gijssel, K., Leijnse, A., Punkari, M., and van Weert, F. H. A.: The impact of glaciation on the groundwater regime of Northwest Europe, Global Planet. Change, 12, 397–413, https://doi.org/10.1016/0921-8181(95)00030-5, 1996.
Bredehoeft, J. D. and Papadopulos, I. S.: Rates of vertical groundwater movement estimated from the Earth's thermal profile, Water Resour. Res., 1, 325–328, https://doi.org/10.1029/WR001i002p00325, 1965.
Brill, F., Alencar, P. H. L., Zhang, H., Boeing, F., Hüttel, S., and Lakes, T.: Exploring drought hazard, vulnerability, and related impacts on agriculture in Brandenburg, Nat. Hazards Earth Syst. Sci., 24, 4237–4265, https://doi.org/10.5194/nhess-24-4237-2024, 2024.
Bruhn, D. K. S., Regenspurg, S., and Schumann, F.: Wärmeversorgung in Berlin und Brandenburg durch Geoenergie, Position Paper, https://www.gfz-potsdam.de/fileadmin/gfz/sec48/pdf/de/Netzwerke/GEB/Posititionspapier_GEB__2.pdf (last access: 22 March 2026), 2023.
Brunner, L., Pendergrass, A. G., Lehner, F., Merrifield, A. L., Lorenz, R., and Knutti, R.: Reduced global warming from CMIP6 projections when weighting models by performance and independence, Earth Syst. Dynam., 11, 995–1012, https://doi.org/10.5194/esd-11-995-2020, 2020.
Burns, E. R., Zhu, Y., Zhan, H., Manga, M., Williams, C. F., Ingebritsen, S. E., and Dunham, J. B.: Thermal effect of climate change on groundwater-fed ecosystems, Water Resour. Res., 53, 3341–3351, https://doi.org/10.1002/2016WR020007, 2017.
Chabab, E., Kühn, M., and Kempka, T.: Upwelling mechanisms of deep saline waters via Quaternary erosion windows considering varying hydrogeological boundary conditions, Adv. Geosci., 58, 47–54, https://doi.org/10.5194/adgeo-58-47-2022, 2022.
Cornes, R. C., van der Schrier, G., van den Besselaar, E. J. M., and Jones, P. D.: An Ensemble Version of the E-OBS Temperature and Precipitation Data Sets, J. Geophys. Res.-Atmos., 123, 9391–9409, https://doi.org/10.1029/2017JD028200, 2018.
Cuthbert, M. O., Taylor, R. G., Favreau, G., Todd, M. C., Shamsudduha, M., Villholth, K. G., MacDonald, A. M., Scanlon, B. R., Kotchoni, D. O. V., Vouillamoz, J.-M., Lawson, F. M. A., Adjomayi, P. A., Kashaigili, J., Seddon, D., Sorensen, J. P. R., Ebrahim, G. Y., Owor, M., Nyenje, P. M., Nazoumou, Y., Goni, I., Ousmane, B. I., Sibanda, T., Ascott, M. J., Macdonald, D. M. J., Agyekum, W., Koussoubé, Y., Wanke, H., Kim, H., Wada, Y., Lo, M.-H., Oki, T., and Kukuric, N.: Observed controls on resilience of groundwater to climate variability in sub-Saharan Africa, Nature, 572, 230–234, https://doi.org/10.1038/s41586-019-1441-7, 2019.
Dams, J., Salvadore, E., Van Daele, T., Ntegeka, V., Willems, P., and Batelaan, O.: Spatio-temporal impact of climate change on the groundwater system, Hydrol. Earth Syst. Sci., 16, 1517–1531, https://doi.org/10.5194/hess-16-1517-2012, 2012.
Deming, D., Sass, J. H., Lachenbruch, A. H., and De Rito, R. F.: Heat flow and subsurface temperature as evidence for basin-scale ground-water flow, North Slope of Alaska, GSA Bulletin, 104, 528–542, https://doi.org/10.1130/0016-7606(1992)104<0528:Hfasta>2.3.Co;2, 1992.
Desai, C. S. and Li, G. C.: A residual flow procedure and application for free surface flow in porous media, Adv. Water Resour., 6, 27–35, https://doi.org/10.1016/0309-1708(83)90076-3, 1983.
DeutscherWetterDienst – Climate Data Center: Grids of monthly averaged daily air temperature (2 m) over Germany, version v1.0, https://opendata.dwd.de/climate_environment/CDC/ (last access: 22 March 2026), 2021.
Diersch, H.-J. G.: FEFLOW: finite element modeling of flow, mass and heat transport in porous and fractured media, 1, Springer Science & Business Media, https://doi.org/10.1007/978-3-642-38739-5, 2013.
Doherty, J.: Calibration and uncertainty analysis for complex environmental models, Watermark Numerical Computing, ISBN 978-0-9943786-1-3, 2015.
Epting, J., Michel, A., Affolter, A., and Huggenberger, P.: Climate change effects on groundwater recharge and temperatures in Swiss alluvial aquifers, J. Hydrol. X, 11, 100071, https://doi.org/10.1016/j.hydroa.2020.100071, 2021.
Eyring, V., Bony, S., Meehl, G. A., Senior, C. A., Stevens, B., Stouffer, R. J., and Taylor, K. E.: Overview of the Coupled Model Intercomparison Project Phase 6 (CMIP6) experimental design and organization, Geosci. Model Dev., 9, 1937–1958, https://doi.org/10.5194/gmd-9-1937-2016, 2016.
Förster, A.: Analysis of borehole temperature data in the Northeast German Basin: continuous logs versus bottom-hole temperatures, Petroleum Geoscience, 7, 241–254, https://doi.org/10.1144/petgeo.7.3.241, 2001.
Francke, T. and Heistermann, M.: Groundwater recharge in Brandenburg is declining – but why?, Nat. Hazards Earth Syst. Sci., 25, 2783–2802, https://doi.org/10.5194/nhess-25-2783-2025, 2025.
Frick, M., Cacace, M., Klemann, V., Tarasov, L., and Scheck-Wenderoth, M.: Hydrogeologic and Thermal Effects of Glaciations on the Intracontinental Basins in Central and Northern Europe, Front. Water, 4, https://doi.org/10.3389/frwa.2022.818469, 2022a.
Frick, M., Kranz, S., Norden, B., Bruhn, D., and Fuchs, S.: Geothermal Resources and ATES Potential of Mesozoic Reservoirs in the North German Basin, Energies, 15, 1980, https://doi.org/10.3390/en15061980, 2022b.
Fuchs, S., Förster, A., and Norden, B.: Evaluation of the terrestrial heat flow in Germany: A case study for the reassessment of global continental heat-flow data, Earth-Sci. Rev., 235, 104231, https://doi.org/10.1016/j.earscirev.2022.104231, 2022.
GERICS – Climate-Service Center Germany: Klima-Ausblick Brandenburg, Hamburg, https://www.climate-service-center.de/products_and_publications/fact_sheets/climate_fact_sheets/detail/080919/index.php.de (last access: 21 March 2026), 2019.
Goderniaux, P., Brouyère, S., Blenkinsop, S., Burton, A., Fowler, H. J., Orban, P., and Dassargues, A.: Modeling climate change impacts on groundwater resources using transient stochastic climatic scenarios, Water Resour. Res., 47, https://doi.org/10.1029/2010WR010082, 2011.
Godinaud, J., Pryet, A., Bayer, P., and Larroque, F.: Impact of land cover and climate change on Aquifer Thermal and Energy Storage (ATES) system performance, Geothermics, 127, 103262, https://doi.org/10.1016/j.geothermics.2025.103262, 2025.
Gosling, S. N., Taylor, R. G., Arnell, N. W., and Todd, M. C.: A comparative analysis of projected impacts of climate change on river runoff from global and catchment-scale hydrological models, Hydrol. Earth Syst. Sci., 15, 279–294, https://doi.org/10.5194/hess-15-279-2011, 2011.
Güntner, A., Sharifi, E., Behzadpour, S., Boergens, E., Dahle, C., Darbeheshti, N., Dobslaw, H., Dorigo, W., Dussailant, I., Flechtner, F., Haas, J., Jäggi, A., Kidd, R., Kosmale, M., Kvas, A., Luojus, K., Mayer-Gürr, T., Meyer, U., Pasik, A., Paul, F., Pedinotti, V., Preimesberger, W., Ruz Vargas, C., Vayre, M., and Zemp, M.: Global Gravity-based Groundwater Product (G3P), V. 1.11, GFZ Data Services [data set], https://doi.org/10.5880/G3P.2023.001, 2023.
Guse, B., Han, L., Kumar, R., Rakovec, O., Luedtke, S., Herzog, A., Thober, S., Samaniego, L., and Wagener, T.: Spatio-Temporal Consistency and Variability in Parameter Dominance on Simulated Hydrological Fluxes and State Variables, Water Resour. Res., 60, e2023WR036822, https://doi.org/10.1029/2023WR036822, 2024.
Haitjema, H. M. and Mitchell-Bruker, S.: Are Water Tables a Subdued Replica of the Topography?, Groundwater, 43, 781–786, https://doi.org/10.1111/j.1745-6584.2005.00090.x, 2005.
Han, L., Merz, B., Nguyen, V. D., Guse, B., Samaniego, L., Schröter, K., and Vorogushyn, S.: Recombining past event precipitation and antecedent catchment states generates unprecedented floods, Commun. Earth Environ., 6, 692, https://doi.org/10.1038/s43247-025-02691-6, 2025.
Hargreaves, G. and Samani, Z.: Reference Crop Evapotranspiration from Temperature, Applied Engineering in Agriculture, 1, 96–99, https://doi.org/10.13031/2013.26773, 1985.
Hattermann, F. F., Post, J., Krysanova, V., Conradt, T., and Wechsung, F.: Assessment of water availability in a Central-European River Basin (Elbe) under climate change, Advances in Climate Change Research, 4, 42, https://www.climatechange.cn/EN/abstract/abstract182.shtml (last access: 24 March 2026), 2008.
Havril, T., Tóth, Á., Molson, J. W., Galsa, A., and Mádl-Szőnyi, J.: Impacts of predicted climate change on groundwater flow systems: Can wetlands disappear due to recharge reduction?, J. Hydrol., 563, 1169–1180, https://doi.org/10.1016/j.jhydrol.2017.09.020, 2018.
Hemmerle, H. and Bayer, P.: Climate Change Yields Groundwater Warming in Bavaria, Germany, Front. Earth Sci., 8, https://doi.org/10.3389/feart.2020.575894, 2020.
Hemmerle, H., Ferguson, G., Blum, P., and Bayer, P.: The evolution of the geothermal potential of a subsurface urban heat island, Environ. Res. Lett., 17, 084018, https://doi.org/10.1088/1748-9326/ac7e60, 2022.
Hersbach, H., Bell, B., Berrisford, P., Hirahara, S., Horányi, A., Muñoz-Sabater, J., Nicolas, J., Peubey, C., Radu, R., and Schepers, D.: The ERA5 global reanalysis, Q. J. Roy. Meteor. Soc., 146, 1999–2049, https://doi.org/10.1002/qj.3803, 2020.
IPCC: Climate Change 2023: Synthesis Report. Contribution of Working Groups I, II and III to the Sixth Assessment Report of the Intergovernmental Panel on Climate Change, edited by: Core Writing Team, Lee, H., and Romero, J., IPCC, Geneva, Switzerland, 184, https://doi.org/10.59327/IPCC/AR6-9789291691647, 2023.
Irvine, D. J., Cartwright, I., Post, V. E. A., Simmons, C. T., and Banks, E. W.: Uncertainties in vertical groundwater fluxes from 1-D steady state heat transport analyses caused by heterogeneity, multidimensional flow, and climate change, Water Resour. Res., 52, 813–826, https://doi.org/10.1002/2015WR017702, 2016.
Jing, M., Kumar, R., Heße, F., Thober, S., Rakovec, O., Samaniego, L., and Attinger, S.: Assessing the response of groundwater quantity and travel time distribution to 1.5, 2, and 3 °C global warming in a mesoscale central German basin, Hydrol. Earth Syst. Sci., 24, 1511–1526, https://doi.org/10.5194/hess-24-1511-2020, 2020.
Klepikova, M.: Groundwater warming, Nat. Geosci., 17, 487–488, https://doi.org/10.1038/s41561-024-01461-x, 2024.
Klepikova, M., Bense, V., Le Borgne, T., Guihéneuf, N., and Bour, O.: Impact of groundwater extraction on subsurface thermal regimes, Environ. Res. Lett., 20, 054048, https://doi.org/10.1088/1748-9326/adc8bb, 2025.
Kooi, H.: Groundwater flow as a cooling agent of the continental lithosphere, Nat. Geosci., 9, 227–230, https://doi.org/10.1038/ngeo2642, 2016.
Krawczyk, C. M. and Schulze, A.: Geophysikalische und geochemische Landesuntersuchung-Seismik, in: Geologie von Brandenburg, edited by: Franke, W. S. D. P., Schweizerbart, Stuttgart, Germany, 508–513, 2015.
Kumar, R., Samaniego, L., and Attinger, S.: Implications of distributed hydrologic model parameterization on water fluxes at multiple scales and locations, Water Resour. Res., 49, 360–379, https://doi.org/10.1029/2012WR012195, 2013.
Kumar, R., Samaniego, L., Thober, S., Rakovec, O., Marx, A., Wanders, N., Pan, M., Hesse, F., and Attinger, S.: Multi-Model Assessment of Groundwater Recharge Across Europe Under Warming Climate, Earth's Future, 13, e2024EF005020, https://doi.org/10.1029/2024EF005020, 2025.
Kurylyk, B. L., Bourque, C. P.-A., and MacQuarrie, K. T. B.: Potential surface temperature and shallow groundwater temperature response to climate change: an example from a small forested catchment in east-central New Brunswick (Canada), Hydrol. Earth Syst. Sci., 17, 2701–2716, https://doi.org/10.5194/hess-17-2701-2013, 2013.
Kurylyk, B. L., MacQuarrie, K. T. B., and Voss, C. I.: Climate change impacts on the temperature and magnitude of groundwater discharge from shallow, unconfined aquifers, Water Resour. Res., 50, 3253–3274, https://doi.org/10.1002/2013WR014588, 2014.
Kurylyk, B. L., MacQuarrie, K. T. B., Caissie, D., and McKenzie, J. M.: Shallow groundwater thermal sensitivity to climate change and land cover disturbances: derivation of analytical expressions and implications for stream temperature modeling, Hydrol. Earth Syst. Sci., 19, 2469–2489, https://doi.org/10.5194/hess-19-2469-2015, 2015.
Kurylyk, B. L., Irvine, D. J., Carey, S. K., Briggs, M. A., Werkema, D. D., and Bonham, M.: Heat as a groundwater tracer in shallow and deep heterogeneous media: Analytical solution, spreadsheet tool, and field applications, Hydrol. Process., 31, 2648–2661, https://doi.org/10.1002/hyp.11216, 2017.
Kurylyk, B. L., Irvine, D. J., and Bense, V. F.: Theory, tools, and multidisciplinary applications for tracing groundwater fluxes from temperature profiles, WIREs Water, 6, e1329, https://doi.org/10.1002/wat2.1329, 2019.
Lang, J., Bebiolka, A., Noack, V., Schützke, J., Weihmann, S., and Breuer, S.: The impact of the structural framework of the North German Basin on Pleistocene tunnel-valley formation, Boreas, 54, 542–566, https://doi.org/10.1111/bor.12694, 2025.
Lemieux, J.-M., Sudicky, E. A., Peltier, W. R., and Tarasov, L.: Simulating the impact of glaciations on continental groundwater flow systems: 1. Relevant processes and model formulation, J. Geophys. Res.-Earth Surf., 113, https://doi.org/10.1029/2007JF000928, 2008.
LfU: Landesamt für Umwelt Brandenburg – Auskunftsplattform Wasser (APW), https://apw.brandenburg.de/, last access: 1 October 2024, 2023.
Li, Y., Yang, X., Lischeid, G., Wollheim, W. M., Jomaa, S., Zhou, X., and Rode, M.: Responses of Wetted River Network Contraction and Expansion Dynamics to Prolonged Drought, Water Resour. Res., 61, e2024WR038938, https://doi.org/10.1029/2024WR038938, 2025.
Liesch, T. and Wunsch, A.: Aquifer responses to long-term climatic periodicities, J. Hydrol., 572, 226–242, https://doi.org/10.1016/j.jhydrol.2019.02.060, 2019.
Littke, R., Bayer, U., Gajewski, D., and Nelskamp, S.: Dynamics of complex intracontinental basins: the central European basin system, Springer Science & Business Media, Berlin Heidelberg, 2008.
Luijendijk, E.: The role of fluid flow in the thermal history of sedimentary basins: Inferences from thermochronology and numerical modeling in the Roer Valley Graben, southern Netherlands, Vrije Universiteit Amsterdam, PhD thesis, ISBN 9789462030381, 2012.
Marx, A., Boeing, F., Rakovec, O., Müller, S., Can, Ö., Malla, C., Peichl, M., and Samaniego, L.: Auswirkungen des Klimawandels auf Wasserbedarf und -dargebot, WASSERWIRTSCHAFT, 111, 14–19, https://doi.org/10.1007/s35147-021-0905-5, 2021.
Maxwell, R. M. and Kollet, S. J.: Interdependence of groundwater dynamics and land-energy feedbacks under climate change, Nat. Geosci., 1, 665–669, https://doi.org/10.1038/ngeo315, 2008.
Menberg, K., Bayer, P., Zosseder, K., Rumohr, S., and Blum, P.: Subsurface urban heat islands in German cities, Science Total Environ., 442, 123–133, https://doi.org/10.1016/j.scitotenv.2012.10.043, 2013.
Merrifield, A. L., Brunner, L., Lorenz, R., Humphrey, V., and Knutti, R.: Climate model Selection by Independence, Performance, and Spread (ClimSIPS v1.0.1) for regional applications, Geosci. Model Dev., 16, 4715–4747, https://doi.org/10.5194/gmd-16-4715-2023, 2023.
Ministerium für Wirtschaft: Arbeit und Energie Brandenburg: Geothermie, https://mwae.brandenburg.de/de/geothermie/bb1.c.478390.de, last access: 6 December 2023.
Moeck, C., Brunner, P., and Hunkeler, D.: The influence of model structure on groundwater recharge rates in climate-change impact studies, Hydrogeol. J., 24, 1171–1184, https://doi.org/10.1007/s10040-016-1367-1, 2016.
Nguyen, V. D., Vorogushyn, S., Nissen, K., Brunner, L., and Merz, B.: A non-stationary climate-informed weather generator for assessing future flood risks, Adv. Stat. Clim. Meteorol. Oceanogr., 10, 195–216, https://doi.org/10.5194/ascmo-10-195-2024, 2024.
Noack, V., Scheck-Wenderoth, M., and Cacace, M.: Sensitivity of 3D thermal models to the choice of boundary conditions and thermal properties: a case study for the area of Brandenburg (NE German Basin), Environ. Earth Sci., 67, 1695–1711, https://doi.org/10.1007/s12665-012-1614-2, 2012.
Noack, V., Scheck-Wenderoth, M., Cacace, M., and Schneider, M.: Influence of fluid flow on the regional thermal field: results from 3D numerical modelling for the area of Brandenburg (North German Basin), Environ. Earth Sci., 70, 3523–3544, https://doi.org/10.1007/s12665-013-2438-4, 2013.
Noack, V., Scheck-Wenderoth, M., Cacace, M., and Schneider, M.: The 3D Structural Model of Brandenburg, Zenodo [data set], https://doi.org/10.5281/zenodo.10526955, 2024.
Odyssee-Mure: Germany | Energy profile, 12, https://www.odyssee-mure.eu/publications/efficiency-trends-policies-profiles/germany-country-profile-english.pdf (last access: 6 August 2025), 2024.
Pei, L., Virchow, L., Blöcher, G., Kranz, S., and Saadat, A.: Characterization of artesian flow and heat transition in an ATES research wellbore using DTS monitoring and numerical modelling, Adv. Geosci., 65, 37–44, https://doi.org/10.5194/adgeo-65-37-2024, 2024.
Pfeifer, S., Rechid, D., and Bathiany, S.: Klimaausblick Brandenburg, https://gerics.de/products_and_publications/fact_sheets/index.php.de (last access: 21 March 2026), 2021.
Reinecke, R., Müller Schmied, H., Trautmann, T., Andersen, L. S., Burek, P., Flörke, M., Gosling, S. N., Grillakis, M., Hanasaki, N., Koutroulis, A., Pokhrel, Y., Thiery, W., Wada, Y., Yusuke, S., and Döll, P.: Uncertainty of simulated groundwater recharge at different global warming levels: a global-scale multi-model ensemble study, Hydrol. Earth Syst. Sci., 25, 787–810, https://doi.org/10.5194/hess-25-787-2021, 2021.
Riedel, T.: Temperature-associated changes in groundwater quality, J. Hydrol., 572, 206–212, https://doi.org/10.1016/j.jhydrol.2019.02.059, 2019.
Rivera, J. A., Blum, P., and Bayer, P.: Increased ground temperatures in urban areas: Estimation of the technical geothermal potential, Renewable Energy, 103, 388–400, https://doi.org/10.1016/j.renene.2016.11.005, 2017.
Rossman, N. R., Zlotnik, V. A., Rowe, C. M., and Szilagyi, J.: Vadose zone lag time and potential 21st century climate change effects on spatially distributed groundwater recharge in the semi-arid Nebraska Sand Hills, J. Hydrol., 519, 656–669, https://doi.org/10.1016/j.jhydrol.2014.07.057, 2014.
Samaniego, L., Kumar, R., and Attinger, S.: Multiscale parameter regionalization of a grid-based hydrologic model at the mesoscale, Water Resour. Res., 46, https://doi.org/10.1029/2008WR007327, 2010.
Samaniego, L., Thober, S., Wanders, N., Pan, M., Rakovec, O., Sheffield, J., Wood, E. F., Prudhomme, C., Rees, G., Houghton-Carr, H., Fry, M., Smith, K., Watts, G., Hisdal, H., Estrela, T., Buontempo, C., Marx, A., and Kumar, R.: Hydrological Forecasts and Projections for Improved Decision-Making in the Water Sector in Europe, B. Am. Meteorol. Soc., 100, 2451–2472, https://doi.org/10.1175/BAMS-D-17-0274.1, 2019.
Samaniego, L., Kumar, R., Zink, M., Cuntz, M., Mai, J., Thober, S., Schneider, C., Dalmasso, G., Musuuza, J., Rakovec, O., Craven, J., Schäfer, D., Prykhodko, V., Schrön, M., Spieler, D., Brenner, J., Langenberg, B., Schüler, L., Stisen, S., Demirel, M. C., Jing, M., Kaluza, M., Schweppe, R., Shrestha, P. K., Döring, N., and Müller, S.: mhm-ufz/mHM Version: v5.13.1, Zenodo [code], https://doi.org/10.5281/zenodo.8279545, 2023.
Scheck, M. and Bayer, U.: Evolution of the Northeast German Basin – inferences from a 3D structural model and subsidence analysis, Tectonophysics, 313, 145–169, https://doi.org/10.1016/S0040-1951(99)00194-8, 1999.
Scibek, J. and Allen, D. M.: Modeled impacts of predicted climate change on recharge and groundwater levels, Water Resour. Res., 42, https://doi.org/10.1029/2005WR004742, 2006.
Seidenfaden, I. K., Sonnenborg, T. O., Stisen, S., and Kidmose, J.: Quantification of climate change sensitivity of shallow and deep groundwater in Denmark, J. Hydrol.: Regional Studies, 41, 101100, https://doi.org/10.1016/j.ejrh.2022.101100, 2022.
Seneviratne, S. I., Corti, T., Davin, E. L., Hirschi, M., Jaeger, E. B., Lehner, I., Orlowsky, B., and Teuling, A. J.: Investigating soil moisture–climate interactions in a changing climate: A review, Earth-Sci. Rev., 99, 125–161, https://doi.org/10.1016/j.earscirev.2010.02.004, 2010.
SenStadt: Senatsverwaltung für Stadtentwicklung, Bauen und Wohnen – Berlin Environmental Atlas, Berlin, https://www.berlin.de/umweltatlas/en/water/groundwater-temperature/ (last access: 5 December 2025), 2020.
Shen, P. Y. and Beck, A. E.: Determination of surface temperature history from borehole temperature gradients, J. Geophys. Res.-Sol. Ea., 88, 7485–7493, https://doi.org/10.1029/JB088iB09p07485, 1983.
Singer, J.: Numerische Untersuchung der thermischen Beeinflussung von hangenden Grundwasserleitern eines saisonalen ATES-Systems am Standort des Reallabors in Berlin-Adlershof, Masterarbeit, Fakultät VI, Technische Universität Berlin, Berlin, 2025.
Sirocko, F., Reicherter, K., Lehné, R., Hübscher, C., Winsemann, J., and Stackebrandt, W.: Glaciation, salt and the present landscape, in: Dynamics of complex intracontinental basins. The Central European basin system, edited by: Littke, R., Bayer, U., Gajewski, D., and Nelskamp, S., Springer, Berlin Heidelberg, 233–245, https://doi.org/10.1007/978-3-540-85085-4_4, 2008.
Smerdon, B. D.: A synopsis of climate change effects on groundwater recharge, J. Hydrol., 555, 125–128, https://doi.org/10.1016/j.jhydrol.2017.09.047, 2017.
Smith, L. and Chapman, D. S.: On the thermal effects of groundwater flow: 1. Regional scale systems, J. Geophys. Res.-Sol. Ea., 88, 593–608, https://doi.org/10.1029/JB088iB01p00593, 1983.
Stackebrandt, W. and Franke, D.: Geologie von Brandenburg, Schweizerbart, 805 pp., 2015.
Stackebrandt, W. and Manhenke, V. (Eds.): Atlas zur Geologie von Brandenburg im Maßstab 1:1 000 000, Landesamt für Geowissenschaften und Rohstoffe, Cottbus, 2010.
Stallman, R. W.: Steady one-dimensional fluid flow in a semi-infinite porous medium with sinusoidal surface temperature, J. Geophys. Res., 70, 2821–2827, https://doi.org/10.1029/JZ070i012p02821, 1965.
Stemmle, R., Arab, A., Bauer, S., Beyer, C., Blöcher, G., Bossennec, C., Dörnbrack, M., Hahn, F., Jaeger, P., Kranz, S., Mauerberger, A., Nordheim, J. N., Ohagen, M., Petrova, E., Regenspurg, S., Rettenmaier, D., Saadat, A., Sass, I., Scheytt, T., Scholliers, N., Shao, H., Tzoufka, K., Zosseder, K., and Blum, P.: Current research on aquifer thermal energy storage (ATES) in Germany, Grundwasser, 30, 107–124, https://doi.org/10.1007/s00767-025-00590-3, 2025.
Taniguchi, M.: Impacts of climate change on groundwater in recharge and discharge areas, AGU Fall Meeting Abstracts, H23C-01, https://ui.adsabs.harvard.edu/abs/2021AGUFM.H23C..01T/abstract (last access: 24 March 2026), 2021.
Taniguchi, M., Shimada, J., Tanaka, T., Kayane, I., Sakura, Y., Shimano, Y., Dapaah-Siakwan, S., and Kawashima, S.: Disturbances of temperature-depth profiles due to surface climate change and subsurface water flow: 1. An effect of linear increase in surface temperature caused by global warming and urbanization in the Tokyo Metropolitan Area, Japan, Water Resour. Res., 35, 1507–1517, https://doi.org/10.1029/1999WR900009, 1999.
Taylor, R. G., Scanlon, B., Döll, P., Rodell, M., van Beek, R., Wada, Y., Longuevergne, L., Leblanc, M., Famiglietti, J. S., Edmunds, M., Konikow, L., Green, T. R., Chen, J., Taniguchi, M., Bierkens, M. F. P., MacDonald, A., Fan, Y., Maxwell, R. M., Yechieli, Y., Gurdak, J. J., Allen, D. M., Shamsudduha, M., Hiscock, K., Yeh, P. J. F., Holman, I., and Treidel, H.: Ground water and climate change, Nat. Clim. Change, 3, 322–329, https://doi.org/10.1038/nclimate1744, 2013.
Tissen, C., Benz, S. A., Menberg, K., Bayer, P., and Blum, P.: Groundwater temperature anomalies in central Europe, Environ. Res. Lett., 14, 104012, https://doi.org/10.1088/1748-9326/ab4240, 2019.
Tsypin, M., Cacace, M., Guse, B., Güntner, A., and Scheck-Wenderoth, M.: Modeling the influence of climate on groundwater flow and heat regime in Brandenburg (Germany), Front. Water, 6, https://doi.org/10.3389/frwa.2024.1353394, 2024.
Tsypin, M., Cacace, M., Guse, B., Lischeid, G., Güntner, A., and Scheck-Wenderoth, M.: Damped groundwater response to recharge: From spectral analysis to regional modeling, J. Hydrol., 658, 133193, https://doi.org/10.1016/j.jhydrol.2025.133193, 2025a.
Tsypin, M., Nguyen, V. D., Cacace, M., and Scheck-Wenderoth, M.: Long-term synthetic weather data, groundwater recharge and a thermo-hydraulic groundwater model for Berlin-Brandenburg (1955–2100), GFZ Data Services [data set], https://doi.org/10.5880/GFZ.CUEG.2025.001, 2025b.
Wunsch, A., Liesch, T., and Broda, S.: Deep learning shows declining groundwater levels in Germany until 2100 due to climate change, Nat. Commun., 13, 1221, https://doi.org/10.1038/s41467-022-28770-2, 2022.
Zhang, Y.-P., Jiang, X.-W., Ge, S., Zhang, Z.-Y., Han, P.-F., Wang, X.-S., Wang, L., Liu, Q., and Wan, L.: Effect of climate warming on subsurface temperature in basins with topography-driven groundwater flow, J. Hydrol., 644, 132024, https://doi.org/10.1016/j.jhydrol.2024.132024, 2024.
Zhou, P., Wang, G., and Duan, R.: Impacts of long-term climate change on the groundwater flow dynamics in a regional groundwater system: Case modeling study in Alashan, China, J. Hydrol., 590, 125557, https://doi.org/10.1016/j.jhydrol.2020.125557, 2020.
- Abstract
- Introduction
- Study area
- Methods
- Climate scenario definition
- Results
- Discussion
- Conclusions
- Appendix A: Additional figures and tables
- Appendix B: Subsurface warming in urban conditions
- Code availability
- Data availability
- Author contributions
- Competing interests
- Disclaimer
- Acknowledgements
- Financial support
- Review statement
- References