the Creative Commons Attribution 4.0 License.
the Creative Commons Attribution 4.0 License.
 | 13 Jan 2026
Global projections of aridity index for mid and long-term future based on CMIP6 scenarios
Camille Crapart
Sandrine Anquetin
Juliette Blanchet
Arona Diedhiou
This study evaluates and projects global aridity index (AI) and dryland distribution using the FAO Aridity Index based on Penman-Monteith potential evapotranspiration. A multimodel ensemble of 13 CMIP6 models, with a horizontal resolution of 100 km, was selected for analysis. The ensemble was validated against WorldClim and ERA5 reanalysis datasets for the reference period (1970–1999), showing strong correlations in key variables and consistent geographic representation of drylands, with some regional discrepancies, notably in North-Eastern Brazil. Future projections of AI were generated for three shared socio-economic pathways (SSP 2–4.5, SSP 3–7.0, and SSP 5–8.5) and two time frames (2030–2059 and 2070–2099). Results indicate that most regions will maintain their current climate classification but face decreasing AI values, signifying drier conditions. Under SSP 2–4.5 and SSP 5–8.5, significant drying is projected for the mid-term, with continued but slower changes by century's end, affecting regions such as North and Central America, the Mediterranean Basin, and areas adjacent to present-day deserts. In contrast, SSP 3–7.0 shows limited drying or localized wetting in the mid-term, followed by extensive drying in the long-term. Comprehensive maps and tables detailing dryland proportions and distributions are provided to support these findings.
- Article
(2632 KB) - Full-text XML
-
Supplement
(2549 KB) - BibTeX
- EndNote


Ongoing climate changes raise concerns about the habitability of drylands, where the population is already facing challenges related to water availability, agriculture and population. Around 27 % of the world population lived in drylands in 2020, i.e. more than 2 billion people (Doxsey-Whitfield et al., 2015). Drylands are broadly defined as arid or semi-arid regions, i.e. regions in which the balance between water received and water loss is in favour of the latter. The concept of aridity refers to a long-term trend of limited water resources, in contrast to “drought” that refers to a temporary episode of water deficit. The IPCC defines aridity as: “the state of a long-term climatic feature characterised by low average precipitation or available water in a region”. Aridity “generally arises from widespread persistent atmospheric subsidence or anticyclonic conditions, and from more localised subsidence on the lee side of mountains” (Möller et al., 2022). Hyperarid and arid zones, such as the Sahara Desert, are mostly located at the descending side of Hadley cells. Semi-arid zones lie between the divergence zones of the two Hadley cells at the equator, and at the divergence zone of Hadley and Ferrel cells near the tropics of Cancer and Capricorn (Scholes, 2020) . Drylands are heterogenous and include various kinds of ecosystems, agricultural and economic activities. Their role in the global climate and biogeochemical cycles is still poorly understood (Osborne et al., 2022). On the contrary, “humid” areas have a water balance that tend to receive more water than they can use. These include tropical and temperature ecosystems, but also encompass great heterogeneity. In the recently released UNCDD report on desertification (Vincente-Serrano et al., 2024), it has been established that the three last decades saw 77.6 % of the world getting dryer and that nearly 8 % of the world land surface transitioned to dryer aridity classes.
Classification of climatic zones based on the concept of aridity have been in use since Ancient Greece. Many simple indices for climate classification have been introduced (Stephen, 2005). For example, Lang defined a “rain factor” (Lang, 1915), de Martonne an “aridity index” (de Martonne, 1926), Emberger a “pluviometric constant” (Emberger, 1930) and Ångström a “coefficient of humidity” (Ångström, 1936), all of them with their associated categories of climates. On the other hand, the botanist Wladimir Köppen who defined climatic zones, based on several criteria, i.e. temperature, length of the winter months (Köppen, 1936, updated by Kottek et al., 2006, and Peel et al., 2007). More recently, Thornthwaite (Thornthwaite, 1943) advocated for a physically-based, systematic, and concise way of differentiating the climates. He highlighted the importance of moisture and heat, and particularly of the processes of evapotranspiration. Evapotranspiration is a complex processus to estimate, and in climate classifications, one uses the potential evapotranspiration i.e. the highest possible evapotranspiration given a good water supply (Xiang et al., 2020). In 1948, he introduced a moisture index that he uses for calculating the potential evapotranspiration (Thornthwaite, 1948). In parallel, Penman (Penman, 1948) derived his evapotranspiration equation from the surface energy balance. Monteith (Monteith, 1965) built on this work to establish the Penman-Monteith (PM) equation recognized as the most complete way of calculating evapotranspiration. However, its extensive need in terms of variables makes other and simpler equations also widely used (Pimentel et al., 2023). For example, later work by Hargreaves and Allen (2003) provided a simpler method with the aim of guiding irrigation practices in arid and semi-arid zones.
The three successive editions of the World Atlas of Desertification (United Nations Environment Programme, 1992; Middleton and Thomas, 1997; Cherlet et al., 2018) provided maps of aridity zones, using the Thornthwaite equation for its simplicity. In the 2024 UNCCD report, the Hargreaves question is used for calculating evapotranspiration (Vincente-Serrano et al., 2024). Some other authors used the Penman-Monteith index on the reference period 1970–1999 to provide world maps, such as the FAO (FAO, 2024) and Zomer et al. (2022). Spinoni et al. (2015) identified regions prone to desertification by comparing the 1951–1980 and 1981–2010 aridity indexes calculated with the PM potential evapotranspiration. By comparing with the literature, they showed that the regions identified as at risk are areas where desertification or land degradation is reported. Other studies of climate zones by the end of the century are available, such as a Köppen classification until 2100 with CMIP6 by Beck et al. (2023). These maps are very detailed, but do not provide information on the evapotranspiration or aridity changes within each climate category. Similarly, Trabucco et al. (2024) also published global maps of aridity index for the periods 2021–2040 and 2041–2060, using the downscaled models available in Worldclim (Fick and Hijmans, 2017). Due to the few variables available in the CMIP6 projections gathered in Worldclim, the authors had to use the Hargreaves equation for calculating the potential evapotranspiration. In addition, these maps of future aridity areas are not available for the end of the century, and the pertinence of CMIP6 models is not evaluated. Using temperature-based methods like Hargreaves or Thornthwaite methods tend to overestimate the potential evapotranspiration in the long-term, by ignoring the effects of wind, radiation and shading (Sheffield et al., 2012). The Penman-Monteith method includes these factors and is less reliant on temperature. In general, no future estimations of the aridity index globally, mid-term and long-term, calculated with the Penman-Monteith reference potential evapotranspiration is available.
In this study, we intend to compute the global aridity index based on Penman-Monteith equation globally for two periods: mid-term (2030–2059) and long-term (2070–2099), using CMIP6 models. This allows us to identify the areas prone to aridification in the short and long term, including within areas defined as “humid”, and provide maps of aridity category areas for three shared socio-economic pathways (SSP 2–4.5, SSP 3–7.0 and SSP 5–8.5). In a first part, the performance of the CMIP6 ensemble is evaluated for the reference period 1970–1999 by the comparison with two databases. The first database is the widely used Worldclim which is a combination of observations and reanalysis, and provides the 30 years average of several bioclimatic variables. The second one is the ERA5 reanalysis. ERA5 and Worldclim had very similar patterns of precipitation and temperature and were considered equally good as references. In the second part of the article, we compare the evolution of aridity index in each grid cell in three SSPs between the reference period 1970–1999 and the two study periods, 2030–2059 and 2070–2099. We compare the change in aridity index with the projected changes in temperature and precipitation, disentangling the relative role of these two factors in climate change. Finally, we examine the areas that will exceed the threshold separating aridity categories, and provide a map of aridity categories in each scenario.
2.1 Aridity index
The aridity index used in this study was first introduced by the UNESCO in 1977 to establish a world map of drylands prior to the United Nations Conference on Desertification (UNESCO, 1977). It uses the Penman-Monteith equation to calculate the potential evapotranspiration, with standardized parameters adapted to an area of growing crops and noted ET0 (Allen et al., 1998). This equation is an adaptation of the energy balance at the surface to calculate the quantity of water lost through evapotranspiration under optimum irrigation conditions, in mm per day. The aridity index is the average annual precipitation over 30 years, divided by the average annual potential evapotranspiration over 30 years, expressed in the World Atlas of Desertification (Cherlet et al., 2018) as:
The Penman Monteith equation for the potential evapotranspiration is:
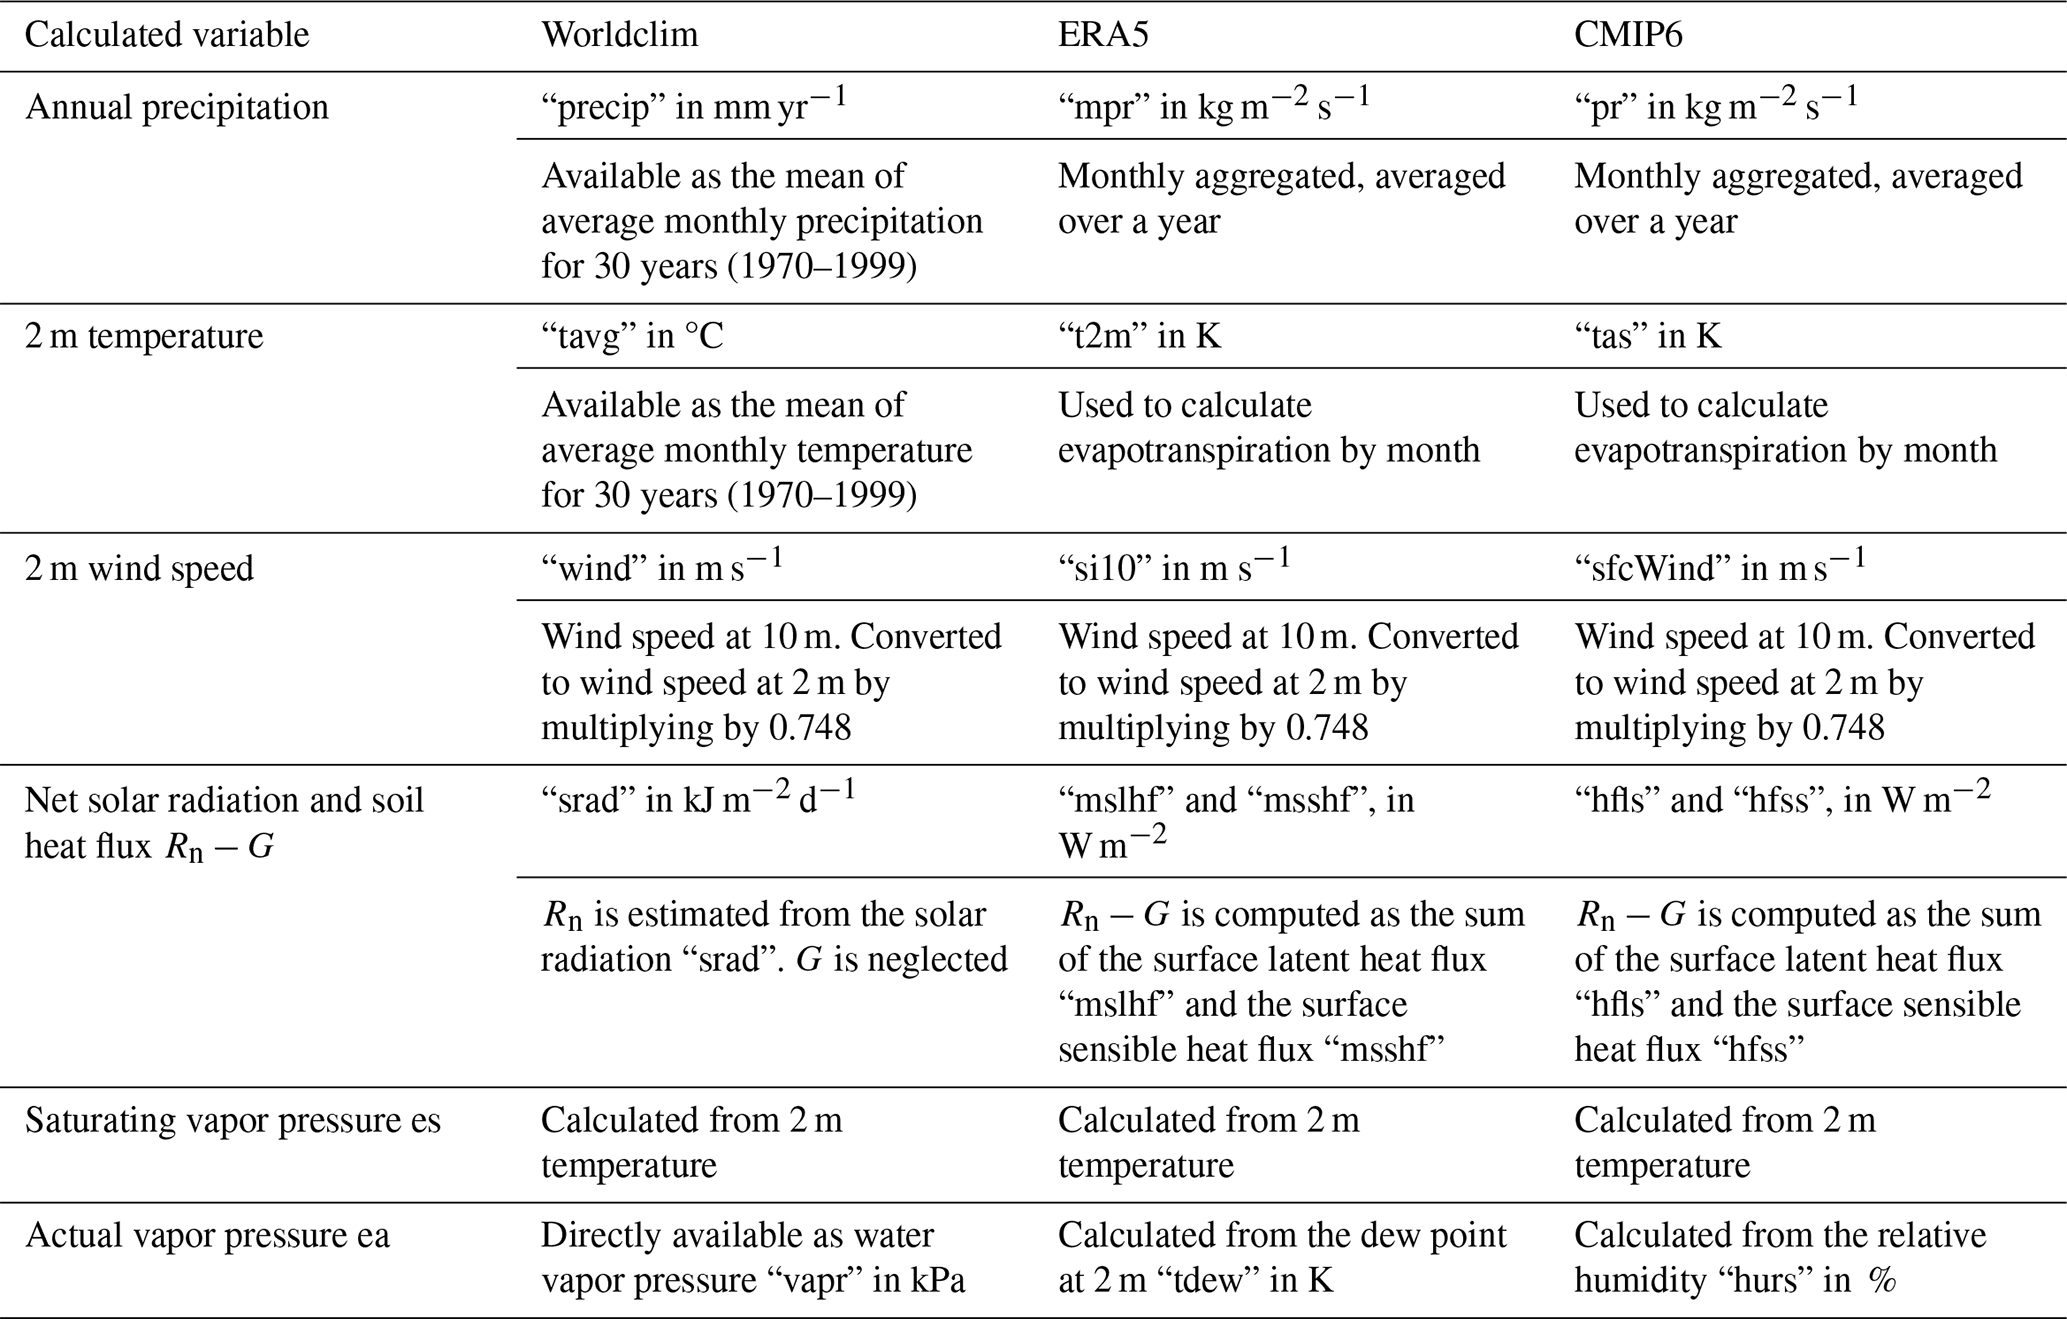
where ET0 is the monthly potential evapotranspiration in mm, Rn is the net surface radiation in MJ m−2 d, G is the soil heat flux density in MJ m−2 d, T is the mean daily temperature at 2 m height in °C, u2 is the wind speed at 2 m height in m s−1, es and ea are the saturating and actual vapour pressure in kPA. Δ is the slope of the vapour pressure curve in kPa °C−1 and γ is the psychrometric constant in kPa °C−1, that depends on atmospheric pressure and temperature. This equation is an adaptation of the general equation of evapotranspiration from Penman-Monteith for a hypothetical surface planted with crops and used to homogenise the parameters related to the vegetation. The notation ET0 used in Allen et al. (1998) to refer to the “reference potential evapotranspiration” is replaced in the rest of this article by “PET”, the usual acronym for potential evapotranspiration.
Annual precipitation was obtained by adding mean monthly values. Similarly, annual PET, was obtained by calculating the mean PET for each month over 30 years and then summed the monthly values. This was preferred over averaging the monthly values of all variables (temperature, wind speed, radiation …) for use in Eq. (2), due to the non-linearity of the Penman-Monteith formula.
This would be represented by:
where “j” represents the months of the year and 30 the years on which the aridity index is calculated. PETi,j is the potential evaporation in mm for a given month in a given year “i”.
The climate is then classified into 6 classes depending on their aridity index (Table 1). The thresholds used in this article were defined in the explicative note of the UNESCO (UNESCO, 1977) on the map of the world's arid regions, based on the bioclimatic characteristics of these areas. These thresholds are slightly different to those used in the UNCCD report on desertification (Vincente-Serrano et al., 2024) and in the dedicated chapter of the IPCC AR6 (Mirzabaev et al., 2022), because these two reports use respectively the Hargreaves and Thornthwaite evapotranspiration equations. The two equations underestimate evapotranspiration in dry areas and overestimate it in humid areas. In their case, the hyperarid areas are defined by an aridity index inferior to 0.05 (instead of 0.03 here) and humid areas with an aridity index superior to 0.65 (instead of 0.75 here), as indicated for defining the aridity categories when the Penman-Monteith equation is used.

In this note, there is no mention of cold regions (Northern Europe, Siberia, Greenland). However, in the World Atlas of Desertification (Cherlet et al., 2018) a “cold” region is defined, in which the annual potential evapotranspiration is inferior to 400 mm yr−1. In our data, grid cells with PET lower than 400 mm have either an aridity index classified as humid, either the annual evapotranspiration is calculated as negative and the index is also negative. To avoid this last case, we decided to integrate the “cold” category, defined as grid cells in which PET is inferior to 400 mm yr−1. In this classification, “drylands” comprise all the categories outside “humid” and “cold”.
2.2 Variables and climate databases
All data analysis was performed using R programming software (R Core Team, 2023). Data from different models were reprojected into the same grid, and extracted using the “raster” package (Hijmans et al., 2023).
The land-sea mask used is extracted from Iturbide et al. (2020), which also provides the polygons of the regions defined for the 6th Assessment Report.
Elevation data (used to calculate atmospheric pressure) are extracted from Worldclim and used for the ERA5, Worldclim and CMIP6 datasets.
2.2.1 Source of data
Historical climate data are taken from the Worldclim database (Fick and Hijmans, 2017) and from the ERA5 monthly aggregated reanalysis (Hersbach et al., 2020).
Worldclim is composed of a combination of observations and reanalysis averaged monthly over a 30 years period (1970–1999). We used the coarsest resolution: 340 km2. Time-series of observation are gathered from various sources (see Table 1 in Fick and Hijmans, 2017) and gridded by interpolation, before being summarized.
ERA5 offers reanalysis of atmospheric variables monthly aggregated with a horizontal spatial resolution of 31 km. The data were downloaded for the period 1970–1999 and averaged per grid cell and by month over 30 years.
CMIP6 models are accessible through the Lawrence Livermore National Laboratory, one of the ESGF data nodes (“LLNL ESGF MetaGrid”; ESGF, 2024). We filtered the available models based on the following criteria. First, the horizontal spatial resolution is 100 km. Second, the 6 necessary variables are available: air temperature at 2 m height (“tas”), precipitation (“pr”), surface wind speed at 2m height (“ sfcWind ”), surface latent heat flux (“hfls”), surface sensible heat flux (“hfss”), relative humidity (“hurs”). Third, these variables are simulated for the 4 following scenarios: historical (years 1850–2014), SSP 2–4.5, SSP 3–7.0 and SSP 5–8.5 (years 2015–2100). The 13 models were thus selected are: CAS-ESM2-0 (Zhang et al., 2020) ; CESM2-WACC (Gettelman et al., 2019); CMCC-CM2-SR5 (Cherchi et al., 2019); CMCC-ESM2 (Lovato et al., 2022); CNRM-CM6-1 (Voldoire et al., 2019); EC-Earth3 (Döscher et al., 2022); FGOALS-f3-L (He et al., 2019); GFDL-ESM4 (Dunne et al., 2020); INM-CM4-8 and INM-CM5-0 (Volodin et al., 2018); MPI-ESM1-2 (Gutjahr et al., 2019); MRI-ESM2-0 (Yukimoto et al., 2019); NorESM2-MM (Seland et al., 2020). Only one member of each of them was downloaded, usually r1i1p1f1 except for the CNRM model which only provided the member r1i1p1f2. For each cell in the grid, the “CMIP6” value is the multimodel mean value of a given variable. The standard deviation was computed to estimate the spread of the models.
2.2.2 Regions and land/ocean mask
The land/ocean mask, the continent and the corresponding IPCC regions were obtained from Grid cells containing only ocean (marked by a value of 0) were excluded, but the coastal grid cells (value between 0 and 1) were kept in the analysis. We excluded from the analysis the continents that were only composed of a few grid cells, mainly islands, i.e. the “Arctic”, “Indian', “Pacific”, “Polar” and “Southern” continents. In addition, most figures and percentages in the article exclude the grid cells of Antarctica, unless otherwise specified.
2.2.3 Variables
The potential evapotranspiration is calculated based on the variables available in each database. Table 2 summarizes which variable is used to compute each term in the Penman-Monteith equation.
2.2.4 Computation of aridity indexes and categories
We use the evapotranspiration as defined by Penman-Monteith, that requires the mean annual temperature, actual vapor pressure and surface energy fluxes. 13 CMIP6 models were selected, that offered the 6 necessary variables were readily available for a resolution of 100 km and for the historical period as well as the 3 SSP.
We retrieved data for future periods in CMIP6 in 3 distinct SSP scenarios. The potential evapotranspiration and the aridity index are then calculated for these 3 scenarios in the 13 CMIP6 models. The average aridity index is computed by grid cells and the value of this index in the two future periods (2030–2059 and 2070–2099) are computed. Increases in aridity index, corresponding to wetter conditions, are represented in blue; while decreases of aridity index, corresponding to dryer conditions, are represented in red. Most of the values taken by the aridity index are comprised between 0 and 1. Values between 0 and 0.65 correspond to the arid, semi-arid and dry-subhumid categories. Aridity indexes superior to 0.65 up to infinity are classified as humid, except grid cells with evapotranspiration lower than 400 mm yr−1 that are classified as cold. Aridity indexes less than 0.03 to (-infinity) are classified as hyperarid. Figures for changes in temperature (the main driver for evapotranspiration) and precipitation compared to 1970–1999 are available in the Supplement (Fig. S5).
3.1 Model dispersion in CMIP6
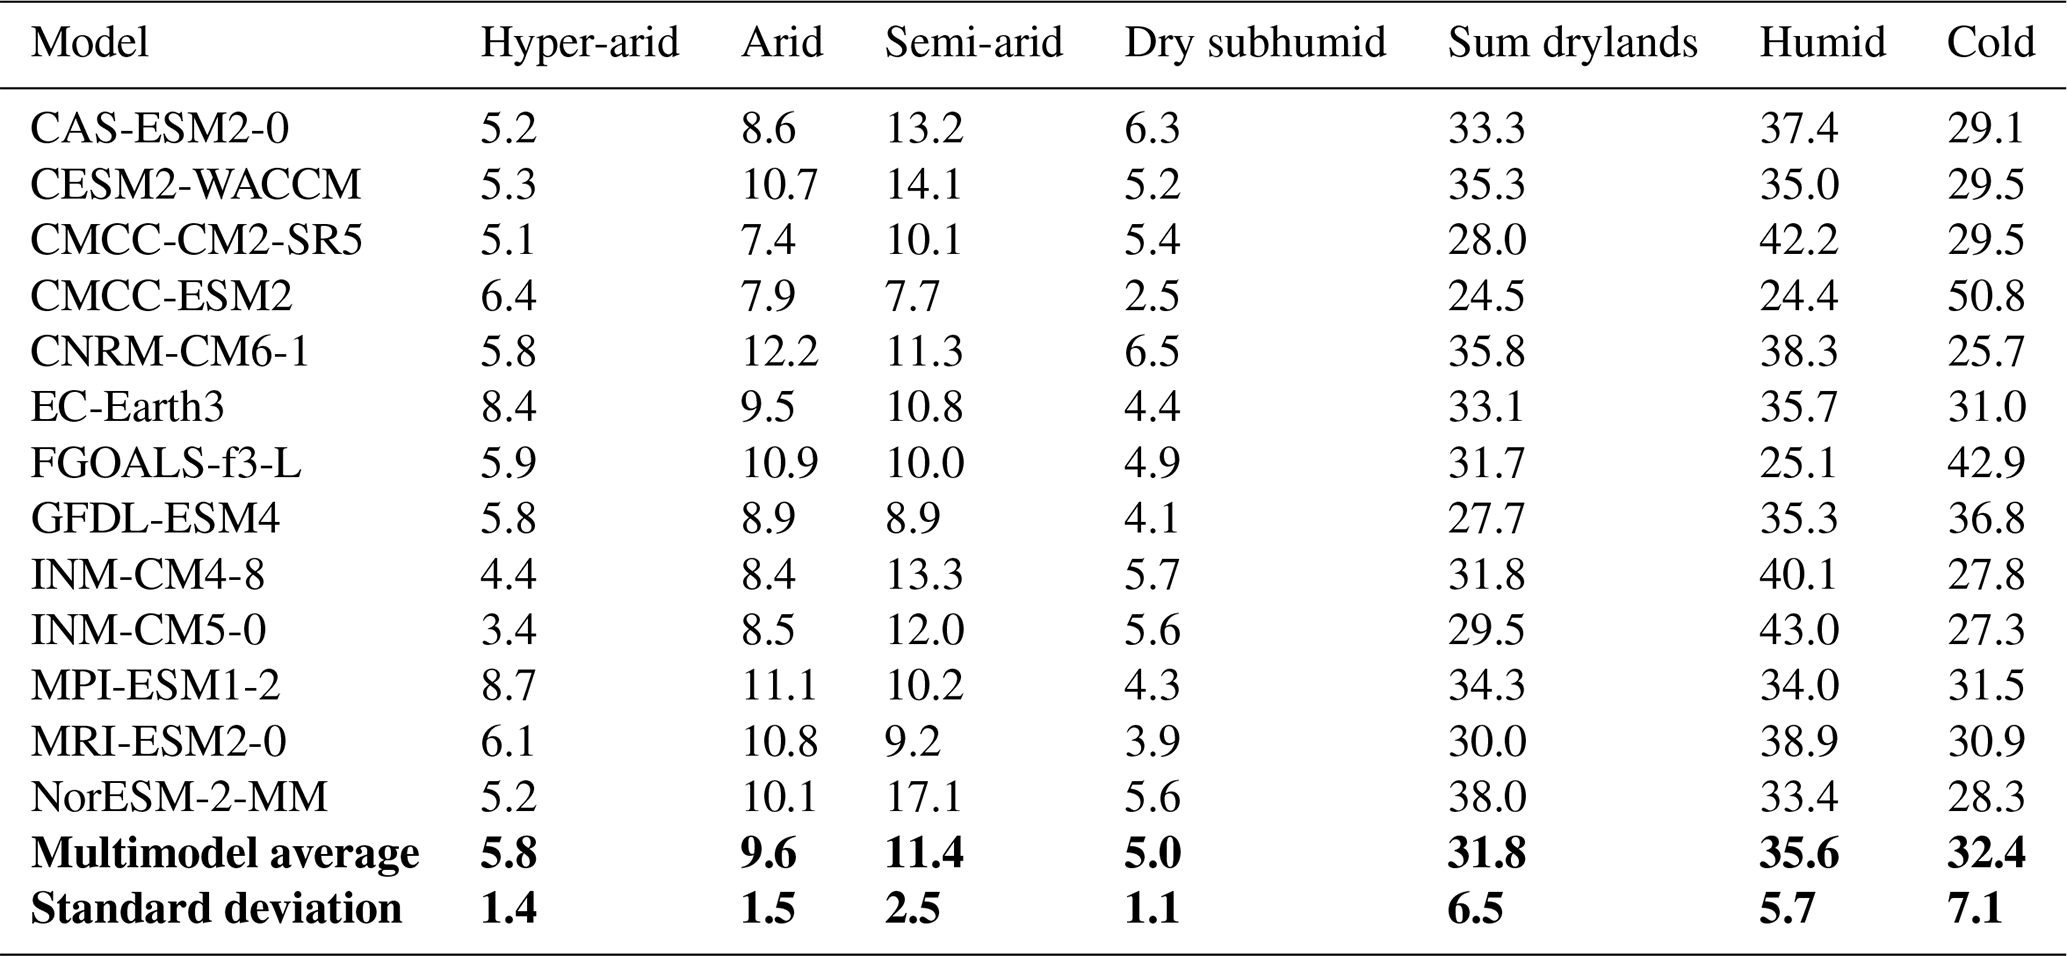
Before calculating the multimodel AI average, the aridity index and corresponding aridity category are calculated for each model in each period and for each grid cell. Then an aridity category is assigned to the grid cell based on the calculated value (Table 1). A summary of the global percentage of aridity category by model is presented in Table 3, excluding Antarctica. The multimodel mean is computed for each grid cell, and the aridity category is determined by this multimodel value. Hence, the multimodel mean in percent is not equal to the mean of the percentages for the 13 models. The percentages of hyperarid, arid, semi-arid and dry-subhumid grid cells are merged into a category “Drylands”. In the 13 models used in this study, this percentage of drylands varies from 24.5 % to 38 %. Only 3 models have a percentage of drylands inferior to the multimodel average. Two of the models had a particularly high proportion of “Cold” grid cells (PET < 400 mm yr−1) compared to the “Humid” category: CMCC-ESM2 and FGOALS.
Unsurprisingly, models developed by the same institution are very similar. CMCC-CM2-SR5 and CMCC-ESM2 are 2 of the 3 “wettest” models, and INM-CM4-8 and INM-CM5-0 also have close results in terms of proportion of drylands. Some of the models in our subset have similarities in the code and results (Pathak et al., 2023). However, this does not always result in similar proportion of aridity categories. For example, EC-Earth-3 and CNRM-CM6-1-HR are supposed to be correlated, and share parts of their code. They have a similar proportion of drylands here (35.8 % and 33.1 %), but differ in their proportion of “Cold” areas (25.7 % compared to 31 %). Similarly, NorESM2, which is supposed to be similar to CESM2-WACCM and CMCC models, has the highest proportion of drylands (38.0 %), while the two CMCC models have the lowest one. Given this variability even in models supposed to be similar, we chose not to weight the models for the multimodel mean.
As a result, the multimodel average is strongly influenced by the wettest and coldest models, with a total proportion of drylands of 28.3 %. However, the multimodel geographical repartition of aridity areas is more consistent with observations than the repartition in each individual model (Fig. S1). The multimodel average is also consistent with the two reference databases, as demonstrated below. Model dispersion will not be further investigated, and we will use the multimodel average from now on.
Table 3Percentage of aridity categories for the 13 CMIP6 models and multimodel average percentage of aridity categories for the reference period 1970–1999. The multimodel average and corresponding standard deviation from now on refer to the global average, and not the average per grid cell. In italics: min and max values in each category.
3.2 Comparison between Worldclim, ERA5 and multimodel CMIP6
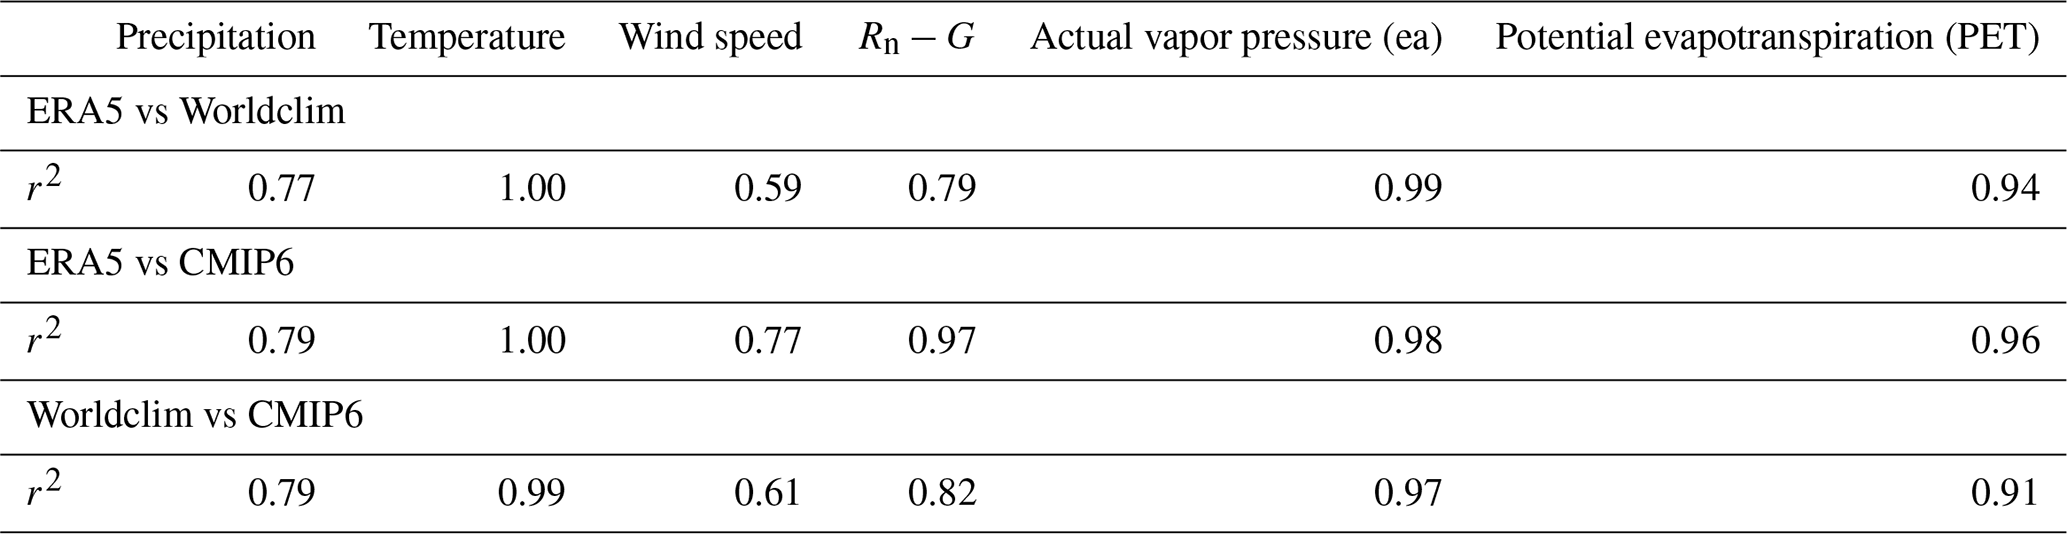
The Worldclim database is commonly used in disciplines such as ecology, biology or biogeochemistry, whereas climatologists rather use more detailed ensembles such as ERA5. These two databases were compared as a basis for evaluating the historical models of the CMIP6 ensemble. Figure 1 shows the violin plots of the main variables in CMIP6, ERA5 and Worldclim: annual mean precipitation, surface temperature, surface wind speed, solar radiation, actual vapor pressure, and the computed potential evapotranspiration. Violin plots display the density curve of the variable over its range, and allows to compare its distribution in different groups. In addition, Table 4 shows the correlation of these variables between CMIP6, ERA5 and Worldclim, represented by r2 (squared Pearson correlation coefficient).
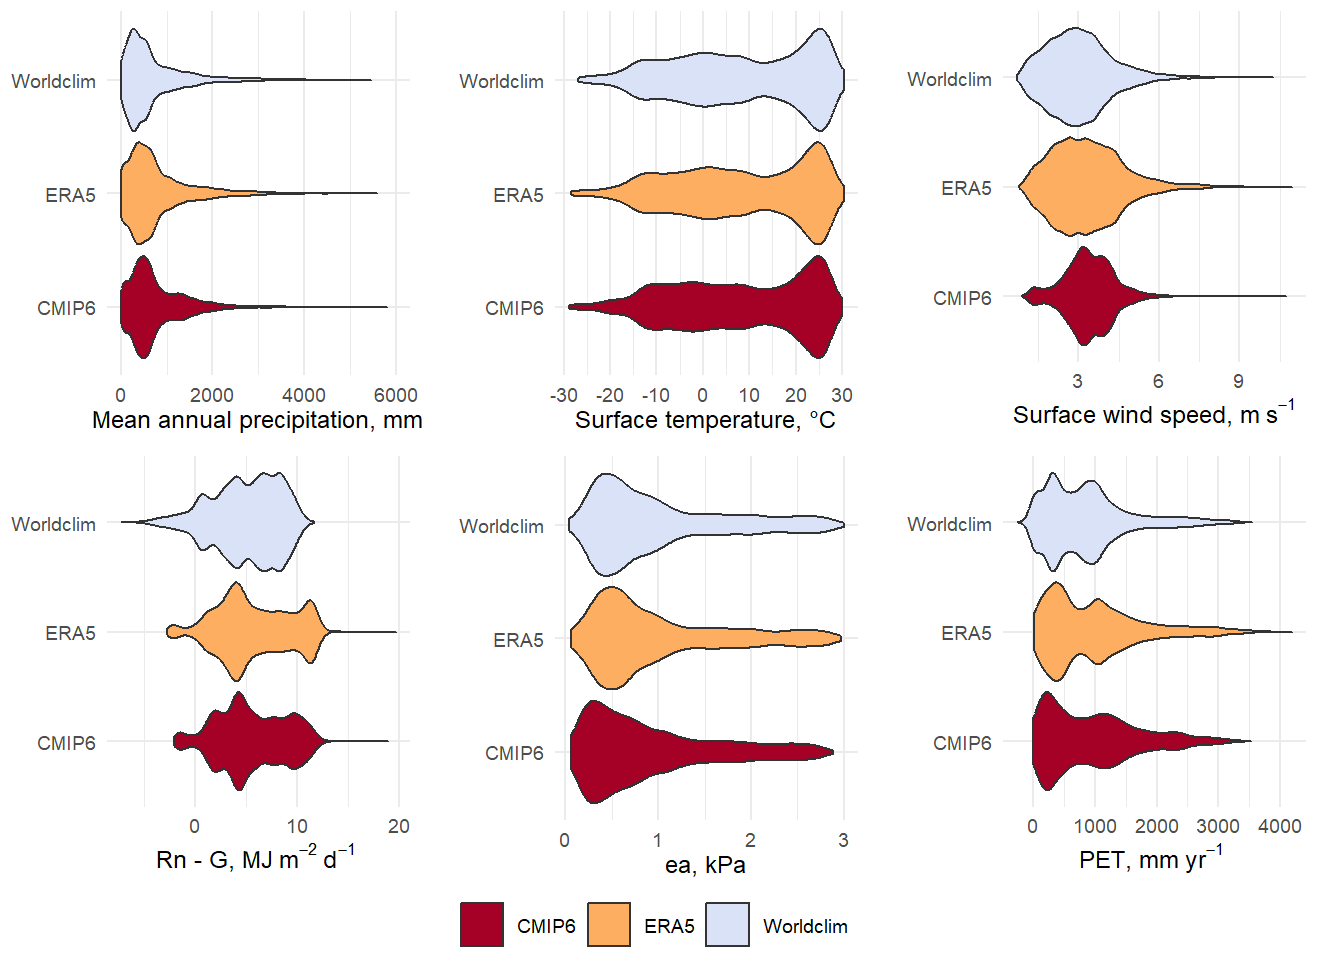
Figure 1Violin plots of the main climate variables in Worldclim, ERA5 and CMIP6. Rn−G represents the net solar radiation minus the soil heat flux, and represents the total heat fluxes at the surface. “ea” is the actual vapor pressure.
All the variables are well correlated with each other, up to an r2 of 1 for surface temperature for the 3 pairs of databases. The actual vapor pressure in the three databases is also highly correlated (r2 = 1 for ERA5/Worldclim and ERA5/CMIP6, and r2 = 0.99 and Worldclim/CMIP6). The annual precipitation, the wind speed and the solar radiation have a higher spread between databases. The shapes of the violins for precipitation are similar, despite higher values in CMIP6. The correlation coefficients are close to 0.9 (r= 0.88 for ERA5/Worldclim, r= 0.89 for ERA5/CMIP6 and Worldclim/CMIP6). The spread is largest for the wind speed, where ERA5 and CMIP6 are more correlated (r= 0.59 for ERA5/CMIP6, r= 0.77 for ERA5/Worldclim, and r= 0.61 for Worldclim/CMIP6). However, the values of wind speed in CMIP6 are mostly comprised between 3 and 5 m/s, while the range is broader in ERA5 and Worldclim. The solar radiation (Rn−G) is also more correlated between ERA5 and CMIP6 than compared to Worldclim (r= 0.99 for ERA5/CMIP6, while r= 0.89 for ERA5/Worldclim and 0.91 for Worldclim/CMIP6). This is also reflected in the shape of the density, with Worldclim having more negative values than ERA5 and CMIP6, no points higher than 12 MJ m−2 d, and most values being comprised between 5 and 10 MJ m−2 d. This difference is due to the different source for the two variables: in CMIP6 and ERA5, Rn−G is calculated as the sum of the flux of latent and sensible heat fluxes, while in Worldclim this term is derived from the total solar radiation and the latitude.
Overall, the discrepancy in wind speed and solar radiation does not impact the strong correlation between the calculated PET in the three databases: r= 0.94 for ERA5/Worldclim, 0.96 for ERA5/CMIP6, and 0.91 for Worldclim/CMIP6. The differences are more reflected in the median value: PET in CMIP6 (809.7 mm yr−1) is similar to that in ERA5 (809.2 mm yr−1), but PET have lower values in Worldclim (median PET = 775.2 mm yr−1).
Table 4r2 for variables, pairwise comparison of databases. All p values were < 2×10⁻¹⁶.
The 30-years average of the aridity index is used to compare ERA5, Worldclim and CMIP6 datasets for the reference period 1970–1999. Figure 2 presents a pie chart showing the percentage of each aridity category for the 3 datasets and for the reference period.
The pie charts highlight the similarities and differences between CMIP6 and the two reference databases. In general, there are less grid cells classified as drylands in CMIP6 (28.3 %) compared to ERA5 (30.4 %) and Worldclim (32.3 %). The proportion of humid grid cells is the highest in ERA5 (42.4 %) compared to CMIP6 (40.1 %) and Worldclim (37.3 %). CMIP6 has the highest share of cold grid cells (31.6 %). This share decreases to 27.1 % in ERA5 and 30.4 % in Worldclim.
Regional differences in the distribution of aridity categories are visible on Fig. 3. Overall, the CMIP6 multimodel categories matches the patterns found in ERA5 and Worldclim. However, several deserts appear in CMIP6 as semi-arid or even dry subhumid areas, whereas they are clearly arid or hyperarid in Worldclim and ERA5.
North America. Deserts are less widespread in CMIP6 compared to the 2 others databases. For example, the Chihuahuan Desert, at the frontier between Mexico and the United States, is in a region that appears as semi-arid or even subhumid in CMIP6. The Great Basin Desert is also much smaller in CMIP6 than in ERA5 and Worldclim. CMIP6 ensemble has proven to have a wet bias in particular over Western US compared to observations (Almazroui et al., 2021).
Central America. CMIP6 is slightly dryer than ERA5 and Worldclim, with some dry subhumid and semi-arid grid cells in the Yucatan Peninsula, Cuba, Haiti and the north of Venezuela. These areas are classified as tropical savannahs in the Köppen-Geiger classification, with a dry winter season (Kottek et al., 2006). This dryer classification can be explained by the dry bias identified by Almazroui et al. (2021) in south Central America and the Caribbean.
South America. In South America, the main differences are visible in the North of Chile (Atacama Desert) and in North Eastern Brazil. North Eastern Brazil is semi-arid in Worldclim and ERA5, but is completely humid in the multimodel CMIP6. Similarly, the Atacama Desert is not hyperarid in CMIP6: only an “arid” band appears. This wet bias has been observed earlier, for example by Reboita et al. (2024) who compared CMIP6 ensemble with reanalysis of temperature (ERA5) and precipitation (Climate Prediction Center Merged Analysis of Precipitation CMAP and Global Precipitation Climatology Project) in 5 subregions of south America. They observed a systematic wet bias in North-eastern Brazil in summer, as well as in the Andean region. Firpo et al. (2022) highlight the dipolar bias in precipitation in North-eastern Brazil and in the Amazonas, by comparing multimodel CMIP6 to the CRU database (Harris et al., 2014). They explain this by a default in the modelling of the maximum precipitation centre in South America, which is located too far east. One of the reasons could be a poor representation of cloud physics. This deficiency was already present in CMIP3 and 5. A bias towards warmer temperatures in south of South America was also found, but this does not seem to influence the distribution of aridity zones.
Europe and Mediterranean Basin. The European continent is divided into humid and cold zones, which do not differ between CMIP6 and ERA5/Worldclim. In the Mediterranean basin, the CMIP6 multimodel ensemble and ERA and Worldclim differ in the Iberian Peninsula. The center and the east of the peninsula are semi-arid and dry subhumid in Worldclim and ERA5, while semi-arid areas are limited to the south in CMIP6. The same pattern is observed in Turkey. It is mostly humid in CMIP6, but the central plateau of Anatolia is semi-arid or dry-subhumid in ERA5 and Worldclim, which corresponds more to the continental conditions observed.
Africa. CMIP6 performs well with all zones well represented. The arid zone in south-west Africa (Namibia, South Africa) is less spread in CMIP6 than in ERA5 and Worldclim. This is consistent with the evaluation made by Almazroui et al. (2020), who noticed a wet bias in this region when comparing CMIP6 to the observations from the Climate Research Unit (University of East Anglia, Harris et al., 2014). In the Arabic peninsula, ERA5 has more hyperarid zones than CMIP6 and Worldclim, but the entire peninsula is arid.
Asia. In Western Central Asia and in India, arid and semi-arid zones are well represented in the three datasets of the three databases. Iran, Turkmenistan (70 % covered by the Kara-Kum cold desert), Uzbekistan and Kazakhstan are mostly arid and semi-arid. However, there are differences in the Tibetan Plateau. In Worldclim, it is classified as arid or semi-arid, whereas some parts are classified as “Cold” in ERA5 and CMIP6. This is due to the particular way “Cold” areas are classified, based on an annual potential evapotranspiration inferior to 400 mm d−1. A cold bias has been found in the region resulting in an underestimation of the potential evapotranspiration (Zhu and Yang, 2020). In particular, temperature in the winter is much colder than observations in a majority of models. This impacts the evapotranspiration: more “cold” grid cells in CMIP6 compared to ERA5. The Gobi and Taklamakan deserts in Western China are visible in the three datasets, but only ERA5 identifies hyperarid areas.
Oceania. the Australian deserts appear as mostly semi-arid in CMIP6, while it is mostly arid in ERA5 and Worldclim. Only the Great Victoria Desert and its closest neighbours are arid, while the Great Sandy Desert, in North Western Australia, is only semi-arid.
Individually, some of the models have a stronger signal in the areas that the CMIP6 multimodel ensemble does not classify as drylands. For example, CESM and NorESM distinctly show North-Eastern Brazil as semi-arid. In addition, the Gobi and Taklamakan deserts are identified as hyperarids in CAS-ESM2, CNRM, EC-Earth-3, MPI, and the deserts of Australia are better represented in the CNRM, EC-Earth3, FGOALS, GFDL-ESM4, and MRI models. Maps are provided in the Supplement (Fig. S1).
However, globally, the multimodel average performs better than any individual model. Table 5 shows the percent of grid cells classified into different aridity categories for the 13 CMIP6 models compared to Worldclim and ERA5, as well as the multimodel average. The percentage of difference between Worldclim and ERA5 is 13.1 %. This percentage rises to 14.7 % when comparing the multimodel average to ERA5 and to 15.1 % when comparing with Worldclim, which is better than any of the CMIP6 models taken individually.
To conclude, the multimodel average reproduces correctly the aridity areas corresponding to the observations and reanalysis of Worldclim and ERA5.
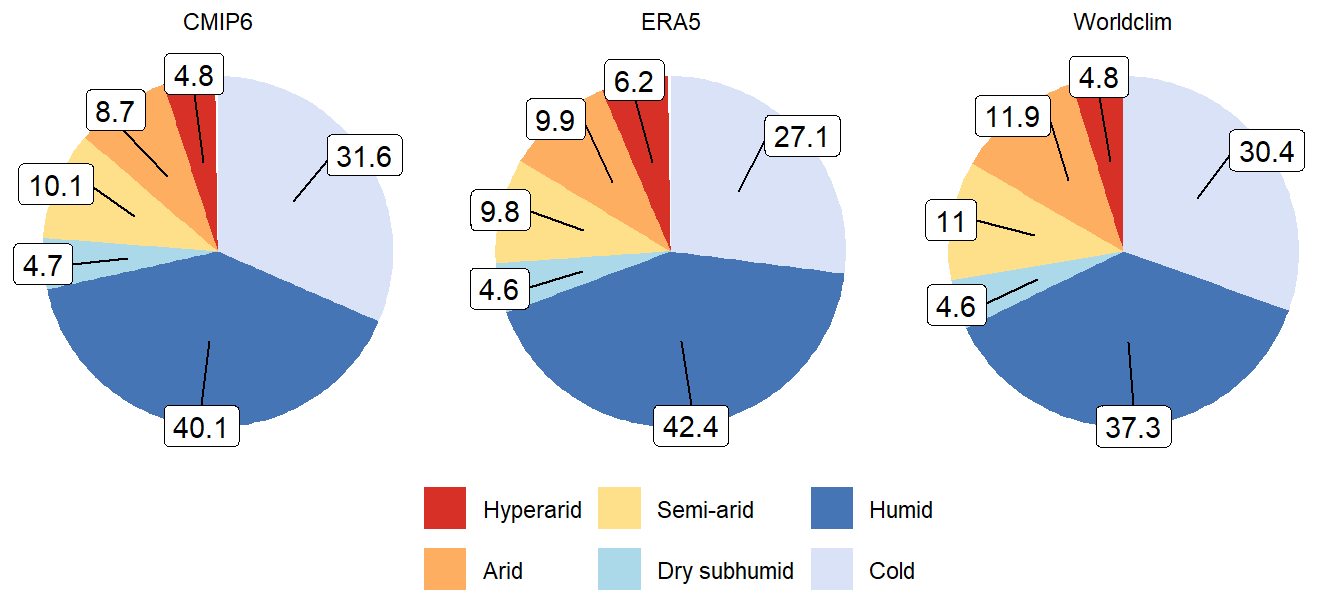
Figure 2Pie chart of the proportion of aridity categories for the datasets CMIP6, ERA5, and Worldclim, excluding Antarctica.
Table 5Proportion of gridcells with a different aridity category for CMIP6 models and for the multimodel average, compared to ERA5 and Worldclim.
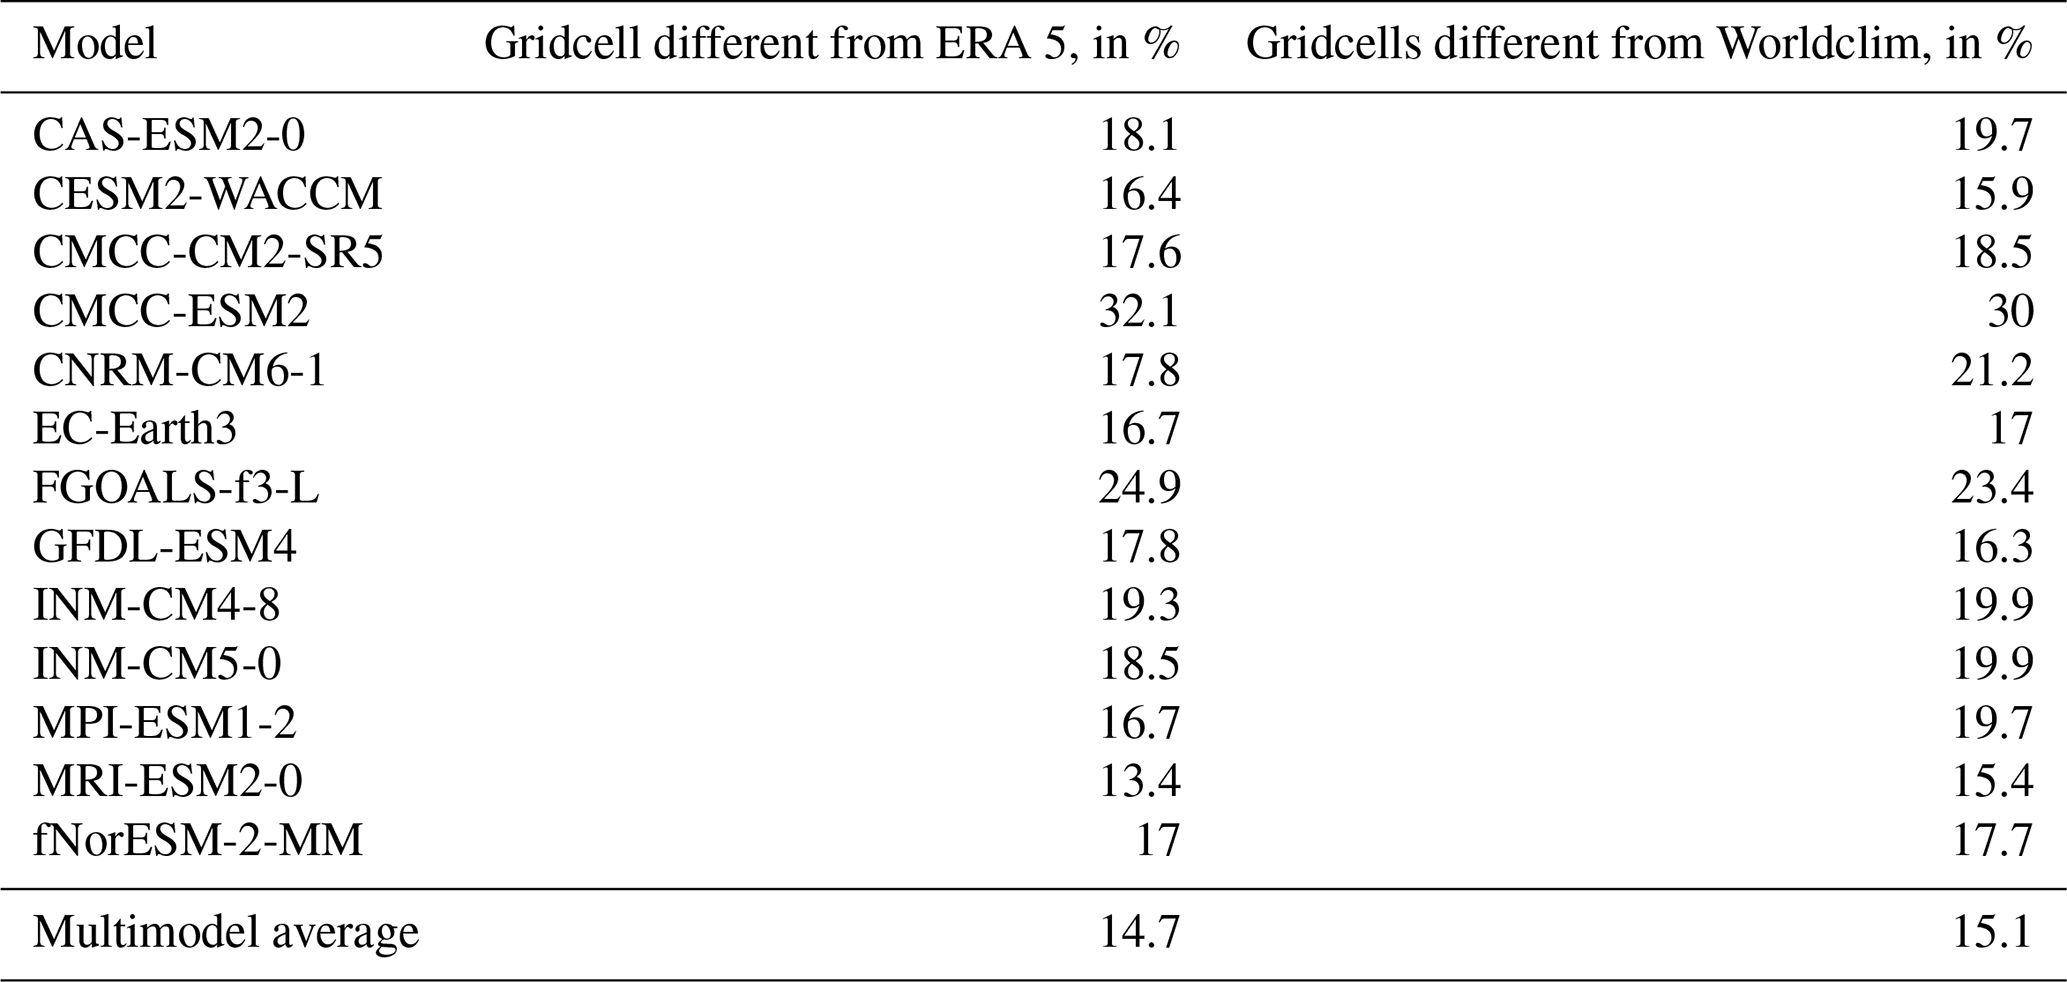
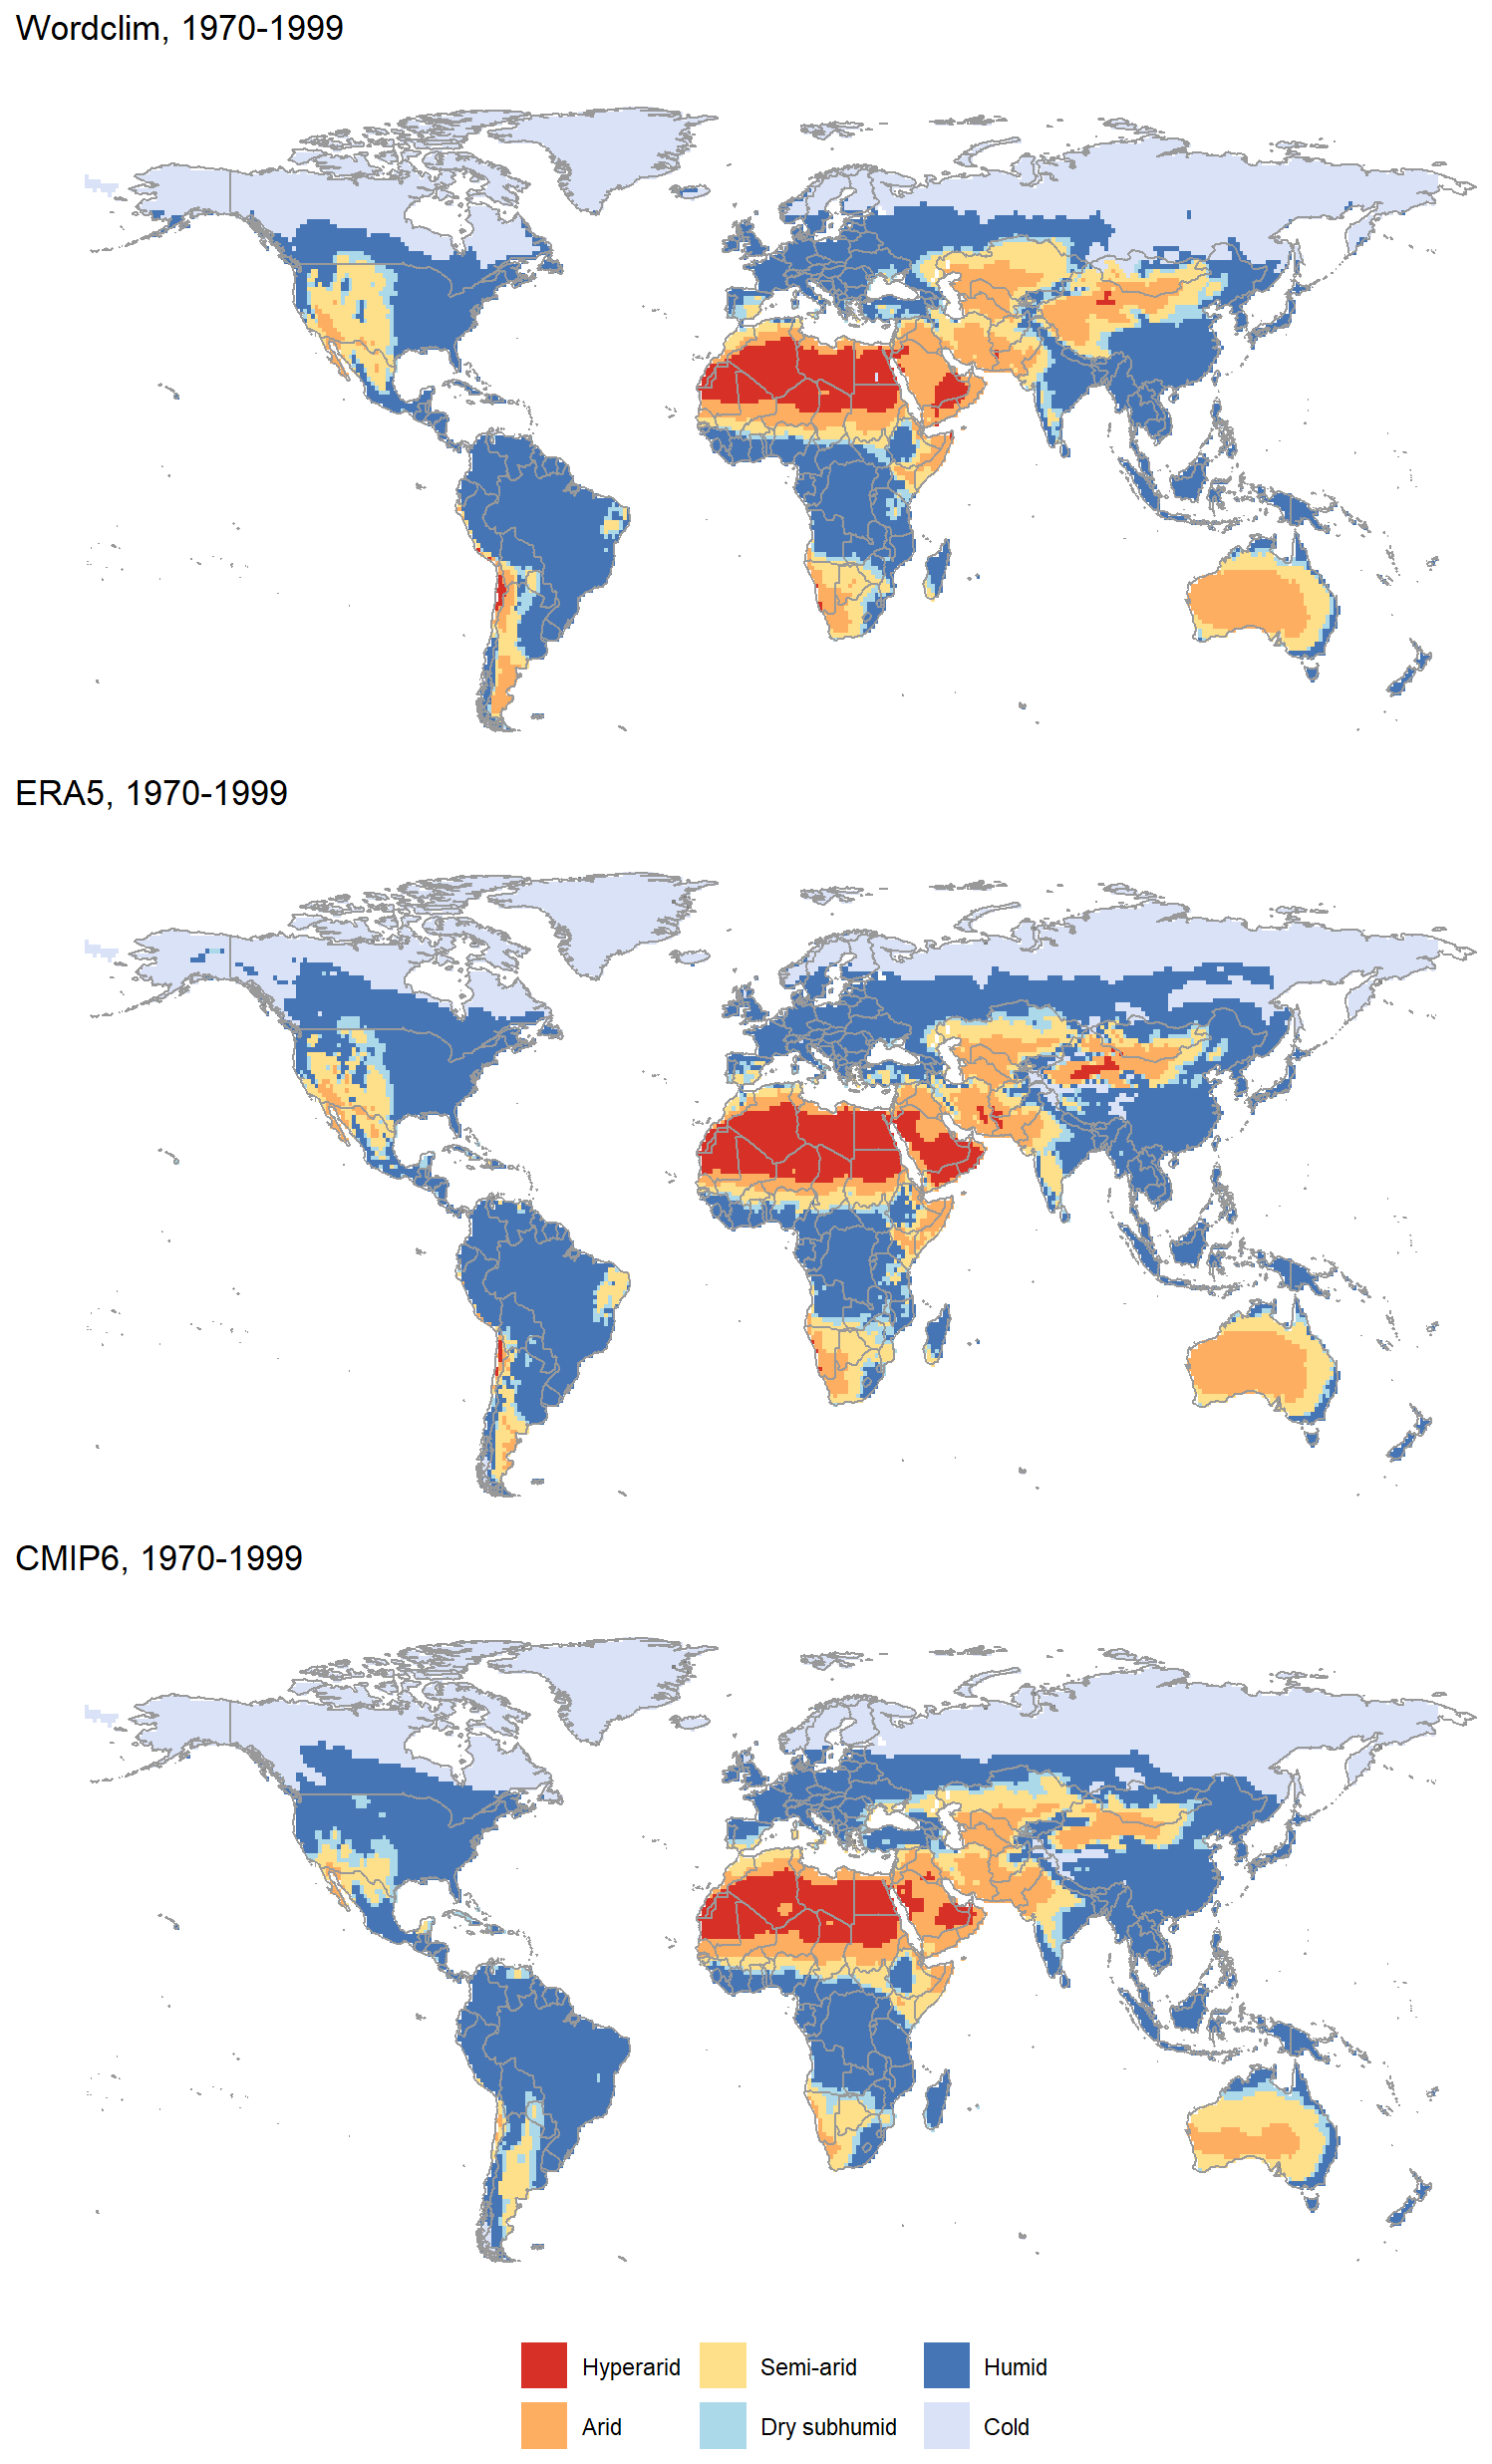
Figure 3Maps of aridity categories for the reference period 1970–1999 for Worldclim, ERA5 and multimodel CMIP6. The maps do not show the Antarctic continent (entirely “cold”), but Antarctica is included in the computation of the proportion of aridity categories.
Here, we intend to diagnose the regions in which climate changes in term of aridity are the most susceptible to happen. We project aridity zones using 13 CMIP6 climate models for 3 of the socio-economic trajectories described in the IPCC's 6th Assessment Report: SSP 2–4.5, SSP 3–7.0 and SSP 5–8.5, for 3 past periods (1850–1880, 1970–1999 and 1985–2015) and 2 future periods (2030–2059 and 2070–2099). The SSP 2–4.5 corresponds to a “middle-of-the-road” scenario in which the emissions remain around current level until 2030, after which most countries achieve their net-zero targets for 2050 under the Paris Agreement. The SSP 3–7.0 is a “regional rivalry” scenario, in which each region acts for itself. No additional climate policy is taken by 2100, and emissions double compared to current levels. In this scenario, emissions include particularly high levels of non-CO2 greenhouse gases and the highest levels of aerosol emissions. The SSP 5–8.5 is also a scenario without any additional climate policy and where future economic development is based on an intensive use of fossil fuels (Chen et al., 2021).
4.1 Evolution of the aridity index value
Figure 4 presents the difference of aridity index between future periods (2030–2070 and 2070–2099) and the reference period (1970–1999) for the three studied SSP. The difference is presented in % for a better understanding, i.e. AI (2070–2099) – AI(1970–1999)/AI(1970–1999).
Polar region. The most impressive changes are located in Greenland, in the northernmost regions of North America, and in the polar archipelagos of Svalbard, Novaya Zemlya and Svernaya Zemlya. The changes vary greatly from cell to cell, ranging from −40 % to +40 %. This is probably due to the large changes in precipitation and temperature in this region, and to the difficulty of modelling the polar regions. The East coast of Greenland is less affected, with a decrease in the aridity index of about −20 %. The temperature increases reach 4 to 5 °C in SSP 2–4.5, but up to 8–10 °C in SSP 5–8.5. In the latter scenario, Greenland experiences a temperature increase of 4 to 9 °C, from south to north. In contrast, precipitation is projected to increase in all these areas, especially in the eastern part of Greenland (+20 % in SSP 2–4.5 and +40 % in SSP 5–8.5).
North America. The strongest aridity changes in North America occur mainly in Alaska, with patterns reminding Greenland, and around the current desertic regions. In the SSP 2–4.5, the whole of Mexico and most of the south of the USA experience a 20 % drying by 2030–2059, increasing to 30 % drying in Mexico and in the South USA by 2070–2099. In particular, the Chihuahuan and Sonoran deserts, which straddle the southern USA and Mexico, become increasingly dryer with changes in aridity down to −40 % in the SSP 5–8.5. The changes in precipitation are relatively similar in the two SSP (−10 % to −20 %) but the temperature increase is more drastic in SSP 5–8.5 compared to SSP 2–4.5: +2.5 °C on average in Mexico in SSP 5–8.5 compared to +1.5 °C in Mexico and South USA in SSP 2–4.5. The rest of Northern America also warms up by an average of 3 °C. Since a wet bias was observed in historical projections of CMIP6 compared to Worldclim and ERA5, the drying projected in CMIP6 is likely to be stronger in the 3 scenarios.
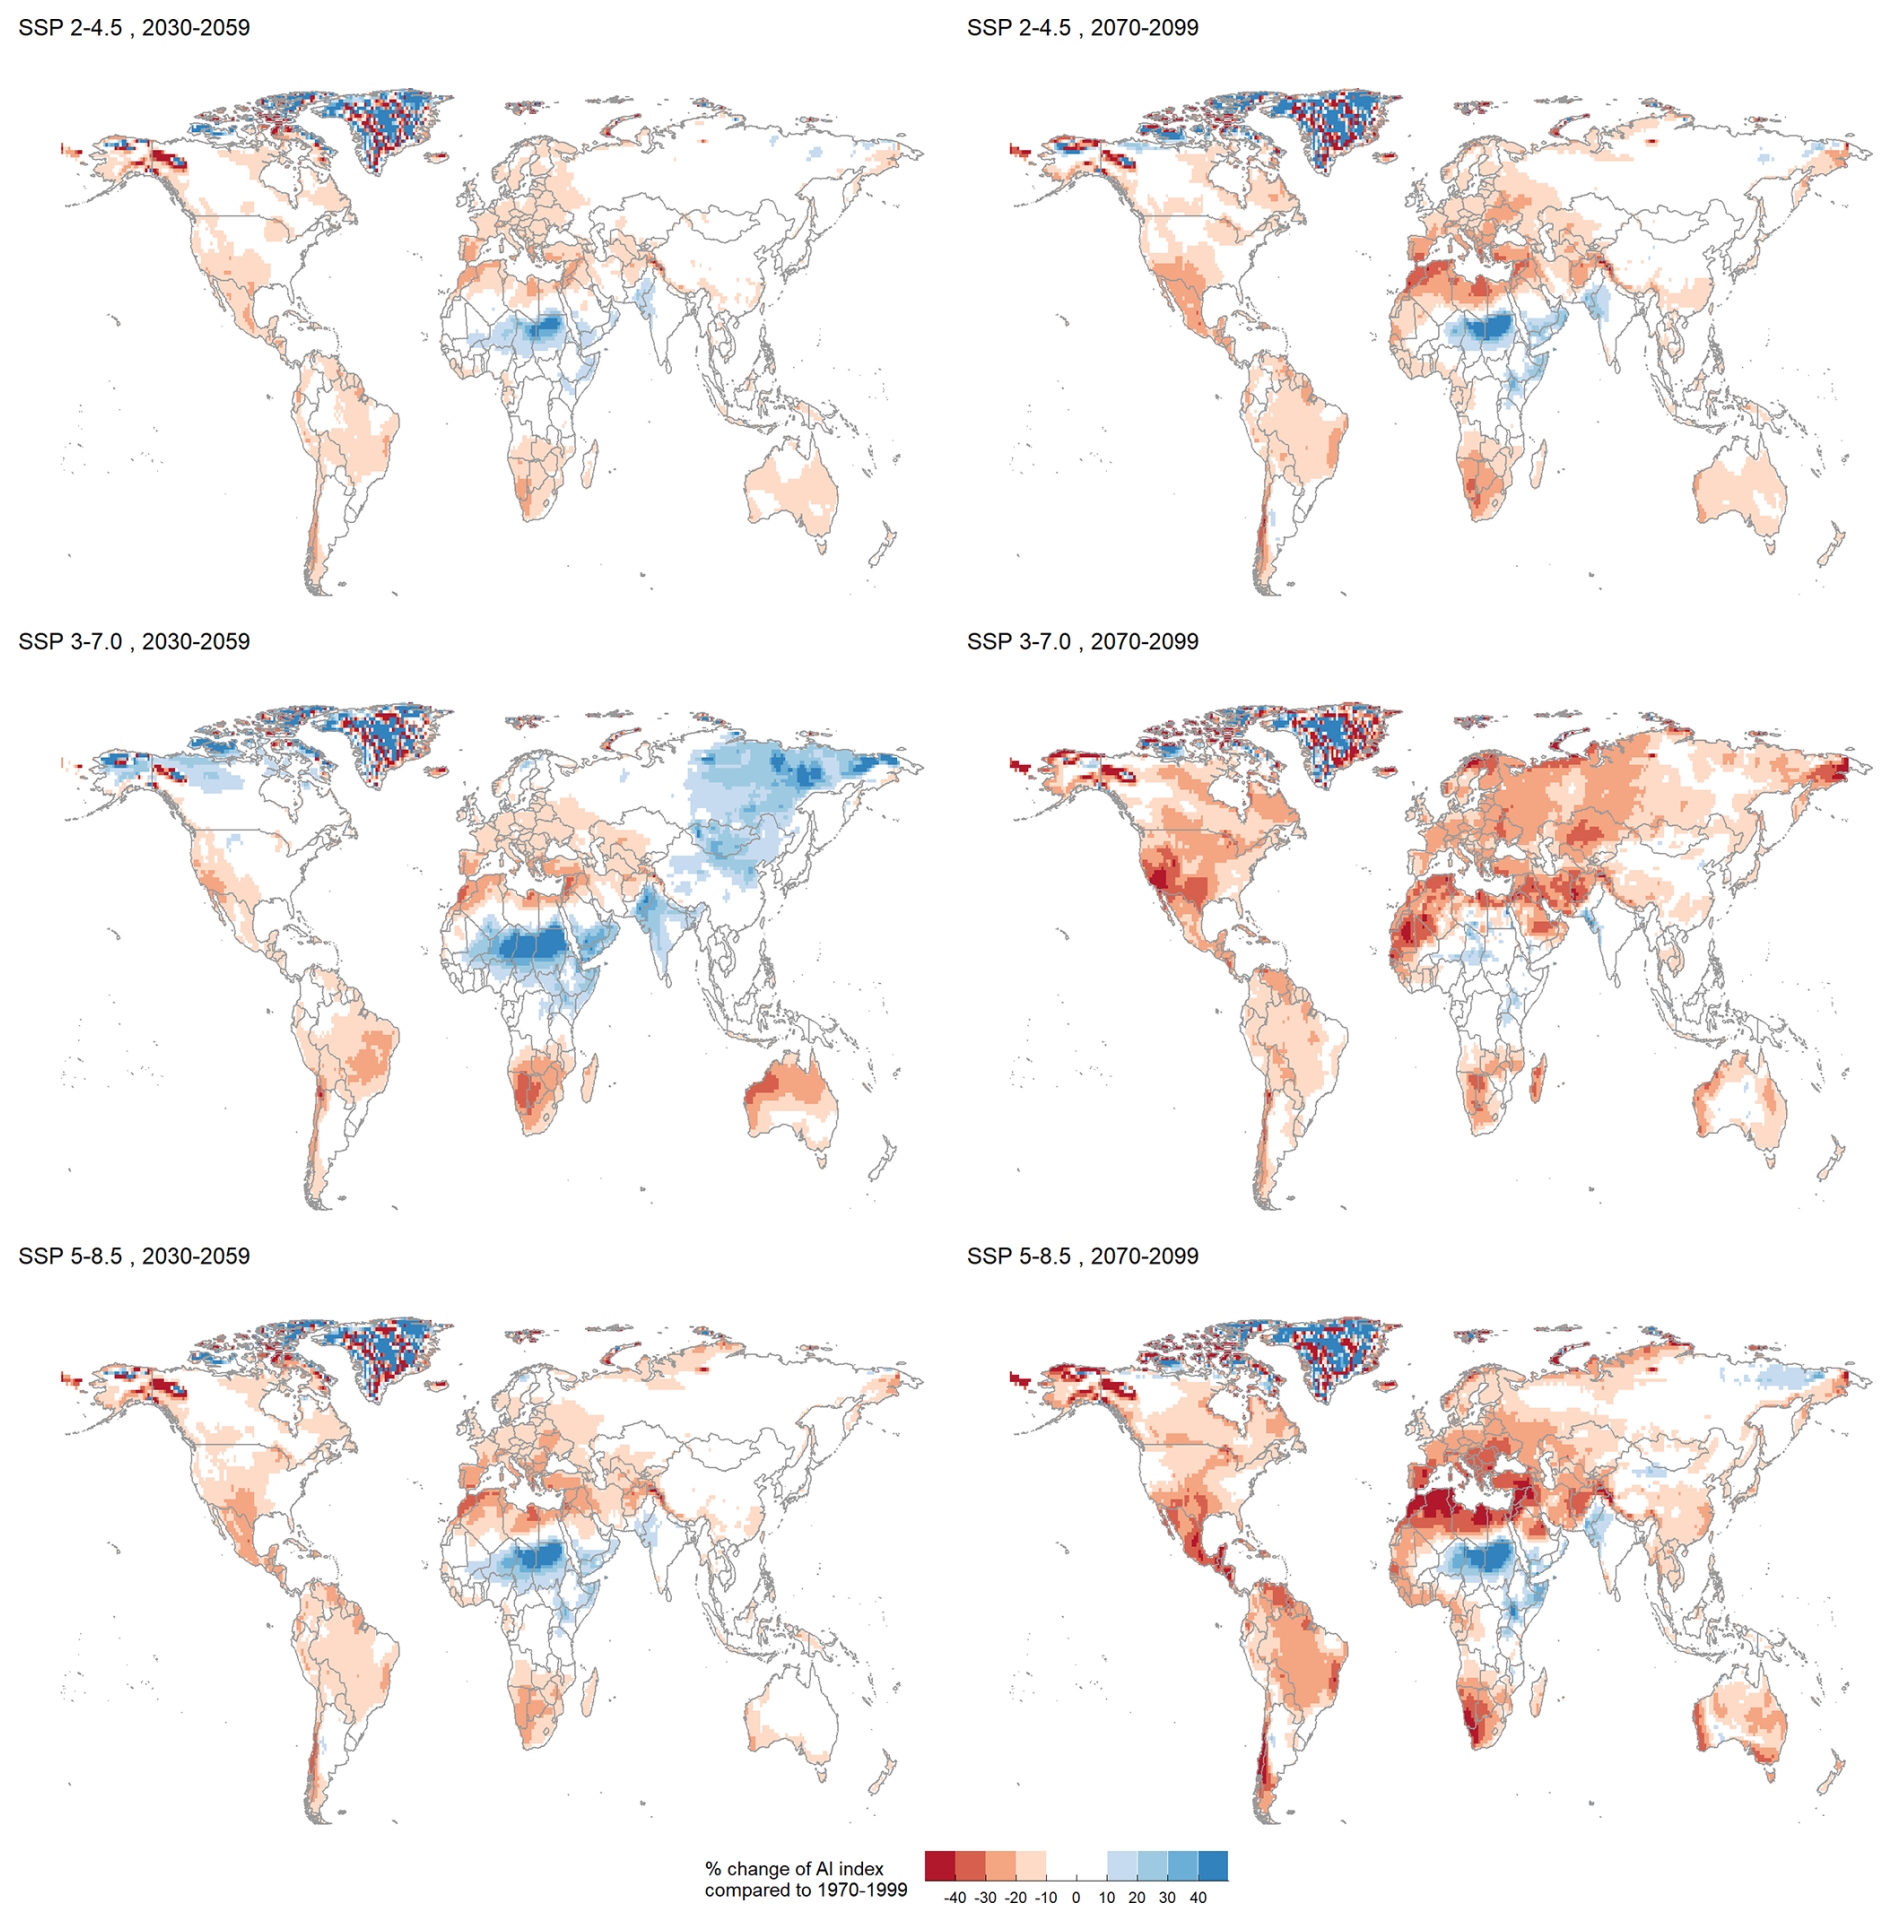
Figure 4Change in % of aridity index compared to the reference period 1970–1999 for SSP 2–4.5, 370 and 585 for two future periods: 2030–2059 and 2070–210. Hatched areas correspond to areas where at least 10 models over 13 agree on the sign of change.
Central and South America. In all scenarios, a decrease at least equal to 20 % of the aridity index is observed in Central America, on the Caribbean coast, in the central Brazil and in the southern part of Chile and Argentina, with the highest decrease observed for the SSP 5–8.5, period 2070–2099. The dry bias identified by Almazroui et al. (2021) for the Carribean and Central America in historical runs of CMIP6 probably results in an overestimation of the drying in these regions. The north-east part of Brazil, nowadays classified as a desert, is located in a region where there is almost no change in aridity index. Overall, the temperature in South America increases, from 1 to 3 °C in SSP 2–4.5 to more than 4 °C in SSP 5–8.5 In SSP 3–7.0, the increase in temperature is comprised between 2 and 4 °C.
In the three SSP, the precipitation patterns change mainly in the south of the continent (precipitation decreases in the south of Chile and increases in some parts of Patagonia). In SSP 5–8.5, there is a general decrease of precipitation in Central America. These decreases coincide with the areas where the strongest changes of aridity index are predicted.
Europe and Mediterranean basin. In SSP 2–4.5, there is overall decrease in the aridity index of between −10 % and −20 %. This excludes the Mediterranean coast, especially Spain, Italy, Greece, South-west France, and Ukraine. The aridity index decreases by more than −30 % in the South of Spain. In SSP 5–8.5, the same pattern with more regions with decreases below −30 %: whole of Spain and Italy, Yugoslavia, Greece etc. The region of up to 20 % drying extends to the North of France and most of Germany and Poland. Parts of Northern Norway and Sweden are affected by similarly large decreases in aridity index, as well as the high plateaus of western Norway, and Iceland. In most of Europe, this pattern results from an overall higher temperature, which reaches up to 3 to 4 °C in SSP 2–4.5 in continental Europe and up to 5 to 6 °C in SSP 5–8.5 in continental and northern Europe. In the Mediterranean region, the decrease of precipitation (−10 % to 20 % in Spain, Italy and North Africa) accentuates the drying. The historical multimodel ensemble for CMIP6 was in good accordance with Worldclim and ERA, except for the Iberian Peninsula and Anatolia that were more humid in CMIP6. Otherwise, no bias is expected for the CMIP6 projections in this region.
Africa. The most striking changes are predicted in the Sahara region. Since the initial aridity index is inferior to 0.03 (hyperarid region), very slight changes can have a high impact on the percent change. For example, a 40 % wetting is observed in south-east Sahara/oriental Sahel region. This increase could be associated with a warming of the atmosphere, resulting in increased rainfall intensity during the wet seasons, with flood periods alternating droughts (He et al., 2023; Palmer et al., 2023).
In the Namib and Kalahari deserts, and more generally in South Africa and Namibia, the aridity index is predicted to decrease from −20 % in SSP 2–4.5 to more than −40 % in SSP 5–8.5. These two regions were wetter in historical CMIP6 compared to ERA5 and Worldclim, which could result in aridity index values even lower than those projected in CMIP6. In CMIP6, the drying is explained by a −10 % to −20 % precipitation decrease in Maghreb and Kalahari, in addition, the average temperature increases by up to +3–4 °C (SSP 2–4.5) and to 4–5 °C (SSP 5–8.5).
The west coast of Africa also experiences drying, from −10 % change in the aridity index in SSP 2–4.5 to −20 % in SSP 5–8.5. The warming is limited to 2 to 4 ° C in SSP 2–4.5 and 3 to 5 °C in SSP 5–8.5, but changes in precipitation range from a slight increase in SSP 2–4.5 (no more than +10 %) to a slight decrease in SSP 5–8.5 (less than −10 %).
In the Arabic peninsula, the south (Yemen and Oman) is marked by an increase of aridity index, more widely spread in SSP 2–4.5 than in SSP 5–8.5. A drying in the North of the peninsula with decrease of aridity index of more than 40 % in 2070–2099 is noted in Iraq, North of Saudi Arabia, Jordan. In SSP 3–7.0, there is no trend of wetting, and a drying is observed mainly in the centre of Saudi Arabia.
Asia. The western part of Asia is already largely composed of drylands, with arid deserts such as the Karakum and Kyzyl-kum deserts. However, the aridity index continues to drop in the short term as well as in the long-term.
In the Indian subcontinent, the aridity index varies between −10 % and 10 %. The most important changes occur in the South-West, in the province of Kerala. An increase of aridity index between 10 and 20 % at the frontier between India and Pakistan, as well as in Pakistan, in the region of the Thar desert that is currently classified as semi-arid or arid. The changes in the south can be explained by the temperature increase of 1 to 2 °C in SSP 2–4.5 over most of the subcontinent. In the SSP 5–8.5, this increase reaches up to 3 to 4 °C. This is the only region in India where the precipitation intensity does not change or slightly decreases compared to 1970–1999. In the north-west, the temperature increases much more (2 to 3 °C in SSP 2–4.5 and 4 to 5 °C in SSP 5–8.5), but precipitations also increase particularly along the border between India and Pakistan (+10 %–20 % in both SSP). This increase in rainfall therefore counterbalances the increase in temperature.
In the North-East of Russia, the aridity index decreases by −20 % to −30 %, while some small regions have an increasing aridity index. Models predict an increase of precipitation in this region by 10 %–20 % and 20 %–30 % in SSP 2–4.5. This increase goes up to 50 % in the SSP 5–8.5. Temperature will also increase by 4 to 5 °C in SSP 2–4.5, 5 to 8 °C in SSP 3–7.0 and 7 to 9 °C in SSP 5–8.5. In SSP 5–8.5, the effect of temperature on evapotranspiration dominates, and the drying occurs mainly along the coast from the Bering Strait to South Korea and Japan.
A large band in the south of China has a decreasing index down to 20 % in SSP 2–4.5. This corresponds to the currently humid part of China that warms the most (semi-arid and arid regions, in the West which warm much more but do not experience such a decrease in aridity index), while little change in precipitation in any of the 3 SSP. In SSP 3–7.0 and 5–8.5, this area is much larger.
Some regions of south-east Asia also experience a slight drying (less than 20 %). In SSP 5–8.5, the areas experiencing drying are the same, but more widespread; while in SSP 3–7.0, there are a few changes in aridity across the region except in Thailand, Cambodia and Vietnam. Temperature increase is uniform and limited in this region: 1 to 2 °C in SSP 2–4.5, 2 to 3 °C in SSP 3–7.0 and 4 to 5 °C in SSP 5–8.5. Precipitation changes little in SSP 2–4.5 and SSP 3–7.0, with changes falling in the range −10 %/+10 %. However, up to +30 % increase is expected on some islands in SSP 5–8.5.
No changes are projected in the Tibetan plateau, the area where most differences were observed in CMIP6 compared to Worldclim and ERA5 in the region.
Oceania. In SSP 2–4.5, a decrease of aridity index by 10 % to 20 % is observed over almost the entire island of Australia and New-Zealand. There is little change between the periods 2030–2059 and 2070–2099, indicating that the drying will occur in the short term. In SSP 5–8.5, the aridity index changes only on the west coast in 2030–2059 and in New Zealand, but decreases much more in 2070–2099, down to −40 % in the west and in the south. These areas correspond to the regions in which the annual precipitation decreases between −10 % and −20 % by 2099.
A decrease in aridity index is projected for central Australia in SSP 2–4.5 and SSP 5–8.5. In SSP 2–4.5, the decrease is between −10 % and −20 %. Precipitation changes slightly, between −10 % and +10 %, but the temperature increases by 1 to 3 °C. In SSP 5–8.5, the aridity index decrease reaches −30 %, with almost no change in precipitation except for an increase of up to 40 % in the Great Victoria Desert (a region where the aridity index does not change), while the temperature increases between 3 and 5 °C.
In SSP 3–7.0, the temperature increases between 2 and 3 ° C by 2070-2099, while precipitation increases by up to 40 % in central region of Australia. This results in a decrease of the aridity index on the coastal areas in of the island, but not in the central areas. The period 2030–2059 is actually dryer than the period 2070–2099, with a 10 %–20 % decrease of precipitation intensity resulting in a 10 %–40 % decrease in the aridity index on the island. Most Australian deserts were wetter in historical CMIP6 compared to ERA5 and Worldclim. This wet bias might affect the final results in aridity index, lower than those projected with CMIP6.
Is it worth noting that the SSP 3–7.0 is overall different from the others two SSP. The period 2030–2059 is marked by an increasing aridity index in a large region of Central and Eastern Africa, India and North East Asia. This trend is reversed in the period 2070–2099, in which the aridity index decreases in most places, in particular in the Arabic peninsula, in India, in North-East Asia and North-West America for the period 2030–3060. The difference with the two other SSP is less visible for the period 2070–2099. The humidification observed for the period 2030–2059 could be explained by the introduction in this scenario of a larger amount of aerosols compared to the 2 others (Cross-Chapter box 1.4, in Chen et al., 2021). Aerosols can have both direct and indirect effects on local climate. In particular, light-absorbing particles such as sulfate aerosols increase the clouds albedo via increasing the number of cloud droplets and the cloud lifetime. In the SSP 3–7.0, the emission of light-absorbing aerosols and in particular sulfate aerosols, increases until 2050 and return to 2015 levels by 2099 (Lund et al., 2019). This is consistent with the wetting projected in SSP 3–7.0 in the two regions where aerosols or aerosols precursors emission is the highest: first over tropical rainforests, and second in Asia because of rapid industrial and urban growth. However, the uncertainty around aerosol impacts sis high. Dark aerosols that absorb the light warm the atmosphere surrounding them, resulting in lower convection and cloud creation; or directly reducing the albedo if deposited over light surfaces. The net result of the cooling and warming effects is delicate to estimate, in addition to properly taking into account the distribution and properties of aerosols regionally, as shown for Asia in Ramachandran et al. (2022). Overall, a scenario such as the SSP 3–7.0 that present more uncertainties and contrasts than the others two, will lead to higher adaptation costs, since the climatic conditions can switch drastically between the mid-term and the long-term horizons.
Figure 5 shows the average trend followed by the aridity index by continent and by SSP. A visualization by sub-region, as well as the relative evolution of temperature and precipitation by continent and by subregion, are available in Supplementary (Tables S2 to S10 and Figs. S10 to S17). The direction and speed of change are clearly visible: for most continents, the most rapid changes in the aridity index occur between the reference period 1970–1999 and the near future 2030–2059, and continue to decrease until the end of the century, but at a slower rate.
This is particularly visible for Central and South America, the Mediterranean region and Oceania, in SSP 2–4.5 and 5–8.5. In these regions, the changes in aridity index are driven by the conjunction of increasing average temperatures and decreasing average precipitation. In SSP 3–7.0, the average aridity index in Oceania decreases down to −20 % in the near future and increases in the far future.
North America is the continent with the highest model dispersion in aridity index, with standard deviation exceeding 100 % of the average value. In SSP 2–4.5, the aridity index slightly decreases in the short term, before increasing again in the long term. In SSP 5–8.5, the average aridity index does not change in the near future, but decreases in the long term. In SSP 3–7.0, the drastic increase in aridity index (> +20 %), indicating wetter conditions, is followed by a strong decrease (−15 %) in the long term. This responds to the strong wetting of northern part of the continent in the period 2030–2059, followed by the drying of most of the continent in 2070–2099. In SSP 2–4.5 and 5–8.5, both temperature and precipitation increase steadily, up to an average of +7.5 °C in 2070–2099 for SSP 5–8.5 and a 20 % average increase in precipitation over the same period. This is again driven by the northern part of the continent, which experiences the most drastic changes.
In Europe, the aridity index decreases steadily in the three SSP. In SSP 3–7.0, the mid-term decrease is only half of the long-term decrease, while in SSP 2–4.5 most of the decrease happens in the first half of the century. Both temperature and precipitation increase in SSP 2–4.5 and SSP 5–8.5, but the influence of the temperature on the potential evapotranspiration exceeds that of the increase in precipitation, as the aridity index decreases. The strongest decrease is observed for SSP 3–7.0 in the period 2070–2099. In some regions, the near future will bring a wetter average climate (South and East Asia, Oriental Sahel), but the trend will be reversed by the end of the century. The North American case is the one with the highest discrepancy, but also with the greatest intermodal variability.
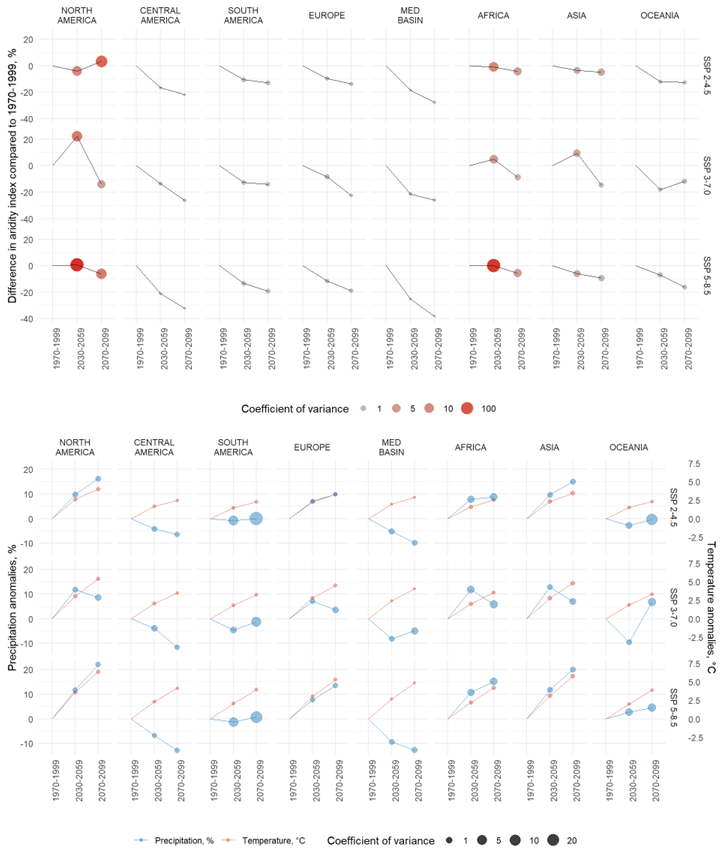
Figure 5Evolution of the mean aridity index in % (up) and of the mean precipitation anomalies (%) and temperature anomalies (°C) (down) by continent in the socio-economic pathways 2–4.5, 3–7.0 and 5–8.5 (Polar continent, including Greenland, Iceland and Svalbard islands, are not included).
4.2 Towards more drylands
In analysing the changes in aridity index globally it can be seen that significant changes occur even in areas that are considered to be cold or humid. In addition, the change in aridity index sometimes leads to a change in aridity category.
Figure 6 shows the proportion of each aridity category is represented by SSP and by period. The overall proportion of drylands (hyperarid, arid, semi-arid and dry subhumid areas) increases in all SSP but the majority of the land (excluding Antarctica) remains in the “humid” or “cold” categories. For example, Central America is classified as “humid” in the CMIP6 multimodel average for the reference period 1970–1999, but will experience drastic decreases in aridity index, especially in SSP 5–8.5, without leading always to a change in aridity category. This is also noted in South America and Europe (Fig. 4). In general, the proportion of drylands in the historical runs for CMIP6 was lower than the proportion of drylands observed in ERA5 and Worldclim (28.3 compared to 30.4 and 32.3 %, respectively). Therefore, the repartition of drylands in the CMIP6 projections is likely to slightly underestimate the total proportion of drylands.
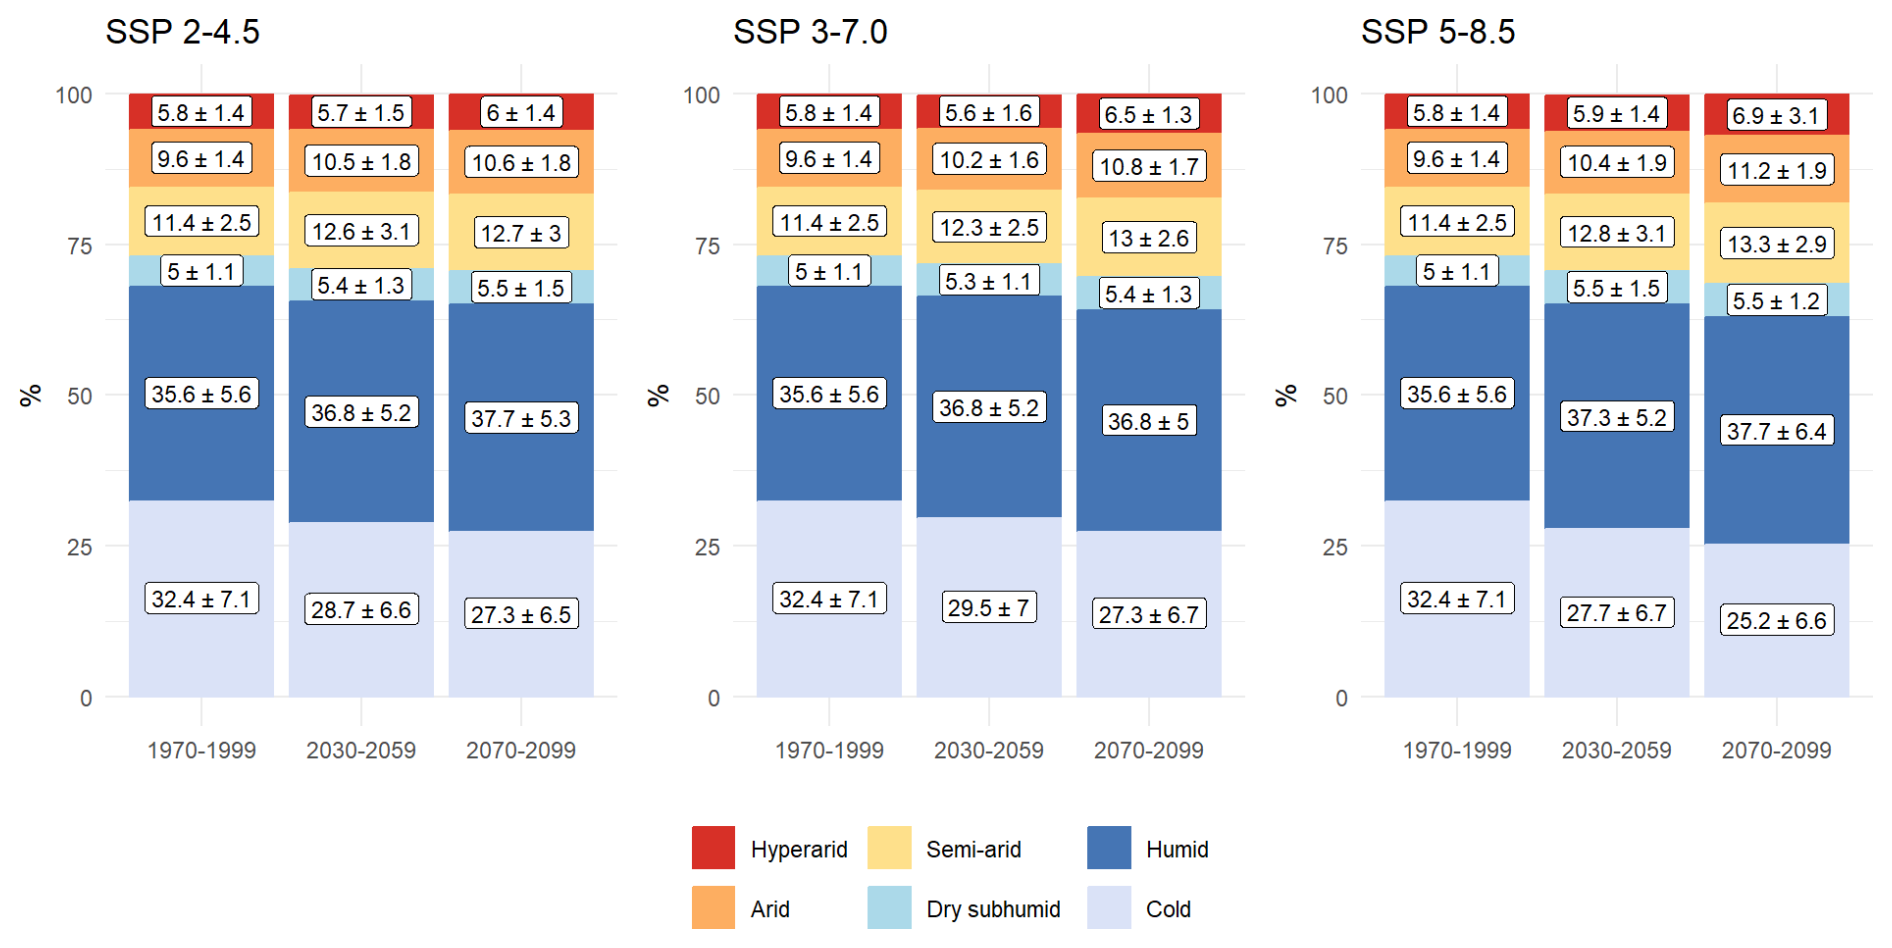
Figure 6Evolution of percentage of aridity categories in the socio-economic pathways SSP 2–4.5, SSP 3–7.0 and SSP 5–8.5. The proportion of each aridity category represents the average of the 13 CMIP6 models, accompanied by the standard deviation.
The most extreme projected changes in category, corresponding to the SSP 5–8.5, are represented on Fig. 7. The corresponding figures for SSP 2–4.5 and SSP 3–7.0 are available in the Supplement (Fig. S8).
North-America. Drylands in North America are expanding northwards and southwards. The Sonoran Desert becomes increasingly arid and the Chihuahuan Desert expands to the south, east and north. A dry subhumid zone appears North-East of the Great Basin Desert, in a region that used to be humid.
Central-America. The dry subhumid areas in Cuba, Haiti and the Yucatan Peninsula become semi-arid. The dry subhumid/semi-arid area in the north of Venezuela becomes mostly semi-arid.
South-America. The dry subhumid/semi-arid area in Argentina and Paraguay becomes mostly semi-arid and extends towards Brazil and Bolivia. Some other areas in Patagonia become semi-arid. Finally, a Brazilian region in the east becomes subhumid, when it was classified as humid before.
Europe. Little changes, except that the cold to humid limit moves northwards.
Mediterranean basin. The hyperarid areas of the Sahara moves northwards, and the semi-arid North African regions become arid. The semi-arid and dry subhumid areas expand in Spain, Italy, Greece and Turkey.
Africa. The Arabic Peninsula becomes mostly hyperarid. In South Africa, the semi-arid and arid areas expand around the Namib and Kalahari deserts. In the Horn of Africa, some regions shift to a wetter category. The north-east of Somalia shifts from arid to semi-arid.
Asia. Most of the category changes occur in the western part of Asia. The northern boundary of the central Asian deserts (Kara-Kum, Kyzyl-Kum) moves northwards, but no major changes occur in the Taklamakan and Gobi deserts.
Oceania. In Australia, the arid and semi-arid areas expand towards the north-east coast, which was previously dry subhumid or humid.
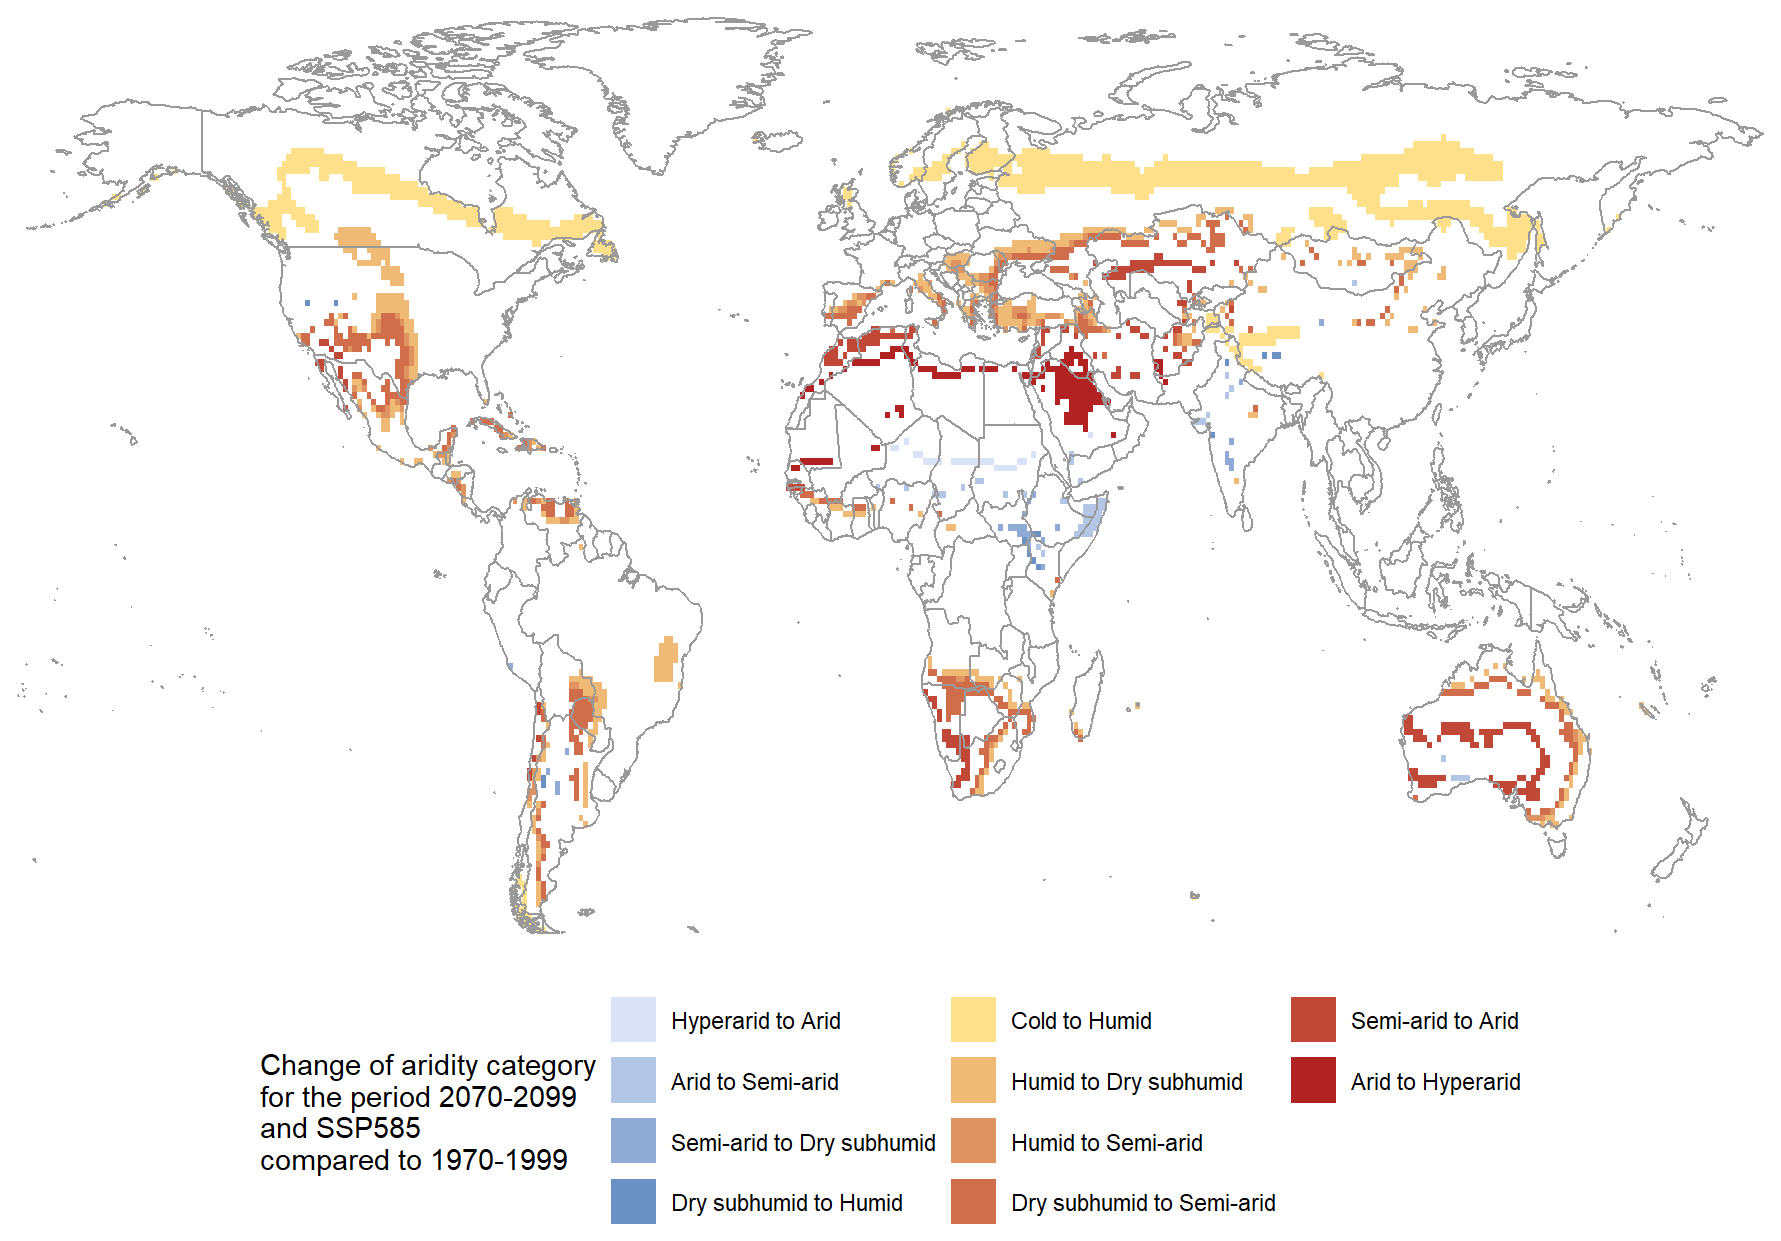
Figure 7Grid cells changing towards a dryer category compared to 1970–1999 for the SSP 5–8.5, period 2070–2099.
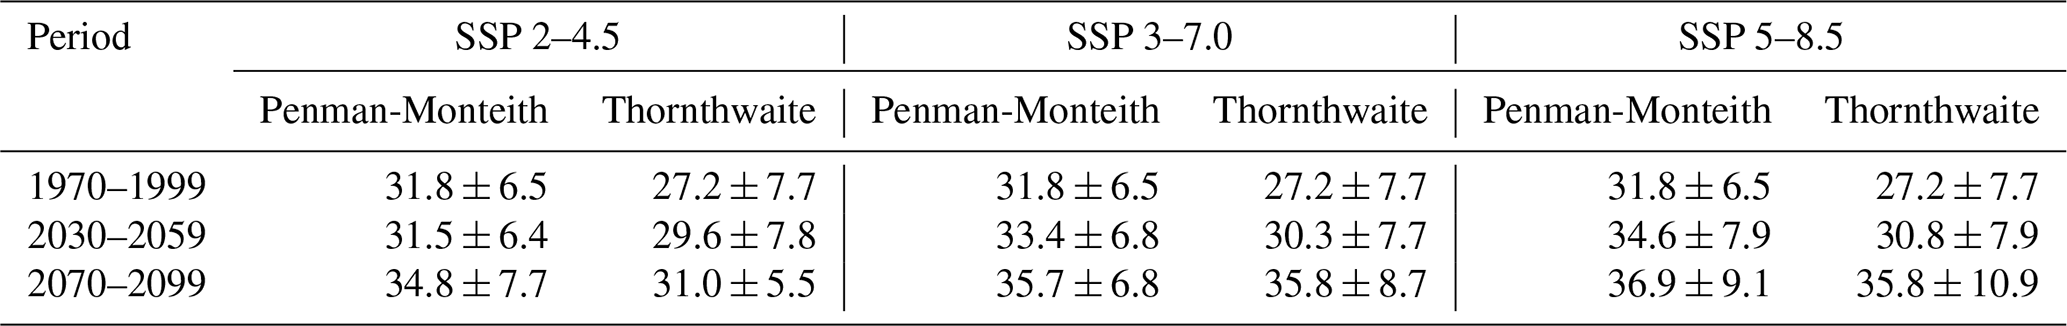
Overall, we find that with the PM equation on our CMIP6 data, the extent of drylands during the reference period is 31.8 %. This extent increased by 3 %, 3.9 % and 5.1 % in SSP 2–4.5, SSP 3–7.0 and SSP 5–8.5, respectively. These trends meet the results presented in the UNCDD report (Vincente-Serrano et al., 2024), with North-America, Latin-America and Europe being the continents most impacted by drying trends. In the report, the initial extent of drylands calculated is higher than in our study (40.6 % of the land area for the reference period 1990–2020), but the projected expansion slightly lower (around 2 % in SSP 2–4.5, less than 3 % in SSP 3–7.0, around 4 % in SSP 5–8.5). To further compare our data with the UNCDD report, we used the Thornthwaite evapotranspiration as a temperature-based method to compute aridity projections with our data. The results are shown in Table 6. We find that the extent of drylands was lower for the reference period with the Thornthwaite equation (27.2 %), but the increase is higher in all SSP compared to the increase calculated with the PM equation: the increase is 3.8 % in SSP 2–4.5, and 8.6 % in both SSP 3–7.0 and 5–8.5.
These results are much lower than the changes predicted by Huang et al. (2016) with CMIP5 data, using the Penman-Monteith evapotranspiration. The authors calculated a 23 % increase of dryland area (reaching 56 % of total land area) in RCP8.5, whereas we only have a 5.1 % in SSP 5–8.5, and 11 % increase (reaching 50 % of total land area) in RCP4.5, while this increase is only of 3 % in SSP 2–4.5. These discrepancies can be attributed to the difference between the SSP and the RCP scenarios, and potentially to the better representation of rainfall patterns in CMIP6 compared to CMIP5 (Du et al., 2022).
Table 6Proportion of drylands in % of total land area (multimodel average), using Penman-Monteith and Thornthwaite evapotranspiration, for the 3 studied SSP.
An ensemble of 13 CMIP6 models was evaluated to compute the aridity index. The multimodel average was evaluated against two databases, Worldclim and ERA5, which include observations and reanalyses. The CMIP6 multimodel average predicts a world that is slightly wetter world than observed today, in particular in the North-Eastern Brazil, where the arid area is not well simulated.
The CMIP6 multimodel average was used to identify future drying and wetting trends in terms of aridity index in the future in most areas, in three different socio-economic pathways. These scenarios represent different possible futures: in SSP 2–4.5, climate changes are limited and therefore the patterns of change for aridity index and aridity categories are also less visible than in the SSP 5–8.5, which represents the scenario with the largest increase in global temperature. The final scenario, SSP 3–7.0, lies in between but with opposite trends between the near and far futures. As a result, many areas are expected to become wetter in the mid-term, but drier in the long-term. This is the case in North-America, Africa and Asia where the aridity index is expected to increase in the mid-term, and then drastically decrease to levels comparable to the other two SSP. This would result in higher adaptation costs compared to the SSP 2–4.5 and SSP 5–8.5. In the three scenarios, the Mediterranean basin and Central America are the regions with the largest decrease in the aridity index. South-America, Europe and Oceania suffer from significant decreases, but limited to −20 %. Overall, a decrease of the aridity index is observed for all continents in the far future. Most of the changes already occur for the period 2030–2059 and remain or continue in 2070–2099. Significant changes of aridity index are also expected within climate zones, in particular in the humid zone, although these changes in the index are not affected by a change in category. The redistribution of arid areas by the end of the century is similar to today's map, with an expansion of arid zones towards the periphery of existing zones. Changes to wetter categories are only observed in the Horn of Africa.
Conclusions for local ecosystems drawn on these results must consider that there is no direct translation between a change of aridity index and the impact on ecosystems. On the one hand, a main caveat of the Penman-Monteith method is that it assumes a fixed stomatal resistance. However, with increasing CO2 concentration, this resistance also increases, reducing in turn the water loss. As a result, evapotranspiration calculated with “historical” resistance value overestimate future evapotranspiration (Yang et al., 2019). Other ways of estimating evapotranspiration have been suggested, for example by directly using the net radiation that is a direct product of climate models (Greve et al., 2019) or by introducing a CO2-term in the equation (Lian et al., 2021), that result in reduced evapotranspiration and therefore less significant drying trends. On the other hand, the aridity index is a simple proxy that does not allow to discriminate between the drivers of change in a given ecosystem. For example, Denissen et al. (2022) use an “Ecosystem Limitation Index” that differentiate situations in which the primary production is limited either by water or energy limitation. The crossing of certain threshold can also be studied, as in Berdugo et al. (2020) that distinguish three phases in land degradation. Finally, seasonality is not taken into account here, while changes in the length of the dry and wet seasons could lead to shifts in vegetation even in humid areas (Xu et al., 2022).
The codes and data used for the statistical analysis are available on Zenodo at https://doi.org/10.5281/zenodo.16418241 (Crapart, 2025).
The supplement related to this article is available online at https://doi.org/10.5194/hess-30-163-2026-supplement.
AD initiated the study, setting the framework and direction of the present work. CC obtained the data, developed the code, performed the data analysis, prepared the figures and redacted the first draft. SA and JB contributed to overcome challenges with the data and to answer conceptual questioning during the data analysis. All authors reviewed the manuscript and contributed to its readability.
The contact author has declared that none of the authors has any competing interests.
Publisher's note: Copernicus Publications remains neutral with regard to jurisdictional claims made in the text, published maps, institutional affiliations, or any other geographical representation in this paper. The authors bear the ultimate responsibility for providing appropriate place names. Views expressed in the text are those of the authors and do not necessarily reflect the views of the publisher.
The research leading to this study was co-funded by IRD (Institut de Recherche pour le Développement; France) grant number “UMR IGE Imputation 252RA5” and by RNER-CC (AFD-C2D) project implemented in the CNCCI (Côte d'Ivoire National Center of High Performance Computing) (submitted version).
This paper was edited by Adriaan J. (Ryan) Teuling and reviewed by two anonymous referees.
Allen, R. G., Pereira, L. S., Raes, D., and Smith, M.: Chapter 2 – FAO Penman-Monteith equation, in: Crop evapotranspiration – Guidelines for computing crop water requirements – FAO Irrigation and drainage paper 56, Rome, 1998.
Almazroui, M., Saeed, F., Saeed, S., Nazrul Islam, M., Ismail, M., Klutse, N. A. B., and Siddiqui, M. H.: Projected Change in Temperature and Precipitation Over Africa from CMIP6, Earth Syst. Environ., 4, 455–475, https://doi.org/10.1007/s41748-020-00161-x, 2020.
Almazroui, M., Islam, M. N., Saeed, F., Saeed, S., Ismail, M., Ehsan, M. A., Diallo, I., O'Brien, E., Ashfaq, M., Martínez-Castro, D., Cavazos, T., Cerezo-Mota, R., Tippett, M. K., Gutowski, W. J., Alfaro, E. J., Hidalgo, H. G., Vichot-Llano, A., Campbell, J. D., Kamil, S., Rashid, I. U., Sylla, M. B., Stephenson, T., Taylor, M., and Barlow, M.: Projected Changes in Temperature and Precipitation Over the United States, Central America, and the Caribbean in CMIP6 GCMs, Earth Syst. Environ., 5, 1–24, https://doi.org/10.1007/s41748-021-00199-5, 2021.
Ångström, A.: A Coefficient of Humidity of General Applicability, Geografiska Annaler, 18, 245–254, https://doi.org/10.2307/519833, 1936.
Beck, H. E., McVicar, T. R., Vergopolan, N., Berg, A., Lutsko, N. J., Dufour, A., Zeng, Z., Jiang, X., van Dijk, A. I. J. M., and Miralles, D. G.: High-resolution (1 km) Köppen-Geiger maps for 1901–2099 based on constrained CMIP6 projections, Sci. Data, 10, 724, https://doi.org/10.1038/s41597-023-02549-6, 2023.
Berdugo, M., Delgado-Baquerizo, M., Soliveres, S., Hernández-Clemente, R., Zhao, Y., Gaitán, J. J., Gross, N., Saiz, H., Maire, V., Lehmann, A., Rillig, M. C., Solé, R. V., and Maestre, F. T.: Global ecosystem thresholds driven by aridity, Science, 367, 787–790, https://doi.org/10.1126/science.aay5958, 2020.
Chen, D., Rojas, M., Samset, B. H., Cobb, K., Diongue-Niang, A., Edwards, P., Emori, S., Henrique Faria, S., Hawkins, E., Hope, P., Huybrechts, P., Meinshausen, M., Mustafa, S. K., Plattner, G.-K., and Treguier, A.-M.: Chapter 1: Framing, Context and Methods, Cambridge University Press, Cambridge, United Kingdom and New York, NY, USA, 147–286, https://doi.org/10.1017/9781009157896.003, 2021.
Cherchi, A., Fogli, P. G., Lovato, T., Peano, D., Iovino, D., Gualdi, S., Masina, S., Scoccimarro, E., Materia, S., Bellucci, A., and Navarra, A.: Global Mean Climate and Main Patterns of Variability in the CMCC-CM2 Coupled Model, Journal of Advances in Modeling Earth Systems, 11, 185–209, https://doi.org/10.1029/2018MS001369, 2019.
Cherlet, M., Hutchinson, C., Reynolds, J., Hill, J., Sommer, S., and von Maltitz, G.: World atlas of desertification: rethinking land degradation and sustainable land management, Publications Office of the European Union, LU, 2018.
Crapart, C.: CamilMC/Aridity: HESS submission, Zenodo [code] and [data set], https://doi.org/10.5281/zenodo.16418241, 2025.
de Martonne, E.: L'indice d'aridité, Bulletin de l'Association de Géographes Français, 3, 3–5, https://doi.org/10.3406/bagf.1926.6321, 1926.
Denissen, J. M. C., Teuling, A. J., Pitman, A. J., Koirala, S., Migliavacca, M., Li, W., Reichstein, M., Winkler, A. J., Zhan, C., and Orth, R.: Widespread shift from ecosystem energy to water limitation with climate change, Nat. Clim. Chang., 12, 677–684, https://doi.org/10.1038/s41558-022-01403-8, 2022.
Döscher, R., Acosta, M., Alessandri, A., Anthoni, P., Arsouze, T., Bergman, T., Bernardello, R., Boussetta, S., Caron, L.-P., Carver, G., Castrillo, M., Catalano, F., Cvijanovic, I., Davini, P., Dekker, E., Doblas-Reyes, F. J., Docquier, D., Echevarria, P., Fladrich, U., Fuentes-Franco, R., Gröger, M., v. Hardenberg, J., Hieronymus, J., Karami, M. P., Keskinen, J.-P., Koenigk, T., Makkonen, R., Massonnet, F., Ménégoz, M., Miller, P. A., Moreno-Chamarro, E., Nieradzik, L., van Noije, T., Nolan, P., O'Donnell, D., Ollinaho, P., van den Oord, G., Ortega, P., Prims, O. T., Ramos, A., Reerink, T., Rousset, C., Ruprich-Robert, Y., Le Sager, P., Schmith, T., Schrödner, R., Serva, F., Sicardi, V., Sloth Madsen, M., Smith, B., Tian, T., Tourigny, E., Uotila, P., Vancoppenolle, M., Wang, S., Wårlind, D., Willén, U., Wyser, K., Yang, S., Yepes-Arbós, X., and Zhang, Q.: The EC-Earth3 Earth system model for the Coupled Model Intercomparison Project 6, Geosci. Model Dev., 15, 2973–3020, https://doi.org/10.5194/gmd-15-2973-2022, 2022.
Doxsey-Whitfield, E., MacManus, K., Adamo, S. B., Pistolesi, L., Squires, J., Borkovska, O., and Baptista, S. R.: Taking Advantage of the Improved Availability of Census Data: A First Look at the Gridded Population of the World, Version 4, Papers in Applied Geography, 1, 226–234, https://doi.org/10.1080/23754931.2015.1014272, 2015.
Du, Y., Wang, D., Zhu, J., Wang, D., Qi, X., and Cai, J.: Comprehensive assessment of CMIP5 and CMIP6 models in simulating and projecting precipitation over the global land, International Journal of Climatology, 42, 6859–6875, https://doi.org/10.1002/joc.7616, 2022.
Dunne, J. P., Horowitz, L. W., Adcroft, A. J., Ginoux, P., Held, I. M., John, J. G., Krasting, J. P., Malyshev, S., Naik, V., Paulot, F., Shevliakova, E., Stock, C. A., Zadeh, N., Balaji, V., Blanton, C., Dunne, K. A., Dupuis, C., Durachta, J., Dussin, R., Gauthier, P. P. G., Griffies, S. M., Guo, H., Hallberg, R. W., Harrison, M., He, J., Hurlin, W., McHugh, C., Menzel, R., Milly, P. C. D., Nikonov, S., Paynter, D. J., Ploshay, J., Radhakrishnan, A., Rand, K., Reichl, B. G., Robinson, T., Schwarzkopf, D. M., Sentman, L. T., Underwood, S., Vahlenkamp, H., Winton, M., Wittenberg, A. T., Wyman, B., Zeng, Y., and Zhao, M.: The GFDL Earth System Model Version 4.1 (GFDL-ESM 4.1): Overall Coupled Model Description and Simulation Characteristics, Journal of Advances in Modeling Earth Systems, 12, e2019MS002015, https://doi.org/10.1029/2019MS002015, 2020.
Emberger, L.: Comptes rendus hebdomadaires des séances de l'Académie des sciences/publiés par MM, les secrétaires perpétuels, Gallica, 1st July, 1930.
ESGF: LLNL ESGF MetaGrid, https://aims2.llnl.gov/search, last access: 19 November 2024.
FAO: Map of aridity (Global – ∼19 km) – “FAO catalog”, https://data.apps.fao.org/catalog/iso/221072ae-2090-48a1-be6f-5a88f061431a, last access: 20 March 2024.
Fick, S. E. and Hijmans, R. J.: WorldClim 2: new 1-km spatial resolution climate surfaces for global land areas, Int. Journal of Climatology, 37, 4302–4315, https://doi.org/10.1002/joc.5086, 2017.
Firpo, M. Â. F., Guimarães, B. dos S., Dantas, L. G., Silva, M. G. B. da, Alves, L. M., Chadwick, R., Llopart, M. P., and de Oliveira, G. S.: Assessment of CMIP6 models' performance in simulating present-day climate in Brazil, Front. Clim., 4, https://doi.org/10.3389/fclim.2022.948499, 2022.
Gettelman, A., Mills, M. J., Kinnison, D. E., Garcia, R. R., Smith, A. K., Marsh, D. R., Tilmes, S., Vitt, F., Bardeen, C. G., McInerny, J., Liu, H.-L., Solomon, S. C., Polvani, L. M., Emmons, L. K., Lamarque, J.-F., Richter, J. H., Glanville, A. S., Bacmeister, J. T., Phillips, A. S., Neale, R. B., Simpson, I. R., DuVivier, A. K., Hodzic, A., and Randel, W. J.: The Whole Atmosphere Community Climate Model Version 6 (WACCM6), Journal of Geophysical Research: Atmospheres, 124, 12380–12403, https://doi.org/10.1029/2019JD030943, 2019.
Greve, P., Roderick, M. L., Ukkola, A. M., and Wada, Y.: The aridity Index under global warming, Environ. Res. Lett., 14, 124006, https://doi.org/10.1088/1748-9326/ab5046, 2019.
Gutjahr, O., Putrasahan, D., Lohmann, K., Jungclaus, J. H., von Storch, J.-S., Brüggemann, N., Haak, H., and Stössel, A.: Max Planck Institute Earth System Model (MPI-ESM1.2) for the High-Resolution Model Intercomparison Project (HighResMIP), Geosci. Model Dev., 12, 3241–3281, https://doi.org/10.5194/gmd-12-3241-2019, 2019.
Hargreaves, G. H. and Allen, R. G.: History and Evaluation of Hargreaves Evapotranspiration Equation, Journal of Irrigation and Drainage Engineering, 129, 53–63, https://doi.org/10.1061/(ASCE)0733-9437(2003)129:1(53), 2003.
Harris, I., Jones, P. D., Osborn, T. J., and Lister, D. H.: Updated high-resolution grids of monthly climatic observations – the CRU TS3.10 Dataset, International Journal of Climatology, 34, 623–642, https://doi.org/10.1002/joc.3711, 2014.
He, B., Bao, Q., Wang, X., Zhou, L., Wu, X., Liu, Y., Wu, G., Chen, K., He, S., Hu, W., Li, J., Li, J., Nian, G., Wang, L., Yang, J., Zhang, M., and Zhang, X.: CAS FGOALS-f3-L Model Datasets for CMIP6 Historical Atmospheric Model Intercomparison Project Simulation, Adv. Atmos. Sci., 36, 771–778, https://doi.org/10.1007/s00376-019-9027-8, 2019.
He, J., Sun, W., Wang, J., Wang, B., and Liu, J.: Strength of the North African monsoon in the Last Interglacial and under future warming, Atmospheric and Oceanic Science Letters, 16, 100320, https://doi.org/10.1016/j.aosl.2022.100320, 2023.
Hersbach, H., Bell, B., Berrisford, P., Hirahara, S., Horányi, A., Muñoz-Sabater, J., Nicolas, J., Peubey, C., Radu, R., Schepers, D., Simmons, A., Soci, C., Abdalla, S., Abellan, X., Balsamo, G., Bechtold, P., Biavati, G., Bidlot, J., Bonavita, M., Chiara, G. D., Dahlgren, P., Dee, D., Diamantakis, M., Dragani, R., Flemming, J., Forbes, R., Fuentes, M., Geer, A., Haimberger, L., Healy, S., Hogan, R. J., Hólm, E., Janisková, M., Keeley, S., Laloyaux, P., Lopez, P., Lupu, C., Radnoti, G., Rosnay, P. de, Rozum, I., Vamborg, F., Villaume, S., and Thépaut, J.-N.: The ERA5 global reanalysis, Quarterly Journal of the Royal Meteorological Society, 146, 1999–2049, https://doi.org/10.1002/qj.3803, 2020.
Hijmans, R. J., Etten, J. van, Sumner, M., Cheng, J., Baston, D., Bevan, A., Bivand, R., Busetto, L., Canty, M., Fasoli, B., Forrest, D., Ghosh, A., Golicher, D., Gray, J., Greenberg, J. A., Hiemstra, P., Hingee, K., Ilich, A., Geosciences, I. for M. A., Karney, C., Mattiuzzi, M., Mosher, S., Naimi, B., Nowosad, J., Pebesma, E., Lamigueiro, O. P., Racine, E. B., Rowlingson, B., Shortridge, A., Venables, B., and Wueest, R.: raster: Geographic Data Analysis and Modeling, R package version 3.6-32, 2025.
Huang, J., Yu, H., Guan, X., Wang, G., and Guo, R.: Accelerated dryland expansion under climate change, Nature Clim. Change, 6, 166–171, https://doi.org/10.1038/nclimate2837, 2016.
Iturbide, M., Gutiérrez, J. M., Alves, L. M., Bedia, J., Cerezo-Mota, R., Cimadevilla, E., Cofiño, A. S., Di Luca, A., Faria, S. H., Gorodetskaya, I. V., Hauser, M., Herrera, S., Hennessy, K., Hewitt, H. T., Jones, R. G., Krakovska, S., Manzanas, R., Martínez-Castro, D., Narisma, G. T., Nurhati, I. S., Pinto, I., Seneviratne, S. I., van den Hurk, B., and Vera, C. S.: An update of IPCC climate reference regions for subcontinental analysis of climate model data: definition and aggregated datasets, Earth Syst. Sci. Data, 12, 2959–2970, https://doi.org/10.5194/essd-12-2959-2020, 2020.
Kottek, M., Grieser, J., Beck, C., Rudolf, B., and Rubel, F.: World Map of the Köppen-Geiger climate classification updated, Meteorologische Zeitschrift, 15, 259–263, https://doi.org/10.1127/0941-2948/2006/0130, 2006.
Lang, R.: Versuch einer exakten Klasisdfikation der Boden in klimatischer und geologischer Hinsicht, Verlag für Fachliteratur, 1915.
Lian, X., Piao, S., Chen, A., Huntingford, C., Fu, B., Li, L. Z. X., Huang, J., Sheffield, J., Berg, A. M., Keenan, T. F., McVicar, T. R., Wada, Y., Wang, X., Wang, T., Yang, Y., and Roderick, M. L.: Multifaceted characteristics of dryland aridity changes in a warming world, Nat. Rev. Earth Environ., 2, 232–250, https://doi.org/10.1038/s43017-021-00144-0, 2021.
Lovato, T., Peano, D., Butenschön, M., Materia, S., Iovino, D., Scoccimarro, E., Fogli, P. G., Cherchi, A., Bellucci, A., Gualdi, S., Masina, S., and Navarra, A.: CMIP6 Simulations With the CMCC Earth System Model (CMCC-ESM2), Journal of Advances in Modeling Earth Systems, 14, e2021MS002814, https://doi.org/10.1029/2021MS002814, 2022.
Lund, M. T., Myhre, G., and Samset, B. H.: Anthropogenic aerosol forcing under the Shared Socioeconomic Pathways, Atmos. Chem. Phys., 19, 13827–13839, https://doi.org/10.5194/acp-19-13827-2019, 2019.
Middleton, N. and Thomas, D. (Eds.): World Atlas of Desertification: 2nd edn., United Nation Environment Programme, ISBN: 978-0-340-69166-3, 1997.
Mirzabaev, A., Stringer, L. C., Benjaminsen, T. A., Gonzalez, P., Harris, R., Jafari, M., Stevens, N., Tirado, C. M., and Zakieldeen, S.: Cross-Chapter Paper 3: Deserts, Semiarid Areas and Desertification, in: Climate Change 2022: Impacts, Adaptation and Vulnerability, Cambridge University Press, Cambridge, UK and New York, NY, USA, 2195–2231, https://doi.org/10.1017/9781009325844.020., 2022.
Möller, V., van Diemen, R., Matthews, J. B. R., Méndez, C., Semenov, S., Fuglestvedt, J. S., and Reisinger, A.: Annex II: Glossary, in: Climate change 2022: Impacts; Adaptation and Vulnerability. Contribution of Working Group II to the Sixth Assessment Report of the Intergovernmental Panel on Climate Change [H.-O. Pörtner, D.C. Roberts, M. Tignor, E.S. Poloczanska, K. Mintenbeck, A. Alegría, M. Craig, S. Langsdorf, S. Löschke, V. Möller, A. Okem, B. Rama (eds.)], Cambridge University Press, Cambridge, UK and New York, NY, USA, 2897–2930, doi:10.1017/9781009325844.029, 2022.
Monteith, J. L.: Evaporation and environment, Symposia of the Society for Experimental Biology, 19, 205–234, 1965.
Osborne, B. B., Bestelmeyer, B. T., Currier, C. M., Homyak, P. M., Throop, H. L., Young, K., and Reed, S. C.: The consequences of climate change for dryland biogeochemistry, New Phytologist, 236, 15–20, https://doi.org/10.1111/nph.18312, 2022.
Palmer, P. I., Wainwright, C. M., Dong, B., Maidment, R. I., Wheeler, K. G., Gedney, N., Hickman, J. E., Madani, N., Folwell, S. S., Abdo, G., Allan, R. P., Black, E. C. L., Feng, L., Gudoshava, M., Haines, K., Huntingford, C., Kilavi, M., Lunt, M. F., Shaaban, A., and Turner, A. G.: Drivers and impacts of Eastern African rainfall variability, Nat. Rev. Earth Environ., 4, 254–270, https://doi.org/10.1038/s43017-023-00397-x, 2023.
Pathak, R., Dasari, H. P., Ashok, K., and Hoteit, I.: Effects of multi-observations uncertainty and models similarity on climate change projections, npj Clim. Atmos. Sci., 6, 1–12, https://doi.org/10.1038/s41612-023-00473-5, 2023.
Peel, M. C., Finlayson, B. L., and McMahon, T. A.: Updated world map of the Köppen-Geiger climate classification, Hydrol. Earth Syst. Sci., 11, 1633–1644, https://doi.org/10.5194/hess-11-1633-2007, 2007.
Penman, H. L.: Natural Evaporation from Open Water, Bare Soil and Grass, Proceedings of the Royal Society of London. Series A, 193, 120–145, 1948.
Pimentel, R., Arheimer, B., Crochemore, L., Andersson, J. C. M., Pechlivanidis, I. G., and Gustafsson, D.: Which Potential Evapotranspiration Formula to Use in Hydrological Modeling World-Wide?, Water Resources Research, 59, e2022WR033447, https://doi.org/10.1029/2022WR033447, 2023.
Ramachandran, S., Rupakheti, M., and Cherian, R.: Insights into recent aerosol trends over Asia from observations and CMIP6 simulations, Science of The Total Environment, 807, 150756, https://doi.org/10.1016/j.scitotenv.2021.150756, 2022.
R Core Team: R: A Language and Environment for Statistical Computing, R version 4.3.2, R Foundation for Statistical Computing, Vienna, Australia, RL https://www.R-project.org/, 2023.
Reboita, M. S., Ferreira, G. W. de S., Ribeiro, J. G. M., and Ali, S.: Assessment of precipitation and near-surface temperature simulation by CMIP6 models in South America, Environ. Res.: Climate, 3, 025011, https://doi.org/10.1088/2752-5295/ad3fdb, 2024.
Scholes, R. J.: The Future of Semi-Arid Regions: A Weak Fabric Unravels, Climate, 8, 43, https://doi.org/10.3390/cli8030043, 2020.
Seland, Ø., Bentsen, M., Olivié, D., Toniazzo, T., Gjermundsen, A., Graff, L. S., Debernard, J. B., Gupta, A. K., He, Y.-C., Kirkevåg, A., Schwinger, J., Tjiputra, J., Aas, K. S., Bethke, I., Fan, Y., Griesfeller, J., Grini, A., Guo, C., Ilicak, M., Karset, I. H. H., Landgren, O., Liakka, J., Moseid, K. O., Nummelin, A., Spensberger, C., Tang, H., Zhang, Z., Heinze, C., Iversen, T., and Schulz, M.: Overview of the Norwegian Earth System Model (NorESM2) and key climate response of CMIP6 DECK, historical, and scenario simulations, Geosci. Model Dev., 13, 6165–6200, https://doi.org/10.5194/gmd-13-6165-2020, 2020.
Sheffield, J., Wood, E. F., and Roderick, M. L.: Little change in global drought over the past 60 years, Nature, 491, 435–438, https://doi.org/10.1038/nature11575, 2012.
Spinoni, J., Vogt, J., Naumann, G., Carrao, H., and Barbosa, P.: Towards identifying areas at climatological risk of desertification using the Köppen–Geiger classification and FAO aridity index, International Journal of Climatology, 35, 2210–2222, https://doi.org/10.1002/joc.4124, 2015.
Stephen, J.: Aridity Indexes, in: Encyclopedia of World Climatology, edited by: Oliver, J. E., Springer Netherlands, Dordrecht, 89–94, https://doi.org/10.1007/1-4020-3266-8_17, 2005.
Thornthwaite, C. W.: Problems in the Classification of Climates, Geographical Review, 33, 233–255, https://doi.org/10.2307/209776, 1943.
Thornthwaite, C. W.: An Approach toward a Rational Classification of Climate, Geographical Review, 38, 55–94, https://doi.org/10.2307/210739, 1948.
Trabucco, A., Spano, D., and Zomer, R. J.: Global Aridity Index and Potential Evapotranspiration Database: CIMP_6 Future Projections, EGU General Assembly 2024, Vienna, Austria, 14–19 April 2024, EGU24-11031, https://doi.org/10.5194/egusphere-egu24-11031, 2024.
UNESCO: Map of the world distribution of arid regions; explanatory note, UNESCO, France, MAB technical notes 7, ISBN: 92-3-101484-6, 1977.
United Nations Environment Programme: World Atlas of Desertification, Edward Arnold, ISBN: 978-0-340-55512-5, 1992.
Vincente-Serrano, S. M., Pricope, N. G., Toreti, A., Moran-Tejeda, E., Spinoni, J., Ocampo-Melgar, A., Archer, E., Diedhiou, A., Mesbahzadeh, T., Ravindranath, N. H., Pulwarty, R. S., and Alibakhshi, S.: The global threat of drying lands: Regional and global aridity trends and future projections. A Report of the Science-Policy Interface, United Nations Convention to Combat Desertification, UNCCD, Bonn, Germany, ISBN: 978-92-95128-16-3, 2024.
Voldoire, A., Saint-Martin, D., Sénési, S., Decharme, B., Alias, A., Chevallier, M., Colin, J., Guérémy, J.-F., Michou, M., Moine, M.-P., Nabat, P., Roehrig, R., Salas y Mélia, D., Séférian, R., Valcke, S., Beau, I., Belamari, S., Berthet, S., Cassou, C., Cattiaux, J., Deshayes, J., Douville, H., Ethé, C., Franchistéguy, L., Geoffroy, O., Lévy, C., Madec, G., Meurdesoif, Y., Msadek, R., Ribes, A., Sanchez-Gomez, E., Terray, L., and Waldman, R.: Evaluation of CMIP6 DECK Experiments With CNRM-CM6-1, Journal of Advances in Modeling Earth Systems, 11, 2177–2213, https://doi.org/10.1029/2019MS001683, 2019.
Volodin, E. M., Mortikov, E. V., Kostrykin, S. V., Galin, V. Y., Lykossov, V. N., Gritsun, A. S., Diansky, N. A., Gusev, A. V., Iakovlev, N. G., Shestakova, A. A., and Emelina, S. V.: Simulation of the modern climate using the INM-CM48 climate model, Russian Journal of Numerical Analysis and Mathematical Modelling, 33, 367–374, https://doi.org/10.1515/rnam-2018-0032, 2018.
Xiang, K., Li, Y., Horton, R., and Feng, H.: Similarity and difference of potential evapotranspiration and reference crop evapotranspiration – a review, Agricultural Water Management, 232, 106043, https://doi.org/10.1016/j.agwat.2020.106043, 2020.
Xu, H., Lian, X., Slette, I. J., Yang, H., Zhang, Y., Chen, A., and Piao, S.: Rising ecosystem water demand exacerbates the lengthening of tropical dry seasons, Nat. Commun., 13, 4093, https://doi.org/10.1038/s41467-022-31826-y, 2022.
Yang, Y., Roderick, M. L., Zhang, S., McVicar, T. R., and Donohue, R. J.: Hydrologic implications of vegetation response to elevated CO2 in climate projections, Nature Clim. Change, 9, 44–48, https://doi.org/10.1038/s41558-018-0361-0, 2019.
Yukimoto, S., Kawai, H., Koshiro, T., Oshima, N., Yoshida, K., Urakawa, S., Tsujino, H., Deushi, M., Tanaka, T., Hosaka, M., Yabu, S., Yoshimura, H., Shindo, E., Mizuta, R., Obata, A., Adachi, Y., and Ishii, M.: The Meteorological Research Institute Earth System Model Version 2.0, MRI-ESM2.0: Description and Basic Evaluation of the Physical Component, Journal of the Meteorological Society of Japan. Ser. II, 97, 931–965, https://doi.org/10.2151/jmsj.2019-051, 2019.
Zhang, H., Zhang, M., Jin, J., Fei, K., Ji, D., Wu, C., Zhu, J., He, J., Chai, Z., Xie, J., Dong, X., Zhang, D., Bi, X., Cao, H., Chen, H., Chen, K., Chen, X., Gao, X., Hao, H., Jiang, J., Kong, X., Li, S., Li, Y., Lin, P., Lin, Z., Liu, H., Liu, X., Shi, Y., Song, M., Wang, H., Wang, T., Wang, X., Wang, Z., Wei, Y., Wu, B., Xie, Z., Xu, Y., Yu, Y., Yuan, L., Zeng, Q., Zeng, X., Zhao, S., Zhou, G., and Zhu, J.: Description and Climate Simulation Performance of CAS-ESM Version 2, Journal of Advances in Modeling Earth Systems, 12, e2020MS002210, https://doi.org/10.1029/2020MS002210, 2020.
Zhu, Y.-Y. and Yang, S.: Evaluation of CMIP6 for historical temperature and precipitation over the Tibetan Plateau and its comparison with CMIP5, Advances in Climate Change Research, 11, 239–251, https://doi.org/10.1016/j.accre.2020.08.001, 2020.
Zomer, R. J., Xu, J., and Trabucco, A.: Version 3 of the Global Aridity Index and Potential Evapotranspiration Database, Sci. Data, 9, 409, https://doi.org/10.1038/s41597-022-01493-1, 2022.
- Abstract
- Introduction
- Material and methods
- Evaluation of CMIP6 performances for the reference period 1970–1999
- Future evolution of the aridity index in CMIP6
- Conclusion
- Code and data availability
- Author contributions
- Competing interests
- Disclaimer
- Financial support
- Review statement
- References
- Supplement