the Creative Commons Attribution 4.0 License.
the Creative Commons Attribution 4.0 License.
 | 23 Mar 2026
Future changes in seasonal drought in Australia
Steven Thomas
Elisabeth Vogel
Ulrike Bende-Michl
Steven Siems
Vjekoslav Matic
Wendy Sharples
Climate change is expected to exacerbate the frequency and intensity of drought in many water-limited regions. However, future drought changes in Australia –the driest inhabited continent on Earth– have remained stubbornly uncertain due to a lack of model agreement in projected precipitation changes in most regions. We use an ensemble of future projections from the National Hydrological Projections to assess future drought changes in Australia. The ensemble of 32 simulations was created using the Australian Landscape Water Balance model (AWRA-L) forced by four global climate models (GCMs) from the Coupled Model Intercomparison Project phase 5 that were downscaled and bias-corrected using four alternative methods. This ensemble provided an opportunity to analyse multiple sources of uncertainty on the future projections and quantify changes across multiple drought types (meteorological, hydrological and agricultural). We show future increases for all three drought types, with largest increases projected in winter and spring. The sign of the changes is consistent across different drought metrics but projected changes are more robust for the time spent under drought than drought duration or intensity. The future changes are particularly robust in the highly populated and agricultural regions of Australia, suggesting potential impacts on agricultural activities, ecosystems and urban water supply. We attributed uncertainty in future drought changes to GCMs, downscaling/bias correction (DS-BC) methods and emissions scenarios. GCMs represent the largest source of uncertainty (47 %–72 % of the full range of projections) but the choice of DS-BC method is also important (23 %–58 %, with approximately half of this uncertainty arising from the choice between dynamical and statistical downscaling). The emissions scenarios were the lowest source of uncertainty (11 %–33 %) but influenced the magnitude and spatial extent of robust future changes. Overall, the projections suggest likely future increases in drought in Australia with little evidence for ameliorating drought risk with climate change despite ongoing uncertainty in future changes in parts of the country.
- Article
(6376 KB) - Full-text XML
-
Supplement
(10144 KB) - BibTeX
- EndNote


Droughts can have devastating and lasting impacts on society and represent one of the most significant consequences of climate change on people and ecosystems (Choat et al., 2018; Van Loon et al., 2016). Droughts are generally expected to increase in the future but there are many regions where even the sign of future change remains uncertain (Seneviratne et al., 2021). Australia is an example of a region where we do not yet understand with confidence how future droughts will evolve, including in key agricultural and highly populated regions (Kirono et al., 2020). Recent droughts have caused severe impacts in Australia, most notably the Millennium drought in 2001–2009 and the Tinderbox drought in 2017–2019 which led to severe water shortages and agricultural losses (Devanand et al., 2024; van Dijk et al., 2013). Globally, Australia ranked fifth in terms of economic losses resulting from drought during 1990–2014 and 15th in terms of the number of people affected by drought (González Tánago et al., 2016), making it a particularly drought prone region. Droughts also contribute to other natural hazards such as heatwaves and bushfires, and land degradation. The Tinderbox drought culminated in the Black Summer bushfires of 2019–2020 (Abram et al., 2021) which burnt > 20 % of Australia's temperate broadleaf forests – a globally unprecedented fraction of any continental forest biome to have burnt within a single fire season (Boer et al., 2020).
There are several challenges in quantifying drought changes in Australia and elsewhere (Kiem et al., 2016). No one definition for droughts exists and changes across different types of droughts can be inconsistent, making it challenging to understand drought trends (Tijdeman et al., 2022). There are three main types of droughts that are often considered in climate studies: meteorological (precipitation), hydrological (streamflow) and agricultural (soil moisture; also termed ecological). While meteorological droughts are driven purely by precipitation deficits, hydrological and agricultural moisture droughts are more complex and often more slowly evolving. They not only depend on precipitation but also on atmospheric water demand, vegetation processes and human influences (Van Loon, 2015). The interplay between the variables means that investigating changes in just one type of drought may not adequately represent drought conditions and as such studies should ideally consider multiple types of drought for a more complete picture (Cook et al., 2020; Kirono et al., 2020). In Australia, the water cycle is strongly driven by rainfall variability due to the dry climate over much of the continent. The southern parts of the continent have experienced decreasing precipitation over the past decades whereas northern Australia has experienced higher rainfall (Dey et al., 2019), with trends in runoff and soil moisture broadly tracking these (Wasko et al., 2021; Zhang et al., 2016). However, some regions have seen opposing trends in rainfall, runoff and soil moisture, including parts of the Murray-Darling Basin and southeastern Australia which encompass key agricultural and high population areas (Wasko et al., 2021). Some semi-arid and subhumid parts of Australia have also seen larger changes in streamflow than rainfall (Fowler et al., 2022; Peterson et al., 2021; Ukkola et al., 2016b), highlighting the need to consider multiple aspects of the hydrological cycle for a more complete picture of drought trends and their magnitude.
Understanding drought trends is further complicated by the various drought metrics employed in different studies. This has made it difficult to compare across studies, particularly as many studies tend to only consider one metric and one type of drought. Moreover, past studies have commonly quantified changes in drought using indices such as the Standardised Precipitation Index (Orlowsky and Seneviratne, 2013) or by comparing historical and future climatologies (Cook et al., 2020; Shi et al., 2020). However, these approaches quantify changes in mean conditions rather than anomalously dry periods that droughts are usually defined as, ignoring the role of variability. This is particularly problematic in Australia where rainfall and streamflow exhibit high interannual variability compared to many other regions of the world (Chiew and McMahon, 1993; King et al., 2020; Morin, 2011). This high variability can lead to extended periods of drought even without changes in the mean. For example, eastern Australia has experienced two severe droughts during the past two decades (the Millennium and Tinderbox droughts) even though the mean rainfall during this period was close to the long-term climatological average. Studies have shown that drought metrics that take variability into account can also lead to more robust future projections and help narrow the uncertainty in hydrological projections (Trenberth et al., 2014; Ukkola et al., 2020).
A further challenge arises from uncertainty in the modelling frameworks used to project future changes. Future projections rely on global climate models (GCMs) but at spatial scales of > 100km they are generally too coarse for regional- and local-scale decision making. They also exhibit biases in regional-scale climate and hydrology and there has been limited effort in understanding their ability to skilfully simulate drought (Seneviratne et al., 2021). Studies that have evaluated global climate models and their components point to systematic biases in the simulation of rainfall persistence (including multi-year meteorological droughts; Moon et al., 2018; Papalexiou et al., 2021; Rocheta et al., 2014) and land drought responses (Martínez-de la Torre et al., 2019; Ukkola et al., 2016a), with large inter-model differences particularly in the simulation of hydrological and agricultural drought (Ukkola et al., 2018). Bias correction and regional downscaling are common methods for reducing these biases and gaining more localised projections (Giorgi and Gutowski, 2015; Xu et al., 2021). Whilst bias-correction and downscaling are able to improve the representation of regional climate conditions (Chapman et al., 2023; Di Virgilio et al., 2020), they introduce another layer of uncertainty as different approaches prioritise varying characteristics of the climate time series. Recently, Vogel et al. (2023) compared four downscaling and bias correction methods for improving GCM-simulated climate variables over Australia and showed that their performance varied depending on the metric considered (e.g. mean climate, variability or extremes) and the climate impact of interest (e.g. projections of drought). As such it is important to understand what and how different bias correction and dynamical downscaling methods impact projections at the scale most relevant to the climate or hydrological quantity being assessed.
Here we investigate future changes in Australian droughts and consider some of these key sources of uncertainty in future projections. We use an ensemble of 32 simulations from the National Hydrological Projections (NHP) collection (Peter et al., 2024; Srikanthan et al., 2022; Wilson et al., 2022) covering the period 1960–2099. The projections were created using the Australian Landscape Water Balance model (AWRA-L; Frost et al., 2018) forced with GCM outputs bias-corrected and downscaled using alternative methods. Using this ensemble provides an opportunity to quantify the uncertainties arising from the choice of GCM, bias correction and downscaling methods and how these propagate into drought projections. We also consider three types of drought (meteorological, hydrological and agricultural) and calculate future changes in these using consistent methods to assess the robustness of future changes across different indicators of drought (time under drought, duration and intensity). These projections are widely used for adaptation and management purposes across Australia but past studies using NHP have largely focused on longer-term averages rather than dry extremes (e.g. Peter et al., 2024), making a thorough analysis of the projected future drought changes timely.
2.1 The AWRA-L model
This study uses simulations from the gridded landscape water balance model AWRA-L (Frost et al., 2018; available via https://github.com/awracms/awra_cms, last access: 17 March 2026). AWRA-L is the Bureau of Meteorology's continental-scale gridded hydrological model which underpins the near seamless Australian Water Outlook service (https://awo.bom.gov.au, last access: 17 March 2026) and provides information on past and near-real time hydrological conditions, seasonal forecasts of hydrology (Pickett-Heaps and Vogel, 2022; Tian et al., 2021; Vogel et al., 2021) and hydrological projections (Srikanthan et al., 2022; Wilson et al., 2022). AWRA-L is a semi-distributed model that has been calibrated towards observed river streamflow, satellite soil moisture and evapotranspiration across the continent (Frost et al., 2018). The model simulates hydrological fluxes and stores, including runoff, actual and potential evapotranspiration, soil moisture for three soil depths (0–10, 10–100 and 100–600 cm) and aggregated root-zone soil moisture (0–100 cm depth) (Frost et al., 2018; Fig. 1). Runoff is calculated as a combination of surface runoff, baseflow and interflow, with both infiltration- and saturation-excess runoff considered. Baseflow is calculated from groundwater storage and deep drainage from the bottom soil layer. Interflow is the lateral drainage from two top soil layers (0–100 cm). AWRA-L does not simulate lateral flow or river routing. Soil moisture is calculated as a function of soil water holding capacity and saturated hydraulic conductivity derived from pedotransfer functions applied to continental gridded clay content. Identical hydraulic parameters are used for each vertical soil layer. The soil moisture used in this study is given as the root zone soil moisture, which is the sum of the upper and lower layers shown in Fig. 1. The root zone soil moisture is a useful measure of agricultural drought as it represents the magnitude and variability of water and energy fluxes through evapotranspiration (e.g. Baldwin et al., 2017; Dumedah et al., 2015). A full description of AWRA-L version 6 which underpins the National Hydrological Projections dataset used in this study is provided in Frost et al. (2018).
AWRA-L has been comprehensively evaluated against hydrological observations, including gauged streamflow, in situ measurements of soil moisture, groundwater recharge data, and flux tower-based evapotranspiration (Frost and Wright, 2018). AWRA-L performs well for a wide range of water balance variables at observational sites across the country (Holgate et al., 2016; Khan et al., 2020) and is able to reproduce historical hydrological trends (Wasko et al., 2021). Azarvinand et al. (2022) present a sensitivity analysis demonstrating the most influential model parameters on the simulated hydrological outputs.
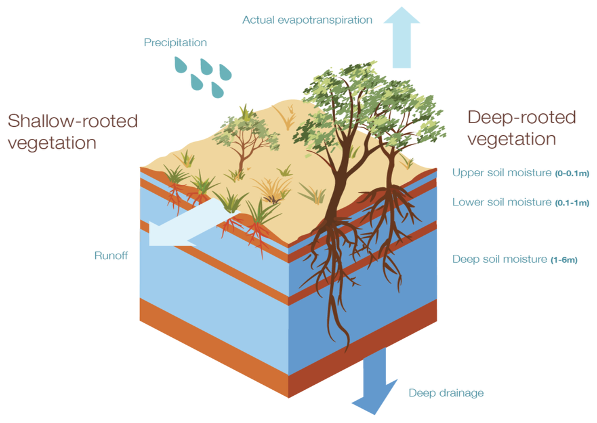
Figure 1Schematic of AWRA-L fluxes and stores (source: Frost et al., 2018).
2.2 Datasets
2.2.1 Historical observations
We use several observation-based products to assess model skill in simulating historical droughts during 1970–2020, the time period maximising the overlap between observations and model simulations. We used observed precipitation from the Australian Bureau of Meteorology's Australian Gridded Climate Dataset (AGCD) version 1 (previously known as the Australian Water Availability Project dataset; Jones et al., 2009) for comparison with climate model simulated meteorological droughts. The AGCD dataset was built by interpolating station-based data onto a 0.05°×0.05° grid. While AGCD was used for bias-correcting the GCM precipitation (see below) and is thus not an independent dataset, it can be used to evaluate the skill of the bias-correction methods in capturing observed precipitation. We additionally used a historical AWRA-L simulation forced with historical climate observations to provide an observationally-constrained reference simulation for runoff and soil moisture. The reference simulation was forced with daily precipitation, minimum and maximum temperature data obtained from AGCD. In addition, remotely-sensed daily solar radiation data (Grant et al., 2008) and daily-average wind speed data derived from station-based 2 m wind speed observations, available on the same 0.05°×0.05° grid (McVicar et al., 2008) were used as inputs into AWRA-L. As long-term gridded runoff and soil moisture observations are not available at high spatial resolution, this reference run was used as pseudo-observations to compare against GCM-forced AWRA-L runs. We supplement these with streamflow observations from the version 2 of the Australian edition of the Catchment Attributes and Meteorology for Large-Sample Studies dataset (CAMELS-AUS v2; Fowler et al., 2025). The streamflow data were screened to remove any catchments with > 5 % of the time steps missing during 1970–2020. Gap-filling has already been performed as part of the original dataset using output from a hydrological model. This left 216 catchments available for the evaluation out of the 561 catchments available in the full dataset (see Fig. S1 in the Supplement for catchment locations).
2.2.2 Downscaled and bias corrected climate model data
We obtained downscaled and bias-corrected hydrological projections from the Bureau of Meteorology's National Hydrological Projections (NHP) dataset (Srikanthan et al., 2022; Wilson et al., 2022). NHP provides climate and hydrological projections based on four GCMs from the 5th Phase of the Coupled Model Intercomparison Project (CMIP5) (Taylor et al., 2012). These GCMs are: ACCESS1-0 (Collier and Uhe, 2012; Dix et al., 2013), CNRM-CM5 (Voldoire et al., 2013), GFDL-ESM2M (Dunne et al., 2012) and MIROC5 (Watanabe et al., 2010). The four GCMs were selected based on their demonstrated ability to reproduce climate features important for Australia (Moise et al., 2015), a representation of the range of GCM uncertainty for future projections, and the availability of all climate variables needed to force AWRA-L at a daily time step (see Srikanthan et al., 2022; Wilson et al., 2022 for details on model selection). Two representative concentration pathways (RCPs) were used for future projections: RCP4.5 and RCP8.5.
We next describe how the NHP projections were constructed. Three statistical bias correction approaches and one combined downscaling and bias correction approach were first applied to the raw GCM data (Peter et al., 2024):
-
ISIMIP2b. The ISIMIP2b bias correction method (Hempel et al., 2013; Lange, 2019) is a parametric quantile matching method. The purpose of the ISIMIP2b method is to preserve the trend of the climate signal. The ISIMIP2b method was applied to daily-scale anomalies for each month of the year separately. An additive correction is applied for temperature, whereas a multiplicative correction is applied for all other variables.
-
QME. The Quantile Matching for Extremes (QME) method is based on empirical quantile mapping with certain adjustments to correct the extreme tails of a distribution of a variable (CSIRO and Bureau of Meteorology, 2021; Dowdy, 2023). The QME method was applied to daily values for each 3-month season (December–February (DJF), March–May (MAM), June–August (JJA), September–November (SON)) to increase the sample size (compared to monthly binning) for a better representation of extremes.
-
MRNBC. The multivariate recursive nested bias correction method (MRNBC) (Johnson and Sharma, 2012; Mehrotra and Sharma, 2015, 2016) corrects biases at multiple time scales (daily, monthly and annual) and considers cross-variable correlations and interdependencies as well as temporal auto-correlations using climate observations.
-
CCAM-ISIMIP2b. The Conformal Cubic Atmospheric Model (CCAM) regional climate model (McGregor and Dix, 2008) was used to dynamically downscale projections of the four CMIP5 GCMs outlined above. CCAM is a global atmosphere-only climate model with a stretched grid using bias-corrected sea surface temperature with high resolution over Australia and broader resolution in other regions. The model simulates atmospheric variables over Australia on a ∼ 50 km grid. CCAM outputs were bias-corrected using the ISIMIP2b method (see above).
Before application of the bias correction approaches, the GCM and CCAM outputs were regridded using conservative remapping to match the resolution of the observational dataset (0.05°×0.05°), except for a RCP8.5 simulation bias-corrected with QME for which bilinear interpolation was used (Peter et al., 2024). The calibration of the bias correction methods was done using the years 1976–2005, except for the QME method where a longer calibration period (1975–2017) was used due to its focus on representing climate extremes.
Projections of root-zone soil moisture (top 1 m) and total runoff were then obtained by running AWRA-L forced with downscaled and bias-corrected GCM data of daily minimum and maximum temperature, precipitation, wind speed and solar radiation. For the historical period, AWRA-L was initialised using initial states for 31 December 1959 from the AWRA-L historical reference run, which is forced with observed climate inputs. The future projections were initialised using the last day of the historical simulation (31 December 2005) resulting in seamless hydrological simulations from 1960 to 2099. We discarded the period 1960–1969 as spin-up from all analyses. We thus use the period 1970–2005 as the historical baseline period in this study.
In the remainder of this paper, we use the term “ensemble member” to define a combination of GCM and downscaling/bias correction (DS-BC) methods. The National Hydrological Projections data underpinning this paper consist of 16 ensemble members for each of the two selected representative concentration pathways (RCPs) – four GCMs combined with four DS-BC methods. We mainly concentrate on the RCP4.5 scenario as it is widely considered more feasible than RCP8.5 but also show some results for RCP8.5 for comparison.
2.3 Drought metrics
We consider three common types of drought: meteorological (precipitation), hydrological (runoff) and agricultural (soil moisture). We use GCM outputs of rainfall for meteorological droughts and AWRA-L outputs of total runoff and root zone soil moisture for hydrological and agricultural drought, respectively. We define droughts using a consistent method across all three drought types. We use percentile thresholds to identify drought periods instead of commonly used metrics such as Standardised Precipitation Index (SPI; (McKee et al., 1993) or Standardised Runoff Index (Shukla and Wood, 2008), as the percentile method does not involve assumptions about the data distribution. We use the 15th percentile as the drought threshold such that months below this threshold are classified as drought. This corresponds approximately to the SPI threshold of −1 which is commonly used to characterise “moderate” droughts (McKee et al., 1993). We chose this threshold to identify events that are likely to lead to impacts whilst maintaining a sufficient number of drought events to reliably infer trends in the drought metrics (Ukkola et al., 2020). This method is also similar to that used by the Australian Bureau of Meteorology which uses percentiles in their drought reporting (http://www.bom.gov.au/climate/drought, last access: 17 March 2026).
We analyse trends in seasonal-scale droughts, which have impacts on Australian agriculture, ecosystems and water resources (Gallant et al., 2013). We chose to concentrate on these relatively short droughts to ensure a large enough sample size of events during the relatively short baseline period (36 years). To identify seasonal droughts, we first convert the daily precipitation, runoff and soil moisture time series into 3-month running means, such that each month's value is calculated as the mean of that and two preceding months. This approach is analogous to calculating SPI at the 3-month scale and reflects seasonal-scale droughts. From the running mean time series, we then determine the 15th percentile drought thresholds separately for each calendar month to account for seasonality. We use data for the period 1970–2005 for determining the thresholds such that all drought metrics are relative to this historical baseline period. This time period was chosen to make use of all the available years in the historical experiment to allow the drought thresholds to be determined more reliably than using a shorter baseline. The thresholds were calculated separately for each model and observational dataset such that they are relative to each dataset's own climatology.
After identifying drought months, we calculate three common drought metrics: duration, intensity and time under drought (Sheffield and Wood, 2011). Duration is defined as the number of consecutive months for which the hydrological variable is below the drought threshold. As we use 3-month running means to determine droughts, the minimum drought duration is 3 months. Intensity (I) is the relative difference between the climatological mean and the running-mean monthly value (expressed as %), averaged across all the months during a drought event. The monthly climatology used to determine intensity is calculated from the 3-month running mean time series. We chose to express intensity in relative terms in this study rather than using the absolute difference (in mm) to be able to compare more easily across the three hydrological variables and different spatial locations for which absolute values can differ strongly. Time under drought (%) was calculated as the percentage of months for which the hydrological variable was below the drought threshold during a given time period. During the historical baseline period (1970–2005), the time under drought is equal to the percentile threshold used to identify drought months (i.e. ∼ 15 % for normally-distributed data).
2.4 Statistical methods
Model skill against observed precipitation and the AWRA-L reference run was estimated using two metrics. Overall model bias was quantified using the mean bias error (MBE):
where is the modelled and the observed mean value of the drought metric during the baseline period (1970–2005). Additionally, we compared the modelled and observed spatial density functions of long-term averaged drought duration, frequency and intensity by calculating the Perkins skill score (s; Perkins et al., 2007) which measures the overlap of the modelled and observed probability density functions (PDFs):
where n is the number of bins used to calculate the PDFs and Zm and Zo are the modelled and observed frequency of values in a given bin, respectively. A value of 1 for s signifies perfect overlap of the two density functions and a value of 0 no overlap. To determine the frequencies, we calculate a discrete probability function (n=50) and express Z as the fraction of land area falling into each bin.
For the future projections, we quantified model agreement on future changes using a metric following (Meehl et al., 2007). Models were deemed to be in agreement when the magnitude of the multi-model mean future change exceeded the inter-model standard deviation of the change. When models are in agreement according to this metric, we describe these projections as “robust”.
We also quantified the fraction of uncertainty in the future projections attributable to GCMs, DS-BC methods and RCP scenarios. The fraction attributable to DS-BC methods and GCM was calculated using the RCP4.5 simulations. We first calculate the full range of future changes in a drought metric by taking the minimum and maximum value of future change from the 16 RCP4.5 simulations at a given pixel (4 GCMs × 4 DS-BC methods). To determine the fraction attributable to DS-BC methods, we then take the simulations from each GCM (i.e. four simulations corresponding to the DS-BC methods) and calculate the range across these and finally divide this range by the full range of future change. We repeat this separately for each GCM and present both the mean fraction across different GCMs and its range in the results. We repeat this to calculate the fraction of uncertainty attributable to GCMs, this time taking the simulations for each DS-BC method corresponding to the four GCMs and repeat the steps as above.
To calculate the fraction attributable to the RCPs, we first calculated the full range in future change from all 32 simulations (2 RCP scenarios × 4 GCMs × 4 DS-BC methods). Separately for each RCP, we then calculate the range across the individual RCP and divide this by the full range. Note the fraction of uncertainty attributed to each source is not additive as it is not possible to calculate the unique contribution from each source of uncertainty from the available simulations.
3.1 Continental-scale changes in drought characteristics
We first explore future changes in drought characteristics across the continent. Figure 2 shows the ensemble mean future change in time under drought relative to the historical baseline (during which ∼ 15 % of the time is under drought as per our definition). Pixels where models agree on the sign of change (see Methods for the definition) are shown in colour and are otherwise masked in grey. The projections suggest that many coastal and inland eastern Australian regions will spend more time under drought with climate change. For the RCP4.5 scenario, the changes are particularly evident along the southern and eastern coastal regions. All drought types show increasing drought occurrence in the southwest. Along the eastern coast, meteorological (precipitation) drought changes are most robust along the south- and northeast coasts. This pattern is slightly different for hydrological (runoff) drought with robust changes all along the eastern seaboard, whereas agricultural (soil moisture) drought changes are most consistent in the southeast and western Tasmania, with scattered areas across eastern Australia, including parts of inland regions. All drought types consistently show increased drought occurrence in the regions of high model agreement. Overall, the changes are larger for runoff and soil moisture compared to precipitation with the time under drought increasing by > 20 % points in some regions. These changes become more widespread and stronger under RCP8.5, with the land area where models agree approximately doubling (e.g. from 19.9 % to 46.5 % for precipitation). Most notably, the robust changes extend further inland in northeastern Australia for precipitation and runoff and in southeastern Australia for soil moisture. For both emissions scenarios, future changes are uncertain in northwestern and central Australia. Many of these regions are arid with very high year-to-year variability, which makes the quantification of drought challenging.
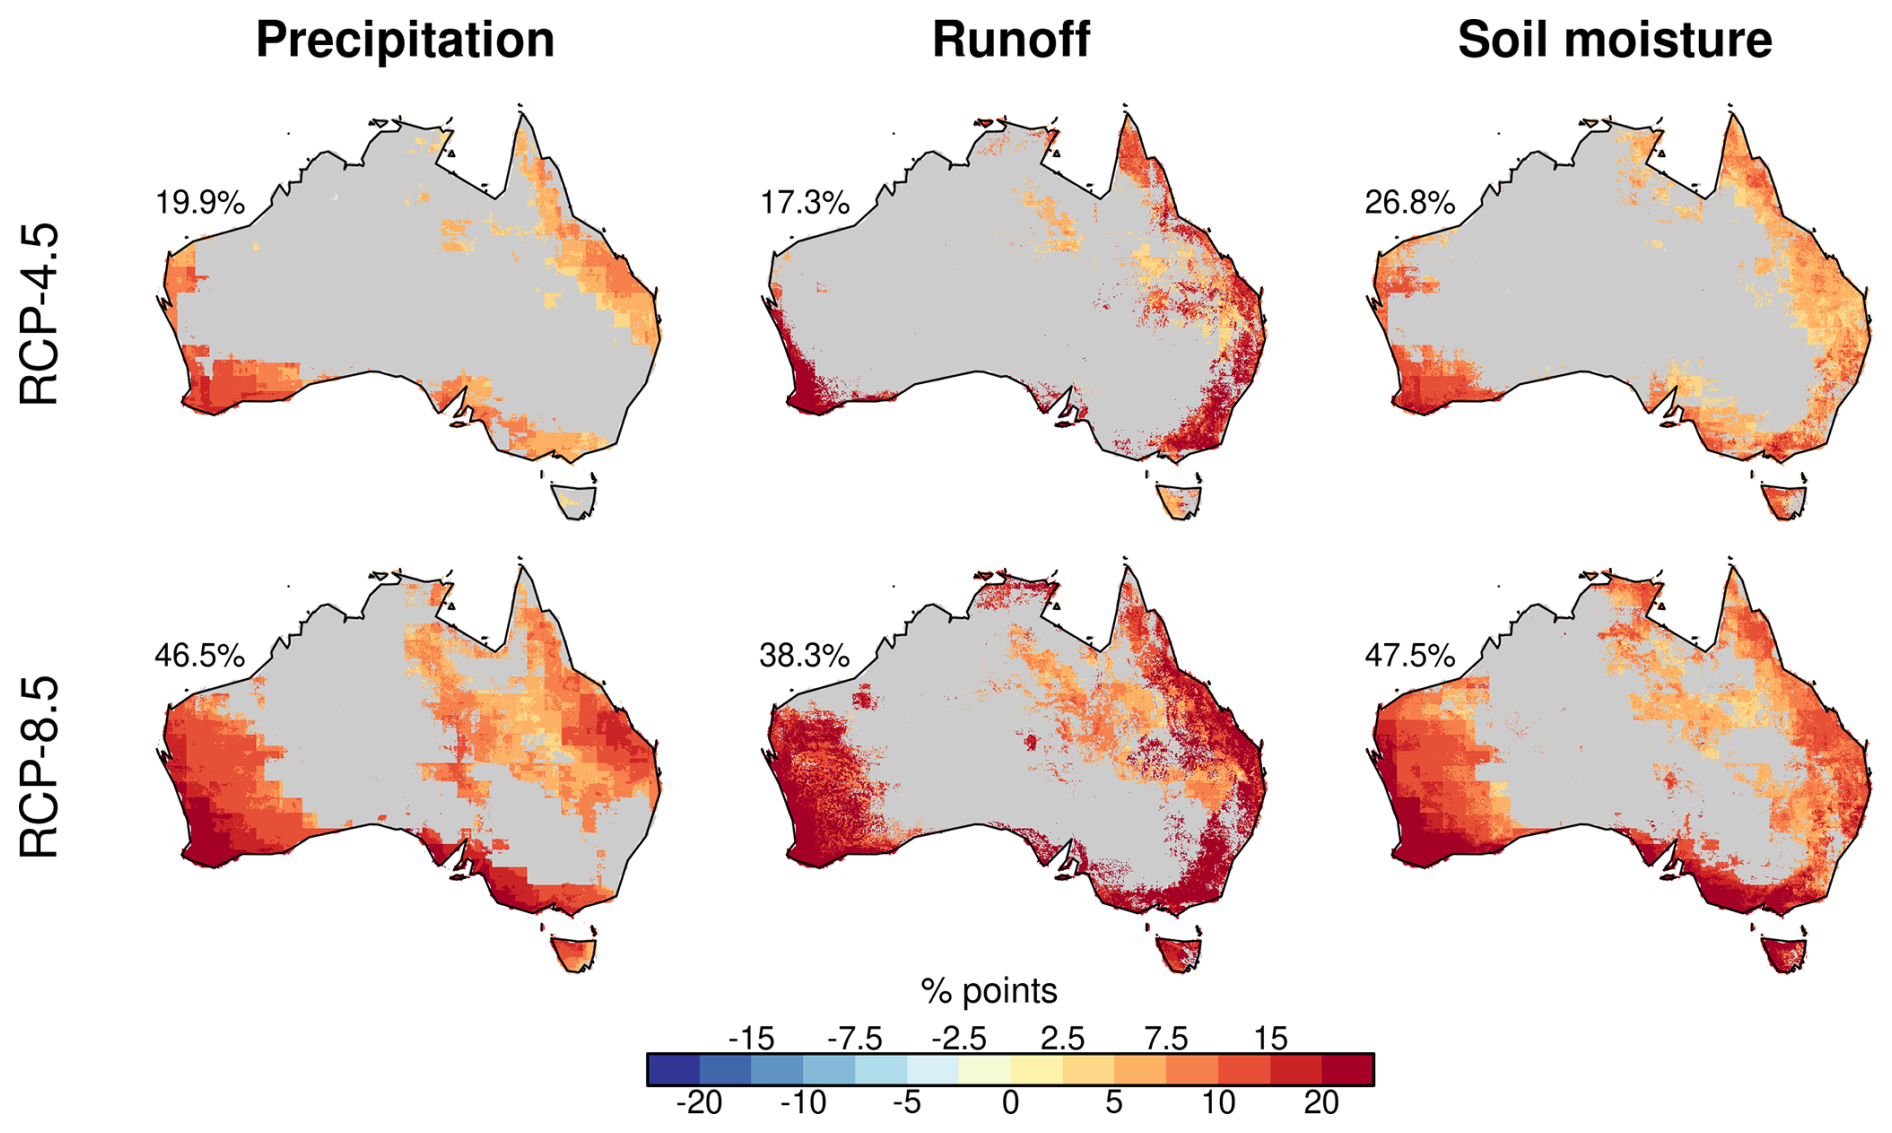
Figure 2The ensemble mean future change in time under drought for the three drought types and two emissions scenarios (RCP4.5 and RCP8.5). The maps show the difference in time under drought in 2064–2099 compared to the 1970–2005 baseline (during which 15 % of time is under drought as per definition). Pixels where models do not agree on the change are shown in grey. The percentage shown on the top left of each map represents the percentage of the land area for which models agree on the change.
Changes in mean drought duration (i.e. the length of individual drought events) are similar with changes in time under drought (Fig. S2). Drought duration is projected to become longer in the southwest and along parts of the southern and eastern coasts. Where models agree on the change they overwhelmingly point to increasing drought duration across the three drought types. However, the land area where models agree is lower for this metric (7.4 %–11.6 % for RCP4.5 compared to 17.3 %–26.8 % for time under drought) although this land area more than doubles for RCP8.5. The largest changes are projected for runoff droughts with increases of > 3 months in many regions. Similar changes can also be seen in soil moisture droughts in the southwest and southeast. Historically, simulated runoff and soil moisture drought are longer (up to 6 months) than precipitation drought which are relatively short-lived using our drought definition (up to 4.5 months), with these projected changes suggesting they will be increasingly persistent with climate change.
Similarly, drought intensity is predicted to increase where models agree on the change (Fig. S2). However, the spatial pattern is less coherent than for time under drought or duration. Changes to precipitation drought are strongest for northwestern Australia, however spatially there is little agreement amongst the models. Changes to runoff drought intensity are largest in the southwest and parts of the southeastern alpine regions. This increase in intensity is larger under RCP8.5. Models show agreement on soil moisture drought changes across many parts of the country but the areas are not spatially coherent. Nevertheless, this suggests a potential risk for more intense soil moisture droughts across the continent.
While runoff drought changes show a smaller area of robust changes, they are of greater magnitude across most pixels compared to rainfall (16 % points for runoff vs 8 % points for rainfall on average across all robust pixels for time under drought; 1.6 months vs 0.5 months for duration and 3.1 % points vs 2.2 % points for intensity). Soil moisture changes similarly tend to be larger than rainfall changes for duration and intensity (0.8 vs 0.5 months for duration and 2.7 % vs 2.2 % points for intensity). These stronger changes partly stem from increases in actual evapotranspiration (ET) (Fig. S4). While ET is largely projected to decline in the southern and eastern parts in line with rainfall, parts of the southeast coast and Tasmania that are projected to experience robust soil moisture and runoff drought increases also show increasing ET in the future. Furthermore, the ratio of ET to rainfall is projected to increase in the southeast where time under drought for runoff and soil moisture is projected to increase more strongly than for precipitation (Fig. S5). This will act to reduce runoff and/or soil moisture even when ET is declining. Both rainfall and ET variability are also projected to increase into the future, increasing the likelihood for drought (Fig. S4).
Another likely factor in larger runoff drought changes is the amplification of rainfall and ET changes in runoff. Runoff is a smaller component of the water cycle compared to rainfall and ET across most of Australia (the fraction of rainfall partitioned to ET is > 50 % across > 99 % of the continent during the historical period). Any given relative changes in ET and rainfall are therefore amplified in runoff, yielding larger relative changes in runoff (and similarly for soil moisture). The relative future changes in mean monthly runoff exceed relative changes in mean monthly precipitation across 93 % of pixels when averaged across the pixels showing robust future changes in time under hydrological drought. Similarly, runoff changes exceed those in ET across 99 % of the pixels with robust changes. This amplification of runoff changes agrees with past observations of greater relative changes in runoff compared to precipitation (e.g. Petrone et al., 2010) and ET (e.g. Ukkola et al., 2016b).
3.2 Seasonal changes in drought characteristics
We next investigate how time under drought and drought intensity are projected to change across different seasons (duration is not shown as this metric cannot be split by season as individual events can span multiple seasons). Figure 3 shows the projected changes in time under drought across the four seasons for the RCP4.5 scenario. The spatial patterns are overall similar compared to the annual average presented in Fig. 2. However, more widespread robust increases during winter and spring are evident across much of the country in all three drought types. This is particularly true for precipitation and runoff droughts where the land area over which models agree on the change increases from 4 %–11 % in summer/autumn to 17 %–24 % in winter/spring. Most of southwestern and southeastern Australia (temperate climates) show robust increases in precipitation droughts during winter/spring. The areas of robust change are similar for runoff but extend to parts of northeastern and northern Australia (noting that winter/spring is the dry season in this region). Soil moisture changes are also most pronounced in the spring, with 33 % of the country showing robust increases. Equally strong increases are also observed in the summer in southwestern and southeastern Australia. Northwestern Australia (a monsoonal region with summer-dominant precipitation) shows declining time under drought in the summer, coinciding with the wet season. This is consistent with increasing summer precipitation and soil moisture in this region during the recent historical period (Dey et al., 2019; Wasko et al., 2021). Similar to precipitation and runoff, soil moisture drought changes are mostly uncertain in autumn with only scattered areas in southern Australia showing robust increases.
Projected seasonal changes in drought intensity show similar patterns to time under drought but the changes are more uncertain across the model ensemble (Fig. S6). Runoff shows more intense droughts across all seasons along the southwestern and southeastern coasts with also some smaller changes along the northeast coast during all seasons. Changes in soil moisture and precipitation drought intensity vary by season with the northeast showing increases in summer and autumn and many scattered regions across the country in spring. Overall, the changes in intensity are most robust in spring across all three drought types (with regions of model agreement ranging between 23 %–25 % of the land area).
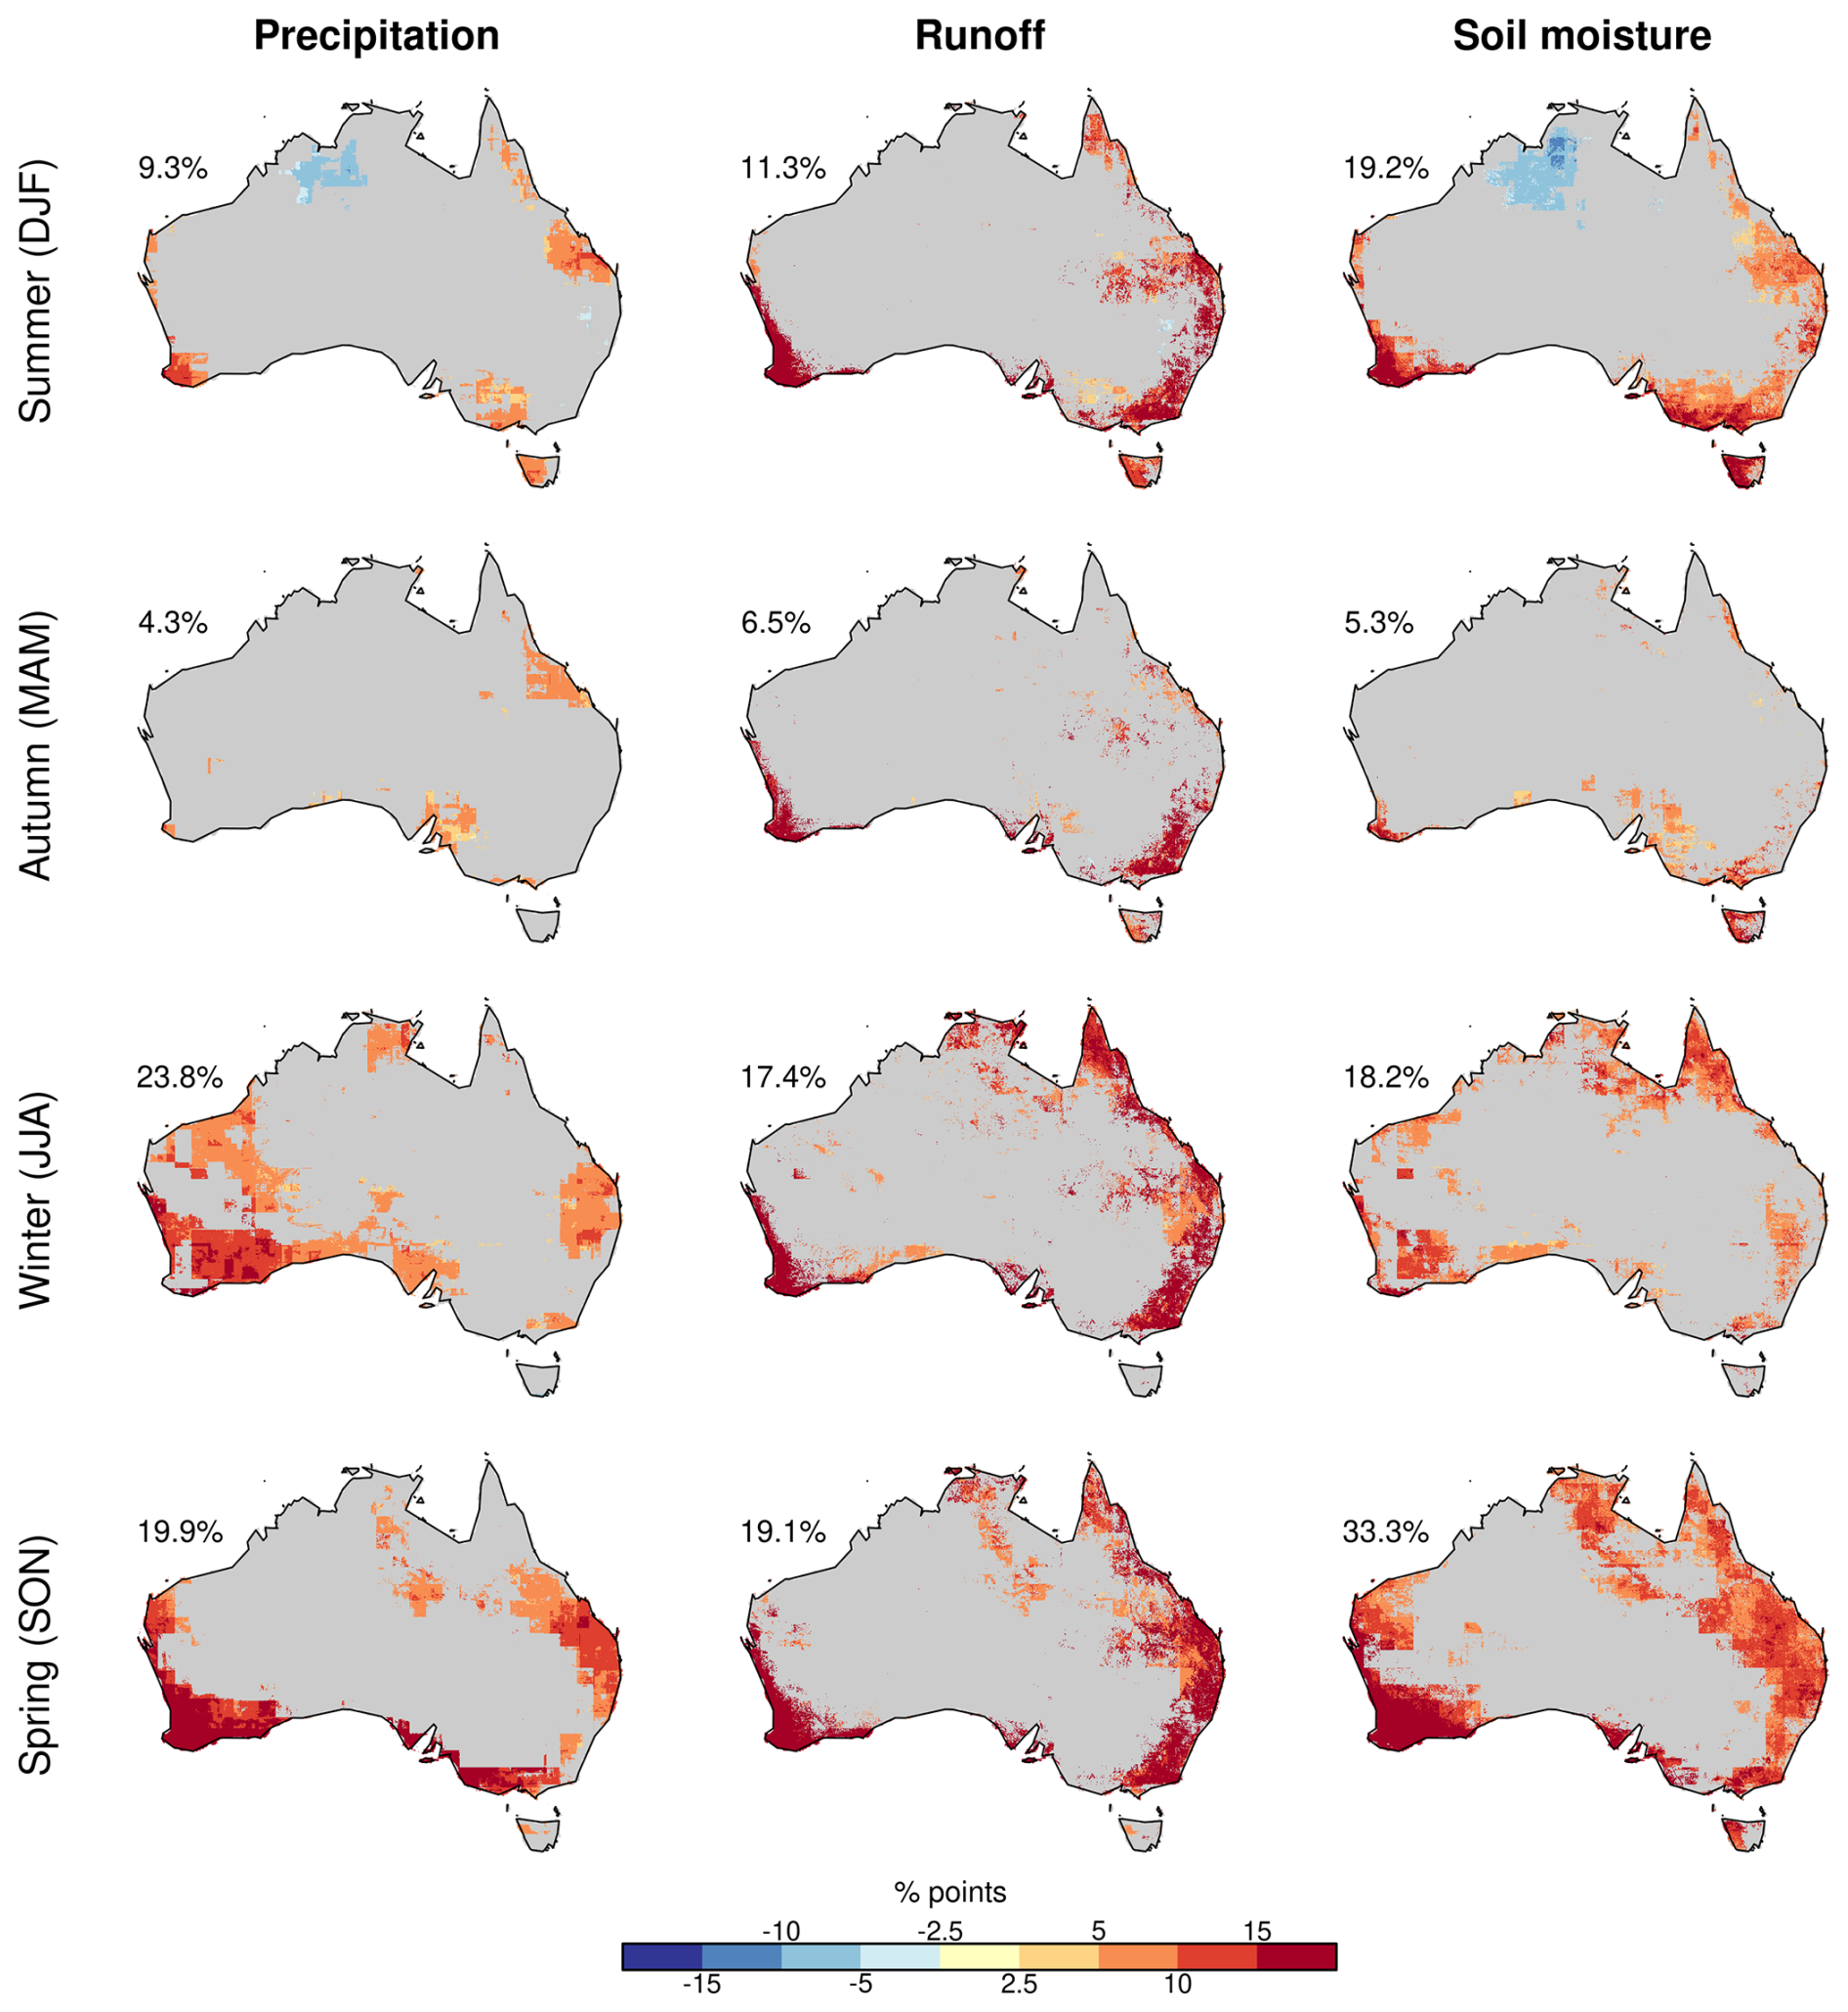
Figure 3The ensemble mean future change in time under drought by season for the three drought types under the RCP4.5 scenario. The maps show the difference in time under drought in 2064–2099 compared to the 1970–2005 baseline during each season. Pixels where models do not agree on the change are shown in grey. The percentage shown on the top left of each map represents the percentage of the land area for which models agree on the change.
3.3 Sources of uncertainty in continental future changes
Our model ensemble consists of a combination of four GCMs and DS-BC correction methods and two emissions scenarios. Figure 4 shows the relative contribution from each of these sources of uncertainty for each pixel for the future change in time under drought (calculated as detailed in Methods Sect. 2.4). For this metric, the uncertainty arising from the GCMs was greatest, accounting for > 80 % of the range of projections in some regions. The GCM uncertainty was particularly high in southwestern and eastern Australia for all drought types, accounting for > 60 % of the uncertainty in many regions. Averaged across the country, 57 %–61 % of the total range in future changes were attributable to the choice of GCM (with individual combinations ranging from 47 %–72 %; see Methods).
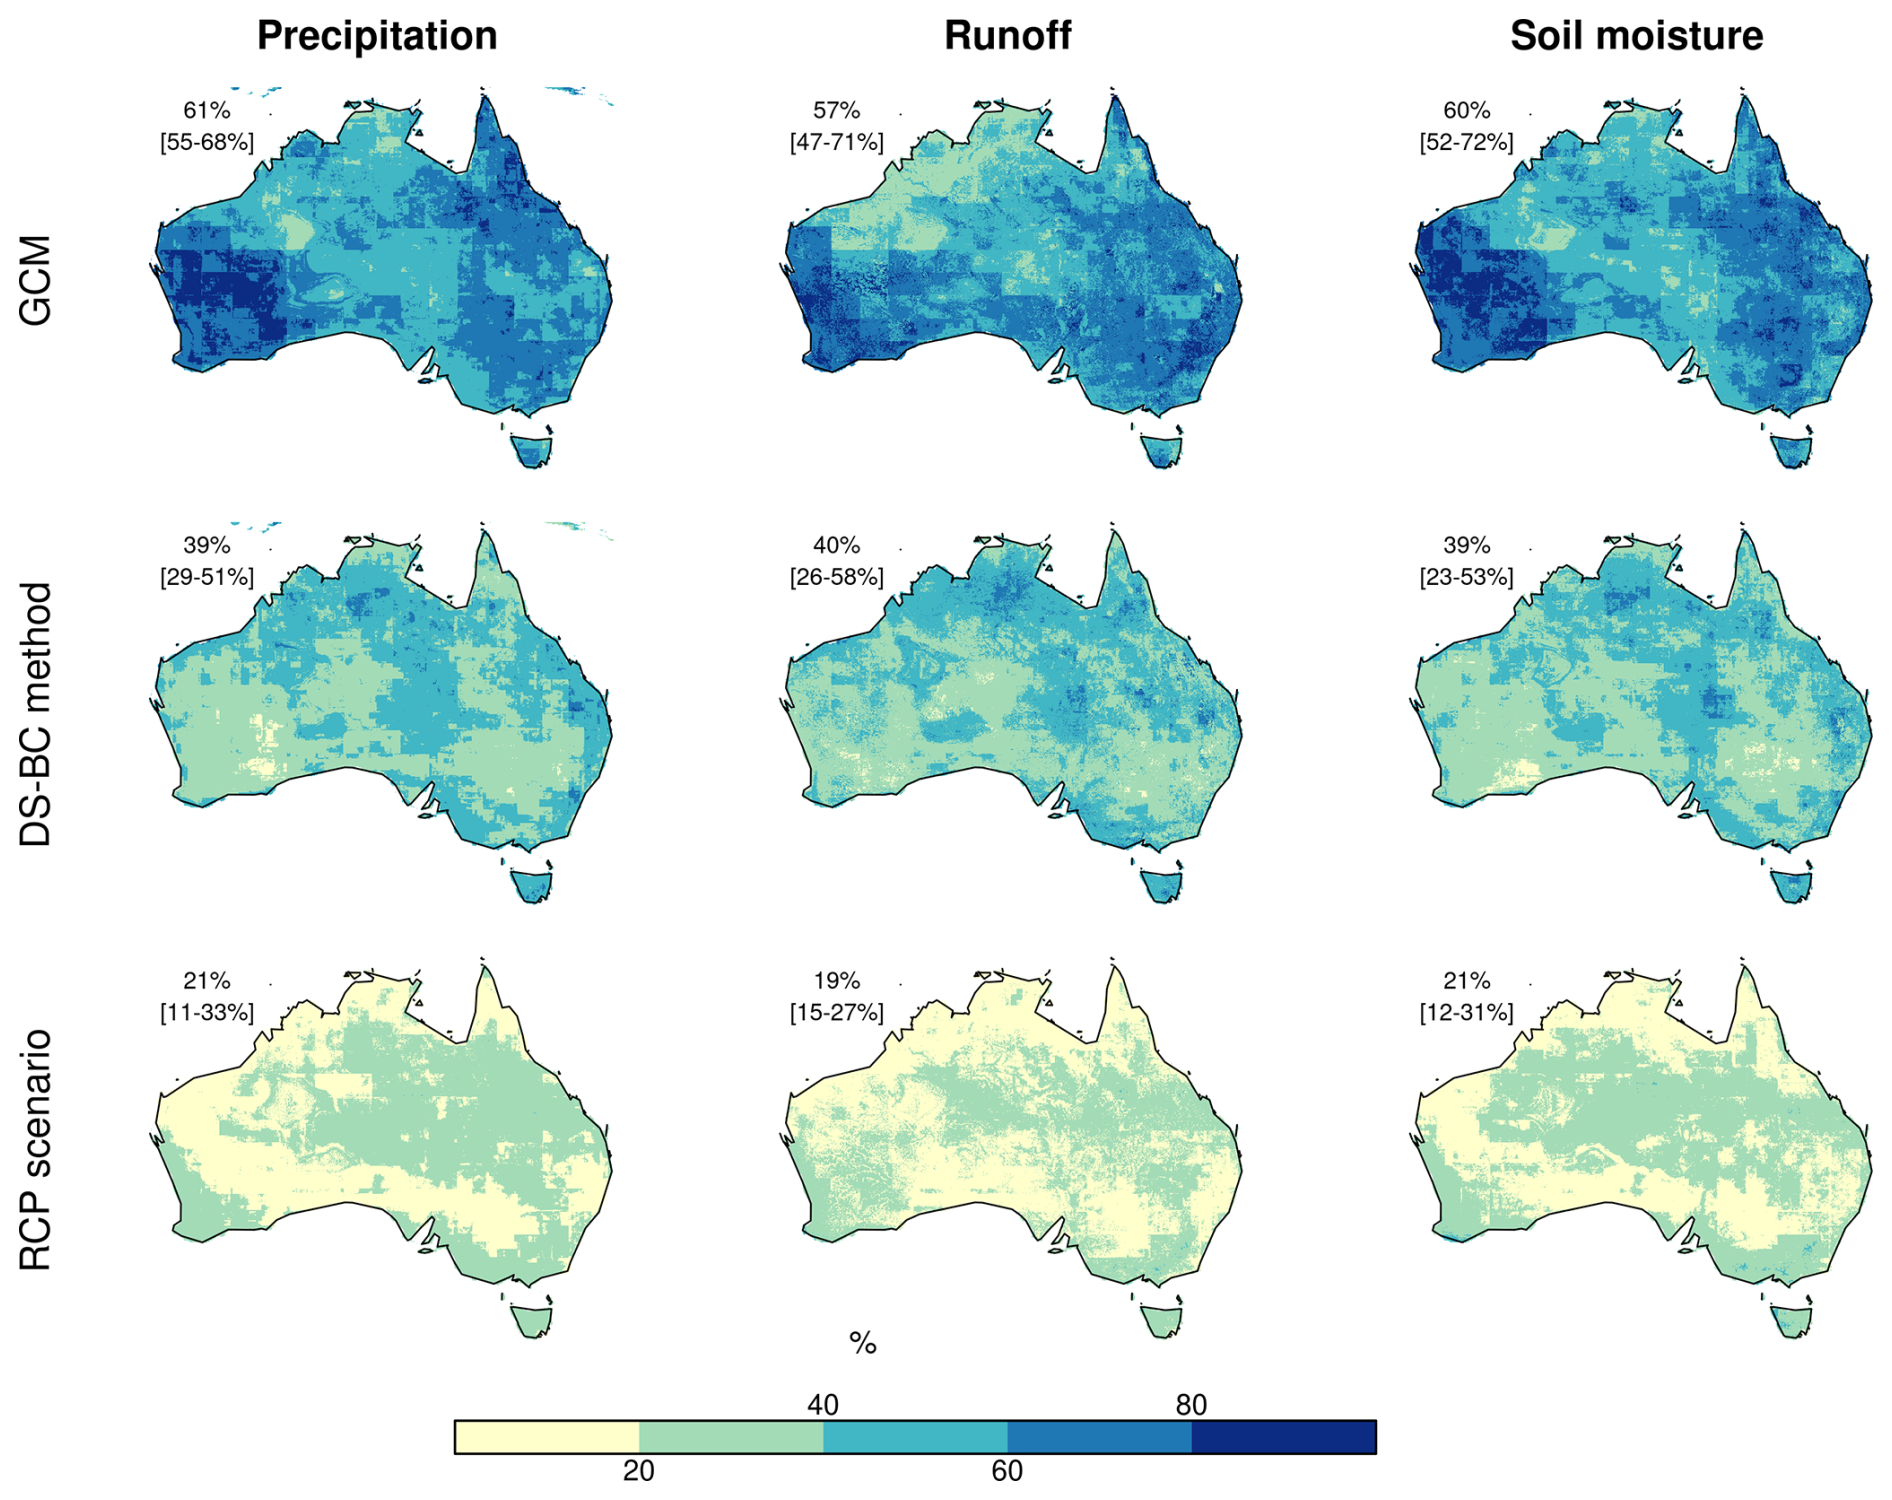
Figure 4Fraction of total uncertainty arising from the choice of GCM (top row), DS-BC method (middle) and RCP scenario (bottom) for the time under drought metric. The RCP4.5 scenario was used to partition GCM and DS-BC uncertainty (see Methods). The percentage shown on the top left of each map represents the mean fraction of uncertainty averaged across all pixels. The numbers in square brackets show the range in the mean value from the different ensemble member combinations (see Methods).
Despite being lower than GCM uncertainty, the choice of DS-BC methods also leads to a large range in projected future changes in time under drought. Averaged across the continent, it represented ∼ 40 % of the full range of uncertainty (ranging between 23 %–58 %), which is roughly equivalent to two thirds of the uncertainty arising from GCMs. The spatial pattern is less coherent compared to the GCM uncertainty, but in many areas of northwestern Australia, DS-BC methods represent an equal or greater fraction of uncertainty than the GCMs (> 40 % in many parts of this region). Elsewhere, it accounts for 20 %–60 % of the uncertainty. It is a major source of uncertainty for precipitation droughts in eastern and southeastern Australia (∼ 40 %).
The RCP emissions scenarios represent the lowest source of uncertainty (we again note the relative contributions are not additive). Up to 40 % of the uncertainty can be attributed to the RCPs but this value is below 20 % across many parts of the country. Overall, the RCPs account for ∼ 20 % of uncertainty across the continent (ranging between 11 %–33 %), representing about half of the uncertainty arising from the DS-BC methods and a third arising from the GCMs. This agrees with previous global studies looking at CMIP6 drought projections which have shown that a higher emission scenario tends to lead to larger future changes but often does not change the sign or the broad spatial distribution of the projected change (Cook et al., 2020; Ukkola et al., 2020).
The contribution for each source of uncertainty was similar for the duration and intensity metrics but the spatial pattern was less coherent compared to the time under drought metric (Figs. S7–S8). For soil moisture, GCMs were the dominant source of uncertainty for both metrics. For runoff and precipitation drought duration, GCM uncertainty was slightly higher than that arising from DS-BC methods. By contrast, for drought intensity bias correction represented a similar fraction of uncertainty to GCMs for both precipitation and runoff (44 % for GCM vs 37 % for bias correction when averaged across the country for runoff intensity, and 55 % vs 52 % for precipitation drought intensity). For both duration and intensity, the RCPs represented the smallest source of uncertainty at ∼ 20 % when averaged across the continent.
3.4 Differences across GCMs and bias correction methods and evaluation against observations
We next analyse historical and future drought metrics separately for each GCM and DS-BC method to understand the differences arising from individual GCMs and DS-BC methods. We first evaluate simulated historical drought duration and intensity across Australia against observed precipitation and streamflow, and the observationally-driven AWRA-L reference run (time under drought is not evaluated as it is 15 % by definition during the historical baseline period). We then analyse the projections for the Natural Resource Management (NRM) regions (Fig. S9) to understand model biases and trends regionally. NRM regions are administrative regions used for the management of natural resources including water, soil, flora and fauna across Australia. Here we use NRM groupings representing areas of similar bioclimatic conditions (Climate Change in Australia, https://www.climatechangeinaustralia.gov.au/en/overview/methodology/nrm-regions/, last access: 17 March 2026).
Figure 5 shows a density distribution of historical mean drought duration for all pixels across Australia, separated by GCMs (left panels) and bias correction methods (right panels). Three GCMs (CNRM-CM5, ACCESS1-0, MIROC5) simulate shorter drought durations compared to the observationally-based data for all drought types whereas GFDL-ESM2M has a longer drought duration compared to the observationally-based data and has the largest mean bias error for precipitation and runoff (0.19 months compared to −0.09 or less for the other GCMs for precipitation and 0.81 compared to 0.31 for runoff). GFDL-ESM2M has the lowest mean bias error for soil moisture (0.11 months) but lowest Perkins skill score (0.74), suggesting an overall low fit to the AWRA-L reference simulations. The positive biases in GFDL-ESM2M are apparent across most of the country (Figs. S10–S12). For runoff droughts, an evaluation against observed streamflow similarly shows that GFDL-ESM2 tends to simulate longer drought duration but it is in better agreement with observations than the other GCMs (Fig. S14).
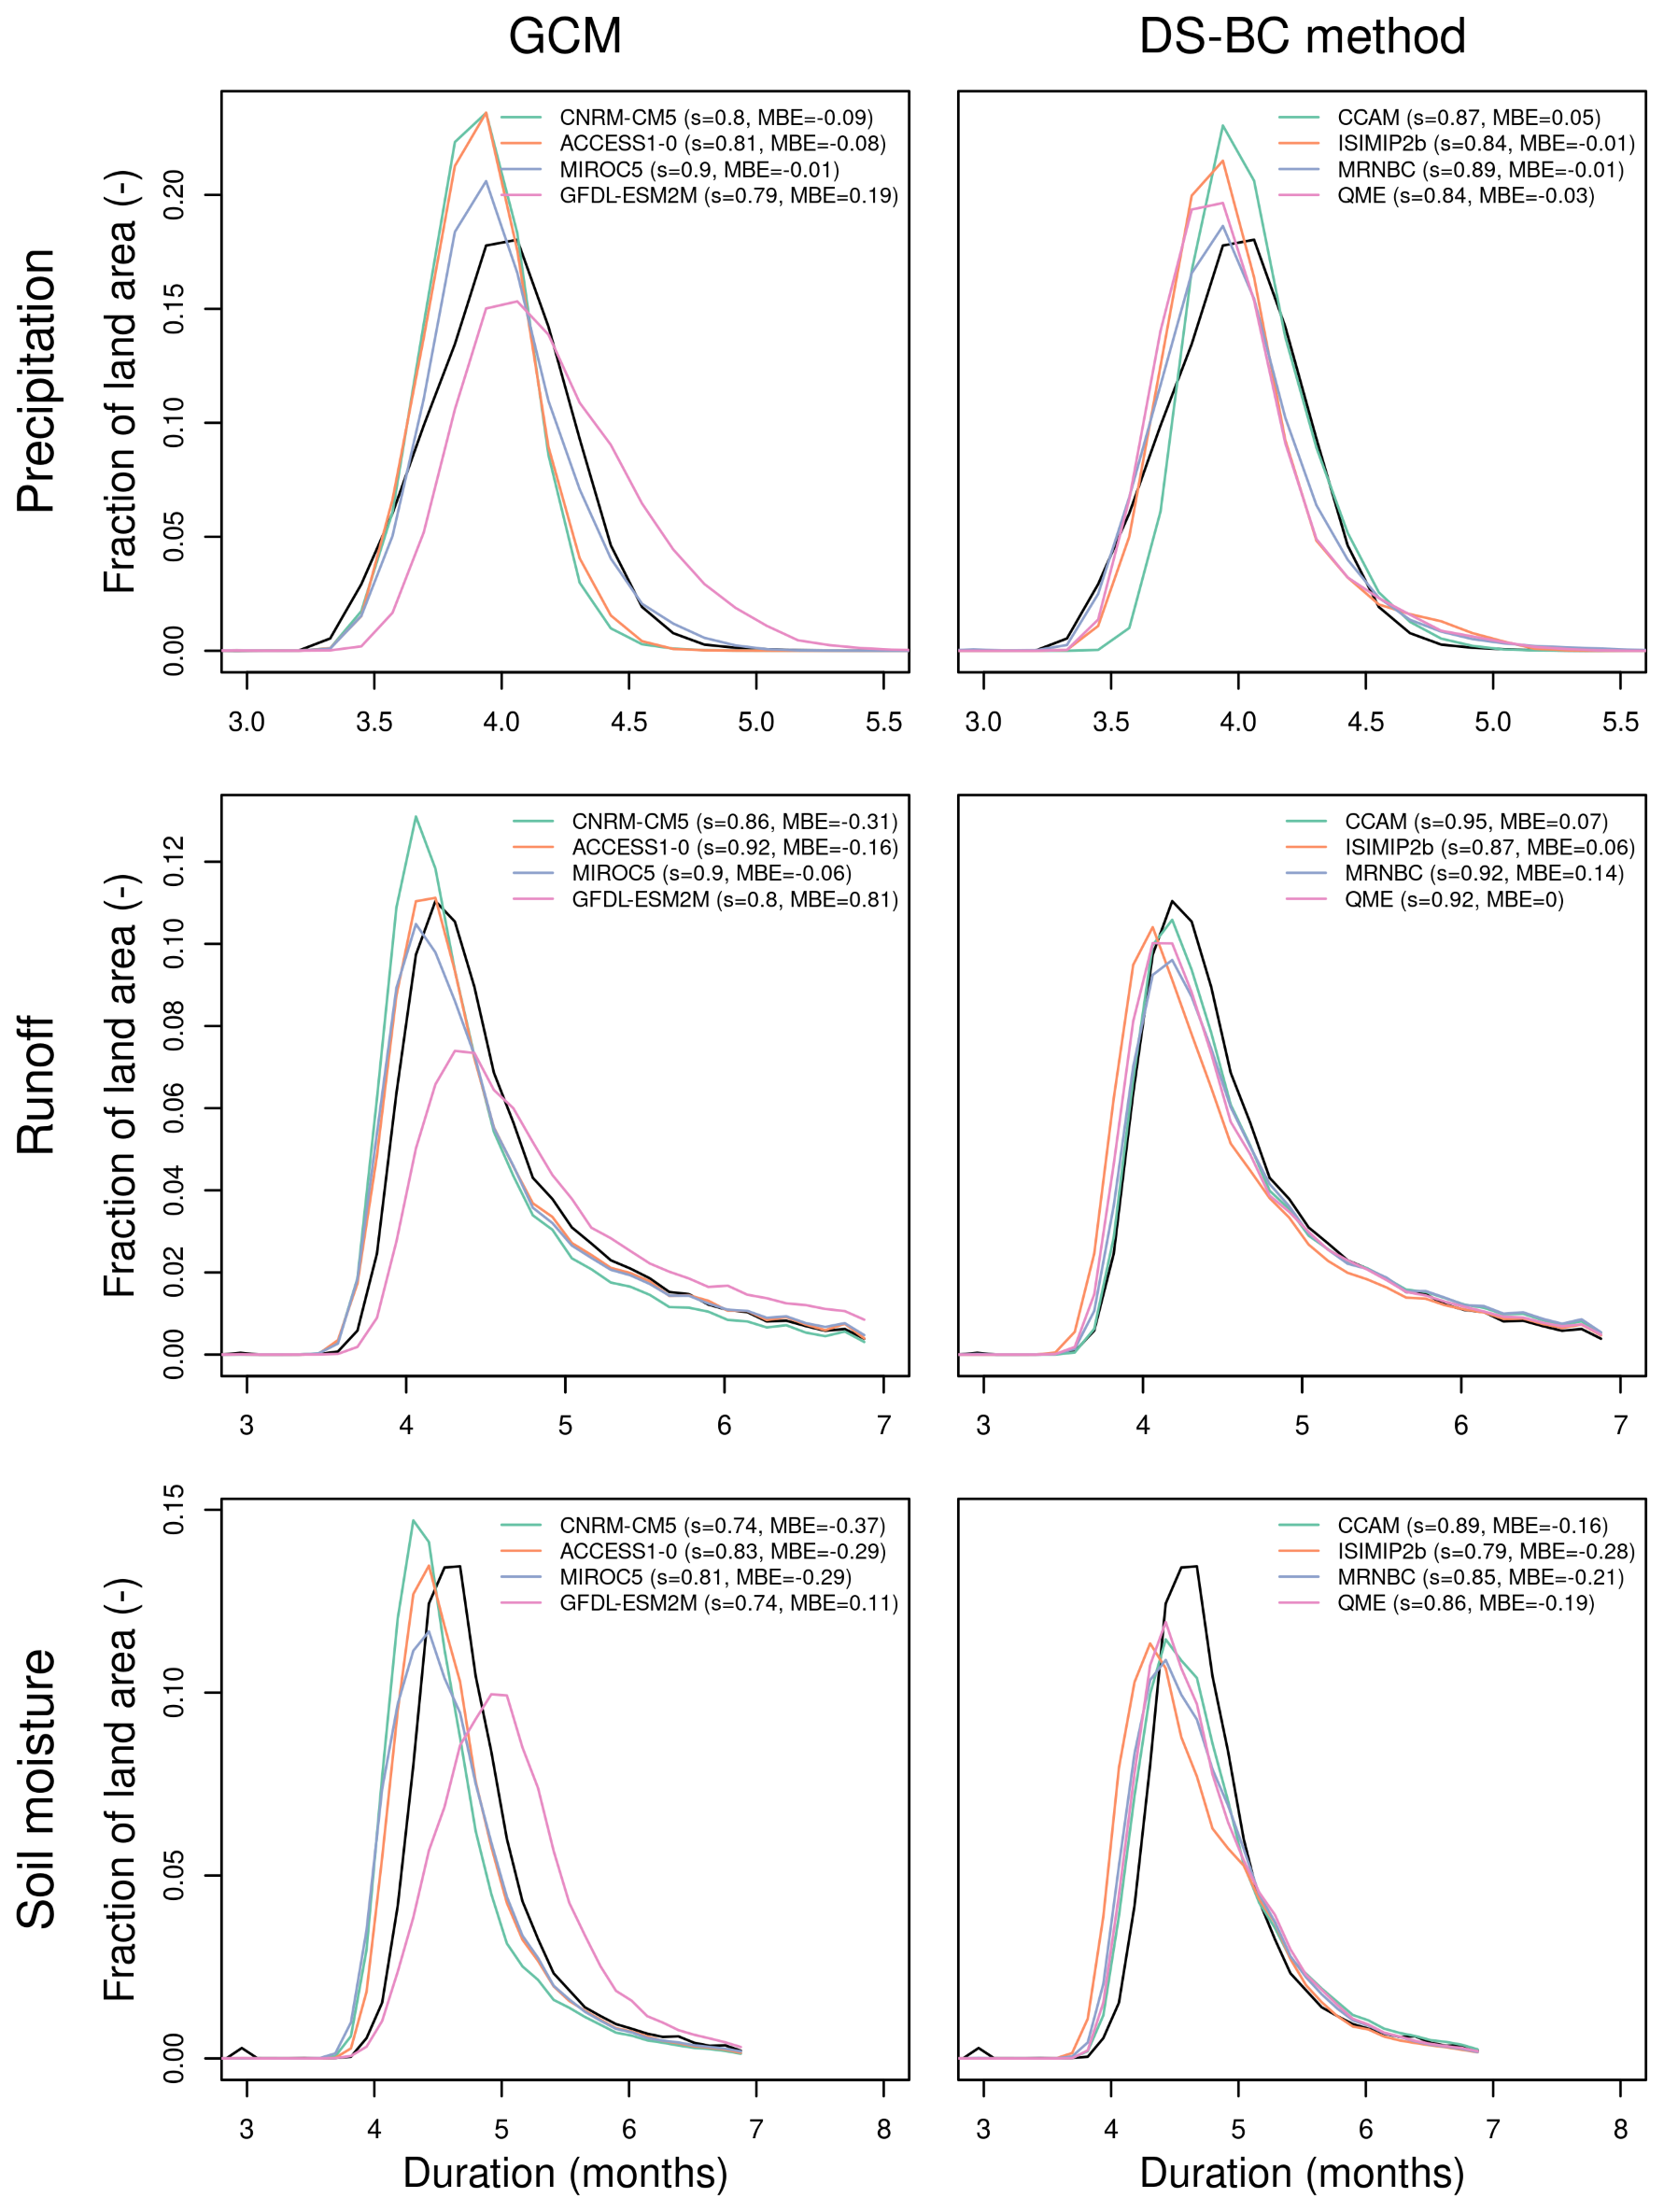
Figure 5The density distribution of historical drought duration across all pixels for precipitation, runoff and soil moisture drought (rows). For precipitation, observations are shown in black. For runoff and soil moisture, the observationally-forced historical AWRA-L reference run is shown in black. For each GCM, the data were averaged across the four DS-BC members before plotting. For DS-BC methods, data were averaged across the four GCMs before plotting. Data for 1970–2020 was used to coincide with the observational data, with the historical model simulations extended using RCP4.5. The Perkins skill score (s) and mean bias error (MBE) are shown in the legend.
The differences between the DS-BC methods are smaller than differences across GCMs (Fig. 5, right panels). The different methods replicate the observed precipitation density well but most methods, in particular CCAM, underestimate the frequency of low duration events (> 4 months) and overestimate longer duration events (> 4.5 months). CCAM biases are largest in northern Australia where it overestimates drought duration (Figs. S10–S12). Overall, the skill is similar across the DS-BC methods when comparing the Perkins skill score and MBE. For runoff and soil moisture, the DS-BC methods overestimate the frequency of shorter events (< 5 months) and underestimate longer events. This finding is consistent when comparing runoff against streamflow observations, albeit the skill scores are lower especially for MBE (Fig. S14). This is not surprising given the streamflow observations are an independent constraint whereas AWRA-L underpins both the GCM-forced and reference runs in Fig. 5. Overall, the skill is similar to precipitation drought duration. However, the difference between statistical (ISIMIP2b, MRNBC and QME ensemble members) and dynamical (CCAM) downscaling is smaller for runoff and soil moisture drought duration compared to precipitation. Drought duration shows largest positive biases in northern Australia, in particular the northeast, and parts of western Australia whereas drought duration in southeastern Australia, especially the alpine regions, is underestimated across all bias correction methods (Figs. S7–S9; right column).
Drought intensity is underestimated by all GCMs and DS-BC methods (Figs. S13, S14; mean bias error). MIROC5 shows the largest mean bias error (−4.17 %) for precipitation and underestimates the frequency of relative intensity values below 60 %. All GCMs and DS-BC methods underestimate runoff drought intensity (except QME when compared to the AWRA-L reference run; Figs. S10 and S14). The Perkins skill score shows good agreement (≥ 0.85) with the AWRA-L reference run but is lower when compared to observed streamflow (0.5–0.66). The bias correction methods also show large differences in the density distributions for drought intensity, with ISIMIP2b showing the largest mean bias error for all drought types (−6.62 % for precipitation, −2.39 % for runoff and −6.71 % for soil moisture). CCAM has a high mean bias error for runoff (−2.38 %) but performs well for precipitation and soil moisture compared to the other methods for both skill metrics. The underestimation of drought intensity is consistent with previous studies which have shown a tendency by GCMs to underestimate monthly and annual scale rainfall variability and precipitation persistence (Moon et al., 2018; Papalexiou et al., 2021; Rocheta et al., 2014; Ukkola et al., 2018).
Finally, we analyse model biases and future changes arising from different GCMs and bias correction methods across the NRM regions. Figures 6 and 7 show the historical bias (top row) and future changes (bottom row) in precipitation and runoff drought duration, respectively, across the NRM regions. GFDL-ESM2M consistently overestimates drought duration across all regions for both drought types. The biases are particularly high for runoff droughts in the wet tropics, southern and south-western flatlands, east coast and central slopes (> 0.5 months). This agrees with Vogel et al. (2023) who showed overestimation of precipitation and runoff interannual variability and drought severity by the GFDL-ESM2M ensemble members. The biases across other GCMs are generally smaller but systematic across several regions. CNRM-CM5, ACCESS1-0 and MIROC5 systematically underestimate drought duration in the rangelands, Murray basin for both precipitation and runoff and additionally southern slopes and southern and south-western flatlands for runoff. Conversely, drought duration is systematically overestimated in the wet tropics and monsoonal north. These northern Australian regions have highly seasonal rainfall and runoff and thus these biases should be interpreted cautiously as they were calculated from all available drought events, including dry season droughts. Overall the biases tend to be larger for runoff, likely due to the longer runoff drought durations (Fig. 5). In many regions the biases are within ±0.2 months, overall suggesting good model skill particularly for precipitation drought.
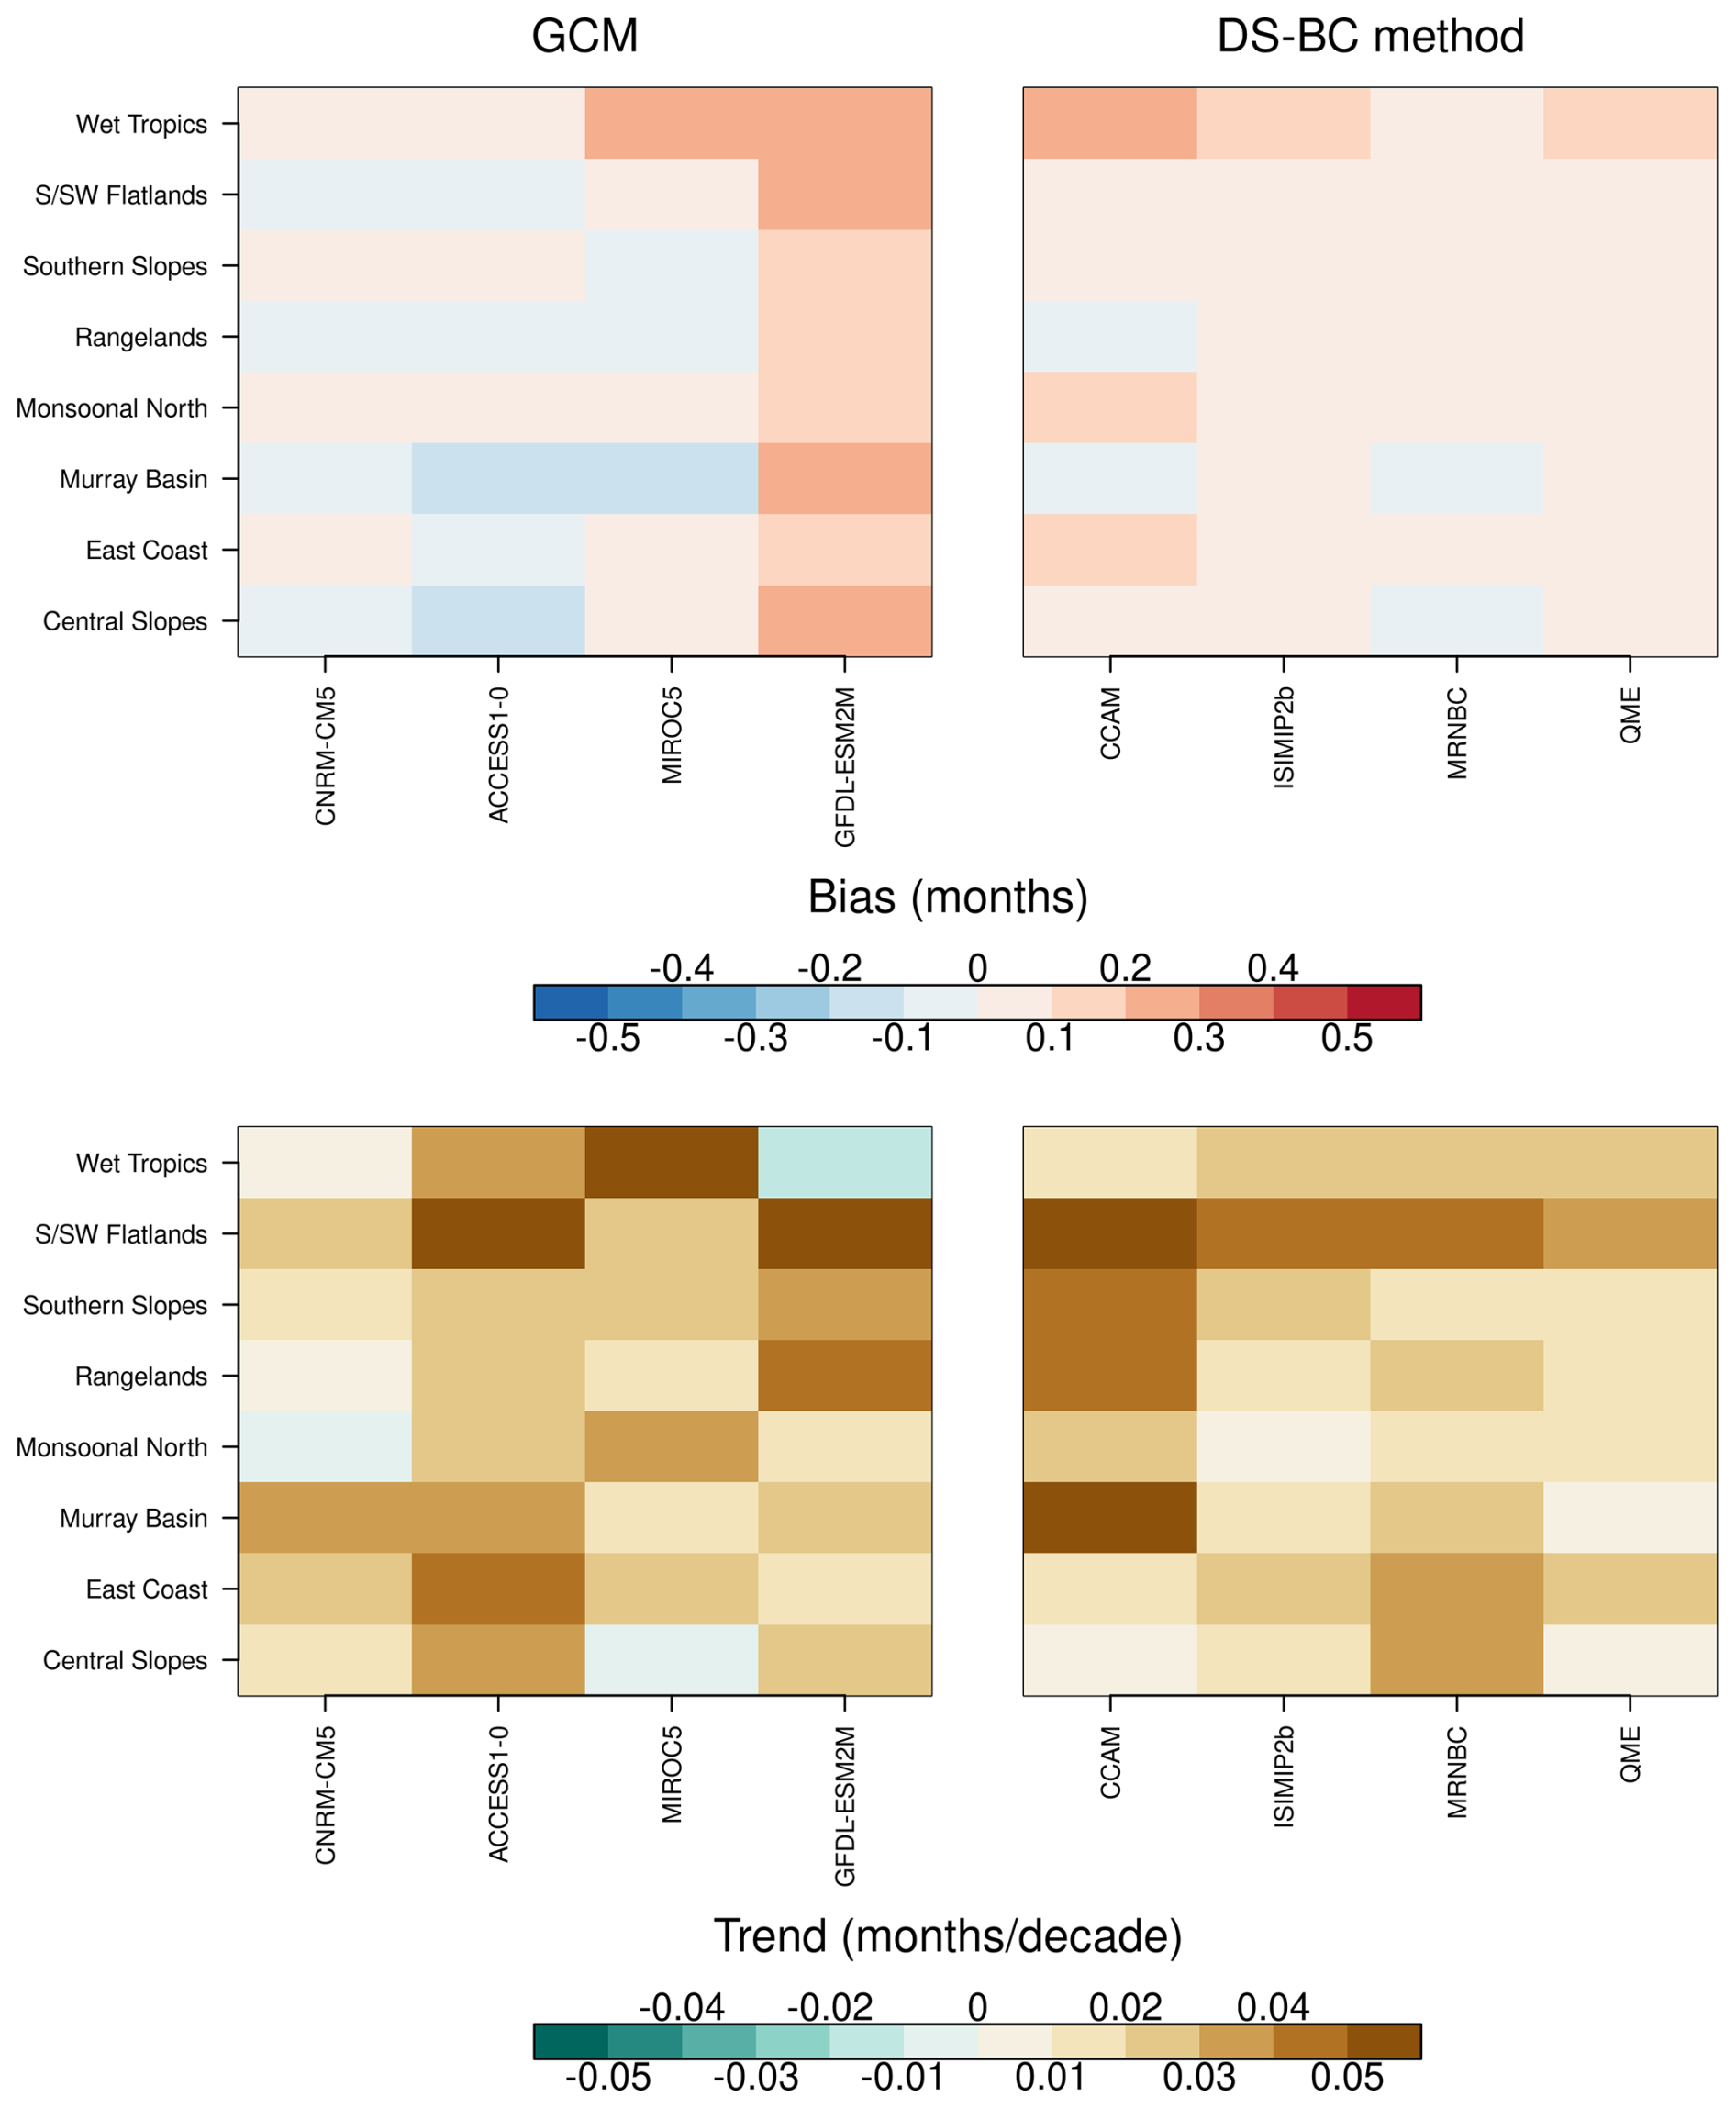
Figure 6Historical bias (top row) and trend in precipitation drought duration averaged across the NRM regions. The trends were calculated using ordinary least squares regression using the time period 1970–2099. The data were averages across GCMs and DS-BC methods as in Fig. 5.
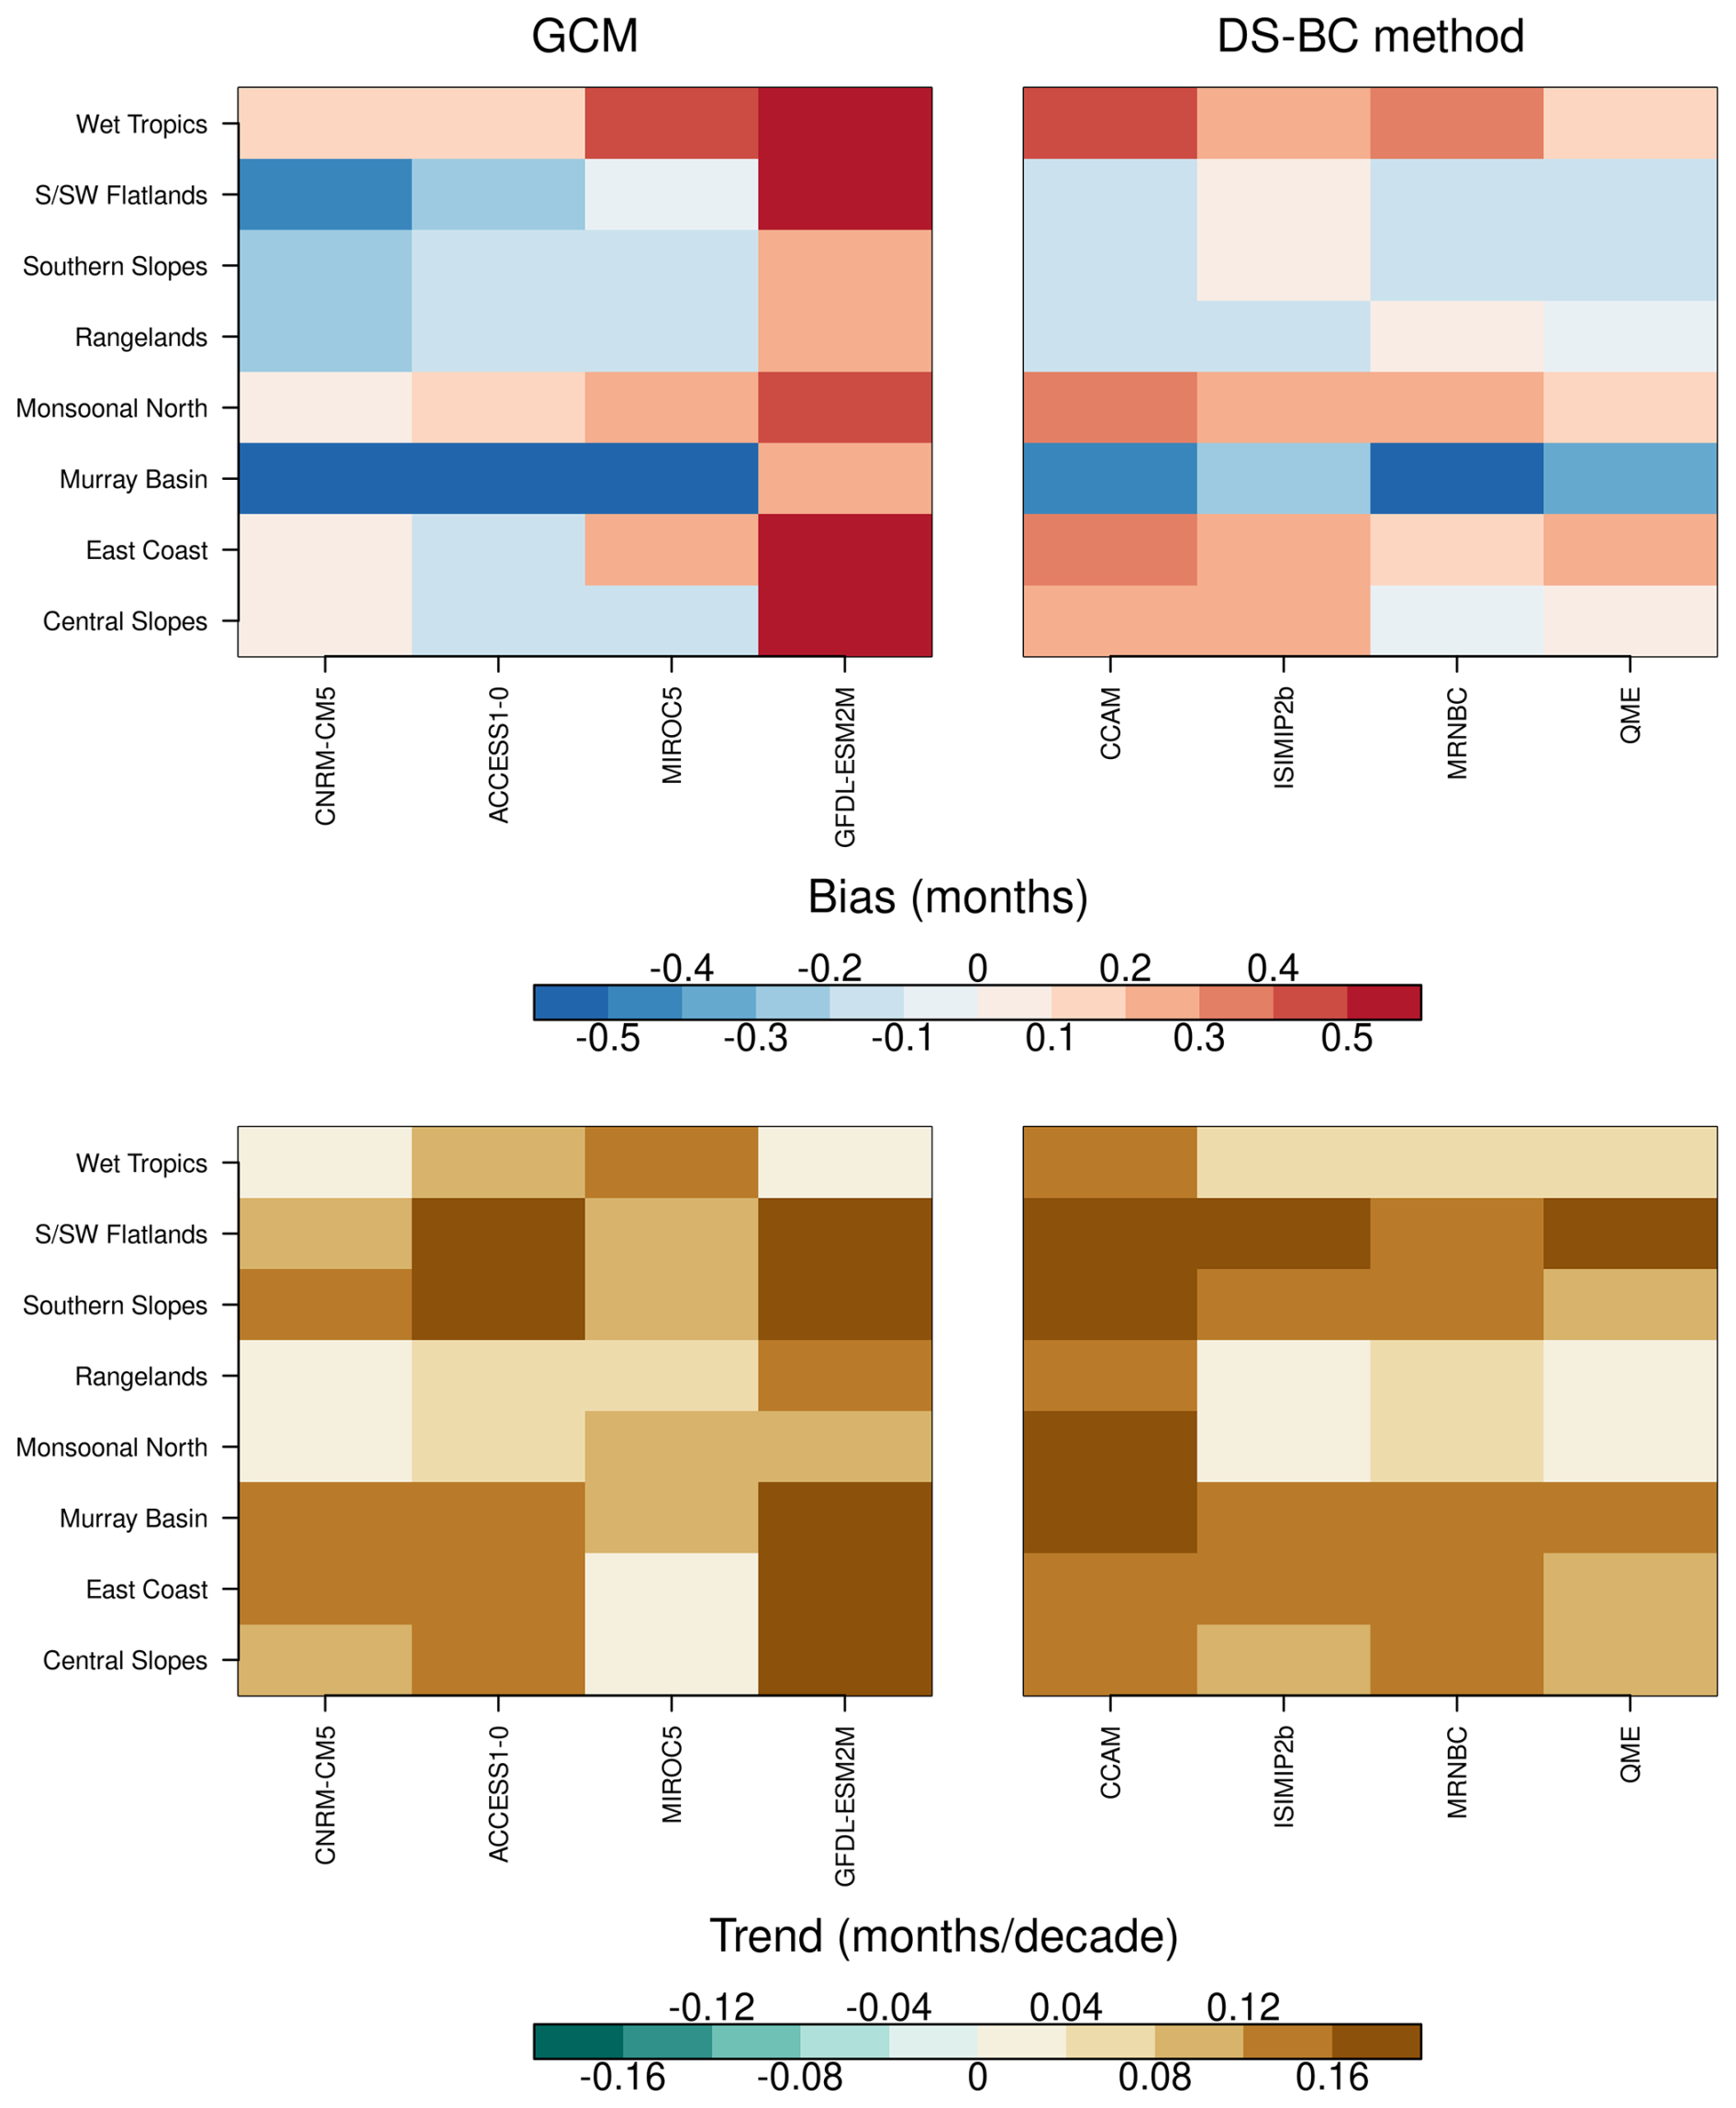
Figure 7Historical bias (top row) and trend in runoff drought duration averaged across the NRM regions. The trends were calculated using ordinary least squares regression using the time period 1970–2099. The data were averages across GCMs and DS-BC methods as in Fig. 5.
The differences across bias correction methods are generally small for precipitation drought duration (Fig. 6), although CCAM shows higher biases. These biases are, however, not systematic with both under- and overestimation in individual regions. Highest positive biases are found in the wet tropics for both drought types. The biases are larger for runoff but consistent in sign across most individual regions, suggesting the sign of the bias is largely driven by other factors (AWRA-L model structure and/or the meteorological driving data).
These historical biases, however, do not directly translate into systematic differences in the future changes, particularly for precipitation. The magnitude of future trends in precipitation drought duration is highly variable across GCMs in the different NRM regions (Fig. 6). While precipitation drought duration is projected to increase in most regions, the sign of the change is uncertain in the wet tropics, monsoonal north and central slopes across the GCMs. For runoff drought duration, GFDL-ESM2M shows the highest biases (which are systematically positive) and also consistently simulates higher trends in most regions. For the other GCMs, the trends are highly variable in magnitude and do not clearly correspond to the historical biases. When averaged across the individual bias correction methods, trends in both runoff and precipitation drought duration are positive across all regions but tend to be larger when bias-correcting using CCAM even in regions where CCAM underestimates historical duration. The differences in the trends are smaller across the three statistical bias correction methods (ISIMIP2b, MRNBC and QME), suggesting the choice between dynamical and statistical downscaling is an important source of uncertainty in the projected future trends.
The regional trends in time under drought are similar to drought duration (Fig. 8). With the exception of the wet tropics region for soil moisture, CNRM-CM5 is the only model that indicates negative trends in time under drought. All other models as well as DS-BC methods simulate increasing time under drought in all regions in the future under the RCP4.5 scenario. GFDL-ESM2M simulates the largest increases in time under drought across many regions. While we could not evaluate this metric against observations (as discussed above), this is consistent with the tendency of GFDL-ESM2M to overestimate drought duration relative to observations. CCAM shows the largest trends out of the four DS-BC methods. The larger future changes relative to the other DS-BC methods are particularly evident in the southern and south-western flatlands, southern slopes and rangelands for all three drought types, as well as the Murray Basin for precipitation and runoff. Future changes simulated using the other DS-BC methods are largely consistent across individual NRM regions, again suggesting the choice between statistical and dynamical downscaling and bias correction can have a large influence on the magnitude of future changes.
While the magnitude of trends vary across GCMs and DS-BC methods, overall the wet tropics, rangelands and monsoonal north are projected to experience smaller changes in time under drought compared to other regions (ranging from −0.01 to 0.01 for precipitation and from −0.01 to 0.015 for runoff and soil moisture) (Fig. 8). These regions receive highly seasonal summer-dominated precipitation (or in the case of the largely arid rangelands highly stochastic precipitation), representing a unique climate zone in Australia. These regions have also experienced increasing rainfall during the recent decades and future rainfall changes have remained more uncertain in these regions compared to southern Australia (Douville et al., 2021), consistent with the smaller drought trends. The regions located in the southern half of Australia (southern and southwestern flatlands, southern slopes, Murray basin, east coast and central slopes) tend to show larger future increases in time under drought, in agreement with a tendency towards drying in recent observations as well as future projections (Dey et al., 2019; Wasko et al., 2021). Southwestern Australia (encompassed within the southern and south-western flatlands NRM region) is a particularly well-known hot spot of future drying with high agreement across coupled climate models (Douville et al., 2021).
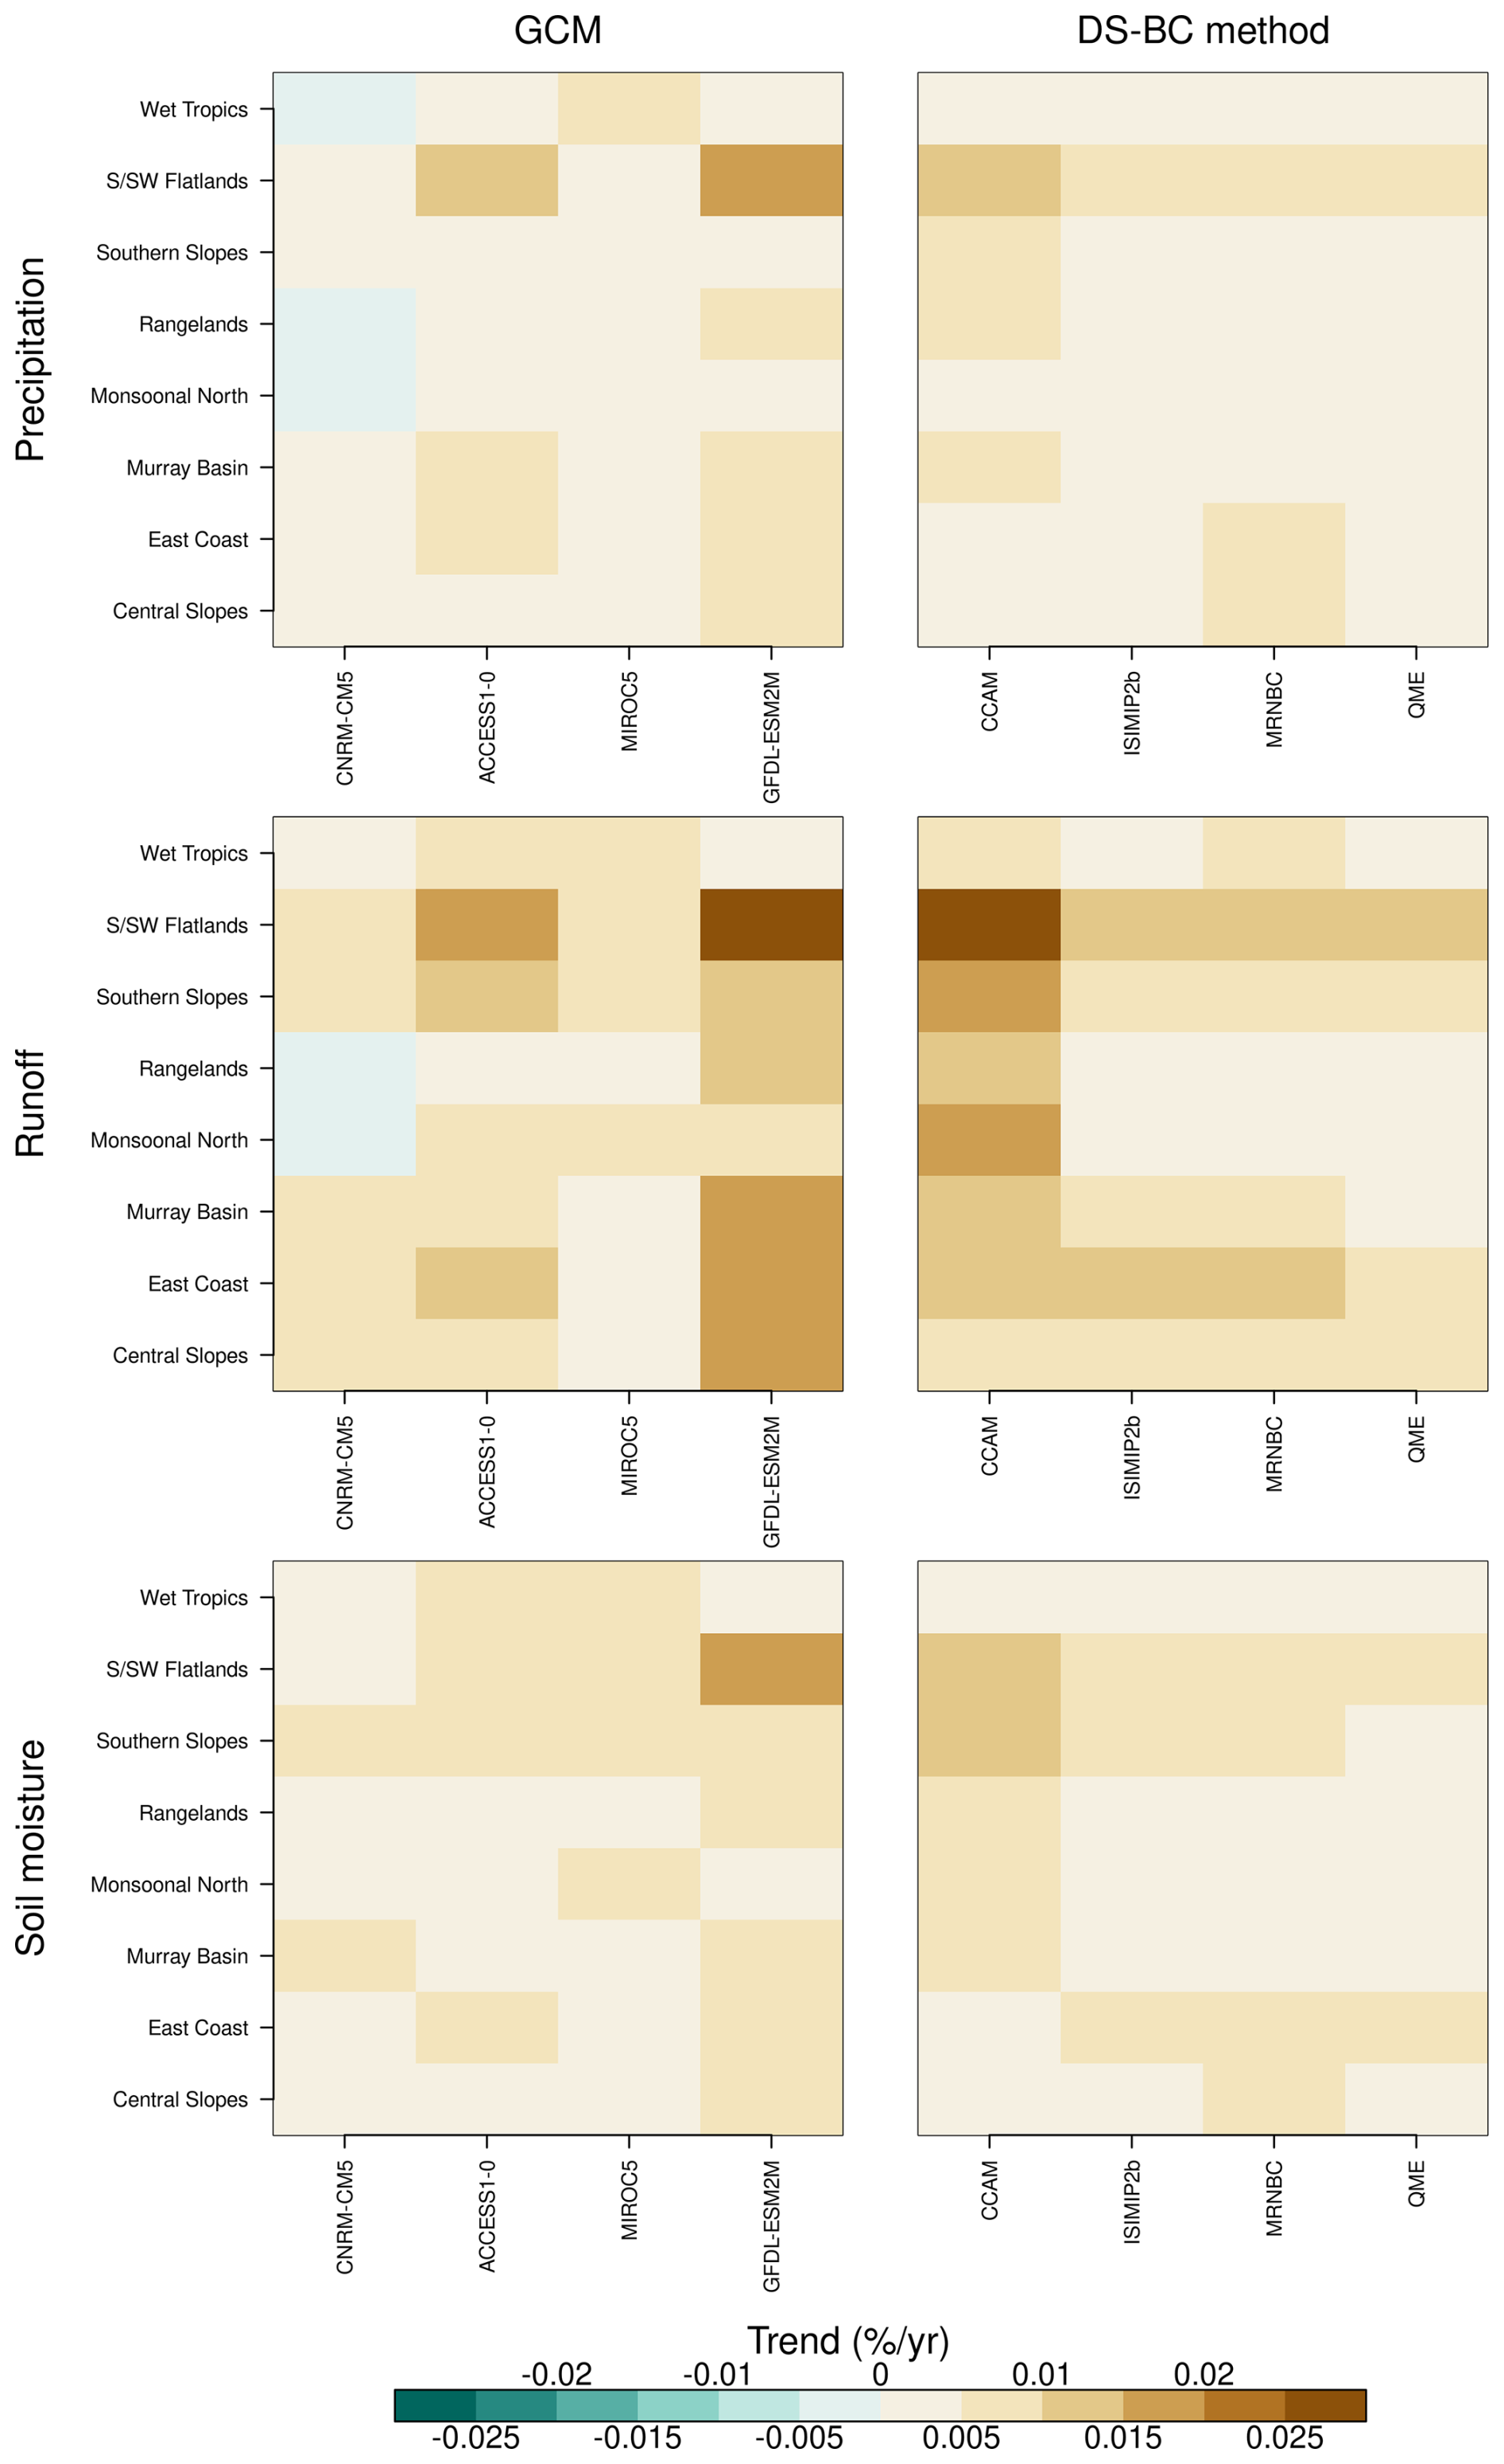
Figure 8Trend in time under drought across the NRM regions for the RCP4.5 scenario. The trends were calculated using ordinary least squares regression using the time period 1970–2099. The data were averages across GCMs and DS-BC methods as in Fig. 5.
4.1 Implications of projected future changes
Only up to 19.9 % of Australia's land area shows robust future changes in time under drought for the more feasible RCP4.5 emissions scenario (Fig. 2). However, despite the limited spatial extent, the changes are most widespread and robust in many of the regions where Australia's highly populated and agricultural areas are located (i.e. eastern and southwestern Australia). The models overwhelmingly indicate increased drought occurrence in these regions, with potential implications for agriculture, ecosystems and water resource management. There is little evidence for decreasing occurrence of drought as seen in some regions globally, with the possible exception of northwestern Australia (Figs. 2–3; Cook et al., 2020; Ukkola et al., 2020). This suggests that despite the high uncertainty in many regions, Australia should prepare for equal or worse droughts conditions as experienced during the historical period. These results broadly agree with previous studies that have shown increasing meteorological and agricultural droughts in southern and eastern Australia but the specific regions where projections are robust differ across studies (Eccles et al., 2025; Kirono et al., 2020; Spinoni et al., 2020). While we concentrate on seasonal droughts, research for global meteorological droughts has shown that future changes in annual droughts largely follow those of seasonal droughts, but show lower model agreement (Ukkola et al., 2020). As such, these results also likely provide indication for future changes in longer droughts that are particularly impactful in Australia (Devanand et al., 2024; van Dijk et al., 2013).
Australia's key cropping and horticultural regions are situated in the southeast and the southwest, with grazing taking place across most of the country with the exception of interior arid regions. Over 99 % of agricultural land in Australia is rainfed (ABARES, 2012), making agricultural activities particularly susceptible to rainfall and soil moisture drought. The occurrence of both of these drought types is projected to increase over the southeastern and southwestern agricultural regions (Fig. 2). While rainfall changes are not robust over the state of New South Wales, robust soil moisture changes are widespread encompassing most of the agricultural regions. The changes are particularly robust during winter and spring, which may impact winter cropping activities, including the multi-billion dollar winter wheat industry. Drought changes in the grazing areas in the interior of the country are generally not robust across the model ensemble under RCP4.5, although more widespread changes are projected under RCP8.5 particularly in parts of northeastern Australia (Queensland and Northern Territory; Fig. 2).
While irrigated agriculture only makes up < 1 % of Australia's agricultural land area, it accounts for ∼ 50 % of agricultural profits (Kirby, 2011). Irrigated agriculture largely takes place in the Murray-Darling basin, with hydrological drought the most relevant indicator of irrigation water availability. Only parts of the basin are projected to experience robust changes in hydrological drought (and similarly rainfall and soil moisture drought; Fig. 2). However, projected changes are most robust and indicate more time under drought in the eastern parts of the basin which encompass the alpine regions where much of the basin's streamflow is generated (Donohue et al., 2011). As such, increased drought occurrence in these important runoff generation areas may have significant impacts on irrigation water supply even if the changes are spatially limited. In the southern parts of the basin runoff generation is highest in the cooler months, potentially making the more robust changes in winter and spring particularly impactful. The Murray Darling basin also hosts important ecological regions, including wetland and river habitats, that rely on sufficient environmental flows to thrive (Timbal et al., 2015). Projected increases in drought occurrence would also threaten the availability of these flows, particularly if prolonged drought periods become more frequent. Parts of the basin have experienced disproportionate declines in runoff relative to precipitation in response to past droughts (Saft et al., 2015); the stronger future increases in runoff droughts relative to precipitation droughts (Figs. 2–3) and increasing ET P ratios in important runoff generation areas (Fig. S5) suggest an ongoing risk to water availability in the basin.
Australia's major population centres are also located along the southeast and southwest coasts where widespread increases in hydrological drought are projected, with potential implications on municipal water security. The alpine regions (including the southern slopes NRM region) that generate much of Murray Darling Basin's streamflow are also important for supplying water resources to large population centres including Australia's two largest cities Sydney and Melbourne. While seasonal droughts generally have small impacts on municipal water supply, particularly in these large cities with several years of dam storage, increased drought occurrence may increase water scarcity over time, particularly as Australia's urban population continues to increase. The water supply to Perth's dams (the major population centre in the southwest of the country) has already declined significantly since the 1970s (Petrone et al., 2010), with projected future increases in hydrological drought likely further increasing reliance on alternative water sources including desalination. Tasmania represents another region with projected increases in hydrological drought, with robust changes over the western parts of the state under both RCPs. Western Tasmania is sparsely populated but is a significant region for hydropower generation that supplies electricity to Tasmania and mainland Australia. Prolonged drought conditions have the potential to disrupt this power source as occurred during drought conditions in the mid-2010s although projected changes are more robust during summer/autumn when runoff generation is at its lowest (Fig. 3).
4.2 Implications for dataset users
We showed that the choice of GCM and DS-BC method can lead to large differences in future drought trends and are an important consideration when quantifying future changes (Figs. 4, 6–8). When averaged across the broad NRM regions, the sign of future change is largely consistent across the different ensemble members but the magnitude of future change is strongly dependent on the choice of GCM and DS-BC method. Uncertainty is particularly high in the monsoonal and tropical climates of northern Australia and the arid interior. The ensemble members broadly agree on increasing drought in southern and eastern Australia but we found that ensemble members using GFDL-ESM2M as the forcing model were particularly anomalous compared to the rest of the NHP ensemble, indicating stronger increases in most regions. Similarly, ensemble members using the CCAM downscaling method projected larger changes compared to the other DS-BC methods. While we showed that larger historical biases did not necessarily lead to systematic differences in the future projections, CCAM and GFDL-ESM2M showed worse performance against historical observations and/or the observationally-driven AWRA-L simulation compared to other simulations, suggesting ensemble members using these should be treated with caution. The GFDL-ESM2M model projects greater future warming and drying over Australia than the other GCMs used here (Peter et al., 2024); our finding of larger drought increases in GFDL-ESM2M are consistent with this tendency. CCAM differs from the other downscaling methods by representing a dynamical, rather than a statistical, downscaling method. This choice between statistical and dynamical downscaling represented the primary reason for differences among the DS-BC methods, with the choice of statistical bias-correction method (ISIMIP2b, QMR or MRNBC) only leading to relatively small differences in historical skill and future projections. CCAM was run at ∼ 50 km resolution, with the data then further statistically regridded to 5 km. While this is a finer resolution than used by the forcing GCMs, the 50 km resolution cannot fully resolve processes important for skilled simulation of meteorological variables, such as convective rainfall. It is also not sufficiently high to resolve geographic features that are important for meteorology such as the topography of the Great Dividing Range that runs along the eastern coast. The CCAM-downscaled ensemble members were found to exhibit higher warming compared to the equivalent GCMs downscaled and bias-corrected using statistical methods (Peter et al., 2024). This may partly explain the tendency for stronger increases in future drought in the ensemble members using CCAM compared to the other downscaling methods. The statistical downscaling methods (conservative and bilinear interpolation) applied to the coarser GCM and CCAM data to derive the final 0.05° spatial fields are also simplistic and do not take local characteristics into account (e.g. spatial gradients in elevation or land surface type) that can influence the meteorological variables that were downscaled. This likely represents a major limitation particularly in eastern Australia which has large spatial variations in climate including rainfall and temperature, as well as land surface properties and topography. The results should thus be interpreted with caution at fine local scales. Finally, the observational data underlying the bias correction is limited particularly in the arid interior and high elevation regions where weather station networks are sparse (Jones et al., 2009; Sarmadi et al., 2020), and results in these regions should therefore be treated with caution.
Overall, we found that the GCMs are the dominant source of uncertainty but in some cases the choice of the DS-BC method can also change the sign of future change (Fig. 6). This suggests the choice of GCM is particularly important for adequately quantifying uncertainty in the future projections. Only four GCMs were used here although they were chosen to represent a range of future climates in terms of rainfall and temperature changes, and for their ability to simulate Australian climate during the historical period (Peter et al., 2024). As the GCMs used here are broadly independent, they are likely to capture the range of CMIP5 projections reasonably well. This is supported by a previous analysis of future drought metrics which showed that nine models from CMIP5 were able to capture the range of uncertainty in the full CMIP5 ensemble of 31 models (Ukkola et al., 2020). The uncertainty arising from the DS-BC methods was approximately two thirds that of the GCMs. Whilst lower, the choice between dynamical and statistical downscaling was particularly important for future trends whereas the uncertainty from the choice of bias correction method was relatively small. The choice of future emissions scenario resulted in the least uncertainty and was mostly important for determining the magnitude of future trends rather than their sign. These findings agree with previous studies that have also found GCMs to represent the dominant source of uncertainty in Australia and globally, with a lesser influence from bias correction methods and emissions scenarios (Oh et al., 2023; Satoh et al., 2021).
4.3 Limitations of the modelling
AWRA-L is a physically-based, conceptual hydrological model that has been specifically developed and calibrated for Australia's hydrological conditions and performs well against multiple observations (Frost and Wright, 2018). Nevertheless, as all hydrological models, it uses imperfect representations of reality and contains uncertainties. One of the key uncertainties in AWRA-L is its simplistic representation of vegetation processes on the water cycle. Past studies have shown that vegetation processes can both mitigate or exacerbate future water scarcity in Australia (Trancoso et al., 2017). While AWRA-L simulates vegetation phenological changes in response to water availability (which is the primary driver of vegetation growth in most of Australia; Broich et al., 2014), it does not consider other processes that have been shown to be potentially important in modulating future drought changes such as the effects of increasing atmospheric CO2. Observational studies point to CO2-driven greening over many parts of Australia (Donohue et al., 2013; Rifai et al., 2022) which has been linked to declining streamflow due to increasing plant water use (Trancoso et al., 2017; Ukkola et al., 2016b). Conversely, global studies have also pointed to CO2-driven water savings (through increased plant water use efficiency) which have the potential to mitigate future drying (Yang et al., 2019). Whilst this remains a key uncertainty in future projections, offline hydrological models that account for these CO2 effects tend to simulate smaller increases in future hydrological drought (Prudhomme et al., 2014). Several studies have also demonstrated that offline hydrological models that do not consider CO2 effects tend to simulate stronger declines in future water availability compared to coupled climate models (Swann et al., 2016; Yang et al., 2019). The use of only one hydrological model also presents a limitation in our study and may lead to an underestimation of future uncertainty. Using the ISIMIP-2b ensemble of offline hydrological simulations, Satoh et al. (2021) showed that global hydrological models are the dominant source of uncertainty in future drought projections in parts of Australia, including much of the Murray-Darling basin, exceeding the uncertainty arising from GCMs.
The GCMs used to provide the meteorological forcing data for AWRA-L are also limited in their ability to simulate rainfall droughts (Moon et al., 2018; Ukkola et al., 2018). This not only has an influence on the rainfall drought statistics analysed here (that were directly obtained from downscaled, bias-corrected GCM data) but also on the hydrological and soil moisture droughts simulated by AWRA-L. GCMs exhibit relatively good skill for seasonal precipitation droughts, which partly motivated our choice to analyse seasonal droughts, but show limited skill for longer droughts (Ukkola et al., 2018). This is in particular related to a lack of “persistence” in GCMs, leading to an underestimation of rainfall variability (Moon et al., 2018; Rocheta et al., 2014). Local biases also arise from the inability of GCMs to represent local features such as topography due to the coarse resolution of GCMs, with CMIP6 models showing a dry precipitation bias along the coasts and areas of complex topography of Australia (Grose et al., 2020). Such biases cannot be overcome by the statistical downscaling methods used here. The 50 km CCAM dynamical downscaling is also too coarse to resolve many of these features, but Chapman et al. (2023) showed that improvements in rainfall statistics can be obtained in 10 km CCAM simulations over much of the country, including mountainous areas. Model biases in the precipitation drought statistics analysed here were highest in the monsoonal and arid interior. The difficulty in simulating the arid interior is not surprising as the rainfall in these regions is highly stochastic and the characterisation of drought using traditional metrics is challenging. Groundwater provides an important water resource in these regions but was not considered here. As water availability from precipitation, runoff and soil moisture is usually low in the arid regions, metrics quantifying anomalously dry conditions (as used here) are not necessarily informative and metrics quantifying wet conditions may be more appropriate for identifying abnormal conditions. Skilled simulation of seasonal precipitation in the monsoonal north requires accurate representation of sea surface temperatures and large-scale atmospheric circulation, including features such as the position of the intertropical convergence zone and Madden-Julian Oscillation. Individual GCMs show limited skill in representing these features, resulting in high uncertainty in future changes (Grose et al., 2020; Narsey et al., 2020). Overall, we showed that historical biases and future trends in runoff and soil moisture droughts are largely consistent with those in rainfall (Figs. 2, 8), suggesting the rainfall outputs from GCMs play an important role in our analysis of future changes in all three drought types.
We identify robust future increases in meteorological, hydrological and agricultural droughts across 20 %–29 % of the Australian land surface under the RCP4.5 scenario and 38 %–48 % under RCP8.5. The future changes are particularly robust in the highly populated and agricultural regions across southern and eastern Australia, with largest increases projected to occur in winter and spring. The ensemble members consisting of different combinations of GCMs and downscaling/bias correction methods broadly agree on increasing drought in southern and eastern Australia but the robustness of future projections vary by region. Uncertainty is particularly high in the monsoonal and tropical climates of northern Australia and the arid interior. Our results are in broad agreement with previous studies but future work is needed to systematically assess the differences in the magnitude and spatial extent of robust changes across different projections.
When averaged across the broad NRM regions, the sign of future change is largely consistent across the different ensemble members but the magnitude of future change is strongly dependent on the choice of GCM and DS-BC method. This choice between statistical and dynamical downscaling represented the primary reason for differences among the DS-BC methods, with the choice of statistical bias-correction method (ISIMIP2b, QMR or MRNBC) only leading to relatively small differences in historical skill and future projections. Overall, we found that the GCMs are the dominant source of uncertainty but in some cases the choice of the DS-BC method can also change the sign of future change (Fig. 6). This suggests the choice of GCM is particularly important for adequately quantifying uncertainty in the future projections.
The analysis codes are available at https://github.com/aukkola/AWRA_future_drought (last access: 19 March 2026; DOI: https://doi.org/10.5281/zenodo.19104304, Ukkola, 2026). The AGCD observed precipitation data can be obtained at https://doi.org/10.25914/6009600b58196 (Australian Bureau of Meteorology, 2020). The National Hydrological Projections are available on the National Computational Infrastructure: https://doi.org/10.25914/6198463da4f22 (Australian Bureau of Meteorology, 2021).
The supplement related to this article is available online at https://doi.org/10.5194/hess-30-1463-2026-supplement.
AU and ST designed the study, carried out the analyses and developed the analysis codes. All authors contributed to the interpretation of results. AU wrote the first draft of the manuscript; all authors contributed to writing of the final manuscript.
The contact author has declared that none of the authors has any competing interests.
Publisher's note: Copernicus Publications remains neutral with regard to jurisdictional claims made in the text, published maps, institutional affiliations, or any other geographical representation in this paper. The authors bear the ultimate responsibility for providing appropriate place names. Views expressed in the text are those of the authors and do not necessarily reflect the views of the publisher.
We are grateful to the National Computational Infrastructure at the Australian National University for hosting the data used in this study and providing computational resources. We acknowledge the World Climate research Programme's Working Group on Coupled Modelling, which is responsible for CMIP, and we thank the climate modelling groups for producing and making available their model output.
This research has been supported by the Australian Research Council (grant nos. CE170100023 and DE200100086).
This paper was edited by Manuela Irene Brunner and reviewed by two anonymous referees.
ABARES: Drought in Australia: Context, policy and management, ABARES report to client (GHD Pty. Ltd.) prepared for the Australia China Environment Development Partnership, Canberra, Australia, https://www.droughtmanagement.info/literature/GovAustr_drought_in_australia_2012.pdf (last access: 19 March 2026), 2012.
Abram, N. J., Henley, B. J., Sen Gupta, A., Lippmann, T. J. R., Clarke, H., Dowdy, A. J., Sharples, J. J., Nolan, R. H., Zhang, T., Wooster, M. J., Wurtzel, J. B., Meissner, K. J., Pitman, A. J., Ukkola, A. M., Murphy, B. P., Tapper, N. J., and Boer, M. M.: Connections of climate change and variability to large and extreme forest fires in southeast Australia, Commun. Earth Environ., 2, 1–17, https://doi.org/10.1038/s43247-020-00065-8, 2021.
Australian Bureau of Meteorology: Australian Gridded Climate Data (AGCD) v1.0.0/ Australian Water Availability Project (AWAP), NCI Data Catalogue [data set], https://doi.org/10.25914/6009600b58196, 2020.
Australian Bureau of Meteorology: The Bureau of Meteorology's National Hydrological Projection data collection on changes to Australia's hydrological water balance, NCI Data Catalogue [data set], https://doi.org/10.25914/6198463da4f22, 2021.
Azarvinand, A., Sharples, W., Bende-Michl, U., Shokri, A., Srikanthan, S., Frost, A. J., and Baron-Hay, S.: Analysing the uncertainty of modelling hydrologic states of AWRA-L – understanding impacts from parameter uncertainty for the National Hydrological Projections, Bureau Research Report, Bureau of Meteorology, Melbourne, Australia, ISBN 978-1-925738-48-3, 2022.
Baldwin, D., Manfreda, S., Keller, K., and Smithwick, E. A. H.: Predicting root zone soil moisture with soil properties and satellite near-surface moisture data across the conterminous United States, J. Hydrol., 546, 393–404, https://doi.org/10.1016/j.jhydrol.2017.01.020, 2017.
Boer, M. M., Resco de Dios, V., and Bradstock, R. A.: Unprecedented burn area of Australian mega forest fires, Nat. Clim. Change, 10, 171–172, https://doi.org/10.1038/s41558-020-0716-1, 2020.
Broich, M., Huete, A., Tulbure, M. G., Ma, X., Xin, Q., Paget, M., Restrepo-Coupe, N., Davies, K., Devadas, R., and Held, A.: Land surface phenological response to decadal climate variability across Australia using satellite remote sensing, Biogeosciences, 11, 5181–5198, https://doi.org/10.5194/bg-11-5181-2014, 2014.
Chapman, S., Syktus, J., Trancoso, R., Thatcher, M., Toombs, N., Wong, K. K.-H., and Takbash, A.: Evaluation of Dynamically Downscaled CMIP6-CCAM Models Over Australia, Earth's Future, 11, e2023EF003548, https://doi.org/10.1029/2023EF003548, 2023.
Chiew, F. H. S. and McMahon, T. A.: Detection of trend or change in annual flow of Australian rivers, Int. J. Climatol., 13, 643–653, https://doi.org/10.1002/joc.3370130605, 1993.
Choat, B., Brodribb, T. J., Brodersen, C. R., Duursma, R. A., López, R., and Medlyn, B. E.: Triggers of tree mortality under drought, Nature, 558, 531–539, https://doi.org/10.1038/s41586-018-0240-x, 2018.
Collier, M. and Uhe, P.: CMIP5 datasets from the ACCESS1.0 and ACCESS1.3 coupled climate models CAWCR Technical Report No. 059, CSIRO, Aspendale, Australia, ISBN 978-1-922173-29-4, 2012.
Cook, B. I., Mankin, J. S., Marvel, K., Williams, A. P., Smerdon, J. E., and Anchukaitis, K. J.: Twenty-First Century Drought Projections in the CMIP6 Forcing Scenarios, Earth's Future, 8, https://doi.org/10.1029/2019EF001461, 2020.
CSIRO and Bureau of Meteorology: Downscaling and evaluating data sets. Electricity Sector Climate Information Project Technical Report (ESCI Technical Report), CSIRO and BoM, Melbourne, Australia, https://www.climatechangeinaustralia.gov.au/media/ccia/2.2/cms_page_media/799/Draft - Downscaling Technical Report.pdf (last access: 19 March 2026), 2021.
Devanand, A., Falster, G. M., Gillett, Z. E., Hobeichi, S., Holgate, C. M., Jin, C., Mu, M., Parker, T., Rifai, S. W., Rome, K. S., Stojanovic, M., Vogel, E., Abram, N. J., Abramowitz, G., Coats, S., Evans, J. P., Gallant, A. J. E., Pitman, A. J., Power, S. B., Rauniyar, S. P., Taschetto, A. S., and Ukkola, A. M.: Australia's Tinderbox Drought: An extreme natural event likely worsened by human-caused climate change, Sci. Adv., 10, eadj3460, https://doi.org/10.1126/sciadv.adj3460, 2024.
Dey, R., Lewis, S. C., Arblaster, J. M., and Abram, N. J.: A review of past and projected changes in Australia's rainfall, WIREs Clim. Change, 10, e577, https://doi.org/10.1002/wcc.577, 2019.
Di Virgilio, G., Evans, J. P., Di Luca, A., Grose, M. R., Round, V., and Thatcher, M.: Realised added value in dynamical downscaling of Australian climate change, Clim. Dynam., 54, 4675–4692, https://doi.org/10.1007/s00382-020-05250-1, 2020.
Dix, M., Vohralik, P., Bi, D., Rashid, H., Marsland, S., O'Farrell, S., Uotila, P., Hirst, T., Kowalczyk, E., Sullivan, A., Yan, H., Franklin, C., Sun, Z., Watterson, I., Collier, M., Noonan, J., Rotstayn, L., Stevens, L., Uhe, P., and Puri, K.: The ACCESS coupled model: documentation of core CMIP5 simulations and initial results, Aust. Meteorol. Ocean., 63, 83–99, 2013.
Donohue, R. J., Roderick, M. L., and McVicar, T. R.: Assessing the differences in sensitivities of runoff to changes in climatic conditions across a large basin, J. Hydrol., 406, 234–244, https://doi.org/10.1016/j.jhydrol.2011.07.003, 2011.
Donohue, R. J., Roderick, M. L., McVicar, T. R., and Farquhar, G. D.: Impact of CO2 fertilization on maximum foliage cover across the globe's warm, arid environments: CO2 fertilization and foliage cover, Geophys. Res. Lett., 40, 3031–3035, https://doi.org/10.1002/grl.50563, 2013.
Douville, H., Raghavan, K., Renwick, J., Allan, R. P., Arias, P. A., Barlow, M., Cerezo-Mota, R., Cherchi, A., Gan, T. Y., Gergis, J., Jiang, D., Khan, A., Pokam Mba, W., Rosenfeld, D., Tierney, J. E., and Zolina, O.: Water Cycle Changes, in: Climate Change 2021: The Physical Science Basis. Contribution of Working Group I to the Sixth Assessment Report of the Intergovernmental Panel on Climate Change, Cambridge University Press, 1055–1210, https://doi.org/10.1017/9781009157896.010, 2021.
Dowdy, A. J.: A bias correction method designed for weather and climate extremes, Bureau Research Report – 087, Bureau of Meteorology, Melbourne, Australia, ISBN 978-1-925738-75-9, 2023.
Dumedah, G. P., Walker, J., and Merlin, O.: Root-zone soil moisture estimation from assimilation of downscaled Soil Moisture and Ocean Salinity data, Adv. Water Resour., 84, 14–22, https://doi.org/10.1016/j.advwatres.2015.07.021, 2015.
Dunne, J. P., John, J. G., Adcroft, A. J., Griffies, S. M., Hallberg, R. W., Shevliakova, E., Stouffer, R. J., Cooke, W., Dunne, K. A., Harrison, M. J., Krasting, J. P., Malyshev, S. L., Milly, P. C. D., Phillipps, P. J., Sentman, L. T., Samuels, B. L., Spelman, M. J., Winton, M., Wittenberg, A. T., and Zadeh, N.: GFDL's ESM2 Global Coupled Climate–Carbon Earth System Models. Part I: Physical Formulation and Baseline Simulation Characteristics, J. Climate, https://doi.org/10.1175/JCLI-D-11-00560.1, 2012.
Eccles, R., Trancoso, R., Syktus, J., Chapman, S., Toombs, N., Zhang, H., Ma, S., and McGloin, R.: High-resolution downscaled CMIP6 drought projections for Australia, Hydrol. Earth Syst. Sci., 29, 4689–4710, https://doi.org/10.5194/hess-29-4689-2025, 2025.
Fowler, K., Peel, M., Saft, M., Peterson, T. J., Western, A., Band, L., Petheram, C., Dharmadi, S., Tan, K. S., Zhang, L., Lane, P., Kiem, A., Marshall, L., Griebel, A., Medlyn, B. E., Ryu, D., Bonotto, G., Wasko, C., Ukkola, A., Stephens, C., Frost, A., Gardiya Weligamage, H., Saco, P., Zheng, H., Chiew, F., Daly, E., Walker, G., Vervoort, R. W., Hughes, J., Trotter, L., Neal, B., Cartwright, I., and Nathan, R.: Explaining changes in rainfall–runoff relationships during and after Australia's Millennium Drought: a community perspective, Hydrol. Earth Syst. Sci., 26, 6073–6120, https://doi.org/10.5194/hess-26-6073-2022, 2022.
Fowler, K. J. A., Zhang, Z., and Hou, X.: CAMELS-AUS v2: updated hydrometeorological time series and landscape attributes for an enlarged set of catchments in Australia, Earth Syst. Sci. Data, 17, 4079–4095, https://doi.org/10.5194/essd-17-4079-2025, 2025.
Frost, A., Ramchurn, A., and Smith, A.: The Australian Landscape Water Balance model (AWRA-L v6), Technical description of the Australian Water Resources Assessment Landscape model version 6, Bureau of Meteorology, https://nla.gov.au/nla.obj-2988767115/view (last access: 19 March 2026), 2018.
Frost, A. J. and Wright, D. P.: Evaluation of the Australian Landscape Water Balance model: AWRA-L v6. A comparison of AWRA-L v6 against Observed Hydrological Data and Peer Models, Bureau of Meteorology, Melbourne, Australia, https://awo.bom.gov.au/assets/notes/publications/AWRALv6_Model_Evaluation_Report.pdf (last access: 19 March 2026), 2018.
Gallant, A. J. E., Reeder, M. J., Risbey, J. S., and Hennessy, K. J.: The characteristics of seasonal-scale droughts in Australia, 1911–2009, Int. J. Climatol., 33, 1658–1672, https://doi.org/10.1002/joc.3540, 2013.
Giorgi, F. and Gutowski, W. J.: Regional Dynamical Downscaling and the CORDEX Initiative, Annu. Rev. Env. Resour., 40, 467–490, https://doi.org/10.1146/annurev-environ-102014-021217, 2015.
González Tánago, I., Urquijo, J., Blauhut, V., Villarroya, F., and De Stefano, L.: Learning from experience: a systematic review of assessments of vulnerability to drought, Nat. Hazards, 80, 951–973, https://doi.org/10.1007/s11069-015-2006-1, 2016.
Grant, I., Jones, D., Wang, W., Fawcett, R., and Barratt, D.: Meteorological and Remotely Sensed Datasets for Hydrological Modelling: A Contribution to the Australian Water Availability Project, in: Catchment-scale Hydrological Modelling & Data Assimilation (CAHMDA-3) International Workshop on Hydrological Prediction: Modelling, Observation and Data Assimilation, 1–4, 2008.
Grose, M. R., Narsey, S., Delage, F. P., Dowdy, A. J., Bador, M., Boschat, G., Chung, C., Kajtar, J. B., Rauniyar, S., Freund, M. B., Lyu, K., Rashid, H., Zhang, X., Wales, S., Trenham, C., Holbrook, N. J., Cowan, T., Alexander, L., Arblaster, J. M., and Power, S.: Insights From CMIP6 for Australia's Future Climate, Earth's Future, 8, https://doi.org/10.1029/2019EF001469, 2020.
Hempel, S., Frieler, K., Warszawski, L., Schewe, J., and Piontek, F.: A trend-preserving bias correction – the ISI-MIP approach, Earth Syst. Dynam., 4, 219–236, https://doi.org/10.5194/esd-4-219-2013, 2013.
Holgate, C. M., De Jeu, R. A. M., van Dijk, A. I. J. M., Liu, Y. Y., Renzullo, L. J., Vinodkumar, Dharssi, I., Parinussa, R. M., Van Der Schalie, R., Gevaert, A., Walker, J., McJannet, D., Cleverly, J., Haverd, V., Trudinger, C. M., and Briggs, P. R.: Comparison of remotely sensed and modelled soil moisture data sets across Australia, Remote Sens. Environ., 186, 479–500, https://doi.org/10.1016/j.rse.2016.09.015, 2016.
Johnson, F. and Sharma, A.: A nesting model for bias correction of variability at multiple time scales in general circulation model precipitation simulations, Water Resour. Res., 48, https://doi.org/10.1029/2011WR010464, 2012.
Jones, D., Wang, W., and Fawcett, R.: High-quality spatial climate data-sets for Australia, Aust. Meteorol. Ocean., 58, 233–248, https://doi.org/10.22499/2.5804.003, 2009.
Khan, M. S., Baik, J., and Choi, M.: Inter-comparison of evapotranspiration datasets over heterogeneous landscapes across Australia, Adv. Space Res., 66, 533–545, https://doi.org/10.1016/j.asr.2020.04.037, 2020.
Kiem, A. S., Johnson, F., Westra, S., van Dijk, A., Evans, J. P., O'Donnell, A., Rouillard, A., Barr, C., Tyler, J., Thyer, M., Jakob, D., Woldemeskel, F., Sivakumar, B., and Mehrotra, R.: Natural hazards in Australia: droughts, Climatic Change, 139, 37–54, https://doi.org/10.1007/s10584-016-1798-7, 2016.
King, A. D., Pitman, A. J., Henley, B. J., Ukkola, A. M., and Brown, J. R.: The role of climate variability in Australian drought, Nat. Clim. Change, 10, 173–174, https://doi.org/10.1038/s41558-020-0712-5, 2020.
Kirby, M.: Irrigation, in: Water: Science and Solutions for Australia, CSIRO Publishing, Collingwood, Australia, ISBN 9780643103283, 2011.
Kirono, D. G. C., Round, V., Heady, C., Chiew, F. H. S., and Osbrough, S.: Drought projections for Australia: Updated results and analysis of model simulations, Weather and Climate Extremes, 30, 100280, https://doi.org/10.1016/j.wace.2020.100280, 2020.
Lange, S.: Trend-preserving bias adjustment and statistical downscaling with ISIMIP3BASD (v1.0), Geosci. Model Dev., 12, 3055–3070, https://doi.org/10.5194/gmd-12-3055-2019, 2019.
Martínez-de la Torre, A., Blyth, E. M., and Robinson, E. L.: Evaluation of Drydown Processes in Global Land Surface and Hydrological Models Using Flux Tower Evapotranspiration, Water, 11, 356, https://doi.org/10.3390/w11020356, 2019.
McGregor, J. L. and Dix, M. R.: An Updated Description of the Conformal-Cubic Atmospheric Model, in: High Resolution Numerical Modelling of the Atmosphere and Ocean, edited by: Hamilton, K. and Ohfuchi, W., Springer, New York, NY, https://doi.org/10.1007/978-0-387-49791-4_4, 2008.
McKee, T. B., Doesken, N. J., and Kleist, J.: The relationship of drought frequency and duration to time scales, Eighth Conference on Applied Climatology, 6, 1993.
McVicar, T. R., Van Niel, T. G., Li, L. T., Roderick, M. L., Rayner, D. P., Ricciardulli, L., and Donohue, R. J.: Wind speed climatology and trends for Australia, 1975–2006: Capturing the stilling phenomenon and comparison with near-surface reanalysis output, Geophys. Res. Lett., 35, L20403, https://doi.org/10.1029/2008GL035627, 2008.
Meehl, G. A., Stocker, T. F., Collins, W. D., Friedlingstein, P., Gaye, A. T., Gregory, J. M., Kitoh, A., Knutti, R., Murphy, J. M., Noda, A., Raper, S. C. B., Watterson, I. G., Weaver, A. J., Zhao, Z.-C., Alley, R. B., Annan, J., Arblaster, J., Bitz, C., Brockmann, P., Brovkin, V., Driesschaert, E., Diansky, N. A., Dyurgerov, M., Eby, M., Edwards, N. R., Emori, S., Forster, P., Furrer, R., Gleckler, P., Hansen, J., Harris, G., Huybrechts, P., Jones, C., Joos, F., Jungclaus, J. H., Kettleborough, J., Kimoto, M., Knutson, T., Krynytzky, M., Lawrence, D., Brocq, A. L., Matthews, H. D., Meinshausen, M., Müller, S. A., Nawrath, S., Oerlemans, J., Oppenheimer, M., Orr, J., Overpeck, J., Palmer, T., Payne, A., Räisänen, J., Rinke, A., Roeckner, E., Russell, G. L., Schmidt, G., Schmittner, A., Schneider, B., Shepherd, A., Sokolov, A., Stainforth, D., Stott, P. A., Stouffer, R. J., Taylor, K. E., Tebaldi, C., Teng, H., Terray, L., van de Wal, R., Vaughan, D., Volodin, E. M., Wild, M., Yoshimura, J., Yu, R., Yukimoto, S., Allen, M., and Pant, G. B.: Global Climate Projections, in: Climate Change 2007: The physical science basis. Contribution of Working Group I to the Fourth Assessment Report of the Intergovernmental Panel on Climate Change, Cambridge University Press, Cambridge, United Kingdom and New York, NY, USA, 1412–1416, ISBN 978-0-521-88009-1, 2007.
Mehrotra, R. and Sharma, A.: Correcting for systematic biases in multiple raw GCM variables across a range of timescales, J. Hydrol., 520, 214–223, https://doi.org/10.1016/j.jhydrol.2014.11.037, 2015.
Mehrotra, R. and Sharma, A.: A Multivariate Quantile-Matching Bias Correction Approach with Auto- and Cross-Dependence across Multiple Time Scales: Implications for Downscaling, J. Climate, https://doi.org/10.1175/JCLI-D-15-0356.1, 2016.
Moise, A., Wilson, L., Grose, M., Whetton, P., Watterson, I., Bhend, J., Bathols, J., Hanson, L., Erwin, T., Bedin, T., Heady, C., and Rafter, T.: Evaluation of CMIP3 and CMIP5 models over the Australian region to inform confidence in projections, Aust. Meteorol. Ocean., 65, 19–53, https://doi.org/10.22499/2.6501.004, 2015.
Moon, H., Gudmundsson, L., and Seneviratne, S. I.: Drought Persistence Errors in Global Climate Models, J. Geophys. Res.-Atmos., 123, 3483–3496, https://doi.org/10.1002/2017JD027577, 2018.
Morin, E.: To know what we cannot know: Global mapping of minimal detectable absolute trends in annual precipitation: minimal detectable precipitation trends, Water Resour. Res., 47, https://doi.org/10.1029/2010WR009798, 2011.
Narsey, S. Y., Brown, J. R., Colman, R. A., Delage, F., Power, S. B., Moise, A. F., and Zhang, H.: Climate Change Projections for the Australian Monsoon From CMIP6 Models, Geophys. Res. Lett., 47, e2019GL086816, https://doi.org/10.1029/2019GL086816, 2020.
Oh, H., Kim, H. J., Mehboob, M. S., Kim, J., and Kim, Y.: Sources and uncertainties of future global drought risk with ISIMIP2b climate scenarios and socioeconomic indicators, Sci. Total Environ., 859, 160371, https://doi.org/10.1016/j.scitotenv.2022.160371, 2023.
Orlowsky, B. and Seneviratne, S. I.: Elusive drought: uncertainty in observed trends and short- and long-term CMIP5 projections, Hydrol. Earth Syst. Sci., 17, 1765–1781, https://doi.org/10.5194/hess-17-1765-2013, 2013.
Papalexiou, S. M., Rajulapati, C. R., Andreadis, K. M., Foufoula-Georgiou, E., Clark, M. P., and Trenberth, K. E.: Probabilistic Evaluation of Drought in CMIP6 Simulations, Earth's Future, 9, e2021EF002150, https://doi.org/10.1029/2021EF002150, 2021.
Perkins, S. E., Pitman, A. J., Holbrook, N. J., and McAneney, J.: Evaluation of the AR4 Climate Models' Simulated Daily Maximum Temperature, Minimum Temperature, and Precipitation over Australia Using Probability Density Functions, J. Climate, 20, 4356–4376, https://doi.org/10.1175/JCLI4253.1, 2007.
Peter, J., Vogel, E., Sharples, W., Bende-Michl, U., Wilson, L., Hope, P., Dowdy, A., Kociuba, G., Srikanthan, S., Duong, V. C., Roussis, J., Matic, V., Khan, Z., Oke, A., Turner, M., Baron-Hay, S., Johnson, F., Mehrotra, R., Sharma, A., Thatcher, M., Azarvinand, A., Thomas, S., Boschat, G., Donnelly, C., and Argent, R.: Continental-scale bias-corrected climate and hydrological projections for Australia, Geosci. Model Dev., 17, 2755–2781, https://doi.org/10.5194/gmd-17-2755-2024, 2024.
Peterson, T. J., Saft, M., Peel, M. C., and John, A.: Watersheds may not recover from drought, Science, 372, 745–749, https://doi.org/10.1126/science.abd5085, 2021.
Petrone, K. C., Hughes, J. D., Van Niel, T. G., and Silberstein, R. P.: Streamflow decline in southwestern Australia, 1950-2008, Geophys. Res. Lett., 37, L11401, https://doi.org/10.1029/2010GL043102, 2010.
Pickett-Heaps, C. and Vogel, E.: Seasonal hydrological ensemble forecasts for Australia using AWRA-L – Hindcast verification report, Bureau of Meteorology, Melbourne, Australia, ISBN 978-1-925738-54-4, 2022.
Prudhomme, C., Giuntoli, I., Robinson, E. L., Clark, D. B., Arnell, N. W., Dankers, R., Fekete, B. M., Franssen, W., Gerten, D., Gosling, S. N., Hagemann, S., Hannah, D. M., Kim, H., Masaki, Y., Satoh, Y., Stacke, T., Wada, Y., and Wisser, D.: Hydrological droughts in the 21st century, hotspots and uncertainties from a global multimodel ensemble experiment, P. Natl. Acad. Sci. USA, 111, 3262–3267, https://doi.org/10.1073/pnas.1222473110, 2014.
Rifai, S. W., De Kauwe, M. G., Ukkola, A. M., Cernusak, L. A., Meir, P., Medlyn, B. E., and Pitman, A. J.: Thirty-eight years of CO2 fertilization has outpaced growing aridity to drive greening of Australian woody ecosystems, Biogeosciences, 19, 491–515, https://doi.org/10.5194/bg-19-491-2022, 2022.
Rocheta, E., Sugiyanto, M., Johnson, F., Evans, J., and Sharma, A.: How well do general circulation models represent low-frequency rainfall variability?, Water Resour. Res., 50, 2108–2123, https://doi.org/10.1002/2012WR013085, 2014.
Saft, M., Western, A. W., Zhang, L., Peel, M. C., and Potter, N. J.: The influence of multiyear drought on the annual rainfall-runoff relationship: An Australian perspective, Water Resour. Res., 51, 2444–2463, https://doi.org/10.1002/2014WR015348, 2015.
Sarmadi, F., Huang, Y., Siems, S. T., and Manton, M. J.: Sensitivity of the orographic precipitation across the Australian Snowy Mountains to regional climate indices, JSHESS, 69, 196–204, https://doi.org/10.1071/ES19014, 2020.
Satoh, Y., Shiogama, H., Hanasaki, N., Pokhrel, Y., Boulange, J. E. S., Burek, P., Gosling, S. N., Grillakis, M., Koutroulis, A., Schmied, H. M., Thiery, W., and Yokohata, T.: A quantitative evaluation of the issue of drought definition: a source of disagreement in future drought assessments, Environ. Res. Lett., 16, 104001, https://doi.org/10.1088/1748-9326/ac2348, 2021.
Seneviratne, S., Zhang, X., Adnan, M., Badi, W., Dereczynski, C., Di Luca, A., Ghosh, S., Iskandar, I., Kossin, J., Lewis, S., Otto, F. E. L., Pinto, I., Satoh, M., Vicente-Serrano, S. M., Wehner, M., and Zhou, B.: Weather and climate extreme events in a changing climate, in: Climate Change 2021 – The Physical Science Basis: Working Group I Contribution to the Sixth Assessment Report of the Intergovernmental Panel on Climate Change, Cambridge University Press, Cambridge, United Kingdom and New York, NY, USA, https://doi.org/10.1017/9781009157896, 2021.
Sheffield, J. and Wood, E.: Drought: past problems and future scenarios, Earthscan, London, UK and Washington, United States, ISBN 9781849775250, 2011.
Shi, L., Feng, P., Wang, B., Liu, D. L., and Yu, Q.: Quantifying future drought change and associated uncertainty in southeastern Australia with multiple potential evapotranspiration models, J. Hydrol., 590, 125394, https://doi.org/10.1016/j.jhydrol.2020.125394, 2020.
Shukla, S. and Wood, A. W.: Use of a standardized runoff index for characterizing hydrologic drought, Geophys. Res. Lett., 35, L02405, https://doi.org/10.1029/2007GL032487, 2008.
Spinoni, J., Barbosa, P., Bucchignani, E., Cassano, J., Cavazos, T., Christensen, J. H., Christensen, O. B., Coppola, E., Evans, J., Geyer, B., Giorgi, F., Hadjinicolaou, P., Jacob, D., Katzfey, J., Koenigk, T., Laprise, R., Lennard, C. J., Kurnaz, M. L., Li, D., Llopart, M., McCormick, N., Naumann, G., Nikulin, G., Ozturk, T., Panitz, H.-J., Porfirio da Rocha, R., Rockel, B., Solman, S. A., Syktus, J., Tangang, F., Teichmann, C., Vautard, R., Vogt, J. V., Winger, K., Zittis, G., and Dosio, A.: Future Global Meteorological Drought Hot Spots: A Study Based on CORDEX Data, J. Climate, 33, 3635–3661, https://doi.org/10.1175/JCLI-D-19-0084.1, 2020.
Srikanthan, S., Bende-Michl, U., Wilson, L., Sharples, W., Vogel, E., Peter, J., Hope, P., Loh, S., Khan, Z., Duong, V. C., Roussis, J., Dowdy, A., Oke, A., Matic, V., Turner, M., Kociuba, G., Thomas, S., Azarvinand, A., Donnelly, C., and Carrara, E.: National Hydrological Projections – design and methodology, Bureau of Meteorology, ISBN 978-1-925738-37-7, 2022.
Swann, A. L. S., Hoffman, F. M., Koven, C. D., and Randerson, J. T.: Plant responses to increasing CO 2 reduce estimates of climate impacts on drought severity, P. Natl. Acad. Sci. USA, 113, 10019–10024, https://doi.org/10.1073/pnas.1604581113, 2016.
Taylor, K. E., Stouffer, R. J., and Meehl, G. A.: An Overview of CMIP5 and the Experiment Design, B. Am. Meteorol. Soc., 93, 485–498, https://doi.org/10.1175/BAMS-D-11-00094.1, 2012.
Tian, S., Renzullo, L. J., Pipunic, R. C., Lerat, J., Sharples, W., and Donnelly, C.: Satellite soil moisture data assimilation for improved operational continental water balance prediction, Hydrol. Earth Syst. Sci., 25, 4567–4584, https://doi.org/10.5194/hess-25-4567-2021, 2021.
Tijdeman, E., Blauhut, V., Stoelzle, M., Menzel, L., and Stahl, K.: Different drought types and the spatial variability in their hazard, impact, and propagation characteristics, Nat. Hazards Earth Syst. Sci., 22, 2099–2116, https://doi.org/10.5194/nhess-22-2099-2022, 2022.
Timbal, B., Abbs, D., Bhend, J., Chiew, F. H. S., Church, J., Ekström, M., Kirono, D. G. C., Lenton, A., Lucas, C., McInnes, K., Moise, A., Monselesan, D., Mpelasoka, F., Webb, L., and Whetton, P.: Murray Basin cluster report, Climate change in Australia: projections for Australia's natural resource management regions, CSIRO and Bureau of Meteorology, Australia, ISBN 978-1-4863-0425-7, 2015.
Trancoso, R., Larsen, J. R., McVicar, T. R., Phinn, S. R., and McAlpine, C. A.: CO2-vegetation feedbacks and other climate changes implicated in reducing base flow, Geophys. Res. Lett., 44, 2310–2318, https://doi.org/10.1002/2017GL072759, 2017.
Trenberth, K. E., Dai, A., van der Schrier, G., Jones, P. D., Barichivich, J., Briffa, K. R., and Sheffield, J.: Global warming and changes in drought, Nat. Clim. Change, 4, 17–22, https://doi.org/10.1038/nclimate2067, 2014.
Ukkola, A.: Analysis codes for “Future changes in seasonal drought in Australia”, v1.0, Zenodo [code], https://doi.org/10.5281/zenodo.19104304, 2026.
Ukkola, A. M., De Kauwe, M. G., Pitman, A. J., Best, M. J., Abramowitz, G., Haverd, V., Decker, M., and Haughton, N.: Land surface models systematically overestimate the intensity, duration and magnitude of seasonal-scale evaporative droughts, Environ. Res. Lett., 11, 104012, https://doi.org/10.1088/1748-9326/11/10/104012, 2016a.
Ukkola, A. M., Prentice, I. C., Keenan, T. F., van Dijk, A. I. J. M., Viney, N. R., Myneni, R. B., and Bi, J.: Reduced streamflow in water-stressed climates consistent with CO2 effects on vegetation, Nat. Clim. Change, 6, 75–78, https://doi.org/10.1038/nclimate2831, 2016b.
Ukkola, A. M., Pitman, A. J., De Kauwe, M. G., Abramowitz, G., Herger, N., Evans, J. P., and Decker, M.: Evaluating CMIP5 Model Agreement for Multiple Drought Metrics, J. Hydrometeorol., 19, 969–988, https://doi.org/10.1175/JHM-D-17-0099.1, 2018.
Ukkola, A. M., De Kauwe, M. G., Roderick, M. L., Abramowitz, G., and Pitman, A. J.: Robust Future Changes in Meteorological Drought in CMIP6 Projections Despite Uncertainty in Precipitation, Geophys. Res. Lett., 47, https://doi.org/10.1029/2020GL087820, 2020.
van Dijk, A. I. J. M., Beck, H. E., Crosbie, R. S., de Jeu, R. A. M., Liu, Y. Y., Podger, G. M., Timbal, B., and Viney, N. R.: The Millennium Drought in southeast Australia (2001–2009): Natural and human causes and implications for water resources, ecosystems, economy, and society: CAUSES AND IMPACTS OF AUSTRALIA'S RECORD DROUGHT, Water Resour. Res., 49, 1040–1057, https://doi.org/10.1002/wrcr.20123, 2013.
Van Loon, A. F.: Hydrological drought explained: Hydrological drought explained, WIREs Water, 2, 359–392, https://doi.org/10.1002/wat2.1085, 2015.
Van Loon, A. F., Stahl, K., Di Baldassarre, G., Clark, J., Rangecroft, S., Wanders, N., Gleeson, T., Van Dijk, A. I. J. M., Tallaksen, L. M., Hannaford, J., Uijlenhoet, R., Teuling, A. J., Hannah, D. M., Sheffield, J., Svoboda, M., Verbeiren, B., Wagener, T., and Van Lanen, H. A. J.: Drought in a human-modified world: reframing drought definitions, understanding, and analysis approaches, Hydrol. Earth Syst. Sci., 20, 3631–3650, https://doi.org/10.5194/hess-20-3631-2016, 2016.
Vogel, E., Lerat, J., Pipunic, R., Frost, A. J., Donnelly, C., Griffiths, M., Hudson, D., and Loh, S.: Seasonal ensemble forecasts for soil moisture, evapotranspiration and runoff across Australia, J. Hydrol., 601, 126620, https://doi.org/10.1016/j.jhydrol.2021.126620, 2021.
Vogel, E., Johnson, F., Marshall, L., Bende-Michl, U., Wilson, L., Peter, J. R., Wasko, C., Srikanthan, S., Sharples, W., Dowdy, A., Hope, P., Khan, Z., Mehrotra, R., Sharma, A., Matic, V., Oke, A., Turner, M., Thomas, S., Donnelly, C., and Duong, V. C.: An evaluation framework for downscaling and bias correction in climate change impact studies, J. Hydrol., 622, 129693, https://doi.org/10.1016/j.jhydrol.2023.129693, 2023.
Voldoire, A., Sanchez-Gomez, E., Salas y Mélia, D., Decharme, B., Cassou, C., Sénési, S., Valcke, S., Beau, I., Alias, A., Chevallier, M., Déqué, M., Deshayes, J., Douville, H., Fernandez, E., Madec, G., Maisonnave, E., Moine, M.-P., Planton, S., Saint-Martin, D., Szopa, S., Tyteca, S., Alkama, R., Belamari, S., Braun, A., Coquart, L., and Chauvin, F.: The CNRM-CM5.1 global climate model: description and basic evaluation, Clim. Dynam., 40, 2091–2121, https://doi.org/10.1007/s00382-011-1259-y, 2013.
Wasko, C., Shao, Y., Vogel, E., Wilson, L., Wang, Q. J., Frost, A., and Donnelly, C.: Understanding trends in hydrologic extremes across Australia, J. Hydrol., 593, 125877, https://doi.org/10.1016/j.jhydrol.2020.125877, 2021.
Watanabe, M., Suzuki, T., O'ishi, R., Komuro, Y., Watanabe, S., Emori, S., Takemura, T., Chikira, M., Ogura, T., Sekiguchi, M., Takata, K., Yamazaki, D., Yokohata, T., Nozawa, T., Hasumi, H., Tatebe, H., and Kimoto, M.: Improved Climate Simulation by MIROC5: Mean States, Variability, and Climate Sensitivity, J. Climate, https://doi.org/10.1175/2010JCLI3679.1, 2010.
Wilson, L., Bende-Michl, U., Sharples, W., Vogel, E., Peter, J., Srikanthan, S., Khan, Z., Matic, V., Oke, A., Turner, M., Co Duong, V., Loh, S., Baron-Hay, S., Roussis, J., Kociuba, G., Hope, P., Dowdy, A., Donnelly, C., Argent, R., Thomas, S., Kitsios, A., and Bellhouse, J.: A national hydrological projections service for Australia, Climate Services, 28, 100331, https://doi.org/10.1016/j.cliser.2022.100331, 2022.
Xu, Z., Han, Y., Tam, C.-Y., Yang, Z.-L., and Fu, C.: Bias-corrected CMIP6 global dataset for dynamical downscaling of the historical and future climate (1979–2100), Sci. Data, 8, 293, https://doi.org/10.1038/s41597-021-01079-3, 2021.
Yang, Y., Roderick, M. L., Zhang, S., McVicar, T. R., and Donohue, R. J.: Hydrologic implications of vegetation response to elevated CO2 in climate projections, Nat. Clim. Change, 9, 44–48, https://doi.org/10.1038/s41558-018-0361-0, 2019.
Zhang, X. S., Amirthanathan, G. E., Bari, M. A., Laugesen, R. M., Shin, D., Kent, D. M., MacDonald, A. M., Turner, M. E., and Tuteja, N. K.: How streamflow has changed across Australia since the 1950s: evidence from the network of hydrologic reference stations, Hydrol. Earth Syst. Sci., 20, 3947–3965, https://doi.org/10.5194/hess-20-3947-2016, 2016.