the Creative Commons Attribution 4.0 License.
the Creative Commons Attribution 4.0 License.
 | 24 Feb 2026
Skills in sub-seasonal to seasonal terrestrial water storage forecasting: insights from the FEWS NET land data assimilation system
Abheera Hazra
Amy McNally
Kimberly Slinski
Shraddhanand Shukla
Weston Anderson
Accurate prediction of terrestrial water storage (TWS), the sum of soil moisture, groundwater, snow/ice, and surface water, is critical for informing disaster responses. Here we evaluated subseasonal to seasonal (S2S) TWS forecasts produced by the Famine Early Warning Systems Network (FEWS NET) land data assimilation system (FLDAS) over Africa using observations from the Gravity Recovery and Climate Experiment (GRACE) and its Follow-On (GRACE/FO) mission. FLDAS consists of two advanced land surface models, Noah-MP and the NASA Catchment Land Surface Model (CLSM), both of which simulate key TWS components including groundwater. Results show that CLSM generally outperformed Noah-MP, with relative operating characteristics scores exceeding 0.6 (the threshold for predictive skill) for tercile forecasts over >50 % of the study domain across the 1–6 months lead times, and stronger correlations with GRACE/FO data.
The superior performance of CLSM is largely attributed to its reanalysis-based initial conditions, which more accurately captured interannual variability observed in GRACE/FO observations (correlation of 0.72 vs 0.56 for Noah-MP for domain averaged TWS). CLSM also simulates strong TWS temporal variability and thus temporal persistence, enabling skillful initial conditions to propagate across forecast lead times. Accurate representation of interannual variability is essential for S2S forecasts because TWS is a long memory process, and interannual variability also directly affects climatology used to determine anomalies.
Although persistence provides a source of predictability, this study shows that inaccurate persistence, such as that associated with anthropogenic trends and misrepresented precipitation variability, can degrade forecast skill. TWS forecasts from both models are also highly sensitive to precipitation interannual variability, achieving higher forecast skill when driven by precipitation forecasts with lower interannual variability. These findings underscore strong impacts of model physics and the critical role of independent observations such as GRACE/FO for evaluating and improving TWS forecasts.
- Article
(22289 KB) - Full-text XML
-
Supplement
(43813 KB) - BibTeX
- EndNote


Changes in terrestrial water storage (TWS), the sum of soil moisture, groundwater, snow/ice and surface water, reflects cumulated impacts of precipitation and evapotranspiration (ET) over weeks to months (Humphrey et al., 2016). As such, it provides unique insight into hydrological extremes (floods and droughts) and their responses to climate variability and climate change (Zhao et al., 2017; Rodell and Li, 2023; Li and Rodell, 2023; B. Li et al., 2025). Skillful TWS forecasts at subseasonal to seasonal (S2S) scales are therefore of great value for providing early warnings on water shortage and crop failure, especially in Africa, where persistent food and water insecurity faced by many communities are often exacerbated by frequent floods and droughts (Ngcamu and Chari, 2020; Cook et al., 2021; Scanlon et al., 2022; WMO, 2025).
Thus far, most studies have focused on evaluating TWS forecasting skills by climate models at decadal scales (e.g., Jensen et al., 2019; Yuan and Zhu, 2018; Zhu et al., 2019). These evaluations typically compare initialized forecasts, where initial conditions are derived from model simulation driven by observation or reanalysis-based atmospheric forcing data, with uninitialized ones to obtain skill scores. Initial conditions have been found to provide more skill than dynamical climate forecasts alone in 1–4 years lead time, suggesting persistence of TWS as a key source of predictability (Zhu et al., 2019). However, since most climate models do not simulate groundwater, the reported persistence mainly reflects that of soil moisture. More importantly, evaluations using simulated TWS as reference mask impacts of model physics and thus are unable to assess uncertainties in model physics and may even mischaracterize persistence and its role in TWS forecast.
Groundwater, located in the deeper subsurface, has longer memory than other near surface processes such as soil moisture and its long-term temporal variability may contribute to TWS predictability (Eltahir and Yeh, 1999; Li et al., 2015). However, modeling groundwater is subject to greater uncertainty due to lack of information on hydrogeological properties and observational data to constrain simulation of deep subsurface processes (Xia et al., 2017). As a result, reanalysis-based groundwater estimates, when used as initial conditions, may not deliver correct temporal persistence or memory for enhancing forecast skill. Furthermore, because of its long memory, groundwater is more sensitive to errors in the meteorological forecasts that drive TWS forecasts. Previous studies have shown biases in S2S precipitation forecasts vary depending on climate conditions and terrains (Shukla et al., 2019; Slater et al., 2019; Zhang et al., 2021; Levey and Sankarasubramanian, 2024; Phakula et al., 2024). However, examining groundwater responses to meteorological forecasts and associated uncertainties is hindered by the scarcity of in situ groundwater observations at the continental to global scales (Jasechko et al., 2024).
TWS observations from the Gravity Recovery and Climate Experiment (GRACE) and its Follow On (hereafter GRACE/FO, Landerer et al., 2020) mission provide a unique opportunity to evaluate S2S TWS forecasts. Representing vertically integrated water storage changes, GRACE/FO data exhibits strong temporal variabilities from subseasonal to interannual scales (Humphrey et al., 2016). While sub-seasonal variability is essential for assessing S2S forecast skill, interannual variability is equally important for evaluating climatology used for forecasting TWS anomalies. GRACE/FO data have been widely used to validate reanalysis estimates and to identify deficiencies in model physics in large-scale hydrological models (e.g., Döll et al., 2014; Scanlon et al., 2018; Bonsor et al., 2018; Li et al., 2019a). In recent years, the record has also been leveraged to train machine learning models for forecasting TWS (e.g., F. Li et al., 2024 and 2025). However, few studies have used GRACE/FO data to evaluate operational S2S TWS forecasts by land surface models. Cook et al. (2021) assessed TWS forecast skill over Africa using a reconstructed GRACE product. With more than two decades of nearly continuous observations, GRACE/FO observations are ideal for objectively assessing S2S TWS forecast skill and examining factors influencing TWS predictability.
The hydrological forecasting system implemented in the Famine Early Warning Systems Network (FEWS NET) land data assimilation system (FLDAS-Forecast) was developed to provide early warnings on droughts and floods across Africa (Arsenault et al., 2020; Hazra et al., 2023). FLDAS-Forecast is a custom instance of the NASA Land Information System (LIS), an advanced computing framework that supports land surface modeling and data assimilation (Kumar et al., 2006). FLDAS-Forecast comprises two advanced land surface models, Noah-MP and the NASA Catchment Land Surface Model (CLSM), both of which simulate major TWS components including groundwater. FLDAS-Forecast issues TWS forecasts using precipitation forecasts from the full North American Multi-Model Ensemble (NMME, Kirtman et al., 2014) and non-precipitation meteorological forecasts from the Goddard Earth Observing System (GEOS, Borovikov et al., 2019).
The primary goal of this study is to provide an objective evaluation of the skill of S2S TWS forecasts from FLDAS-Forecast using GRACE/FO observations. To this end, we analyze TWS hindcasts for the historical period 2003–2020. The hindcasts were generated using the same set of NMME models employed in the operational FLDAS forecasts (2021–present), except that one of the NMME models used a reduced number of ensemble members (Hazra et al., 2023). Initial conditions for the hindcasts are derived from model simulations forced by observation and reanalysis-based meteorological forcing fields. Consequently, TWS hindcast skill reflects the combined influence of land surface model physics, meteorological hindcasts, and the reanalysis-based initial conditions.
By leveraging the multi-model framework of FLDAS-Forecast, including two land surface models and a full ensemble of NMME precipitation forecast models, the evaluation aims to improve understanding of how model physics employed by land surface models influence TWS forecast skill and how they interact with precipitation forecasts. In addition to GRACE/FO observations, TWS hindcasts were evaluated against reanalysis TWS to isolate the impact of model physics from those of meteorological forecasts. Unlike past studies where S2S forecasts were evaluated by the season when they were issued (e.g., Shukla et al., 2019; Hazra et al., 2023), statistics analyses are performed over the entire study period (2003–2020) in this study to better examine the role of long-term variability in precipitation and simulated TWS processes in influencing TWS forecast skill. Autocorrelation analysis is performed for simulated TWS processes and GRACE/FO observations to examine the role of temporal persistence on forecast skill and to assess the relative contribution of individual processes to overall TWS persistence.
2.1 Observational and reanalysis-based meteorological input
Precipitation from the Climate Hazards Infrared Precipitation with Stations (CHIRPS, Funk et al., 2015) and other meteorological fields from the Modern-Era Retrospective Analysis for Research and Applications, Version 2 (MERRA-2, Gelaro et al., 2017) are used to drive model simulation by Noah-MP and CLSM from 1982 to present. The output of these simulation runs, referred to as the reanalysis, is then used as initial conditions for issuing TWS hindcasts (Hazra et al., 2023).
CHIRPS integrates satellite-based precipitation estimates with station data to produce global precipitation time series at 0.05° spatial resolution and a 6 h interval. MERRA-2, which has 0.5° in latitude by 0.625° in longitude resolution, is an atmospheric reanalysis product based on the GEOS model, featuring assimilation of various atmospheric observations such as radiances, surface winds, temperature, and aerosol and improved representation of stratosphere and cryosphere processes (Gelaro et al., 2017). While CHIRPS precipitation was interpolated to 0.25° for this study by the data develop group, MERRA-2 forcing fields were interpolated to 0.25° using LIS built-in functions for model simulation. Temporal disaggregation was also performed within LIS.
2.2 Meteorological hindcasts
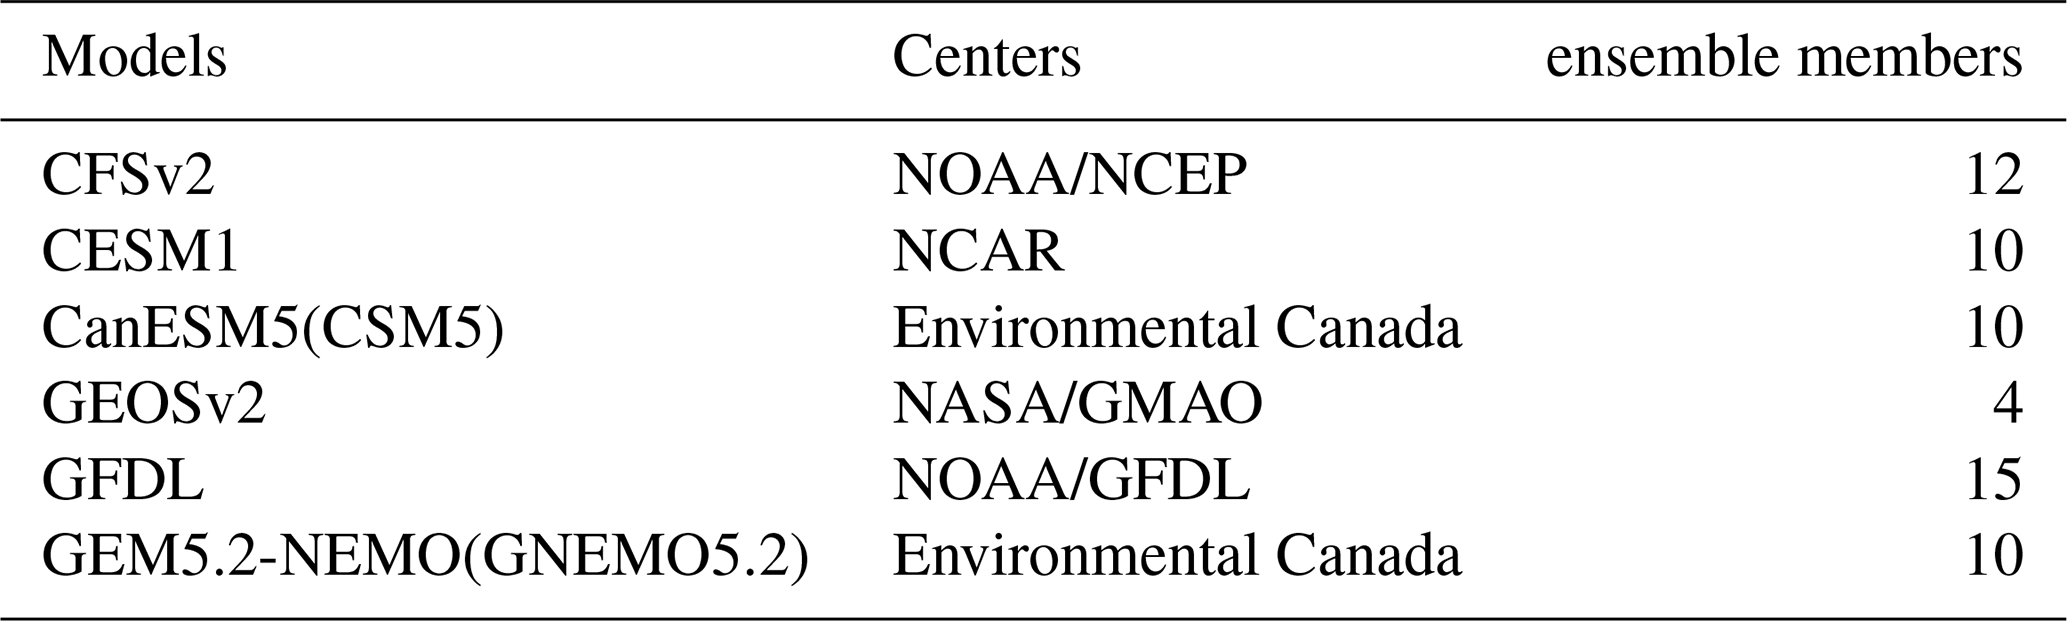
To generate TWS hindcasts, atmospheric forcing fields must be obtained from hindcast products to properly represent forecast uncertainty, as reanalysis products cannot predict future weather events. Unlike reanalysis fields which are constrained by observations, meteorological hindcasts are produced by climate models alone and therefore, are subject to larger uncertainties. FLDAS-Forecast employs a suite of NMME models developed by multiple institutions to provide S2S precipitation (and temperature which is not currently used by FLDAS-Forecast) forecasts (Table 1). The ensemble approach not only enables uncertainty quantification but also generally yields higher predictive skill than any single model (Wood et al., 2002; Kirtman et al., 2014).
Since the NMME suite does not provide the full set of meteorological forcing fields needed to drive land surface models, non-precipitation fields, such as radiation and winds, are obtained from the GEOS ensemble hindcasts (Borovikov et al., 2019). Given that GEOS only includes four ensemble members, non-precipitation fields from randomly selected GEOS ensemble members are paired with NMME precipitation hindcasts to produce TWS hindcasts (see details in Hazra et al., 2023). NMME precipitation hindcasts are spatially downscaled to 0.25° resolution using the CHIRPS 0.25° product, whereas GEOS non-precipitation fields were first downscaled to MERRA-2 resolution and then to 0.25° using LIS built-in functions (Arsenault et al., 2020; Hazra et al., 2023). The spatial downscaling also includes bias-correction using the respected reanalysis and observation fields. Both NMME and GEOS forecasts are further temporally downscaled to sub-daily for model simulation using the procedures described in Hazra et al. (2023). For simplicity, the combined NMME precipitation and GEOS non-precipitation hindcasts are referred to as NMME hindcast models in the following sections.
Table 1NMME precipitation hindcast specifications. CFS: Climate Forecast System; CESM: Community Earth System Model; CanESM: Canadian Earth System Model; GFDL: Geophysical Fluid Dynamics Laboratory; GEM: Global Environmental Multiscale; NEMO: Nucleus for European Modeling of the Ocean; NCEP: National Centers for Environmental Prediction; NCAR: National Center for Atmospheric Research; GMAO: Global Modeling and Assimilation Office.
2.3 Land surface models and TWS reanalysis and hindcasts
Both Noah-MP and CLSM simulate key components of TWS, soil moisture, groundwater storage and snow water equivalent (SWE), based on water and energy balance equations. However, they differ considerably in model physics, particularly in modeling subsurface water flows (see Table 1 of Xia et al., 2017 for model configuration and descriptions).
Noah-MP simulates soil moisture dynamics in four unsaturated soil layers based on Richards' equation (Niu et al., 2011). Groundwater storage in FLDAS-Forecast/Noah-MP is represented by a linear reservoir scheme that computes groundwater storage changes based on net water exchanges between the lowest soil layer and the aquifer (Niu et al., 2011). Although the scheme simulates capillary rise, the upward water movement from the aquifer to the upper unsaturated soil has been shown to be minimal, resulting in small seasonal variations in simulated groundwater in some regions (Xia et al., 2017; Li et al., 2021).
In contrast, CLSM simulates subsurface water storage changes at three layers: a 2 cm surface layer, a 1 m root zone and the total profile (Koster et al., 2000). The depth of the soil profile is determined by a spatially varying bedrock depth parameter (see Fig. 10 of Li et al., 2019b for the spatial map). Water flows among these layers are governed by empirically derived time constants that actively redistribute water, moving water downward during precipitation events, and upward during the dry months to sustain ET. This strong coupling between surface and deep layers results in pronounced seasonal variations in CLSM simulated groundwater and TWS, even in dry climates (Xia et al., 2017; Li et al., 2019b). Although CLSM does not explicitly model groundwater, groundwater variation is included in the total profile soil moisture; thus, CLSM groundwater storage is obtained by subtracting water storage in the root zone from that of the total soil profile, following previous studies (e.g., Li et al., 2019b). Compared to Noah-MP, CLSM groundwater contains soil moisture from the 1 m depth to the implicit water table. Despite this diagnostic approximation, CLSM groundwater has been shown to compare well with in situ groundwater in different climates (Xia et al., 2017; Li et al., 2019b).
The two models also employ different physics for ET estimates which, along with precipitation, exerts major controls on the temporal variability of groundwater in unconfined aquifers (Eltahir and Yeh, 1999; Li et al., 2015; Li et al., 2019b; Ascott et al., 2020). Previous studies have shown that CLSM tends to simulate higher ET than other land surface models, primarily due to its strong coupling among soil layers and the specific ET algorithms it employs (Xu et al., 2019). For instance, bare soil evaporation is computed as a nonlinear function of soil moisture in Noah-MP, but a linear function in CLSM (Niu et al., 2011; Koster and Suarez, 1996). Although both models employ the TOPMODEL concept to simulate surface and subsurface (baseflow) runoff, discrepancies in simulating ET and profile moisture lead to different runoff estimates (Xia et al., 2017).
Neither model simulates surface water, which is detected by GRACE/FO satellites. However, surface water contribution to TWS is generally smaller compared to other TWS components, except in areas with large surface water bodies (Rodell and Famiglietti, 2001; Getirana et al., 2017; Deggim et al., 2021). Implications of neglecting surface water storage for the evaluation results are discussed in Sect. 3. In addition, both models do not simulate water storage changes in confined aquifers which are also detected by GRACE/FO satellites. Because snow is negligible in Africa, simulated TWS in this study is thus represented as the sum of soil moisture in the unsaturated zone, 2 m for Noah-MP and 1 m for CLSM, and groundwater storage.
Model simulations were first performed by driving Noah-MP and CLSM with CHIRPS precipitation and non-precipitation fields from MERRA-2. Because MERRA-2 is a reanalysis product, these simulations are collectively referred to as the reanalysis. TWS hindcasts with lead times of 1 to 6 months were then generated by forcing Noah-MP and CLSM with the NMME hindcasts described above, using the corresponding reanalysis output as initial conditions. Since CHIRPS and MERRA-2 are constrained by hydrological and atmospheric observations, initializing hindcasts with the reanalysis, rather than modeled states driven solely by NMME meteorological hindcasts, helps reduce uncertainty in TWS hindcasts. In Sect. 3, we evaluate both the ensemble mean TWS hindcasts of individual NMME models and those of all NMME models.
2.4 GRACE/FO TWS observations
GRACE/FO data used in this study were developed by the Center for Space Research (CSR) at the University of Texas based on the mass concentration (mascon) approach (Save et al., 2016). The mascon approach utilizes time-variable constraints to constrain the inversion of satellite ranging data to gravity fields at each mascon block. This approach eliminates the need for postprocessing as with the spherical harmonical approach and thus better preserves signals related to TWS changes (Landerer and Swenson, 2012; Save et al., 2016).
CSR GRACE TWS observations are provided as monthly anomalies relative to the 2004–2009 temporal mean, at a 0.25° spatial resolution. However, the effective resolution remains relatively coarse, approximately 150 000 km2 at mid-latitudes (Tapley et al., 2004). There are 34 months with missing data, including the 11-month gap between the two missions. Missing data were filled using linear interpolation, except for the 11-month gap. We found filling the gap had no noticeable impact on the statistical results.
2.5 Data processing and study domain
To ensure consistency with GRACE/FO data, we first removed the temporal mean of simulated TWS for 2004–2009 at each grid cell to align the model's mean period with that of GRACE/FO. We then computed non-seasonal TWS anomalies by subtracting the monthly mean (climatology), one for each calendar month, from the simulated TWS and GRACE/FO time series for their overlapping period, 2003–2020. Unless otherwise noticed, all results presented in Sect. 3 are based on the non-seasonal TWS anomalies.
For identifying severity of extreme conditions, percentiles, P, of TWS hindcasts (anomalies relative to monthly climatology) are calculated by ranking the anomalies against the climatology of the corresponding month:
where k is the rank of the TWS hindcast respect to the climatology, and N is the number of monthly anomalies in the climatology which are sorted in ascending order. Lower percentiles indicate drier conditions, while higher percentiles indicate wetter conditions.
The FLDAS-Forecast domain encompasses the African continent and a large portion of the Middle East (Supplement Fig. S1). Northern Africa and parts of the Middle East have experienced long-term TWS declines associated with extensive groundwater withdrawals for irrigation (Gossel et al., 2004; Rodell et al., 2018; Scanlon et al., 2018; Frappart, 2020). Since FLDAS-Forecast does not simulate these anthropogenic effects, these regions were excluded from the evaluation using the groundwater depletion masks provided by Rodell et al. (2018).
2.6 Evaluation metrics
The root mean square error (RMSE) and Pearson correlation are used to evaluate the performance of TWS forecasts. Additionally, skill in forecasting terciles is assessed using the relative operating characteristic (ROC) score, a commonly used metric for evaluating forecasts that measures the ratio of hit rates to false alarm rates (Met Office, 2025). A ROC score of 1 indicates a perfect forecast. ROC scores below 0.5 suggest no skill, while scores above 0.6 indicate predictive skill (Met Office, 2025). High ROC scores and strong correlation are commonly interpreted as indication of skillful forecasts (e.g., Yuan and Zhu, 2018).
As indicated earlier, skill of TWS hindcasts is influenced by several factors, including initial conditions, meteorological hindcasts, and the underlying land surface model physics which affect both the reanalysis-based initial conditions and TWS hindcasts. Because these influences are interrelated, fully isolating their individual contribution to hindcast skill is inherently challenging. To address this, we conduct a series of complementary evaluations using both GRACE/FO data and the reanalysis as reference.
We begin by examining the temporal variability of reanalysis soil moisture and groundwater, which are used as initial conditions for TWS hindcasts, to assess their relative contribution to temporal variability and accuracy of TWS (Sect. 3.1). We then evaluate TWS hindcasts and the corresponding reanalysis using GRACE/FO observations to quantify forecast skill for each land surface model and NMME forcing model, and accuracy of initial conditions (Sect. 3.2). Since TWS hindcasts differ from the reanalysis TWS only in their meteorological forcing fields, evaluating TWS hindcasts using the reanalysis as reference helps isolate uncertainties in NMME hindcasts. Differences between evaluation metrics computed relative to GRACE/FO and to the reanalysis, in turn, reveal impacts of land surface model physics that are masked when the reanalysis is used as reference (Sect. 3.3). To quantify hydrological memory, an important source of predictability, we conduct autocorrelation analyses of simulated TWS processes and GRACE/FO observations at three lags relevant to S2S hindcasts (Sect. 3.4). Finally, we present a case study to demonstrate the relevance of TWS forecasts for predicting hydrological extremes (Sect. 3.5).
3.1 Evaluation of reanalysis TWS processes
To understand how soil moisture and groundwater contribute to TWS variability, we decompose TWS time series from the reanalysis and GRACE/FO into seasonal and non-seasonal components and summarize the domain average results in Fig. 1. Large discrepancies are observed between the two models at both seasonal and non-seasonal timescales. Noah-MP, with a 2 m soil depth, simulates greater soil moisture variability than CLSM which has a 1 m soil depth. In contrast, CLSM simulates much stronger groundwater variations than Noah-MP across both seasonal and non-seasonal scales (Fig. 1c, d), with the seasonal amplitude and temporal standard deviation of non-seasonal groundwater being nearly five times larger than those of Noah-MP (Fig. 1e, f).
As a result of the strong groundwater temporal variability, non-seasonal CLSM TWS estimates also show strong temporal variation and correlate more strongly (0.72) with GRACE/FO data than those of Noah-MP (0.57; Fig. 1f). Non-seasonal CLSM TWS also exhibits smaller (1.04 cm) RMSEs than that of Noah-MP (1.16 cm).
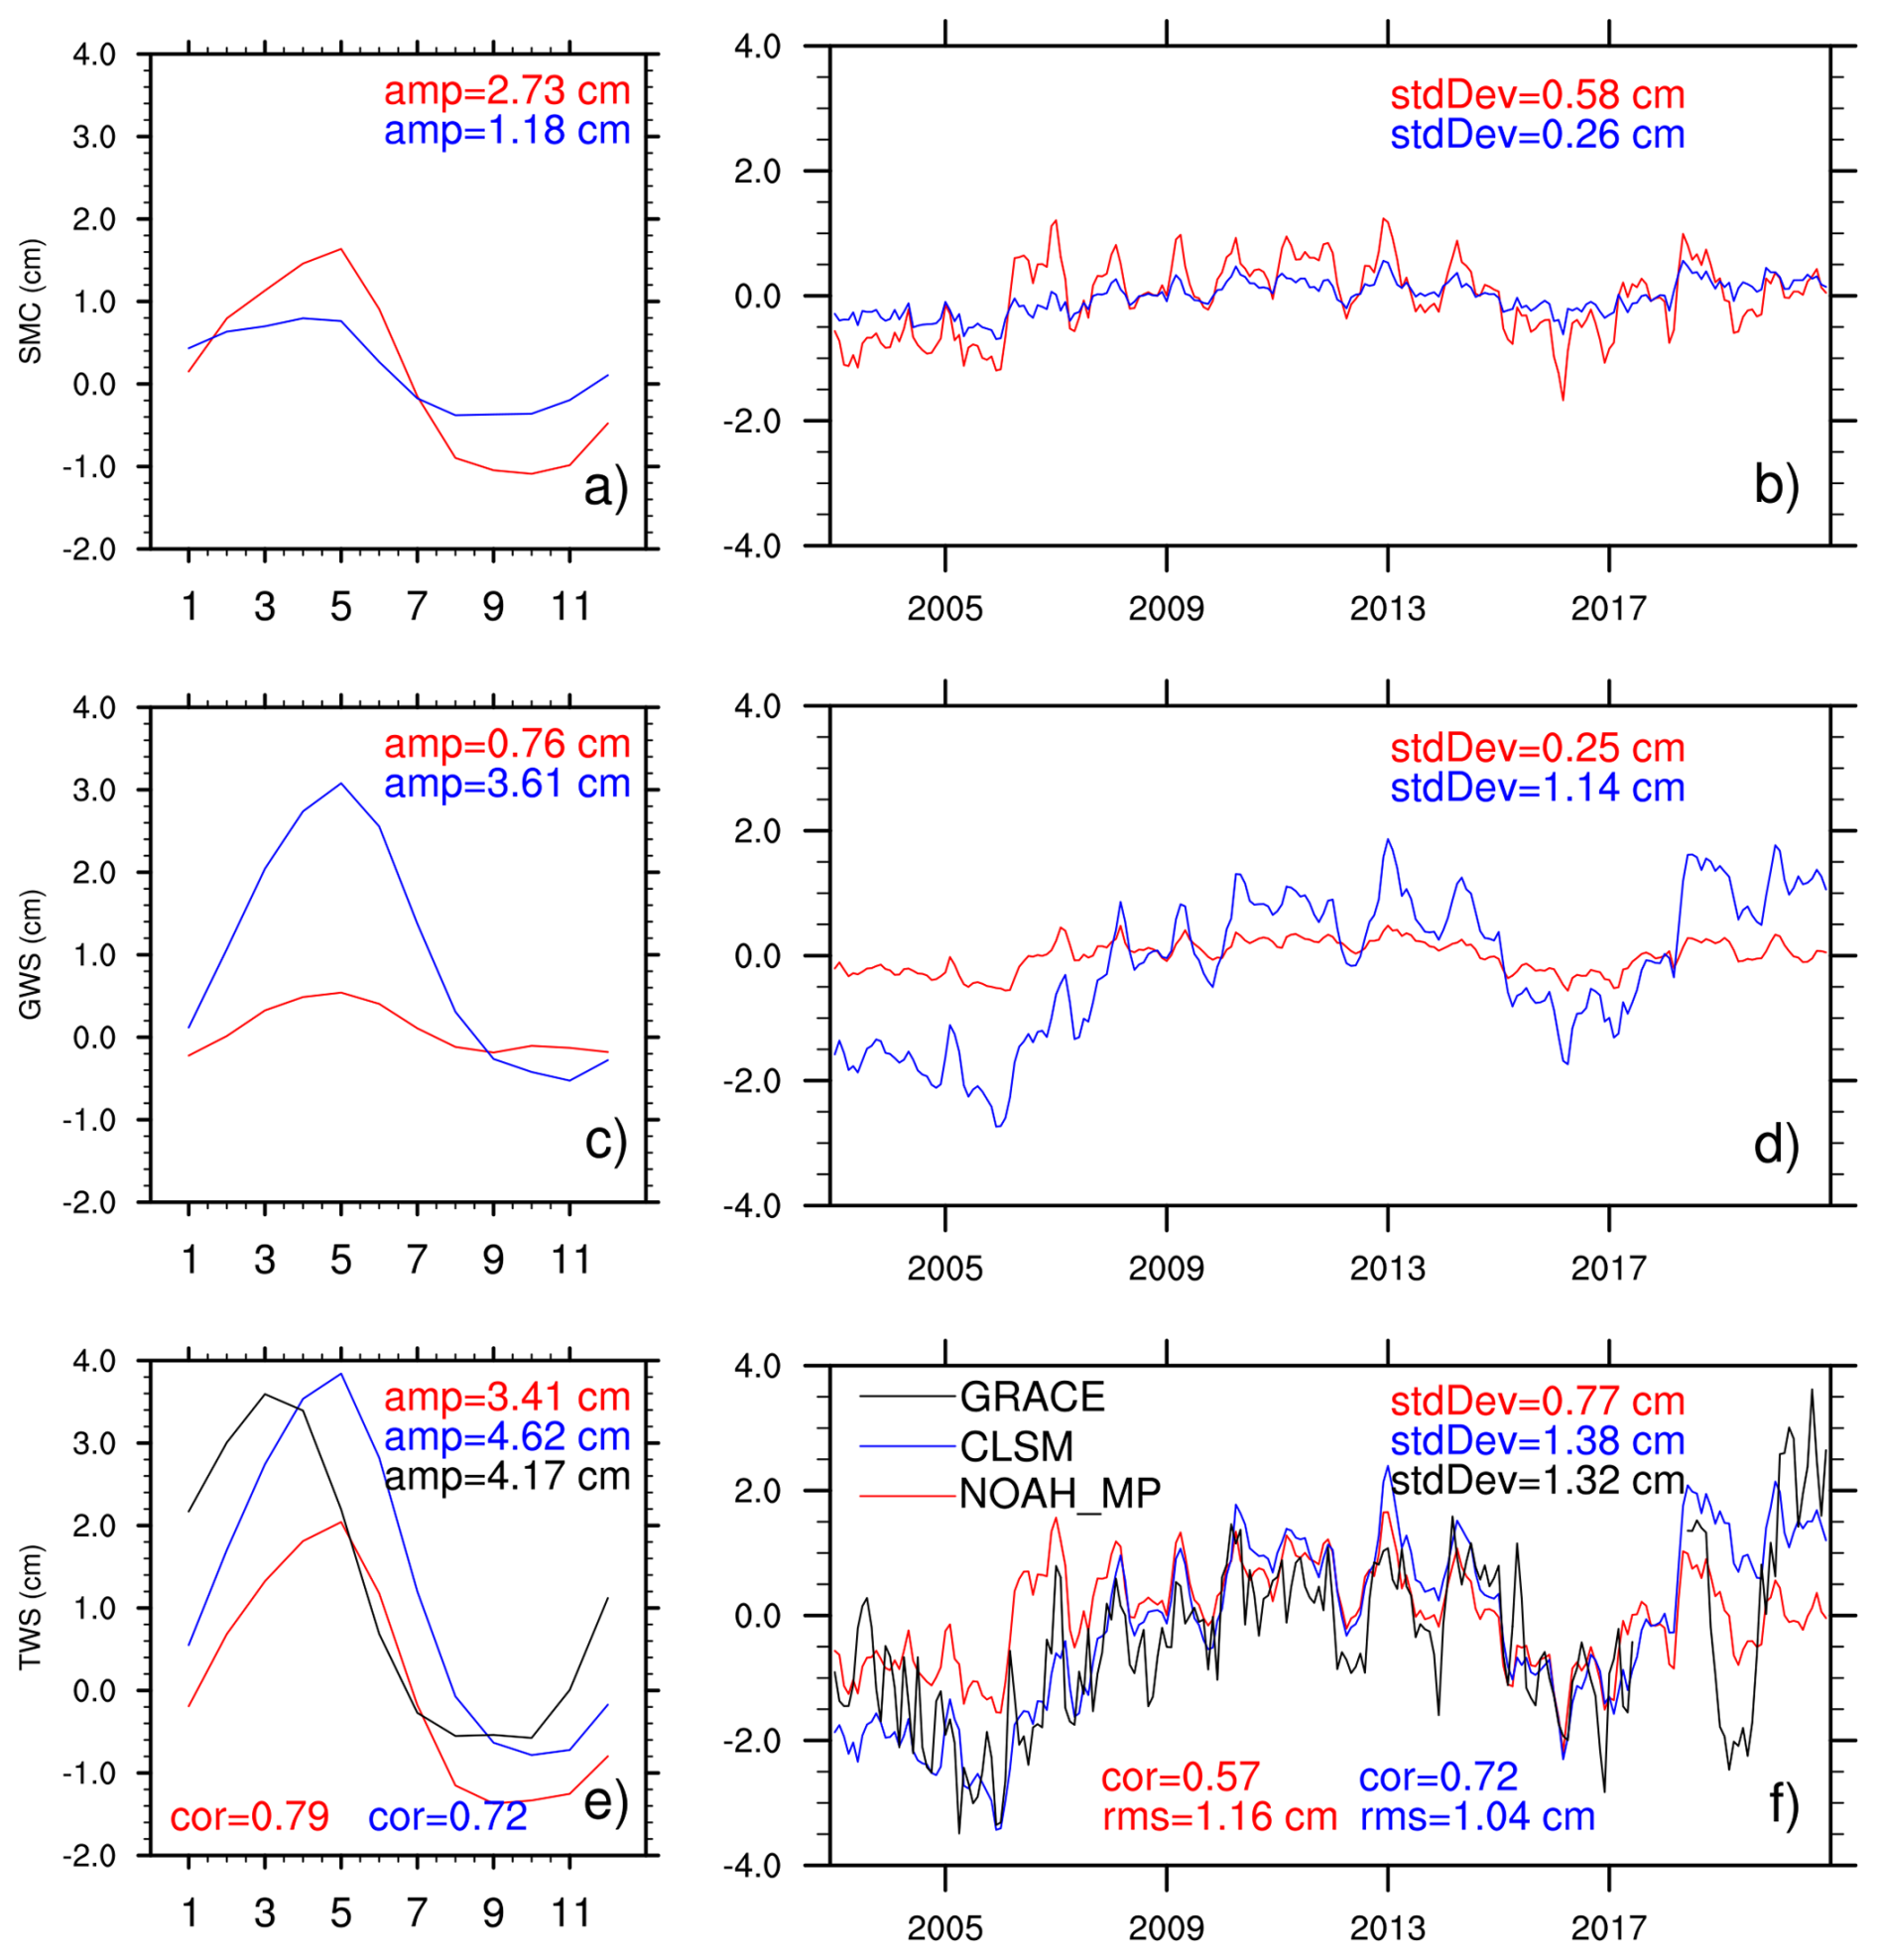
Figure 1Domain-averaged seasonal and non-seasonal components of soil moisture of the unsaturated soil (a, b), groundwater storage (c, d) and TWS (e, f) from the Noah-MP (red lines) and CLSM (blue lines) reanalysis and GRACE/FO data (black lines). Amplitudes of mean seasonal cycles, temporal standard deviations of non-seasonal components, RMSEs and correlations between the reanalysis and GRACE/FO data are shown in matching colors of the corresponding time series.
The strong correlation between CLSM TWS and GRACE/FO data is also contributed by the presence of statistically significant secular trends in the two time series (p<0.01 based on the Mann-Kendall test; Yue et al., 2002), 0.014 cm per month for CLSM and 0.007 cm per month for GRACE/FO. In contrast, Noah-MP TWS time series did not show a statistically significant trend.
CLSM also better captured the seasonal amplitude of TWS changes as observed in GRACE data (Fig. 1e). Although seasonal variations simulated by both models show >0.7 correlations with GRACE/FO data, their seasonal maxima lag that of GRACE/FO data by two months, likely due to deficiencies in model physics and errors in the meteorological forcing fields.
To further evaluate the performance of reanalysis TWS, we examine temporal variability of TWS time series for the six largest river basins in Africa (see Supplement Fig. S1a for basin delineations). Similar to domain averaged TWS, seasonal TWS for both models show high correlations (generally >0.7) with GRACE/FO data in most basins (Fig. 2, left column). Noah-MP often exhibits slightly higher seasonal correlations than CLSM (e.g., in Congo, Niger, Zambezi, and Chad); however, its performance degrades substantially in Orange, where the correlation with GRACE/FO data is near zero (Fig. 2g). This low correlation is attributed to the misalignment in the timing of the annual minimum TWS, with Noah-MP reaching its seasonal low in February, whereas GRACE/FO observations (and CLSM) reach their seasonal low in November.
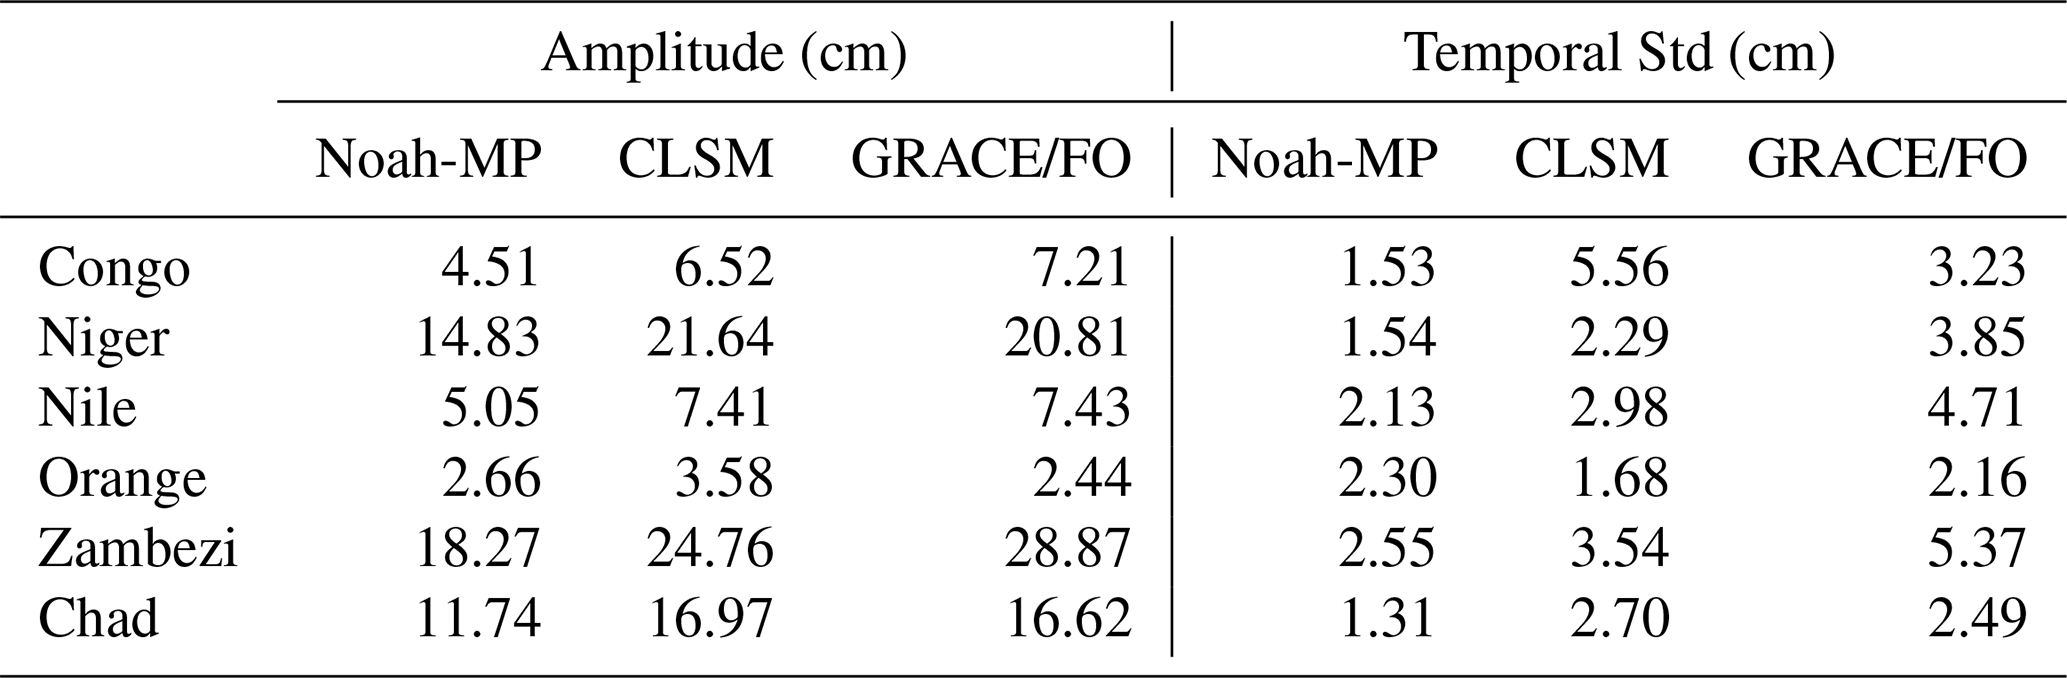
In contrast, the non-seasonal component of reanalysis TWS exhibits notably lower correlations with GRACE/FO (Fig. 2, right column), reflecting greater challenges in simulating interannual TWS variability. CLSM generally achieves higher correlations than Noah-MP in the central and northcentral basins (Congo, Nile and Zambezi), whereas Noah-MP performs better in the northwestern basins (Niger and Chad). RMSEs are lower for each model in three of the six basins. Consistent with the domain averaged analysis (Fig. 1), CLSM simulates larger seasonal variability and stronger interannual variability than Noah-MP, both of which are in closer agreement with GRACE/FO data in most cases (Table 2).
Non-seasonal TWS often exhibits strong interannual variability, reflecting both climate variability and anthropogenic effects. For instance, TWS reached maxima in the Zambezi and Orange basins in 2011 in association with the La Niña event (Fig. 2h, j), which typically brings wetter conditions to southern Africa (Mason and Goddard, 2001; Scanlon et al., 2022;). Similarly, the strong TWS increases in the Nile basin in 2019, evident in GRACE/FO data (Fig. 2f), is linked to a strong positive phase of the Indian Ocean Dipole (Scanlon et al., 2022) and enhanced precipitation variability in the East African Rift (Boergens et al., 2024). In the Niger basin (Fig. 2d), GRACE/FO shows a strong persistent increasing trend (0.048 cm per month) that has been linked to conversion of shrubs to crops (Favreau et al., 2009) and corroborated by well data (Scanlon et al., 2022). Since the models do not represent land cover change, the reanalysis TWS exhibits smaller trends (0.019 cm per month for Noah-MP and 0.016 cm per month for CLSM with p<0.01 for all three trends). Discrepancies are also observed in the Congo and Chad basins during multi-year periods (Fig. 2b, l), which may be linked to deforestation and are discussed in more detail in Sect. 3.2. Overall, the reanalysis TWS captures interannual variability observed by GRACE/FO but tends to underestimate strong anomalies such as the 2019 elevated TWS in the Nile basin and the 2016 and 2019 lows in the Zambezi basin, reflecting deficiencies in land surface model physics and uncertainties in the reanalysis forcing data. Because droughts and floods are relative to the climatological mean, evaluations in the following sections focus on non-seasonal TWS forecasts, i.e., TWS anomalies relative to monthly means.
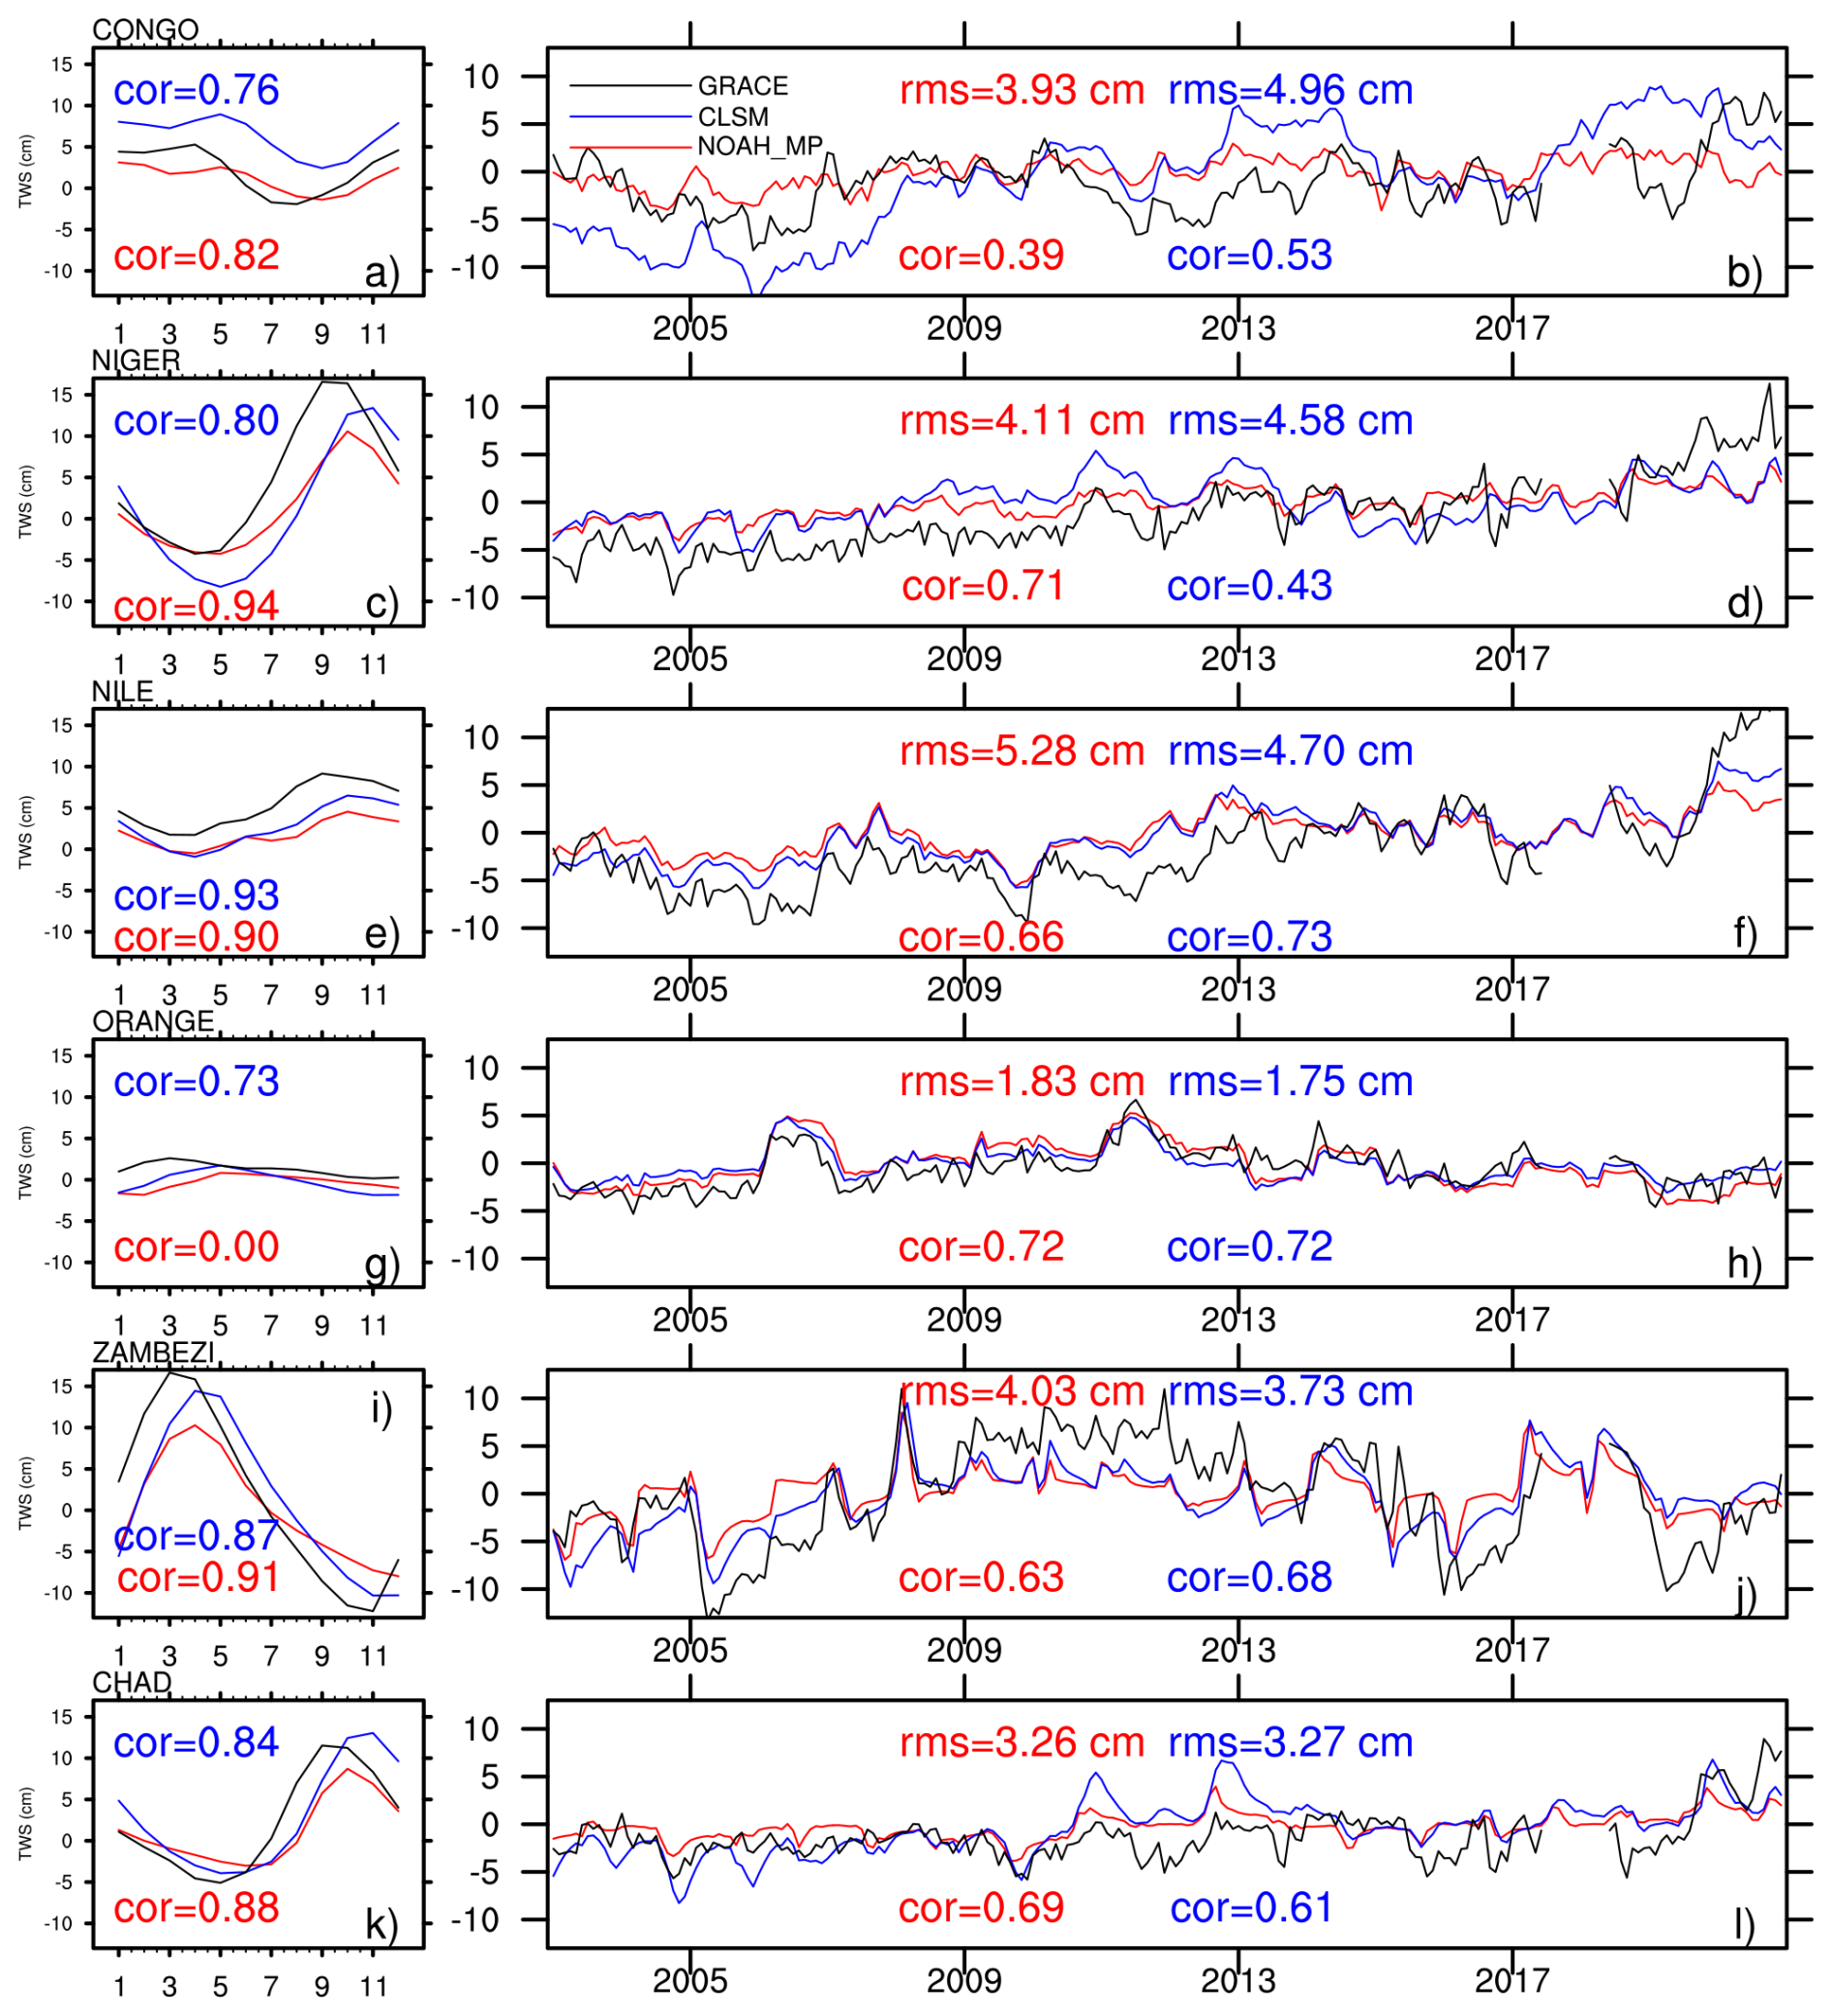
Figure 2Average seasonal (left column) and non-seasonal (right column) components of TWS from the Noah-MP (red lines) and CLSM (blue lines) reanalysis and GRACE/FO data (black lines) for the six largest river basins in Africa (Basin delineations are shown in Supplement Fig. S1a). RMSEs and correlations with respect to GRACE/FO are shown in matching colors of corresponding time series.
Table 2Amplitudes of mean seasonal TWS changes and temporal standard deviations of non-seasonal TWS over the six largest river basins in Africa (see Supplement Fig. S1a for basin delineations).
3.2 Evaluation of TWS hindcasts using GRACE/FO
RMSEs of the ensemble mean TWS hindcasts of all NMME models, with respect to GRACE/FO data, exhibit distinct spatial patterns (Fig. 3). Large RMSEs are observed in the interior western Sahel, a large region across Lake Victoria, Lake Tanganyika, and Lake Volta as well as southern Zambia and Angola, for both models. As the models do not simulate surface water which is detected by GRACE/FO satellites, unresolved surface water dynamics and water management activities may have contributed to errors in lake areas. In addition, uncertainties in precipitation forcing data, from both reanalysis and hindcasts may further amplify errors in simulated TWS. As discussed earlier, the East African Rift region, which includes Lake Victoria, has seen increased precipitation variability (Boergens et al., 2024); similarly, Southern Africa including southern Angola has been experiencing erratic precipitation patterns and more severe meteorological droughts in recent years (Trisos et al., 2022; Correia et al., 2025). However, considering that the reanalysis exhibits similar spatial patterns and magnitudes of RMSEs as the hindcasts (Fig. 3a, e), these results suggest that deficiencies in model physics are the dominant contributor to RMSEs in TWS hindcasts.
CLSM forecasts show larger RMSEs than Noah-MP in Gabon, Central African Republic (CAR) and Democratic Republic of the Congo (DRC) where mean annual precipitation is among the highest (Supplement Fig. S1a). This result suggests that CLSM is more sensitive to precipitation and its associated uncertainty, likely due to strong interannual variability in its simulated groundwater and TWS.
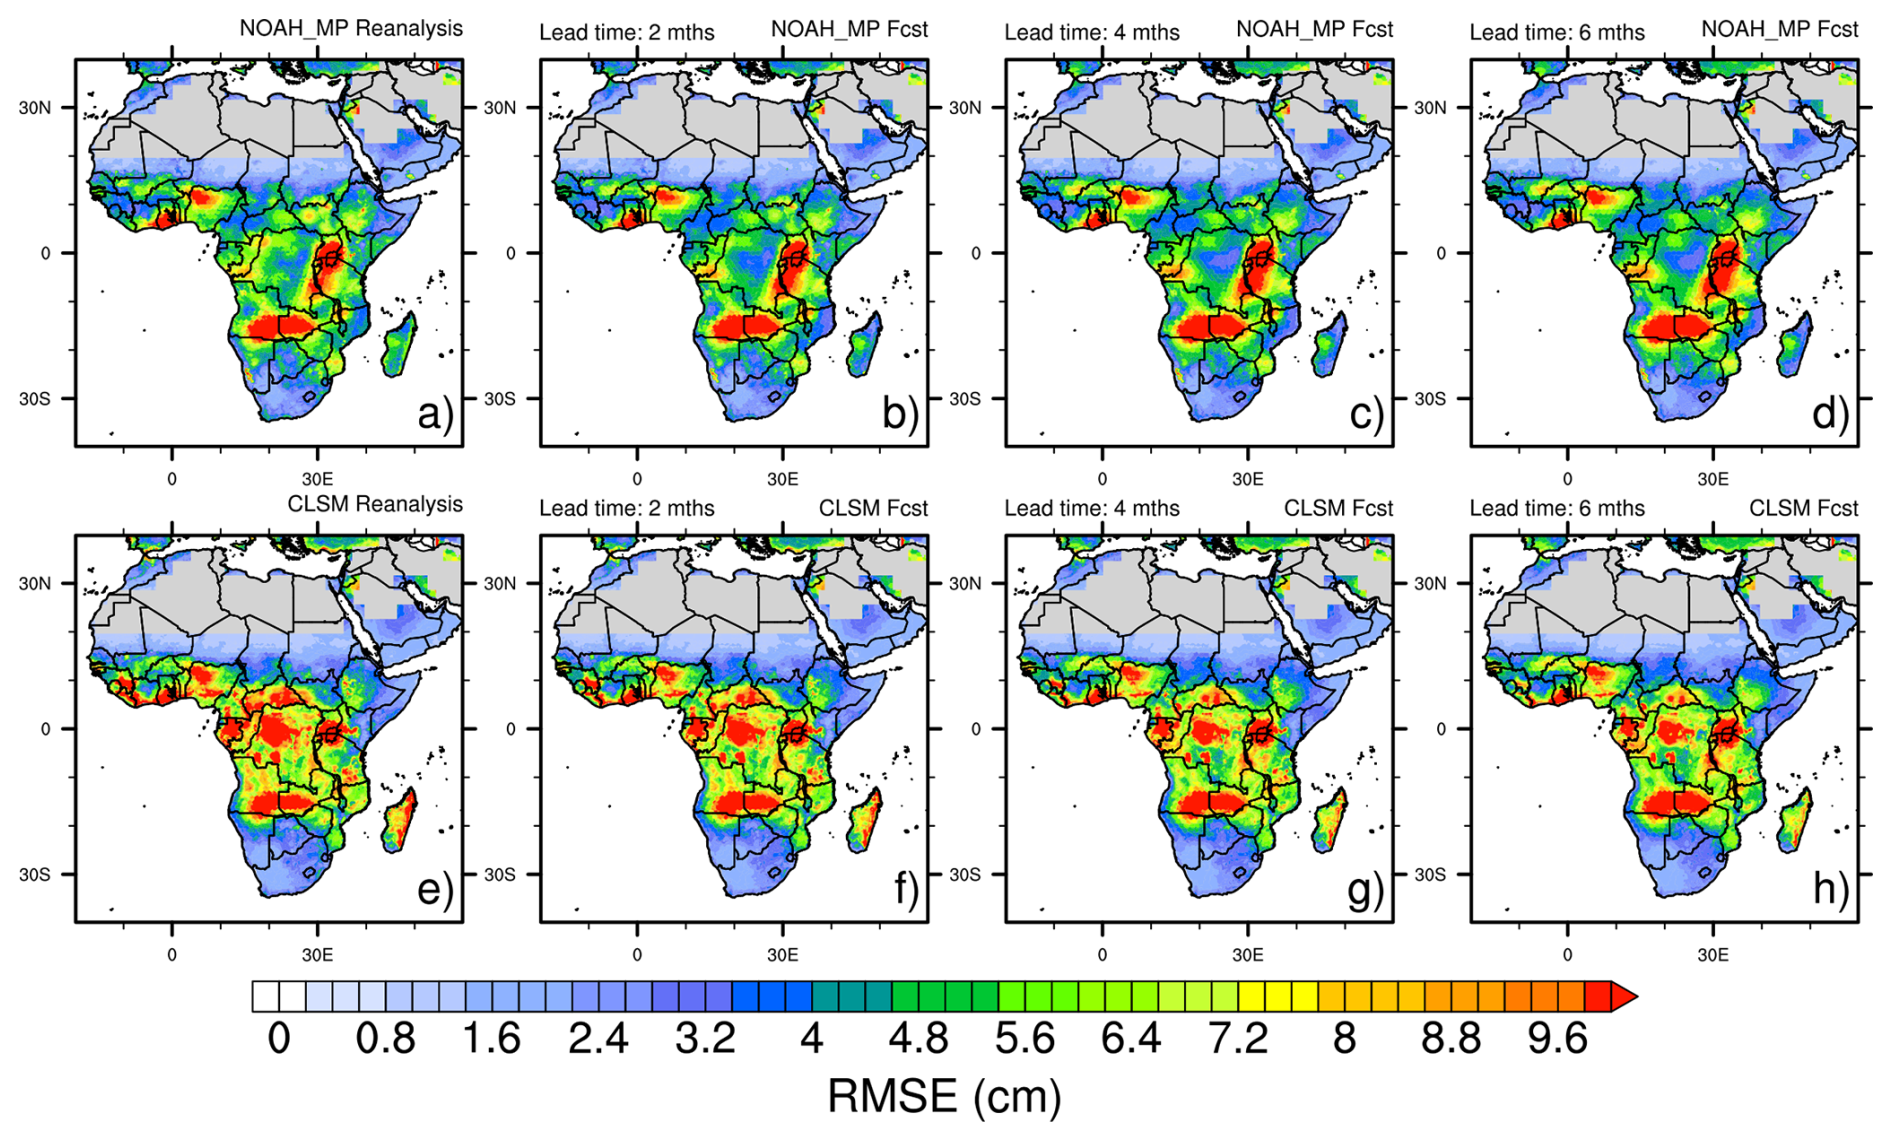
Figure 3RMSEs of non-seasonal reanalysis TWS, ensemble mean TWS forecasts of all NMME models with respect to GRACE/FO data for Noah-MP (top row) and CLSM (bottom row) at three lead times.
Correlation between the ensemble mean TWS forecasts of all NMME models and GRACE/FO data exhibits similar spatial patterns between Noah-MP and CLSM (Fig. 4), suggesting precipitation plays a stronger role in correlation than model physics. However, the strength of those correlations differs notably between the two models, especially at long lead times with higher average correlation for CLSM. Correlations decrease with lead time for both models, but more rapidly for Noah-MP which, on average, decreased by 48 % from the 2- to 6-month lead time, compared to the 27 % decrease with CLSM. Most of the deterioration in correlation is observed in central Africa where mean annual precipitation is the largest (Supplement Fig. S1a), reflecting larger precipitation uncertainty in wet regions and the model's response to such uncertainty.
Similar to RMSEs, correlations of the reanalysis exhibit spatial patterns comparable to those of hindcasts but with higher values, owing to the use of more accurate meteorological forcing fields (Fig. 4a, e). On spatial average, the CLSM reanalysis shows higher correlations with GRACE/FO data than Noah-MP, contributing to the higher forecast skill of CLSM (Fig. 4). Note that strong performance in one metric does not necessarily imply similar performance in another; in some cases, the metrics may even indicate opposite behavior. For instance, both higher correlation and larger RMSEs are observed in southern Zambia and Angola and Lake Victoria, reflecting different controls on these metrics.

Figure 4Correlation between non-seasonal reanalysis TWS and ensemble mean TWS forecasts of all NMME models at three lead times, and GRACE/FO observations for Noah-MP (top row) and CLSM (bottom row). Domain average correlations are shown in inset text.
In CAR and South Sudan, TWS hindcasts from both models show near and below zero correlations with GRACE/FO data likely due to the opposite trends between reanalysis TWS and GRACE/FO data in that region (Supplement Fig. S2). The negative trends in GRACE/FO data (Supplement Fig. S2c) may reflect the impacts of deforestation, which alter the partitioning of precipitation with increases in surface runoff and decreases in soil infiltration. Although deforestation can also reduce ET and thus increase TWS, this effect is likely minor because of reduced soil infiltration. According to the Global Forest Watch, CAR and South Sudan lost more than 20 % of its primary forests during 2000–2024. Since neither Noah-MP nor CLSM accounts for land cover change, they simulated increases in TWS (Supplement Fig. S2a, b) in response to increases in annual precipitation in that region (Supplement Fig. S1c). Because the reanalysis is used as initial conditions for each forecast issued, inaccuracy in long-term trends inevitably affected climatology and the associated anomalies.
RMSEs of TWS forecasts by individual NMME models exhibit contrasting behaviors with respect to lead time between Noah-MP and CLSM (Fig. 5a, b). RMSEs of TWS forecasts increase with lead time for Noah-MP, reflecting growing uncertainty in meteorological forecasts. In contrast, RMSEs of CLSM forecasts decrease with lead time, except for forecasts driven by GEOSv2. As shown in previous studies (e.g., Li et al., 2019b), CLSM has the tendency to overestimate TWS dynamic ranges. Because interannual variability of NMME precipitation forecasts generally decreases with increasing lead time (Supplement Fig. S3), this overestimation is progressively damped, leading to reduced RMSEs at longer lead times. On the other hand, GEOSv2 precipitation exhibits substantially larger interannual variability than other NMME products, which remains strong across all lead times and leads to slightly increasing RMSEs with lead times (Supplement Fig. S3).
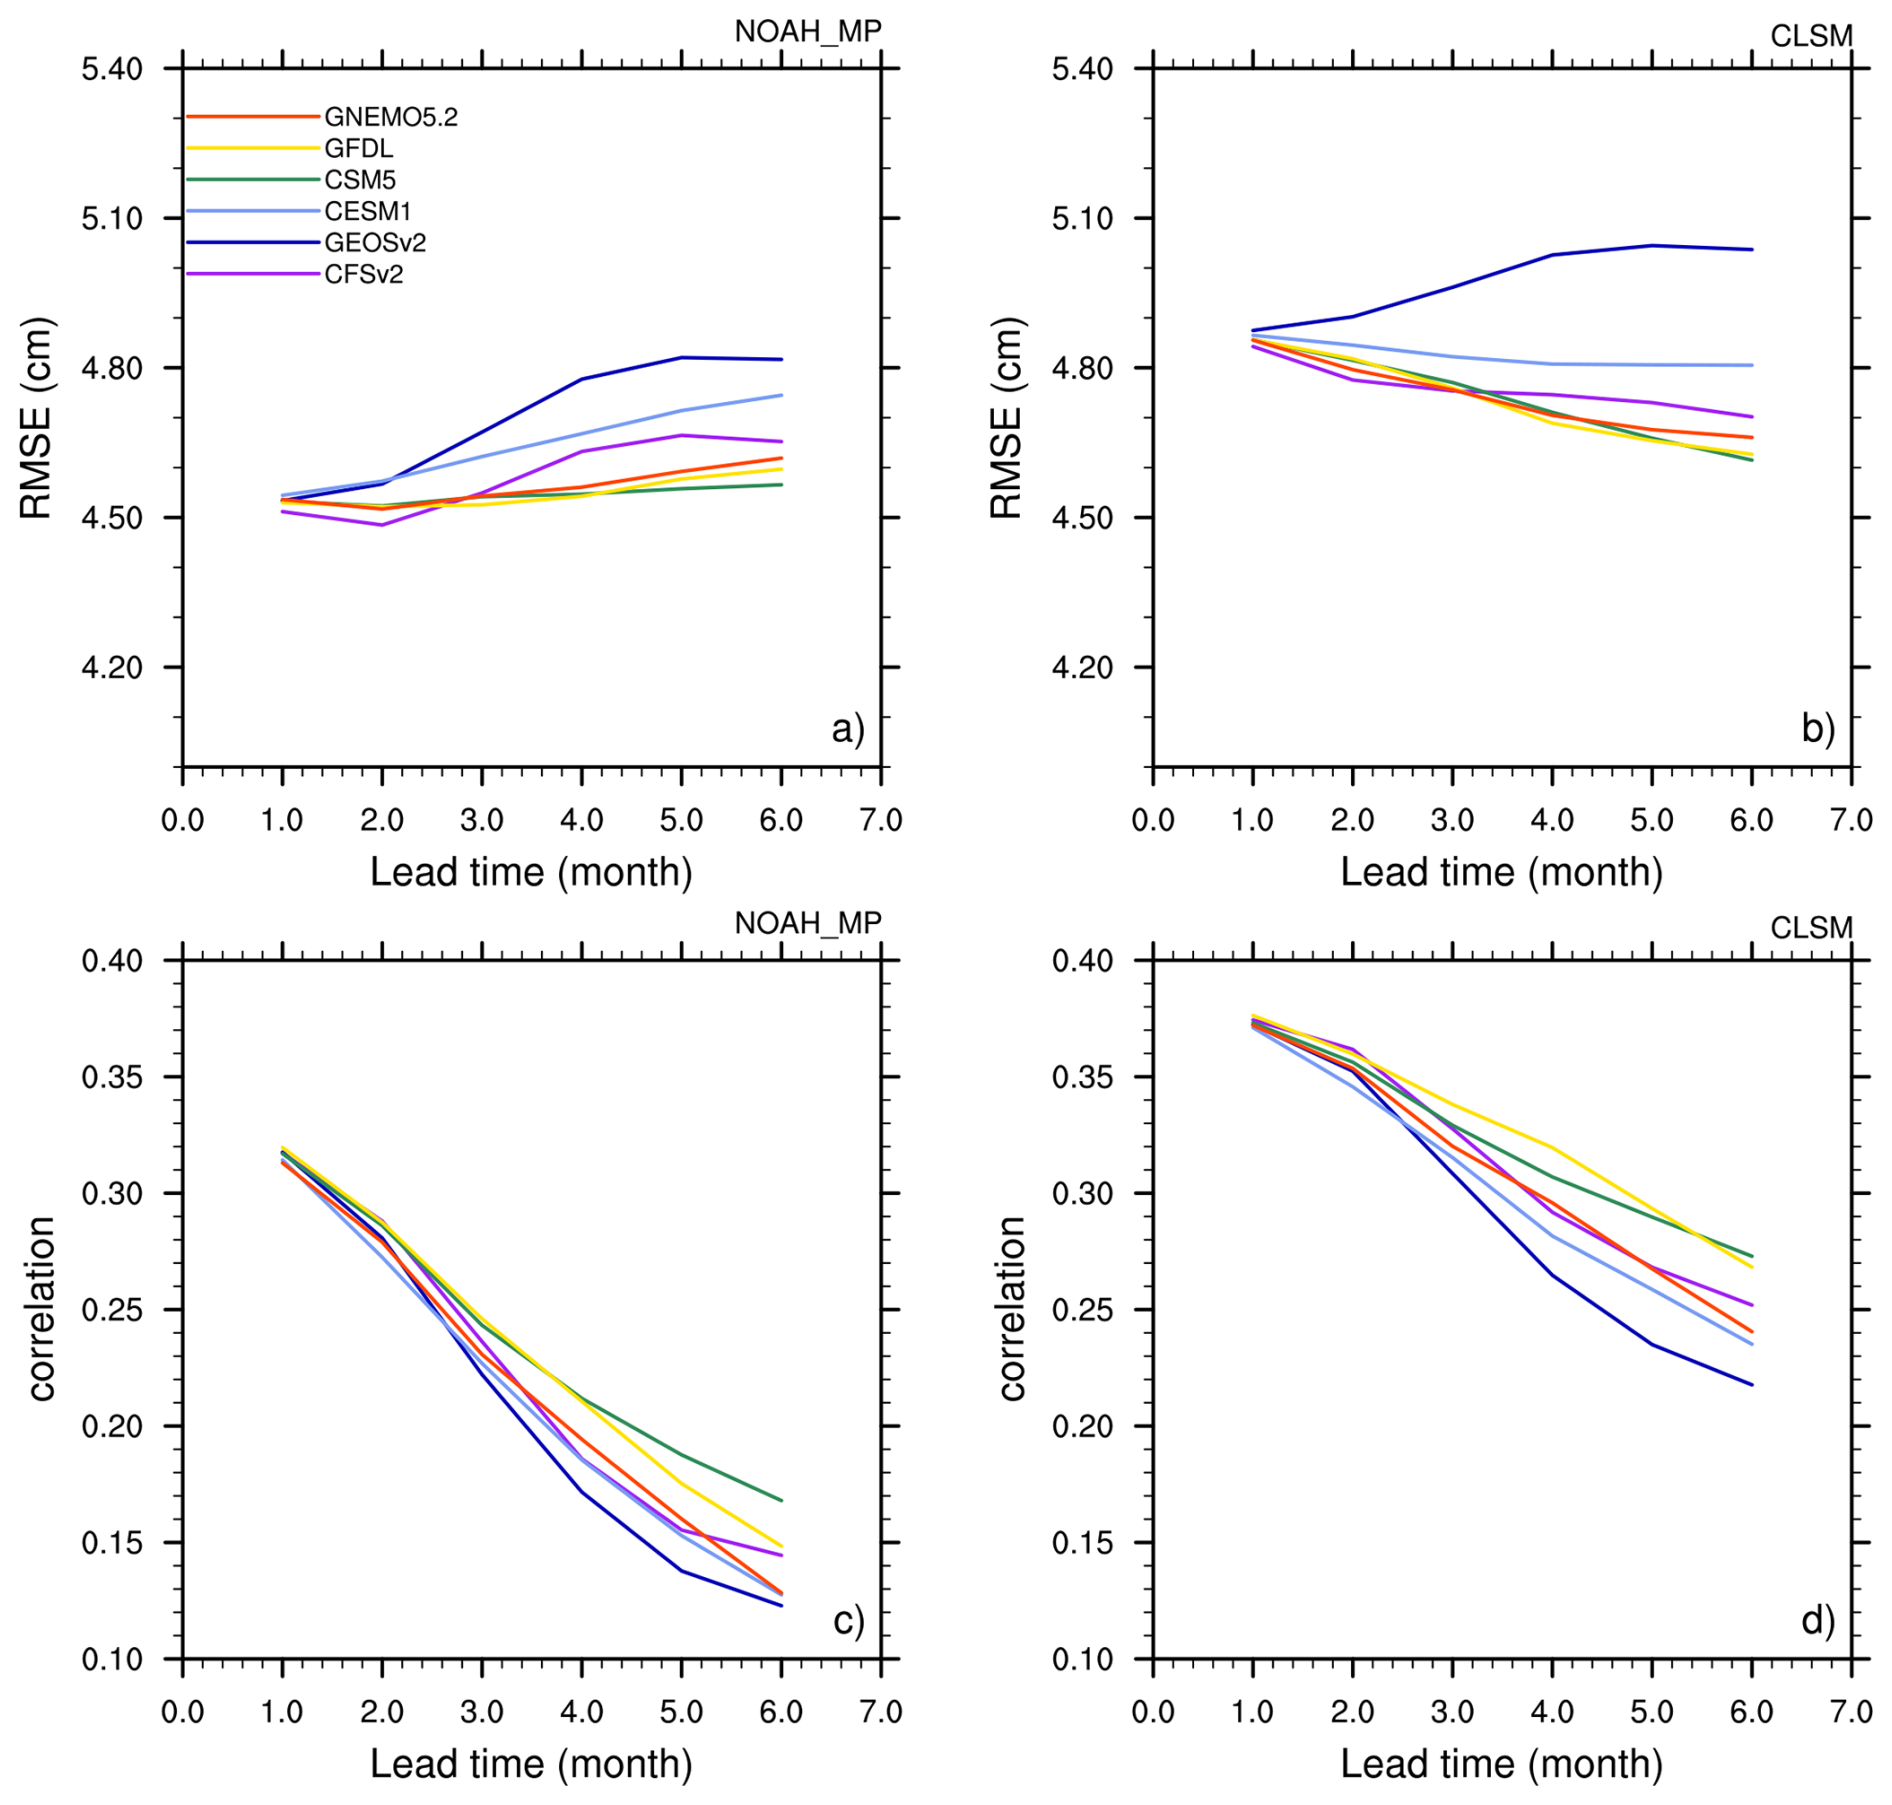
Figure 5Domain-averaged RMSEs (top row) and correlations (bottom row) of ensemble mean TWS forecasts of individual NMME models relative to GRACE/FO data for Noah-MP (left column) and CLSM (right column) as a function of lead time.
As observed in all-model ensemble mean, correlations between ensemble mean TWS hindcasts of individual NMME models and GRACE/FO data decrease with increasing lead time (Fig. 5c, d). In addition, CLSM hindcasts for each NMME model exhibit higher correlation than those of Noah-MP at all lead times.
Among all NMME models, GFDL and CSM5, which exhibit the lowest precipitation interannual variability (Supplement Fig. S3), produced the most accurate forecasts, with the lowest RMSEs and the highest correlations, whereas GEOSv2, with the highest interannual variability, produced the least accurate TWS forecasts, yielding the largest RMSEs and lowest correlations for both Noah-MP and CLSM. In addition to strong interannual variability, previous studies showed that GEOS precipitation forecasts are less consistent within its ensemble members than other NMME models (Becker et al., 2014), indicating larger uncertainty in GEOS precipitation forecasts.
While RMSEs and correlation quantify the magnitude of discrepancies and the temporal consistency between two time series, they do not directly assess the ability to accurately forecast wetter and drier conditions. Therefore, we use ROC scores, which measure the hit rate relative to the false-alarm rate, to evaluate the performance of Noah-MP and CLSM in predicting terciles, corresponding to below-normal, near-normal and above-normal conditions. ROC scores for the lower tercile hindcast from the two models exhibit similar spatial patterns but differ in magnitude (Fig. 6). Both models perform well in the Sahel (minus the northern edge), the Horn of Africa, and the eastern part of southern Africa. Both models scored low ROC values in CAR and South Sudan, consistent with correlations relative to GRACE/FO. CLSM shows more skills overall, achieving >0.6 ROC scores over >50 % of the domain across all lead times. Note that the 0.6 threshold for predictive skill is based on the guideline by the Met Office (Met Office, 2025). In contrast, Noah-MP forecasts exhibit lower ROC scores, on average, and the scores decrease quickly with increases in lead time, with only 35 % of the domain achieving >0.6 ROC scores at the 6-month lead time. The decrease is particularly noticeable in central Africa where annual precipitation is the largest (Supplement Fig. S1a)
ROC scores for the upper tercile forecast show similar spatial patterns but with slightly higher values than those of lower terciles (Supplement Fig. S4). This difference likely reflects the uneven occurrences of wet and dry anomalies over the relatively short study period (2003–2020). For both upper and lower terciles, the spatial patterns of ROC scores including their changes with lead time show broad agreement with those of correlations, suggesting a close relationship between the two metrices.
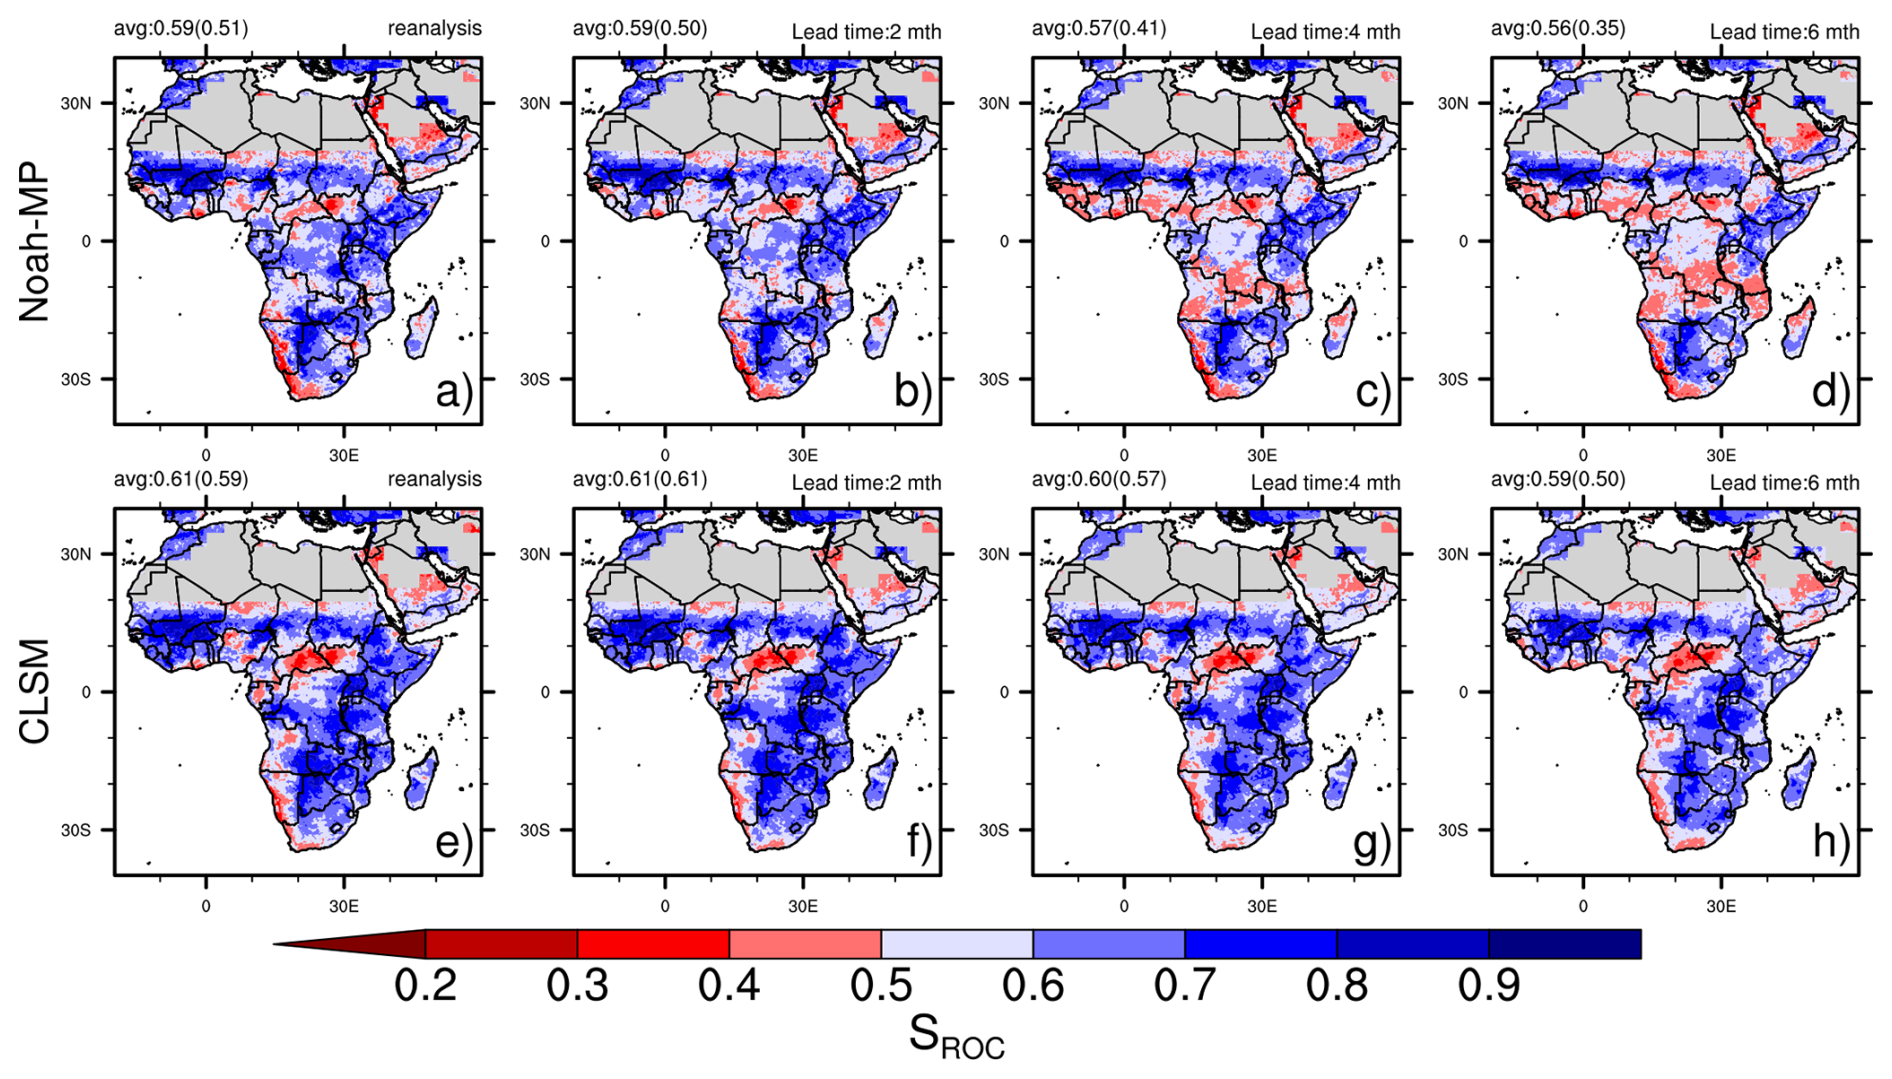
Figure 6ROC scores (Sroc) of lower terciles of ensemble mean TWS forecasts of all NMME models by Noah-MP (top row) and CLSM (bottom row) with respect to GRACE/FO data. The upper left text indicates average Sroc and the fraction of area (in parentheses) with Sroc>0.6.
3.3 Evaluation of TWS hindcasts using reanalysis
Since TWS hindcasts differ from the reanalysis only in the meteorological forcing data used, evaluating TWS forecasts against the reanalysis helps isolate impacts of NMME hindcasts from those of model physics. RMSEs relative to the reanalysis exhibit similar spatial patterns between the two models (Supplement Fig. S5), with larger errors in wetter central Africa and smaller errors in drier northern and southern regions, highlighting mean annual precipitation and associated uncertainty as a main driver of TWS forecast errors when uncertainty in model physics is masked. As expected, these RMSEs are substantially lower than those relative to GRACE/FO and increase steadily with increasing lead time, reflecting growing discrepancies between NMME precipitation hindcasts and CHIRPS precipitation estimates.
Correlations evaluated relative to the reanalysis reveal contrasting patterns between the two models (Supplement Fig. S6). For Noah-MP, correlations relative to the reanalysis exhibit spatial patterns similar to those obtained using GRACE/FO as reference, with higher correlations in the drier northern and southern regions and lower correlations in central Africa. In contrast, when evaluated against the reanalysis, CLSM yields stronger correlations in central Africa through the 1–6-month lead times, in sharp contrast to the low skill inferred when GRACE/FO is used as reference. This region of strong correlations coincides with that of strong long-term TWS trends in CLSM (Supplement Fig. S2b) which, as discussed in Sect. 3.4, may induce strong persistence in simulated TWS and hence strong correlation. For both models, domain-averaged correlations relative to the reanalysis are more than twice those relative to GRACE/FO in most cases, underscoring substantial uncertainty in model physics that limit TWS forecast skill and the need to use independent data for evaluation.
3.4 Persistence of TWS processes
Persistence refers to the tendency of a process or variable in retaining its past state (wet or dry conditions) and has been known to help enhance hydrological prediction skill. To examine persistence, we computed the autocorrelation of TWS time series from the two re-analyses and GRACE/FO data at three lags (Fig. 7, top three rows). Autocorrelations for the two models exhibit distinct spatial patterns. Noah-MP simulates higher autocorrelation, suggesting stronger persistence, in the drier northern and southern Africa, whereas CLSM reanalysis exhibits higher autocorrelations across the wetter central Africa.
GRACE/FO observations exhibit different patterns of persistence with strong persistence in the interior Sahel, southern Africa and the large swath area encompassing Lake Victoria (Fig. 7, third row) where they exhibit strong long-term trends (Supplement Fig. S2). On average, GRACE/FO data shows lower persistence at the 2-month lag, but substantially higher autocorrelation at 4- and 6-month lags than the reanalysis. The area with >0.37 autocorrelation (representing the e-folding time) in GRACE/FO data remains high, above 75 % even at the 6-month lag. These results suggest that persistence simulated by the model may not represent real-world persistence and thus may not help with enhancing forecast skill.
Differences between simulated and GRACE/FO TWS persistence exhibit spatial patterns similar to those of mean annual precipitation, reflecting the strong influence of mean annual precipitation and associated uncertainty on persistence (Fig. 7, bottom two rows). However, the two models often exhibit contrasting performances. Compared to GRACE/FO, Noah-MP underestimates persistence in central Africa and overestimates it elsewhere. In contrast, CLSM overestimates persistence in central Africa while underestimating it in other regions, with the discrepancy steadily increasing with lags. In wetter central Africa, strong interannual variability in CLSM TWS helps retain past wetness conditions and contributes to its strong persistence. On the other hand, the underestimation of persistence by CLSM in drier regions may be linked to the model's tendency to overestimate ET, which acts as continuous disruption to soil moisture states, thus leading to low persistence. These results reflect strong impacts of model physics, especially their responses to precipitation variability, on simulated TWS variability. For both models, discrepancies between the reanalysis and GRACE/FO increase with lag (Fig. 7, bottom two rows), reflecting the accumulation of differences from past states.
The spatial patterns of persistence resemble those of correlations using the reanalysis as the reference (Supplement Fig. S6), suggesting that persistence is a useful indicator of forecast skill primarily when uncertainty in model physics is minimal, as in the case of using the reanalysis as the reference. Moreover, the spatial patterns of persistence align well with those of correlations and ROC scores, relative to GRACE/FO, only for Noah-MP, suggesting that short-term persistence (1–6 months) may not be reliable indication of forecast skill for models that simulate strong interannual variability such as CLSM.
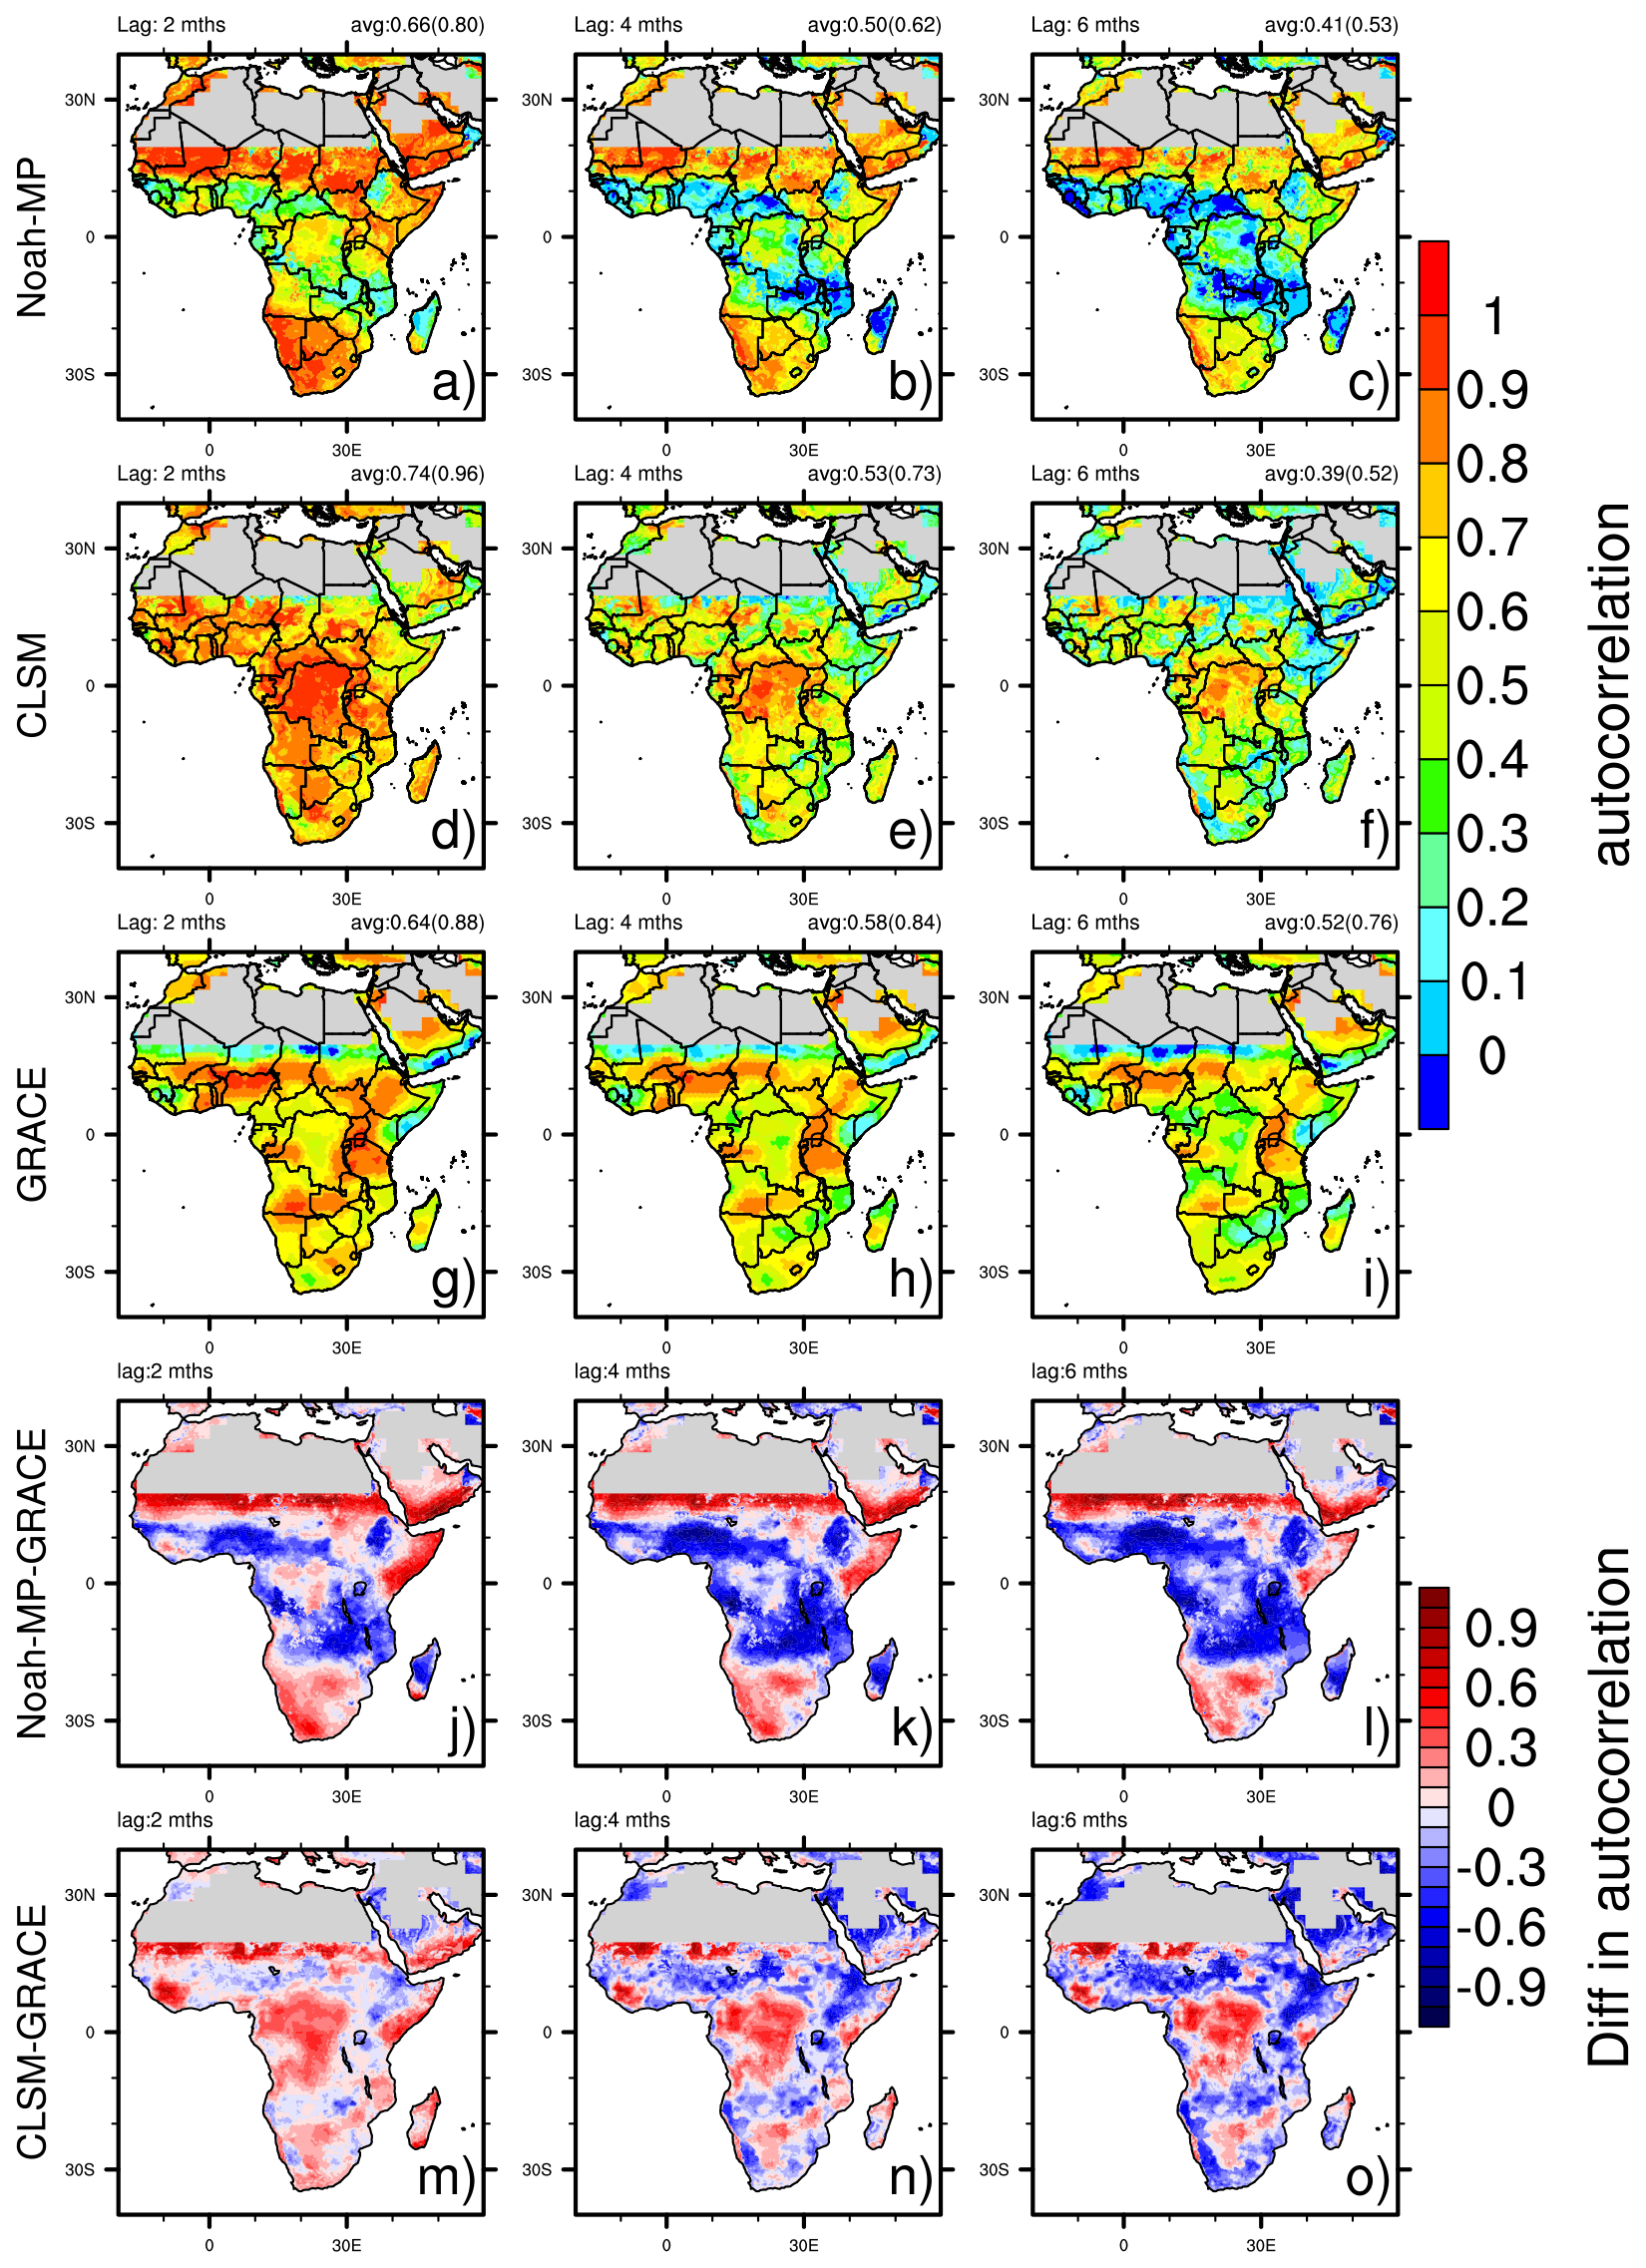
Figure 7Autocorrelation of Noah-MP and CLSM reanalysis TWS (top two rows), and GRACE/FO data (third row) at three lags. The fourth and fifth rows show differences in autocorrelations between the reanalysis and GRACE/FO data. Upper right text in the top three rows shows average autocorrelation and fraction of area with autocorrelation >0.37 (in parentheses).
To further investigate contributors of TWS persistence, we examine domain averaged autocorrelation of soil moisture of the unsaturated soil and groundwater storage from the reanalysis (Fig. 8). Noah-MP simulates weak groundwater persistence which, at the 1- and 2-month lags, is even lower than that of soil moisture and remains low at longer lags. In contrast, CLSM simulates stronger groundwater persistence than soil moisture, with groundwater persistence contributing nearly all TWS persistence. Compared to GRACE/FO observations, reanalysis TWS from both models exhibits a slower decline in persistence at 0–2-month lags, but a faster decline afterwards.
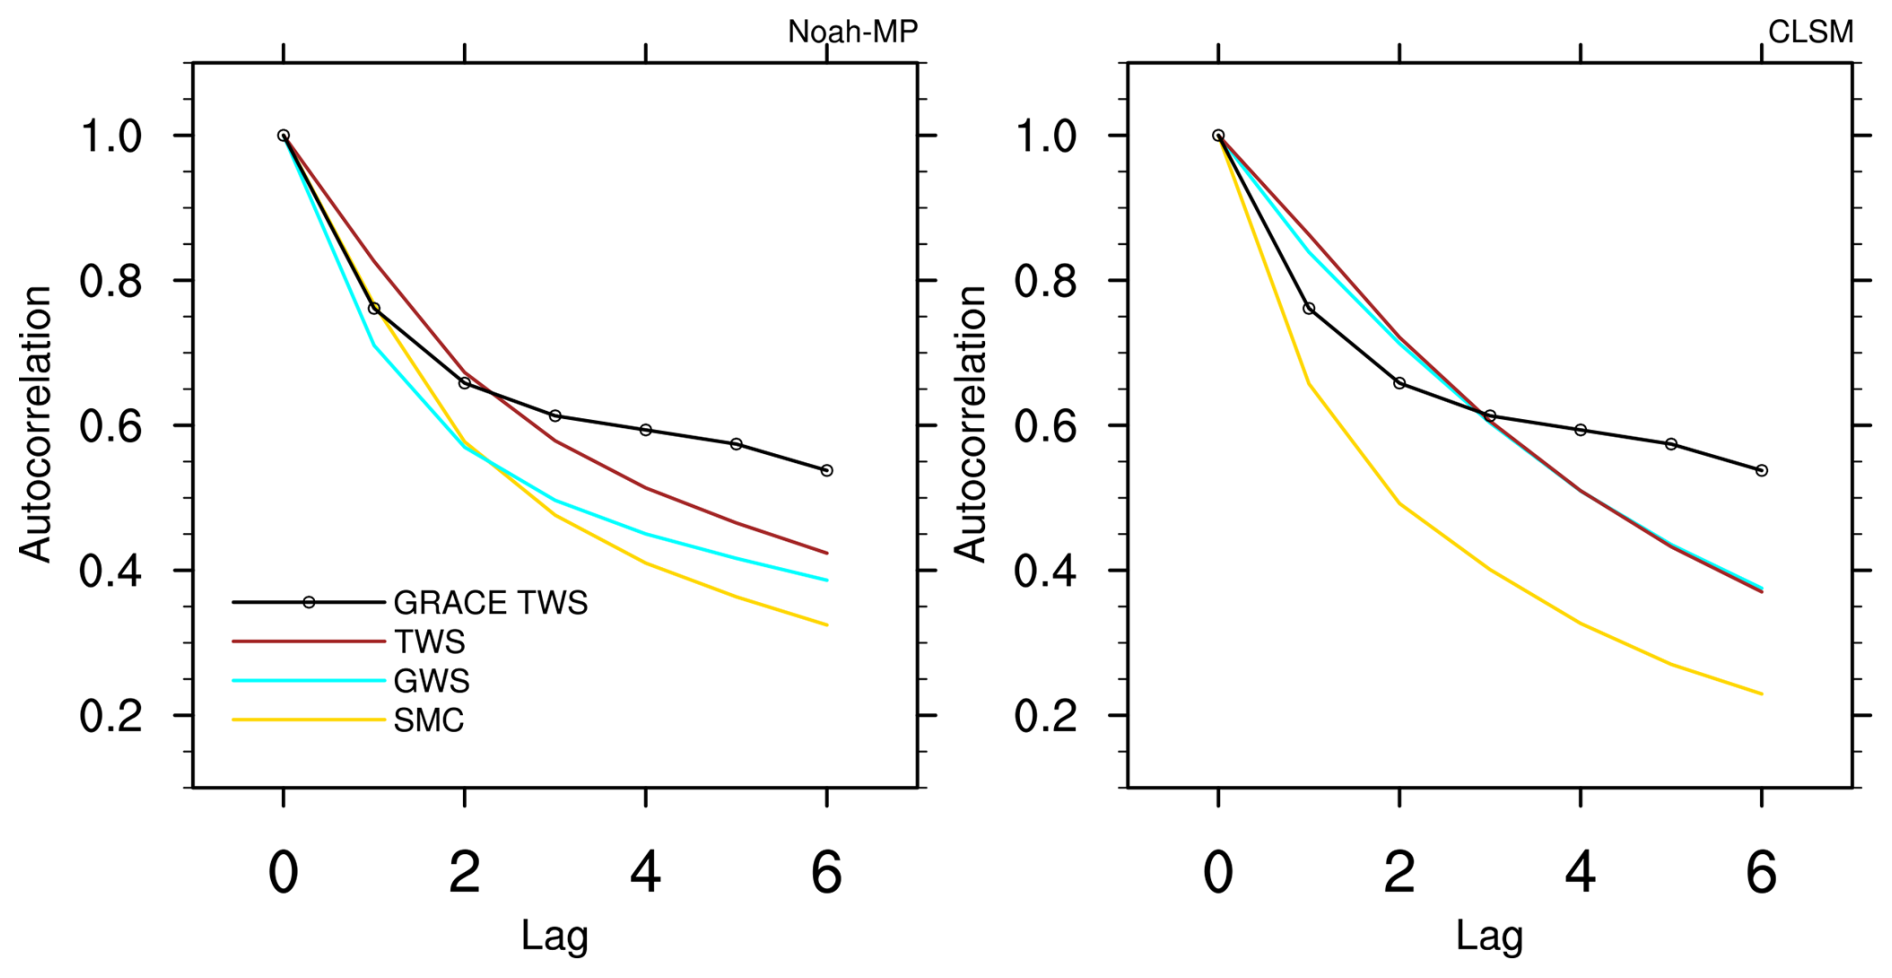
Figure 8Domain-averaged autocorrelation for soil moisture of the unsaturated soil, groundwater storage and TWS as a function of lags (in months).
3.5 TWS forecast percentiles: a case study
To demonstrate the value of TWS forecasts, we examine TWS percentile maps derived using Eq. (1) for hindcasts initialized in December 2015 and GRACE/FO data (Fig. 9). Both Noah-MP and CLSM forecasts identified pronounced droughts in southern Africa and parts of the southwestern coastal region including Ghana and Gabon, and wet conditions in eastern Africa and the northwestern Africa including Mauritania, Mali and Senegal. The southern Africa drought was attributed to the 2015–2016 El Niño event which is known to bring dry conditions to southern Africa (Mason and Goddard, 2001). The spatial extent and severity of drought forecasted for March 2016 are broadly consistent with the FEWS NET assessment released in March 2016, based on cumulative precipitation analysis (FEWS NET, 2016). The drought caused up to 66 % crop production declines in some areas and affected at least 18 million people (Ainembabazi et al., 2018), underscoring the potential value of TWS forecasts for providing early warnings for agricultural failures and food insecurity. The El Niño also brought wet conditions in eastern Africa, with relentless rainfalls triggering landslides and causing considerable human fatality and property damage (Bishumba, 2016). Sustained wet conditions in the northwestern Africa may have contributed to severe floods in Mali and Burkina Faso in July 2016 (FloodList, 2016). Noah-MP and CLSM generally agree on regional placement of extreme events, but they may differ on the extent and severity estimate. For instance, CLSM identified more severe drought areas in southern Africa than Noah-MP.
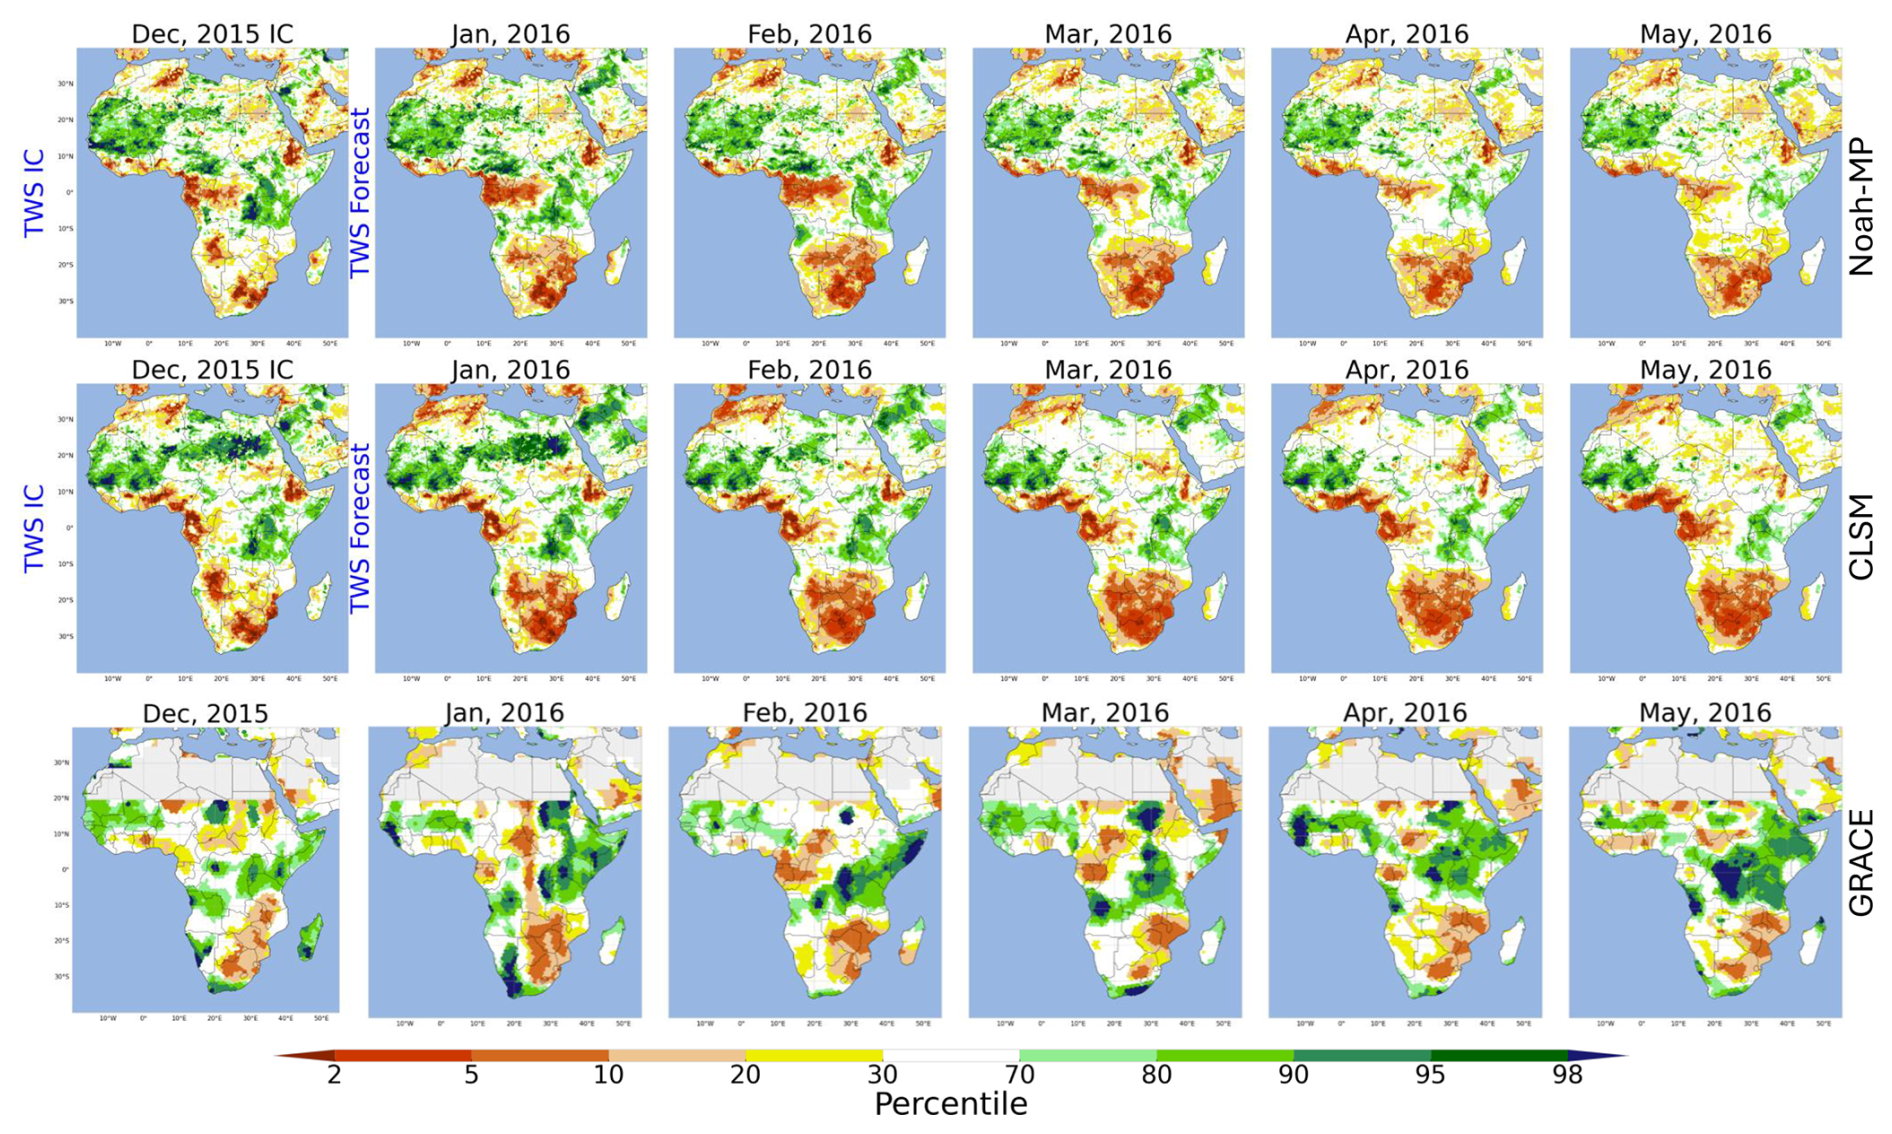
Figure 9TWS percentile maps derived from Noah-MP and CLSM ensemble mean TWS forecasts (top two rows) of all NMME models, initialized in December 2015, and corresponding maps for GRACE/FO data (bottom row).
GRACE/FO TWS observations show broad agreement with TWS hindcasts, showing dry anomalies in southeastern and southwestern Africa and wet anomalies in eastern Africa and the western Sahel, but may differ in severity, extent and temporal evolvement of these extreme conditions. For instance, while both models suggest wet conditions in eastern Africa weakened from January to May of 2016, GRACE/FO indicates they intensified and spread to larger areas. As discussed earlier, interannual variability of NMME precipitation decreases with lead time and thus may result in less severe TWS anomalies forecasted for long lead times. Compared to GRACE/FO, Noah-MP more accurately captured the extent of droughts in southeastern Africa, while CLSM performed better in forecasting wet conditions in eastern Africa at longer lead times. Note the north-south dry pattern in GRACE/FO for January 2016 is the well-known de-aliasing error associated with limited observations, which can occur even after the regularization procedures applied to CSR GRACE/FO data (Save et al., 2016).
Surface and root zone soil moisture exhibit dry and wet anomalies comparable to those of TWS in the first two months but diverge in later months, reflecting their more rapid responses to changes in meteorological conditions (Supplement Fig. S7). This divergence is especially evident for Noah-MP surface moisture, which indicates only moderately dry conditions (10–20th percentiles) in southern Africa by May 2016, compared to large areas of more severe droughts (5–10th percentiles) suggested by Noah-MP TWS. CLSM surface soil moisture and root zone soil moisture indicate more persistent anomalies conditions like CLSM TWS, consistent with the tighter coupling among CLSM water storage components. These results further underscore the strong impact of model physics and the added value of TWS forecasts for predicting hydrological extremes.
We evaluated terrestrial water storage (TWS) forecasts produced by the FLDAS Hydrological Forecasting System (FLDAS-Forecast) over Africa using GRACE/FO TWS observations as an independent benchmark. Statistical analyses showed that the Catchment land surface model (CLSM) exhibits considerable S2S predictive skill, with ROC scores for tercile forecasts exceeding 0.6 (the threshold for predictive skill) over more than half of the study domain across 1- to 6-month lead times. CLSM forecasts also correlate more strongly with GRACE/FO data than those of Noah-MP, especially at longer lead times. In contrast, Noah-MP forecasts generally show lower skill than CLSM, especially in central Africa where the skill declines quickly with increases in lead times.
The superior performance of CLSM is attributed to its ability to simulate strong groundwater dynamics across seasonal to interannual scales. This capability enables CLSM to better capture the interannual variability in TWS observed by GRACE/FO, thereby producing more accurate initial conditions. Enhanced interannual variability also increases persistence in CLSM TWS estimates, allowing the benefit of more accurate initial conditions to propagate to longer forecast lead times. Interannual variability is important for S2S forecasts because TWS, as a long memory process, retains information about past wet and dry conditions over months. Moreover, long-term variability directly affects the climatology used for determining TWS anomalies, thus affecting forecast skill.
Consistent with this long memory behavior, TWS forecasts exhibit strong sensitivity to interannual variability of precipitation forecasts, which varies substantially across NMME models. TWS forecasts driven by precipitation forecasts with larger interannual variability (e.g., GEOSv2) show lower correlation and higher RMSEs with respect to GRACE/FO observations, whereas those forced by precipitation forecasts with lower interannual variability (e.g., GFDL and CSM5) yield more accurate TWS predictions. TWS forecasts also respond differently to changs in precipitation forecasts across lead times. NMME precipitation forecasts generally show decreasing interannual variability with increasing lead time, likely reflecting reduced forecast skill at long leads when prediction reverts toward climatology (Zhang et al., 2021). This decrease leads to contrasting model behaviors, with CLSM TWS forecasts showing reduced RMSEs with increases in lead time, whereas Noah-MP forecasts exhibit increasing RMSEs. These results underscore not only the importance of improving S2S precipitation forecasts but also the need to better understand how land surface models filter and propagate precipitation variability.
Autocorrelation analysis further reveals differences in how the two models represent TWS processes. CLSM simulates much stronger persistence in groundwater than in soil moisture, owing to its two-way interactions between the unsaturated zone and the aquifer. This coupling enhances groundwater sensitivity to climate variability and persistence that supports extended forecast skill. In contrast, Noah-MP produces similar persistence in groundwater and soil moisture, reflecting its weak representation of groundwater upward movement, which limits groundwater responses to droughts and results in reduced temporal variability. Additional factors such as overestimation of surface runoff may further limit groundwater dynamics by reducing infiltration and groundwater recharge. Importantly, while persistence can contribute to predictability, our analyses show that simulated persistence does not always agree with GRACE/FO data, especially in regions with strong trends, and therefore may overstate forecast skill. In addition, persistence quantified using short-lag (1–6 months) autocorrelations may be a poor indicator of predictability when TWS exhibits substantial interannual variability. These findings underscore the inherent challenges of accurately simulating persistence in long-memory processes, where uncertainties in input data and model physics accumulate over time.
Together, these findings emphasize the critical role of realistically representing groundwater variability in improving S2S TWS forecasts. For models such as Noah-MP, where groundwater dynamics are primarily driven by recharge from the overlying soil layers, improved simulation of capillary rise, the upward groundwater flux, is particularly critical for simulating realistic groundwater responses to climate variability. More broadly, because TWS is a long-memory process that integrates the cumulative impacts of precipitation, ET and human interventions, forecast skill can be further enhanced by improving simulation of both climate-driven long-term variability and anthropogenic trends.
Evaluation relative to the reanalysis yielded much smaller RMSEs and higher correlation than evaluation relative to GRACE/FO, underscoring substantial uncertainties in model physics and the importance of using independent observations as the benchmark. GRACE/FO data are sensitive to climate variability, climate change and anthropogenic effects, which are often poorly represented or inconsistently treated in reanalysis systems. While this study provides insight into the impact of groundwater representation on TWS predictability, future work should focus on improving groundwater simulation by leveraging more than two decades of GRACE/FO observations to advance S2S hydrological predictability.
GRACE/FO data assimilation has been shown to be an effective means to constrain the temporal variability of groundwater and TWS, leading to more accurate estimates of TWS anomalies (Li et al., 2019b). However, higher computational costs and a 2–4-month data latency limit its application to reanalysis rather than near-real time forecasting. Consequently, even when GRACE/FO data assimilation improves initial conditions, deficiencies in model physics, such as weak groundwater persistence as seen in Noah-MP, can prevent these improvements from translating into skill at long lead times. However, quantifying the influence of improved initial conditions on TWS forecast skill remains an important area for future research. In addition, studies assessing the potential benefits of reduced GRACE/FO data latency could help motivate efforts to deliver more timely GRACE/FO observations for operational forecasting.
Finally, separating surface water signals from GRACE/FO data can improve diagnosis of modeled TWS processes in regions dominated by large surface water bodies. However, due to the spatial smoothing inherent in GRACE/FO measurements, surface water signals are distributed over broad surrounding areas, rendering the simple grid-scale mass balance calculations inadequate. Specialized modeling approaches are required to properly isolate surface water contributions (Deggim et al., 2021; Sharifi et al., 2025). Because such techniques are not yet widely available, there is a need for surface water datasets that are harmonized with GRACE/FO observations and accompanied by uncertainty estimates. Beyond temporally consistent local observations of surface water elevation and extent, this effort requires improved modeling of surface water and groundwater interactions, processes currently absent in most hydrological models but can substantially influence TWS variability, particularly in wet climates (Bierkens and Wada, 2019).
FLDAS forecast data are available at https://ldas.gsfc.nasa.gov/fldas/models/forecast (last access: 17 February 2026).
The supplement related to this article is available online at https://doi.org/10.5194/hess-30-1097-2026-supplement.
BL: conceptualization, formal analysis, methodology, investigation, visualization, writing (original draft preparation). AH: Data curation, software, writing (review and editing). AM: project administration, supervision, writing (review and editing). KS: project administration, writing (review and editing). SS: Funding acquisition, supervision, writing (review and editing) WA: writing (review and editing).
At least one of the (co-)authors is a member of the editorial board of Hydrology and Earth System Sciences. The peer-review process was guided by an independent editor, and the authors also have no other competing interests to declare.
The opinions expressed in this paper are those of the authors and do not necessarily reflect the views of the U.S. agencies.
Publisher's note: Copernicus Publications remains neutral with regard to jurisdictional claims made in the text, published maps, institutional affiliations, or any other geographical representation in this paper. The authors bear the ultimate responsibility for providing appropriate place names. Views expressed in the text are those of the authors and do not necessarily reflect the views of the publisher.
This work was supported by grants from NASA and the Bureau of Humanitarian Assistance at the U.S. Agency for International Development.
This research has been supported by NASA (grant nos. 80NSSC23K0559 and 80NSSC23M0032) and the U.S. Agency for International Development (grant no. PAPA BHA22H00005).
This paper was edited by Harrie-Jan Hendricks Franssen and reviewed by three anonymous referees.
Ainembabazi, J. H., Rusike, J., and Keizire, B: The 2015-16 El Niño-induced drought crisis in Southern Africa: Lessons from Historical Data and Policy Implications, https://agra.org/wp-content/uploads/2020/08/AGRA-drought-crisis-in-Southern-Africa_v2-.pdf (last access: 25 August 2025), 2018.
Arsenault, K.R., Shukla,S., Hazra, A., Getirana, A., McNally, A., Kumar, S., Koster, R. D., Peters-Lidard, C. D., Zaitchik, B. F., Badr, H., Jung, H. C., Narapusetty, B., Navari, M., Wang, S., Mocko, D. M., Funk, C., Harrison, L., Husak, G. J., Adoum, A., Galu, G., Magadzire, T., Roningen, J., Shaw, M., Eylander, J., Bergaoui, K., McDonnell, R. A., and Verdin, J. P.: The NASA hydrological forecast system for food and water security applications, Bull. Am. Meteorol. Soc., https://doi.org/10.1175/BAMS-D-18-0264.1, 2020.
Ascott, M. J., Macdonald, D. M. J., Black, E., Verhoef, A., Nakohoun, P., Tirogo, J., Sandwidi, W. J. P., Bliefernicht, J., Sorensen, J. P. R., and Bossa, A.: In situ observations and lumped parameter model reconstructions reveal intra-annual to multidecadal variability in groundwater levels in sub-Saharan Africa, Water Resources Research, 56, e2020WR028056, https://doi.org/10.1029/2020WR028056, 2020.
Becker, E., H. v. den Dool, and Q. Zhang: Predictability and Forecast Skill in NMME, J. Climate, 27, 5891–5906, https://doi.org/10.1175/JCLI-D-13-00597.1, 2014.
Bierkens, M. F. and Wada, Y.: Non-renewable groundwater use and groundwater depletion: a review, Environ. Res. Lett., 14, 063002, https://doi.org/10.1088/1748-9326/ab1a5f, 2019.
Bishumba, N.: El Nino-induced floods ravage East Africa, https://www.dw.com/en/el-nino-induced-floods-ravage-east-africa/a-19245333 (last access: 17 February 2026), 2016.
Boergens, E., Güntner, A., Sips, M., Schwatke, C., and Dobslaw, H.: Interannual variations of terrestrial water storage in the East African Rift region, Hydrol. Earth Syst. Sci., 28, 4733–4754, https://doi.org/10.5194/hess-28-4733-2024, 2024.
Borovikov, A., Cullather, R., Kovach, R., Marshak, J., Vernieres, G., Vikhliaev, Y., Zhao, B., and Li, Z.: GEOS-5 seasonal forecast system, Clim. Dyn., 53, 7335–7361, https://doi.org/10.1007/s00382-017-3835-2, 2019.
Bonsor, H. C., Shamsudduha, M., Marchant, B. P., MacDonald, A. M., and Taylor, R. G.: Seasonal and Decadal Groundwater Changes in African Sedimentary Aquifers Estimated Using GRACE Products and LSMs, Remote Sens., 10, 904, https://doi.org/10.3390/rs10060904, 2018.
Cook, B. I, Slinski, K., Peters-Lidard, C., McNally, A., Arsenault, K., and Hazra, A.: The efficacy of seasonal terrestrial water storage forecasts for predicting vegetation activity over Africa, J. Hydrometeorol., 22, 3121–3137, https://doi.org/10.1175/JHM-D-21-0046.1, 2021.
Correia, C. D. N., Fonseca, A., Amraoui, M., Pereira, C. A., and Santos, J. A.: Long-Term Climate Trends in Southern Angola and Possible Implications in Agriculture, Climate, 13, 173, https://doi.org/10.3390/cli13090173, 2025.
Deggim, S., Eicker, A., Schawohl, L., Gerdener, H., Schulze, K., Engels, O., Kusche, J., Saraswati, A. T., van Dam, T., Ellenbeck, L., Dettmering, D., Schwatke, C., Mayr, S., Klein, I., and Longuevergne, L.: RECOG RL01: correcting GRACE total water storage estimates for global lakes/reservoirs and earthquakes, Earth Syst. Sci. Data, 13, 2227–2244, https://doi.org/10.5194/essd-13-2227-2021, 2021.
Döll, P., Schmied, H. M., Schuh, C., Portmann, F. T., and Eicker, A.: Global-scale assessment of groundwater depletion and related groundwater abstractions: Combining hydrological modeling with information from well observations and GRACE satellites, Water Resour. Res., 50, 5698–5720, https://doi.org/10.1002/2014WR015595, 2014.
Eltahir, E. A. B. and Yeh P. J.-F.: On the asymmetric response of aquifer water level to floods and droughts in Illinois, Water Resour. Res., 35, 1199–1217, https://doi.org/10.1029/1998WR900071, 1999.
Favreau, G., Cappelaere, B., Massuel, S., Leblanc, M., Boucher,M., Boulain, N., and Leduc, C.: Land clearing, climate variability, and water resources increase in semiarid southwest Niger: A review, Water Resour. Res., 45, W00A16, https://doi.org/10.1029/2007WR006785, 2009.
FloodList: West Africa – Deadly Floods in Mali and Burkina Faso, https://floodlist.com/africa/west-africa-floods-nigeria-mali-burkina-faso-august-2016, (last access: 11 August 2025), 2016.
FEWS NET: Southern Africa: Special Report Illustrating the extent and severity of the 2015-16 drought, https://reliefweb.int/report/south-africa/southern-africa-special-report-illustrating-extent-and-severity-2015-16-drought (last access: 19 August 2025), 2016.
Frappart, F.: Groundwater Storage Changes in the Major North African Transboundary Aquifer Systems during the GRACE Era (2003–2016), Water, 2669, https://doi.org/10.3390/w12102669, 2020.
Funk, C., Peterson, P., Landsfeld, M., Shukla, S., Husak, G., Harrison, L., and Michaelsen, J.: The climate hazards infrared precipitation with stations – a new environmental record for monitoring extremes, Sci. Data, 2, 150066, https://doi.org/10.1038/sdata.2015.66, 2015.
Gelaro, R., McCarty, W., Suárez, M. J., Todling, R., Molod, A., Takacs, L., Randles, C. A., Darmenov, A., Bosilovich, M. G., Reichle, R., Wargan, K., Coy, L., Cullather, R., Draper, C., Akella, S., Buchard, V., Conaty, A., da Silva, A. M., Gu, W., Kim, G.-K., Koster, R., Lucchesi, R., Merkova, D., Nielsen, J. E., Partyka, G., Pawson, S., Putman, W., Rienecker, M., Schubert, S. D., Sienkiewicz, M., and Zhao, B.: The Modern-Era Retrospective Analysis for Research and Applications, Version 2 (MERRA-2), J. Climate, 30, 5419–5454, https://doi.org/10.1175/JCLI-D-16-0758.1, 2017.
Gossel, W., Ebraheem, A. M., and Wycisk, P.: A very large scale GIS-based groundwater flow model for the Nubian sandstone aquifer in Eastern Sahara (Egypt, northern Sudan and eastern Libya), Hydrogeology Journal, 12, 698–713, https://doi.org/10.1007/s10040-004-0379-4, 2004.
Getirana, A., Kumar, S. V., Girotto, M., and Rodell, M.: Rivers and floodplains as key components of global terrestrial water storage variability, Geophysical Research Letters, 44, 10359–10368, https://doi.org/10.1002/2017GL074684, 2017.
Hazra, A., McNally, A., Slinski, K., Arsenault, K. R., Shukla, S., Getirana, A., Jacob, J. P., Sarmiento, D. P., Peters-Lidard, C., Kumar, S. V., and Koster, R. D.: NASA's NMME-based S2S hydrologic forecast system for food insecurity early warning in southern Africa, J. Hydrology, 617, 129005, https://doi.org/10.1016/j.jhydrol.2022.129005, 2023.
Humphrey, V., Gudmundsson, L., and Seneviratne, S. I.: Assessing Global Water Storage Variability from GRACE: Trends, Seasonal Cycle, Subseasonal Anomalies and Extremes, Surv. Geophys., 37, 357–395, https://doi.org/10.1007/s10712-016-9367-1, 2016.
Jasechko, S., Seybold, H., Perrone, D., Fan, Y., Shamsudduha, M., Taylor, R. G., Fallatah, O., and Kirchner, J. W.: Rapid groundwater decline and some cases of recovery in aquifers globally, Nature, 625, 715–721, https://doi.org/10.1038/s41586-023-06879-8, 2024.
Jensen, L., Eicker, A., Dobslaw, H., Stacke, T., and Humphrey, V.: Long-term wetting and drying trends in land water storage derived from GRACE and CMIP5 models, J. Geophys. Res. Atmos., 124, 9808–9823, https://doi.org/10.1029/2018JD029989, 2019.
Kirtman, B. P., Min, D., Infanti, J. M., Kinter III, J. L., Paolino, D. A., Zhang, Q., van den Dool, H., Saha, S., Pena Mendez, M., Becker, E., Peng, P., Tripp, P., Huang, J., DeWitt, D. G., Tippett, M. K., Barnston, A. G., Li, S., Rosati, A., Schubert, S. D., Rienecker, M., Suarez, M., Li, Z. E., Marshak, J., Lim, Y.-K., Tribbia, J., Pegion, K., Merryfield, W. J., Denis, B., and Wood, E. F.: The North American Multimodel Ensemble: Phase-1 Seasonal-to-Interannual Prediction; Phase-2 toward Developing Intraseasonal Prediction, Bull. Amer. Meteor. Soc., 95, 585–601, https://doi.org/10.1175/BAMS-D-12-00050.1, 2014.
Koster, R. and Suarez, M.: Energy and water balance calculations in the Mosaic LSM, NASA Tech. Memo, NASA, TM-104606, vol. 9, 60 pp., https://gmao.gsfc.nasa.gov/pubs/docs/Koster130.pdf (last access: 17 February 2026), 1996.
Koster, R. D., Suarez, M. J., Ducharne, A., Stieglitz, M., and Kumar, P.: A catchment-based approach to modeling land surface processes in a general circulation model: 1. Model structure, J. Geophys. Res., 105, 24809–24822, https://doi.org/10.1029/2000JD900328, 2000.
Kumar, S., Peters-Lidard, C. D., Tian, Y., Houser, P. R., Geiger, J., Olden, S., Lighty, L., Eastman, J. L., Doty, B., Dirmeyer, P., Adams, J., Mitchell, K., Wood, E. F., and Sheffield, J.: Land information system: An interoperable framework for high resolution land surface modeling, Environmental Modelling & Software, 21, https://doi.org/10.1016/j.envsoft.2005.07.004, 2006.
Landerer, F. W. and Swenson, S. C.: Accuracy of scaled GRACE terrestrial water storage estimates, Water Resour. Res., 48, W04531, https://doi.org/10.1029/2011WR011453, 2012.
Landerer, F. W., Flechtner, F. M., Save, H., Webb, F. H., Bandikova, T., Bertiger, W. I., Bettadpur, S. V., Byun, S. H., Dahle, C., Dobslaw, H., Fahnestock, E., Harvey, N., Kang, Z., Kruizinga, G. L. H., Loomis, B. D., McCullough, C., Murböck, M., Nagel, P., Paik, M., Pie, N., Poole, S., Strekalov, D., Tamisiea, M. E., Wang, F., Watkins, M. M., Wen, H.-Y., Wiese, D. N., and Yuan, D.-N.: Extending the global mass change data record: GRACE Follow-On instrument and science data performance, Geophysical Research Letters, 47, e2020GL088306, https://doi.org/10.1029/2020GL088306, 2020.
Levey, J. R. and Sankarasubramanian, A.: Spatial and Temporal Variation of Subseasonal-to-Seasonal (S2S) Precipitation Reforecast Skill across the CONUS, J. Hydrometeor., 25, 755–770, https://doi.org/10.1175/JHM-D-23-0159.1, 2024.
Li, B. and Rodell, M.: How have hydrological extremes changed over the past 20 years?, Journal of Climate, https://doi.org/10.1175/jcli-d-23-0199.1, 2023.
Li, B., Rodell, M., and Famiglietti, J.: Groundwater variability across temporal and spatial scales in the central and northeastern U.S., Journal of Hydrology, 525, 769–780, https://doi.org/10.1016/j.jhydrol.2015.04.033, 2015.
Li, B., Rodell, M., Sheffield, J. Wood, E., and Sutanudjaja, E.: Long-term, non-anthropogenic groundwater storage changes simulated by three global-scale hydrological models, Scientific Reports, 9, 10746, https://doi.org/10.1038/s41598-019-47219-z, 2019a.
Li, B., Rodell, M., Kumar, S., Beaudoing, H. K., Getirana, A., Zaitchik, B. F., de Goncalves, L. G., Cossetin, C., Bhanja, S., Mukherjee, A., Tian, S., Tangdamrongsub, N., Long, D., Nanteza, J., Lee, J., Policelli, F., Goni, I. B., Daira, D., Bila, M., de Lannoy, G., Mocko, D., Steele-Dunne, S. C., Save, H., and Bettadpur, S.: Global GRACE data assimilation for groundwater and drought monitoring: Advances and challenges, Water Resour. Res., 55, 7564–7586, https://doi.org/10.1029/2018wr024618, 2019b.
Li, B., Rodell, M., Peters-Lidard, C., Erlingis, J., Kumar, S., and Mocko, D.: Groundwater recharge estimated by land surface models: an evaluation in the conterminous U.S, J. Hydrometeor., 22, 499–522, https://doi.org/10.1175/JHM-D-20-0130.1, 2021.
Li B., Rodell, M., and Save, H.: Terrestrial water storage in 2024, Nature Reviews Earth & Environment, 6, 261–263, https://doi.org/10.1038/s43017-025-00659-w, 2025.
Li, F., Kusche, J., Sneeuw, N., Siebert, S., Gerdener, H., Wang, Z., Chao, N., Chen, G., and Tian, K.: Forecasting next year's global land water storage using GRACE data, Geophysical Research Letters, 51, e2024GL109101, https://doi.org/10.1029/2024GL109101, 2024.
Li, F., Springer, A., Kusche, J., Gutknecht, B., and Ewerdwalbesloh, Y.: Reanalysis and Forecasting of Total Water Storage and Hydrological States by Combining Machine Learning With CLM Model Simulations and GRACE Data Assimilation, Water Resources Research, e2024WR037926, https://doi.org/10.1029/2024WR037926, 2025.
Mason, S. J. and Goddard, L.: Probabilistic precipitation anomalies associated with ENSO, Bull. Am. Meteorol. Soc., 82, 619–638, https://doi.org/10.1175/1520-0477(2001)082<0619:PPAAWE>2.3.CO;2, 2001.
Met Office: Relative operating characteristic (ROC), https://www.metoffice.gov.uk/research/climate/seasonal-to-decadal/gpc-outlooks/user-guide/interpret-roc, last access: 5 August 2025.
Ngcamu, B. S. and Chari, F.: Drought Influences on Food Insecurity in Africa: A Systematic Literature Review, Int. J. Environ. Res. Public Health, 17, 5897, https://doi.org/10.3390/ijerph17165897, 2020.
Niu, G.-Y., Yang, Z., Mitchell, K., Chen, F., Ek., M, Barlage, M., Kumar, A., Manning, K., Niyogi, D., Rosero, E., Tewari, M., and Xia, Y.: The community Noah land surface model with multiparameterization options (Noah-MP): 1. Model description and evaluation with local-scale measurements, J. Geophys. Res., 116, D12109, https://doi.org/10.1029/2010JD015139, 2011.
Phakula, S., Landman, W. A., and Engelbrecht, C. J.: Literature survey of subseasonal-to-seasonal predictions in the southern hemisphere, Meteorological Applications, 31, e2170, https://doi.org/10.1002/met.2170, 2024.
Rodell, M. and Famiglietti, J. S.: An analysis of terrestrial water storage variations in Illinois with implications for the Gravity Recovery and Climate Experiment (GRACE), Water Resources Research, 37, 1327–1340, https://doi.org/10.1029/2000WR900306, 2001.
Rodell, M. and Li, B.: Changing intensity of hydroclimatic extreme events revealed by GRACE and GRACE-FO, Nature Water, 1, https://doi.org/10.1038/s44221-023-00040-5, 2023.
Rodell, M., Famiglietti, J. S., Wiese, D. N., Reager, J. T., Beaudoing, H. K., Landerer, F. W., and Lo, M.-H.: Emerging trends in global freshwater availability, Nature, 557, 651–659, https://doi.org/10.1038/s41586-018-0123-1, 2018.
Save, H., Bettadpur, S. and Tapley, B. D.: High resolution CSR GRACE RL05 mascons, J. Geophys. Res. Solid Earth, 121, 7547–7569, https://doi.org/10.1002/2016JB013007, 2016.
Scanlon, B. G., Zhang, Z., Save, H., Sun, A., Schmied, H. M., van Beek, L. P. H., Wiese, D. N., Wada, Y., Long, D., Reedy, R. C., Longuevergne, L., Döll, P., and Bierkens, M. F. P.: Global models underestimate large decadal declining and rising water storage trends relative to GRACE satellite data, Proc. Natl. Acad. Sci. USA, 115, E1080–E1089, https://doi.org/10.1073/pnas.1704665115, 2018.
Scanlon, B., Rateb, A., Anyamba, A., Kebede, S., MacDonald, A. M., Shamsudduha, M., Small, J., Sun, A., Taylor, R. G., and Xie, H.: Linkages between GRACE water storage, hydrologic extremes, and climate teleconnections in major African aquifers, Environ. Res. Lett., 17, 014046, https://doi.org/10.1088/1748-9326/ac3bfc, 2022.
Sharifi, E., Haas, J., Boergens, E., Dobslaw, H., and Güntner, A.: Technical note: GRACE-compatible filtering of water storage data sets via spatial autocorrelation analysis, Hydrol. Earth Syst. Sci., 29, 6985–6998, https://doi.org/10.5194/hess-29-6985-2025, 2025.
Shukla, S., Roberts, J., Hoell, A., Funk, C. C., Robertson, F., and Kirtman, B.: Assessing North American multimodel ensemble (NMME) seasonal forecast skill to assist in the early warning of anomalous hydrometeorological events over East Africa, Clim. Dyn., 53, 7411–7427, 2019.
Slater, L. J., Villarini, G., and Bradley, A. A.: Evaluation of the skill of North-American Multi-Model Ensemble (NMME) Global Climate Models in predicting average and extreme precipitation and temperature over the continental USA, Clim. Dyn., 53, 7381–7396, 2019.
Tapley, B. D., Bettadpur, S., Watkins, M., and Reigber, C.: The gravity recovery and climate experiment: Mission overview and early results, Geophys. Res. Lett., 31, L09607, https://doi.org/10.1029/2004GL019920, 2004.
Trisos, C. H., Adelekan, I. O., Totin, E., Ayanlade, A., Efitre, J., Gemeda, A., Kalaba, K., Lennard, C., Masao, C., Mgaya, Y., Ngaruiya, G., Olago, D., Simpson, N. P., and Zakieldeen, S.: Africa, in: Climate Change 2022: Impacts, Adaptation and Vulnerability. Contribution of Working Group II to the Sixth Assessment Report of the Intergovernmental Panel on Climate Change, edited by: Pörtner, H.-O., Roberts, D. C., Tignor, M., Poloczanska, E. S., Mintenbeck, K., Alegría, A., Craig, M., Langsdorf, S., Löschke, S., Möller, V., Okem, A., and Rama, B., Cambridge University Press, Cambridge, UK and New York, NY, USA, 1285–1455, https://doi.org/10.1017/9781009325844.011, 2022.
WMO: State of the Climate in Africa 2024, https://library.wmo.int/idurl/4/69495 (last access: 17 February 2026), 2025.
Wood, A. W., Maurer, E. P., Kumar, A., and Lettenmaier, D.: Long-range experimental hydrologic forecasting for the eastern United States, J. Geophys. Res., 107, 4429, https://doi.org/10.1029/2001JD000659, 2002.
Xia, Y., Mocko, D., Huang, M., Li, B., Rodell, M., Mitchell, K. E., Cai, X., and Ek, M. B.: Comparison and assessment of three advanced land surface models in simulating terrestrial water storage components over the United States, J. Hydrometeor., 18, 625–649, https://doi.org/10.1175/jhm-d-16-0112.1, 2017.
Xu, T., Guo, Z., Xia, Y., Ferreira, V. G., Liu, S., Wang, K., Yao, Y., Zhang, X., and Zhao, C.: Evaluation of twelve evapotranspiration products from machine learning, remote sensing and land surface models over conterminous United States, J. Hydrology, 578, https://doi.org/10.1016/j.jhydrol.2019.124105, 2019.
Yuan, X. and Zhu, E.: A first look at decadal hydrological predictability by land surface ensemble simulations, Geophysical Research Letters, 45, 2362–2369, https://doi.org/10.1002/2018GL077211, 2018.
Yue, S., Pilon, P., and Cavadias, G.: Power of the Mann–Kendall and Spearman's rho tests for detecting monotonic trends in hydrological series, Journal of Hydrology, 259, https://doi.org/10.1016/S0022-1694(01)00594-7, 2002.
Zhang, L., Kim, T., Yang, T., Hong, Y., and Zhu, Q.: Evaluation of Subseasonal-to-Seasonal (S2S) precipitation forecast from the North American Multi-Model ensemble phase II (NMME-2) over the contiguous U.S., J. Hydrology, 603, https://doi.org/10.1016/j.jhydrol.2021.127058, 2021.
Zhao, M., Geruo A, Velicogna, I., and Kimball, J. S.: A global gridded dataset of GRACE drought severity index for 2002-14: Comparison with PDSI and SPEI and a case study of the Australia Millennium Drought, J. Hydrometeorol., 18, 2117–2129, https://doi.org/10.1175/JHM-D-16-0182.1, 2017.
Zhu, E., Yuan, X., and Wood, A. W.: Benchmark decadal forecast skill for terrestrial water storage estimated by an elasticity framework, Nat. Commun., 10, 1237, https://doi.org/10.1038/s41467-019-09245-3, 2019.