the Creative Commons Attribution 4.0 License.
the Creative Commons Attribution 4.0 License.
 | 24 Feb 2025
INSPIRE game: integration of vulnerability into impact-based forecasting of urban floods
Akshay Singhal
Louise Crochemore
Isabelle Ruin
Sanjeev K. Jha
Extreme precipitation events (EPEs) and flash floods inflict great damage on lives and property in cities. Precipitation forecasts help predict extreme events; however, they have limitations in anticipating the impacts of extreme events. Impact-based forecasts (IBFs), when integrated with information on hazards, exposure, and vulnerability, can anticipate impacts and suggest emergency decisions. In this study, we present a serious game experiment, called the INSPIRE game, which evaluates the roles of hazards, exposure, and vulnerability in a flash flood situation triggered by an EPE. Participants make decisions in two rounds based on the extreme precipitation and flood that occurred over Mumbai on 26 July 2005. In the first round, participants make decisions on the forthcoming EPE scheduled for later in the afternoon. In the second round, they make decisions on the compound events of extreme precipitation, river floods, and high tide. Decisions are collected from 123 participants, predominantly researchers, PhDs and Masters students. Our results show that participant use of information to make decisions was based on the severity of the situation. A larger proportion of participants used precipitation forecast and exposure to make correct decisions in the first round, while they used precipitation forecast and vulnerability information in the second round. Higher levels of education and research experience enabled participants to evaluate the severity of the event and use the appropriate information set presented to them. Additionally, given the choice between qualitative and quantitative information on rainfall, 64 % of the participants preferred qualitative information to quantitative information. We also discuss the relevance and potential of vulnerability integration into IBFs using inferences derived from the serious game.
- Article
(4123 KB) - Full-text XML
- BibTeX
- EndNote


The accuracy and precision of quantitative precipitation forecasts (QPFs) have undergone remarkable improvements in recent decades, owing to the advancement in computing technology and high-resolution data assimilation techniques (Kirkwood et al., 2021; Samal et al., 2023; Singhal et al., 2023). Today, QPFs are available with high spatial and temporal resolutions and large areal extents. The availability of QPFs with lead times of up to 15 d has enabled timely forecasting of hydrological extremes such as extreme precipitation and flash floods reasonably well (Ahlgrimm et al., 2016). Recently, applications of precipitation nowcasting have emerged that aim for high-resolution forecasting of rainfall a couple of hours into the future, keeping in mind socio-economic needs and local decision-making (Ravuri et al., 2021; Ballard et al., 2016; Poletti et al., 2019).
Despite the increasing availability and performance of QPFs across the globe, loss of lives and economic damage have continued to increase (Nanditha and Mishra, 2021; Lala et al., 2021; Singhal et al., 2022). The first reason is simply that extreme precipitation does not necessarily lead to a flood hazard, which can for instance be explained by hydrological (e.g. rather dry antecedent conditions) or hydrodynamic (e.g. structural mitigation measures) factors. Provided that precipitation is the cause of a flood event, four main reasons may be advanced as to why the improvements in QPFs have not necessarily led to better mitigation of losses of lives and property. First, a growing population is associated with an increase in exposed lives and property. Second, despite improvements, QPFs still lack the ability to accurately predict the magnitude, intensity, and duration of extreme hazards (EPEs or flash floods). Third, early warning systems have generally used QPFs to focus on hazards rather than on their impacts at the local scale. Lastly, the hazard information obtained is not integrated well with the information on local exposure and vulnerability. The lack of integration of the vulnerability information may not provide the local public with a clear and comprehensive understanding of preventive actions. Hence, there is a need for not just forecasts but also impact-based forecasts (IBFs) informing the local public about “what the weather will do” rather than just “what the weather will be” (Hemingway and Robbins, 2020; Kaltenberger et al., 2020).
Well-informed decision-making in IBFs requires two types of information to assess risks: (a) information regarding the hazard and (b) information regarding the area-specific vulnerability. Information regarding the hazard, such as its magnitude, frequency, temporal duration, and spatial extent, is available from the QPFs and is well-documented in the literature (Papagiannaki et al., 2015; Coughlan De Perez et al., 2015; Robbins and Titley, 2018). However, human actions and interventions produce vulnerability and, in particular, exposure, which are as important as the hazards themselves. Vulnerability is defined as “the conditions determined by physical, social, economic and environmental factors that increase the susceptibility of an individual, a community, assets or systems to the impacts of a particular hazard” (UNDRR, 2017). The information on vulnerability is crucial for guiding effective adaptation planning and informed decision-making processes (Næss et al., 2006; Parker et al., 2019; Singhal and Jha, 2021). On the other hand, exposure is defined as “the situation of people, infrastructure, housing, production capacities and other tangible human assets located in hazard-prone areas” (UNDRR, 2017). Decision-making in IBFs should form an integrated framework involving information on hazards (single or compound), exposure, and vulnerability to enable decision-makers to take timely mitigating actions (Kox et al., 2018).
Serious games – games used for purposes other than entertainment – are a potential tool for training, improving, and testing decision-making processes in a controlled environment (Rusca et al., 2012; Aubert et al., 2018). One objective of game-playing is to transfer lessons learnt to real-world decision-making (Geurts et al., 2007). Mayer (2009) defined serious games as “experimental, rule-based, interactive environments, where players learn by taking actions and by experiencing their effects through feedback mechanisms that are deliberately built into and around the game”. Craven et al. (2017) considered serious games to be a space free of the restrictions of past systems, where scientists and policy-makers can come together. Games present a range of scenarios based on potential actions taken for various events, and each combination of selected actions for an event has its consequences (Aubert et al., 2019).
Previous studies have noted that serious games are effective tools for communicating advanced scientific concepts in fields such as climate adaptation, water resource management, urban planning, and disaster management (Rumore et al., 2016; Flood et al., 2018; Crochemore et al., 2021). However, in the context of hydrological hazards such as EPEs and floods, most serious games have focused on understanding and communication of hazard information rather than the role of exposure and vulnerability in decision-making processes (Crochemore et al., 2016; Terti et al., 2019). For instance, Arnal et al. (2016) and Crochemore et al. (2016) designed serious games to better understand the perception and use of probabilistic forecasts in flood-related decision-making contexts. Terti et al. (2019) created a role-playing game called ANYCaRE that simulated a crisis management unit in order to explore the value of modern impact-based weather forecasts for decision-making processes related to weather risks in Europe. Sermet et al. (2020) developed a web-based decision support tool for multiple hydrological hazards, such as floods and droughts, in order to discuss decision-making processes in terms of budget, technicality, preparedness, and response. For more information regarding the application of serious games in flood risk management, the reader is referred to Forrest et al. (2022).
In this study, we present a serious game experiment which assesses the interplay between hazard, exposure, and vulnerability in a flash flood triggered by extreme rainfall. The INSPIRE game is designed based on the dramatic flood of 2005 in Mumbai; all values for hazard and vulnerability provided in the game are derived from observations of that particular event and area. Results from the 123 answers collected during six game sessions are analysed to explore how to best combine and communicate hazard and vulnerability information for emergency decision-making in IBFs. We argue that, with hydrometeorological advancements, humans may be able to improve their capacity to forecast the magnitude, temporal duration, and spatial extent of EPEs in the near future; however, this may not guarantee fewer impacts from such EPEs compared to what we are witnessing today. One of the ways of mitigating such impacts is to make socio-environmental systems less vulnerable (i.e. less exposed, less sensitive, and more adaptable) to EPEs. Hence, we aim to show that vulnerability and its underlying components need to be included in IBFs and decision-making protocols. We test combinations of extreme rainfall, exposure, and vulnerability to understand how the components of risk and their communication (i) alter decisions, (ii) influence confidence in decisions, and (iii) are perceived in support of flood-based decision-making.
The game is inspired by the dramatic EPE and the subsequent flood of 26–27 July 2005 in Mumbai, the financial capital of India. The city is located on the western coast of India, as shown in Fig. 1a, and is surrounded by the Arabian Sea on all sides. It is divided into 24 municipal wards (local administrative units) covering an area of 603 km2 (233 mi2) with a population of approximately 20 million. Of the four rivers flowing through the city, the Mithi is the most prominent one, acting as a natural drainage channel and carrying excess water during the monsoon season, i.e. from June to September (JJAS), out of the city towards the Arabian Sea.
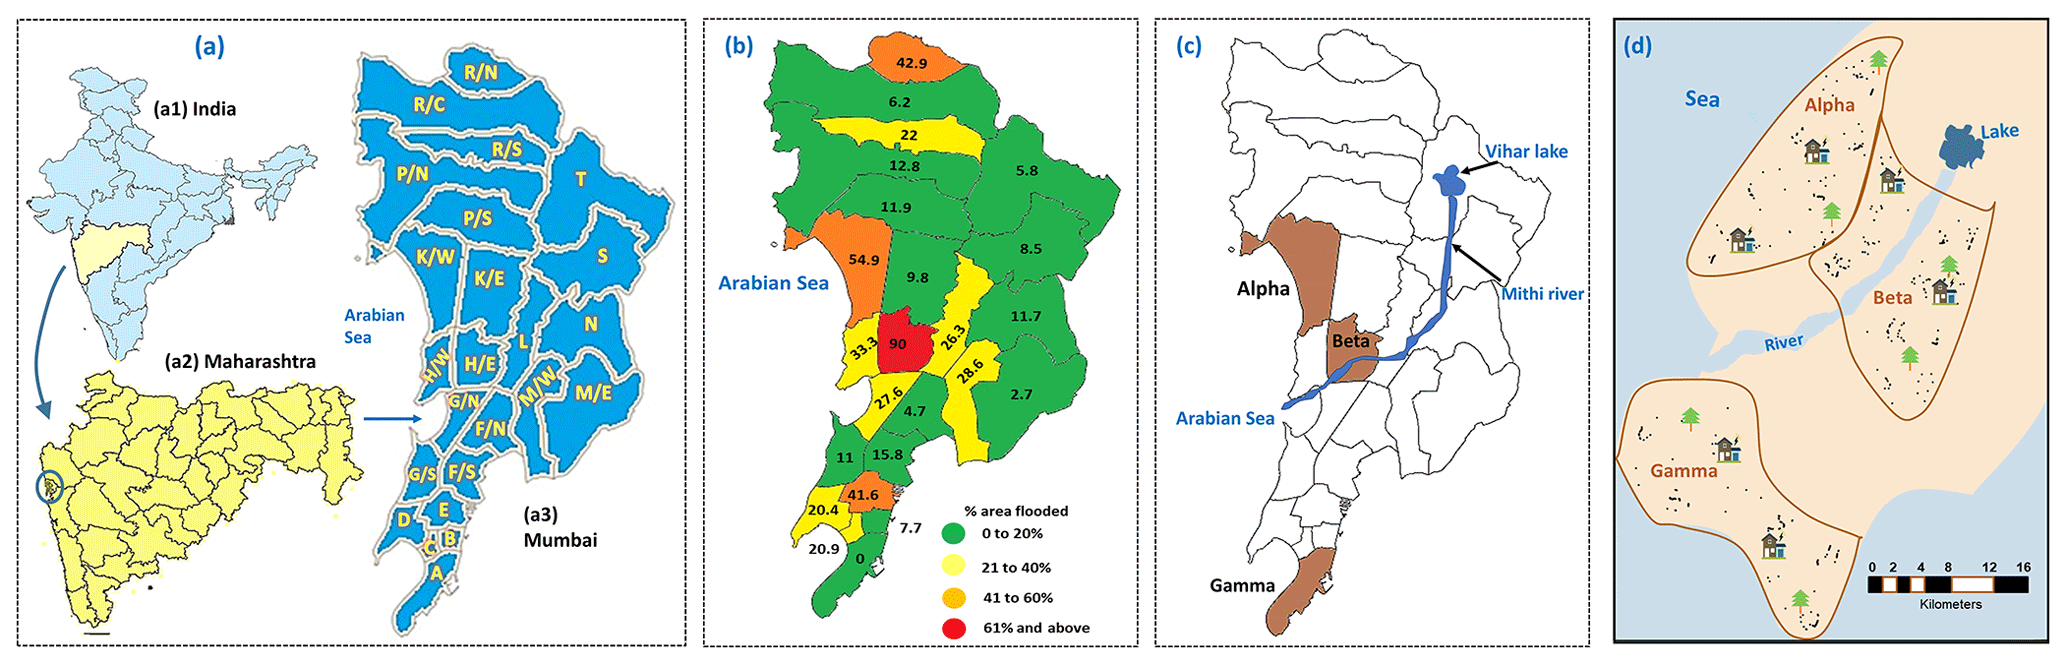
Figure 1Maps of the study area: (a) location of Mumbai in India; (b) ward-wise percent area flooded during the extreme precipitation and flood event of 2005 (based on MCGM, 2006); (c) wards selected for this study and the flow direction of the Mithi River, originating from Vihar Lake; and (d) the three selected wards named Alpha, Beta, and Gamma in the fictitious city of INSPIRE.
On 26–27 July 2005, the city received unprecedented precipitation of 944 mm over 24 h, with 190.3 mm of rainfall in a single hour as observed by the Santacruz observatory (Jenamani et al., 2006). The annual average precipitation for the city is around 2000 mm. Over 60 % of the city was flooded, with high variability across its wards (Fig. 1b), mainly due to the extreme precipitation and partly due to insufficient drainage systems and a high tide of 4.48 m that did not allow the floodwater from the Mithi River (Fig. 1c) to drain into the sea (Government of Maharashtra, 2006). As a result, the transportation and communication systems collapsed: the airport was closed, major roads were submerged, intercity trains were halted, and electricity was cut off in many parts of the city. About 1200 people lost their lives either directly or indirectly because of the torrential rainfall and the subsequent deluge-related diseases (Gupta, 2007), and economic damages of around USD 2 billion were incurred.
The INSPIRE flood game aims to test out different ways of jointly communicating hazard and vulnerability information for emergency decision-making. To this end, we test different joint visualizations of extreme rainfall, exposure, and vulnerability information in a decision-making process resembling that of the 2005 Mumbai flood.
3.1 Game area
The wards “K/W”, “H/E”, and “A” (see Fig. 1a3) in Mumbai were selected for the setting of the game to represent three different combinations of hazard and vulnerability levels. Wards K/W (55 %) and H/E (90 %) were the most affected wards in the event. Ward A was the least affected ward and serves as a control ward in the game, as players should not make drastic decisions there. In addition, the three wards bring out different flooding drivers: ward K/W was primarily flooded due to extreme precipitation, while ward H/E was impacted by the combination of extreme precipitation and overflow of the Mithi River. Lastly, the wards represent varying socio-economic conditions, from the huge slum population (ward H/E) to a flourishing tourist hotspot (ward A), leading to different levels of vulnerability and exposure.
In the game and hereafter, the selected wards K/W, H/E, and A are referred to as the towns “Alpha”, “Beta”, and “Gamma” (Fig. 1c). They represent parts of the fictitious INSPIRE city that was created for the game. The geographical and socio-economic characteristics of these three towns mimic those of the three corresponding wards of Mumbai. Participants make decisions for each of these three towns. While playing the game, participants are not informed about the Mumbai background in order to avoid biases in the gameplay. Participants would likely have based their decisions on their knowledge of the 2005 flood event rather than on the information provided to them during the game.
3.2 Game session unfolding
3.2.1 Introduction of the game
Each participant is assigned the role of flood risk manager (FRM) for an adapted city called INSPIRE (see Fig. 1d). The main goal of the FRM is to make the best possible emergency decisions to minimize the impact of the extreme precipitation and floods. The game moderator first informs the players about the area they will have to manage, with relevant geographical and socio-economic characteristics of the city, and the decisions they will have to make. Each participant takes part in the game experiment independently and is given a worksheet on which to mark their decision choices: either take an action or do not take it (yes/no decisions). The game moderator ends the introduction round by informing the participants of the risk of an upcoming extreme rainfall event across INSPIRE that may lead to flash floods. Utmost care is taken to ensure that the participants understand the context of the game, the scenarios, the information provided to them, the purpose of the game, the rules they have to play by, and the decisions they have to make.
3.2.2 Game rounds
The game is then set for two rounds corresponding to successive times in the progression of the event. At the beginning of each round, a crisis unit provides the participants' FRM with field information (water levels of the lake and river, sea tide height, prevailing situation on the ground, and possible future developments) from the fictitious Meteorological Department, Department of Town Planning, Department of River Management, Department of Coast Management, and media cell (Fig. 2). The participants are then provided, in random order, with town-scale information on vulnerability, accumulated rainfall forecasts, and exposure. Based on the information received, the participants make decisions to be implemented. On average, the participants required 25 min to play the two rounds of the game. The time spent on providing the background information on the study area, the structure of the two rounds, and the rules for playing the game are not included in these 25 min.
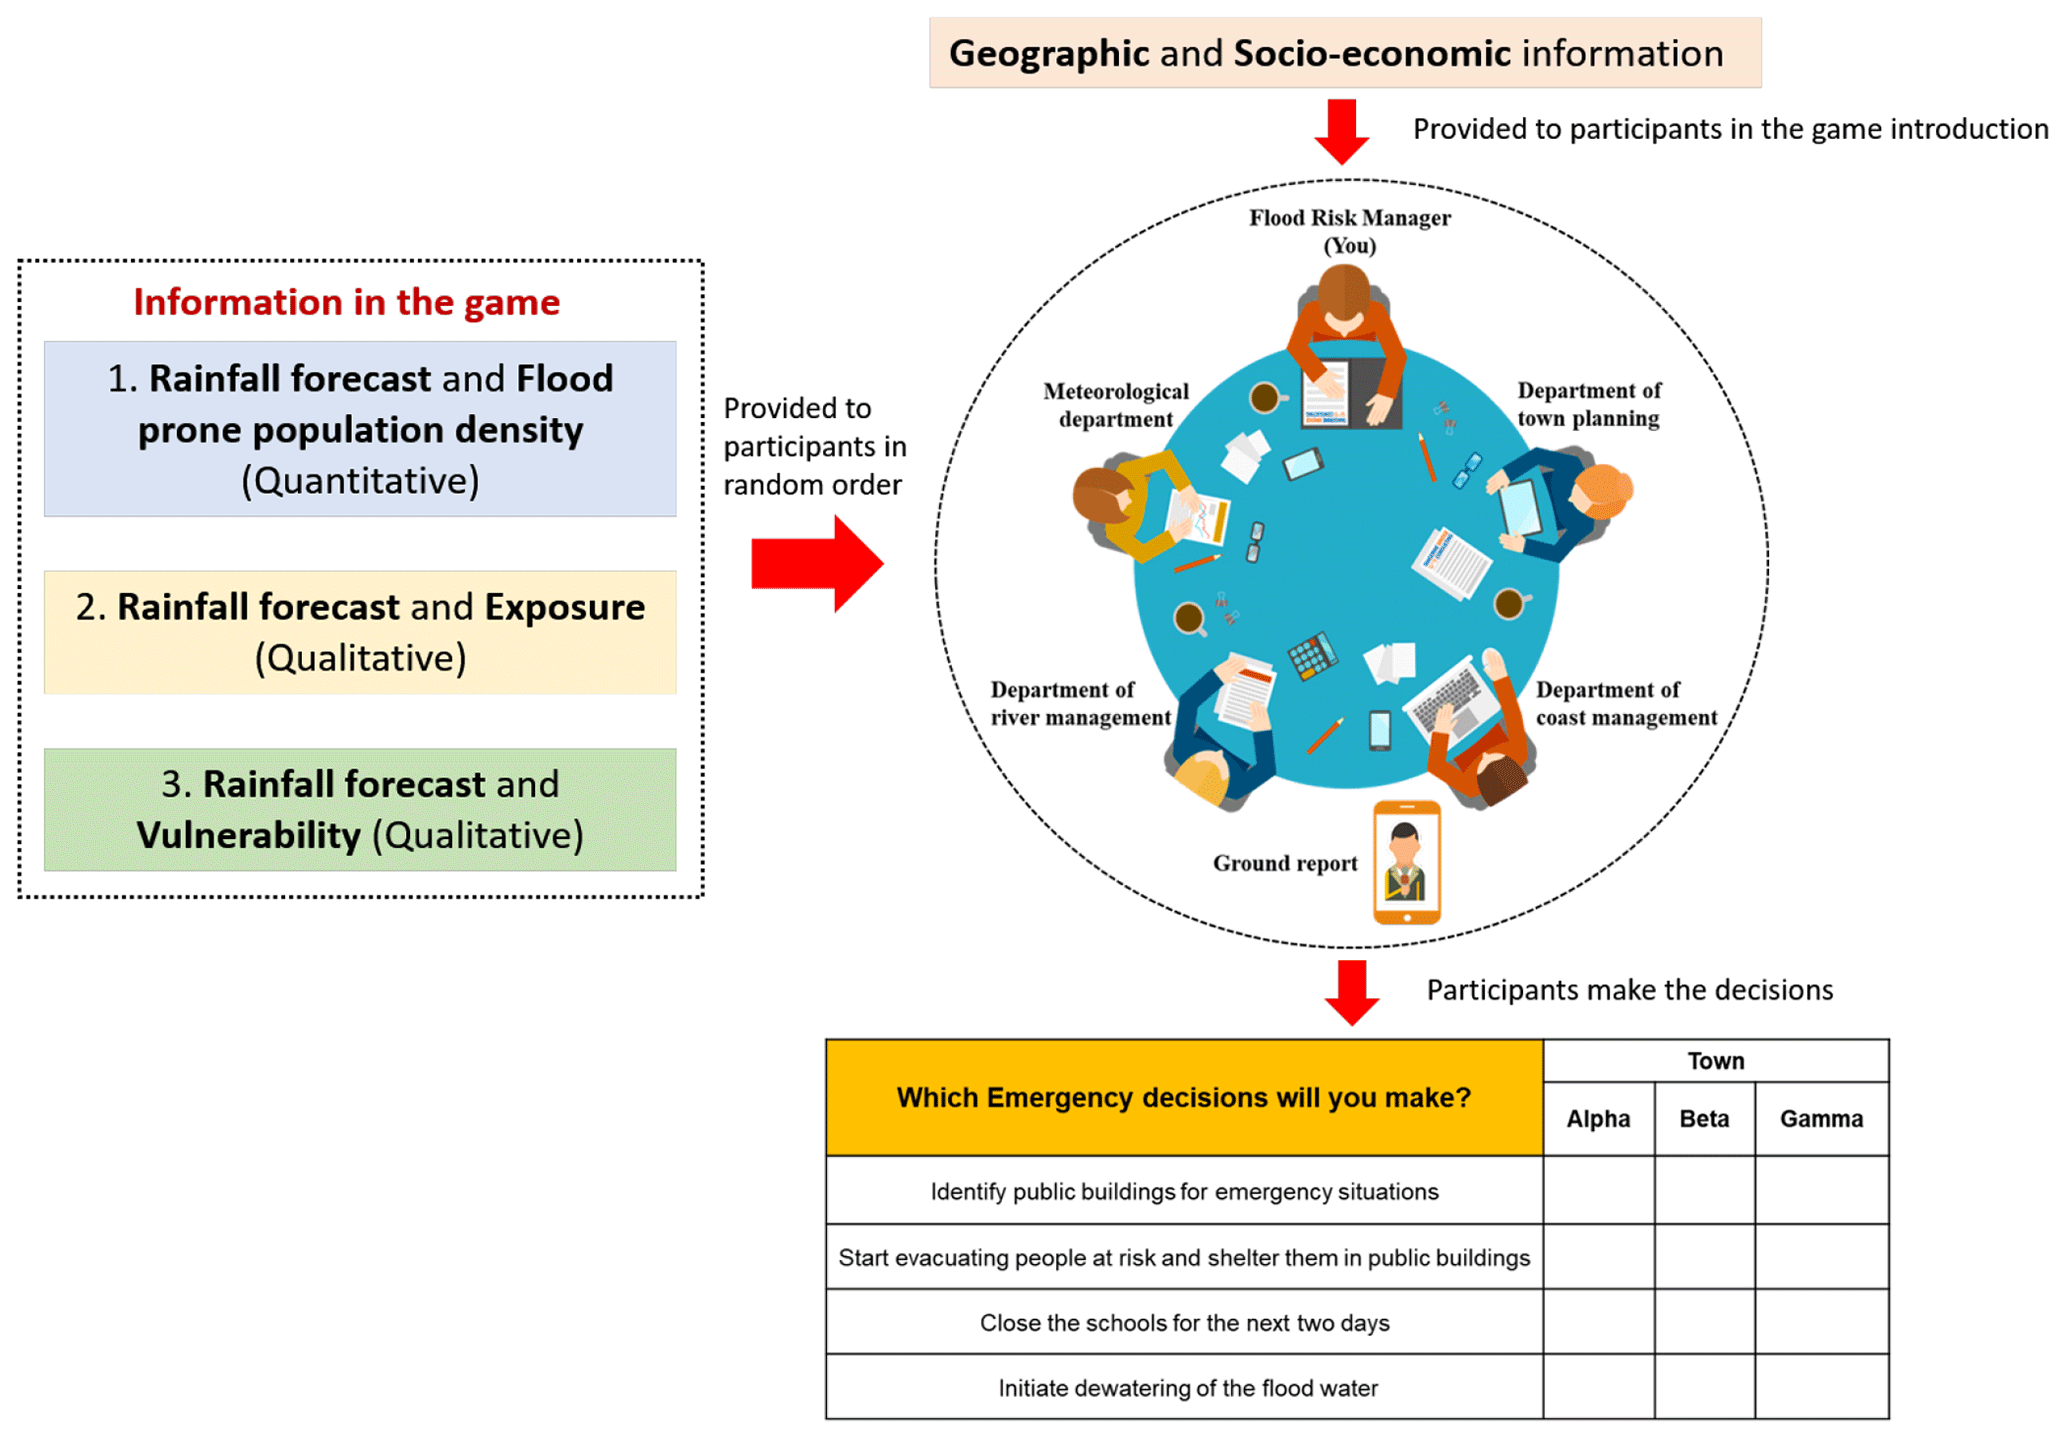
Figure 2Different information provided to the participants in order to make the four emergency decisions for each of the towns Alpha, Beta, and Gamma..
3.2.3 Final survey
After the game rounds, participants are requested to complete a survey (Section D; Fig. A1; Appendix A) to reflect on their perception of the combinations of information (i.e. most preferred combination, usefulness of exposure and vulnerability, and qualitative or quantitative information on the rainfall forecast). A prescribed space for any feedback in the form of comments and suggestions was provided at the bottom of Section D.
3.2.4 Game scoring
For each decision, the participants are awarded “approval points” (+10 and −10 for each correct and incorrect decision, respectively). There are a total of 360 points potentially available in each of the two rounds, resulting in a total of 720 potential points in the game. At the end of the game, participants are given the correct and incorrect decisions to calculate their score for each information set and their total score.
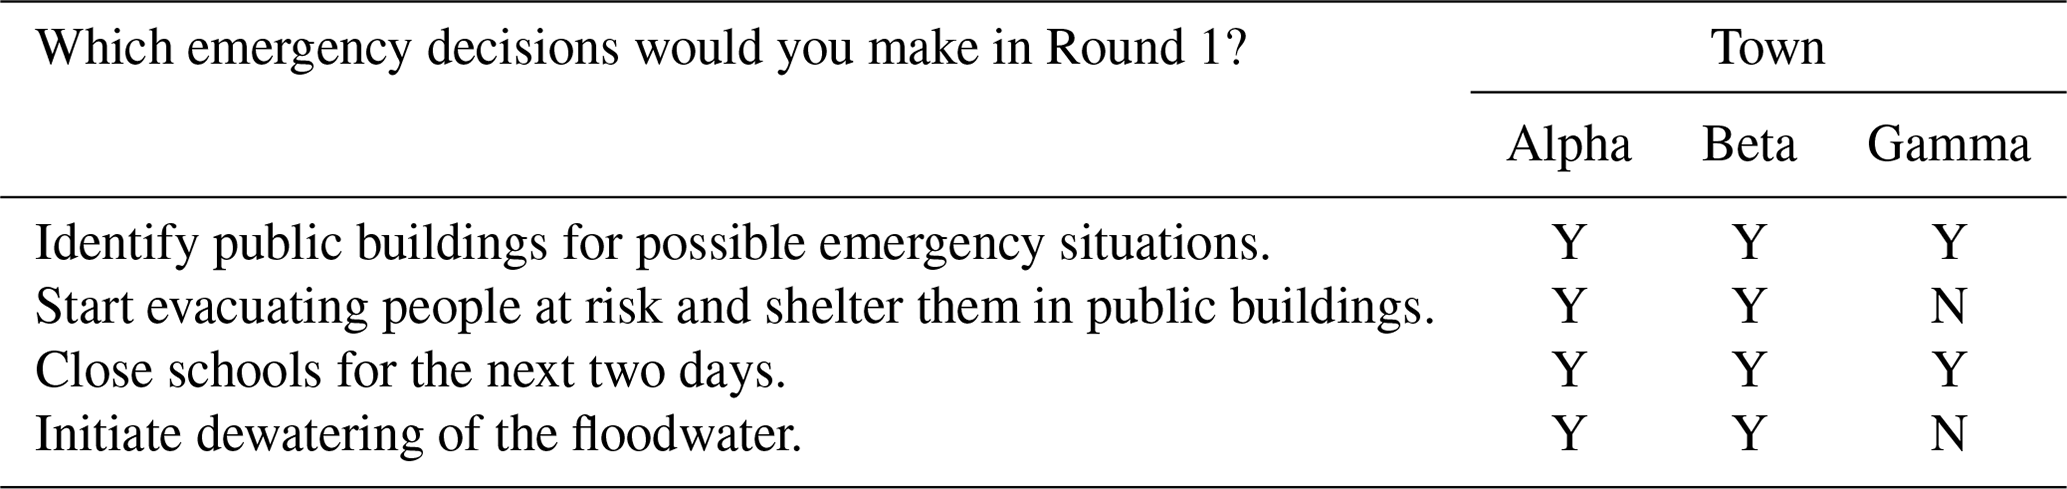
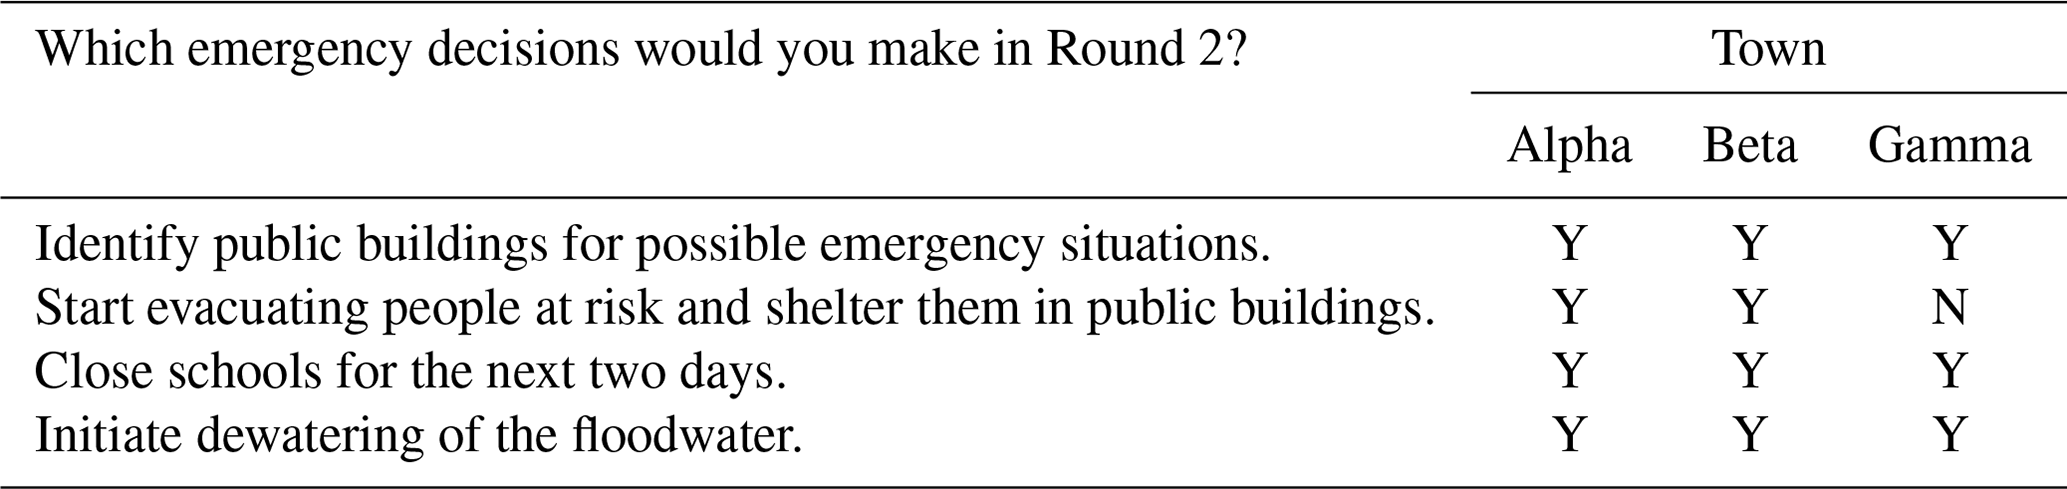
Correct and incorrect decisions are made through the gameplay by a decision-maker in Mumbai who often makes real decisions in the wake of any extreme precipitation or flood event (see Appendix B). These expert decisions are based on the INSPIRE game rather than on the flood event of 2005. The expert from the Municipal Corporation of Greater Mumbai (MCGM) who made the decisions played the game under the same conditions as the participants. The expert had no idea about the three towns in the game or their locations and relied on their decision-making expertise in managing floods in Mumbai for this a priori unknown decision-making context. Given that emergency decision-making is complex, there may be more than one optimal decision made. This decision by the expert decision-maker serves primarily as a reference with which to compare the participants' answers and is discussed with the participants during the debriefing session. The worksheets of participants who made more decisions for Gamma (control ward) than for Alpha or Beta in the first round were excluded due to their lack of understanding of the flood situation or the rules of the game.
3.2.5 Debriefing
After the game, a debriefing session of 10–15 min is convened to initiate and encourage discussion among the participants about the game experiments, its structure, the usefulness of the information provided for making informed decisions, and the approach to their decision choices. Finally, the actual backdrop of the game, the Mumbai flood, is revealed to the participants.
3.3 Information provided to the players
During the game, the participants are provided with town-scale information on 4-hourly accumulated forecast rainfall, flood-prone population density, exposure, or vulnerability, on the basis of which they make decisions (see Fig. 2). The rainfall forecast is provided in either qualitative or quantitative form in the game to experiment with different visualizations of rainfall information. The criteria for classifying the rainfall forecast in colour codes are presented in Appendix C. The information on flood-prone population density is provided quantitatively, while exposure and vulnerability are only provided qualitatively.
The accumulated rainfall forecast used in the game is a slight modification of the observed rainfall during the event on 26–27 July 2005. The forecast issued for the event by the different numerical weather prediction (NWP) models is not used because they greatly underestimated the observed rainfall. The best forecast (United Kingdom Meteorological Office – UKMO) predicted 120–160 mm (lead time day 3), 280–320 mm (lead time day 2), and 200–240 mm (lead time day 1), as reported by Bohra et al. (2006), while the actual rainfall was 944 mm. The adequacy of any decision made based on this actual forecast would likely be determined by the hazard forecast regardless of the spatial variability in vulnerability, making it unsuitable for the research question investigated here. The effect of such forecast biases on decision-making and forecast perception was explored in other studies (e.g. Arnal et al., 2016). The observed rainfall used in this game is slightly modified to ensure that the rainfall in the three selected towns is contrasted, which allows for diverse hazard-related decision-making contexts in the game. The flood-prone population density (per square kilometre) is calculated for the three selected wards as the total ward population multiplied by the percent area flooded during the 2005 event.
The information on exposure and vulnerability is statistically calculated as shown in Sect. 3.4. Both exposure and vulnerability are calculated for each of the 24 wards of Mumbai. The values of the three selected wards (Alpha, Beta, and Gamma) are then provided to the participants as qualitative colour codes during the game; the colour codes vary in four severity levels (I to IV, denoting low, moderate, high, and extreme), each corresponding to a quartile range. For example, 25 % of the wards with the highest vulnerability are assigned severity level IV (extreme).
More detailed information, such as high-resolution rainfall and vulnerability, could potentially be available to decision-makers and thus could have been provided to the players. However, in India, access to data, especially socio-economic data, is difficult because these are generally collected once a decade and are not publicly available. For instance, the socio-economic and flood-related data used in this study have been obtained through the MCGM after a lengthy process. The raw socio-economic data obtained from the MCGM were processed to derive 15 vulnerability indicators. These were summarized with a colour code or value for an area because understanding and visualizing all 15 indicators in order to make a decision can be highly difficult and take too long when quick decisions are required, as in the case of floods. For the above reasons, and to limit the duration of the game, simple aggregated and easy-to-process information was provided.
3.4 Vulnerability analysis
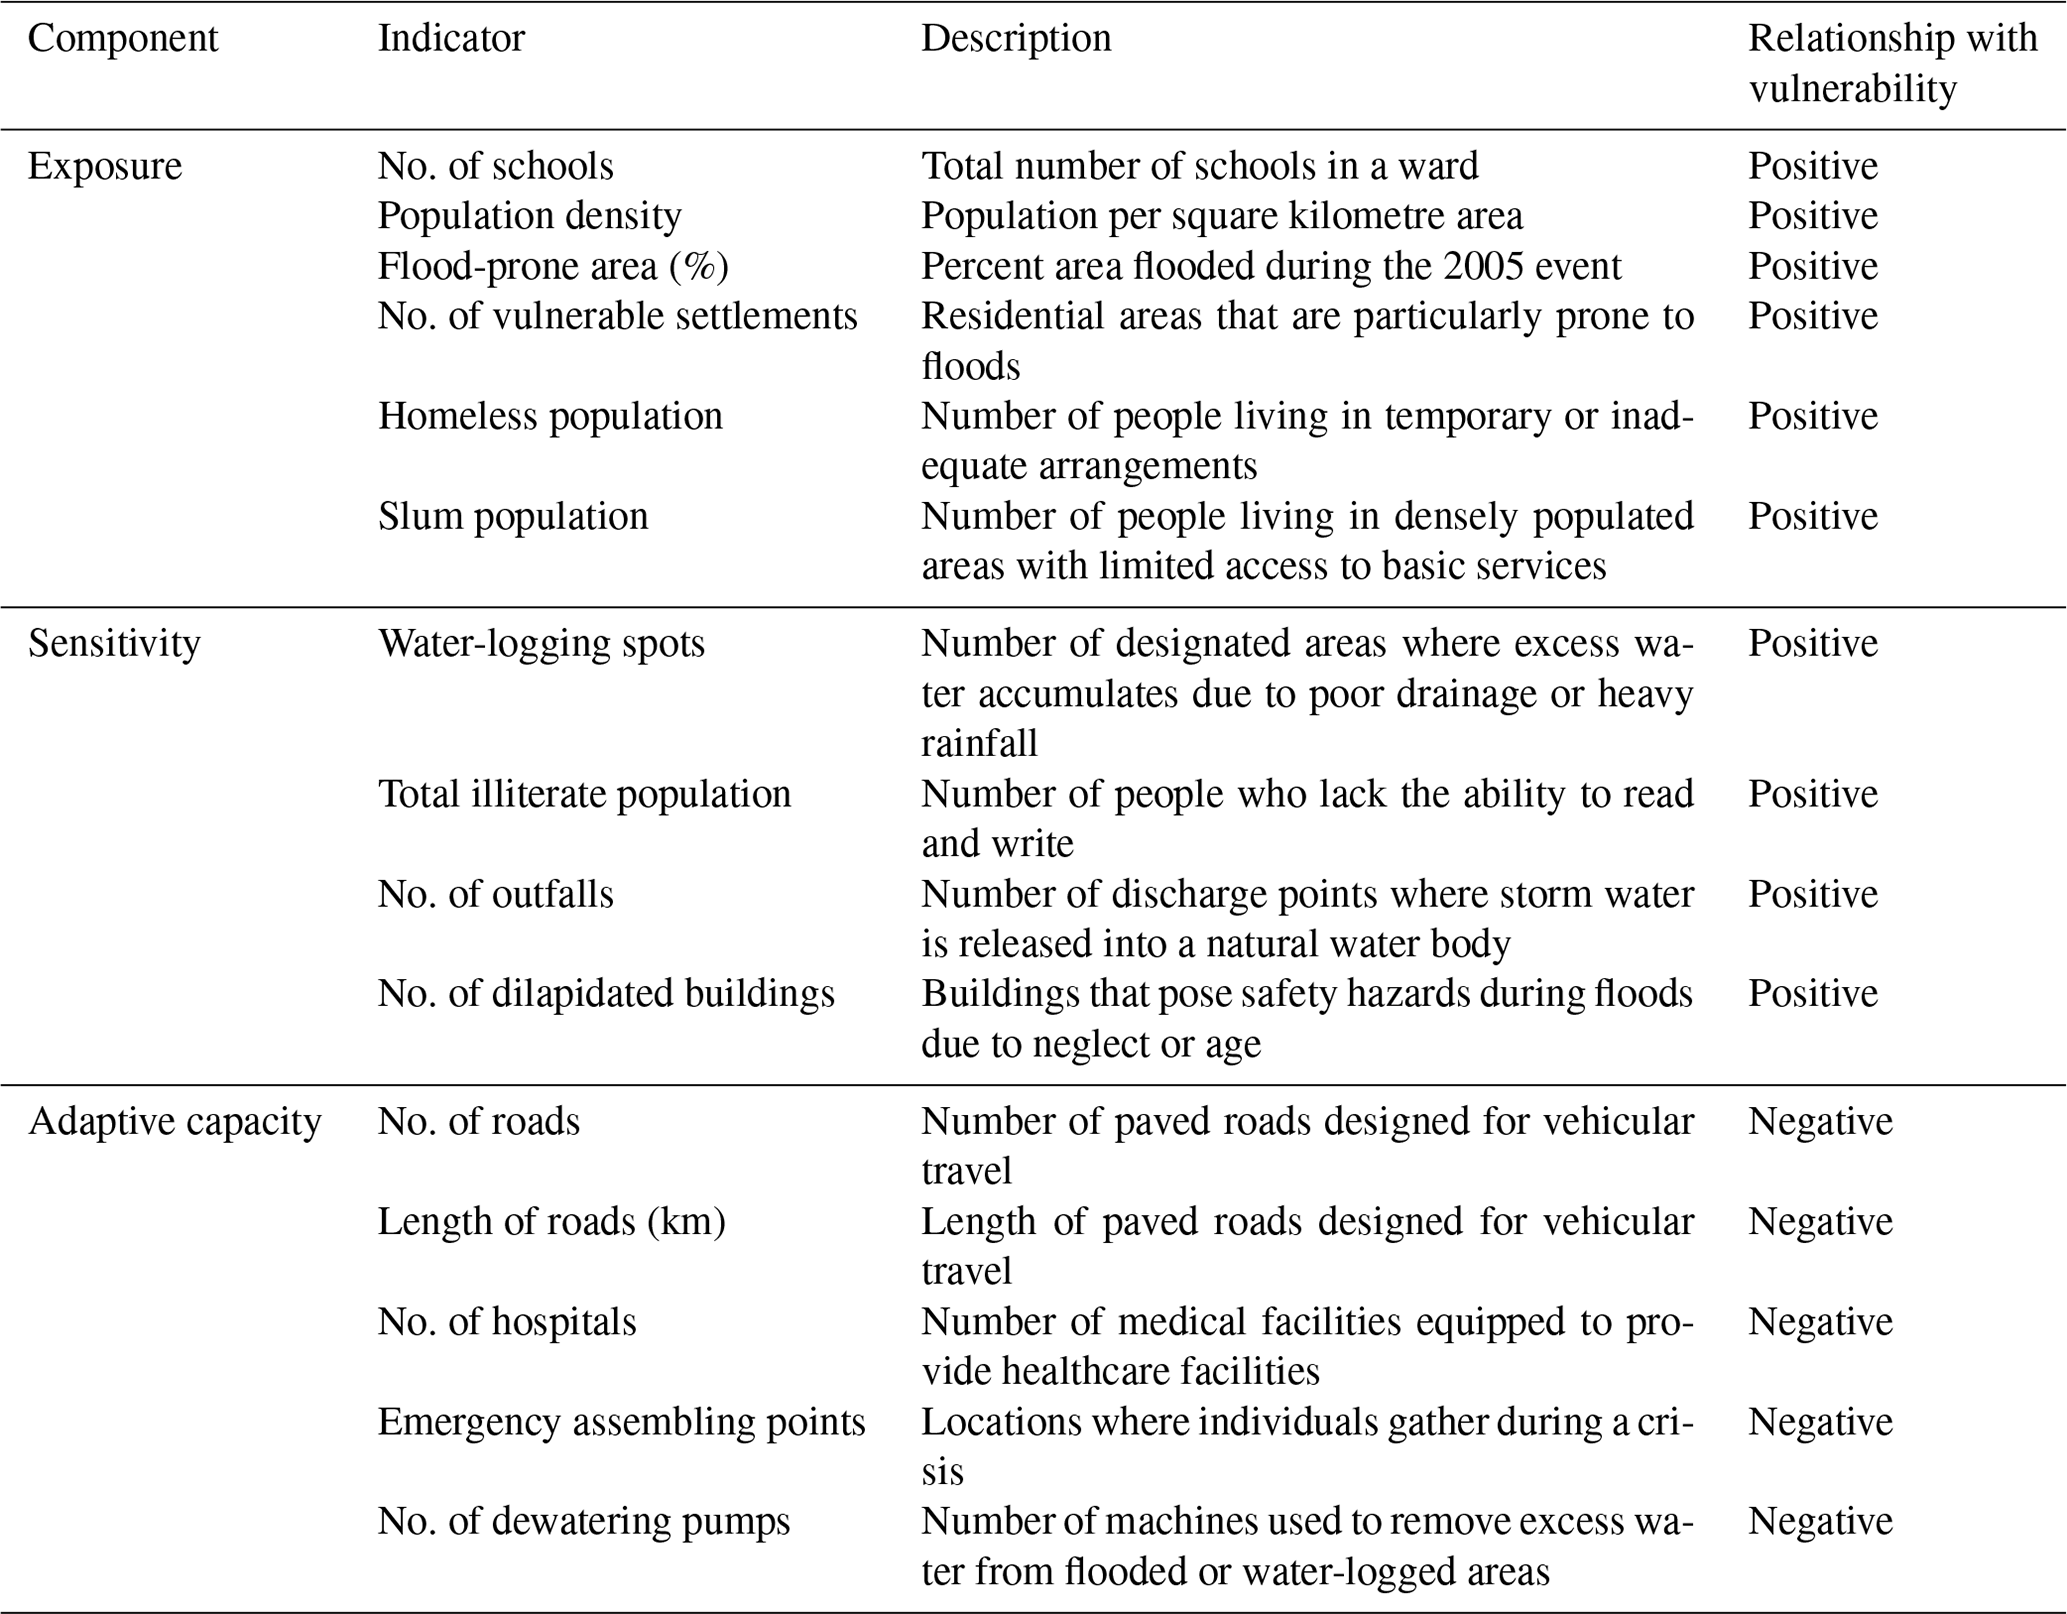
In this study, we consider vulnerability to be divided into three components – exposure, sensitivity, and adaptive capacity (Gallopín, 2006). The values of each of the components and the overall vulnerability were calculated for all 24 wards prior to ward selection. The first step is to collect and identify relevant data (as “indicators”) and categorize them as components of exposure, sensitivity, and adaptive capacity. Each indicator is then scaled based on the fraction of the ward that was flooded during the 2005 event. For instance, close to 55 % of Alpha's total area was flooded in the 2005 event, which implies that each indicator value of Alpha is multiplied by 0.55 in this study. The scaling is done to make sure that the vulnerability (and exposure) of each ward is calculated close to the reality of the 2005 flood event. Subsequently, each indicator is normalized using the maxima–minima method, weighted, and aggregated to form the vulnerability index, followed by a four-level categorization.
3.4.1 Rationale for indicators
The selection of appropriate indicators is essential for accurate assessment of vulnerability. Several indicators may directly or indirectly influence the cause or impact of floods, which can be used to assess the vulnerability of an area. Such indicators were obtained from publicly available data from government agencies (MCGM, 2022) and were selected to best define the flood vulnerability of the wards of Mumbai. Table 1 lists all the selected indicators for this study along with their description and relationship with vulnerability.
Table 1The indicators selected for vulnerability assessment of the 24 wards. Here, (+) indicates that the vulnerability increases with an increase in the magnitude of the corresponding indicator, and (−) indicates that the vulnerability decreases with an increase in the magnitude of the corresponding indicator.
3.4.2 Normalization of indicators
The indicators are expressed in different units which require normalization before comparison. We use the maxima–minima method to normalize the indicators in this study (Singhal and Jha, 2021) as shown in Eq. (1). The maxima–minima method scales the value of an indicator between 0 and 1. The minimum value of the indicator is subtracted from the value of a selected indicator which is then divided by the range of the indicator.
The normalized values are between 0 and 1, i represents the selected indicator, j is the selected ward, and m is the total number of wards. Vij is the value of the ith indicator. minVim and maxVim are the minimum and maximum values of the ith indicator over the study area.
3.4.3 Weighting of indicators
In this study, we assign weights to the indicators using the inverse variance method proposed by Iyengar and Sudarshan (1982). The inverse variance method has been widely used in several vulnerability studies (Murthy et al., 2015; Omerkhil et al., 2020). The two-step equation is shown in Eqs. (2) and (3):
where the variance is calculated for a given indicator i and all wards j. k is a constant such that
Wi is the weight of the indicator i (between 0 and 1), and the sum of all the assigned weights is equal to 1.
3.4.4 Exposure, sensitivity, adaptive capacity, and vulnerability
The sub-indices of exposure (E), sensitivity (S), and adaptive capacity (AC) are calculated using the normalized values and weights of the corresponding indicators (Balaganesh et al., 2020) using Eq. (4). The normalized values of the indicators (Sect. 3.4.2) for each town are multiplied by their corresponding weights (Sect. 3.4.3) to calculate their weighted average. The values of the calculated sub-indices are then used to calculate the flood vulnerability index.
Lastly, we use the additive (averaging) approach to calculate the flood vulnerability index (VI). The approach aggregates the sub-indices of exposure, sensitivity, and adaptive capacity, as shown in Eq. (5).
3.4.5 Categorization of indices
The indices obtained (exposure, sensitivity, adaptive capacity, and vulnerability) are categorized into four levels using the approach proposed by Iyengar and Sudarshan (1982) as shown in Eq. (6). Each level (low, moderate, high, and extreme) is assigned a 25 % probability of occurrence based on the beta distribution, which is generally appropriate for classifying positive random variables (Murthy et al., 2015).
where B(a,b) is the beta function defined by Eq. (7).
The maximum likelihood approach is used to estimate the parameters a and b of the beta distribution.
3.5 The experimental design
In the game, decisions are made in two rounds based on the two waves of extreme precipitation and flood that occurred over Mumbai on 26 July 2005. The first round of decisions (R1) takes place at 12:00 IST (noon), keeping in mind the forthcoming extreme precipitation event scheduled for later in the afternoon. The second round of decisions (R2) takes place at 16:00 IST for the compound events of extreme precipitation, river flood, and high tide later in the evening. Both rounds involve decisions based on three information sets each. Each information set contains hazard and vulnerability information. The hazard information is in the form of a rainfall forecast, either qualitative (Quali_RF) or quantitative (Quant_RF). The vulnerability information provided to the participants varies, which may be quantitative flood-prone population (Quant_Pop), qualitative exposure (Quali_Exp), or qualitative vulnerability level (Quali_Vul). For easier understanding, we denote the use of each of the information sets as an experiment. Use of Quant_RF + Quant_Pop in this study is denoted as experiment E1, Quali_RF + Quali_Exp as E2, and Quali_RF + Quali_Vul as E3. The details of the rounds and experiments (E1, E2, and E3) are presented in Table 2.
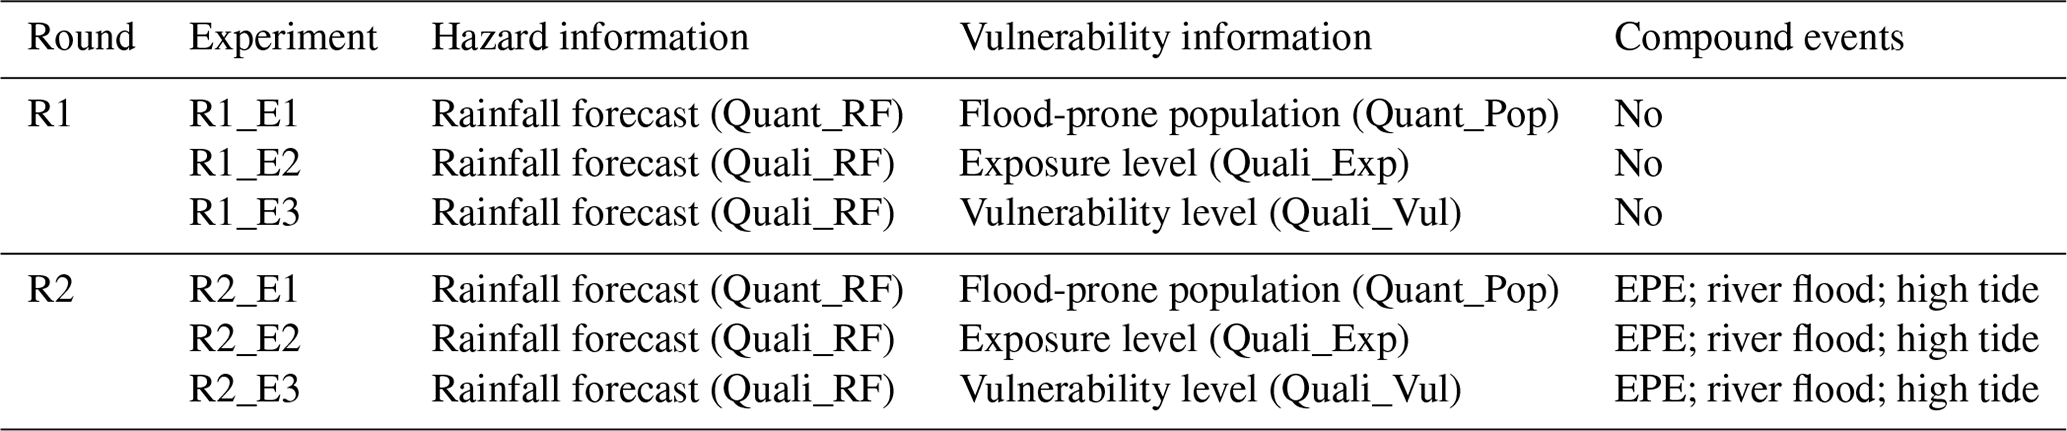
The main aim of the experiments is to test different combinations of the hazard and vulnerability information and identify the best-suited combination for emergency decision-making. The participants make decisions in both rounds based on the information received on extreme precipitation, exposure, and vulnerability. Please note that each experiment involves testing of a particular combination of information sets which the participants use to make decisions. In total, there are two rounds and three experimental runs, which make the total set of experiments equal six. Hereafter, a combination of round and experimental run represents an experiment and is denoted as Rm_En, where m=1 and 2 and n=1, 2, and 3. For instance, R1_E1 represents the first experiment in the first round informed by the first information set. The three information sets in each round were delivered in three different orders depending on the game session: E1–E2–E3, E3–E2–E1, and E2–E3–E1. Different orders ensured that no combination of information had an advantage due to its placement as first or last and that the results were independent of the order in which the information sets were delivered.
The objective of the first round is to familiarize the participants with the different combinations of information and, more importantly, to understand their choice of combination when making emergency decisions in the wake of an extreme precipitation event. The second round is played to understand the choice of information made by the participants in order to achieve higher scores during the compound events.
With these six experiments, the main aim is to identify the best possible combination of extreme rainfall and vulnerability information for emergency decision-making. In addition, two other research questions are addressed: (i) are the quantitative information on rainfall forecasts and a single important indicator (flood-prone population density) sufficient for making optimal decisions during flash floods, and (ii) is it enough to consider exposure instead of vulnerability in order to improve emergency decision-making?
During each of the six experiments, the moderator provides the hazard and vulnerability information to the participant. The participant's role is to assess the information provided and accordingly mark the decisions on a worksheet (Fig. A1; Appendix A).
3.6 Game sessions and participants
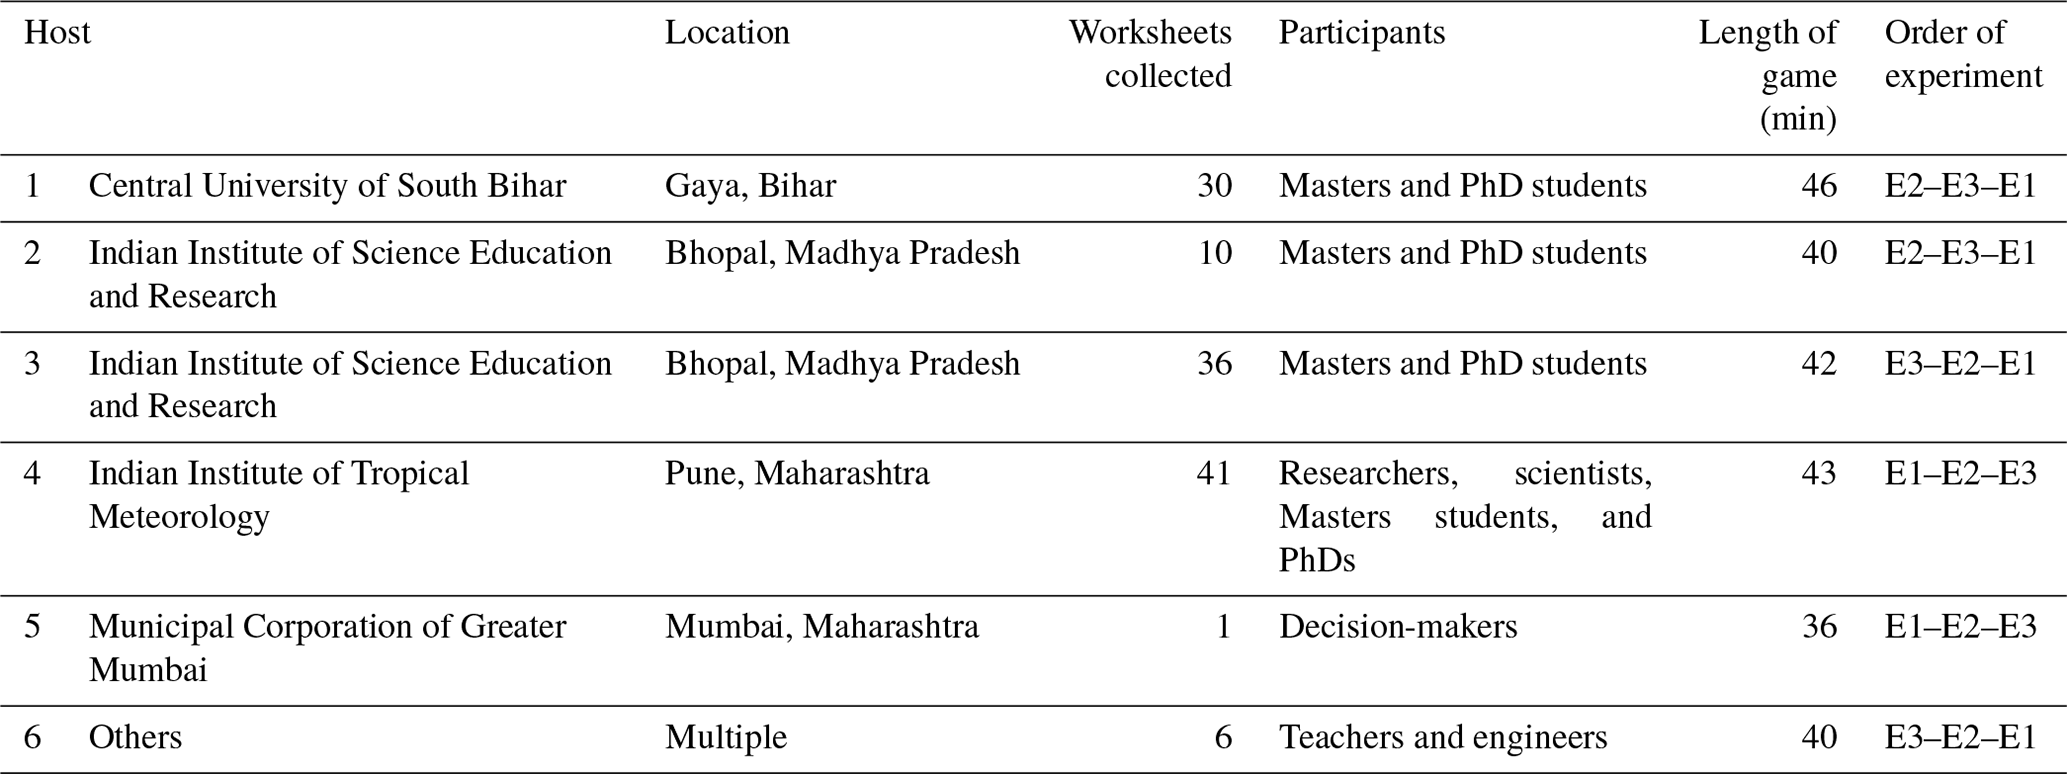
The game is designed to be played by anyone who can understand the flood context and the game's rules. The game was thus played with an educated audience who likely understood the role of emergency decision-makers, the information they may have to process, and the decisions they may have to make. A total of 123 worksheets was collected through five distinct presentations of the game (Appendix D). Participants generally worked in Indian research institutions, which ensured an educated audience with students enrolled in higher studies. Participants from these research institutions usually come from across India and have diverse backgrounds, ensuring some level of social, cultural, and linguistic diversity among the participants. All sessions were conducted in English, which is the working language of these institutions.
All game sessions start with participants filling in their profiles (position, field of expertise, and self-rated knowledge). The distribution of the participants by position, field of expertise, and self-rated knowledge in their field is shown in Fig. 3. The majority of participants identify as senior-level students, i.e. PhDs (48 %) and Masters students (24 %), followed by researchers (22 %; Fig. 3a). The category of researchers encompasses professors, scientists, and holders of other academic positions related to science. Most participants (89 %) identify their field of expertise as “natural science”, while the remaining participants identify it as “socio-economic science” (Fig. 3b). All participants took part in the game voluntarily. Moreover, we asked the participants the question “How much would you rate your knowledge in your field on a scale of 0 to 10?”. Around 70 % of the participants rated their knowledge levels between 4 and 7, while 27 % rated themselves between 8 and 10 (Fig. 3c). The remaining 3 % considered their knowledge levels to be between 0 and 3.
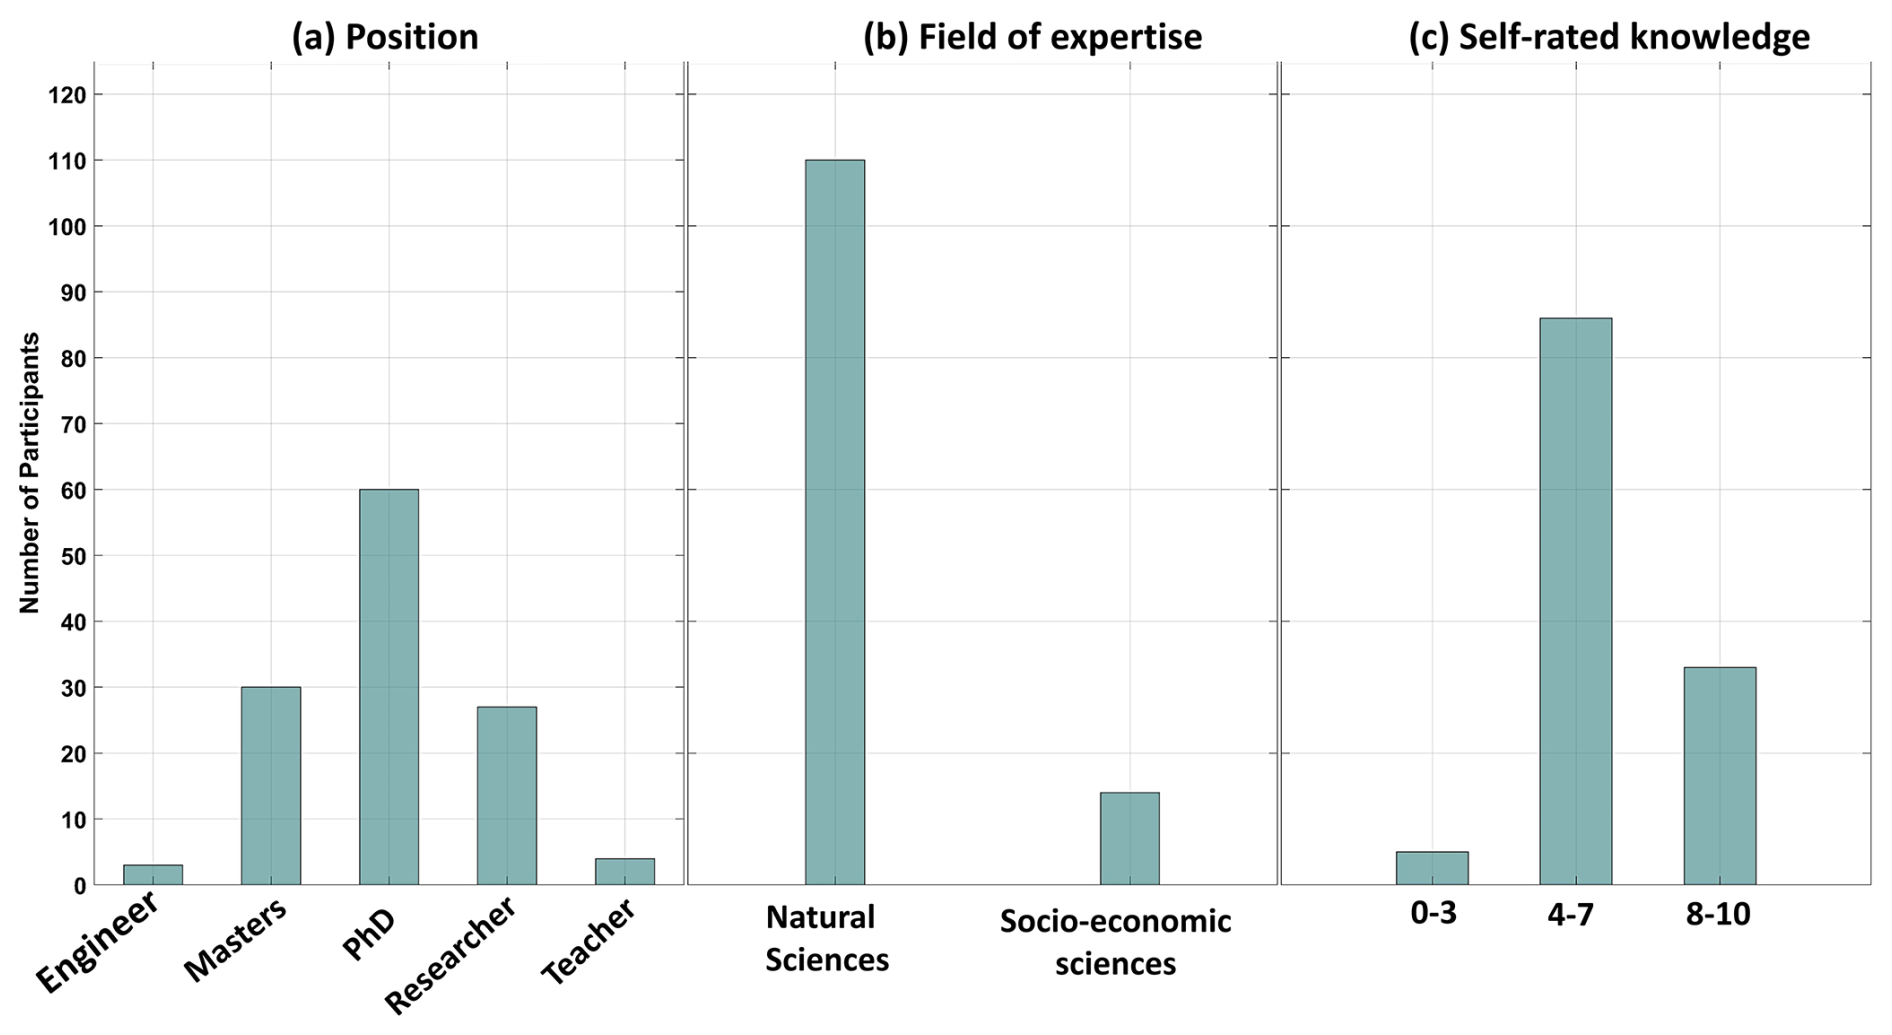
Figure 3Information about the participants' (a) position, (b) field of expertise, and (c) self-rated knowledge in their field, obtained from the worksheet.
4.1 Overview of the decision-making
Of the 123 worksheets, we analysed 111 only, because 12 participants (around 10 % of the 123) had a clear misunderstanding of the game's context as they made a greater number of decisions for the town of Gamma than they did for Alpha or Beta in the first round. Based on the town-specific information provided to the players, Gamma should have been considered the least affected town in the game. We analysed the scoring pattern of the participants who made decisions for the town of Gamma. The results show that these excluded participants made almost all the decisions for all three towns in the game. However, they ended up making a few more decisions for Gamma than for the other two towns. These participants could have been overcautious in making the decisions, may not have understood the rules of the game, or may not have been able to process the information provided to them for making decisions.
The total possible score in the game (720) is divided into four quartiles. Around 14 % of the participants scored in the first quartile (0 to 180), 62 % in the second quartile (181 to 360), and 24 % in the third quartile (361 to 540), while one participant scored in the fourth quartile (541 to 720). The low scores of participants in the first quartile (lowest scores) can be attributed to them adopting a risk-prone strategy. The presence of only one participant in the last quartile indicates that the decision-making process in the game was not overly straightforward. Participants in the third quartile probably had a better understanding of the game, as they consistently made a greater number of correct decisions across the experiments, regardless of the information provided to them.
Our results show that the participants were better prepared to make decisions in the second round (Fig. 4). Around 80 % of the participants (89) scored higher in the second round than in the first (22). Seven participants scored the same in both rounds. Figure 4a–c present the cumulative distribution of scores in each of the three experiments from both rounds. Kolmogorov–Smirnov (KS) tests were performed, indicating that the distribution pairs are statistically different at the 5 % confidence level. Participants scored higher in the second round of the game regardless of the experiment but especially in E3, when they were provided with the combination of qualitative rainfall forecast (Quali_RF) and vulnerability (Quali_Vul). Consistently higher scores in the second round suggest that (a) there might have been a learning curve throughout the game with better decisions made in the second round as participants became more familiar with the rules and the available information or that (b) the severity of the forecast event might have played a role, as the higher severity in the second round of the game led to more actions being taken by the participants, thus leading to higher scores.
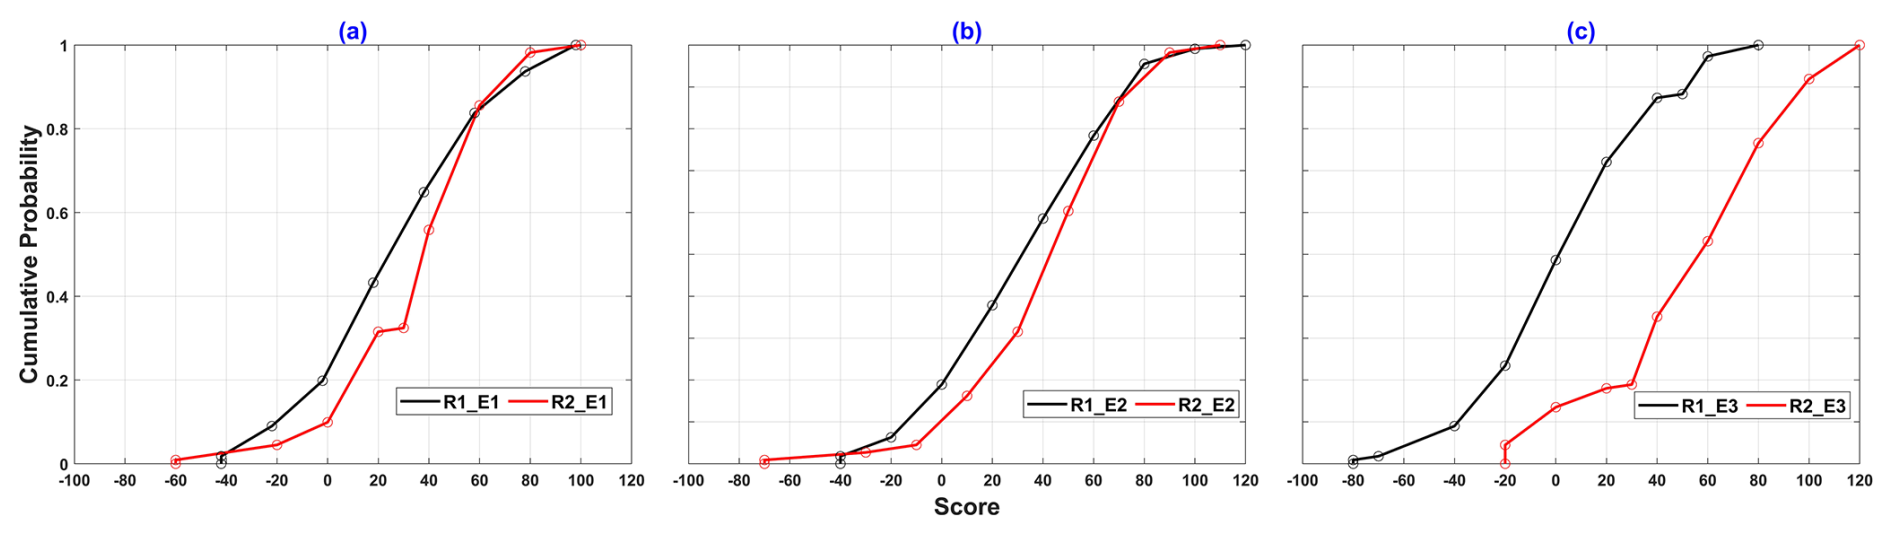
Figure 4Cumulative distributions of the scores for information sets E1 (a), E2 (b), and E3 (c) from Round 1 (no compound event, black line) and Round 2 (compound event, red line).
4.2 The role of exposure and vulnerability in emergency decision-making
Figure 5 presents the cumulative distribution of the scores of the participants for each information set in the two rounds. Here, our aim is to examine (i) whether the different sets of information provided led to different scores (and hence decisions) and (ii) whether the information on exposure and vulnerability helped the participants to make correct emergency decisions. In the first round (R1), 43 % of the participants achieved higher scores when Quali_RF + Quali_Exp (E2) information was given to them. In the second round, the highest percentage of participants (47 %) scored highest when the information on Quali_RF + Quali_Vul (E3) was provided. Figure 5a shows less distance between the curves of R1_E1 and R1_E2 than between R1_E1 and R1_E3, with R1_E2 displaying higher scores overall and R1_E3 displaying the lowest score distribution.

Figure 5Cumulative distributions of the scores of all 111 participants, depending on the information set (E1, E2, and E3) (a) in the first round R1 and (b) in the second round R2.
In the second round (Fig. 5b), there is an evident change in the distribution of scores for all three information sets. All the curves display higher median scores than in Round 1, as noted previously. R2_E1 and R2_E2 are located close together, but the tails of their distributions have moved significantly towards negative scores. This possibly implies that some participants could not consistently make correct decisions for the very severe compound events in Round 2 based on the information provided in E1 or E2. The curve for E3, which consisted of the lowest scores in the first round, has moved considerably towards high positive scores in the second round. This indicates that most of the participants made a greater number of correct decisions when given the total vulnerability information, thus achieving higher scores. Overall, the participants scored well using the combination of rainfall forecast and exposure in the first round and rainfall forecast and vulnerability in the second round, regardless of the order in which the experiments were presented. The participants made different decisions based on the information on exposure alone, full vulnerability, and severity of the crisis.
Further, we analyse the worksheets of the top 10 scorers in the game to understand which information they actually used. Of these participants, 8 out of the 10 scored higher in the second round than in the first. In the first round, four participants reached higher scores with the information provided in experiments E1 and E2, while only two reached higher scores with E3. In the second round, five participants reached higher scores with the information in E3, three with E1, and two with E2. The information supporting the high scores of the top 10 scorers is largely consistent with the results observed for the entire group of participants.
4.3 The role of education and experience in emergency decision-making
We selected participants with the positions “Masters” (25 out of 111), “PhDs” (55 out of 111), and “researchers” (31 out of 111) to understand their preferred choice of information. These three positions were selected to understand how education level and research experience influence emergency decisions. We assumed that the researchers had the highest level of experience, followed by the PhDs and Masters students. The participants were also asked to rate their knowledge in the field of expertise on a scale from 0 to 10. Based on the information received, we divided participants who rated their knowledge between 0 and 6 (52 out of 111) and between 7 and 10 (59 out of 111). The inferences were drawn assuming that the participants were as honest as one can be while rating oneself.
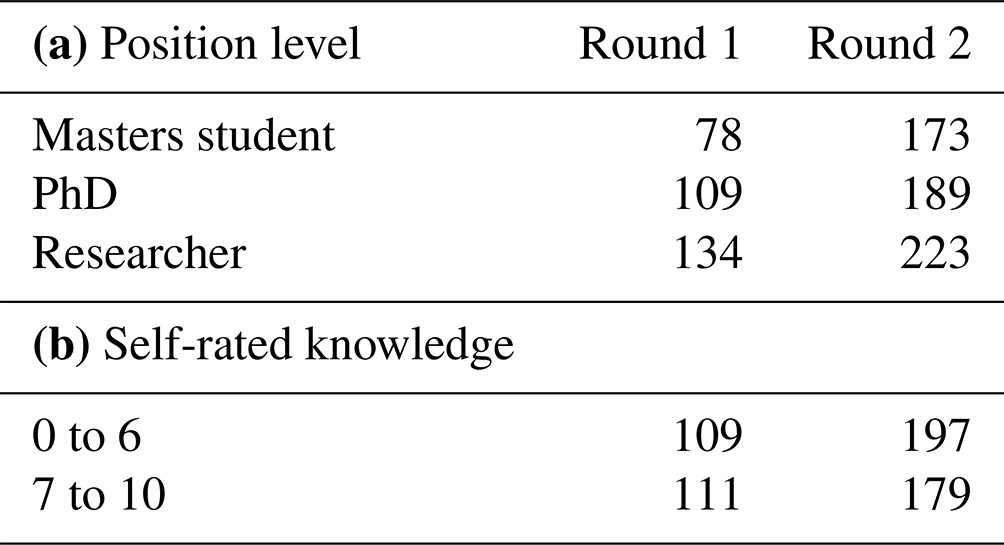
We analysed the scoring patterns based on education level and self-rated knowledge. The results show that the information set used to achieve the best scores is largely similar to the overall trend that was observed for all 111 participants (Sect. 4.2). We calculated the mean scores achieved by each of the three positions to infer whether the level of experience played a role in achieving higher scores. Table 3a presents the mean score obtained by the three positions in the two rounds. The researchers achieved the highest mean score in the first round, followed by the PhDs and Masters students. A similar trend was observed in the second round, with the researchers performing comparatively better than both the PhDs and Masters students, suggesting that the level of experience does play a role in decision-making. Further, Table 3b presents the mean scores based on their self-rated knowledge. The results show that the participants reached almost similar mean scores in the first round irrespective of their declared ratings. In the second round, the participants who rated themselves lower obtained higher mean scores (197) than the participants who rated themselves higher (179). This suggests that self-rated knowledge may not be a reliable indicator of a participant's decision-making ability.
Table 3The mean and cumulative scores achieved by the participants in the two rounds based on (a) their position level and (b) their self-rated knowledge.
4.4 The role of a hazard-vulnerability context in emergency decision-making
In this section, we analyse the scores of the participants for each of the three selected towns in the study – Alpha, Beta, and Gamma. In the first round, when the event was announced and started, participants achieved the highest mean score for town Alpha (47), followed by towns Gamma (36) and Beta (21). In the second round, when the severity of the event was announced and several drivers of flood came into play, the highest mean score was obtained for town Beta (67), followed by towns Alpha (49) and Gamma (45). In Sect. 4.2, the results showed that the participants primarily used the information on Quali_RF + Quali_Exp to achieve higher scores in the first round, while Quali_RF + Quali_Vul were mainly used in the second round. However, almost similar mean scores for Alpha in both rounds indicate that contexts of ground-level hazards and vulnerabilities likely influenced the decisions, just like information sets did.
Table 4 presents the levels of hazard, exposure, and vulnerability estimated for the three towns in the two rounds. Here, the levels of exposure and vulnerability in the towns vary with the rounds because the indicators used to calculate them are scaled based on the actual area of the ward which was flooded in 2005. Moreover, the cumulative distribution of each participant's score in the three towns is presented in Fig. 6. The score distributions show that the participants used the information in E3 to make the best decisions in all three towns, followed by E2 and E1, irrespective of the condition of hazard vulnerability prevalent in the three towns. Greater differences between the three information sets are observed in Alpha and Beta, where the intensity of the hazard was greatest (moderate to high in Alpha and high to extreme in Beta; see Table 4). This suggests that, in these towns where high hazard severity required drastic measures (all actions taken), the type of adjacent vulnerability information played a crucial role. By contrast, in town Gamma, where the hazard severity was low to moderate and where actions should have been taken parsimoniously, the vulnerability information did not necessarily help discriminate between the actions to take.
Table 4Levels of hazard, exposure, and vulnerability calculated for the three towns in the two rounds. Here, ∗ denotes the occurrence of the compound events.
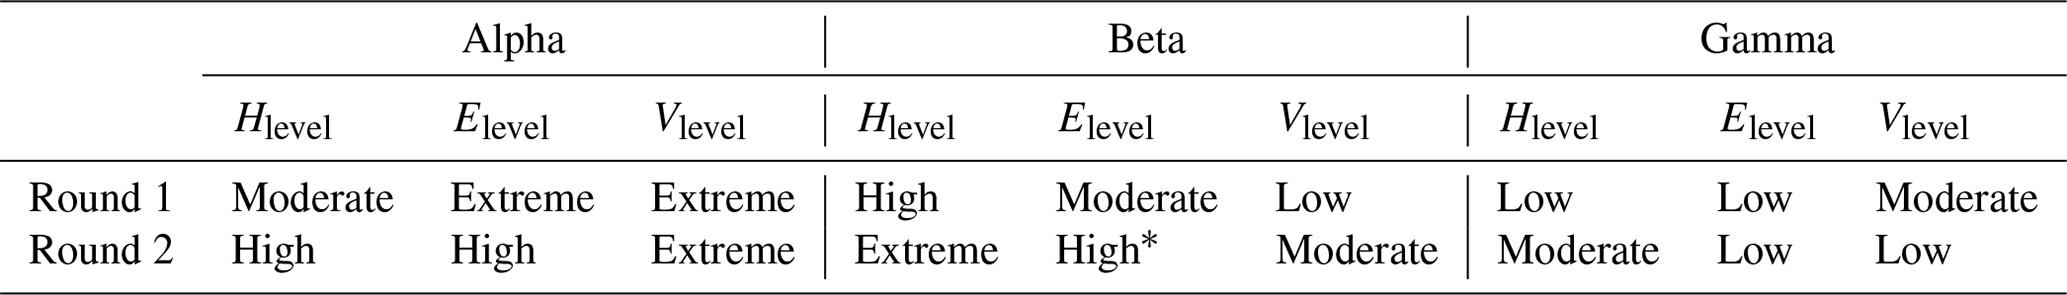
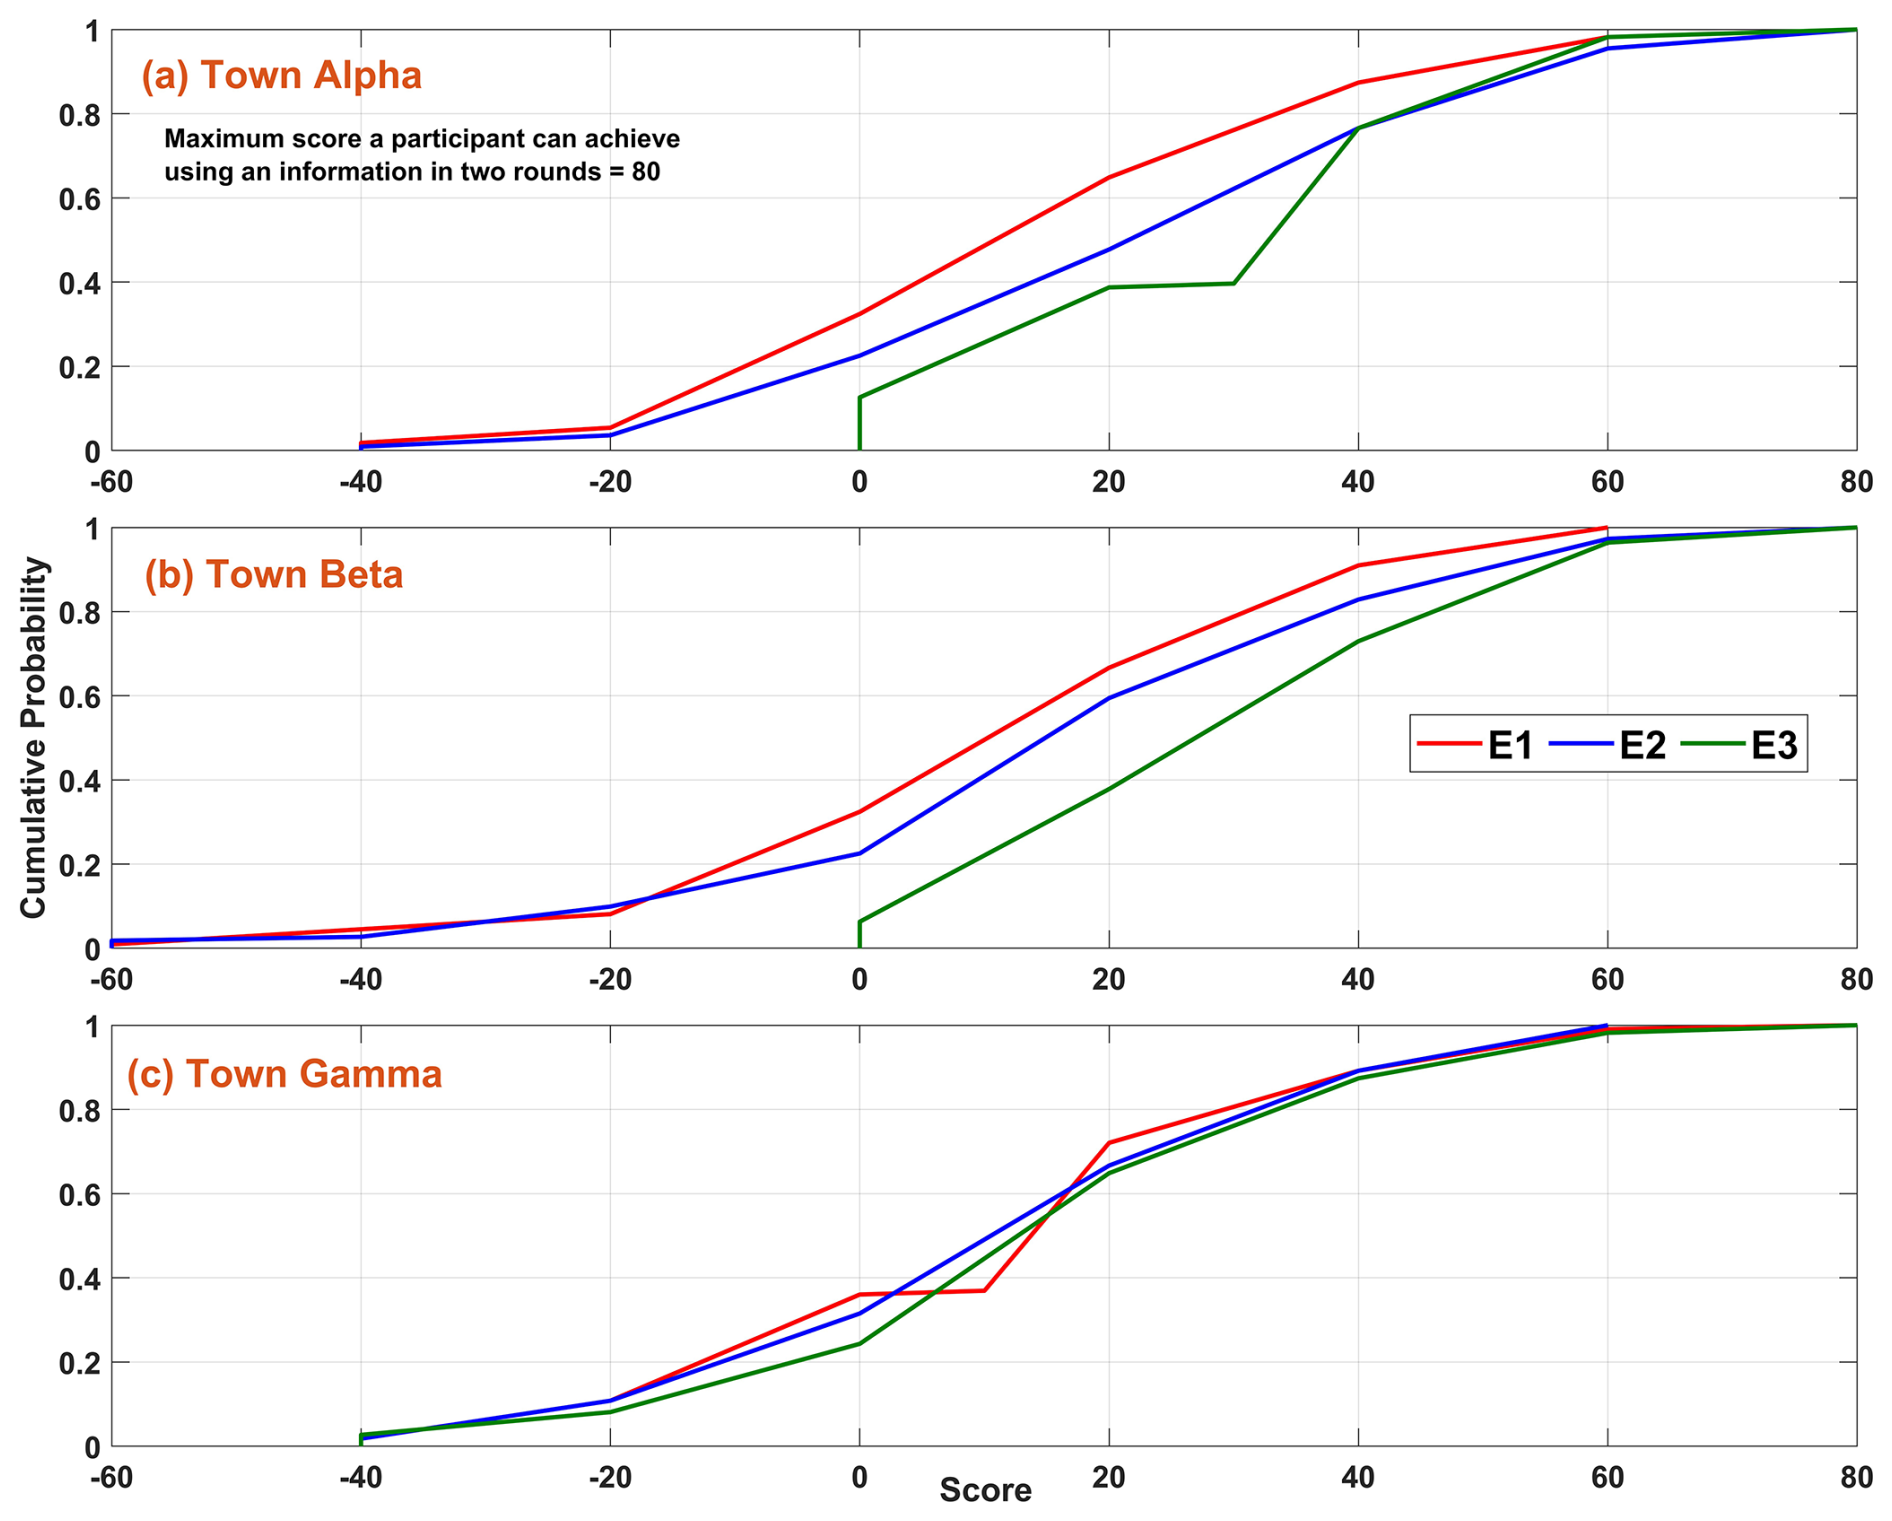
Figure 6Cumulative distributions of the 111 participants' scores in the three towns of Alpha, Beta, and Gamma, depending upon the information E1, E2, and E3.
4.5 Perceived usefulness of the information compared to the actual decision-making
In the final survey, we asked the participants a few questions about their perception of the usefulness of the different information sets (see Appendix A and Section D). In this section, we first analyse the preferences of the participants in terms of the information sets, and then we assess whether these preferences are consistent with the scores they obtained using each information set.
4.5.1 Analysis of participants who prefer exposure and vulnerability information for emergency decision-making
In the final survey, we asked the participants about the usefulness of the exposure and vulnerability information in emergency decision-making. We gave them four options to choose from – not useful, slightly useful, useful, and very useful. Out of the 111 participants, around 9 % found the information slightly useful, 50 % found it useful, 41 % found it very useful, and none found it not useful (Fig. 7). This suggests that the information on exposure and vulnerability helped the participants to make correct decisions.
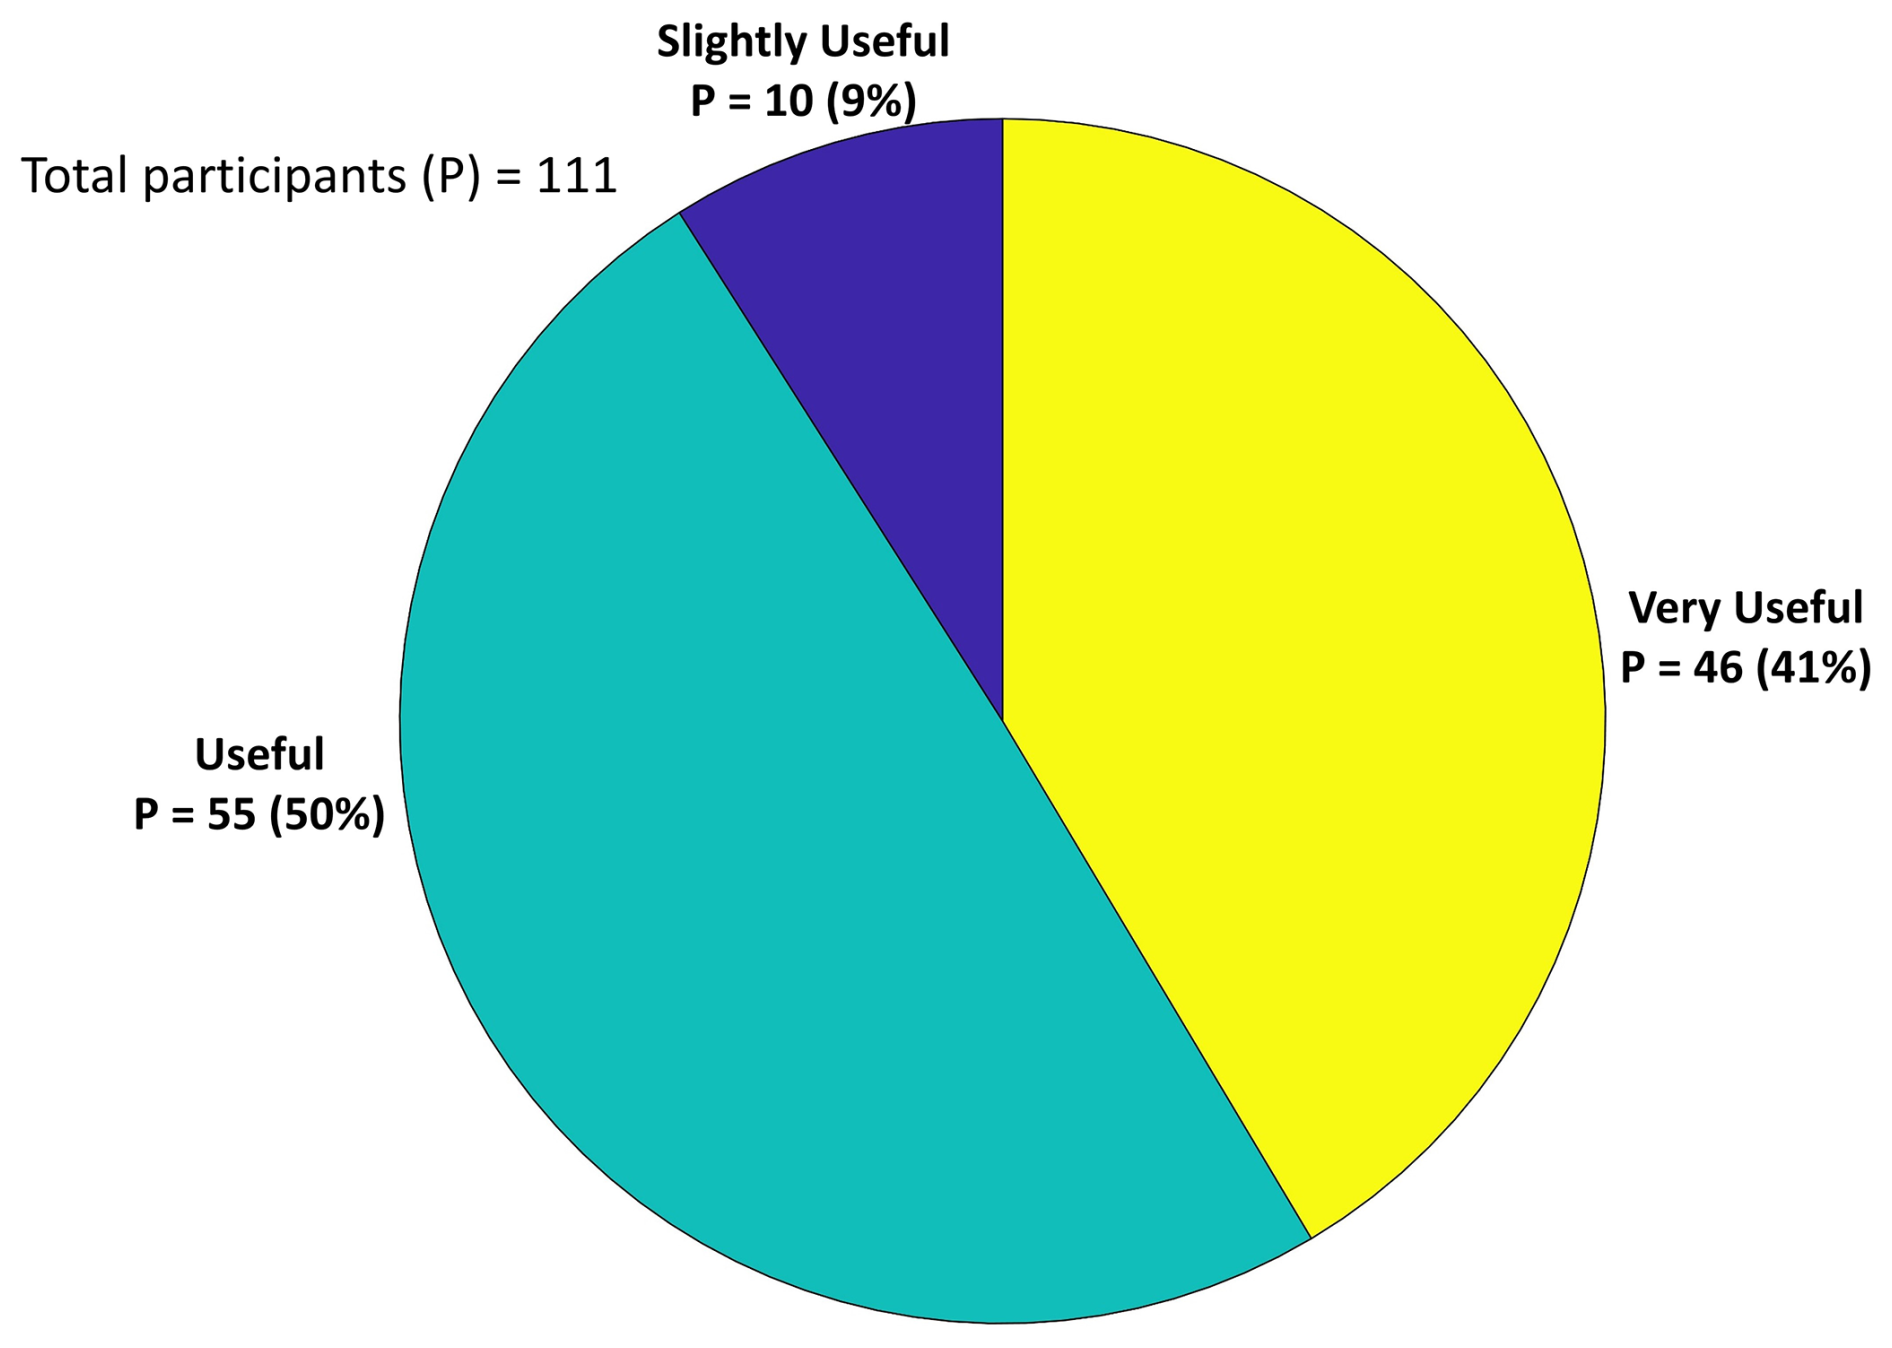
Figure 7Participants' answers, in the final survey, regarding the usefulness of the exposure and vulnerability information for decision-making.
4.5.2 Analysis of participants who preferred qualitative rainfall information and exposure and vulnerability information for making decisions
We asked the participants this question in the final survey: “If you had only one kind of information for making decisions, which one would you have preferred?” In response, 21 of the 111 participants picked the combination of Quant_RF and Quant_Pop (E1) as the most useful one for making decisions, and 29 of the 111 picked Quali_RF + Quali_Exp (E2) as the best information (Fig. 8a). The highest number of participants (61 of 111) chose Quali_RF + Quali_Vul (E3) as the most suitable ones for making decisions. We examine whether the choices made by the participants in the final survey are consistent with the scores they obtained in the game rounds. The results show that, of the 21 participants who consciously opted for E1, 23 % actually achieved higher scores in R1_E1 than in R1_E2 and R1_E3, while 19 % achieved higher scores in the second round (Fig. 8b). Therefore, a small percentage of the participants who preferred E1 in the survey actually achieved high scores with E1. Moreover, of the 29 participants who opted for E2 in the final survey, 47 % actually scored higher with E2 in the first round. However, the percentage dropped to 21 % in the second round. Of the 61 participants who perceived E3 to be the most suitable information, 29 % achieved higher scores during the first game round and 49 % during the second game round.
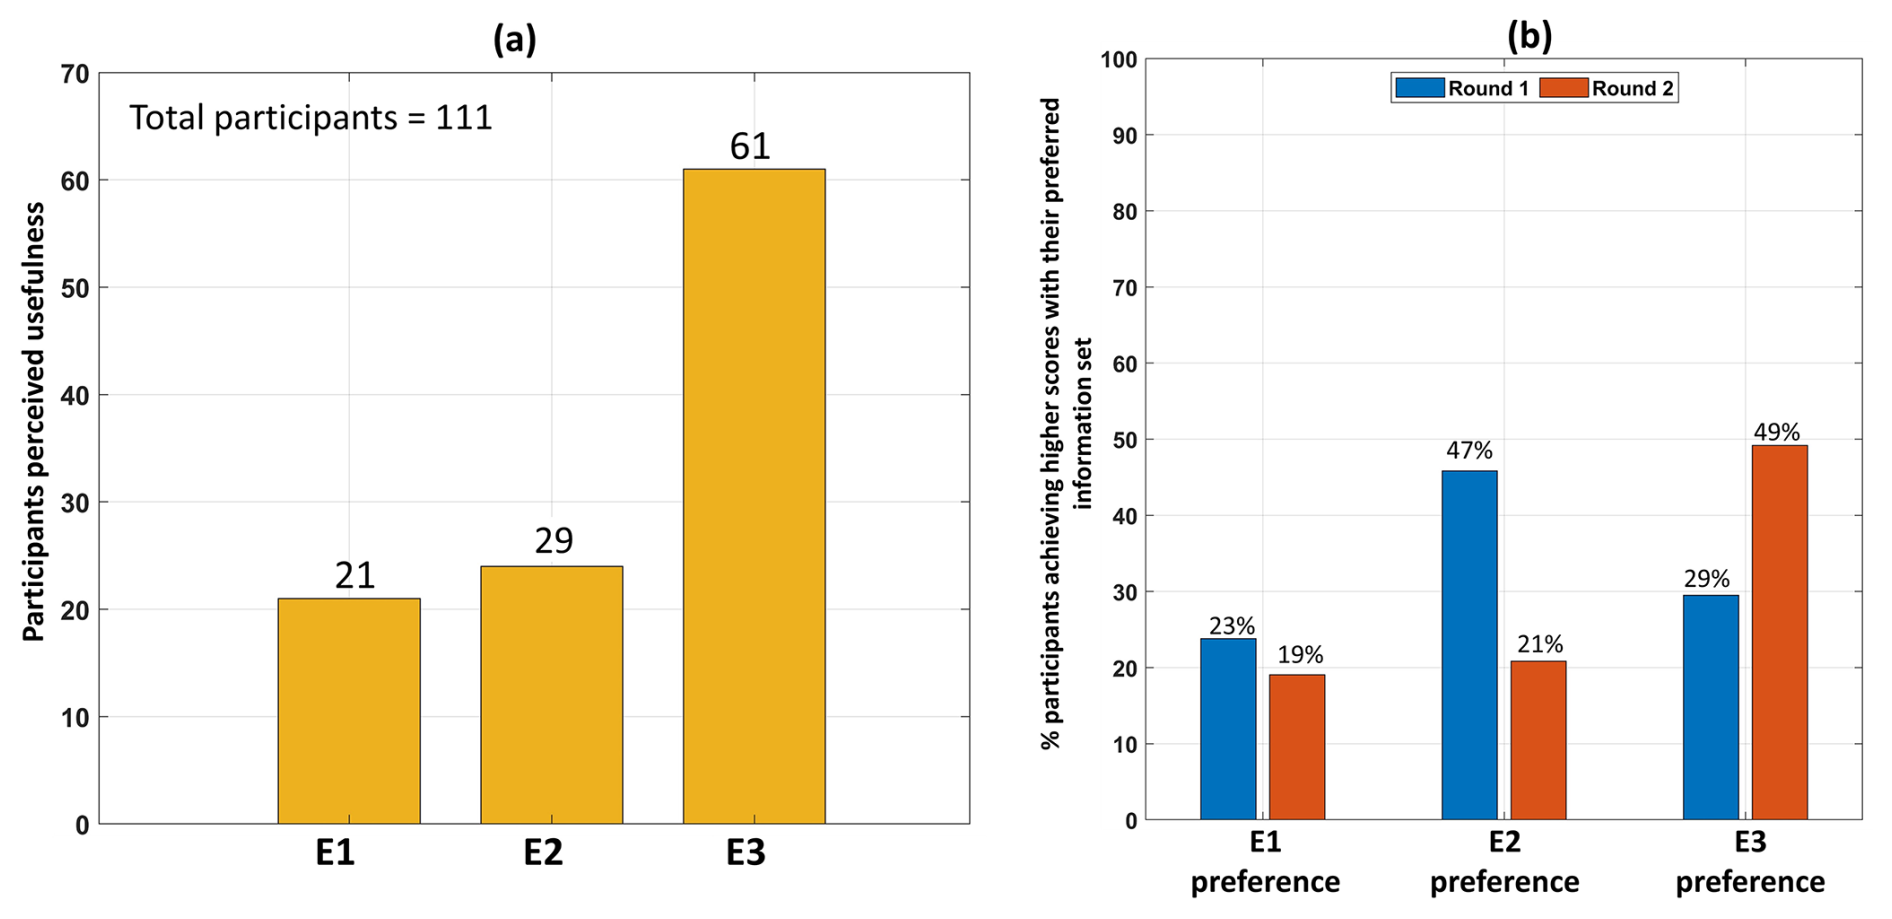
Figure 8Description of the (a) participants' preferences for the different information sets (E1, E2, and E3) as declared in the final survey and the (b) percentage of participants with a preference for each information set, achieving a higher score with that preferred information set.
The results suggest that the participants' perceived usefulness of the information and its actual usefulness do not match. The largest difference is observed in the case of E1, in which participants could not obtain higher scores in any of the two rounds using the information of their choice. Close to half of the participants who preferred E2 or E3 actually achieved higher scores with their preferred information set, in either the first or second round. The participants who preferred E2 in the survey achieved higher scores in the first round, while those who opted for E3 only achieved the same in the second round.
4.5.3 Analysis of participants who find qualitative information on rainfall to be suitable for making decisions
When asked in the final survey about their preference for qualitative or quantitative information on rainfall, 64 out of the 111 participants responded in favour of qualitative information, while 47 out of the 111 opted for the quantitative form of rainfall information (Fig. 9a). We compared these preferences with the scores they obtained during the gameplay. Each player made a total of 72 decisions during the game in both rounds. Of these 72 decisions, 24 were made using the quantitative information on rainfall (E1), while the remaining 48 were made with the qualitative information (E2 and E3). Then, we examined the total number of correct decisions made by the participants according to their respective preferences. The 64 participants who preferred the qualitative information made, on average, 56 % correct decisions using the qualitative information in the first round, and 63 % of the decisions were correct in the second round (Fig. 9b). For the remaining 47 participants (who preferred the quantitative rainfall information in the final survey), 38 % of the decisions were correct in the first round, while only 32 % were correct in the second round (Fig. 9c).

Figure 9Description of (a) participants' preferences, in the final survey, for qualitative or quantitative information on the rainfall forecast and (b) participants' actual performances during the two game rounds (R1 and R2) using qualitative rainfall information and (c) quantitative rainfall information.
5.1 The role of exposure and vulnerability in decision-making
One of the main research questions in this study is ascertaining which type of vulnerability information (of a population-based single indicator, exposure, and total vulnerability) can best combine with the extreme rainfall and flood hazard information for emergency decision-making in IBFs. We observed that most of the participants made the best decisions using the qualitative rainfall forecast and exposure information in the first game round. Interestingly, when the information on vulnerability was provided along with rainfall in the first round, far fewer correct decisions were made. In the second round, the participants used the qualitative rainfall forecast and vulnerability information to make the best possible decisions for compound events of extreme precipitation, river overflow, and high tide. Vulnerability provided a larger scope for ground-level information than exposure. This implies that, in emergency situations, it is important to select the information that best suits the decisions to be made, as also pointed out by Misra et al. (2020). We noticed that the mere availability of more (and possibly more complicated) information can lead to information overload (van den Homberg et al., 2018), thus overcomplicating the decision-making process.
One of the main challenges in the game was to make sure that the participants differentiated between the exposure and vulnerability information and used it according to the situation of the game. Differentiating between the two information sets was tricky since the participants could only see the colours representing the severity of exposure and vulnerability and not the actual indicators or values used to create them. The participants used different information sets in the two rounds of the game to make decisions, which suggests that they were able to understand the differences between the information sets. This also indicates that the information sets on exposure and vulnerability have different roles in the decision-making process that are determined by the severity of the situation on the ground.
5.2 The role of education and knowledge in decision-making
Similar to Kim et al. (2018), the results from the game show that a higher education level and greater research experience lead to better emergency decision-making. The researchers obtained the highest mean score in both rounds, followed by the PhDs and Masters students. The researchers, due to their higher education and experience level, may have understood the different hazard-vulnerability contexts of the two rounds better. Greater research experience possibly allowed them to select the best information for making their decisions, making them more consistent in decision-making across the three towns. The Masters students made significantly more correct decisions in the second round than in the first, suggesting that they were able to adapt to the decision-making process.
The results from self-rated knowledge do not show a particular pattern in decision-making, suggesting that self-rated knowledge may not be a reliable indicator of a participant's decision-making ability. Possible reasons for the lack of a trend could be that (i) rating your own expertise in a research area is not simple or that (ii) a higher knowledge level does not always correspond to better emergency decision-making abilities.
5.3 The role of hazard-vulnerability contexts in decision-making
The ground-level situation of hazard and vulnerability determines which information can better manage the severity of the situation. For instance, when the intensity of the hazard was greatest (such as in Alpha and Beta), the information on the vulnerability played a crucial role in suggesting to the participants which decisions to actually make. When the hazard severity was low (as in Gamma), the same vulnerability information could not always guide the participants in making decisions. This might suggest that vulnerability information helped confirm the drastic measures in extreme situations. In towns with low to moderate risks, good understanding of the actions and levels of risk aversion of the participants may have played a greater role than the format of the vulnerability information. Overall, the low scores of the participants in the game indicate that emergency decision-making is not straightforward, especially in the case of sudden events such as flash floods. Considering that the game was designed in such a way as to closely represent the actual flood event of 2005, low scores demonstrate how flood managers can have trouble identifying the optimal outcome amid an event. This also suggests how important it is that decision-makers are experts in their fields, have comprehensive knowledge of their territory, and are well-trained for coping with difficult situations. Prior experience in decision-making can also help to analyse the best possible options corresponding to the available resources and accuracy of the information.
5.4 Perceived and actual usefulness of the information presented
Each participant had their own understanding of hazard, exposure, and vulnerability. Upon playing the game, they also gained personal perceptions and experience of these concepts in the game. We asked the participants in the final survey about the perceived usefulness of the exposure and vulnerability information in making decisions: almost all of the participants (91 %) found both exposure and vulnerability information to be useful to very useful. On the most preferred combination of information, the majority of the participants selected rainfall forecast and vulnerability; however, only a small percentage of them (29 % and 49 % in the first and second rounds, respectively) could actually use this to make the correct decisions. Having said that, the perception of information may not always match the highest obtained score. Preference may be based not solely on the score outcome, but also on the ease of understanding the information provided (e.g. qualitative versus quantitative information) and whether the participants felt they had enough information to make the right decisions (e.g. exposure versus vulnerability). Interestingly, a larger proportion of the participants (64 %) preferred the qualitative information on rainfall to the quantitative information in the survey. The results suggest that the participants who preferred the qualitative rainfall in the final survey were actually able to use it to make correct decisions during the game (56 % and 63 % in the first and second rounds, respectively). However, a significant portion of those participants who selected the quantitative rainfall information in the final survey were unable to reach better decisions with the information.
5.5 Game limitations and prospects for future research
Although based on real events, the concepts involved in the INSPIRE flood game are more wide-ranging than its storyline portraying a flash flood situation in an urban context. Flash flood was considered a hazard in the game. However, other natural or anthropogenically induced hazards could also be included to assess the role of exposure and vulnerability in decision-making. In the present setup of the game, a single participant could make all four possible decisions. Roles can be distributed among the players to better understand a participant's thought process behind each decision, as shown by Terti et al. (2019). In this game, we do not aim to understand the role of human interactions in making emergency decisions. We aim to study how hazard-vulnerability information, which would be communicated by a meteorological department or an early warning system, is received and interpreted by an individual to appraise the criticality or priority of a situation. Further, the roles of rainfall and flood forecasts as well as their reliability and behaviour were not evaluated in the game, which was more of a focus point in other, similar games (Arnal et al., 2016; Guido et al., 2023). It could be interesting (and a bit more complicated) to comprehend the decision-making process when all three factors, i.e. hazard, exposure, and vulnerability, show uncertainty. Moreover, since the game was played on worksheets with no real risk of damage to life and property, the participants may have behaved as risk-prone and taken sufficient actions or as risk-averse and taken unnecessary actions. To avoid additional complexity, it was assumed that the participants had unlimited resources and staff to make and implement their decisions. The inclusion of some constraints such as a fixed number of volunteers for each decision, budgetary constraints, or fictitious lives at stake could enhance the potential reality of the game. The storyline of this game was real. However, the oversimplification of such drastic events may impact the transfer of the overall outcomes from the game to real-life decision-making, as opined by Aubert et al. (2019).
While, in the present work, only exposure as a component of vulnerability was included, future work may add other components such as sensitivity and adaptive capacity in the game to enhance the socio-economic understanding of an area. The addition of more such concepts would enable the participants to better anticipate the probable impacts, especially in regions which witness frequent floods (Weis et al., 2016). Moreover, future research could explore the design of a two-step game in which the decisions made by the participants are validated by people and stakeholders for whom the decisions are actually made, instead of the decision-makers. These stakeholders could be office workers, parents, local shop owners, or transport owners, who can offer opinions on whether the decisions made by the participants are actionable or not. This will enhance the reliability of decisions that are made on worksheets during the game and will help to bridge the gap between in-game decision-making and its practical implementation on the ground. Finally, there is a need for better communication and possibly greater simplification of the exposure and vulnerability information provided to the participants before the start of the game. To address this, future work may focus on presenting the information differently, which may also include the actual indicators used to create the qualitative colour codes, as quantitative values or in the form of a warning matrix.
This paper presents a game experiment designed to simulate emergency decision-making in a flash flood triggered by extreme rainfall, inspired by an actual event in 2005 in Mumbai, India. The game is designed to understand the roles of hazard, exposure, and vulnerability information in impact-based forecasting and their perceived usefulness for decision-makers in emergency management. It was played by a total of 123 participants during six distinct in-person sessions held at academic and research institutions across India. In the game, participants were sequentially provided with town-scale information on 4-hourly accumulated rainfall forecasts, flood-prone population density, exposure, and vulnerability, on the basis of which they made decisions. In the first round, participants made decisions in response to an extreme rainfall event, while in the second round they made the same decisions for compound events of extreme rainfall, flash floods, and high tide.
During the game, participants were supposed to consider the information provided to them in isolation and make fresh decisions each time, without any influence of the previous information provided in the previous experiment or round. In the first round, a large proportion of the participants achieved higher scores using a combination of rainfall forecast and exposure. In the second round, the majority of them obtained higher scores when the information on rainfall forecast and vulnerability was provided to them, regardless of the order of the experiments.
The conclusions drawn from this game can help in further progress of impact-based forecasting of extreme hydro-climatic events. First, it is important to include the information on local exposure and vulnerability, along with the rainfall and flood forecast, while developing impact-based approaches or services. The information on exposure is particularly useful in making preliminary decisions in the wake of an extreme hydrological event, while vulnerability is effective if and when the situation on the ground has worsened over a period of time. During the feedback session, several participants, while acknowledging the relevance of exposure and vulnerability, suggested providing a broader overview of the concepts before the start of the game. Second, the participants demonstrated significant improvement in decision-making in the second round of the game. One clear reason for this improvement is that they developed a greater understanding of the decision-making process in the first round. After the game, few participants in any session wished to play the first round again. When reminded that they already knew the correct decisions, they asked to play a different game, as they believed they could make better decisions this time round. This strongly indicates that there is a need for a greater focus on training and developing decision-makers by putting them in diverse scenarios, presenting them with different information, and working on their risk-taking behaviour in order to develop comprehensive decision-making expertise. Finally, the game is a simplified representation of reality, having no ability or intention to replicate the actual event which occurred in Mumbai in 2005. The main purposes are to experience, investigate, and discuss the challenges of decision-making in such emergency situations and transfer possible solutions to real-world impact-based forecasting as far as possible. The prospects of saving your town from flooding, collecting negative points for incorrect decisions, being fired from your job, and the joy of saving your town in the end added a light touch to the game and created an inclusive environment for discussing the usefulness of different information related to emergency decisions for impact-based forecasting. The decision-making framework developed here can be useful to forecasters, meteorological departments, urban planners, policy-makers, and disaster response authorities for making well-informed decisions and generating effective impact-based forecasts and early warnings.
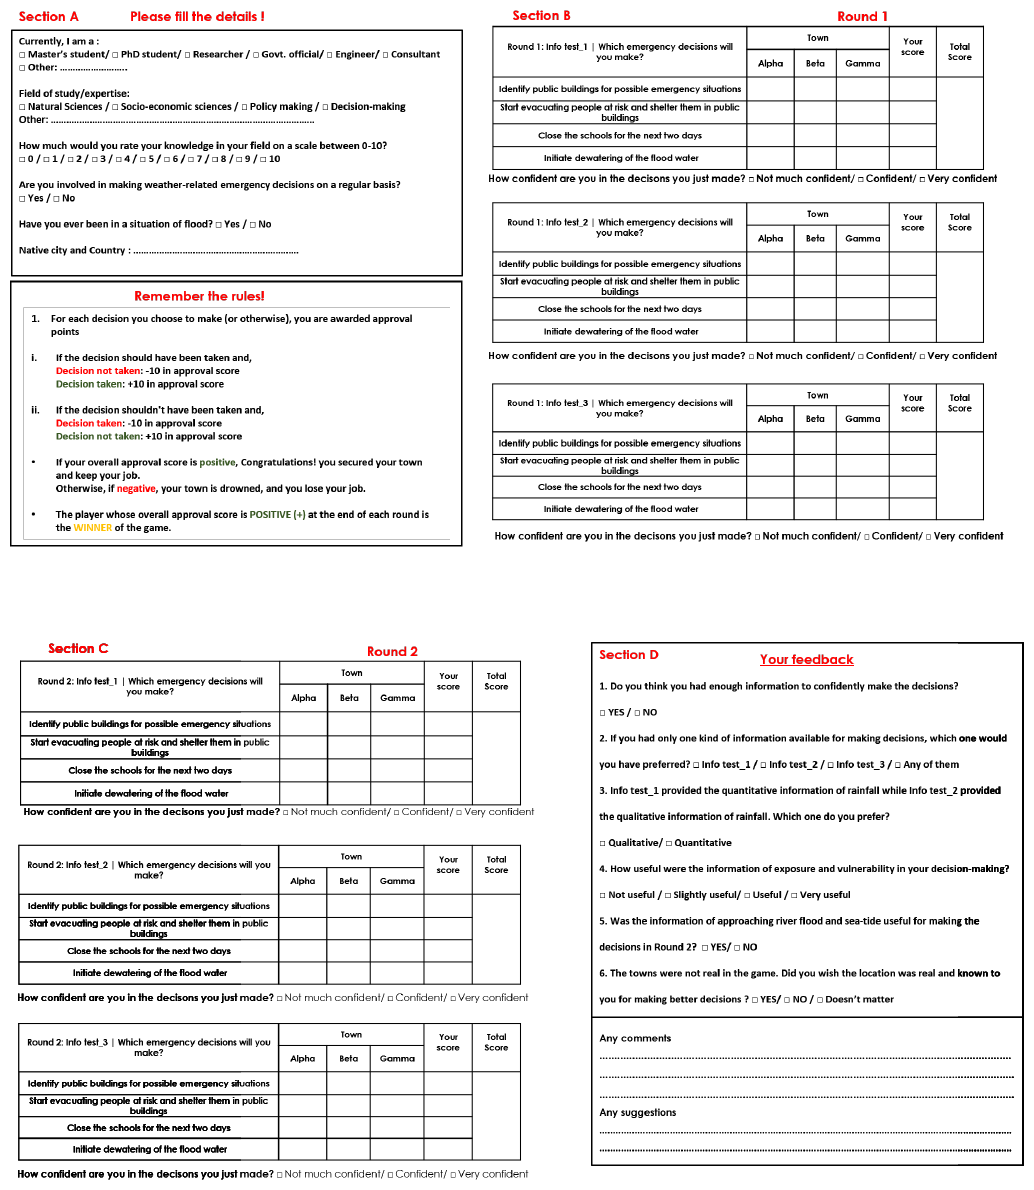
Figure A1The worksheet (two pages) distributed to the game participants, on which they noted their decisions. The first page consists of Section A, where the participants filled in some of their personal details, and Section B, where they noted the decisions for the first round. The second page consists of Section C, where the participants noted the decisions for the second round, and in Section D they submitted their responses to a final survey.
Since the extreme rainfall event witnessed over Mumbai in a few hours was unprecedented, there are no existing criteria that can be used to classify that amount of rainfall. Hence, we developed a criterion for classifying the rainfall forecast in colour codes in the paper. First, historical observed rainfall amounts were explored to find the highest ever 1-hourly and 3-hourly rainfall over Mumbai. These rainfall amounts were 113 and 253 mm, respectively. The rainfall amounts were then classified in four categories based on equal proportions.
If rainfall (mm) ≤113, the category is defined as Level I (green). If rainfall (mm) >113–183, the category is Level II (yellow). If rainfall (mm) >183–253, the category is Level III (orange). If rainfall (mm) >253, the category is Level IV (red).
Table D1Details of the game sessions convened at different host institutes and organizations.
The data that support the findings of this study are available from the corresponding author upon reasonable request.
AS: conceptualization; formal analysis; original draft writing; investigation; visualization; funding acquisition. LC: methodology; conceptualization; visualization; validation; manuscript writing and editing; supervision. IR: methodology; conceptualization; visualization; validation; manuscript writing and editing. SKJ: methodology; conceptualization; visualization; validation; manuscript writing and editing; supervision.
The contact author has declared that none of the authors has any competing interests.
Publisher's note: Copernicus Publications remains neutral with regard to jurisdictional claims made in the text, published maps, institutional affiliations, or any other geographical representation in this paper. While Copernicus Publications makes every effort to include appropriate place names, the final responsibility lies with the authors.
We thank all the participants who took part in this experiment as well as the volunteers who played the game in order to test it and fix any obvious shortcomings. We would like to thank the host institutes Central University of South Bihar, Indian Institute of Science Education and Research (Bhopal), Indian Institute of Tropical Meteorology (Pune), and Municipal Corporation of Greater Mumbai for providing us with the necessary facilities to convene the game sessions. We especially acknowledge the support provided by the Disaster Management Authority of the Municipal Corporation of Greater Mumbai for providing us with all the relevant data and information about the flood situation in Mumbai. We also thank the representative for playing the game and providing us with the optimal decisions based on which the decisions of the participants were evaluated. The resources and support provided by the Institute of Environmental Geosciences at the Université Grenoble Alpes, where the concept of the game was actually developed, is also acknowledged.
This research has been supported by the Raman-Charpak fellowship awarded to Akshay Singhal by the Indo-French Centre for the Promotion of Advanced Research (IFCPAR/CEFIPRA; IFC/4141/RCF 2022/385), the Department of Science and Technology, Government of India (DST/INSPIRE/03/2019/001343) (IF 190257) for the DST-INSPIRE PhD fellowship, and the Science and Engineering Research Board (SERB) project, CRG/2022/004006 awarded to Sanjeev Jha.
This paper was edited by Christa Kelleher and reviewed by two anonymous referees.
Ahlgrimm, M., Forbes, R. M., Morcrette, J.-J., and Neggers, R. A. J.: ARM's Impact on Numerical Weather Prediction at ECMWF, Meteor. Mon., 57, 28.1–28.13, https://doi.org/10.1175/amsmonographs-d-15-0032.1, 2016. a
Arnal, L., Ramos, M.-H., Coughlan de Perez, E., Cloke, H. L., Stephens, E., Wetterhall, F., van Andel, S. J., and Pappenberger, F.: Willingness-to-pay for a probabilistic flood forecast: a risk-based decision-making game, Hydrol. Earth Syst. Sci., 20, 3109–3128, https://doi.org/10.5194/hess-20-3109-2016, 2016. a, b, c
Aubert, A. H., Bauer, R., and Lienert, J.: A review of water-related serious games to specify use in environmental Multi-Criteria Decision Analysis, Environ. Modell. Softw., 105, 64–78, https://doi.org/10.1016/j.envsoft.2018.03.023, 2018. a
Aubert, A. H., Medema, W., and Wals, A. E.: Towards a Framework for Designing and Assessing Game-Based Approaches for Sustainable Water Governance, Water, 11, 869, https://doi.org/10.3390/W11040869, 2019. a, b
Balaganesh, G., Malhotra, R., Sendhil, R., Sirohi, S., Maiti, S., Ponnusamy, K., and Sharma, A. K.: Development of composite vulnerability index and district level mapping of climate change induced drought in Tamil Nadu, India, Ecol. Indic., 113, 106197, https://doi.org/10.1016/j.ecolind.2020.106197, 2020. a
Ballard, S. P., Li, Z., Simonin, D., and Caron, J. F.: Performance of 4D-Var NWP-based nowcasting of precipitation at the Met Office for summer 2012, Q. J. Roy. Meteor. Soc., 142, 472–487, https://doi.org/10.1002/QJ.2665, 2016. a
Bohra, A. K., Basu, S., Rajagopal, E. N., Iyengar, G. R., Das Gupta, M., Ashrit, R., and Athiyaman, B.: Heavy rainfall episode over Mumbai on 26 July 2005: Assessment of NWP guidance, Curr. Sci. India, 90, 1188–1194, 2006. a
Coughlan de Perez, E., van den Hurk, B., van Aalst, M. K., Jongman, B., Klose, T., and Suarez, P.: Forecast-based financing: an approach for catalyzing humanitarian action based on extreme weather and climate forecasts, Nat. Hazards Earth Syst. Sci., 15, 895–904, https://doi.org/10.5194/nhess-15-895-2015, 2015. a
Craven, J., Angarita, H., Corzo Perez, G. A., and Vasquez, D.: Development and testing of a river basin management simulation game for integrated management of the Magdalena-Cauca river basin, Environ. Modell. Softw., 90, 78–88, https://doi.org/10.1016/j.envsoft.2017.01.002, 2017. a
Crochemore, L., Ramos, M. H., Pappppenberger, F., Van Andel, S. J., and Wood, A. W.: An Experiment on Risk-Based Decision-Making in Water Management Using Monthly Probabilistic Forecasts, B. Am. Meteorol. Soc., 97, 541–551, https://doi.org/10.1175/BAMS-D-14-00270.1, 2016. a, b
Crochemore, L., Cantone, C., Pechlivanidis, I. G., and Photiadou, C. S.: How Does Seasonal Forecast Performance Influence Decision-Making? Insights from a Serious Game, B. Am. Meteorol. Soc., 102, E1682–E1699, https://doi.org/10.1175/BAMS-D-20-0169.1, 2021. a
Flood, S., Cradock-Henry, N. A., Blackett, P., and Edwards, P.: Adaptive and interactive climate futures: systematic review of “serious games” for engagement and decision-making, Environ. Res. Lett., 13, 063005, https://doi.org/10.1088/1748-9326/AAC1C6, 2018. a
Forrest, S. A., Kubíková, M., and Macháč, J.: Serious gaming in flood risk management, WIRes Water, 9, e1589, https://doi.org/10.1002/WAT2.1589, 2022. a
Gallopín, G. C.: Linkages between vulnerability, resilience, and adaptive capacity, Global Environ. Chang., 16, 293–303, https://doi.org/10.1016/j.gloenvcha.2006.02.004, 2006. a
Geurts, J. L., Duke, R. D., and Vermeulen, P. A.: Policy Gaming for Strategy and Change, Long Range Plann., 40, 535–558, https://doi.org/10.1016/J.LRP.2007.07.004, 2007. a
Government of Maharashtra: Report of the Fact-Finding Committee (FFC) on Mumbai Flood, government report, Government of Maharashtra, vol. 1, 2006. a
Guido, Z., McMahan, B., Hoy, D., Larsen, C., Delgado, B., Granillo, R. L., and Crimmins, M.: Public Engagement on Weather and Climate with a Monsoon Fantasy Forecasting Game, B. Am. Meteorol. Soc., 104, E249–E256, https://doi.org/10.1175/BAMS-D-22-0003.1, 2023. a
Gupta, K.: Urban flood resilience planning and management and lessons for the future: a case study of Mumbai, India, Urban Water J., 4, 183–194, https://doi.org/10.1080/15730620701464141, 2007. a
Hemingway, R. and Robbins, J.: Developing a hazard-impact model to support impact-based forecasts and warnings: The Vehicle OverTurning (VOT) Model, Meteorol. Appl., 27, e1819, https://doi.org/10.1002/MET.1819, 2020. a
Iyengar, N. S. and Sudarshan, P.: A Method of Classifying Regions from Multivariate Data, Econ. Polit. Weekly, 17, 2047–2052, 1982. a, b
Jenamani, R. K., Bhan, S. C., and Kalsi, S. R.: Observational/forecasting aspects of the meteorological event that caused a record highest rainfall in Mumbai, Current Science, 90, 1344–1362, 2006. a
Kaltenberger, R., Schaffhauser, A., and Staudinger, M.: “What the weather will do” – results of a survey on impact-oriented and impact-based warnings in European NMHSs, Adv. Sci. Res., 17, 29–38, https://doi.org/10.5194/asr-17-29-2020, 2020. a
Kim, H. B., Choi, S., Kim, B., and Pop-Eleches, C.: The role of education interventions in improving economic rationality, Science, 362, 83–86, https://doi.org/10.1126/science.aar6987, 2018. a
Kirkwood, C., Economou, T., Odbert, H., and Pugeault, N.: A framework for probabilistic weather forecast post-processing across models and lead times using machine learning, Philos. T. Roy. Soc. A, 379, 20200099, https://doi.org/10.1098/rsta.2020.0099, 2021. a
Kox, T., Lüder, C., and Gerhold, L.: Anticipation and Response: Emergency Services in Severe Weather Situations in Germany, Int. J. Disast. Risk Sc., 9, 116–128, https://doi.org/10.1007/S13753-018-0163-Z, 2018. a
Lala, J., Bazo, J., Anand, V., and Block, P.: Optimizing forecast-based actions for extreme rainfall events, Climate Risk Management, 34, 100374, https://doi.org/10.1016/J.CRM.2021.100374, 2021. a
Mayer, I. S.: The Gaming of Policy and the Politics of Gaming: A Review, Simulation and Gaming, 40, 825–862, https://doi.org/10.1177/1046878109346456, 2009. a
MCGM: Flood Preparedness Guidelines, Tech. rep., https://dm.mcgm.gov.in/flood-preparedness-guidelines (last access: 10 October 2024), 2022. a
Misra, S., Roberts, P., and Rhodes, M.: Information overload, stress, and emergency managerial thinking, Int. J. Disast. Risk Re., 51, 101762, https://doi.org/10.1016/j.ijdrr.2020.101762, 2020. a
Murthy, C. S., Laxman, B., and Sesha Sai, M. V.: Geospatial analysis of agricultural drought vulnerability using a composite index based on exposure, sensitivity and adaptive capacity, Int. J. Disast. Risk Re., 12, 163–171, https://doi.org/10.1016/j.ijdrr.2015.01.004, 2015. a, b
Næss, L. O., Norland, I. T., Lafferty, W. M., and Aall, C.: Data and processes linking vulnerability assessment to adaptation decision-making on climate change in Norway, Global Environ. Chang., 16, 221–233, https://doi.org/10.1016/j.gloenvcha.2006.01.007, 2006. a
Nanditha, J. S. and Mishra, V.: On the need of ensemble flood forecast in India, Water Security, 12, 100086, https://doi.org/10.1016/j.wasec.2021.100086, 2021. a
Omerkhil, N., Chand, T., Valente, D., Alatalo, J. M., and Pandey, R.: Climate change vulnerability and adaptation strategies for smallholder farmers in Yangi Qala District, Takhar, Afghanistan, Ecol. Indic., 110, 105863, https://doi.org/10.1016/j.ecolind.2019.105863, 2020. a
Papagiannaki, K., Lagouvardos, K., Kotroni, V., and Bezes, A.: Flash flood occurrence and relation to the rainfall hazard in a highly urbanized area, Nat. Hazards Earth Syst. Sci., 15, 1859–1871, https://doi.org/10.5194/nhess-15-1859-2015, 2015. a
Parker, L., Bourgoin, C., Martinez-Valle, A., and Läderach, P.: Vulnerability of the agricultural sector to climate change: The development of a pan-tropical Climate Risk Vulnerability Assessment to inform sub-national decision making, PLOS ONE, 14, e0213641, https://doi.org/10.1371/journal.pone.0213641, 2019. a
Poletti, M. L., Silvestro, F., Davolio, S., Pignone, F., and Rebora, N.: Using nowcasting technique and data assimilation in a meteorological model to improve very short range hydrological forecasts, Hydrol. Earth Syst. Sci., 23, 3823–3841, https://doi.org/10.5194/hess-23-3823-2019, 2019. a
Ravuri, S., Lenc, K., Willson, M., Kangin, D., Lam, R., Mirowski, P., Fitzsimons, M., Athanassiadou, M., Kashem, S., Madge, S., Prudden, R., Mandhane, A., Clark, A., Brock, A., Simonyan, K., Hadsell, R., Robinson, N., Clancy, E., Arribas, A., and Mohamed, S.: Skilful precipitation nowcasting using deep generative models of radar, Nature, 597, 672–677, https://doi.org/10.1038/s41586-021-03854-z, 2021. a
Robbins, J. C. and Titley, H. A.: Evaluating high-impact precipitation forecasts from the Met Office Global Hazard Map (GHM) using a global impact database, Meteorol. Appl., 25, 548–560, https://doi.org/10.1002/met.1720, 2018. a
Rumore, D., Schenk, T., and Susskind, L.: Role-play simulations for climate change adaptation education and engagement, Nat. Clim. Change, 6, 745–750, https://doi.org/10.1038/nclimate3084, 2016. a
Rusca, M., Heun, J., and Schwartz, K.: Water management simulation games and the construction of knowledge, Hydrol. Earth Syst. Sci., 16, 2749–2757, https://doi.org/10.5194/hess-16-2749-2012, 2012. a
Samal, N., Ashwin, R., Singhal, A., Jha, S. K., and Robertson, D. E.: Using a Bayesian joint probability approach to improve the skill of medium-range forecasts of the Indian summer monsoon rainfall, Journal of Hydrology: Regional Studies, 45, 101284, https://doi.org/10.1016/j.ejrh.2022.101284, 2023. a
Sermet, Y., Demir, I., and Muste, M.: A serious gaming framework for decision support on hydrological hazards, Sci. Total Environ., 728, 138895, https://doi.org/10.1016/j.scitotenv.2020.138895, 2020. a
Singhal, A. and Jha, S. K.: Can the approach of vulnerability assessment facilitate identification of suitable adaptation models for risk reduction?, Int. J. Disast. Risk Re., 63, 102469, https://doi.org/10.1016/j.ijdrr.2021.102469, 2021. a, b
Singhal, A., Raman, A., and Jha, S. K.: Potential Use of Extreme Rainfall Forecast and Socio-Economic Data for Impact-Based Forecasting at the District Level in Northern India, Front. Earth Sci., 10, 846113, https://doi.org/10.3389/feart.2022.846113, 2022. a
Singhal, A., Cheriyamparambil, A., Samal, N., and Jha, S. K.: Relating forecast and satellite precipitation to generate future skillful ensemble forecasts over the northwest Himalayas at major avalanche and glacier sites, J. Hydrol., 616, 128795, https://doi.org/10.1016/j.jhydrol.2022.128795, 2023. a
Terti, G., Ruin, I., Kalas, M., Láng, I., Cangròs i Alonso, A., Sabbatini, T., and Lorini, V.: ANYCaRE: a role-playing game to investigate crisis decision-making and communication challenges in weather-related hazards, Nat. Hazards Earth Syst. Sci., 19, 507–533, https://doi.org/10.5194/nhess-19-507-2019, 2019. a, b, c
UNDRR: Terminology on Disaster Risk Reduction, https://www.undrr.org/terminology (last access: 10 March 2024), 2017. a, b
van den Homberg, M., Monné, R., and Spruit, M.: Bridging the information gap of disaster responders by optimizing data selection using cost and quality, Comput. Geosci., 120, 60–72, https://doi.org/10.1016/j.cageo.2018.06.002, 2018. a
Weis, S. W. M., Agostini, V. N., Roth, L. M., Gilmer, B., Schill, S. R., Knowles, J. E., Blyther, R., Margles Weis, S. W., and Org, S. W.: Assessing vulnerability: an integrated approach for mapping adaptive capacity, sensitivity, and exposure, Climatic Change, 136, 615–629, https://doi.org/10.1007/s10584-016-1642-0, 2016. a
- Abstract
- Introduction
- Study area and description of the extreme precipitation event
- The INSPIRE game
- Results
- Discussions
- Conclusions
- Appendix A: Game worksheet
- Appendix B: Optimal decisions
- Appendix C: The criteria for classifying the rainfall forecast in colour codes
- Appendix D: The sessions of the game
- Data availability
- Author contributions
- Competing interests
- Disclaimer
- Acknowledgements
- Financial support
- Review statement
- References