the Creative Commons Attribution 4.0 License.
the Creative Commons Attribution 4.0 License.
 | 07 Feb 2025
Simulating the Tone River eastward diversion project in Japan carried out 4 centuries ago
Naota Hanasaki
The Tone River is the largest river in Japan, flowing from the Kanto Plain westward to the Pacific Ocean. The river originally flowed southward, entering Tokyo Bay, but the Tone River eastward diversion project (TREDP) in the 17th century and many later projects changed the flow route to that of today. The gradual process of eastward diversion has been extensively studied from the historical viewpoint, revealing that the initial project in the 17th century was principally intended to establish a stable navigation route. However, no scholars have yet proven this hypothesis via hydrological modeling.
We used the H08 global hydrological model to reconstruct historical flow direction maps at a 60 arcsec spatial resolution with a 1 d temporal resolution. We hypothesized that the historical claims could be numerically verified using a relatively simple simulation. First, we confirmed that our modeling framework reasonably reproduced the present river flows by adding two present-day bifurcation functions. Next, using the reconstructed historical maps, we quantified low flows (20th percentile) in the 17th century and confirmed that the Tone River diversion aided navigation because it connected areas that increased low flows. Finally, the validity of our historical simulation was proven by contrasting the distribution of simulated low flow rates with the flows at the historical river ports that lie furthest upstream. We show that it is possible to bridge two different disciplines, history, and numerical hydrological modeling to obtain a better understanding of human–water interactions. One limitation is that we only reconstructed historical land maps in the present study; the meteorological forcing inputs employed were identical to those of the 20th century. The historical inputs are not known.
- Article
(1829 KB) - Full-text XML
-
Supplement
(305 KB) - BibTeX
- EndNote


1.1 Background
The courses of rivers, particularly those flowing in densely populated areas, are sometimes heavily altered by humans. Such changes are easily recorded if they are recent but not if they happened more than a few centuries ago. One such example is the Tone River, Japan's largest river. The Tone River basin is the Kanto Plain, where the capital, Tokyo, is located. The Tone River rises in a mountainous region northwest of the Kanto Plain that now ends at the southeastern corner of the plain, where it flows into the Pacific Ocean. Originally, however, the river flowed through only the western half of the Kanto Plain and ended at Tokyo Bay. The eastern half was drained by another river, the Hitachi River, running in the lower reach of the present-day Tone River. Principally during the 17th century (in the Edo period; see Sect. S1 in the Supplement), several remarkable projects connected the two basins of the Tone and Hitachi rivers. In this study, we term the series of projects the Tone River eastward diversion project (TREDP). The considerable changes in the river courses have attracted the attention of not only hydrologists but also archeologists and geologists.
1.2 Earlier studies
The history of the Tone River has been investigated by numerous researchers over the last century. Takashi Kawada wrote the first report on the history of the development of the Tone River (Kawada, 1893). Later, Ryosuke Kurihara wrote a book on the same topic, which became the established view (Kurihara, 1943). In short, both authors claimed that the primary purpose of the 17th century TREDP was to protect the capital city of Edo (the Tokyo of today; see Sect. S2) from floods. At that time, redirecting flood water using flood channels was already common in Japan and was one of the main reasons why the TREDP was conducted (Koide, 1975; Kosuge, 1981). After World War II, Haku Koide and Takashi Okuma proposed a different view: the primary purpose of the TREDP was to enlarge the navigation network and enhance low flow to maintain network stability (Koide, 1975; Okuma 1981). Okuma (1981) hypothesized that the Tone River diversion of the Edo period greatly enhanced the sustainable socioeconomic development of the Kanto region. In those days, a substantial number of people relied on the renewable resources of the Japanese archipelago but, of course, lacked modern technology. Increased low flows and uninterrupted connections between mountainous and coastal regions expanded the business and trade possibilities, sustaining the historical supply of food and commodities to the capital city of Edo. This view is supported by a great deal of historical evidence and is now regarded as accurate.
1.3 The shortcomings of earlier studies
Although the claims of Koide and Okuma have been established from the historical perspective, little is quantitatively known; ideally, numerical hydrological simulations are required. To the best of the authors' knowledge, numerical hydrological simulations that targeted events that took place more than a century ago have seldom been performed, particularly in Japan. The exceptions include the following studies. Luo et al. (2014) evaluated the paleo-hydrological anthropogenic impacts of land use changes in the Kamo River basin in Kyoto, Japan, by reconstructing historical land use maps from 1902. They reported delayed and reduced peak discharges under the land use regime of 1902 compared to that of 1976 because of decreases in forest and paddy field coverage. Nemoto et al. (2011) developed a numerical model to investigate the hydraulic effect of the Shingen tsutumi (a series of dikes built in the 16th century in Yamanashi Prefecture, Japan). They confirmed the hydraulic efficiency of dikes described in the ancient texts and effectively countered certain recent alternative views. Nemoto et al. (2013) developed a hydrological model to estimate the inundation depth at the time of the battle of Bicchu Takamatsu Castle in 1582, during which it is known that the attackers created a temporary earth dike to flood the castle and thus force the defenders to surrender. It was found that building a relatively short and low structure at a hydrologically critical point was sufficient to inundate the castle; this provided a hydraulic basis for the historical event. Outside Japan, the following studies tackled a century-long historical hydrological reconstruction. Balasch et al. (2019) qualitatively reconstructed and estimated peak flows in different subbasins of the Ebro River basin over the last 400 years. They reconstructed peak flows with possible errors of 10 % after calibrating the hydraulic model and found that the geometry of the modeled reach of the riverbed and the flood plain was the greatest source of uncertainty. Werther et al. (2021) reconstructed river channel lengths from the pre-modern period (19th century) to today in the Bavaria region of Germany and calculated changes in the main channels of all major rivers in the study area after the channels were straightened.
1.4 Objectives and new contributions
In this study, we model and evaluate the river discharges of the Tone and various other rivers and quantitatively investigate the hydrological consequences thereof during the various stages of the TREDP waterworks, which established more stable navigational routes in the Kanto Plain, including the capital city of Edo. We use the H08 global hydrological model for this purpose (Hanasaki et al., 2018). This choice was made because global hydrological models are designed for data-sparse regions, and an earlier study indicated that H08 was capable of simulating Japanese rivers at a reasonably high spatiotemporal resolution (Hanasaki et al., 2022). In particular, the specific questions addressed in this study are summarized as follows:
-
How can we establish a hydrological simulation of events that occurred several centuries ago and that are thus associated with data limitations?
-
How can we validate the simulations for periods when modern river gauging did not exist?
-
What were the implications of TREDP? Were the implications consistent with the views of Koide and Okuma, who claimed that the enhancement of navigation was key?
2.1 Climatological and hydrological characteristics
The Tone River watershed area is 16 940 km2, and the main channel runs for 322 km from its source to the Pacific Ocean (MLIT, 2023a). The mean annual rainfall in the upper Tone River basin is 1381 mm, with a standard deviation of 148 mm (Ibbitt et al., 2002). The mean Ara, Edo, and Tone discharges (MLIT, 2023b) for the period between 2004 and 2008 at the most downstream stations (Jisui Bashi, Nagareyama, and Toride, respectively) were 103, 111, and 242 m3 s−1, respectively.
Three rivers, Tone, Ara, and Edo, are connected by two major bifurcations that are too large to ignore. The first bifurcation is the Tone Ozeki Weir, where some Tone River water is diverted to the Ara River (hereafter T2A), and the second bifurcation is the Sekiyado Dam in the Tone River, which controls the amount of water that flows downstream toward the Edo River (hereafter T2E). Presently, the T2E diversion is operated using a gate, whereas there was natural diversion in the 17th century. The only structure was earthen; this narrowed the inlet of the Edo River (termed “bo-dashi” in Japanese, which means “stick out”).
2.2 Study sites relevant to the historical Edo period
As mentioned earlier, TREDP involved numerous subprojects. We focus on six subprojects and reconstruct historical maps of the Tone, Edo, and Ara rivers in the Kanto region of Japan. The six historical maps were generated electronically by manually changing the flow directions by referencing historical reports on TREDP development as follows: before 1593; after checking the partial blockage by the Aino River diversion (a bifurcating channel of the mid-Tone River) in 1594, which is considered to be the first step of TREDP; after completion of the Shinkawa–Dori channel (straightening of the mid-Tone River) in 1621; after the Kinu and Kokai river diversions, which moved the confluent points upstream, together with the Ara River diversion in 1630, which connected the upper basin to a southern river; after the Akahori River diversion (a new section that connected the upper and lower Tone River) in 1654; and after the Sakasa River diversion and relevant constructions in 1666. Construction of the Sakasa River with a near-zero slope changed the flow direction from the Tone to the Edo River and vice versa (“sakasa” translates to “opposite” in English). This was achieved by narrowing the Edo River; otherwise, all river water drained toward Tokyo Bay, which reduced the water flowing eastward.
Figure 1 shows the historical and present-day river basin maps, from 1593 (before the TREDP) to 2023. All three river basins are located between 35 and 37.4° N and 138 to 141° E (i.e., within an area approximately 220 km × 160 km). Using the catchment areas of the stations farthest downstream that collect discharge data, the three rivers are classified as follows: Tone (5002 km2 on historical maps corresponding to the eastern part of the present Tone River; 11 376 km2 on the present-day map), Edo (7946 km2 on historical maps corresponding to the western part of the present-day Tone River; 787 km2 on the present-day map), and Ara (1383 km2 on historical maps; 2168 km2 on the present-day map). On historical maps, the easternmost river basin was termed the Hitachi River and the middle river basin the Tone River; they were not connected. However, in the chapters below, we use the present-day nomenclature; the middle river basin is termed the Edo River and the easternmost river basin the Tone River. Below, we apply this nomenclature to both present-day and historical maps for convenience.
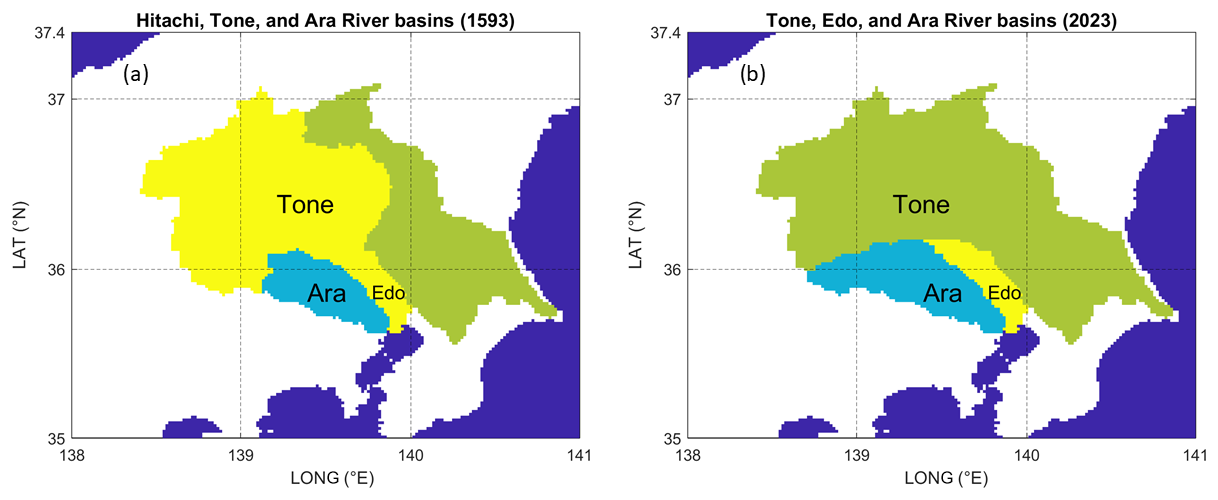
Figure 1The Tone (green), Edo (yellow), and Ara (blue) river basins in (a) 1593 and (b) 2023. In 1593, the Tone River mouth corresponded to the 2023 Edo River mouth, whereas the 2023 Tone River basin was termed the Hitachi River basin.
Table 1 shows the locations and other information for 20 river gauging stations (MLIT, 2023b), and Fig. 2 presents the river sequences of today with the positions of all 20 gauging stations relative to the bifurcations.
Table 1The present-day gauging locations with observed river discharge. From the left, the columns contain station identification numbers (IDs), station names, the river systems, longitudes, latitudes, watershed areas of the observed data, watershed areas of the H08 model, and errors in the watershed areas of H08. The tributaries in Table 1 are shown in Fig. 2.
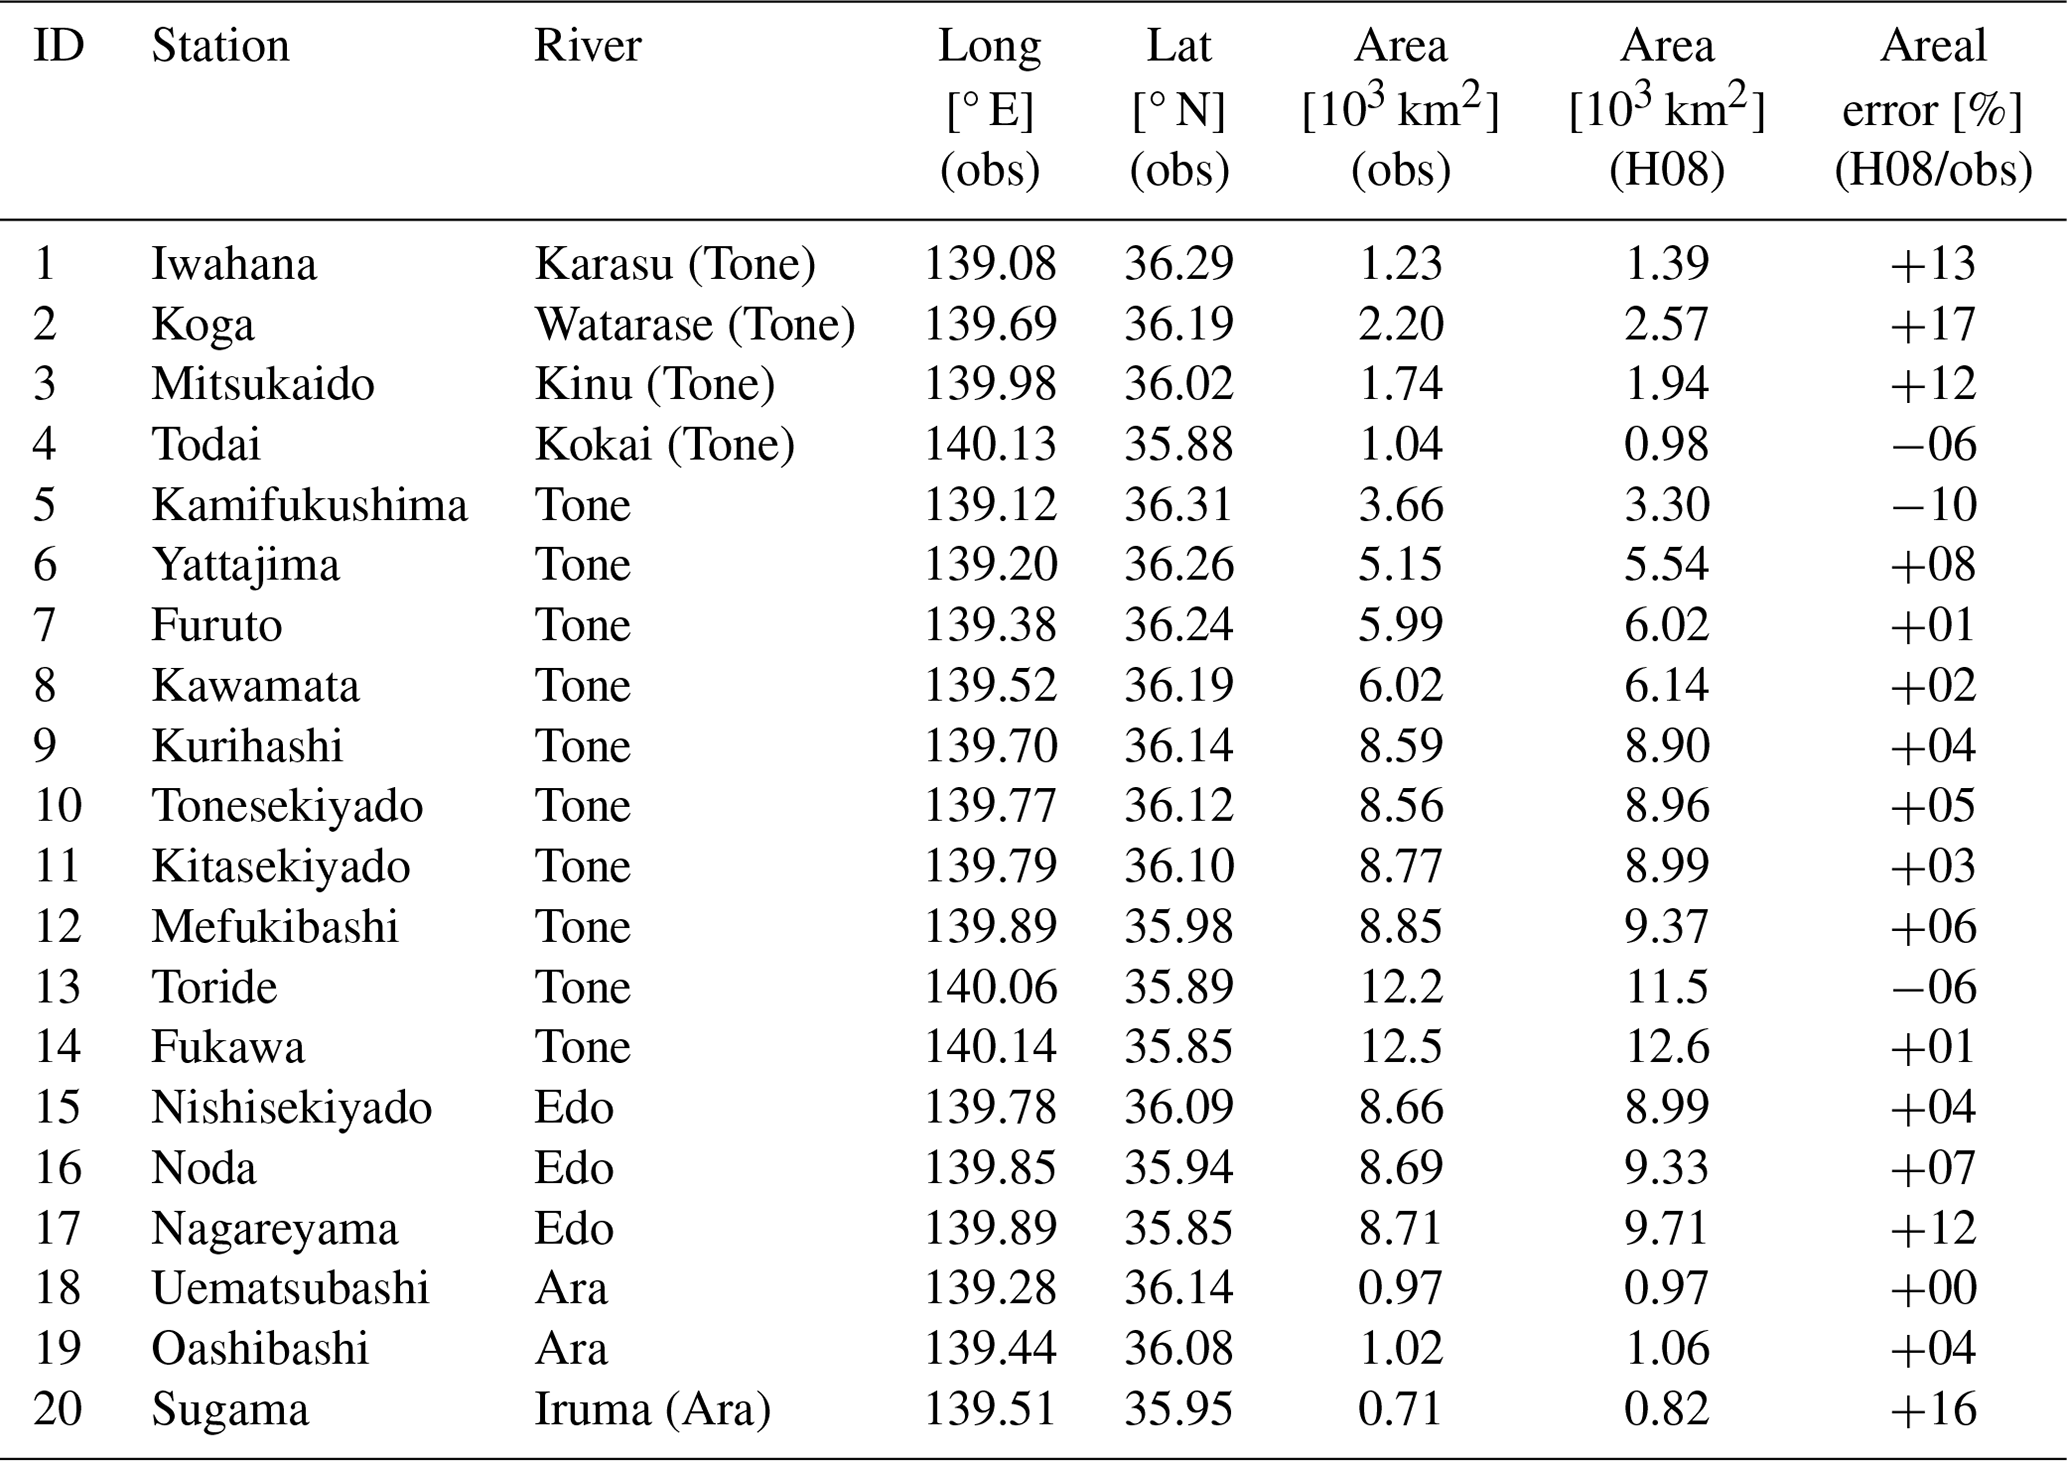
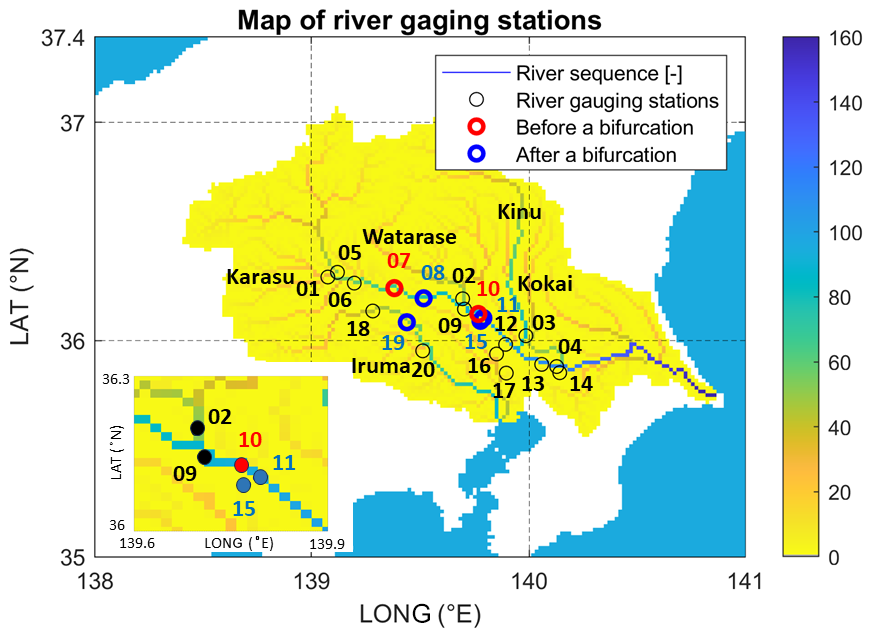
Figure 2The present-day river sequences with the positions of all 20 gauging stations relative to the locations of bifurcations. Numbers near stations before (red color) and after (blue color) bifurcations correspond to the station IDs listed in Table 1.
3.1 Overview
The H08 is a grid-based, physically driven hydrological model that calculates the global hydrological cycle with consideration of major human activities (e.g., sector-wise water abstraction and reservoir operation) and assesses water resource status at a 30 arcmin spatial resolution (Hanasaki et al., 2008a, b, 2018). The H08 is applicable to small spatial domains and low resolutions. Recently, the H08 model was expanded because of the need for regional application in Kyushu Island of Japan; the fine spatial resolutions are 1 arcmin and a 1 d time step (Hanasaki et al., 2022). We applied the H08 model to the present-day river map of the Kanto Plain, which has the two existing bifurcation functions, T2A and T2E, that divert the flow of the Tone River to the Ara and the Edo rivers, respectively, at certain fixed rates. Next, we validated the simulated river discharges of the present-day river map using observed data. Then, the historical river discharges were estimated by replacing the present-day river map with historical maps. Finally, we indirectly validated the results by comparing the distributions of low flow and the most upstream locations of navigable river ports.
3.2 H08 model
H08 consists of six submodules – namely, land surface hydrology, river routing, reservoir operation, irrigation water estimation, environmental water estimation, and water withdrawal submodules. A detailed description, including all fundamental equations together with the validation results, has appeared elsewhere (Hanasaki et al., 2008a, b, 2018, 2022). In this study, only the land surface hydrology and river routing submodules were used. The land surface hydrology submodule calculates the surface water and energy balance. This submodule requires daily precipitation, air temperature, wind speed, surface pressure, shortwave and longwave radiation, and relative humidity data as meteorological forcers. The river routing submodule calculates the daily river discharge by routing the daily runoff at a constant velocity.
The approach and methodology of Hanasaki et al. (2022) were applied in this study when using the land surface hydrology and river routing submodules to analyze data from 1993 to 2008. The other submodules were disabled, mainly because their application to historical maps would render the historical simulations very uncertain given the lack of input data. The calibration period was from 1993 to 2000, and the validation period was from 2001 to 2008. During this period, quantitative rainfall and river discharge data were consistently available from all observation stations.
3.3 Data
3.3.1 Meteorological data
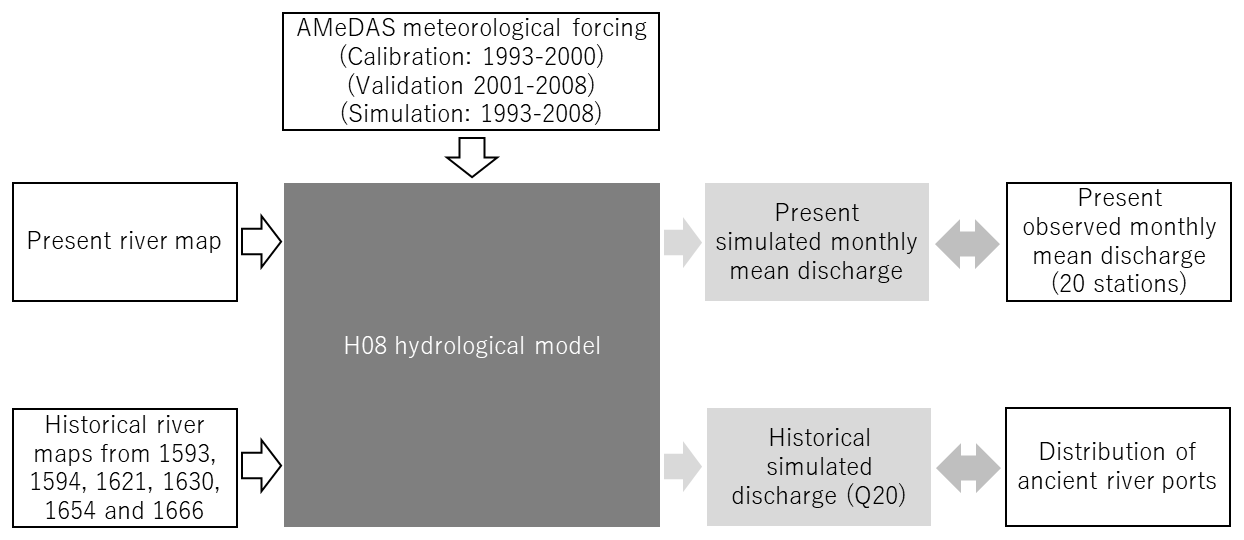
The observed meteorological variables were collected from the Automated Meteorological Data Acquisition System (AMeDAS, 2023) online database of the Japan Meteorological Agency. These were point data from all 91 rain gauges of the three river basins; the records have been published and are thus readily available. The modeling framework formulated for this study is schematically shown in Fig. 3.
3.3.2 River discharge data
The river discharge data were collected from the online database of the Ministry of Land, Infrastructure, Transport and Tourism (MLIT, 2023b).
3.3.3 Flow direction data
Matsumura et al. (2021) developed a flow direction map for the present-day Tone, Edo, and Ara river basins with a resolution of 1 arcmin (approximately 2 km). The reconstructed digital historical maps are built from printed reconstructed flow direction maps in publications. As the base digital flow direction map, we used the one developed by Matsumura et al. (2021). Then, starting from the oldest reconstructed digital historical map in 1593, we have changed one or more flow directions on the way to complete TREDP by referring to available printed historical maps. During reconstruction of historical maps, the flow direction was manually changed at one or more points to match the available historical maps (i.e., MLIT, 2023c; Inazaki et al., 2014). When it was difficult to obtain the exact historical maps, then administrative borders were used as guidelines because we found that, when a river changes its route, its administrative borders usually do not change simultaneously with it. For instance, the flow direction for excavating the Shinkawa–Dori diversion in 1621 was determined as the northern border between Saitama and Tochigi prefectures (nowadays the Watarase River), which remained the same until today, yet after the excavation of Shinkawa–Dori, the Tone River route moved slightly southward of the prefectural border. Another example is the diversion of the Kinu River toward the Kokai River in 1630, whose route followed the border between Moriya and Tsukubamirai districts, which is a densely populated area nowadays. The parts of the domain that did not lie inside the three river basins were treated as no-data points.
First, the map before the waterworks started is termed “1593”, indicating the year in which the map was prepared. Second, we used the map obtained after the partial blockage of the Aino River (1594). Third, we used the maps created after the Shinkawa–Dori diversion (1621), followed by the diversions of the Ara, Kinu, and Kokai rivers (1630); the Akahori River (1654); and the Sakasa River (1666).
3.4 Simulation
3.4.1 Parameter calibration
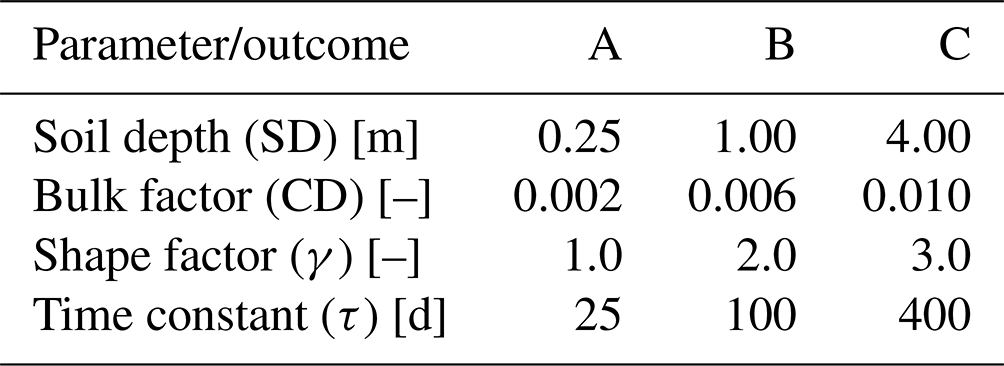
The parameters of the land surface hydrology submodule were tuned using a simple Monte Carlo-based method that has been described previously (Hanasaki et al., 2022; Mateo et al., 2014; Masood et al., 2015). The sensitivities of four hydrological parameters were evaluated by deriving the Nash–Sutcliffe efficiency (NSE; Eq. 1, Nash and Sutcliffe, 1970) of the monthly average river discharges using three possible values of each of the four parameters for a total of 81 possible parameter combinations (Table 2). The calibration period was from 1993 to 2000, and the validation period was from 2001 to 2008. The most frequently occurring best-calibrated parameters from all gauging stations were termed ensemble optimum parameters (EOPs). For the validation period, simulated discharges were evaluated and compared to observations using both the best parameters at each station and the EOPs obtained during the calibration period with respect to the computed monthly NSE values.
where is the observed discharge at time t, is the simulated discharge at time t, and is the mean observed discharge during an event.
Table 2The four calibrated parameters, SD, CD, γ, and τ, and the three possible outcomes, A, B, and C.
3.4.2 Present-day simulation
The results of three present-day simulations using (a) the default uniform global H08 model parameters, (b) the best-calibrated parameters at each gauging station, and (c) the EOPs obtained during the calibration period were validated using the observed daily discharge values (MLIT, 2023b) from 20 river gauging stations in the present Tone, Edo, and Ara rivers. Furthermore, we also analyzed both T2A and T2E operational functions to determine the constant diversion rates (i.e., the percentages of river discharge flowing toward each river) by varying the percentages of river discharge flowing toward the Edo and Tone rivers. The analysis showed that the NSE values for Tone River observation stations downstream of Tonesekiyado were the highest when the diversion rates were set to 70 % of river discharge toward the Tone River and 30 % toward the Edo River. To estimate the flow rate of the T2A diversion, based on the observed river discharge data from the Furuto (upstream, before diversion, QF) and Kawamata (downstream, after diversion, QK) stations (see Fig. 2), we obtained the following relationship (Eq. 2):
This functional relationship is employed to recalculate the river discharge at Kawamata from the modeled river discharge at Furuto at every simulation step. This relationship was used throughout all present-day river map simulations; it was the operational rule of the T2A diversion.
3.4.3 Historical simulation
The default uniform global H08 model parameters and the EOPs from the present-day maps were selected for the historical simulations of all grid cells when we analyzed historical changes in river discharges. For the historical simulations, the meteorological inputs were the same as for the present-day simulation; we lacked historical meteorological data from the 17th century. We applied the same modeling configurations as employed for the present-day simulation but without T2A and with a modified T2E; the T2E bifurcation function was adjusted from 70:30 % for the present day to 50:50 % for the historical maps (hereafter the old T2E). This was because the flood control of high waters flowing toward the Edo River was not as efficient as is afforded by the Sekiyado Dam of today (Okuma, 1981) and because we assumed that one of the main goals of enhanced navigation through the Sekiyado point was to increase the minimum water levels of both Tone and Edo rivers as much as possible and to equal extents. The bifurcation between the Tone and Ara rivers did not exist in the 17th century, and the bifurcation between the Tone and Edo rivers differed from that of today. We assumed that the optimal reproducibility metrics for the old T2E on the historical maps included 50 % flow in each direction because the discharge of low flows toward each river at the bottleneck crossover of Sekiyado would then be optimal.
3.5 Analysis
As historical river discharge records are not available, we indirectly validated our findings using the records of riverine ports. We collected data on the most historically upstream river port locations for each river (figures with similar data are also in Inazaki et al., 2014; Kubo, 2012; and Okuma, 1981). The names of ports were taken from historians' books (e.g., Okuma, 1981) and confirmed by the name “aza”, an administrative designation of small sections into which some of the rural districts of Japan are divided. The old river routes were also taken from figures in books and digitalized to maintain the geometry of routes. As the widths and depths of historical river routes differed from those of the present day, it was challenging to determine the historical thresholds for navigable river routes. We evaluated various historical navigation possibilities under the assumption that navigable river route thresholds would be met when Q20 exceeded 20 m3 s−1 throughout the Kanto Plain and particularly throughout the Hitachi River, which was a bottleneck compromising smooth navigation through the Tone River in the Edo period. The validity of the 20 m3 s−1 threshold is discussed below.
In the following, we discuss the results presented in this study as they relate to the three specific questions that were the objectives of the study. Each of the specific questions was evaluated separately and is discussed in Sect. 4.1–4.3 as follows:
-
How can we establish a hydrological simulation of events that occurred several centuries ago and that are thus associated with data limitations?
-
How can we validate the simulations for periods when modern river gauging did not exist?
-
What were the implications of TREDP? Were the implications consistent with the views of Koide and Okuma, who claimed that the enhancement of navigation was key?
4.1 Reconstruction of historical Tone River basin maps
As we proceeded through the various steps of the TREDP, we reconstructed the six aforementioned historical maps. Figure 4 shows the reconstructed river sequences of five historical maps and also the present-day Tone, Edo, and Ara river basins; the color bars indicate unitless river sequences.
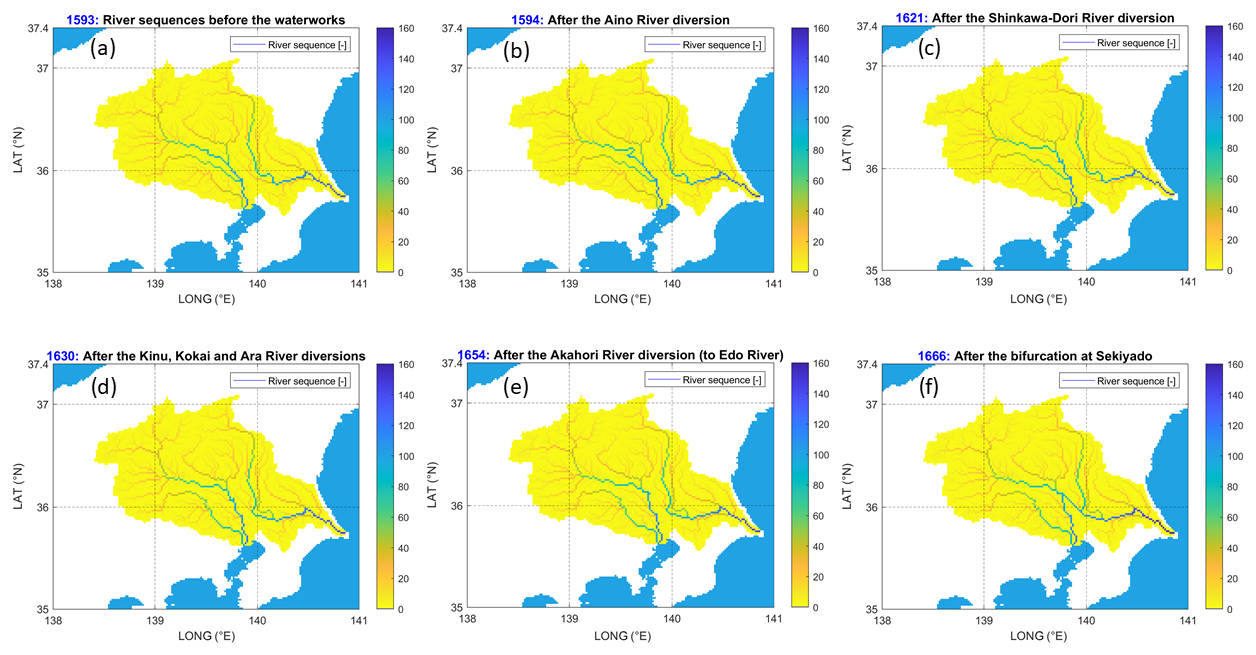
Figure 4Reconstructed river sequences [–] of the Tone, Edo, and Ara River routes on five historical maps: (a) 1593, (b) 1594, (c) 1621, (d) 1630, (e) 1654, and (f) 1666 map.
The river sequences after the old T2E bifurcation of 1666 that sent 50 % of the water flow toward the Edo and Tone rivers at the Sekiyado point are visualized in Fig. 4f. The historical maps reconstructed from the several individual steps of the TREDP enhance our understanding of engineering technologies that were well understood and applied even in the 17th century. Particularly, the 17th century engineers planned TREDP step by step, and thus gradually moved the Tone River mouth to a distance of about 100 km from the original mouth.
4.2 Calibration and validation: present-day Tone River discharge
4.2.1 Tone River to Ara River (T2A)
The relationship between the discharge at Furuto (before T2A; see Fig. 2 and Table 1) and Kawamata (after T2A) stations from 1993 to 2008 is shown in Fig. 5. After removing the five outlier data points, we obtained Eq. (2), as introduced in Sect. 3.4.2.
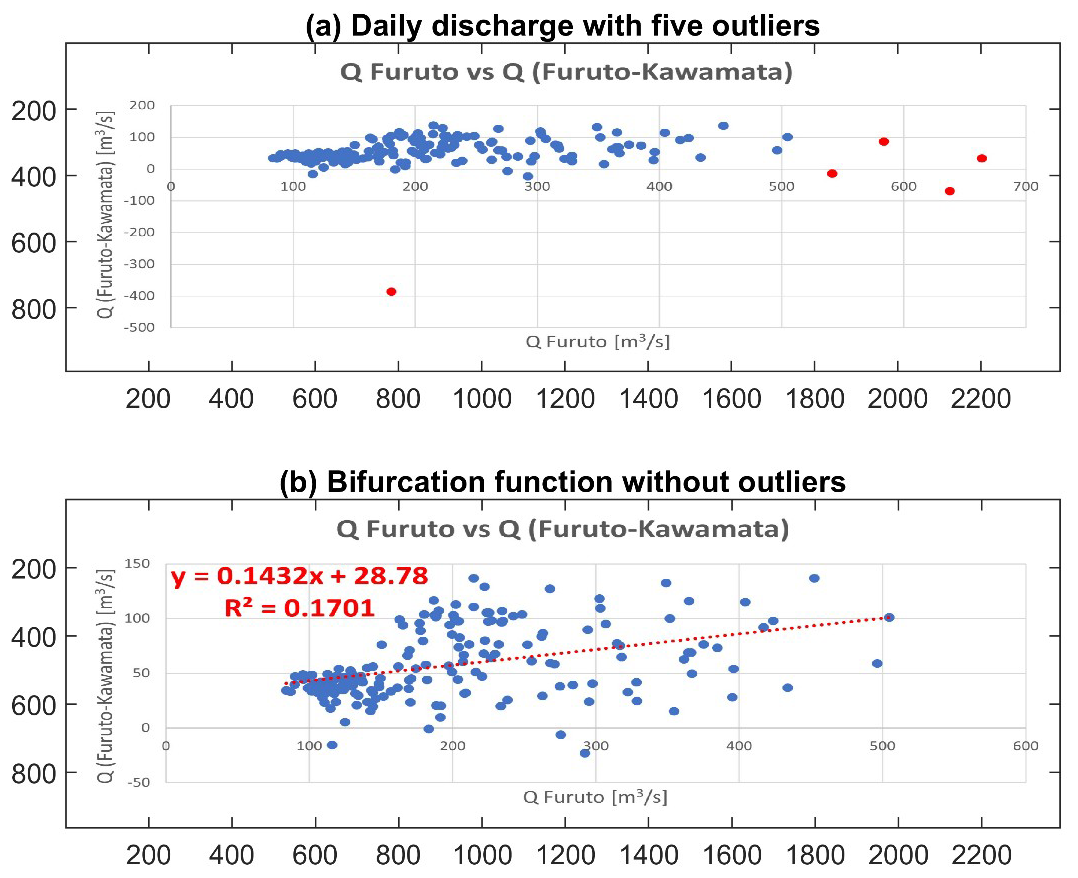
Figure 5The process used to obtain the observed discharge correlation function between (a) Furuto and (b) Kawamata stations, as formulated by Eq. (2).
Figure 6 shows the best NSE reproducibility metrics at the Kawamata and Tonesekiyado gauging stations for the monthly discharge simulations from 1993 to 2008.
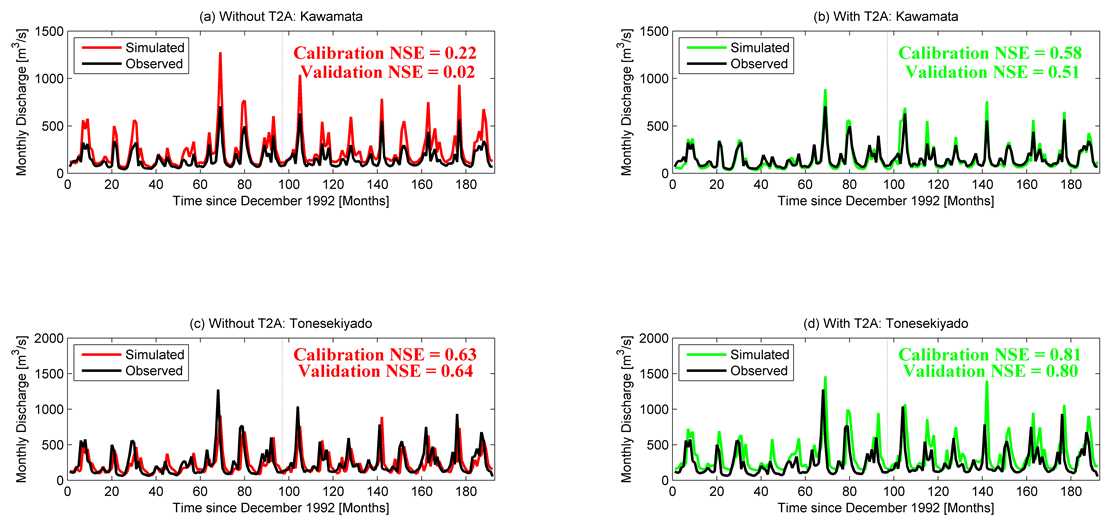
Figure 6The best NSE reproducibility metrics at the Kawamata (a, b) and Tonesekiyado (c, d) gauging stations without (a, c) and with (b, d) implementation of the T2A bifurcation for both calibration and validation periods.
The monthly NSE value at the Kawamata station was only 0.22 for the calibration and 0.02 for the validation period when the bifurcation function was not applied between the Furuto and Kawamata stations at the point of the Tone Ozeki Weir. We obtained the relationships at Furuto and Kawamata from the observed data, as explained in Sect. 3.3.2. After implementing the T2A bifurcation function mentioned above, the monthly NSE value at the Kawamata station greatly increased from 0.22 for the calibration and 0.02 for the validation period (Fig. 6a) to 0.58 and 0.51 (Fig. 6b) and, further downstream at Tonesekiyado station, increased from 0.63 and 0.64 (Fig. 6c) to 0.81 and 0.80 (Fig. 6d), respectively. Consequently, the reproducibility metrics of all downstream stations also significantly increased (data not shown).
4.2.2 Tone River to Edo River (T2E)
Figure 7 shows the best NSE reproducibility metrics at the Kitasekiyado and Nishisekiyado gauging stations for the monthly discharge simulations from 1993 to 2008 after the T2A and T2E bifurcations. The Tonesekiyado station is located upstream of T2E, followed by the downstream stations Kitasekiyado in the Tone River and Nishisekiyado in the Edo River (see Fig. 2; zoomed-in region in the lower-left corner).
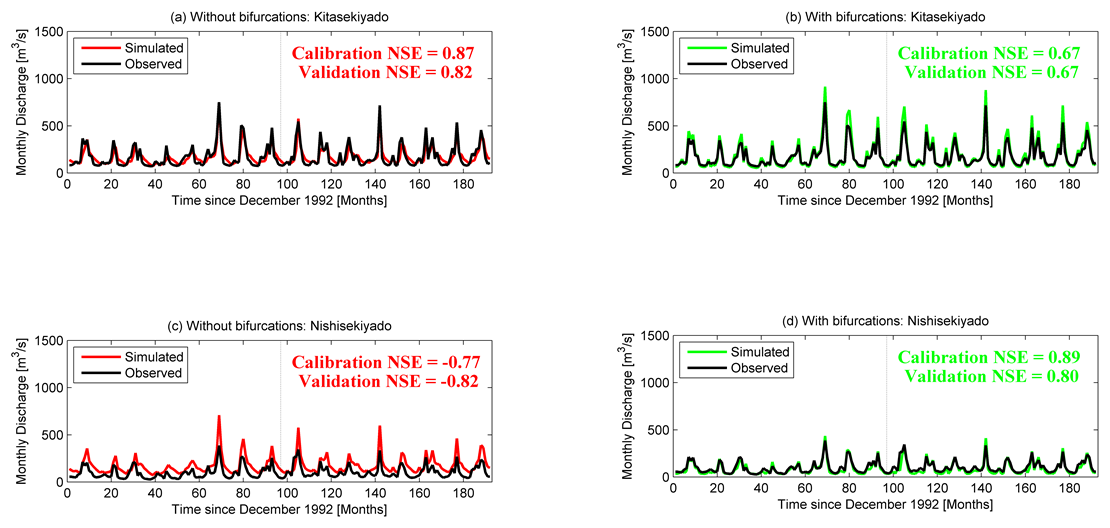
Figure 7The best NSE reproducibility metrics at the Kitasekiyado (a, b, after T2E toward Tone) and Nishisekiyado (c, d, after T2E toward Edo) stations before (a, c) and after (b, d) implementation of the T2A and T2E bifurcations for both calibration and validation periods.
As shown in Fig. 7, the monthly NSE value at the Kitasekiyado station, located just downstream of T2E, decreased from 0.87 for the calibration and 0.82 for the validation period to 0.67 and 0.67, respectively, when using the best combination of calibrated parameters during implementation of the T2A function into our H08 modeling system. This shows the impact 30 km downstream of the T2A bifurcation. However, the validity at the Nishisekiyado station greatly increased from −0.77 for the calibration and −0.82 for the validation period to 0.89 and 0.80, respectively. The rationale for choosing 70 % flow toward the Tone River and 30 % flow toward the Edo River at the T2E bifurcation was that the Kitasekiyado and Nishisekiyado stations should exhibit the best and near equal performance after implementation of the bifurcation, which was achieved.
4.2.3 Validation at stations
Table 3 shows the calibration and validation data for the modeled monthly river discharges using the observed river discharges from 20 gauging stations and their EOPs for the present-day map.
Table 3Calibration (from 1993 to 2000) and validation (from 2001 to 2008) of the modeled monthly river discharges based on the observed river discharges from 20 gauging stations for which NSEs were derived using the best parameters and the EOPs for the present-day map. The columns (from left) are the station IDs, the best parameter combination for the calibration period, the best NSEs for the calibration period, the best NSEs for the validation period, the NSEs of the EOPs for the calibration period, and the NSEs of the EOPs for the validation period.

Table 3 provides an overview of the simulation results; it is apparent that 16 of 20 stations had NSE values > 0.50 during both calibration and validation periods. The stations that exhibited the lowest NSE values in both calibration and validation periods were the most upstream stations on the Tone (Kamifukushima and Yattajima) and Ara (Uematsubashi) rivers. This may indicate that these relatively smaller subbasins may require different optimal combinations of parameters than the combinations that we selected. However, as the downstream parts of all three rivers yielded relatively high reproducibility metrics, we selected CABC to be the set of EOPs (see Tables 2 and 3) when further analyzing river discharges. The mean NSE values of all 20 stations obtained using the best parameters for every station were 0.62 for the calibration period and 0.60 for the validation period, which are satisfactorily high values. When the EOPs were applied to the entire basin over the calibration and validation periods, the obtained mean NSE values were 0.61 and 0.56, respectively. The very small drops in the NSE reproducibility metrics from the cases with the best NSE values for each station to the cases with the NSE values obtained using the EOPs indicate that it is appropriate to use the CABC EOPs for the entire basin.
4.2.4 Basin-wise water balance
Table 4 analyzes and compares the present-day simulated and observed data on the mean annual simulated discharges from 1993 to 2008 at the Tone, Edo, and Ara river mouths using the default uniform global H08 model parameters when (a) the T2A and T2E bifurcation functions were operating simultaneously and when (b) only the T2E bifurcation was in operation.
Table 4Mean annual simulated discharges at the mouths of three rivers in the present day (m3 s−1) using the default uniform global H08 model parameters.
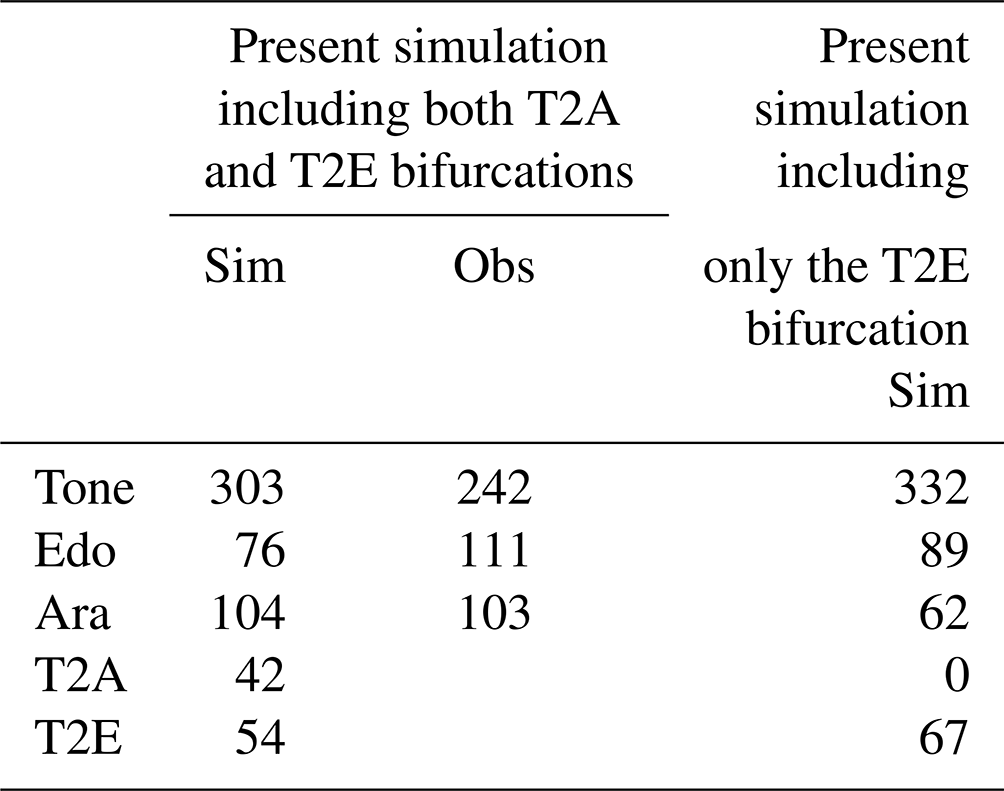
Table 4 shows the obtained present-day mean discharges at the mouths of the Tone, Edo, and Ara rivers. These are 303, 76, and 104 m3 s−1, respectively, when the T2A and T2E bifurcations operate. The Ara River value is similar to the 2004–2008 mean annual observed discharge (MLIT, 2023b) of the Ara River (103 m3 s−1), but the Edo River discharge is underestimated, and the Tone River discharge is overestimated compared to the observed values (111 and 242 m3 s−1, respectively). Without the T2A bifurcation, the errors are greater, as expected. Importantly, the observed discharges were those at the most downstream stations, but the simulated discharges were those at the mouths; it should thus be expected that the simulated discharges would be slightly larger. The mean annual discharges of the Tone River are 151 and 101 m3 s−1 before and after the T2A point, and those of the Ara River are 24 and 66 m3 s−1, respectively. Thus, about 42 m3 s−1 is diverted by T2A on average.
Summarizing Figs. 6 and 7 and Tables 3 and 4, we conclude that our H08 modeling framework with T2A and T2E accurately reproduces the present-day Tone, Edo, and Ara river discharges, especially in the most downstream parts.
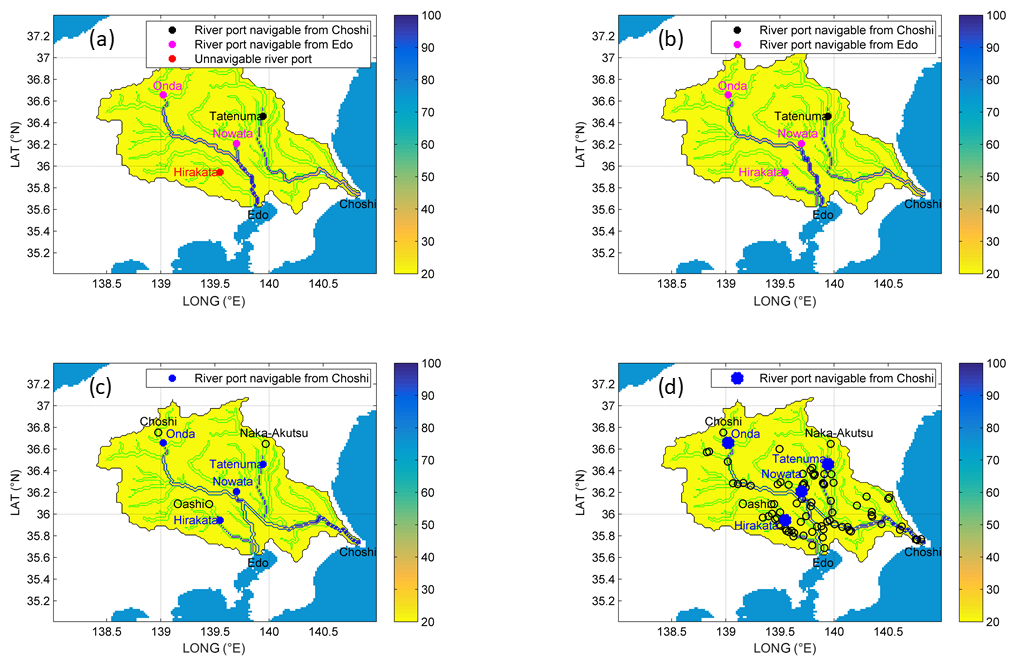
Figure 8The contours of Q20 values > 20 m3 s−1 for the historical maps from (a) 1593, (b) 1630, and (c) 1666 with the locations of the most upstream navigable historical river ports, and panel (d) is the same as panel (c) but with all recorded navigable historical ports using the default uniform global H08 model parameters. The color bar indicates the Q20 values of river flow of the basin in units of m3 s−1. The main channel indicates river flow which meets the condition of Q20>20 m3 s−1, which increases downstream. Q20 values ≤ 20 m3 s−1 are shown in yellow. Channels presented in pale colors represent river flow slightly greater than Q20>20 m3 s−1, while the ones with dark-blue colors indicate greater discharge up to maximal values shown in the color bar. The hollow circles represent all recorded navigable historical ports except the most upstream navigable ones. Historically, there were two Choshi ports, one at the river mouth and the other upstream of the Tone River.
4.3 Quantification of increasing low flows during and after the waterworks
In the following, we quantify the low flows of the Tone and Edo rivers that were altered by the TREDP. The need to increase low-flow water levels along the Tone and Edo River systems, particularly in the unnavigable upmost section of the Hitachi River (presently between the Mefukibashi and Tonesekiyado stations of the Tone River; see Table 1), has been assumed to be the main reason why the TREDP was conducted and proceeded (Koide, 1975; Okuma, 1981). Note that the capital city of Edo was also protected from floods by these waterworks (Sippel, 2014). One constraint imposed on flood protection was the Akahori River, which was artificially constructed in 1654 and only 18 m wide at the time of construction (Okuma, 1981) but was subsequently further widened in multiple steps for decades and centuries after the TREDP; however, high flows are not the topic of the present study.
Figure 8 shows the 20th percentiles (Q20) of monthly river discharges from 1993 to 2008 using the default uniform global H08 model parameters, which served as the reference level when evaluating low-flow conditions. Additionally, Fig. 8 also shows the most upstream navigable historical river ports with their Q20 thresholds for 1593, 1630, and 1666 (Fig. 8a–c) and compares these to those of all recorded navigable historical ports (Fig. 8d).
The key confirmation of the expectation enunciated by Koide (1975) is shown in Fig. 8, which is an indirect validation of the historical maps. Figure 8 shows our H08-modeled Q20 values and compares these with those of the river ports, whose most upstream locations with Q20 values > 20 m3 s−1 are shown. Q20 values > 20 m3 s−1 indicate navigable points. Note that, in 1593, the eastern half of the present-day Tone River (the Hitachi River) and the western half of the Tone River were not connected and thus were unnavigable (Fig. 8a, the southeast part from the Nowata port). Moreover, the Q20 of the Hitachi River exceeded 20 m3 s−1 only after the confluence of the Kinu and Kokai rivers, south from the Tatenuma port. In 1630, after the diversion of the Kinu River, the section wherein Q20 exceeded 20 m3 s−1 moved upstream (Fig. 8b, south of the Tatenuma port). After the Sekiyado bifurcation (i.e., the old T2E) in 1666, the navigable section was substantially extended, now connecting the upper streams of major tributaries to the Pacific Ocean and Tokyo Bay (Fig. 8c, the part connecting the southeast part of the Nowata port and the south side of the Tatenuma port). Furthermore, the distances between the most navigable river ports modeled in Fig. 8c and the most upstream navigable historical river ports (i.e., Noda and Choshi for the Tone River, Tatenuma and Naka–Akutsu for the Kinu River, and Hirakata and Oashi for the Ara River) are rather small. Thus, we indirectly validated the modeled locations of the uppermost reachable ports of the mainstream Tone and its tributaries via comparisons with the reconstructed historical uppermost ports.
Figure 9 shows the simulated streamflow of the Tone River discharges at Toride station for 3 key historical years, that is 1593, 1630, and 1666, compared to the observed data from 1993 to 2008 derived using the EOPs. For these historical validations, we used the old T2E historical bifurcation ratio at Sekiyado.
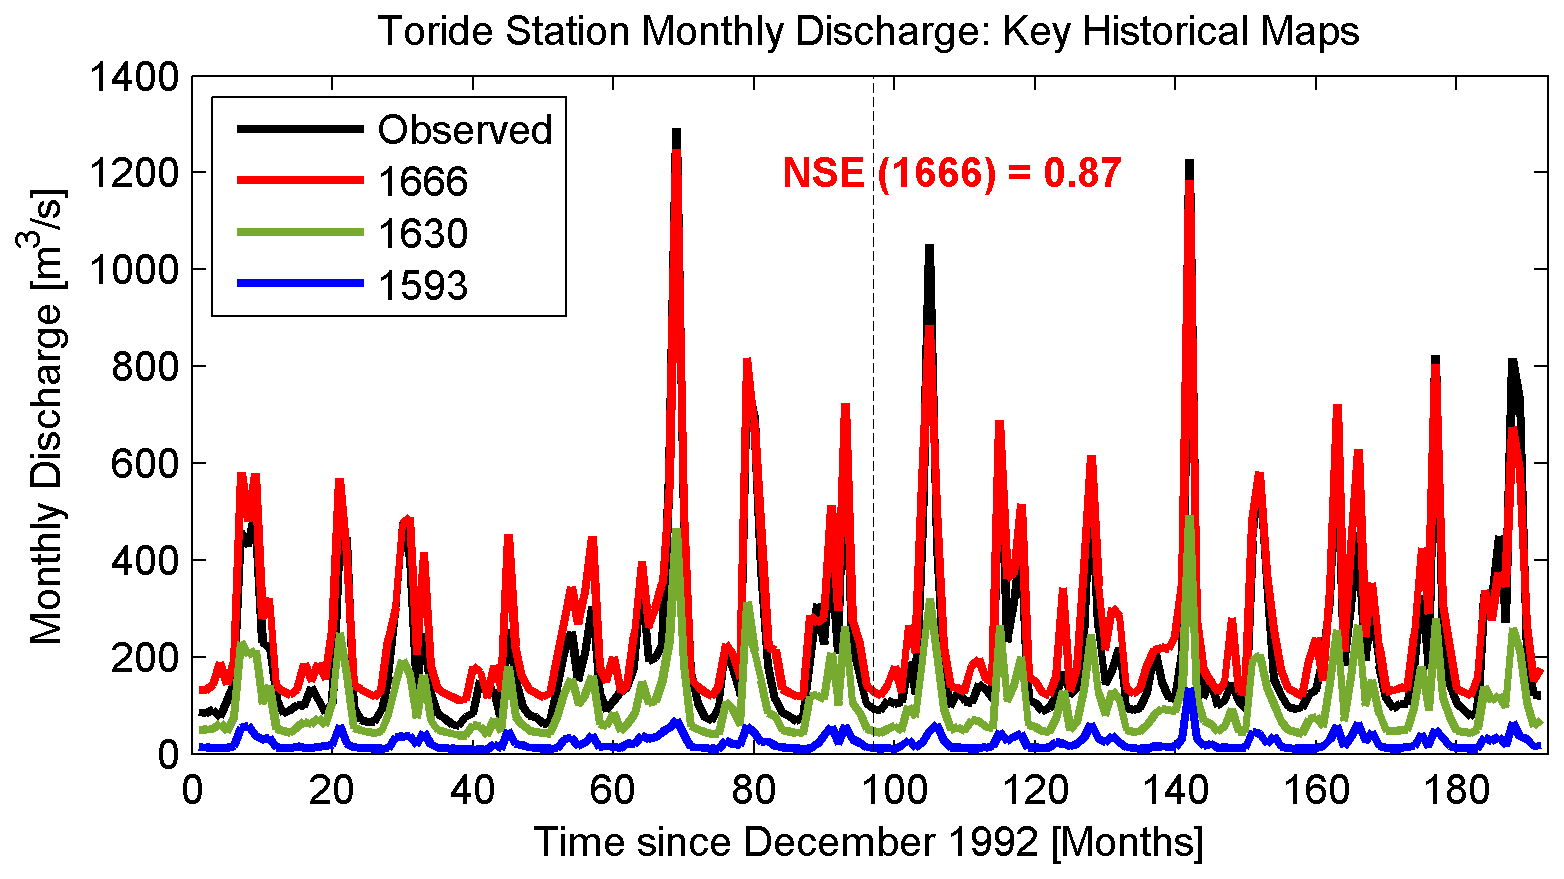
Figure 9The Tone River discharges at Toride station in 1593 (blue), 1630 (red), and 1666 (green) compared to the observed data from 1993 to 2008, derived using the EOPs and the old T2E historical bifurcation ratio at Sekiyado.
The aforementioned increases in low flows are shown in Fig. 9 for the Toride station, and the modeled river discharges are compared to the observed values of the present-day observed values because these yielded the best reproducibility metrics over all river basins. A gradual historical increase in Q20 at the Toride station is apparent; the values were 11, 53, and 131 m3 s−1 for the maps of 1594, 1630, and 1666, respectively. These findings confirm the expectation of Koide (1975) that the main goal of the TREDP was a step-by-step increase in low flows to enhance navigation. Other reasons might also be as important as enhanced river routes for navigation and trading, but a very different modeling setup would be needed to test and show the other hypotheses (e.g., irrigation area expansion, flood protection, military purpose, etc.). Testing them would also be a very interesting contribution to a better understanding of the historical hydrology of the rivers in the Kanto Plain, but apparently, they are out of the intended scope of this study.
Summarizing Figs. 8 and 9, the TREDP was useful in that it revealed increasing low flows over time in the Tone River between Sekiyado and Choshi. TREDP principally used human power to build earthen and wooden structures that allow only for limited water diversion. In the early 20th century, modern steel and concrete structures permitted large-scale water transfer during severe floods. Inland transportation has gradually lost importance given the development of a sophisticated rail network in the region. It is thus not immediately intuitive to assume that transport was the main reason for the TREDP when viewing the scenario today. The socio-hydrological implications and societal contributions of the TREDP expanded the business and trade of the Kanto Plain, which historically supplied food and commodities to the capital city of Edo. The results support the claims of Haku Koide and Takashi Okuma: the TREDP was indeed intended to expand the riverine transport network of the entire Kanto Plain.
4.4 Uncertainties
Here and below, we note some important limitations of our study. First, the H08 historical maps were forced using present-day meteorological data. The flows may have differed from what we derived because the climatological conditions may have varied. Thus, although we claim that we accurately reconstructed historical river maps, this is not necessarily the case for streamflow due to different climatological factors from the past. Yet, we provided indirect validation by comparing the distribution of the Q20 river discharge with the most upstream navigable river ports in the past. Recently, a few studies (i.e., Hatono et al., 2022) have developed long-term historical meteorological datasets for Japan, which should enable this limitation to be minimized in future studies. In the cited work, the period from 1926 to 2020 was reconstructed. Such long-term meteorological reanalyses are needed to extend input precipitation data coverage further into the past. Second, when tuning the present-day climate parameters, the effects of dams were not included, and the subbasins of tributaries were not calibrated separately. Instead, the best-calibrated parameters for each gauging station were validated using the observed daily discharge values and then applied uniformly throughout the entire basin. Third, water withdrawal and consumption were not included in the simulation. This might affect the water balance in both the middle reaches, where irrigation is concentrated, and the lower reaches, where municipalities are concentrated. Fourth, changes in historical land use were not considered because available historical data were lacking. Fifth, given the lack of data, we did not consider river channel cross sections. Although navigability is primarily determined by the water depth, width, and flow velocity, we considered only the flow rate for simplicity.
In this study, we asked and answered the three questions: how can we establish a hydrological simulation of events that occurred several centuries ago and that are thus associated with data limitations? How can we validate the simulations for periods when modern river gauging did not exist? And what were the implications of TREDP? Moreover, were the implications consistent with the views of Koide and Okuma, who claimed that the enhancement of navigation was key?
First, we modeled the Tone, Edo, and Ara River discharges before and after the various steps of TREDP and evaluated the results of each step (Fig. 4). We used the H08 global hydrological model to reconstruct historical flow-direction maps and determined the operational patterns of the two present-day bifurcation functions, T2A and T2E. Thus, we successfully established a hydrological simulation commencing 4 centuries ago.
Second, we found that the navigability paths for low flows (Q20) became connected between the Pacific Ocean and the capital city of Edo after the TREDP waterworks were completed (Fig. 8) and that the river discharges at the bottleneck Toride station were gradually increased after conducting each significant waterwork of TREDP (Fig. 9).
Third, the societal implications of the diversion afforded numerous advantages, as previously indicated by other scholars. Our simulation results show that the increasing low-flow water levels and thus the improved navigability routes were the most significant societal implication. Thus, our findings are consistent with those of the historians Koide and Okuma.
This is the first study to show that securing stable and adequate low riverine flows permitted navigation and the transport of large amounts of goods from the eastern Kanto Plain to inland areas and ultimately to the capital city of Edo, which became safer and economically more efficient than with combined sea navigation and land transportation; we used a historical hydrological modeling framework to discover this. Other reasons might also be as important societal implication as improved navigability routes, but they are out of the scope of this study.
Learning from historical technologies, followed by efforts to implement what is learned in the present day, may be an important step toward more sustainable present-day and future water resources management. We expect that the findings of this study will motivate the scientific community to consider that learning from the past is no less important than projecting and predicting the future, where such learning may yield valuable tools aiding present-day and future climate studies. For example, in this study, we learned that low-flow but navigable river routes were designed in a very organized manner even 4 centuries ago.
The code and data associated with this study can be accessed at https://doi.org/10.5281/zenodo.14362421 (Trošelj and Hanasaki, 2024).
The supplement related to this article is available online at: https://doi.org/10.5194/hess-29-753-2025-supplement.
Both co-authors reviewed, discussed, and suggested revisions for the submitted version of the manuscript and conceptualized and designed the experiments, which were then conducted by JT. NH developed the model code and JT further improved it for the particular application and performed the simulations. JT wrote and revised the manuscript with contributions from NH.
The contact author has declared that neither of the authors has any competing interests.
Publisher's note: Copernicus Publications remains neutral with regard to jurisdictional claims made in the text, published maps, institutional affiliations, or any other geographical representation in this paper. While Copernicus Publications makes every effort to include appropriate place names, the final responsibility lies with the authors.
This study was supported by the Japan Society for the Promotion of Science (KAKENHI; grant no. 21H05178). The authors are grateful and appreciative to the two anonymous referees for providing constructive comments and suggestions on this work. The authors sincerely thank Akiko Matsumura for providing flow direction maps of the present-day Tone, Edo, and Ara rivers; Kinuyo Tarumoto for digitizing the historical river port locations; and Kedar Otta and Ai Zhipin for their useful suggestions in the early phases of H08 model framework development.
This research has been supported by the Japan Society for the Promotion of Science ((KAKENHI) grant no. 21H05178).
This paper was edited by Giuliano Di Baldassarre and reviewed by two anonymous referees.
AMeDAS – Automated Meteorological Data Acquisition System: Past Weather Data, AMeDAS [data set], https://www.data.jma.go.jp/obd/stats/etrn/ (last access: 20 April 2023), 2023.
Balasch, J.C., Pino, D., Ruiz-Bellet, J. L., Tuset, J., Barriendos, M., Castelltort, X., and Peña, J.C.: The extreme floods in the Ebro River basin since 1600 CE, Sci. Total Environ., 646, 645-660, https://doi.org/10.1016/j.scitotenv.2018.07.325, 2019.
Hanasaki, N., Kanae, S., Oki, T., Masuda, K., Motoya, K, Shirakawa, N., Shen, Y., and Tanaka, K.: An integrated model for the assessment of global water resources – Part 1: Model description and input meteorological forcing, Hydro. Earth Syst. Sci., 12, 1007–1025, https://doi.org/10.5194/hess-12-1007-2008, 2008a.
Hanasaki, N., Kanae, S., Oki, T., Masuda, K., Motoya, K, Shirakawa, N., Shen, Y., and Tanaka, K.: An integrated model for the assessment of global water resources – Part 2: Applications and assessments, Hydrol. Earth Syst. Sci., 12, 1027–1037, https://doi.org/10.5194/hess-12-1027-2008, 2008b.
Hanasaki, N., Yoshikawa, S., Pokhrel, Y., and Kanae, S.: A global hydrological simulation to specify the sources of water used by humans, Hydrol. Earth Syst. Sci., 22, 789–817, https://doi.org/10.5194/hess-22-789-2018, 2018.
Hanasaki, N., Matsuda, H., Fujiwara, M., Hirabayashi, Y., Seto, S., Kanae, S., and Oki, T.: Toward hyper-resolution global hydrological models including human activities: application to Kyushu Island, Japan, Hydrol. Earth Syst. Sci., 26, 1953–1975, https://doi.org/10.5194/hess-26-1953-2022, 2022.
Hatono, M., Kiguchi, M., Yoshimura, K., Kanae, S., Kuraji, K., and Oki, T.: A 0.01-degree gridded precipitation dataset for Japan, 1926—2020, Sci. Data, 9, 422, https://doi.org/10.1038/s41597-022-01548-3, 2022.
Ibbitt, R., Takara, K., Desa, M. N. B. M., and Pawitan, H.: Catalogue of Rivers for South East Asia and the Pacific – Volume IV, The UNESCO-IHP Regional Steering Committee for Southeast Asia and the Pacific, https://unesdoc.unesco.org/ark:/48223/pf0000145288 (last access: 5 February 2025), 2002.
Inazaki, T., Ota, Y., and Maruyama, S.: The largest and longest project in Japan – Spanning over 400 years, J. Geogr. (Chigaku Zasshi) 123, 401–433, https://doi.org/10.5026/jgeography.123.401, 2014.
Kawada, T.: On the history of the Tone River basin, J. Hist. Soc. Jpn. (Shigaku Zasshi), 43, 367–389, 1893.
Koide, H.: Tone River and Yodo River – Historical Development in Eastern and Western Japan (Tonegawa to Yodogawa: higashi Nihon, nishi Nihon no rekishiteki tenkai), Chuokoronshinsha, Tokyo, 220 pp., ISBN 13:978-4121003843, 1975.
Kosuge, N.: The development of waterworks in Japan, HSDRJE-29/UNUP-240, The United Nations University, ISBN 92-808-0240-2, 1981.
Kubo, S.: Shifting of the Arakawa river in the Kanto Plain, central Japan, during the Late Holocene: a geomorphological approach, Geogr. Rev. Jpn. Ser. B, 84 71–80, https://doi.org/10.4157/geogrevjapanb.84.71, 2012.
Kurihara, R.: Flood control history of the Tone River, Kankaikoronsya, Tokyo, 331 pp., https://ndlsearch.ndl.go.jp/books/R100000039-I1058667 (last access: 5 February 2025), 1943.
Luo, P., Takara, K., Apip, He, B., and Nover, D.: Palaeoflood simulation of the Kamo River basin using a grid-cell distributed rainfall run-off model, J. Flood Risk Manage., 7, 182–192, https://doi.org/10.1111/jfr3.12038, 2014.
Masood, M., Yeh, P. J.-F., Hanasaki, N., and Takeuchi, K.: Model study of the impacts of future climate change on the hydrology of Ganges–Brahmaputra–Meghna basin, Hydrol. Earth Syst. Sci., 19, 747–770, https://doi.org/10.5194/hess-19-747-2015, 2015.
Mateo, C. M., Hanasaki, N., Komori, D., Tanaka, K., Kiguchi, M., Champathong, A., Sukhapunnaphan, T., Yamazaki, D., and Oki, T.: Assessing the impacts of reservoir operation to floodplain inundation by combining hydrological, reservoir management, and hydrodynamic models, Water Resour. Res., 50, 7245–7266, https://doi.org/10.1002/2013wr014845, 2014.
Matsumura, A. Mitsuhashi, T., Suga, K., Terashima, A., Kanayama, T., Ogawada, D., Yano, S., Hanasaki, N., and Oki, T.: Global Water Cycle Model H08 assessment of water supply and demand in a watershed considering the intake and drainage systems, J. Jpn. Soc. Civ. Eng. Ser. B1, 77, I_205–I_210, https://doi.org/10.2208/jscejhe.77.2_I_205, 2021.
MLIT – Ministry of Land, Infrastructure, Transport and Tourism: Rivers of Japan, https://www.mlit.go.jp/river/toukei_chousa/kasen/jiten/nihon_kawa/index.html (last access: 19 December 2023), 2023a.
MLIT – Ministry of Land, Infrastructure, Transport and Tourism: Water Information System, MLIT [data set], http://www1.river.go.jp/ (last access: 20 April 2023), 2023b.
MLIT – Ministry of Land, Infrastructure, Transport and Tourism: Introduction to the Tone River, https://www.ktr.mlit.go.jp/tonejo/tonejo00185.html (last access: 20 April 2023), 2023c.
Nash, J. E. and Sutcliffe, J. V.: River flow forecasting through conceptual models: Part I – A discussion of principles, J. Hydrol., 10, 282–290, https://doi.org/10.1016/0022-1694(70)90255-6, 1970.
Nemoto, Y., Nakayama, D., and Matsuyama, H.: Reevaluation of Shingen-tsutsumi based on inundation flow simulations with special focus on the flood control facilities along the Midai River, Geogr. Rev. Jpn. Ser. A, 84, 553–571, https://doi.org/10.4157/grj.84.553, 2011.
Nemoto, Y., Izumi, T., Nakayama, D., and Matsuyama, H.: Hydrologic study of artificial flooding tactics at Bicchutakamatsu Castle by Hideyoshi based on a flood-inundation simulation, subtitles, Geog. Rev. Jpn. Ser. A, 86, 315–337, https://doi.org/10.4157/grj.86.315, 2013.
Okuma, T.: Changes in the Tone River improvements and its floods (Tonegawa chisui no hensen to suigai), The University of Tokyo Press, Tokyo, 397 pp., ISBN 13:978-4130660532, 1981.
Sippel, P.: Japan's first urban water disaster: The Great Kanto Flood of 1742, Contemp. Hist. Res., 10, 1–34, 2014.
Trošelj, J. and Hanasaki, N.: Code and data of Simulating the Tone River Eastward Diversion Project in Japan Carried Out Four Centuries Ago, Zenodo [code and data set], https://doi.org/10.5281/zenodo.14362421, 2024.
Werther, L., Menn, T., Schmidt, J., and Müller, H.: Modelling pre-modern flow distances of inland waterways – A GIS study in southern Germany, Virt. Archaeol. Rev., 12, 42–56, https://doi.org/10.4995/var.2021.15245, 2021.