the Creative Commons Attribution 4.0 License.
the Creative Commons Attribution 4.0 License.
 | 05 Feb 2025
Canopy structure modulates the sensitivity of subalpine forest stands to interannual snowpack and precipitation variability
Gerald F. M. Page
Frank Zurek
Christopher Still
Mariah S. Carbone
William Talavera
Laura Hildebrand
James Byron
Kyle Inthabandith
Angellica Kucinski
Melissa Carlson
Kelsey Foss
Wendy Brown
Rosemary W. H. Carroll
Austin Simonpietri
Marshall Worsham
Ian Breckheimer
Anna Ryken
Reed Maxwell
David Gochis
Mark S. Raleigh
Eric Small
Kenneth H. Williams
A declining spring snowpack is expected to have widespread effects on montane and subalpine forests in western North America and across the globe. The way that tree water demands respond to this change will have important impacts on forest health and downstream water subsidies. Here, we present data from a network of sap velocity sensors and xylem water isotope measurements from three common tree species (Picea engelmannii, Abies lasiocarpa and Populus tremuloides) across a hillslope transect in a subalpine watershed in the Upper Colorado River basin. We use these data to compare tree- and stand-level responses to the historically high spring snowpack but low summer rainfall of 2019 against the low spring snowpack but high summer rainfall amounts of 2021 and 2022. From the sap velocity data, we found that only 40 % of the trees showed an increase in cumulative transpiration in response to the large snowpack year (2019), illustrating the absence of a common response to interannual spring snowpack variability. The trees that increased water use during the year with the large spring snowpack were all found in dense canopy stands – irrespective of species – while trees in open-canopy stands were more reliant on summer rains and, thus, more active during the years with modest snow and higher summer rain amounts. Using the sap velocity data along with supporting measurements of soil moisture and snow depth, we propose three mechanisms that lead to stand density modulating the tree-level response to changing seasonality of precipitation:
-
Topographically mediated convergence zones have consistent access to recharge from snowmelt which supports denser stands with high water demands that are more reliant and sensitive to changing snow.
-
Interception of summer rain in dense stands reduces the throughfall of summer rain to surface soils, limiting the sensitivity of the dense stands to changes in summer rain.
-
Shading in dense stands allows the snowpack to persist deeper into the growing season, providing high local reliance on snow during the fore-summer (early-summer) drought period.
Combining data generated from natural gradients in stand density, like this experiment, with results from controlled forest-thinning experiments can be used to develop a better understanding of the responses of forested ecosystems to futures with reduced spring snowpack.
- Article
(7463 KB) - Full-text XML
-
Supplement
(2280 KB) - BibTeX
- EndNote


Across the mountainous regions of the western US, there has been a widespread decline in the spring snowpack (Mote et al., 2018). The spring pulse of snowmelt recharges deep soil layers, providing a water source for forest ecosystems that can persist through the fore-summer drought period (Harpold and Molotch, 2015; Wainwright et al., 2020; Sloat et al., 2015; Coulthard et al., 2021). Isotopic and modeling studies have consistently shown that winter precipitation continues to act as the primary water source for subalpine trees for a period of months after the snowmelt pulse (Berkelhammer et al., 2020; Allen et al., 2019; Martin et al., 2018; Love et al., 2019; Kerhoulas et al., 2013). Reductions in the magnitude and duration of snowmelt inputs combined with higher warming-induced increases in evaporative demand have been shown to manifest in these forest systems as phenological shifts, increases in mortality, thinning, crown dieback and greater susceptibility to disturbance (Kelsey et al., 2021; Allen et al., 2010; Knowles et al., 2023; Carrer et al., 2023; Cooper et al., 2020).
Despite the broad ecological importance of snowmelt for subalpine forests (Trujillo et al., 2012), utilization of summer rain is also critical to the functioning of these ecosystems, particularly during periods with reduced snowmelt inputs (Berkelhammer et al., 2017; Strange et al., 2023). For example, aspen (Populus tremuloides) individuals rely on shallow soil moisture replenished by summer rains to alleviate periods of drought stress (Anderegg et al., 2013). In contrast, subalpine conifers, such as trees from Picea, Abies and Pinus genera, have generally been shown to be less responsive and reliant on summer precipitation (Pataki et al., 2000). Although summer rain only contributes 10 %–20 % of annual precipitation inputs for many areas in the western US, these modest precipitation inputs are sufficient to increase soil matric potentials above thresholds that can cause hydraulic damage to transpiring trees. This facilitates active water uptake by trees late in the summer (Samuels-Crow et al., 2023). Furthermore, the convective storm systems associated with summer rain locally increase humidity and moisten the surface soils, thus reducing the evaporative demand on trees (Strange et al., 2023). While a lot of attention has been given to declining trends in spring snowpack (Schmitt et al., 2024), summer rain in the western US may also be experiencing a decrease or possibly a change in frequency and intensity, although any persistent or spatially coherent trends remain less obvious (Holden et al., 2018; Pascale et al., 2017).
To understand the response of subalpine forest systems to changes in seasonal precipitation inputs, a better understanding of the factors that influence the seasonal origins of water used by trees is needed. Previous work in subalpine forests has often considered this problem from the perspective of species traits and their impact on the timing and soil depth that trees extract their water from. Root profiles and water uptake develop the shallowest possible profile at the community scale, leading to preferential use of growing season precipitation (Schenk, 2008), but species may develop deeper profiles in response to stress and competition. For example, Grossiord et al. (2017) showed that co-located piñon and juniper had opposing belowground responses to water stress that manifested in piñon trees seeking out deeper winter-sourced water during drought. Aboveground traits also influence water use patterns such that species like Populus tremuloides with a lower susceptibility to embolism can maintain high rates of transpiration during drier periods late in the summer (Pataki et al., 2000). On the other hand, species that have a higher susceptibility to embolism from air seeding, such as Abies lasiocarpa, face a greater risk from extracting water from desiccated soils and during periods with high vapor pressure deficits (VPDs). Consequently, they are less likely to remain active during periods of high evaporative demand and low soil moisture that precede or occur between periodic summer rains. Thus, these species have a tendency toward higher relative reliance on snow, as the risk of transpiring during periods of low soil moisture outweighs the benefits of access to sporadic rain events (Berdanier and Clark, 2018). In addition, differences in species-level allocation to leaf area and variations in phenology affect the interception of snow and rain as well as surface radiation loads to the surface, which influence the sublimation of snow and soil evaporation. For example, results from subalpine forests in Colorado show that aspen stands may experience 40 % higher effective precipitation rates (Thomas, 2016) and 20 % higher rates of winter sublimation compared with nearby conifer stands (LaMalfa and Ryle, 2008). These processes effectively shift what seasonal precipitation inputs are present in the surface soils of forest stands composed of different species.
Studying the question of seasonal water utilization strictly in terms of species-level traits has limitations, as the distribution of species within a watershed is generally sensitive to hillslope position (Metzen et al., 2019). Thus, species may experience different temperatures and VPDs, depth to groundwater, snowpack buildup, timing of snow disappearance, and radiation loading, all of which may influence the preferential utilization of seasonal water sources (Brooks et al., 2015; Martin et al., 2018; Molotch et al., 2009; Fabiani et al., 2022; Cooper et al., 2020). For example, using sap velocity and water isotope data from a subalpine watershed in Montana, Martin et al. (2018) found a measurable increase in the reliance on snowmelt by subalpine fir over a 350 m elevational gradient. They argued that fir trees in the lower-elevation plots rely on more snowmelt due to a shallower groundwater downslope and the convergence of lateral near-surface flow, both of which lead to persistent access to snowmelt waters through the growing season. The lower-elevation snow-reliant plots are, thus, more sensitive to annual snowmelt inputs and more responsive to interannual shifts in the snowpack. The tree water use pattern observed by Martin et al. (2018) supports a view of hillslope ecohydrology in which vegetation near the bottom of the hillslope or in local topographically mediated convergence zones is more connected to changes in snowmelt inputs (Hoylman et al., 2018; Graup et al., 2022). From this perspective, the species-level traits may be less important for determining the seasonal origins of water use than the position on the hillslope.
In addition to species traits and hillslope position, stand density generates myriad effects on water pathways through the soil–plant–atmosphere continuum, including modulating the interception of rain and snow, competition for soil water between plants, and changes in soil infiltration (Tague et al., 2019). Because stand density can be actively managed, thinning is used to reduce the vulnerability to ongoing changes in climate and snow hydrology (O'Donnell et al., 2021; Belmonte et al., 2022). Consequently, the effects of stand density on seasonal water access and water stress have been studied through thinning experiments (Bréda et al., 1995; Kerhoulas et al., 2013). A consistent effect of changing stand density in subalpine forests is that thinned stands tend to experience a larger buildup of winter snowpack due to reduced canopy interception. However, this effect does not always translate to more water being available to plants, as higher radiative inputs to the surface can generate melt that occurs earlier in the spring and ahead of the period of most active water use by trees (O'Donnell et al., 2021). The thinned stands also experience higher throughfall of summer rain, on the order of 10 %–20 %, with a 50 % reduction in the basal area index (Thomas, 2016; Mazza et al., 2011). In addition to reduced inputs of precipitation in unthinned stands, there is also increased levels of competition for water: individual trees in unthinned stands experience higher levels of water stress (Bréda et al., 1995), whereas trees in thinned stand tend to compete with shallow-rooted understory plants that emerge in canopy openings (Kerhoulas et al., 2013). This can facilitate the development of deeper root systems that are more likely to support sustained access to snowmelt. Lastly, a number of studies have also shown that stand density influences soil properties such that the hydraulic conductivity and infiltration rate of soils is higher in dense stands, which may increase available soil water despite higher levels of canopy interception (LaMalfa and Ryle, 2008; O'Donnell et al., 2021; Belmonte et al., 2022).
The cumulative effect of thinning is that dense (i.e., unthinned) stands experience drier surface soils, higher levels of water stress and reduced tree-level transpiration (Tague et al., 2019). Kerhoulas et al. (2013) showed that these changes shift the seasonality of water sources towards an increased reliance on snowmelt and winter precipitation. The higher preferential use of winter precipitation in thinned stands is hypothesized to arise from a combination of decreased interception of snow, the presence of taller and deeper-rooted trees, and an increase in shallow-rooted understory vegetation that competes for summer rain inputs in the shallow soil layers. The increased reliance on winter precipitation in thinned stands has been affirmed by other studies such as Sohn et al. (2014). However, other publications such as Fernandes et al. (2016) suggest an opposite effect where thinned stands rely more heavily on summer rain due to higher levels of through-falling rain and higher losses of snowpack to runoff and sublimation. The use of thinning experiments has been able to document ways in which the stand density could affect reliance and/or sensitivity to changes in precipitation seasonality. However, in the context of unmanaged forests, in which the hillslope position, stand density and species distribution co-vary, the competing effects of soil properties, subsurface flow and traits make it more difficult to predict the reliance on and sensitivity to changing snow. For example, the location of dense stands often indicates the presence of shallow groundwater recharged by snowmelt (i.e., a high reliance in snowmelt), despite the fact that these stands may also lose more of the potential incoming snow to interception and sublimation.
In this study, we present an interannual analysis of transpiration fluxes (via sap velocity sensors) and seasonal origins of water used by trees (via stable isotope analysis) from a network of sites along a hillslope transect of ∼ 500 m in the Upper Colorado River basin that includes a mixture of fir, spruce and aspen individuals, which are typical of this region. The instrumented and sampled stands include different combinations of co-existing species and fall into a cluster of more open stands, typical of this hillslope, and a cluster of dense stands, localized convergence zones. We take advantage of the sensors operating across years with opposing seasonal precipitation inputs (high snow and low summer rain vs. low snow and higher summer rain) to test how species, hillslope position and stand properties influence the response of trees to interannual changes in precipitation seasonality. We document differences in the seasonal origins of water utilized across species and show that trees in the denser-canopy stands showed greater declines in transpiration during the year with the low spring snowpack. From these results, we provide hypotheses to explain how stand density might influence sensitivity to interannual snow inputs in an unmanaged watershed and how this result contrasts with those generated from controlled thinning experiments.
2.1 Sap velocity network
We installed a network of sap velocity sensors at six sites across a hillslope transect on Snodgrass Mountain outside of Crested Butte, Colorado, in the Upper Colorado River basin (Fig. 1) (Fuchs et al., 2017). The sites span a 500 m range in elevation, transitioning from a dominance of trembling aspen (Populus tremuloides) at the lowest elevation to a mixture of Engelmann spruce (Picea engelmannii) and subalpine fir (Abies lasiocarpa) towards the top. At each site, two mature and visibly healthy trees of each species were selected for instrumentation. Because sites had between one and three species present, each stand had between two and six instrumented trees. To measure sap velocity, we used the SFM1 sensor manufactured by ICT International (Armidale, NSW, Australia). The sensor logs an estimate of sap velocity using the heat ratio method from Burgess et al. (2001). Each sensor includes three stainless-steel probes of 1.3 mm diameter and 35 mm length. The probes are installed in the tree by removing the outer tree bark and drilling three parallel holes spaced precisely 5 mm apart using a drill guide. Care was taken to drill the holes as a series of small incremental steps with a low drill speed to minimize wounding that affects the conductivity of wood around the probes. The middle probe includes a 12 VDC heater that is powered on for ∼ 5 s when a measurement is made. The upper and lower probes include thermistors with a resolution of 0.001 °C positioned at 7.5 and 22.5 mm along the probes in order to estimate sap velocity at two depths in the sapwood. We programmed our sensors to turn on and make a measurement every ∼ 15 min, although this interval was reduced for some trees where radiation loads on the solar panels were limited. To estimate sap velocity, we use Eqs. (1)–(3) below.
Here, Vh is the uncorrected heat pulse velocity, k is the thermal diffusivity of wood, x is the distance between the heater and thermistors (5 mm), and t1 and t2 are the increase in temperature measured at the respective equidistant points above and below the heater where the thermistors are installed. This measurement then has to be corrected using a wounding coefficient that accounts for the reduction in the conductivity of wood once it has been wounded during the installation process. To estimate the wounding effect, we use the approach outlined in the sensor manual that is based on earlier work by Swanson and Whitfield (1981) and described by Eq. (2) below.
Here, Vc is the corrected heat pulse velocity; Vh is the uncorrected heat pulse velocity from Eq. (1); and a, b and c are a series of empirically derived wounding coefficients that vary based on the size of the wound. These latter coefficients were measured each year when the probes were reinstalled. Finally, we estimate the sap velocity using Eq. (3), which solves for the velocity of water within the wood matrix, based on Marshall (1958).
Here, Vs is the sap velocity (in units of cm h−1), Vc is the corrected heat pulse velocity from Eq. (2), ρb and ρs are the respective densities of wood and water, cw and cs are the respective specific heat capacities of wood and water, and mc is the water content of sapwood that was measured for each tree.
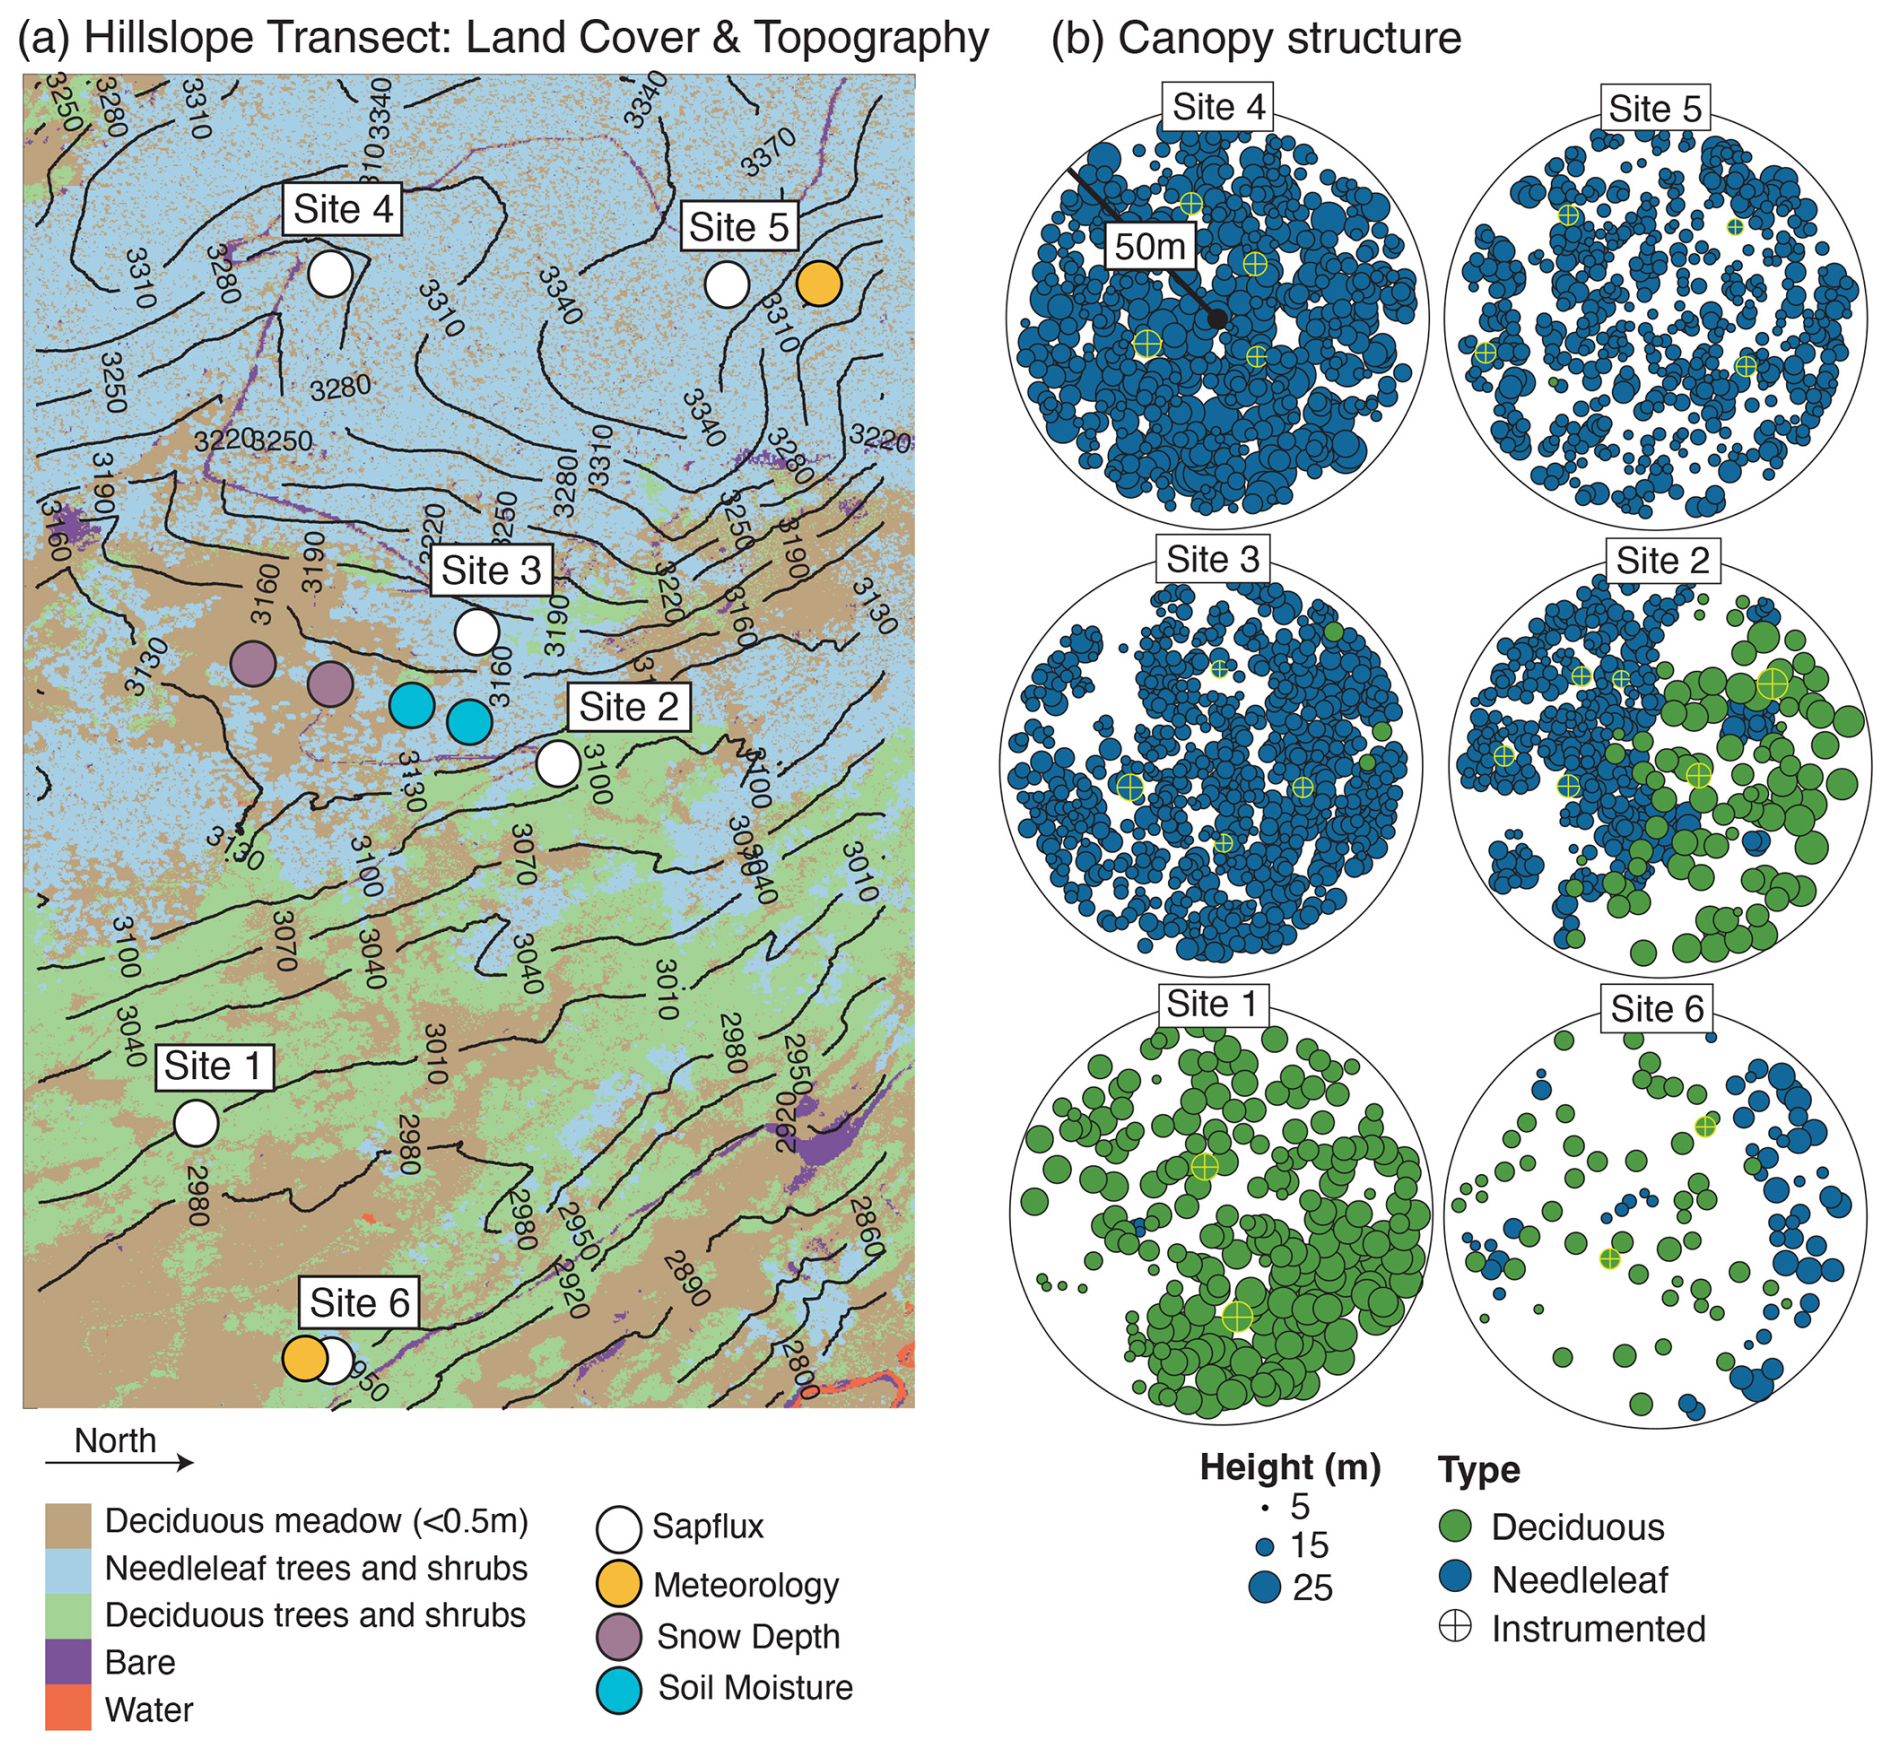
Figure 1Panel (a) provides a map of the Snodgrass Mountain hillslope showing the six sap velocity clusters and multiple meteorological towers projected over elevation and land cover type. Panel (b) presents maps of canopy density and tree height for the six plots shown in panel (a). Plots were delineated as a 50 m radius circle drawn from the center point of the instrumented trees. See Sect. 2 for information on how the tree height and individual crowns were delineated.
Sensors were installed on the northern side of each tree in June 2019 and repositioned on the same tree each spring until 2022, excluding 2020 when fieldwork was unable to be conducted due to COVID-19. Bark depth, sapwood depth, sapwood density and water content were measured in July 2019, with wound diameter also determined following reinstallation. Sapwood depth was determined on two cores with a 5 mm diameter taken on the northern and southern sides of the tree at 1.2 m height using an increment borer (Haglöf, Långsele, Sweden) and stained with methyl orange to indicate active sapwood. An average sapwood depth was calculated for each tree. Although the sensors ran during 2020, data from this season were not included in these analyses owing to observations that wounding effects were too severe to keep probes in the same location for multiple seasons and still produce reliable estimates of sap velocity. Heat pulse velocity measurements on some trees were restricted to the daytime only – when the sap velocity typically peaks – to reduce power consumption overnight. Consequently, nighttime data were limited, and the focus of our analysis is on midday patterns. As discussed in Sect. 3.1, one focus of the analysis of sap velocity was on differences between 2019 and 2021–2022. To do this, we calculated the weekly averaged daytime sap velocity and subtracted each weekly value from 2019 from the averaged weekly value from 2021 and 2022. We did not include Site 6 in the interannual analysis, as there were insufficient data from that site to estimate seasonally averaged interannual differences in the sap velocity.
2.2 Water isotope data
During the growing season, approximately weekly measurements of twig water isotopes were made for each of the trees instrumented with sap velocity sensors. Live twigs of ∼ 3–5 cm diameter were sampled from the trees, debarked, placed in a sealed bag and frozen as quickly as possible. Water from the twigs was extracted cryogenically using a batch-distillation method (Berkelhammer et al., 2020). Surface soil samples were periodically collected from a 10 cm depth at each sap velocity site during the field seasons. The soil samples were extracted following the same method as the twig samples. All extracted soil and twig water samples were analyzed for δ18O and δ2H on a Picarro l2140-i analyzer following the methodology described in Berkelhammer et al. (2020).
To understand the source of water within the extracted twig pool, we utilized additional information on meteoric water inputs to the hillslope. We took advantage of a wide range of groundwater, precipitation and snowpack sample isotopic data from this watershed that have previously been presented (Carroll et al., 2022a). Twig and soil water samples are subject to evaporative enrichment relative to the precipitation inputs, leading to higher values of δ18O and δ2H as well as a shallower slope between the two isotopes relative to meteoric inputs. To estimate the sources of water in twigs and soils, the measurements need to be projected back to the meteoric water line. We do this, following Benettin et al. (2018) and Allen et al. (2019), by estimating an evaporation line for each sample using measured meteorological data and then solving for the intersection between each sample's evaporation line and the meteoric water line defined by the isotopic ratio of precipitation samples. Lastly, we were cognizant of the possibility of fractionation between δ2H of the source water and the twig water, as has been noted in a number of recent studies (Chen et al., 2020; Barbeta et al., 2019). This offset has been linked to numerous processes and, according to Diao et al. (2022), is more severe when the sample size of extracted water is less than 0.6 mL. We attempted to minimize this issue by extracting water from large samples that generally yielded more than 1.5 mL of water. Nonetheless, we assessed this potential bias by comparing the isotopic ratio of the soil and twig water samples during the early period of the summer immediately following snowmelt, when we assume that soil water would be minimally evaporated and there would be an almost homogenous profile in the isotopic ratio of the soil water. During this period, we observed statistically similar values for twig and soil δ18O but an approximate −6 ‰ offset between twig and soil δ2H (Fig. S2). This negative offset is similar to that observed in previous studies (Barbeta et al., 2019; Diao et al., 2022); therefore, we apply this value as a correction to all measured stem δ2H values. Hereafter, we refer to twig water as the estimated isotopic ratio of the source water value following all corrections based on the aforementioned effects. Raw isotopic data are provided in the dataset associated with this publication.
2.2.1 Isotopic mixing model
To assess the relative proportion of snowmelt in the twig water samples, we developed a mixing model with three distinct end-members. One end-member was snowmelt water, the value of which was estimated from snowpack and snowmelt measurements with a modest correction for lapse rate across the elevational gradient of our sites (Carroll et al., 2022a). As groundwater from nearby wells in the area was typically hard to distinguish from snowmelt without an additional tracer, we did not attempt to separate the current year's snowmelt from older snowmelt that had recharged the groundwater in previous seasons. The second end-member is the weighted average of precipitation during the growing season up until the time of sampling. This was developed by combining the date and amount of each rain event with values for the isotopic ratio of that rain event. The third end-member is the isotopic value of the most recent rainfall event. The justification to separate summer rain into two end-members was based on the fact that (1) growing season rain has a cumulative impact that aggregates in the soil horizon and (2) the most recent rain event may be present in the near-surface soils and immediately taken up by the trees. Early in the growing season, these two precipitation end-members are nearly identical, but they became distinct later in the growing season, as the most recent rainfall event tends to be more enriched than the cumulative inputs (Fig. S1 in the Supplement). We did not consider travel time and storage within the trees; this is a limitation to this mixing model in instances when the most recent rainfall event occurred just days before sampling and, therefore, would not likely yet be present in the sampled twig reservoir (Knighton et al., 2020). More sophisticated and higher-resolution sampling approaches would be needed to resolve these dynamics (Seeger and Weiler, 2021).
We implemented the mixing model using a Bayesian Monte Carlo approach developed and described by Arendt et al. (2015). The principle of this method is that distributions of possible end-member mixtures are generated randomly but must adhere to the condition that the fractional contribution of each end-member sums to 1. Samples from these prior distributions are selected using a uniform random-walk Monte Carlo simulation. Samples from the simulated end-member mixtures are rejected or retained based on their likelihood, giving rise to the posterior distribution that provides the most likely mixing model and an estimate of the uncertainty around this model. In developing the prior distributions, the uncertainty in each end-member must be defined, and we assume that uncertainty is normally distributed around a standard deviation derived independently from our observations. We assume that the uncertainty is the same for each measurement and make no specific assumptions about prior distributions being different between species, across sites or over time. We assume that the standard deviation on the twig water measurements is 1 ‰ for δ18O and 8 ‰ for δ2H, based on repeat measurements from samples of the same tree. These uncertainties are about an order of magnitude larger than analytical uncertainty and represent the cumulative effects of within-tree heterogeneity, sampling, storage and transport, and cryogenic extraction. We estimate similar levels of uncertainty for the values of the precipitation and snowmelt end-members based on ranges that emerged from the simulations and measurements of snowmelt and precipitation observed in previous studies (Carroll et al., 2022b; Anderson et al., 2016). The Bayesian mixing model is similar in function and form to other recent stable water isotopic tree source water studies such as Samuels-Crow et al. (2023).
2.3 Meteorological data
We utilized numerous atmospheric and surface weather datasets for the analyses and interpretations described in Sect. 3. There are six meteorological stations in the Snodgrass Mountain hillslope transect where the sap velocity measurements were made (Fig. 1). These stations – run by three different research groups (i.e., Simonpietri and Carbone, 2024; Ryken, 2021; and Bonner et al., 2022) – have collected data over different periods of time and have distinct combinations of sensors. Because these datasets have all been published and are publicly available, we refer the reader to the original sources (listed above) for details on the collection approaches. We averaged these datasets to develop a daily mean temperature and humidity dataset for the hillslope to estimate the evaporative mixing lines described above (Sect. 2.2.1). To do this, we used the daily average temperature based on all available measurements for a given day. We utilized snow depth and snow water equivalent (SWE) measurements from a pair of adjacent forest and meadow stations that were derived using both continuous snow height sensors and periodic snow pits (Bonner et al., 2022). These data were used to estimate how the presence of the canopy influenced the timing of snowmelt inputs to the soil. We took advantage of daily precipitation data to weight the importance of each precipitation event with respect to the growing season isotopic inputs for the mixing model (Sect. 2.2.1 and 2.2.2). We used continuous volumetric water content estimates at three soil depths (5, 15 and 50 cm) from adjacent conifer and aspen sites to illustrate differences in growing season (May–June–July–August–September) rain infiltration between the different canopy types (Carbone et al., 2023). Lastly, we utilized the long-term record of rainfall and snowfall from the nearby Gothic, Colorado, weather station (Faybishenko et al., 2023) to place the years of this study into a climatological context.
2.4 Remote sensing and GIS
Canopy structure for each site instrumented for sap velocity was measured via airborne lidar scanning (ALS), using the 1 m canopy height model (CHM) and vegetation-type data (Goulden et al., 2020). We identified the center point of each cluster of sap velocity probes, captured all trees within a 50 m radius around the center point, and classified this tree cluster as a site or stand. For each stand, we identified all of the tree crowns using the method of Parkan and Tuia (2018) and identified whether the crown was deciduous (aspen) or coniferous (subalpine fir, Engelmann spruce or lodgepole pine) based on the vegetation-type classification dataset from Goulden et al. (2020). We used previously established allometric relationships between tree height and diameter at breast high (DBH) for these tree species in this region (Hulshof et al., 2015) to estimate the DBH of each crown and then estimated the sapwood area using our paired measurement of sapwood depth and DBH by fitting a power-law model with the same order as described by Mitra et al. (2020). We then divided total sapwood area (aspens and conifers) by ground area (fixed at the 50 m radius) to generate a sapwood-to-ground-area estimate for each site. Lastly, we used a local digital elevational model (Goulden et al., 2020) to estimate the topographic position index (TPI) for each site.
3.1 Sap velocity data
Instantaneous sap velocity values displayed diurnal and seasonal cycles that followed expectations for all species based on previous work from a similar montane forest system in the region (Fig. 2) (Pataki et al., 2000). Both conifer species had peak values early in June during all years but exhibited substantial interannual variation later in the season, such that transpiration rates dropped to very low levels in August during 2019 but persisted measurably into September and October during both 2021 and 2022. These differences reflect the presence of significant summer rainstorms in 2021 and 2022 relative to 2019. Due to limited early-season site access, we did not generate data to capture the early-season sap velocity of the conifers. Based on the fact that the species displayed almost peak rates of sap velocity by early June (i.e., day of the year 160), we suspect that the early-growing-season water use was significant and is a critical absence in terms of our capacity to close the transpiration water budget. Previous sap velocity work from a subalpine system in the Sierra Nevada in California also suggests that transpiration is active by April and can reach close to peak values by middle to late May (Cooper et al., 2020). Although the conifers displayed similar average sap velocity values and temporal patterns, we do note measurable differences in the behavior between species. For example, the sap velocity of subalpine fir relative to Engelmann spruce was shifted earlier in the season and showed higher water use during the early morning and evening (although with similar midday peak values for both species). In contrast to the conifers, aspen transpiration typically began in early June following leaf-out, with a protracted period of high transpiration that extended into mid-August before showing measurable declines. Transpiration stopped by mid-September ahead of leaf senescence. Despite the shorter period of activity, the peak rates and average sap velocity for aspens were substantially higher than those of both conifer species.
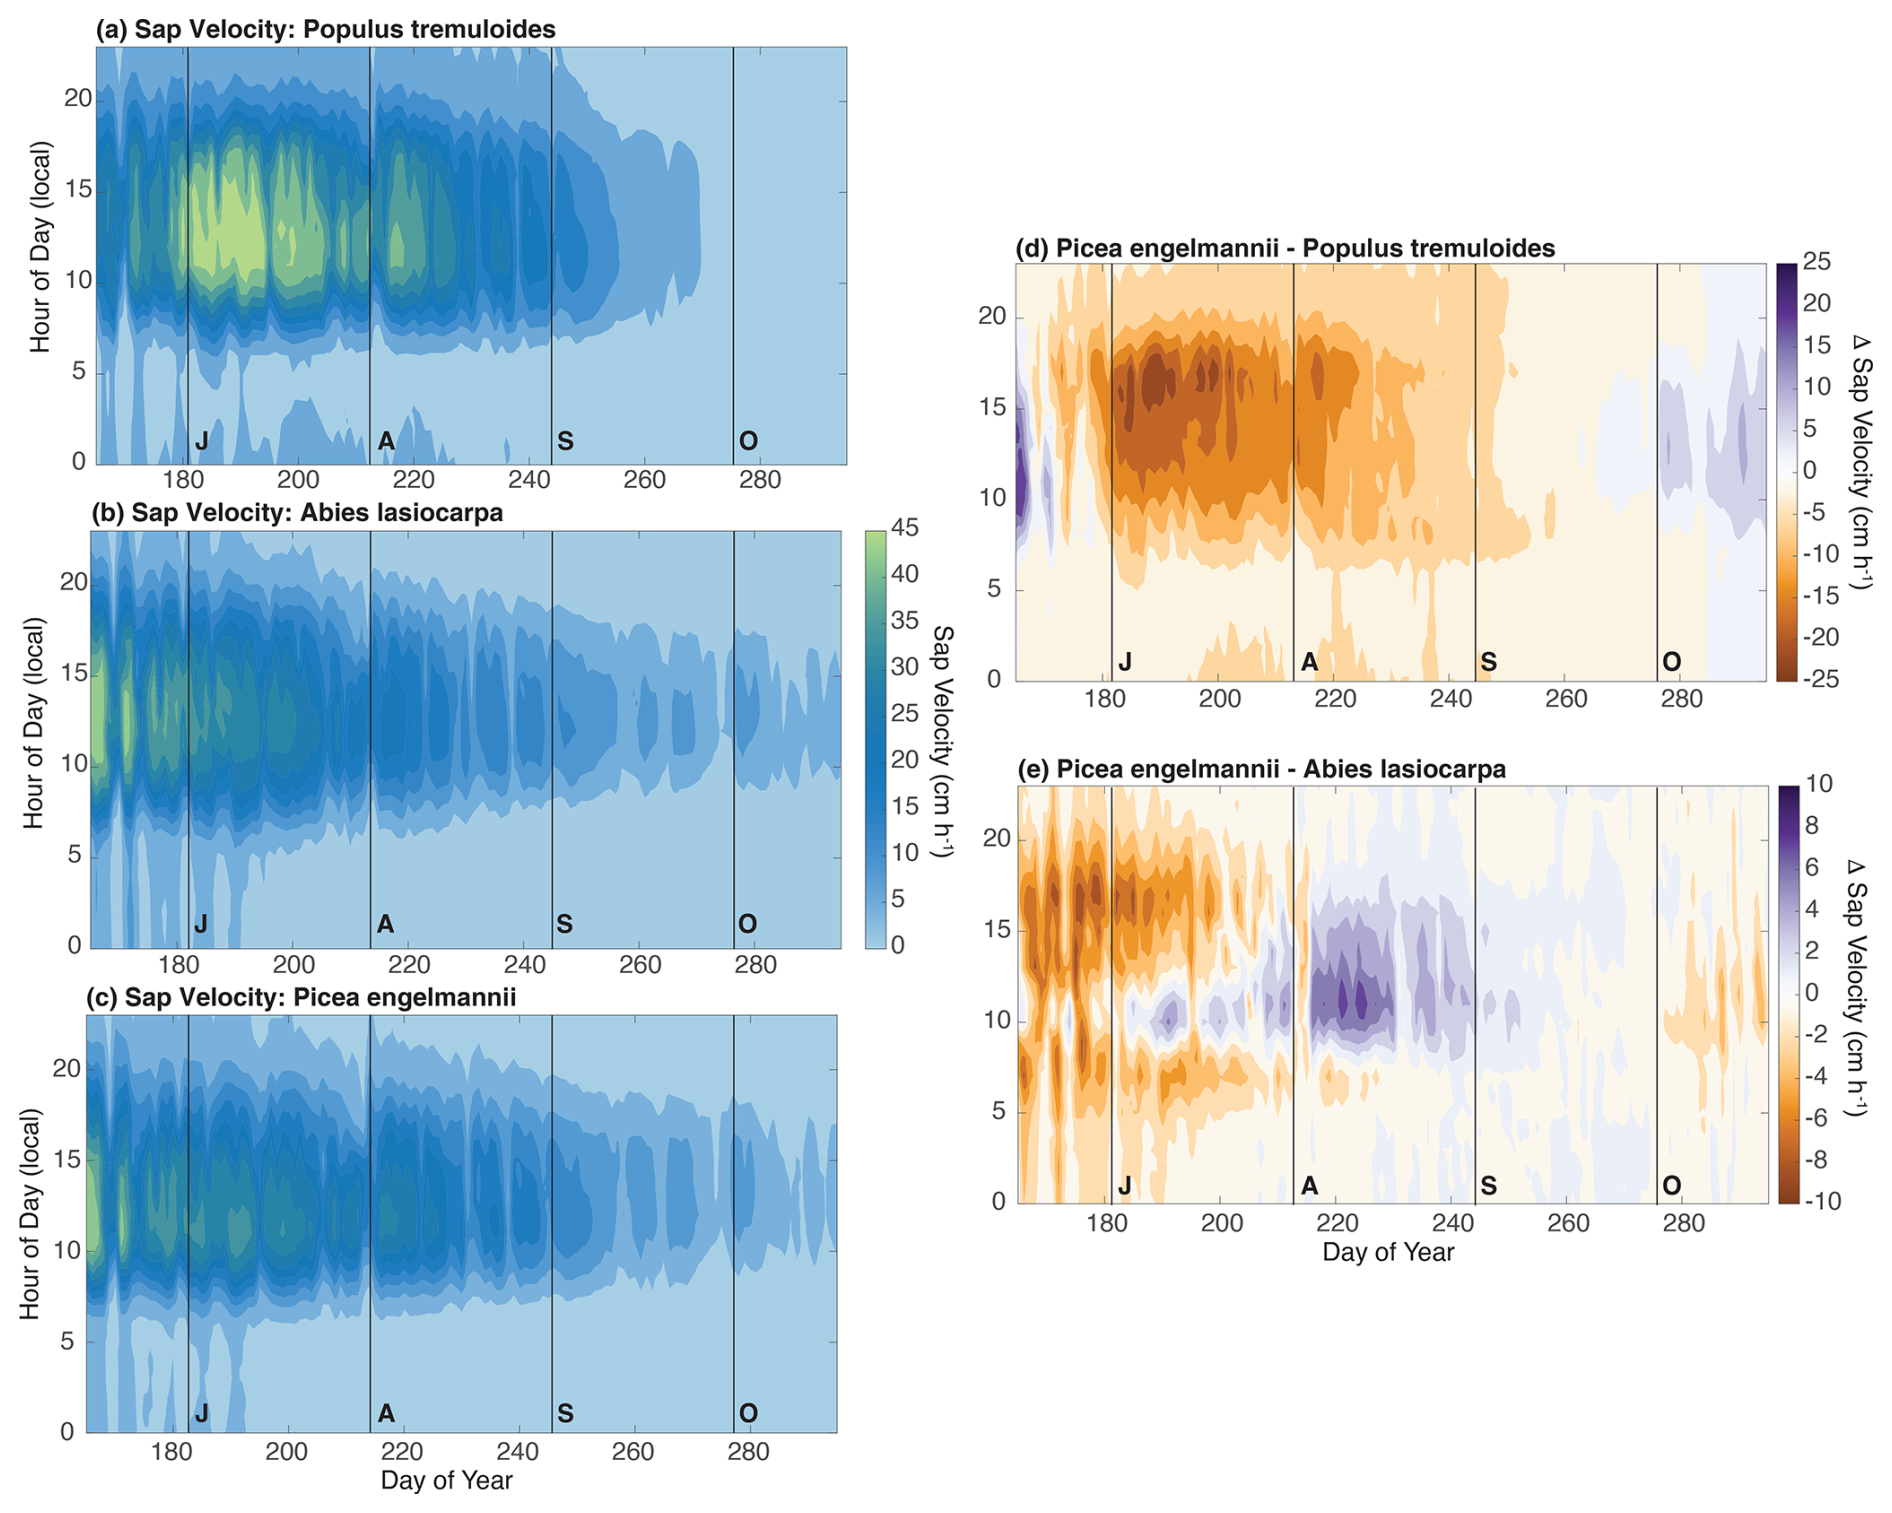
Figure 2Panel (a) presents the sap velocity averaged across all trembling aspen trees between years as a function of hour of the day (y axis) and day of the year (x axis). Panel (b) is the same as panel (a) but for subalpine fir. Panel (c) is the same as panel (a) but for Engelmann spruce. Panel (d) provides the differences in sap velocity between Engelmann spruce and trembling aspen. Panel (e) is the same as panel (d) but for Engelmann spruce and subalpine fir, although differences in the scale bar (to accentuate the more subtle differences between conifer species) should be noted.
The period during which this experiment was conducted (2019–2022) was characterized by both intervals of higher-than-normal spring snowpack with lower-than-normal summer rains (2019) and lower-than-normal spring snowpacks with higher-than-normal summer rains (2021–2022) (Fig. 3). We use 1 May snowpack as our spring snowpack indicator, as this metric captures the magnitude of the snow reservoir present during the period in which conifers begin to show high levels of activity and can, therefore, directly utilize inputs from melting snow. We note that there appears to be a slight negative relationship between 1 May and July–August (JA) precipitation over the last 40 years, as observed in previous work (Gutzler and Preston, 1997). This implies that trees are likely to generally experience contrasting inputs of winter vs. summer precipitation in typical years. Using this analysis on precipitation seasonality, 2019 ranks among the highest years for 1 May snow and among the lowest years for JA precipitation. In contrast, the period between 2020 and 2022 was characterized by below-average 1 May snow and above-average JA rainfall, illustrating the strong contrast in precipitation seasonality among the experimental seasons. While we did not include 2020 in our sap velocity analysis, we highlight this year in Fig. 3 to emphasize a sustained multiyear difference in precipitation seasonality over the last 3 years of the experiment relative to 2019.
Prior to day of the year ∼ 200, almost all of the trees (88 %) showed an increase in sap velocity in 2019 relative to 2021–2022, illustrating how an extended spring snowpack supports high levels of transpiration during peak radiation and the fore-summer drought period (Fig. 3b). However, by the end of the growing season, less than half of the trees had retained a higher total averaged sap velocity. In fact, averaged across all trees, there was a slight decline in cumulative sap velocity in 2019 relative to 2021–2022. This result shows that (1) a historically large spring snowpack like 2019 did not universally enhance water use and that (2) the buffering effect of the more active monsoon seasons of 2021 and 2022 appeared to fully offset the presumed negative effects of a lower snowpack across this population of trees. This result is consistent with results from Strange et al. (2023), who utilized a network of tree-ring records across the southwestern US to show that variations in monsoon rain were able to fully offset the deleterious effects of winter drought on tree stress.
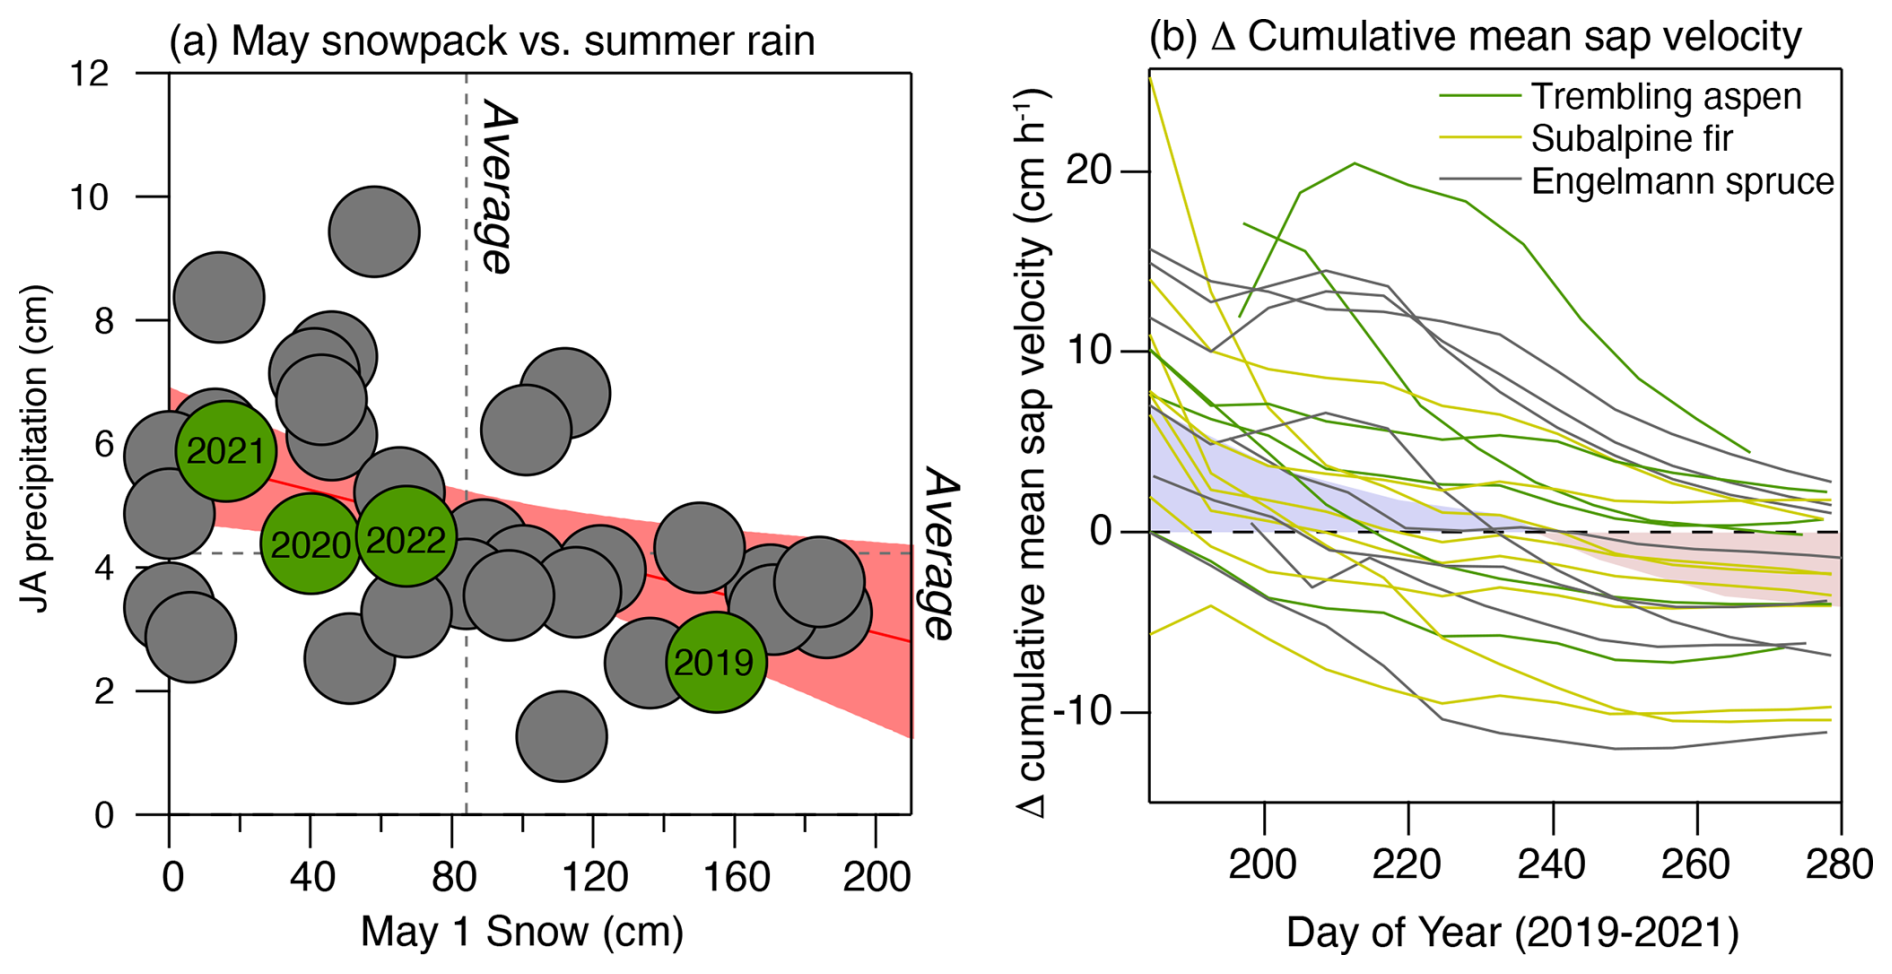
Figure 3Panel (a) presents the relationship between 1 May snowpack and July and August rainfall from the nearby Gothic weather station (Faybishenko et al., 2023). The 4 years encompassing the study are labeled in green, and a trend line with the 95 % confidence intervals along with the mean values for each seasonal precipitation input are indicated in pink. Panel (b) shows the difference in cumulatively averaged sap velocity between 2019 and 2021–2022 for each tree that had continuous measurements during each of those three growing seasons. The shaded area is the average of all trees to indicate the mean sap velocity response between the contrasting precipitation years.
3.2 Isotopic data
To place the patterns of sap velocity into a context of seasonal water source utilization, we rely on measurements of the twig water isotope samples and how they compare to seasonal water inputs. As expected, the twig water samples fall to right of the well-defined local meteoric water line (LMWL) – indicative of evaporative enrichment of soil waters relative to precipitation inputs (Fig. 4a). As discussed, the raw isotopic values shown in Fig. 4a were projected back to the interception with the precipitation LMWL to estimate the original seasonal origin of the precipitation source, and we then applied a mixing model to estimate the importance of snowmelt as the source for transpiration. Based on the results from the mixing model, we estimate that the trees relied on ∼ 60 % snowmelt, although this value varied significantly across space and species, as illustrated by the wide ranges of snowmelt reliance shown in Fig. 4b and c. To place this value in context, the hillslope receives ∼ 80 % of its precipitation inputs in the form of snow; thus, if the trees were relying on a mixture of seasonal water sources that purely reflected precipitation inputs, the reliance on snow would be higher than the ∼ 60 % value that we observed. Therefore, trees show a preferential use of summer rain relative to streamflow that is supported by about ∼ 90 % snowmelt (Carroll et al., 2020).
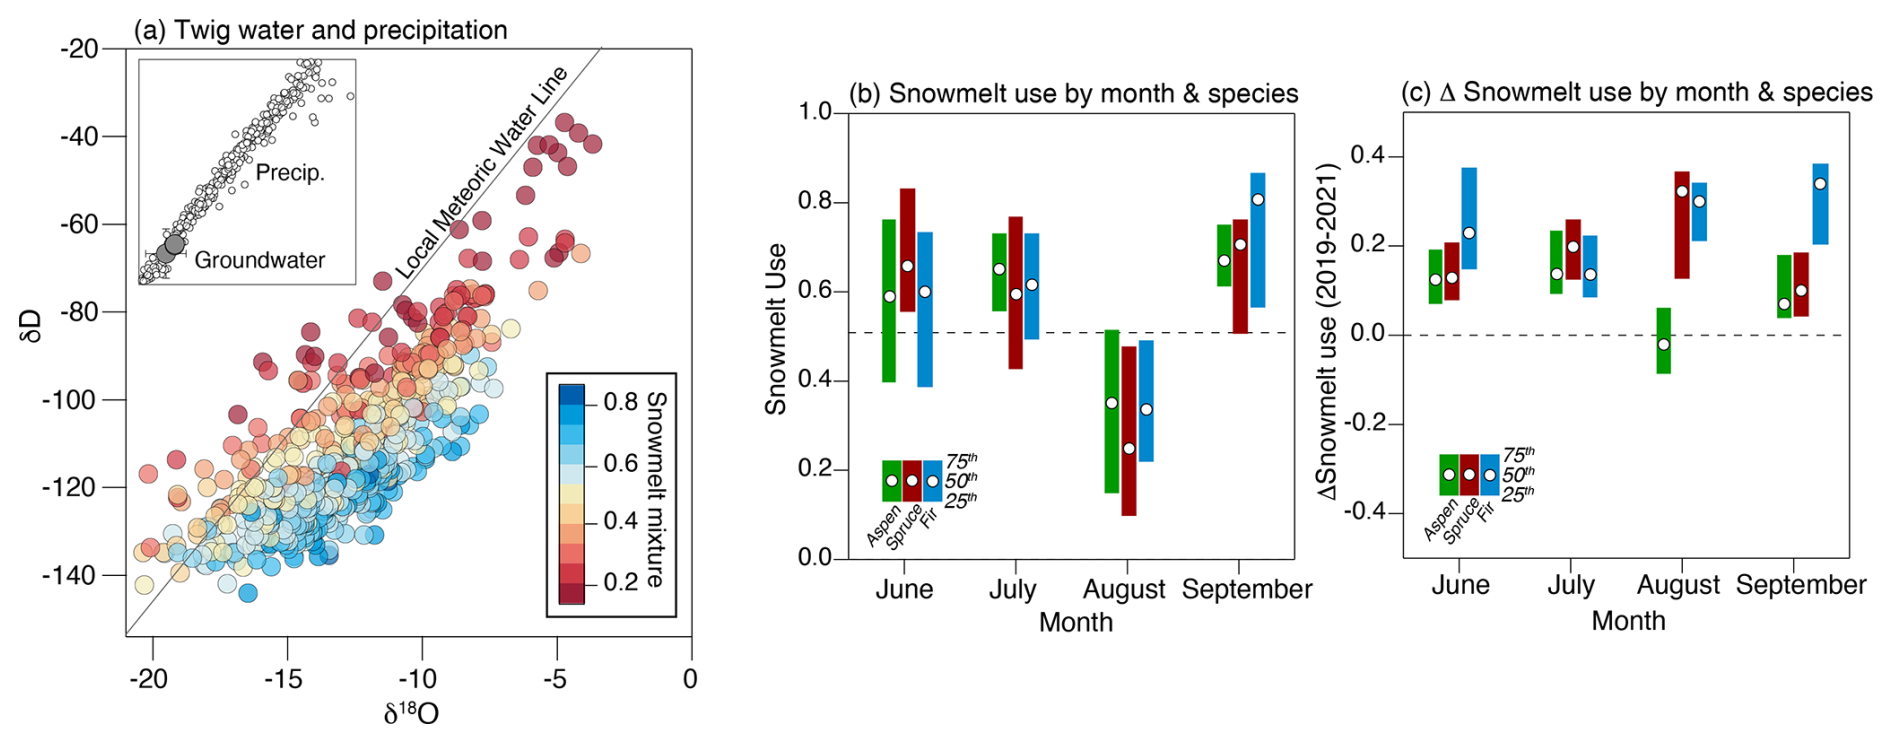
Figure 4Panel (a) shows the local meteoric water line for precipitation samples and the 3 years of collected twig and soil water samples. Samples are color-coded based on the inferred snowmelt reliance derived from the mixing model. Panel (b) presents the monthly averaged use of snowmelt per species based on all available data. A value of 1.0 corresponds to complete dependence on snowmelt water. Panel (c) displays the difference in reliance on snowmelt between 2019 and 2021.
The twig water isotope data show that the use of seasonal water sources varies through the growing season and between years. During June and July, snowmelt water accounted for 70 %–80 % of the water used, while the importance of summer rain only prominently emerged in samples collected in August (Fig. 4b). Interestingly, a return to the use of snowmelt as a water source occurred in September, indicating a reliance on groundwater or older snowmelt waters retained in the soil near the end of the growing season. Sap velocity is generally negligible during this period, so the water source in September is not consequential to the water budget but may be critical for sustaining low levels of tree activity deeper into the fall after summer rain inputs have mostly been lost to evapotranspiration. As expected, we note a consistent increase in reliance on summer rain in 2021–2022 relative to 2019 across species and time (Fig. 4c). The one notable exception to this pattern is the similar interannual use of summer rain in aspens during August. This may reflect the significantly lower interception rates for aspens (Thomas, 2016), which allowed the utilization of the limited summer rain inputs in 2019 that did not penetrate the conifer canopy, and/or the fact that extended spring snowpacks (as in 2019) can enhance summer rain use by allowing a higher density of surface roots to stay active during the fore-summer drought (Bailey et al., 2023).
In order to assess the partitioning of water sources between species, we filtered the isotopic data to look only at differences in water sources between co-located species sampled simultaneously. As shown in Fig. 5, we can see that all three species utilized a statistically similar water source during June and July, but a distinction between aspens and conifers started to emerge in late July (∼ day of the year 200) and reached a maximum in species partitioning in early August. For comparison, there was never a statistically significant partitioning between Engelmann spruce and subalpine fir. The difference in water sources between aspens and conifers emerges during periods when summer rains infiltrate under the aspen stands but not under the conifer stands (Figs. 5d and S6).
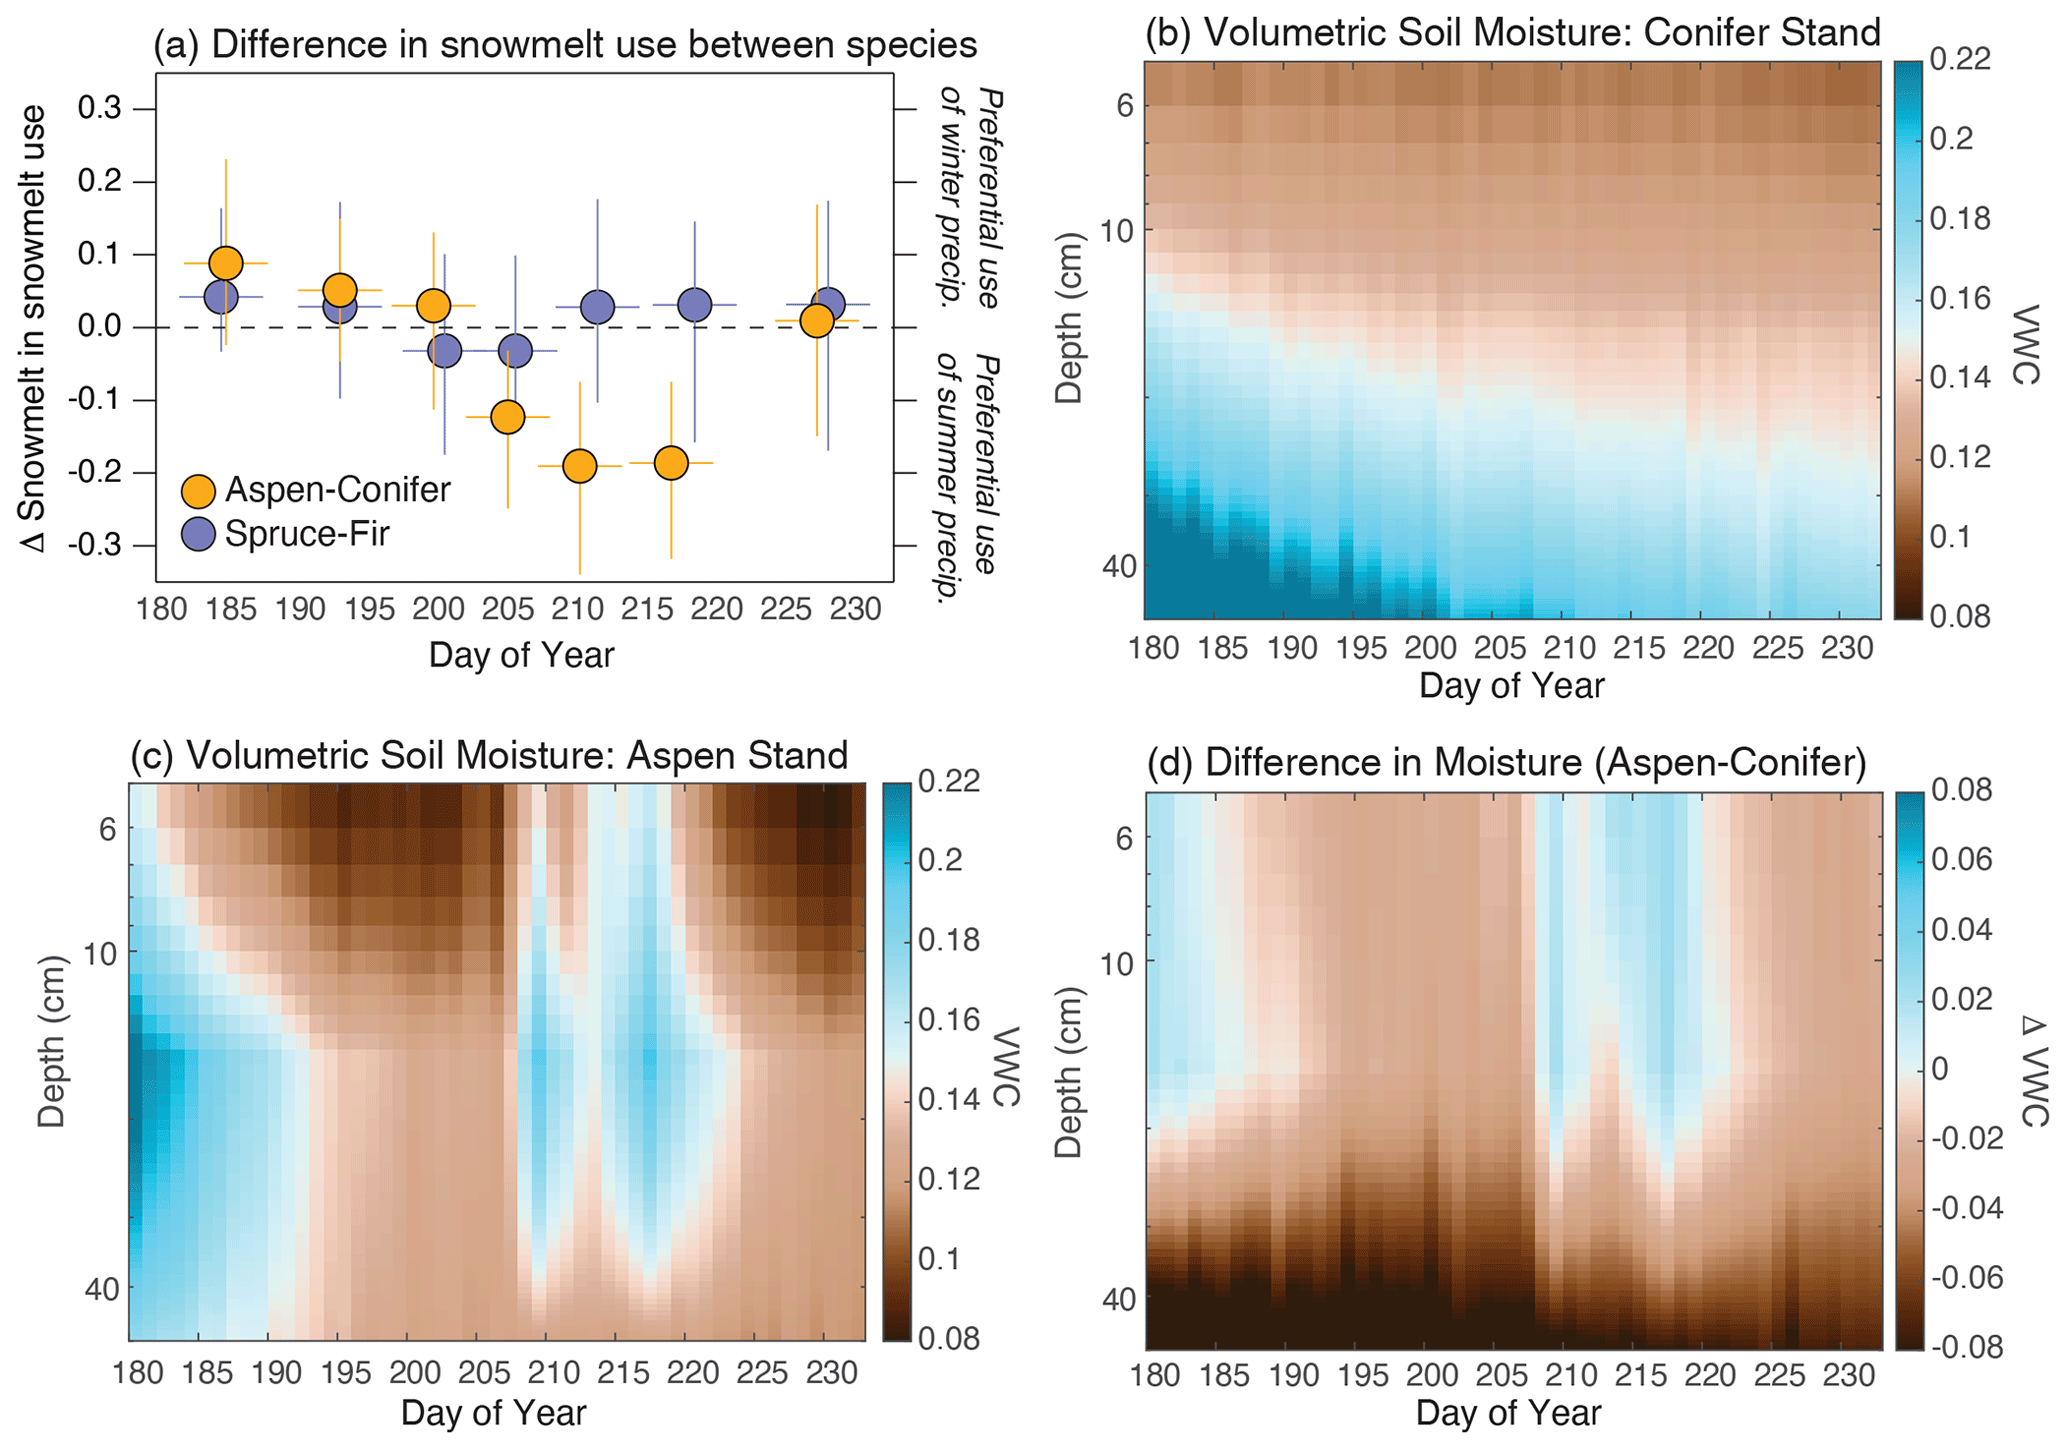
Figure 5Panel (a) shows the difference in reliance on snowmelt between trembling aspen and both conifer species (yellow) as well as the difference between the two conifer species (purple). The data were generated by only comparing snowmelt use between co-located and simultaneously sampled twig water samples. The data were binned into 10 d windows to capture dynamics that were occurring at the sub-monthly scale. Error bars capture the 25th and 75th percentiles around each of those 10 d bins. Panels (b) and (c) present the volumetric water content under adjacent conifer and aspen stands, respectively, interpolated from measurements at 5, 15 and 50 cm. The site location is indicated in Fig. 1, and the data are available from Simonpietri and Carbone (2024). Panel (d) displays the difference in volumetric water between aspen and conifer stands, illustrating the moistening of surface soils under the aspen stands in late-July and August.
3.3 Integration of isotopic, sap velocity and stand structure data
By combining the estimates of tree snowmelt reliance from stable isotopes and interannual variations in sap velocity (i.e., Fig. 3b), we find that trees more reliant on snowmelt were those that benefited most from the large spring snowpack in 2019 (Fig. 6a). Although this seems to be a self-evident result, it validates the idea that variation in the seasonal origin of a tree's water source influences its response to changing seasonal precipitation inputs. As can be seen in Fig. 6a, the sensitivity of a tree to interannual variations in snow inputs was not, however, clearly predicted by species, with examples of individual aspen, fir and spruce responding in opposite directions to the precipitation differences between 2019 and 2021–2022. Instead, the results show that all of the trees were more active during 2019 at two of the sites (1 and 4), whereas the trees were less active during 2019 at the other three sites (2, 3 and 5) (Fig. 6b). Site 1 is the lowest-elevation site and is exclusively aspen vegetation, whereas Site 4 is located near the top of the hillslope and is exclusively coniferous vegetation (Fig. 1). The species and elevational contrasts between these sites show that the common response of the trees at these sites to variations in snowpack was not associated with a particular species trait nor the elevational position on the hillslope. The most conspicuous characteristic shared between these two sites is that they have similar sapwood-to-ground-area values (∼ 38 cm2 m−2), which are approximately 3 times greater than the other three sites (∼ 12 cm2 m−2) and well above the typical values for forested areas on this hillslope (Fig. S5).
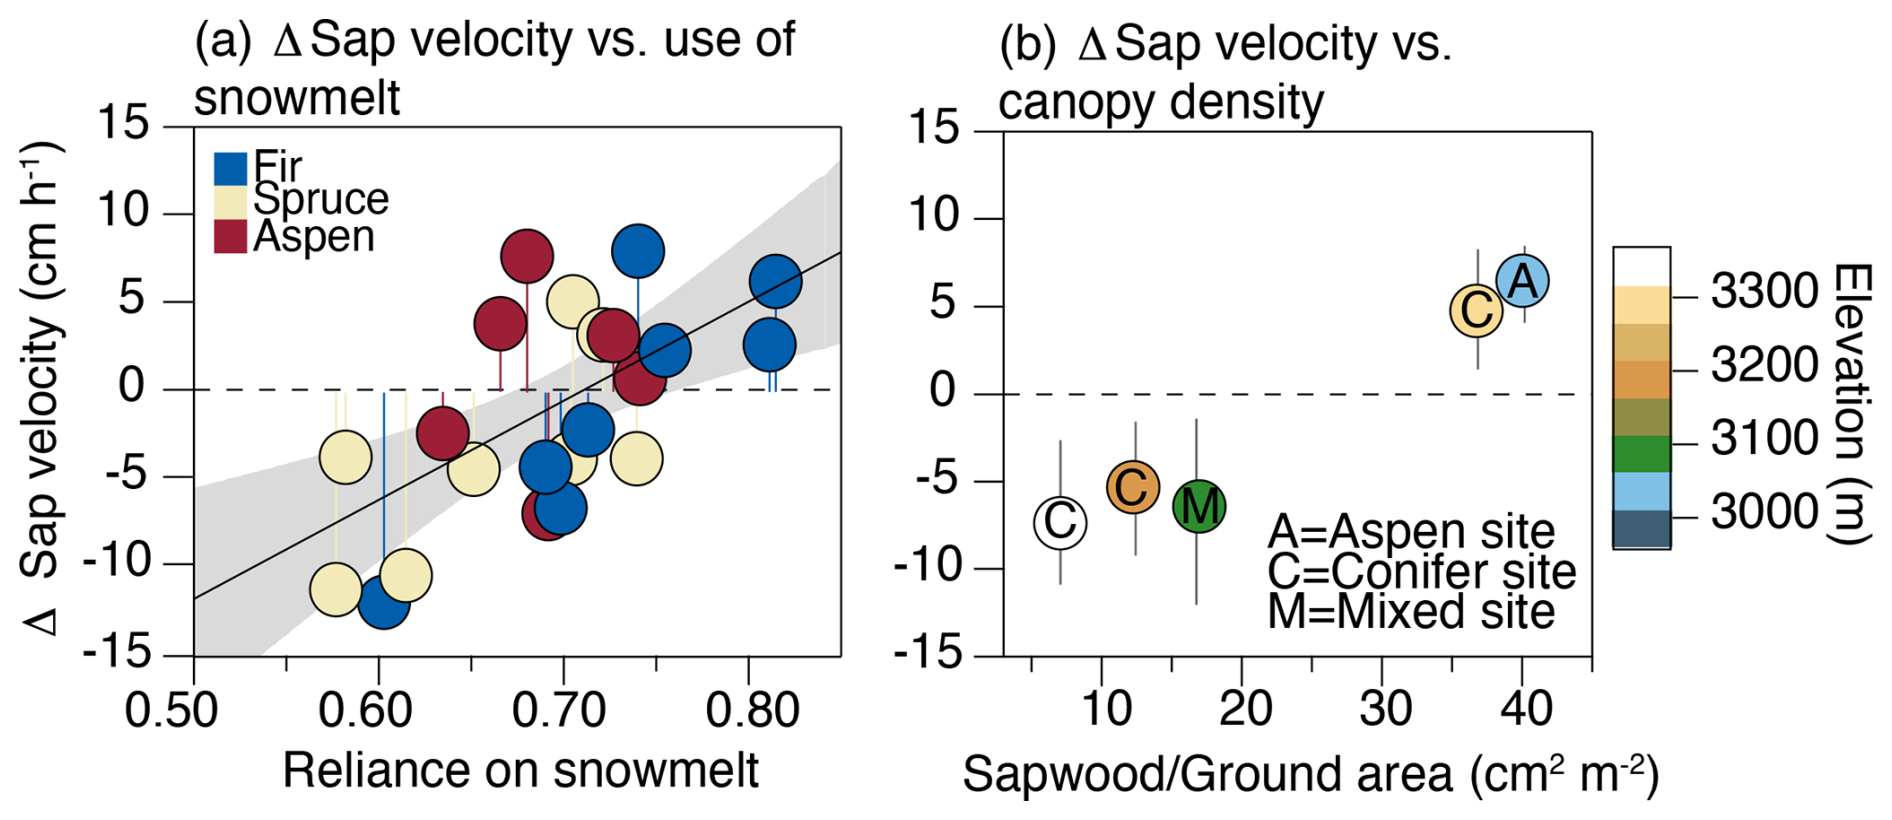
Figure 6Panel (a) shows the relationship between differences in the averaged sap velocity between 2019 and 2021–2022 vs. the weighted average reliance of use of snowmelt for each tree. A positive relationship implies that those trees that rely more heavily on snow are those that were more active during the large spring snowpack year of 2019. Panel (b) presents the differences in sap velocity between 2019 and 2021–2022 organized by the stand density that each tree fell within (Fig. 1). The error bars capture the range of Δ sap velocity for all trees within the stand. Note that only five stands are present in this figure, as Site 6 did not have sufficient continuous data to generate a difference estimate between years.
Because this was not a controlled thinning experiment with incremental changes in density across stands of a single species, it is difficult to interpret the significance and causal nature of this pattern. We can, however, show (via a simple probabilistic argument) that the likelihood that all of the trees in the dense stands behaved similarly and in opposition to the behavior of those at the more open sites was not random. There was a total of 26 trees instrumented across these stands that had continuous sap velocity measurements during 2019, 2021 and 2022, and 10 of these trees showed a positive response in 2019. All 6 of the trees within the two dense stands were within the population of 10 trees that showed an increase in sap velocity during 2019. The probability that all six trees in the two dense stands would show the same response just through random sorting is 0.002 based on a Monte Carlo simulation (n= 10 000). Although this result does not causally link stand density to the way that the sap velocity responds to spring snowpack, it shows that there was nonrandom organization, such that the different response between sites 1 and 4 vs. sites 2, 3 and 5 captured a distinct ecohydrological behavior between these sites. As discussed above, differences in the transpiration rate and seasonal water sources between stands of contrasting densities have been established in previous studies (e.g., Tague et al., 2019); thus, this is not an unusual result.
Although we have focused on sap velocity as a metric to understand tree responses to precipitation seasonality, we also generated stand-level transpiration estimates by upscaling these measurements using lidar tree crown data, as described in Sect. 2.4. The peak estimated transpiration rates from these scaling estimates were comparable to previously published estimates of evapotranspiration from a flux tower in a riparian zone at the base of this hillslope (Ryken, 2021; Ryken et al., 2022). The average transpiration rates across sites were almost linearly related to sapwood area – as expected and as noted in previous studies (Berry et al., 2018) (Fig. S4). This translates to a factor of 3–4 difference in transpiration rates between the open and closed stands. Sites 1 and 4 showed an approximate 5 cm h−1 increase in sap velocity in 2019, whereas sites 2, 3 and 5 showed a decrease of about the same magnitude. This would suggest a response between the dense and open stands in 2019 that was symmetrical but inverse. However, after scaling this response to stand-level transpiration, it translates to an approximate 4.3 kg H2O m−2 h−1 transpiration increase in the dense stands vs. an approximate 0.5 kg H2O m−2 h−1 decrease in the open stands. This indicates that, as they have a higher peak capacity to move water, the denser stands' potential variance is much larger, even if the individual tree-level variances are of similar magnitudes across stands.
While emphasis thus far has primarily been on drivers of interannual sap velocity variability, we also used the merged isotopic and transpiration data to shed light on whether there were optimal seasonal water utilization patterns over the period of this experiment. To assess this, we compared peak transpiration rates for individual trees – as a proxy for the hydraulic capacity of a tree – against the water source used by the tree (Fig. 7). From this analysis, we see that the use of a diverse mixture of water sources characterized by neither a strongly snow- nor rain-dominated mixture led to the highest peak transpiration rates (Fig. 7). Those trees with a particularly high reliance on either snow or summer rain use (i.e., a more narrow range of water sources) tended to have lower peak transpiration rates than those trees with mixed water sources, albeit with an approximate 70 % preference for snow. These patterns can be mapped onto the hillslope context, as portrayed by the topographic position index (TPI), to show that sites with low–moderate TPI values (low slope and convergence zones) exhibited a more diverse mixture of water sources and a higher individual transpiration capacity than those sites with higher TPIs (i.e., in hilltop areas). The relationship between the TPI and changes in the dominant water sources used by trees was also observed on a Douglas-fir-dominated hillslope in the northern Rocky Mountains (Hoylman et al., 2018).
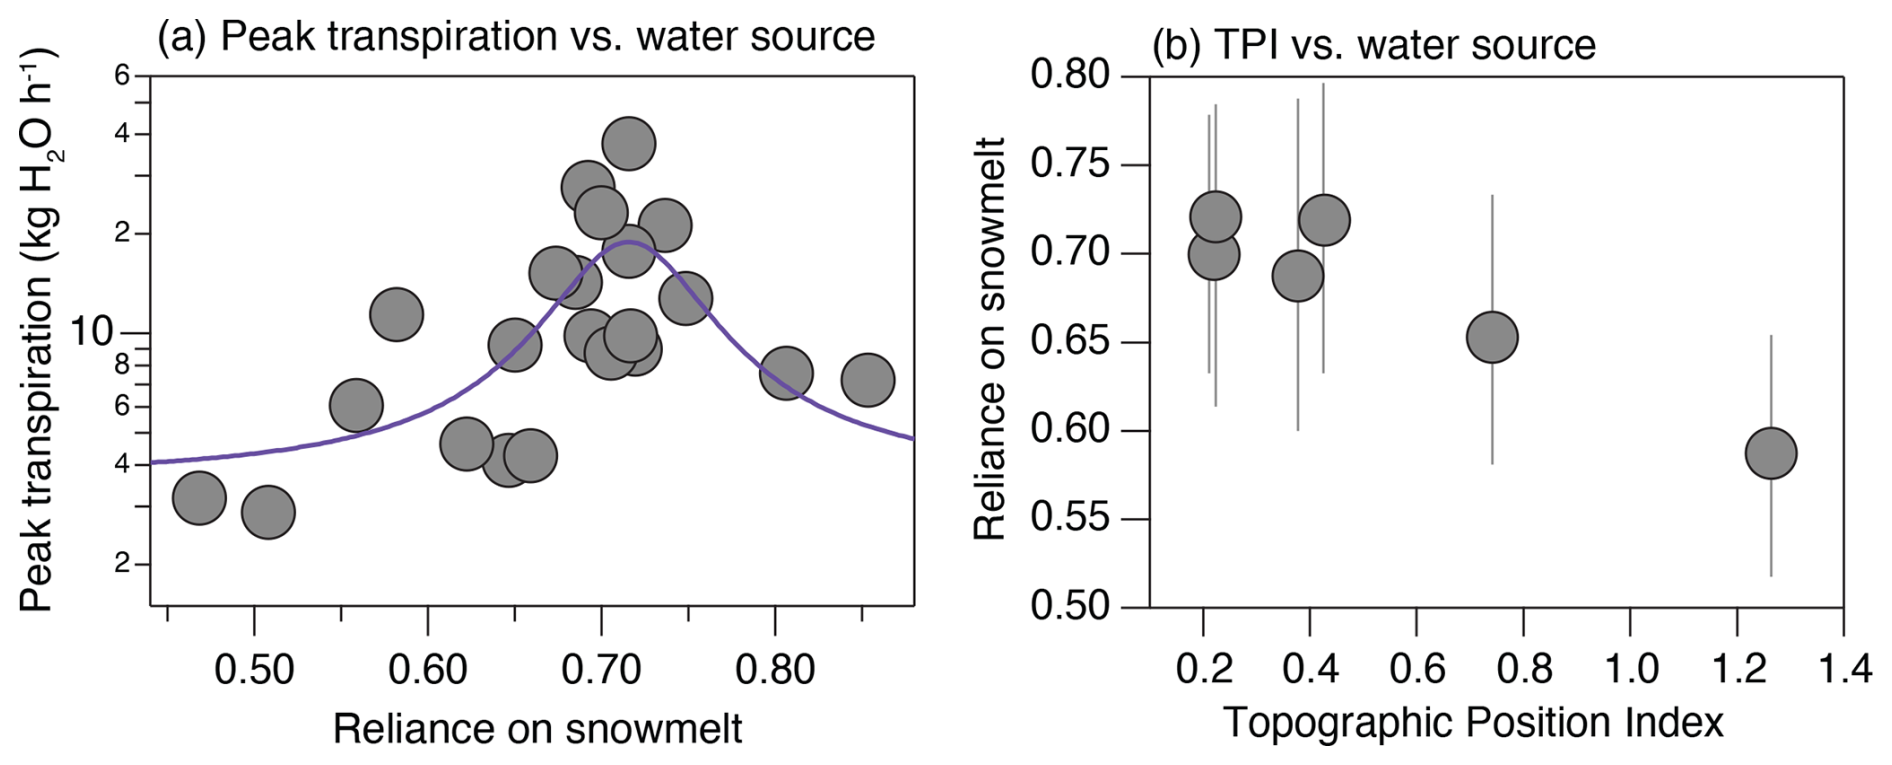
Figure 7Panel (a) shows the relationship between peak transpiration reached through the experimental period and the average snowmelt reliance of the tree. Note that the units here are kilograms of water per hour (kg H2O h−1), derived by multiplying sap velocity by sapwood area. A third-order polynomial fit was added to the figure to highlight the structure and location of the optimum value. Panel (b) presents the relationship between snowmelt reliance and the topographic position index (TPI) of each site, with the range of snowmelt reliance captured by the error bars. This figure has six sites, whereas Fig. 6 only has five; this is due to the fact that, while we did not have sufficient data from Site 6 to assess differences between years, we did have data to estimate peak transpiration.
An extensive collection of literature based primarily on isotopic data and modeling outlines the importance of snowmelt as a water source to support the transpiration demands of common tree species across the subalpine forests of the western US. As the spring snowpack declines and growing season evaporative demands increase, the extent to which these changes will limit forest productivity, influence downstream water subsidies and increase susceptibility to disturbance remains unclear. Here, we utilized a distributed network of sap velocity sensors and twig water isotopes to generate quantitative information on the magnitude and sources of water use at the species- and stand-scale for a hillslope in an extensively studied watershed in the Upper Colorado River basin. To the first order, the sap velocity data mirrored results from a similar study by Pataki et al. (2000) done in this region over 2 decades earlier. Notably, aspens had significantly higher instantaneous sap velocity rates and were more responsive to small summer rain inputs than the subalpine fir or Engelmann spruce trees. The aspens were able to sustain high levels of activity through the summer months, even during a growing season like 2019 that experienced a sustained fore-summer drought period and weak monsoon (Anderegg et al., 2013; Sloat et al., 2015). On the other hand, during 2019, many of the individual conifers began to show significant declines in water use by early July and sustained only minimal flow rates by August, even after small rainfall inputs. These differences reflect the higher threshold for embolism and reduced rainfall interception by aspens. We also document measurable differences in the seasonality and diurnal cycles between subalpine fir and Engelmann spruce: the latter were more active later in the season and had reduced sap velocities during the morning and evenings. This was consistent with some previous work documenting a higher sensitivity to the vapor pressure deficit and a lower sensitivity to soil moisture for Engelmann spruce relative to other common coniferous species (Oogathoo et al., 2020; Pataki et al., 2000). However, these differences are small relative to those between either of the conifer species and aspens.

Figure 8Panel (a) shows seasonal trends in snow depth (lines, left axis) and SWE (dots, right axis) derived from continuous snow depth sensors and periodic snow pit measurements for adjacent open and forested sites, as indicted on the map in Fig. 1. The multiple lines per site capture data from 2019, 2020 and 2021. These data were published by Bonner et al. (2022). Panel (b) presents the average difference in snow depth and SWE between the forested and open sites for 2019–2021. The results indicate that, while the forested site had generally lower snow during the winter starting from day of the year 120 until day 160, there was a persistently larger snowpack.
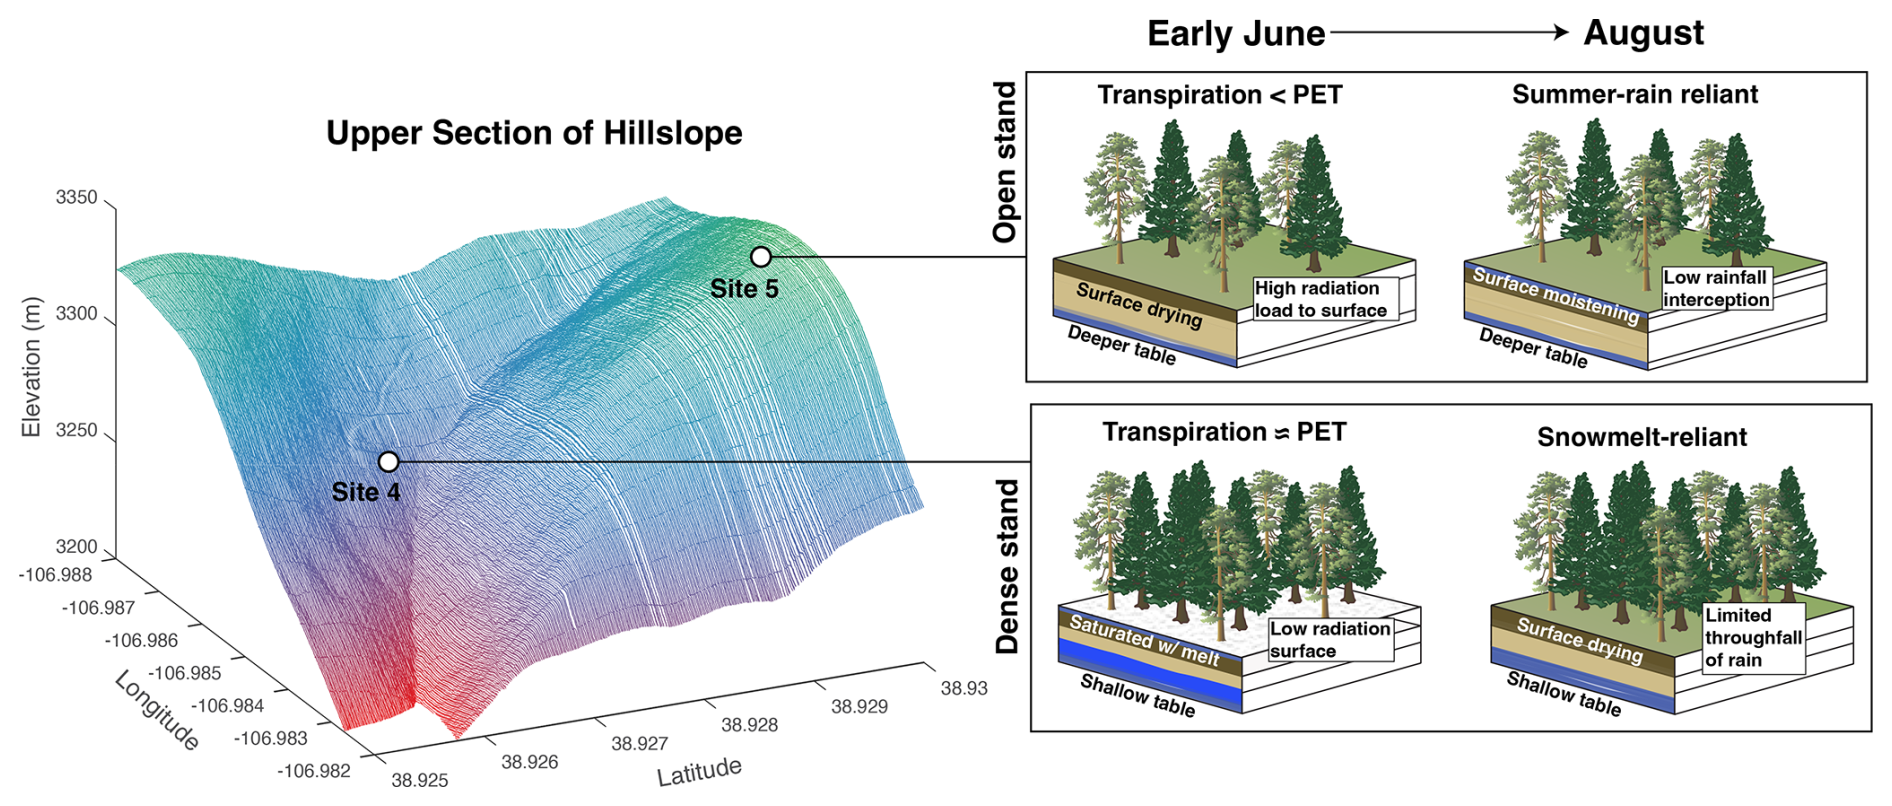
Figure 9Schematic view showing the way that the hillslope position and canopy structure can influence seasonal water source access and stand density.
In our experimental design, we distributed the isotopic sampling and sap velocity sensors across conifer, aspen and mixed aspen–conifer stands that had both sapwood-to-ground-area densities that were typical of the hillslope and stands with densities near the maximum of the hillslope (Fig. S5). We observed differences in transpiration across these stands that showed an almost linear relationship with density and varied with respect to their transpiration rates across a factor of 5 (∼ 2.0 vs. ∼ 12.0 kg H2O m−2 h−1) (Fig. S4). The linear response of transpiration to stand density has been noted in other sap velocity studies from a variety of forests, including similar subalpine systems (Tor-Ngern et al., 2017). In an earlier study that utilized one season of data from this same sap velocity network, Ryken (2021) found that two of the densest sites – corresponding to sites 1 and 4 in Fig. 1 – displayed transpiration rates that were comparable to and/or exceeded June and July latent heat flux rates from an eddy-covariance tower in the riparian zone at the foot of this hillslope (Ryken et al., 2022). In contrast, the open stands always had transpiration values well below the observed evapotranspiration (ET) rates. This result suggests that, during June–July, the densest sites in the network were operating in a state in which transpiration accounted for virtually all of the ET and was similar to estimated potential ET (PET). Thus, transpiration was fully energy-limited, at least during the early periods of the summer prior to the dry-down of soil moisture in late July (Fig. 9). These transpiration rates likely reflect a long-term acclimation at a few localized areas of the hillslope where persistently higher amounts of soil moisture or the presence of locally shallow groundwater supported an optimum level of sapwood area. Unlike results from some previous studies, such as Bréda et al. (1995), we did not see lower rates of sap velocity from individual trees in the dense stands relative to the open stands, indicating that, even with the higher competition for water, there was virtually no competitive limitation on water for weeks after snow had completely melted out. The dense sites also displayed a larger range (by an order of magnitude) in interannual transpiration variability, indicating that these uncommon areas of the hillslope are likely important drivers of temporal variations in how much snowmelt is routed to transpiration (Faramarzi et al., 2009).
To develop a more mechanistic perspective on how species- and stand-level sap velocity values are related to access of specific water sources, we utilized the results from the stable isotopic mixing model. One of the most conspicuous results that emerged from the isotopic data is the appearance of partitioning between co-located aspens and conifers during late-July and August (Fig. 5a). There was a measurably higher reliance on summer rain by aspens relative to conifers as the growing season progressed, and this was apparent in multiple years and multiple stands, confirming the results presented in earlier studies from other sites in the region (Anderegg et al., 2013). The reason for the species-level partitioning can be explained by multiple co-existing processes. Conifers have a 3–4 times higher leaf area per basal area than aspens (Pataki et al., 2000), which results in up to 40 % higher interception by conifers (Thomas, 2016). Soil moisture profiles from this hillslope and a nearby site in the watershed, as reported by Carbone et al. (2023) (Fig. S6), confirm that soils at 5 and 15 cm depths were often nonresponsive to small summer rain events under conifer stands. This result shows how the partitioning of water sources between species does not inherently require any explanation relating to belowground competition for a common water pool; rather, it results from differences in aboveground traits relating to leaf area and interception. However, we also cannot rule out differences in rooting depths between species as a driver of differences in water use. LaMalfa and Ryle (2008) also noted differences in the permeability of soils beneath conifers and aspens which could further increase how much of the summer rainfall infiltrates below aspen canopies. The combination of lower interception, increased soil infiltration and a higher threshold for embolism all collectively increase the ability of aspens to rely on summer rain inputs. However, an easily overlooked aspect of the differential water sources between conifers and aspens is that aspens regularly exhibit sap velocity rates that are twice that of conifers (Fig. 2) while also exhibiting a 20 % higher relative reliance on summer rain (Fig. 5a); this suggests the conifers and aspens are transpiring similar amounts of snowmelt water but that aspens are also mixing summer rain into the transpiration stream. Thus, all of the species exhibited a similar reliance on one water pool (snowmelt water), but aspens were also able to take advantage of a second pool associated with periodic summer rains. As illustrated in Fig. 7, the trees that utilized a mixture of summer and winter precipitation (primarily aspens) yielded the highest rates of instantaneous transpiration.
The spatial patterns and species dynamics described above illustrate properties of species-level water use on this hillslope, but the interannual changes are needed to understand the sensitivity of these forest systems to variability in snow hydrology. The interannual comparisons show that snowmelt-reliant trees were more active in 2019 and that about 40 % of the differences in individual tree sap velocity rates between the contrasting 2019 and 2021–2022 growing seasons can be explained by the seasonal origins of the water used by the trees. Previous studies have drawn inferences about reliance on snowmelt via relationships between satellite greenness metrics and snowpack inputs in other subalpine system (Berkelhammer et al., 2017; Trujillo et al., 2012), but we now make an explicit connection between snow utilization and interannual changes in tree activity. As described in studies such as Martin et al. (2018) and Kerhoulas et al. (2013), there are measurable differences in the reliance on seasonal water sources on a hillslope owing to factors such as topographic position, elevation and stand density. Indeed, we see evidence of distinct water use patterns and responses to the 2019 vs. 2021–2022 growing seasons between the five stands. The dense aspen and conifer stands were both more active during 2019, whereas the open stands that included both mixed and exclusively conifer stands were more active during 2021–2022. The results that we see here are, however, in contrast to both Kerhoulas et al. (2013) and Sohn et al. (2014), who noted that trees were more reliant on snow in denser (unthinned) stands. They argued that this was the consequence of increased canopy interception of snow, a decrease in shallow-rooted understory plants and the presence of shallower-rooted trees in the unthinned stands. In this work, there was a minimal understory and no evidence of taller trees in the thinner stands among the instrumented sites (Fig. 1). The absence of shallow-rooted understory plants here would likely accentuate the way in which trees in the open stands were able to benefit from the increased throughfall of summer rain, as the shallowest root profile emerges in the absence of competition (Schenk, 2008). In contrast, denser stands with higher water demands may support the development of deeper rooting profiles to support high stand-level water demands and the absence of surface soil moistening by summer rain. Furthermore, while the snowpack reached higher peak values in open areas, it persisted later into the growing season in forested stands, allowing surface soils to be consistently recharged during the early period of the growing season (Fig. 8). The relationship between SWE and canopy density is nonlinear and varies with background climate (Dickerson-Lange et al., 2021; Lundquist et al., 2013), but the results from this hillslope suggest that snowpack persistence might be one of the mechanisms that would be favorable to increasing access to snowmelt waters in dense stands (Fig. 9).
The results presented here show some notable contrasts with previous studies using controlled thinning experiments in single-species stands that found lower levels of snow reliance and more tree-level water stress in dense stands (e.g., Belmonte et al., 2022). With the design of this network, we cannot, for example, conclude that the similar response to the large spring snowpack of 2019 between the dense aspen stand (Site 1) and the dense conifer stand (Site 4) was the result of a common mechanism. The dense conifer stands may have benefited from the impact of stand density on the persistence of snowpack, whereas dense aspen stands may have been more active during 2019 because the large snowpack sustained active shallow roots longer through the early-summer drought period (Bailey et al., 2023). It is also notable that thinning experiments like those utilized in studies such as Sohn et al. (2014) or O'Donnell et al. (2021) were intentionally designed to understand how changes in aboveground properties (i.e., thinning) influence ecohydrology, with the explicit goal of understanding how management could decrease tree-level water stress. Thus, the experimental design of these studies intentionally tried to minimize differences in soil properties or groundwater depth between stands that would naturally lead to differences in canopy structure. On the other hand, the dense stands where we made measurements likely reflect topographically mediated convergence and/or the presence of deeper soils that support stand structures with a high potential for water use and persistent connections with water recharged by snowmelt. Therefore, while the dynamics that we observed here may appear to contrast with results from thinning experiments, they provide potentially complementary information on how above- and belowground controls interact to affect the sensitivity of a forest stand to changing seasonal precipitation inputs. Across the natural gradient of our sites, the above- and belowground effects may have acted to enhance the differential responses between stands, such as an instance in which access to shallow groundwater supports higher canopy density while also simultaneously leading to a snowpack that lasts longer into the growing season and reduces summer rain throughfall. We also note potentially similar dynamics to those observed here at an unmanaged stand in the Sierra Nevada, as noted by Goodwin et al. (2023), who documented an inverse relationship between the isotopic ratio of tree cellulose and stand density.
Although there are limits to the generalizable conclusions that can be drawn from this study, we use the results to pose some hypotheses about the responses of subalpine forests in the western US to changes in snowpack. In unthinned forests, the largest responses to declining snowpack will be centered on those locally dense stands that have developed in the context of a high reliance on snowmelt. The effects would likely be more pronounced in conifer stands that have a generally lower capacity to utilize summer rain inputs. While these sites have historically had higher access to soil moisture that has given rise to higher leaf areas, they are more likely to be vulnerable to dieback and thinning in the case of a low-snow future due to the combination of their locally high water demands and higher rainfall interception rates that minimize access to summer rain. In a scenario where the dense stands experience dieback, this natural thinning process could lead to the emergence of more shallow-rooted understory plants and, potentially, a deeper root system for the trees, thus maintaining a high reliance on snow but an overall reduction in transpiration due to the loss of stem and leaf area.
We recognize a number of important limitations of this work that future field and modeling experiments could address. Firstly, our analysis of interannual responses among stands does not consider legacy effects from previous years' conditions. For example, Blume-Werry et al. (2016) noted how a single season of reduced snowpack can induce stand impacts that have persistent effects for years after the event. The multiyear legacy reflects a variety of endogenous (e.g., changes in leaf area) and exogenous (e.g., persistence of deep soil moisture anomalies) processes that may vary across a stand density gradient (Peltier and Ogle, 2023). As an example of how legacy might be important in the context of this study, the large snowpack year of 2019 could have lead to a higher leaf area at the dense sites that further reduced summer rain throughfall during the following years. Furthermore, experiments by Berkelhammer et al. (2022), who utilized a land surface model with dynamic roots, showed how wet years can lead to a shallower root profile that can persist for years and may leave an ecosystem vulnerable to subsequent dry years. Secondly, the design of the sensor network was not intentionally focused on canopy structure; thus, we do not have data along a continuum between dense to open sites. Therefore, it was not possible to infer how stands that fell between the more open and closed end-members behaved, which would be needed to scale up towards an aggregated hillslope estimate of transpiration changes to snow input variability. Controlled thinning at experimental plots that include a different species composition and different initial densities would be the optimal test bed to explore the continuum of these effects. Lastly, adding measurements of tree hydraulic properties to link their responses to changes in water access will help to develop an understanding of the variance in behavior that was not driven just by changing snow inputs. In particular, we see some evidence that individual trees with access to diverse water sources can reach the highest peak transpiration rates, but the mechanisms for this relationship (e.g., root profiles or root hydraulics) were unexplored in this study. Despite these limitations, our work links key observations about forest dynamics and changing hydrology that could help guide forest management decisions in order to optimize the ecological utilization of summer rain in regions like the southwestern US that receive regular summer rain inputs. Furthermore, this work provides needed benchmarking information for future simulations of coupled ecological and hydrological processes at the watershed scale.
The data associated with this work are available at https://doi.org/10.15485/1647654 (Berkelhammer, 2023).
The supplement related to this article is available online at: https://doi.org/10.5194/hess-29-701-2025-supplement.
MB wrote the manuscript; led the analysis of data; and assisted with field deployment, design and resource acquisition. GFMP edited and wrote the manuscript and led field design and data acquisition. CS assisted with editing the manuscript and resource acquisition. FZ, WT, LH, JB, KI, AK, MC, KF, WB, MW, MSC, IB, AR, RM, DG, MR, ES and KHW all provided critical datasets for the analysis.
The contact author has declared that none of the authors has any competing interests.
Publisher’s note: Copernicus Publications remains neutral with regard to jurisdictional claims made in the text, published maps, institutional affiliations, or any other geographical representation in this paper. While Copernicus Publications makes every effort to include appropriate place names, the final responsibility lies with the authors.
The authors would like to acknowledge the supporting staff at the Rocky Mountain Biological Lab (RMBL). Max Berkelhammer and Christopher Still acknowledge support from the Department of Energy's Office of Science “Biological and Environmental Research” (BER) program (grant no. DE-SC0019210). The work of William Talavera, Angellica Kucinski and Kyle Inthabandith was supported by the US Department of Defense's National Defense Education Activity via the Educational and Research Training Collaborative at the University of Illinois Chicago (grant no. HQ-00342010037). Mariah S. Carbone acknowledges funding from the Department of Energy's Biological and Environmental Research program (grant nos. DE-SC0021139 and DE-SC0024218) and an RMBL graduate fellowship to Austin Simonpietri. Rosemary W. H. Carroll acknowledges support from the US Department of Energy's Office of Science (grant no. DE-AC02-05CH11231). This material is based upon work supported by the National Science Foundation under grant no. 1761441 to Mark Raleigh and Eric Small. This material is also based upon work undertaken as part of the Watershed Function Scientific Focus Area funded by the US Department of Energy's Office of Science BER program under grant no. DE-AC02-05CH11231.
This research has been supported by the Department of Energy's Office of Science “Biological and Environmental Research” program (grant nos. DE-SC0019210, DE-SC0021139, DE-SC0024218 and DE-AC02-05CH11231), the Department of Defense Education Activity (grant no. HQ-00342010037) and the Directorate for Geosciences (grant no. 1761441).
This paper was edited by Anke Hildebrandt and reviewed by Matthias Beyer and two anonymous referees.
Allen, C. D., Macalady, A. K., Chenchouni, H., Bachelet, D., McDowell, N., Vennetier, M., Kitzberger, T., Rigling, A., Breshears, D. D., Hogg, E. T., Gonzalez, P., Fensham, R., Zhang, Z., Castro, J., Demidova, N., Lim, J.-H., Allard, G., Running, S. W., Semerci, A., and Cobb., N.: A global overview of drought and heat-induced tree mortality reveals emerging climate change risks for forests, Forest Ecol. Manag., 259, 660–684, 2010. a
Allen, S. T., Kirchner, J. W., Braun, S., Siegwolf, R. T. W., and Goldsmith, G. R.: Seasonal origins of soil water used by trees, Hydrol. Earth Syst. Sci., 23, 1199–1210, https://doi.org/10.5194/hess-23-1199-2019, 2019. a, b
Anderegg, L. D., Anderegg, W. R., Abatzoglou, J., Hausladen, A. M., and Berry, J. A.: Drought characteristics' role in widespread aspen forest mortality across Colorado, USA, Glob. Change Biol., 19, 1526–1537, 2013. a, b, c
Anderson, L., Berkelhammer, M., and Mast, M. A.: Isotopes in north American Rocky mountain snowpack 1993–2014, Quaternary Sci. Rev., 131, 262–273, 2016. a
Arendt, C. A., Aciego, S. M., and Hetland, E. A.: An open source Bayesian Monte Carlo isotope mixing model with applications in Earth surface processes, Geochem. Geophy. Geosy., 16, 1274–1292, 2015. a
Bailey, K., Szejner, P., Strange, B., Monson, R., and Hu, J.: The influence of winter snowpack on the use of summer rains in montane pine forests across the southwest US, J. Geophys. Res.-Biogeo., 128, e2023JG007494, https://doi.org/10.1029/2023JG007494, 2023. a, b
Barbeta, A., Jones, S. P., Clavé, L., Wingate, L., Gimeno, T. E., Fréjaville, B., Wohl, S., and Ogée, J.: Unexplained hydrogen isotope offsets complicate the identification and quantification of tree water sources in a riparian forest, Hydrol. Earth Syst. Sci., 23, 2129–2146, https://doi.org/10.5194/hess-23-2129-2019, 2019. a, b
Belmonte, A., Ts. Sankey, T., Biederman, J., Bradford, J. B., and Kolb, T.: Soil moisture response to seasonal drought conditions and post-thinning forest structure, Ecohydrology, 15, e2406, https://doi.org/10.1002/eco.2406, 2022. a, b, c
Benettin, P., Volkmann, T. H. M., von Freyberg, J., Frentress, J., Penna, D., Dawson, T. E., and Kirchner, J. W.: Effects of climatic seasonality on the isotopic composition of evaporating soil waters, Hydrol. Earth Syst. Sci., 22, 2881–2890, https://doi.org/10.5194/hess-22-2881-2018, 2018. a
Berdanier, A. and Clark, J.: Tree water balance drives temperate forest responses to drought, Ecology, 99, 2506–2514, 2018. a
Berkelhammer, M.: Sapflow and xylem water isotopes from Snodgrass Mountain, East River Watershed, Colorado USA. Space and time dynamics of transpiration in the East River watershed: biotic and abiotic controls, ESS-DIVE repository [data set], https://doi.org/10.15485/1647654, 2023. a
Berkelhammer, M., Stefanescu, I., Joiner, J., and Anderson, L.: High sensitivity of gross primary production in the Rocky Mountains to summer rain, Geophys. Res. Lett., 44, 3643–3652, 2017. a, b
Berkelhammer, M., Still, C., Ritter, F., Winnick, M., Anderson, L., Carroll, R., Carbone, M., and Williams, K.: Persistence and plasticity in conifer water-use strategies, J. Geophys. Res.-Biogeo., 125, e2018JG004845, https://doi.org/10.1029/2018JG004845, 2020. a, b, c
Berkelhammer, M., Drewniak, B., Ahlswede, B., and Gonzalez-Meler, M. A.: Root foraging alters global patterns of ecosystem legacy from climate perturbations, J. Geophys. Res.-Biogeo., 127, e2021JG006612, https://doi.org/10.1029/2021JG006612, 2022. a
Berry, Z. C., Looker, N., Holwerda, F., Gómez Aguilar, L. R., Ortiz Colin, P., González Martínez, T., and Asbjornsen, H.: Why size matters: The interactive influences of tree diameter distribution and sap flow parameters on upscaled transpiration, Tree Physiol., 38, 263–275, 2018. a
Blume-Werry, G., Kreyling, J., Laudon, H., and Milbau, A.: Short-term climate change manipulation effects do not scale up to long-term legacies: Effects of an absent snow cover on boreal forest plants, J. Ecol., 104, 1638–1648, 2016. a
Bonner, H. M., Smyth, E., Raleigh, M. S., and Small, E. E.: A Meteorology and Snow Data Set From Adjacent Forested and Meadow Sites at Crested Butte, CO, USA, Water Resour. Res., 58, e2022WR033006, https://doi.org/10.1029/2022WR033006, 2022. a, b, c
Bréda, N., Granier, A., and Aussenac, G.: Effects of thinning on soil and tree water relations, transpiration and growth in an oak forest (Quercus petraea (Matt.) Liebl.), Tree Physiol., 15, 295–306, 1995. a, b, c
Brooks, P. D., Chorover, J., Fan, Y., Godsey, S. E., Maxwell, R. M., McNamara, J. P., and Tague, C.: Hydrological partitioning in the critical zone: Recent advances and opportunities for developing transferable understanding of water cycle dynamics, Water Resour. Res., 51, 6973–6987, 2015. a
Burgess, S. S., Adams, M. A., Turner, N. C., Beverly, C. R., Ong, C. K., Khan, A. A., and Bleby, T. M.: An improved heat pulse method to measure low and reverse rates of sap flow in woody plants, Tree Physiol., 21, 589–598, 2001. a
Carbone, M. S., Richardson, A. D., Berkelhammer, M., Boot, C. M., Simonpietri, A., and Still, C. J.: Interannual precipitation controls on soil CO2 fluxes in high elevation conifer and aspen forests, Environ. Res. Lett., 18, 124009, https://doi.org/10.1088/1748-9326/ad07b5, 2023. a, b
Carrer, M., Dibona, R., Prendin, A. L., and Brunetti, M.: Recent waning snowpack in the Alps is unprecedented in the last six centuries, Nat. Clim. Change, 13, 155–160, https://doi.org/10.1038/s41558-022-01575-3, 2023. a
Carroll, R. W., Gochis, D., and Williams, K. H.: Efficiency of the summer monsoon in generating streamflow within a snow-dominated headwater basin of the Colorado River, Geophys. Res. Lett., 47, e2020GL090856, https://doi.org/10.1029/2020GL090856, 2020. a
Carroll, R. W., Deems, J., Maxwell, R., Sprenger, M., Brown, W., Newman, A., Beutler, C., Bill, M., Hubbard, S. S., and Williams, K. H.: Variability in observed stable water isotopes in snowpack across a mountainous watershed in Colorado, Hydrol. Process., 36, e14653, https://doi.org/10.1002/hyp.14653, 2022a. a, b
Carroll, R. W., Deems, J., Sprenger, M., Maxwell, R., Brown, W., Newman, A., Beutler, C., and Williams, K. H.: Modeling snow dynamics and stable water isotopes across mountain landscapes, Geophys. Res. Lett., 49, e2022GL098780, https://doi.org/10.1029/2022GL098780, 2022b. a
Chen, Y., Helliker, B. R., Tang, X., Li, F., Zhou, Y., and Song, X.: Stem water cryogenic extraction biases estimation in deuterium isotope composition of plant source water, P. Natl. Acad. Sci. USA, 117, 33345–33350, 2020. a
Cooper, A. E., Kirchner, J. W., Wolf, S., Lombardozzi, D. L., Sullivan, B. W., Tyler, S. W., and Harpold, A. A.: Snowmelt causes different limitations on transpiration in a Sierra Nevada conifer forest, Agr. Forest Meteorol., 291, 108089, https://doi.org/10.1016/j.agrformet.2020.108089, 2020. a, b, c
Coulthard, B. L., Anchukaitis, K. J., Pederson, G. T., Cook, E., Littell, J., and Smith, D. J.: Snowpack signals in North American tree rings, Environ. Res. Lett., 16, 034037, https://doi.org/10.1088/1748-9326/abd5de, 2021. a
Diao, H., Schuler, P., Goldsmith, G. R., Siegwolf, R. T. W., Saurer, M., and Lehmann, M. M.: Technical note: On uncertainties in plant water isotopic composition following extraction by cryogenic vacuum distillation, Hydrol. Earth Syst. Sci., 26, 5835–5847, https://doi.org/10.5194/hess-26-5835-2022, 2022. a, b
Dickerson-Lange, S. E., Vano, J. A., Gersonde, R., and Lundquist, J. D.: Ranking forest effects on snow storage: A decision tool for forest management, Water Resour. Res., 57, e2020WR027926, https://doi.org/10.1029/2020WR027926, 2021. a
Fabiani, G., Schoppach, R., Penna, D., and Klaus, J.: Transpiration patterns and water use strategies of beech and oak trees along a hillslope, Ecohydrology, 15, e2382, https://doi.org/10.1002/eco.2382, 2022. a
Faramarzi, M., Abbaspour, K. C., Schulin, R., and Yang, H.: Modelling blue and green water resources availability in Iran, Hydrol. Process., 23, 486–501, 2009. a
Faybishenko, B., Arora, B., Dwivedi, D., and Brodie, E.: Meteorological and hydrological parameters for 17 locations of meteorological stations of the East River Watershed, Watershed Function SFA, ESS-DIVE repository [data set], https://doi.org/10.15485/1989228, 2023. a, b
Fernandes, T. J., Del Campo, A. D., Herrera, R., and Molina, A. J.: Simultaneous assessment, through sap flow and stable isotopes, of water use efficiency (WUE) in thinned pines shows improvement in growth, tree-climate sensitivity and WUE, but not in WUEi, Forest Ecol. Manag., 361, 298–308, 2016. a
Fuchs, S., Leuschner, C., Link, R., Coners, H., and Schuldt, B.: Calibration and comparison of thermal dissipation, heat ratio and heat field deformation sap flow probes for diffuse-porous trees, Agr. Forest Meteorol., 244, 151–161, 2017. a
Goodwin, M. J., Kerhoulas, L. P., Zald, H. S., North, M. P., and Hurteau, M. D.: Conifer water-use patterns across temporal and topographic gradients in the southern Sierra Nevada, Tree Physiol., 43, 210–220, 2023. a
Goulden, T., Hass, B., Brodie, E., Chadwick, K. D., Falco, N., Maher, K., Wainwright, H., and Williams, K.: NEON AOP Survey of Upper East River CO Watersheds: LAZ Files, LiDAR Surface Elevation, Terrain Elevation, and Canopy Height Rasters. Watershed Function SFA, ESS-DIVE repository [data set], https://doi.org/10.15485/1617203, 2020. a, b, c
Graup, L., Tague, C., Harpold, A., and Krogh, S.: Subsurface Lateral Flows Buffer Riparian Water Stress Against Snow Drought, J. Geophys. Res.-Biogeo., 127, e2022JG006980, https://doi.org/10.1029/2022JG006980, 2022. a
Grossiord, C., Sevanto, S., Dawson, T. E., Adams, H. D., Collins, A. D., Dickman, L. T., Newman, B. D., Stockton, E. A., and McDowell, N. G.: Warming combined with more extreme precipitation regimes modifies the water sources used by trees, New Phytol., 213, 584–596, 2017. a
Gutzler, D. S. and Preston, J. W.: Evidence for a relationship between spring snow cover in North America and summer rainfall in New Mexico, Geophys. Res. Lett., 24, 2207–2210, 1997. a
Harpold, A. A. and Molotch, N. P.: Sensitivity of soil water availability to changing snowmelt timing in the western US, Geophys. Res. Lett., 42, 8011–8020, 2015. a
Holden, Z. A., Swanson, A., Luce, C. H., Jolly, W. M., Maneta, M., Oyler, J. W., Warren, D. A., Parsons, R., and Affleck, D.: Decreasing fire season precipitation increased recent western US forest wildfire activity, P. Natl. Acad. Sci. USA, 115, E8349–E8357, 2018. a
Hoylman, Z. H., Jencso, K. G., Hu, J., Martin, J. T., Holden, Z. A., Seielstad, C. A., and Rowell, E. M.: Hillslope topography mediates spatial patterns of ecosystem sensitivity to climate, J. Geophys. Res.-Biogeo., 123, 353–371, 2018. a, b
Hulshof, C. M., Swenson, N. G., and Weiser, M. D.: Tree height–diameter allometry across the United States, Ecol. Evol., 5, 1193–1204, 2015. a
Kelsey, K. C., Pedersen, S. H., Leffler, A. J., Sexton, J. O., Feng, M., and Welker, J. M.: Winter snow and spring temperature have differential effects on vegetation phenology and productivity across Arctic plant communities, Glob. Change Biol., 27, 1572–1586, 2021. a
Kerhoulas, L. P., Kolb, T. E., and Koch, G. W.: Tree size, stand density, and the source of water used across seasons by ponderosa pine in northern Arizona, Forest Ecol. Manag., 289, 425–433, 2013. a, b, c, d, e, f
Knighton, J., Kuppel, S., Smith, A., Soulsby, C., Sprenger, M., and Tetzlaff, D.: Using isotopes to incorporate tree water storage and mixing dynamics into a distributed ecohydrologic modelling framework, Ecohydrology, 13, e2201, https://doi.org/10.1002/eco.2201, 2020. a
Knowles, J. F., Bjarke, N. R., Badger, A. M., Berkelhammer, M., Biederman, J. A., Blanken, P. D., Bretfeld, M., Burns, S. P., Ewers, B. E., Frank, J. M., Hicke, J. A., Lestak, L., Livneh, B., Reed, D. E., Scott, R. L., and Molotch, N. P.: Bark beetle impacts on forest evapotranspiration and its partitioning, Sci. Total Environ., 880, 163260, https://doi.org/10.1016/j.scitotenv.2023.163260, 2023. a
LaMalfa, E. M. and Ryle, R.: Differential snowpack accumulation and water dynamics in aspen and conifer communities: Implications for water yield and ecosystem function, Ecosystems, 11, 569–581, 2008. a, b, c
Love, D., Venturas, M., Sperry, J., Brooks, P., Pettit, J. L., Wang, Y., Anderegg, W., Tai, X., and Mackay, D.: Dependence of aspen stands on a subsurface water subsidy: Implications for climate change impacts, Water Resour. Res., 55, 1833–1848, 2019. a
Lundquist, J. D., Dickerson-Lange, S. E., Lutz, J. A., and Cristea, N. C.: Lower forest density enhances snow retention in regions with warmer winters: A global framework developed from plot-scale observations and modeling, Water Resour. Res., 49, 6356–6370, 2013. a
Marshall, D.: Measurement of sap flow in conifers by heat transport, Plant Physiol., 33, 385, https://doi.org/10.1104/pp.33.6.385, 1958. a
Martin, J., Looker, N., Hoylman, Z., Jencso, K., and Hu, J.: Differential use of winter precipitation by upper and lower elevation Douglas fir in the Northern Rockies, Glob. Change Biol., 24, 5607–5621, 2018. a, b, c, d, e
Mazza, G., Amorini, E., Cutini, A., and Manetti, M. C.: The influence of thinning on rainfall interception by Pinus pinea L. in Mediterranean coastal stands (Castel Fusano–Rome), Ann. Forest Sci., 68, 1323–1332, 2011. a
Metzen, D., Sheridan, G. J., Benyon, R. G., Bolstad, P. V., Griebel, A., and Lane, P. N.: Spatio-temporal transpiration patterns reflect vegetation structure in complex upland terrain, Sci. Total Environ., 694, 133551, https://doi.org/10.1016/j.scitotenv.2019.07.357, 2019. a
Mitra, B., Papuga, S. A., Alexander, M. R., Swetnam, T. L., and Abramson, N.: Allometric relationships between primary size measures and sapwood area for six common tree species in snow-dependent ecosystems in the Southwest United States, J. Forestry Res., 31, 2171–2180, 2020. a
Molotch, N. P., Brooks, P. D., Burns, S. P., Litvak, M., Monson, R. K., McConnell, J. R., and Musselman, K.: Ecohydrological controls on snowmelt partitioning in mixed-conifer sub-alpine forests, Ecohydrology: Ecosystems, Land and Water Process Interactions, Ecohydrogeomorphology, 2, 129–142, 2009. a
Mote, P. W., Li, S., Lettenmaier, D. P., Xiao, M., and Engel, R.: Dramatic declines in snowpack in the western US, Npj Climate and Atmospheric Science, 1, 2, https://doi.org/10.1038/s41612-018-0012-1, 2018. a
O'Donnell, F. C., Donager, J., Sankey, T., Masek Lopez, S., and Springer, A. E.: Vegetation structure controls on snow and soil moisture in restored ponderosa pine forests, Hydrol. Process., 35, e14432, https://doi.org/10.1002/hyp.14432, 2021. a, b, c, d
Oogathoo, S., Houle, D., Duchesne, L., and Kneeshaw, D.: Vapour pressure deficit and solar radiation are the major drivers of transpiration of balsam fir and black spruce tree species in humid boreal regions, even during a short-term drought, Agr. Forest Meteorol., 291, 108063, https://doi.org/10.1016/j.agrformet.2020.108063, 2020. a
Parkan, M. and Tuia, D.: Estimating uncertainty of point-cloud based single-tree segmentation with ensemble based filtering, Remote Sensing, 10, 335, https://doi.org/10.3390/rs10020335, 2018. a
Pascale, S., Boos, W. R., Bordoni, S., Delworth, T. L., Kapnick, S. B., Murakami, H., Vecchi, G. A., and Zhang, W.: Weakening of the North American monsoon with global warming, Nat. Clim. Change, 7, 806–812, 2017. a
Pataki, D. E., Oren, R., and Smith, W. K.: Sap flux of co-occurring species in a western subalpine forest during seasonal soil drought, Ecology, 81, 2557–2566, 2000. a, b, c, d, e, f
Peltier, D. M. and Ogle, K.: Still recovering or just remembering? To understand drought legacies, modelling choices matter, J. Ecol., 111, 1170–1173, 2023. a
Ryken, A. C.: Constraining evapotranspiration and understanding ET drivers and limitations in a mountain headwaters system, Colorado School of Mines ProQuest Dissertations & Theses, 28412923, 2021. a, b, c
Ryken, A. C., Gochis, D., and Maxwell, R. M.: Unravelling groundwater contributions to evapotranspiration and constraining water fluxes in a high-elevation catchment, Hydrol. Process., 36, e14449, https://doi.org/10.1002/hyp.14449, 2022. a, b
Samuels-Crow, K. E., Peltier, D. M., Liu, Y., Guo, J. S., Welker, J. M., Anderegg, W. R., Koch, G. W., Schwalm, C., Litvak, M., Shaw, J. D., and Ogle, K.: The importance of monsoon precipitation for foundation tree species across the semiarid Southwestern US, Frontiers in Forests and Global Change, 6, 1116786, https://doi.org/10.3389/ffgc.2023.1116786, 2023. a, b
Schenk, H. J.: The shallowest possible water extraction profile: A null model for global root distributions, Vadose Zone J., 7, 1119–1124, 2008. a, b
Schmitt, J., Tseng, K.-C., Hughes, M., and Johnson, N. C.: Illuminating snow droughts: The future of Western United States snowpack in the SPEAR large ensemble, J. Geophys. Res.-Atmos., 129, e2023JD039754, https://doi.org/10.1029/2023JD039754, 2024. a
Seeger, S. and Weiler, M.: Temporal dynamics of tree xylem water isotopes: in situ monitoring and modeling, Biogeosciences, 18, 4603–4627, https://doi.org/10.5194/bg-18-4603-2021, 2021. a
Simonpietri, A. and Carbone, M.: Raw soil carbon dioxide, moisture, temperature and micrometeorological data in the East River Watershed, Colorado June 2021–June 2024, (DE-SC0021139), https://doi.org/10.15485/1909712, 2024. a, b
Sloat, L. L., Henderson, A. N., Lamanna, C., and Enquist, B. J.: The effect of the foresummer drought on carbon exchange in subalpine meadows, Ecosystems, 18, 533–545, 2015. a, b
Sohn, J. A., Brooks, J. R., Bauhus, J., Kohler, M., Kolb, T. E., and McDowell, N. G.: Unthinned slow-growing ponderosa pine (Pinus ponderosa) trees contain muted isotopic signals in tree rings as compared to thinned trees, Trees, 28, 1035–1051, 2014. a, b, c
Strange, B. M., Monson, R. K., Szejner, P., Ehleringer, J., and Hu, J.: The North American Monsoon buffers forests against the ongoing megadrought in the Southwestern United States, Glob. Change Biol., 29, 4354–4367, https://doi.org/10.1111/gcb.16762, 2023. a, b, c
Swanson, R. H. and Whitfield, D.: A numerical analysis of heat pulse velocity theory and practice, J. Exp. Bot., 32, 221–239, 1981. a
Tague, C. L., Moritz, M., and Hanan, E.: The changing water cycle: The eco-hydrologic impacts of forest density reduction in Mediterranean (seasonally dry) regions, Wiley Interdisciplinary Reviews: Water, 6, e1350, https://doi.org/10.1002/wat2.1350, 2019. a, b, c
Thomas, S.: Differences in rainfall interception losses for three tree species common to Colorado: Populus tremuloides, Picea engelmannii, and Pinus ponderosa, University of Colorado, Colorado Springs, ISBN 978-1-339-72600-7, 2016. a, b, c, d
Tor-Ngern, P., Oren, R., Oishi, A. C., Uebelherr, J. M., Palmroth, S., Tarvainen, L., Ottosson-Löfvenius, M., Linder, S., Domec, J.-C., and Näsholm, T.: Ecophysiological variation of transpiration of pine forests: synthesis of new and published results, Ecol. Appl., 27, 118–133, 2017. a
Trujillo, E., Molotch, N. P., Goulden, M. L., Kelly, A. E., and Bales, R. C.: Elevation-dependent influence of snow accumulation on forest greening, Nat. Geosci., 5, 705–709, 2012. a, b
Wainwright, H. M., Steefel, C., Trutner, S. D., Henderson, A. N., Nikolopoulos, E. I., Wilmer, C. F., Chadwick, K. D., Falco, N., Schaettle, K. B., Brown, J. B., Williams, H. K. H., Hubbard, S., and Enquist, B. J.: Satellite-derived foresummer drought sensitivity of plant productivity in Rocky Mountain headwater catchments: spatial heterogeneity and geological-geomorphological control, Environ. Res. Lett., 15, 084018, https://doi.org/10.1088/1748-9326/ab8fd0, 2020. a