the Creative Commons Attribution 4.0 License.
the Creative Commons Attribution 4.0 License.
 | 25 Nov 2025
Evolution of low-karstified rock-blocks and their influence on reservoir leakage: a modelling perspective
Youjun Jiao
Qingchun Yu
Xusheng Wang
Franci Gabrovšek
Hydraulic structures such as dams and reservoirs pose significant construction challenges in karst areas due to severe and costly leakage issues. In this study, we apply a numerical model to test the hypothesis that karst aquifers in water divide areas may contain intrinsically low-karstified rock-blocks (LKB), which form due to the specific evolution of unconfined aquifer with recharge distributed to the water table. We develop, test, and apply a model of flow, transport, and dissolution in a 2D fracture network with a fluctuating water table. The model's structure and boundary conditions are based on the conceptualization of the Luojiaao (China) interfluve aquifer. First, we simulate the evolution of an unconfined network, representing the interfluve, up to a stage resembling the present conditions at Luojiaao. We then analyse leakage through the evolved aquifer from a reservoir at different water levels and simulate further aquifer evolution under reservoir conditions. Our results demonstrate the formation of the LKB and highlight its role in mitigating leakage.
- Article
(13203 KB) - Full-text XML
-
Supplement
(1643 KB) - BibTeX
- EndNote


Karst areas occupy approximately 14 % of Earth's ice-free land surface. In these regions, the chemical erosion of rock by surface water and groundwater – known as karstification – produces distinctive surface and subsurface features. Karst aquifers are among the most productive freshwater resources, supplying drinking water to around 20 % of the world's population – and more than 50 % in some countries (Chen et al., 2017; Ford and Williams, 2007). These aquifers are characterized by networks of solution conduits formed within initially fractured and porous rock. The development of these conduits, a process known as speleogenesis, is complex and spans nearly the entire period during which the rock is exposed to groundwater circulation (Dreybrodt, 1996; Yuan et al., 1993).
Karst aquifers can be conceptualized as hierarchically organized conduit systems embedded within a fractured porous matrix. These conduits serve as high-transmissivity flow pathways, channelling water from points of recharge to karst springs. Karstified rocks are also widespread in young orogenic belts, where the high-relief terrain provides favourable elevation differences that facilitate the construction of hydraulic structures such as dams and reservoirs (Milanović, 2000; Yuan et al., 1993; Shen et al., 1997).
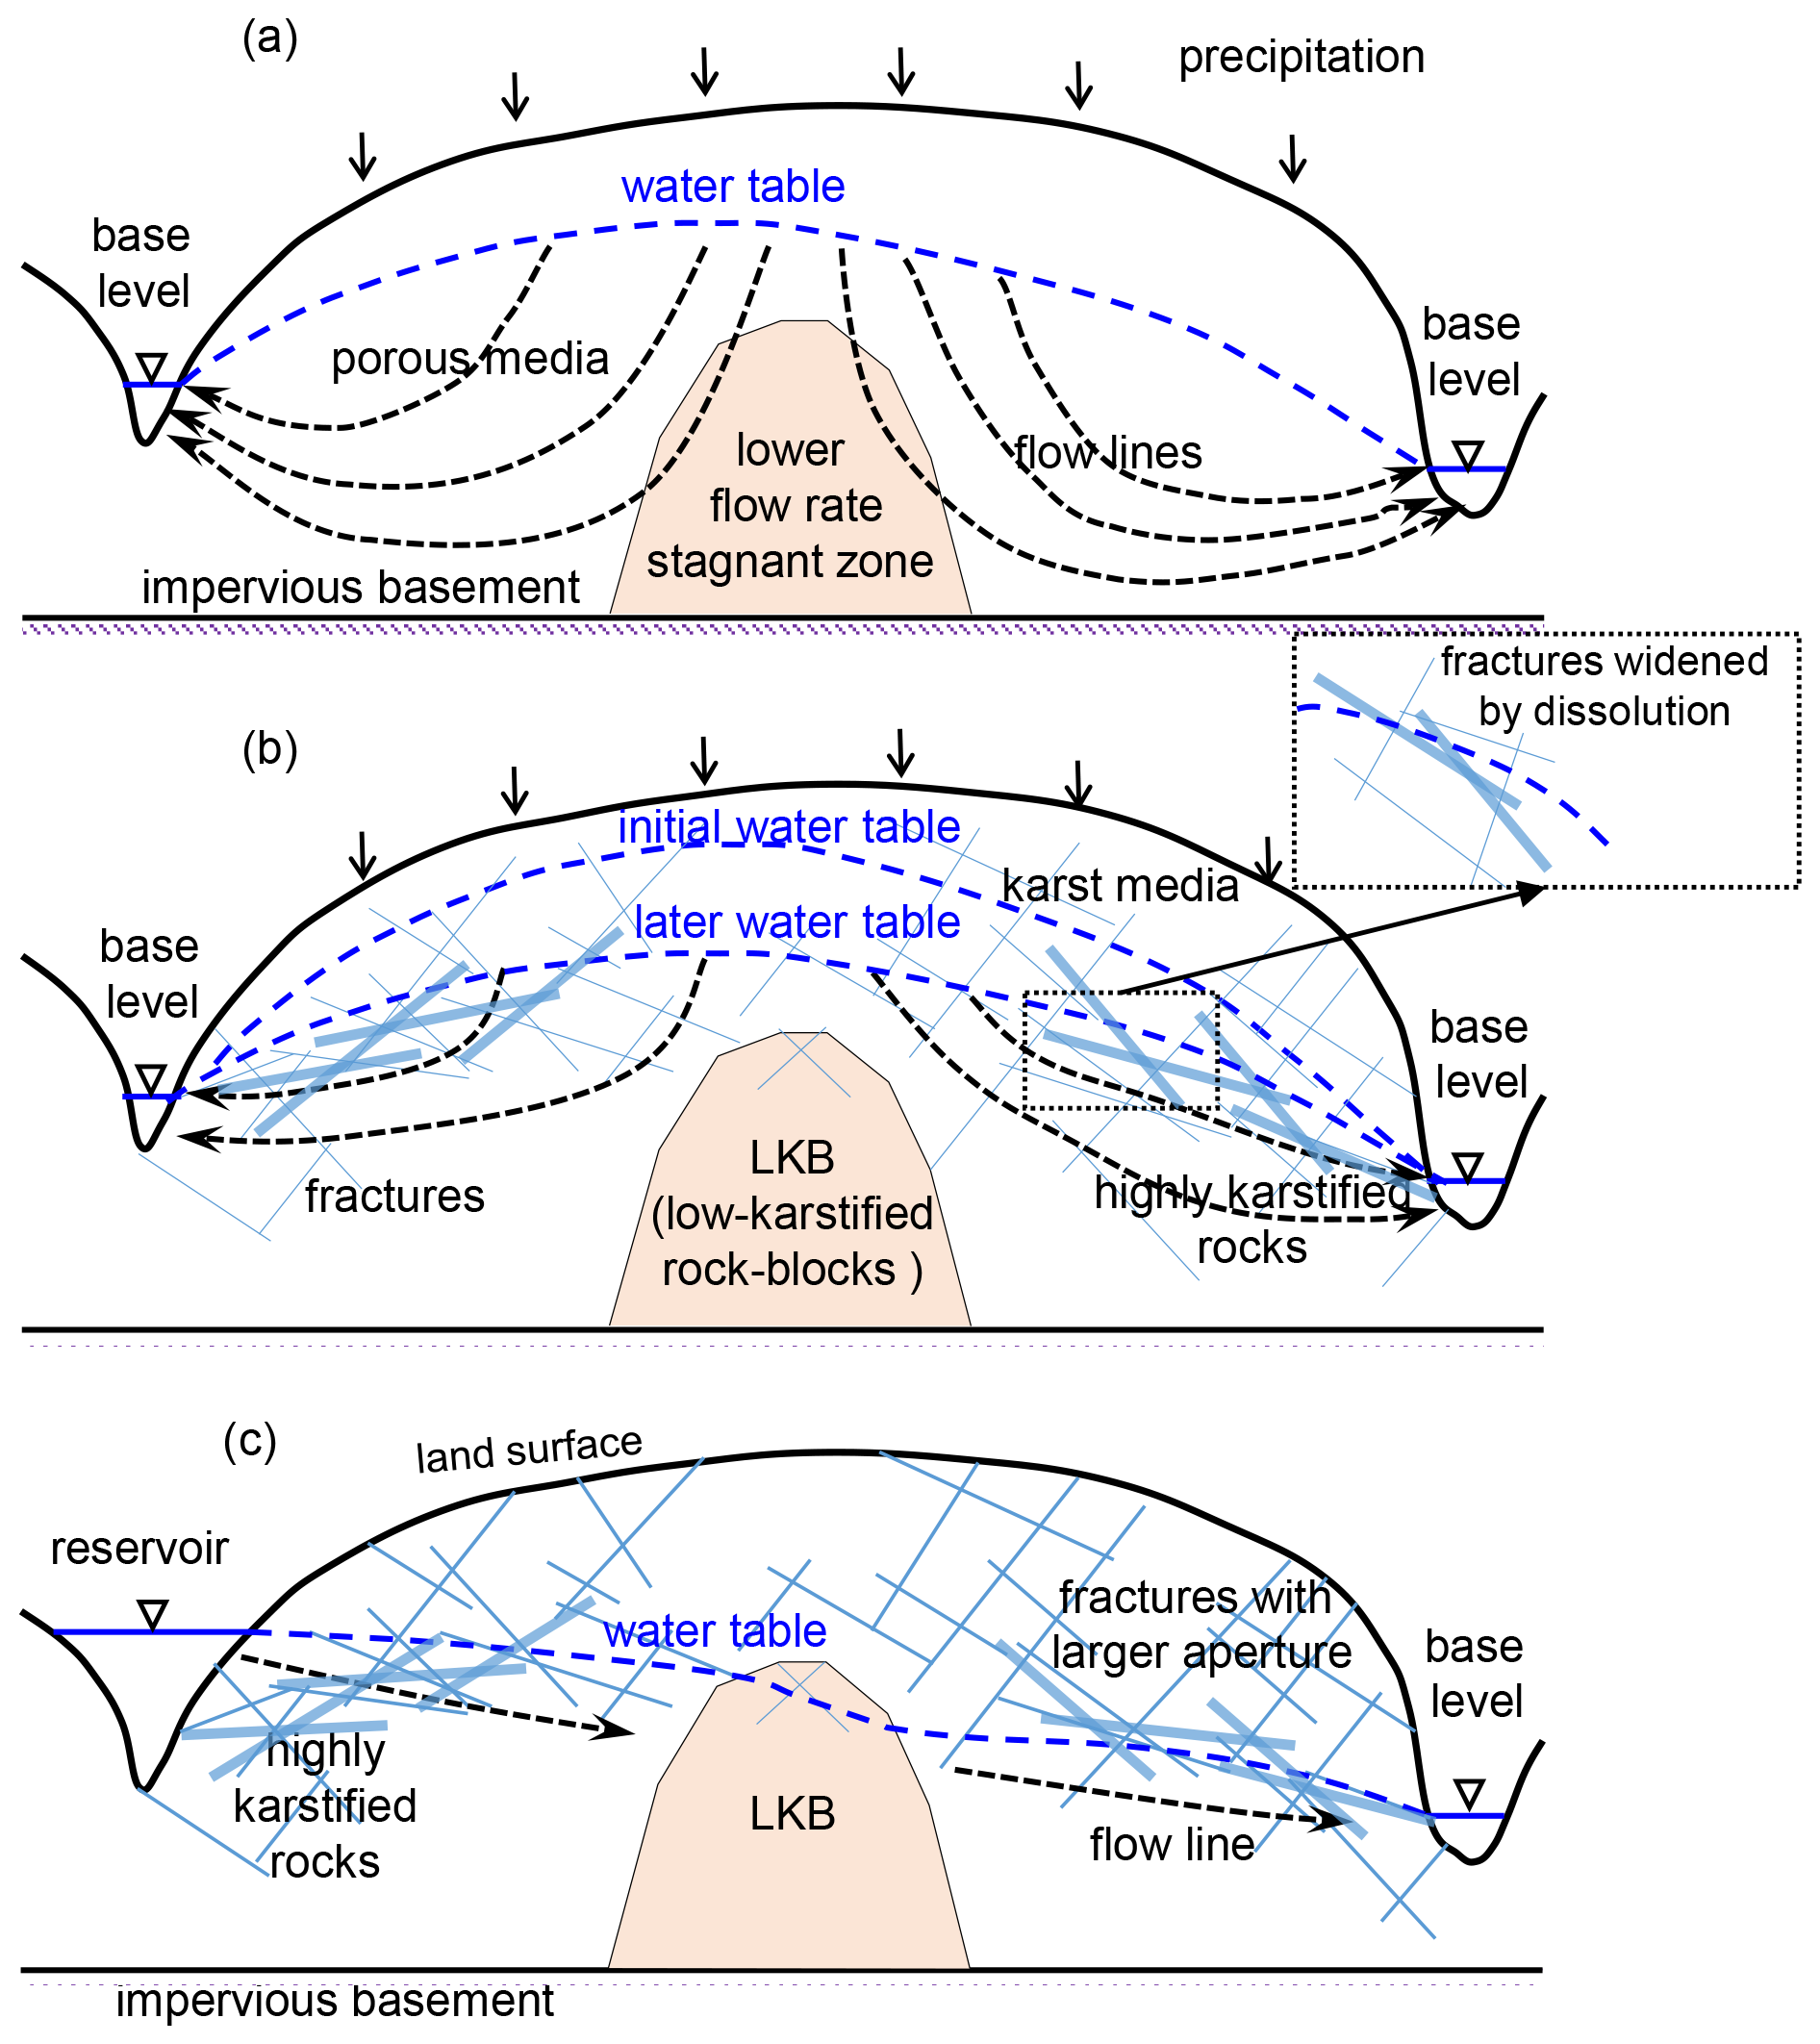
Figure 1Simplified cross section of an unconfined aquifer in water divide region. (a) Low flow zone in the water divide area. (b) Karstification increases permeability and progressively lowers the water table over time, but leaves the water divide zone less karstified (LKB). (c) In case of reservoir construction, the LKB can effectively mitigate leakage across the aquifer (Modified from Zhang et al., 2018).
However, the construction hydraulic structures in karst areas pose significant engineering challenges. The position, size, and connectivity of existing networks of solution conduits are extremely difficult to predict or detect. As a result, the extent of initial leakage from a reservoir is also hard to estimate (Milanović, 2000, 2018). Furthermore, the high hydraulic gradients induced by such structures can accelerate the formation of new conductive pathways, potentially leading to a rapid increase in leakage – sometimes reaching intolerable levels within the operational lifespan of the structure (Dreybrodt, 1996; Gabrovšek and Dreybrodt, 2001, 2010; Romanov et al., 2003, 2007).
Basic flow solutions in unconfined porous aquifers with constant recharge as shown in Fig. 1a, suggest a relatively stagnant flow zone in water divide area (Rhoades and Sinacori, 1941; Tóth, 1962; Liang et al., 2010). Studies on porous aquifers have revealed a zone of low permeability in divide areas, characterized by slower flow velocities (Kang et al., 2003; Wang et al., 2011; Jiang et al., 2012; Nogues et al., 2013).This also applies to fractured aquifer and can have important implication for karstification, where low flow zone may also result in less karstified zone, as shown in Fig. 1b. Such low-karstified rock-blocks (LKB) have been recognised in water divide regions of real karst aquifers and proven to be effective in mitigation of leakage from reservoirs in karst areas (Yuan et al., 1993; Milanović, 2000; Xu and Yan, 2004). The LKB means that there is a relatively low permeable region formed in the middle of karst aquifer during the natural karst evolution. The concept is illustrated in Fig. 1, showing a low karstified block formed in the water divide region during natural karstification (Fig. 1a and b). As depicted in Fig. 1c, this zone can effectively mitigate leakage from man-made reservoirs.
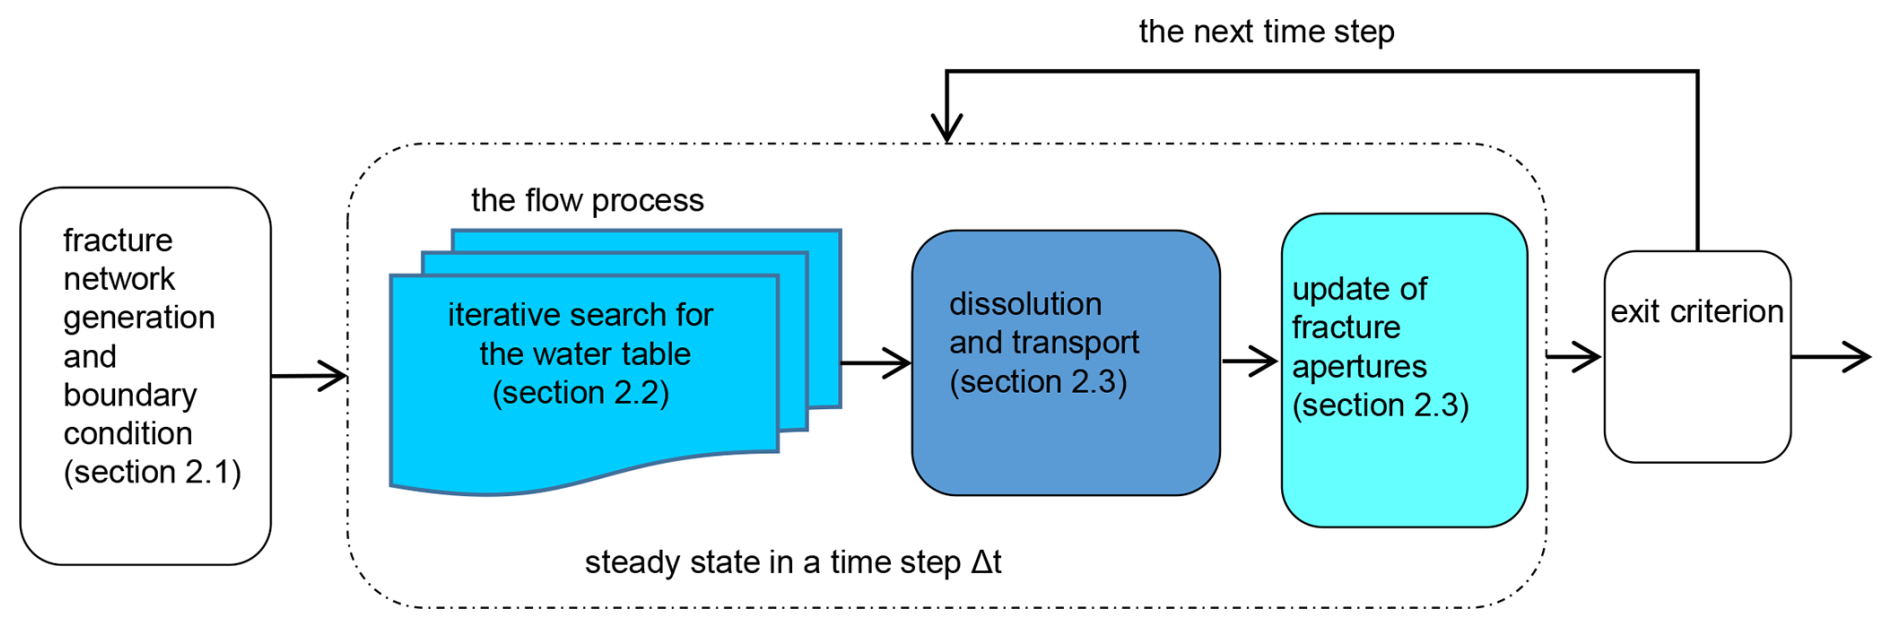
Figure 2The flowchart of the whole modelling process. At each time step, the new position of the water table is determined through an iterative process. Subsequently, the coupled flow, dissolution, and transport equations are solved at both the individual fracture scale and the fracture network scale. Based on these results, the fracture apertures are updated accordingly. The modified fracture network then serves as the basis for calculations in the following time step.
Due to the intricate nature of karst leakage, there have been limited reports on quantitative modelling studies of this phenomenon (Milanović, 2000, 2018; Smerdon et al., 2005). Modelling karst aquifer leakage is a challenging endeavour, often deemed impractical despite its importance for engineering planning. In engineering construction, predictions of reservoir leakage primarily rely on geological surveys and field experiments. For example, one study analysed extensive observational data and predicted that leakage would remain minimal (Yuan et al., 2002; Shen et al., 1997).
To model evolution of karst aquifers, it is essential to simulate flow, dissolution, and transport processes within soluble fractured media. When modelling an unconfined aquifer that includes a water divide, the problem involves a free surface, requiring the determination of the water table position at each time step of the model. Some studies have addressed this by treating discrete fractures as equivalent continuum media (Desai and Li, 1983). However, such models are unable to capture the processes of fracture dissolution and widening. Several studies have reported on modelling discrete fracture flow with free surfaces. For instance, Wang (1993) employed an initial flux method to locate the free surface within the fracture system, while Jing et al. (2001) used a discontinuous deformation analysis (DDA) method for modelling fracture flow. These intuitive methods often encounter numerical instability due to their lack of a solid mathematical foundation. The variational inequality method, which introduces the continuous Heaviside function in the finite element method, has proven effective in modelling the free surface in discrete fractures (Zheng et al., 2005; Jiang et al., 2013). But these models do not consider situations with recharge to the water table.
Several models have been used to simulate the evolution of unconfined karst aquifers with constant recharge at the water table (Clemens et al., 1999; Gabrovšek and Dreybrodt, 2001, 2010, 2021; Kaufmann, 2003; Dreybrodt et al., 2005). As demonstrated in these works, the evolution of unconfined karst aquifers is most pronounced near the water table. These models do not explicitly account for the details of flow and dissolution in the vadose zone – the region between the surface and the water table – but instead assume gravitational flow that reaches a specific level of chemical saturation with respect to calcite. Nevertheless, within the phreatic zone, water is typically least saturated with respect to calcite near the water table, and thus possesses the highest potential for dissolution (often referred as aggressivity) in this region. The numerical methods employed in these studies primarily focus on the evolution of relatively homogeneous fracture networks, rather than on the randomly distributed fractures typical of natural karst aquifers.
In this work, we introduce a numerical model to study the evolution of karst aquifer under distributed (rainfall) recharge. The algorithm is built upon an earlier study by Yu et al. (1999). We propose an intuitive method that uses iterative search for the water table and couples flow, transport and dissolution to simulate evolution of discrete fracture network. We first simulate the natural evolution of the aquifer under rainfall recharge up to selected stage of maturity. Then, the obtained aquifer is subjected to boundary conditions imposed by the construction of the reservoir. We analyse how the LKB has evolved and assess its effectiveness in mitigating leakage from the reservoir.
Models of fracture networks' karstification necessitate the integration of flow, dissolution, and transport processes within the system, while adhering to specified hydraulic and hydrochemical boundary conditions. In our research, we simulate the evolution of a stochastic fracture network under constant recharge and fixed head boundary conditions. The computational procedure is shown in flowchart of Fig. 2 and outlined as follows:
-
Generate random fracture network and boundary conditions;
-
Locate the water table and compute the flow within the network;
-
Calculate dissolution and solute transport;
-
Update fracture apertures: compute the changes in the width of each fracture within the specified time step;
-
Iterate or terminate: proceed to the next time step and repeat steps 2 to 4, or terminate the simulation as required.
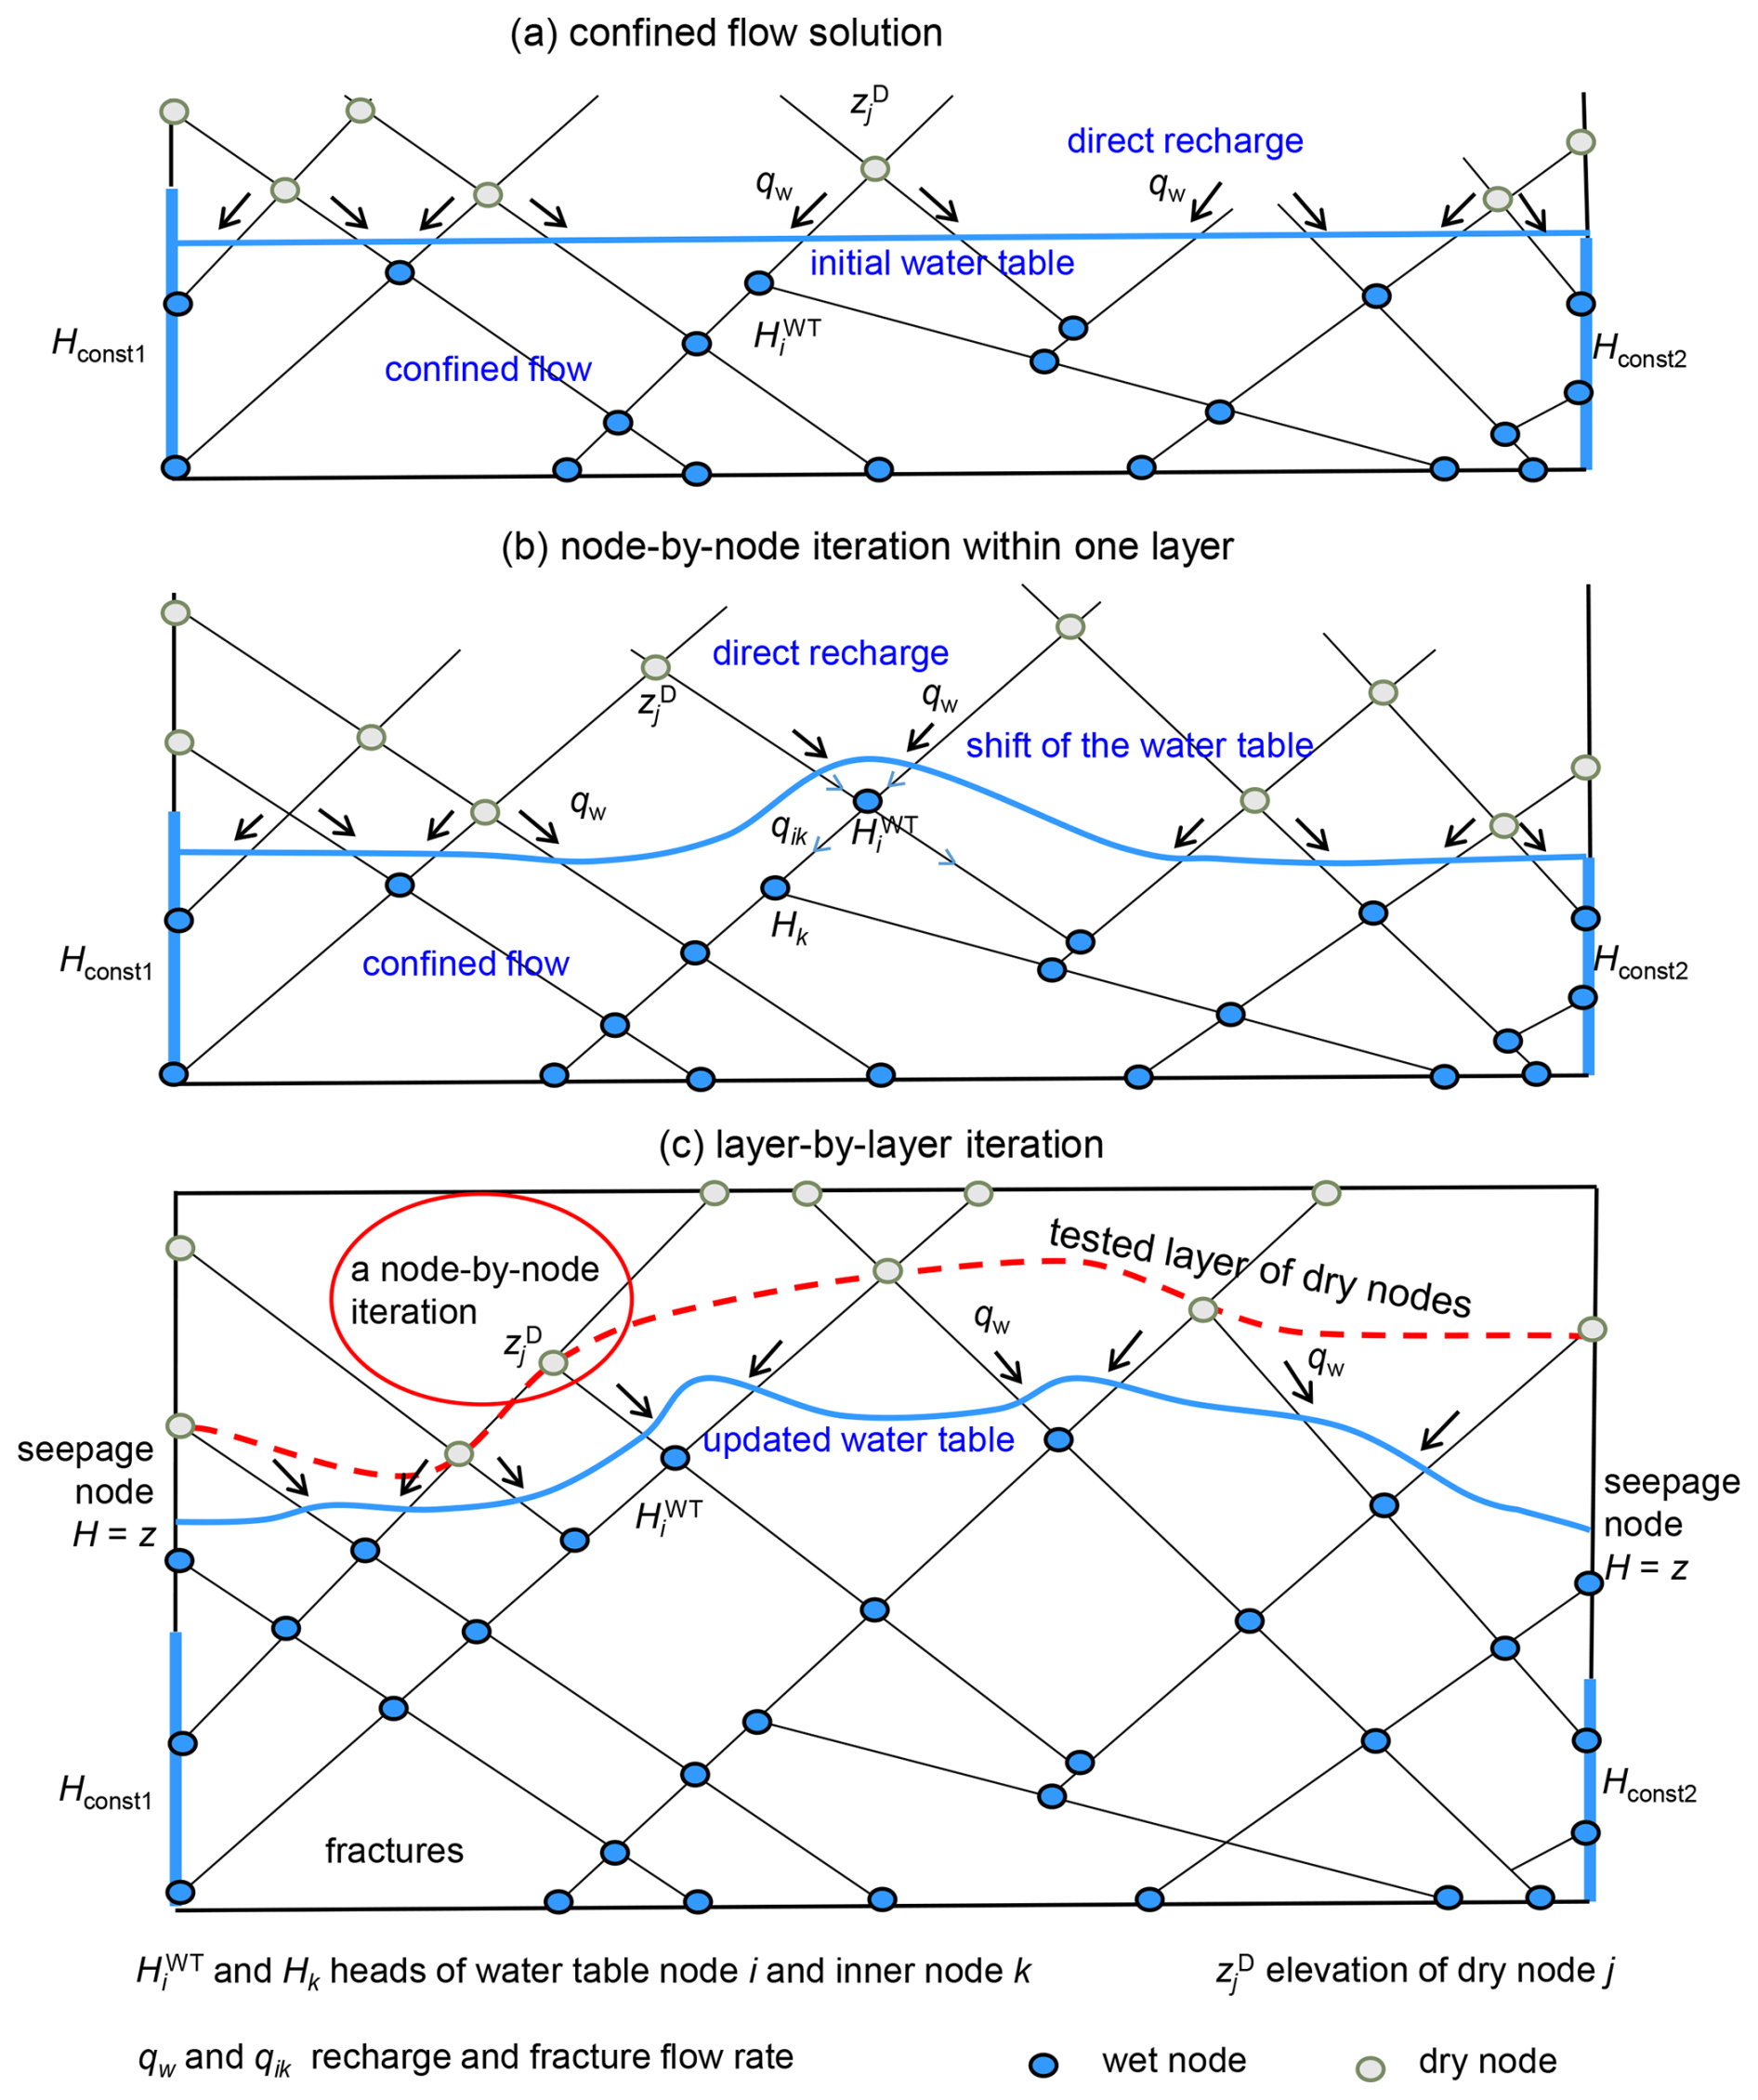
Figure 3Conceptual presentation of flow calculation in the fracture network. (a) Boundary conditions for confined flow calculation performed at every iterative step. (b) Node-by-node iteration: testing wetting of a dry node across a layer. (c) Layer-by-layer iteration.
2.1 Flow in fractures
2.1.1 Fracture network generation
The initial fracture network is created through Monte Carlo stochastic simulation, as described by Yu et al. (1999). Fracture parameters, including centre location, length, aperture, and direction, are randomly generated using Gaussian and lognormal distributions. Subsequently, the algorithm searches for fracture intersections (nodes) and excludes all dead end segments, which do not contribute to flow. In this work the fractures are uniform plan parallel planes, defined by length and aperture.
2.1.2 Flow in one fracture
When a fracture with length Lij and aperture bij connects nodes i and j with hydraulic heads Hi and Hj, respectively, the flow rate qij within the fracture conforms to the cubic law for laminar flow, whereas for turbulent flow, the Lomize equation (Lomize, 1951) is used to relate the flow rate to the hydraulic gradient Jij.
where g is the gravitational acceleration, v is the kinematic viscosity of water, and Re is Reynolds number. The transition from the laminar to the turbulent flow regime is here introduced at the point where turbulent frictional losses exceed those associated with laminar flow. The factor in Lomize equation (Eq. 2) is set so that transition occurs at a Reynolds number around 2020. This simplification omits the transitional flow zone, resulting in a smooth increase in flow rates as turbulence sets in Su et al. (1994) and Finenko and Konietzky (2024). However, in simulations presented in this work, flow always remains laminar.
2.2 Solution for water table in random fractures under distributed uniform recharge conditions
Each evolution time step requires the calculation of flow, dissolution, solute transport, and the corresponding changes in fracture aperture. Accurate flow calculation depends on determining the position of the water table at each time step. This is achieved through an iterative process, in which the water table position is updated until specific convergence criteria are met, as described in Sect. 2.2.2. The procedure is illustrated in Fig. 3. At each iteration, the current approximation of the water table defines a set of boundary conditions (Fig. 3a): prescribed recharge at water table nodes, seepage face (boundary nodes, where hydraulic head equals the elevation), and constant-head conditions elsewhere. The flow solver (confined flow solution) is then invoked to compute flow rates and hydraulic heads at all nodes. Water table nodes are subsequently searched node by node within each layer (Fig. 3b, node-by-node iteration) and layer-by-layer throughout the domain (Fig. 3c, layer-by-layer iteration).
2.2.1 Confined flow solution
During each node-by-node iteration, an approximate water table is used to classify boundary nodes as having either a specified head, a prescribed recharge, or as part of the seepage face. At every node, a flow balance must be satisfied:
where the first part is the sum of flow from/to all inner (non-boundary) nodes (see Eqs. 1–2) and the second part is the sum of direct recharge qw from the vadose zone, applied to the water table nodes.
Assuming that the equations are non-linear, we use the Newton–Raphson iteration to solve the system of equations, with convergence criteria as follows:
where Herror is the water head error vector between the n and n+1 iterations. H is the water head vector. Hmax is the maximum water head difference between two iterations and Htol is the allowable error. Qerro is the sum of water flow budget of all inner nodes, and Qtol is the allowable error.
The difference in the water heads between two iterations and the water budget is checked to validate the flow results. When Hmax is less than the allowable error Htol and the water budget Qerro is less than the allowable error Qtol, the iteration converges. The C open source linear algebra package Armadillo (Sanderson and Curtin, 2016, 2019) was employed to perform matrix computation.
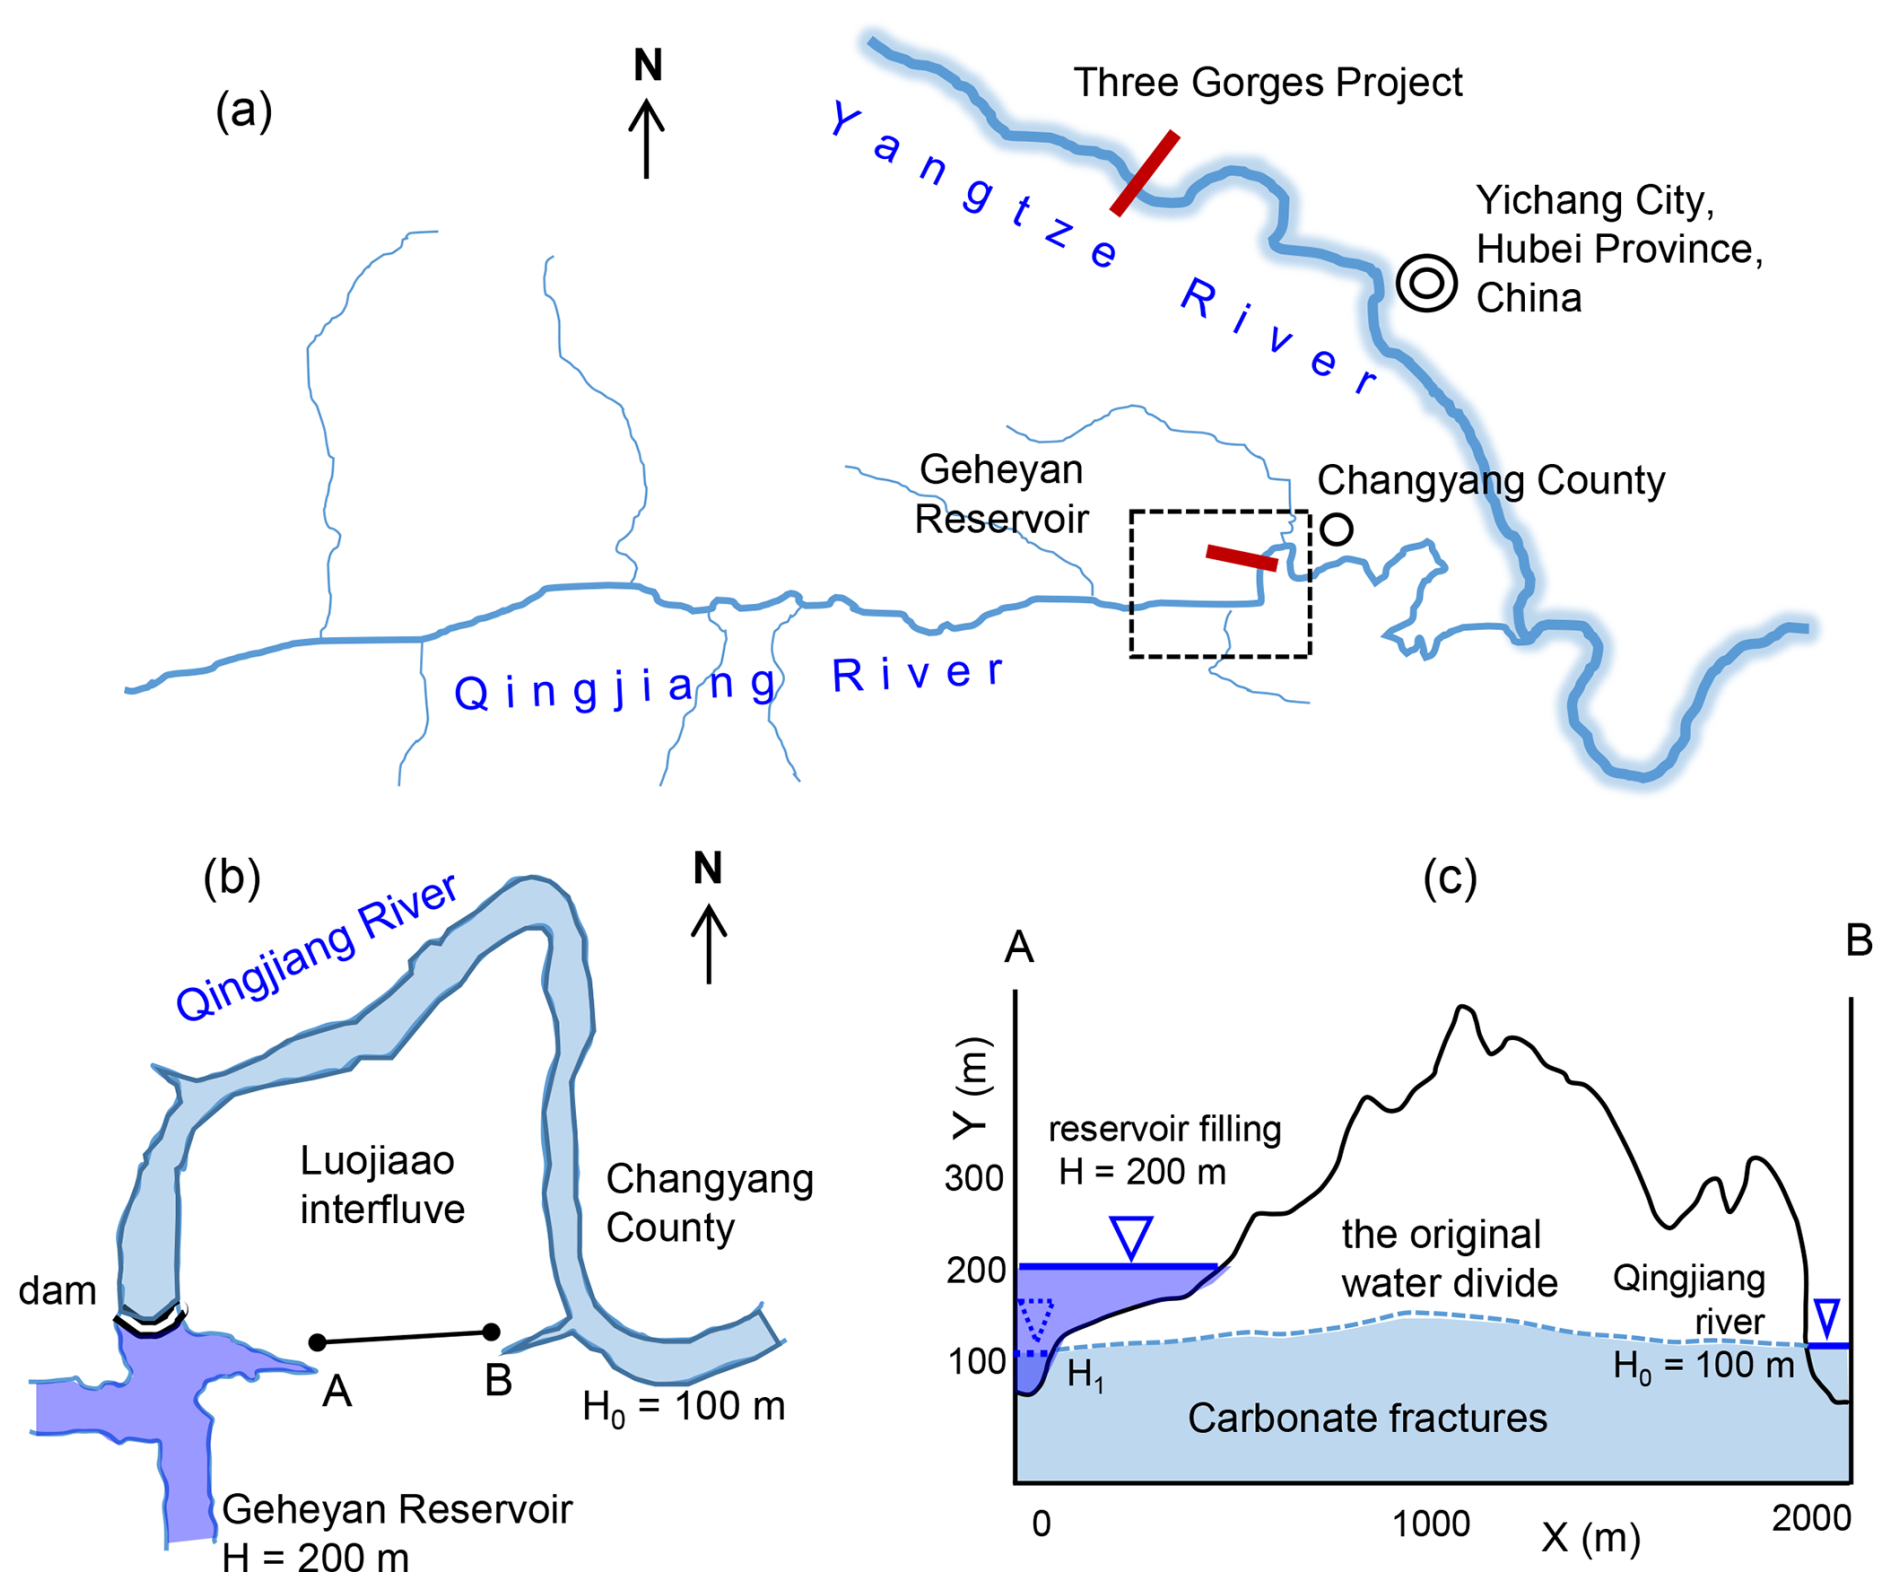
Figure 4Location and setting of the Geheyan Reservoir, situated on the upstream side of a bend in the Qingjiang River, Changyang County, Hubei Province, China. (a) The location of Geheyan Reservoir. (b) Simplified map of the reservoir area and Luojiaao interfluve aquifer (marked by a dashed rectangle in a). (c) Cross-section through the Luojiaao interfluve aquifer along the line AB in (b). The dashed line shows position of the water table before the reservoir construction.
2.2.2 The node-by-node and layer-by-layer iterations: search for the water table
One of the challenges in modelling unconfined aquifers with distributed recharge lies in accurately identifying the water table. In the presence of dissolution and increasing permeability of fractured media, the water table changes in time also when recharge is constant. We use a robust “intuitive” algorithm for computing the position of a water table as shown in Fig. 3. The algorithm employs a two-level iterative strategy: (1) layer-by-layer iterations and (2) node-by-node iterations within each layer. When the algorithm solving for the confined water head is included, the method effectively operates as a three-level iterative strategy, ensuring robustness and accuracy in resolving wetting and free surface dynamics. The algorithm is applied for all time-steps of a simulation.
- Step 0:
-
Initially, the water table is positioned at the lowest constant head boundary in the domain (Fig. 3a). The nodes of the water table receive direct recharge from the vadose zone. The heads at all nodes in the phreatic part are calculated by above described confined flow solution.
- Step 1:
-
Dry nodes, directly connected to water table nodes are identified. For each pair, the difference between the hydraulic head of the nearest water table node and the elevation of the dry node is calculated as . These differences are then sorted into an ordered sequence.
- Step 2:
-
Following the sequence each dry node is changed to a water table node and the heads are recalculated by confined flow solver, assuming new boundary conditions with constant input to the new WT node (Fig. 3b). If the head at the node is higher than its elevation, and no other wet node becomes dry, the transition of the node from dry to wet is kept. Otherwise, the node remains dry and the procedure continues with the next node in the sorted sequence.
- Step 3:
-
Repeat Steps 1 and 2 layer by layer until no dry node becomes wet (Fig. 3c).
The numerical model was verified successfully against a MODFLOW model (Harbaugh et al., 2000) and an analytical model using the Dupuit assumption. Please see the Supplements for details.
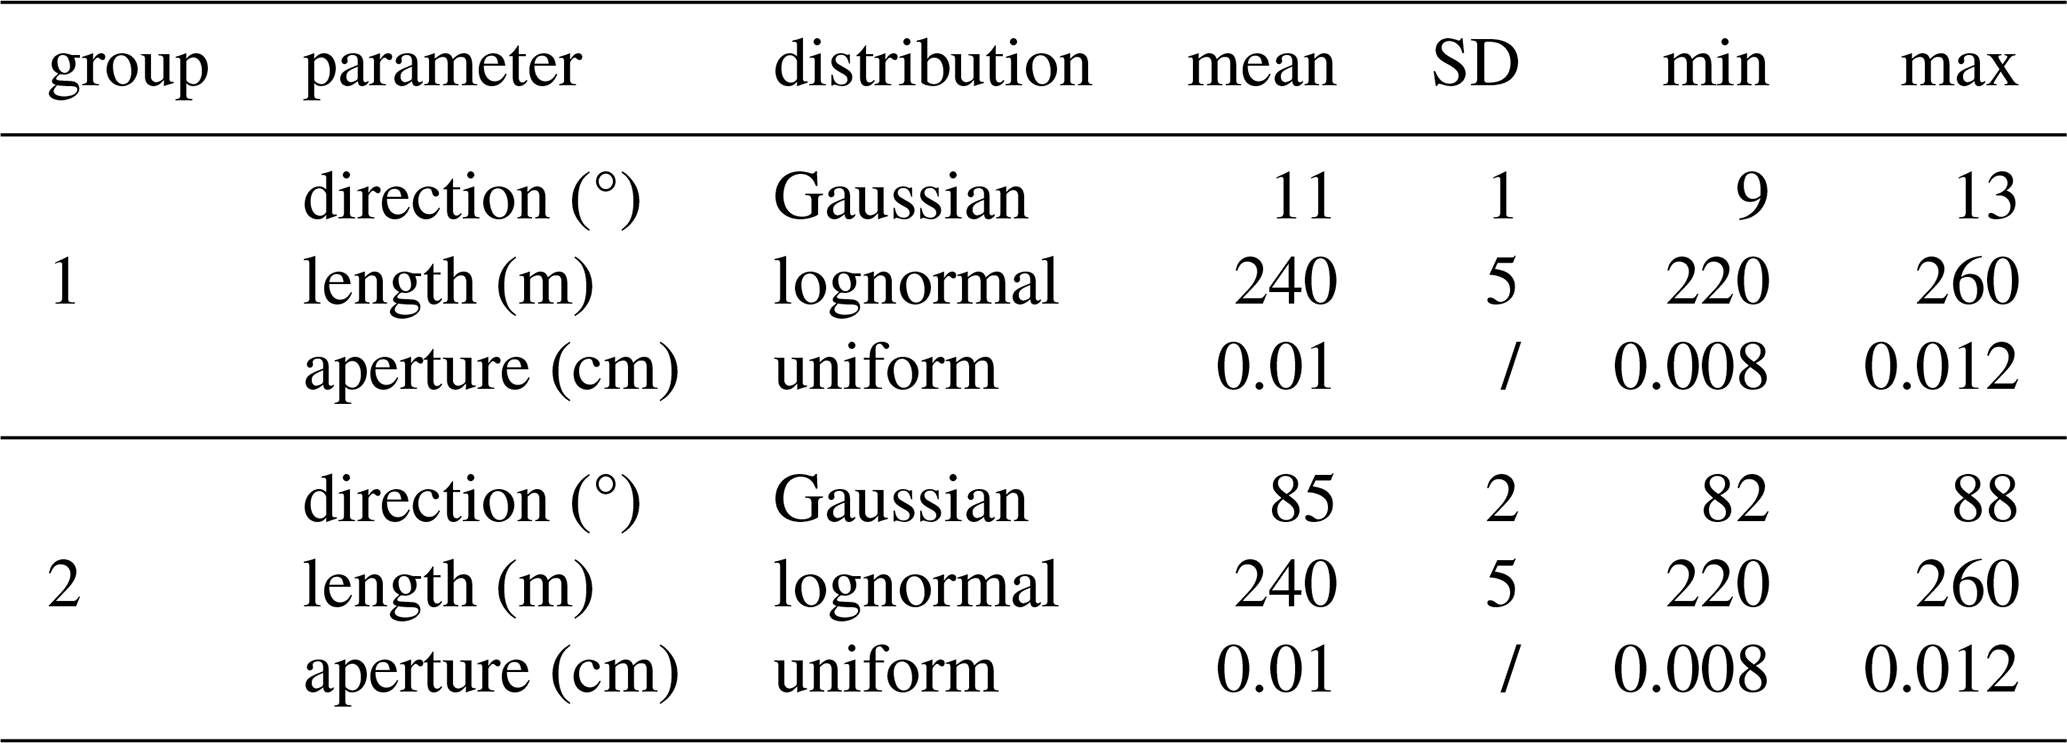
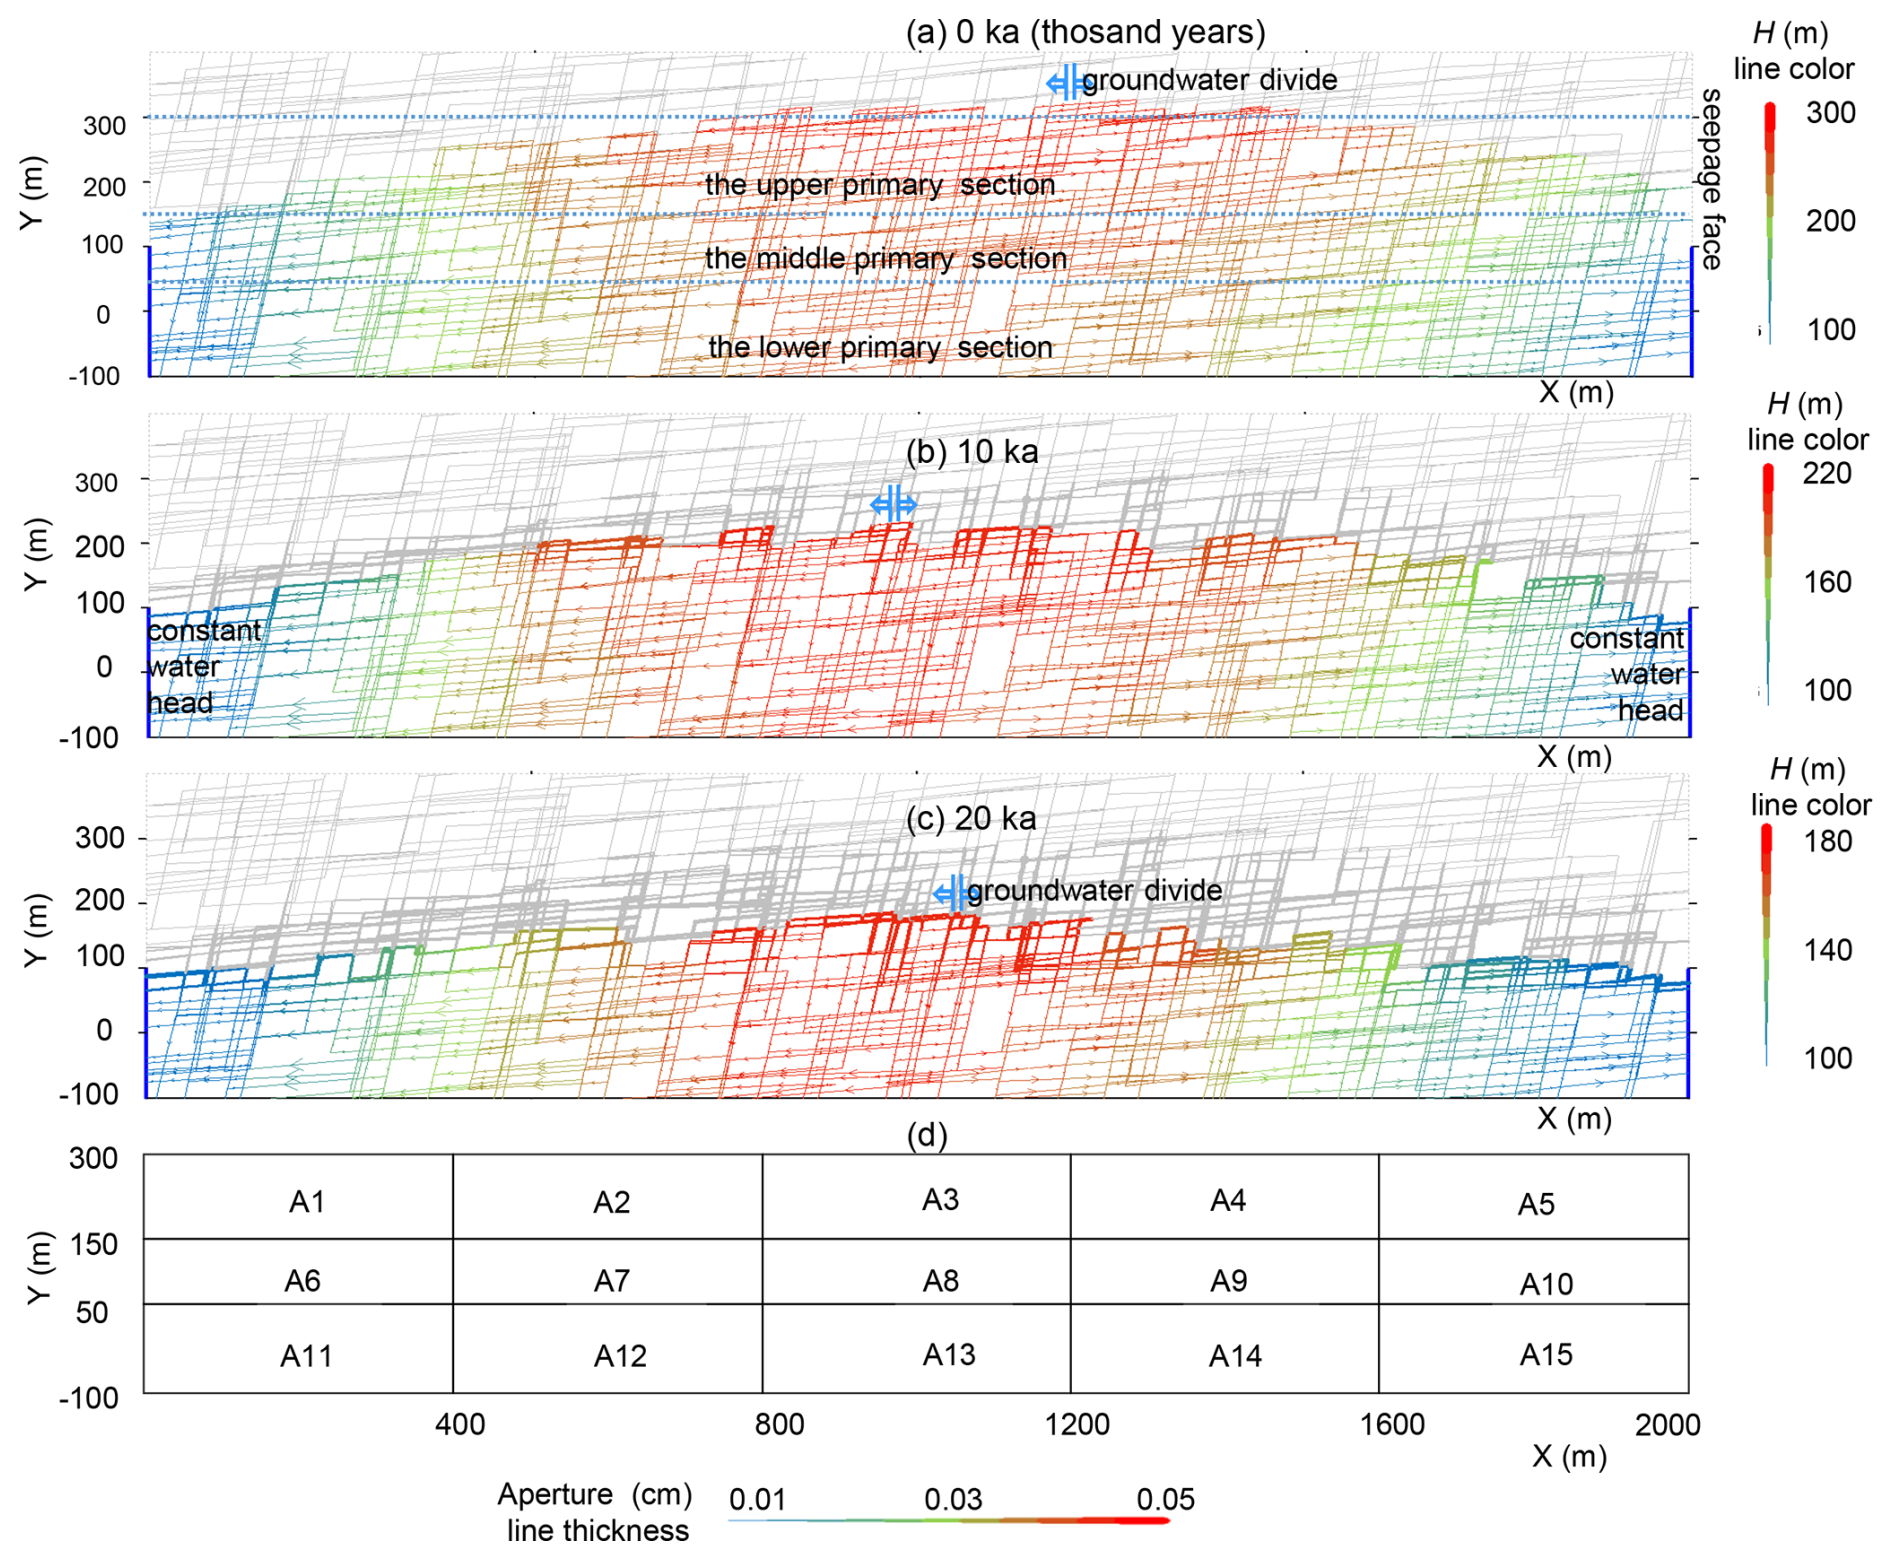
Figure 5The initial aquifer (a), and aquifer after 10 ka (thousand years) (b) and 20 ka (c) of evolution. The widths of the lines present the aperture, colours the head and arrows the flow direction. To facilitate the discussion the aquifer is divided into 3 primary vertical sections and each of them into 5 horizontal subsections, as shown in panels (a) and (d).
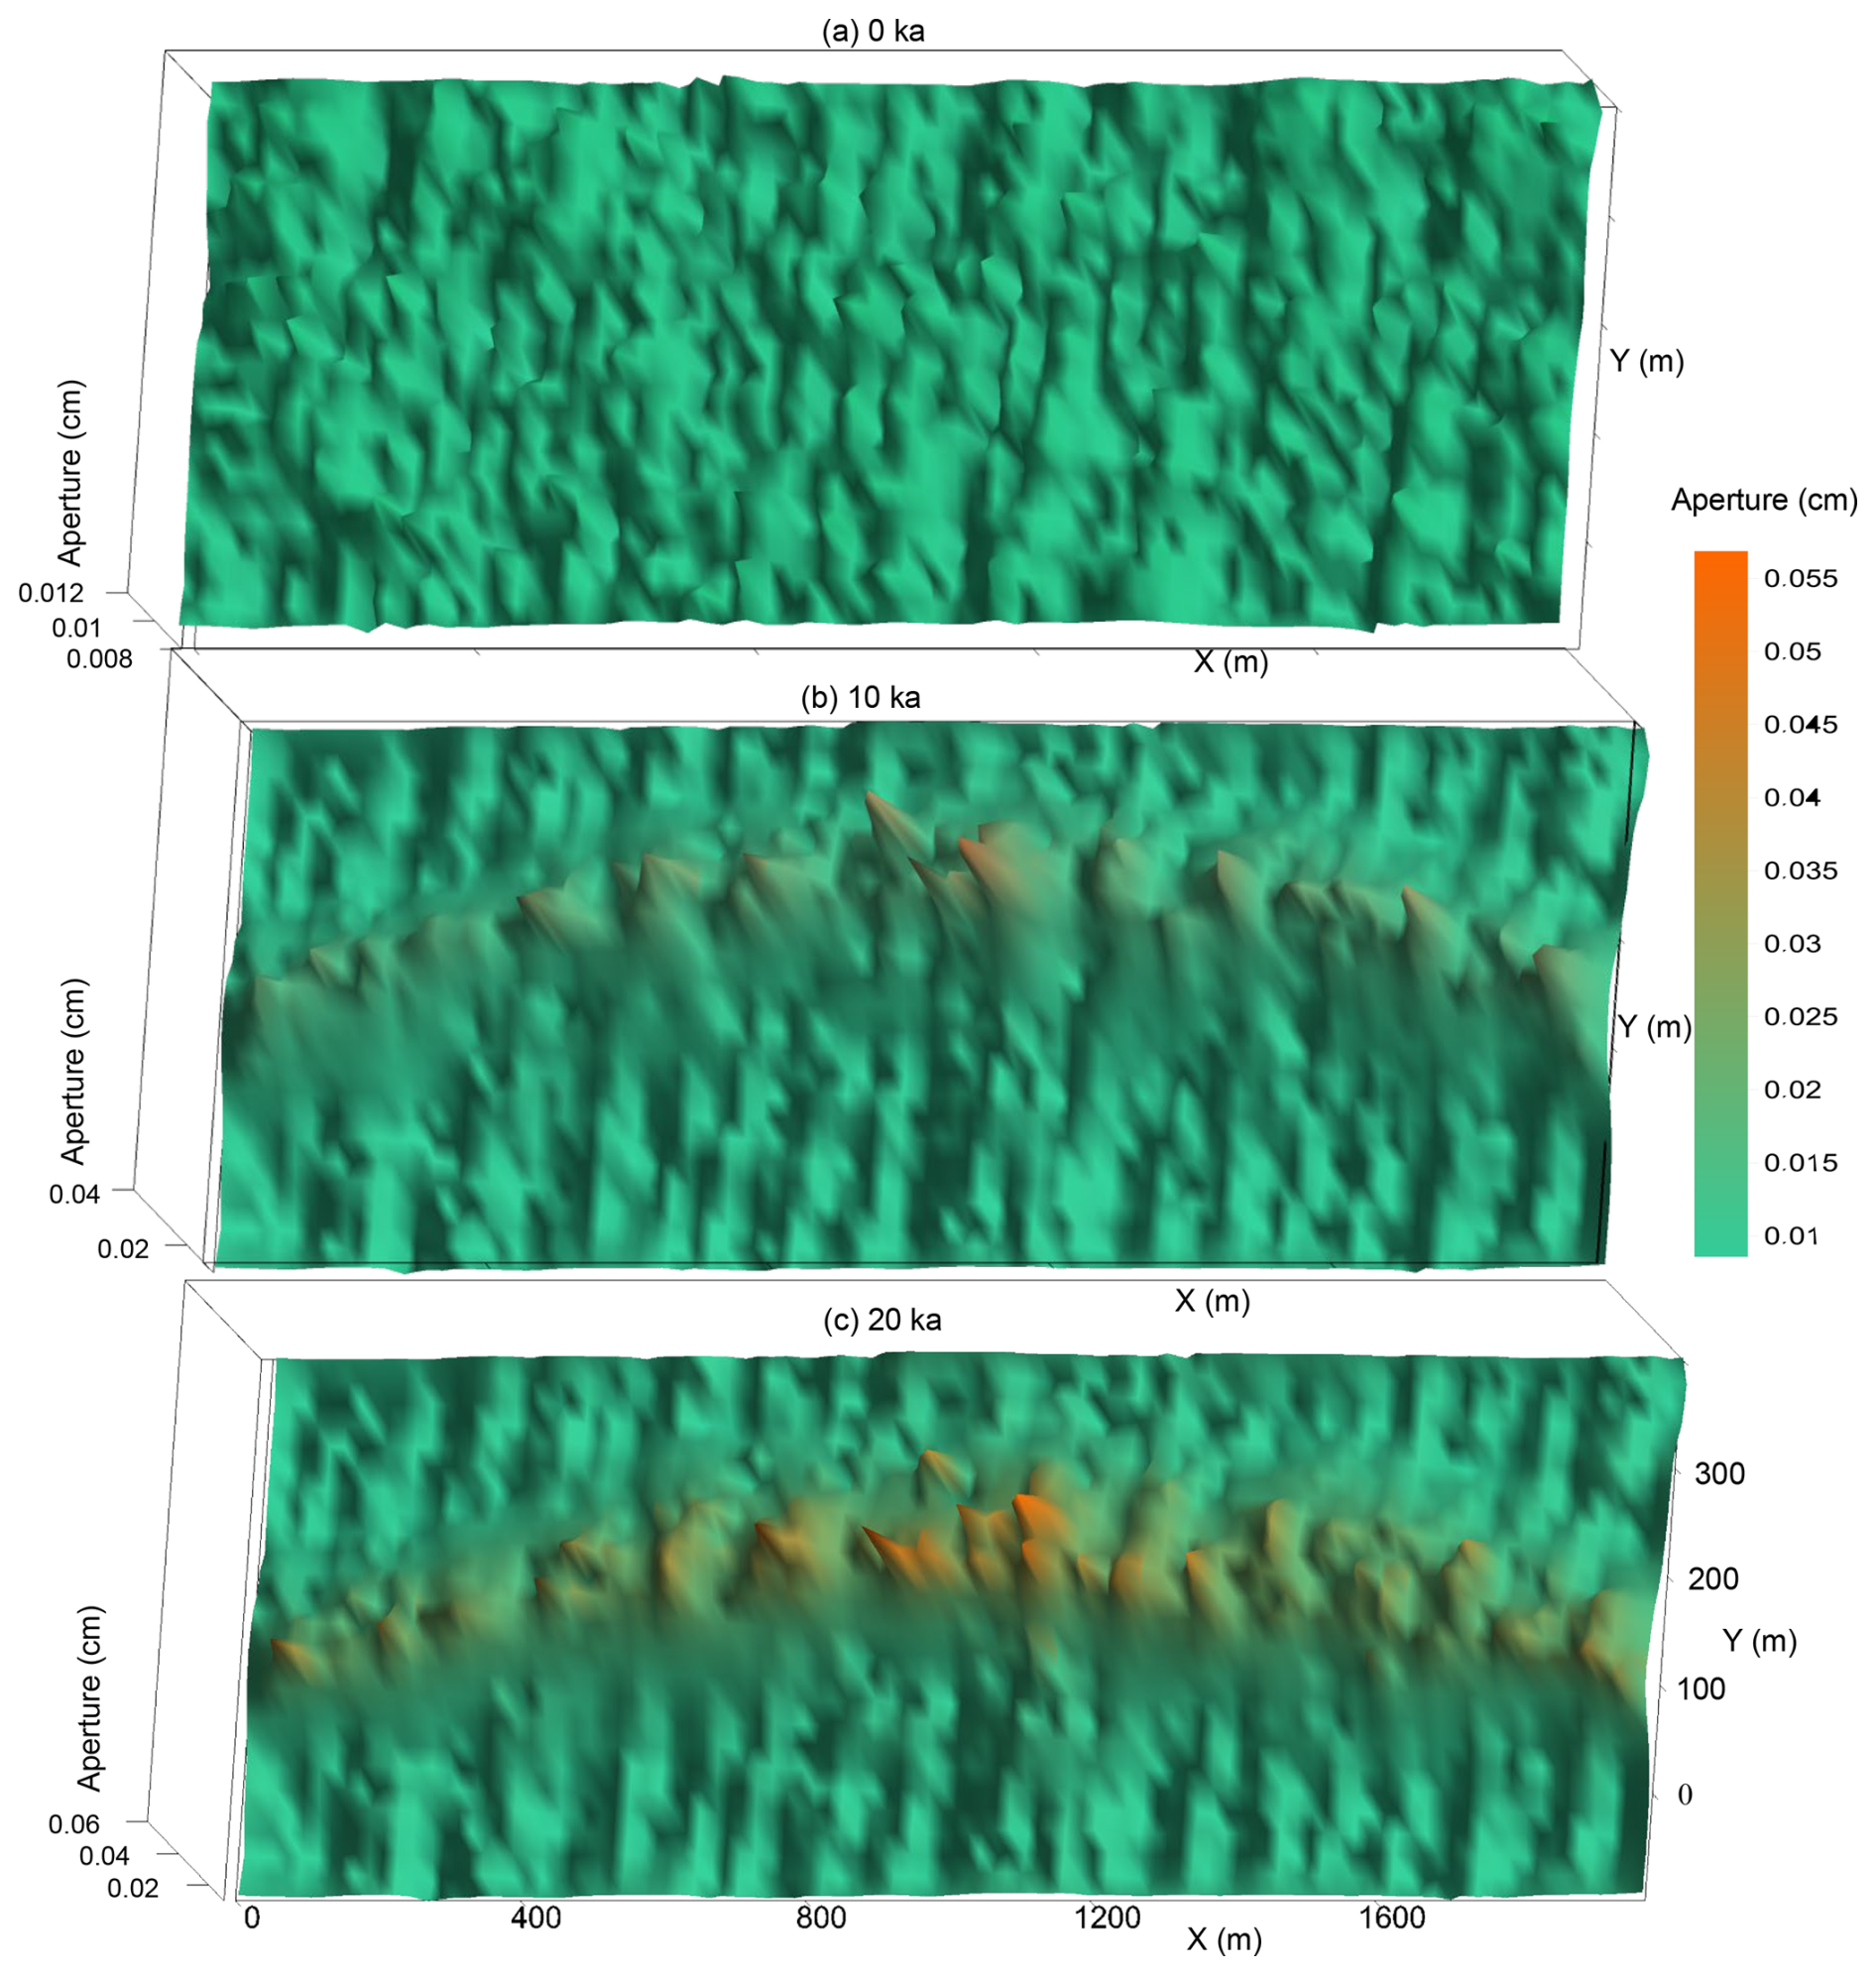
Figure 6Evolution of fracture apertures under natural karstification at 0 ka (thousand years) (a), at 10 ka (b) and at 20 ka (c).
2.3 Dissolution widening of fractures
The dissolution rates of limestone under both laminar and turbulent flow conditions have been the focus of extensive research (Dreybrodt, 1990, 1996; Liu and Dreybrodt, 1997; Eisenlohr et al., 1999; Dreybrodt and Kaufmann, 2007). These rates are governed by a complex interplay of surface reactions, transport mechanisms, and CO2 conversion processes (Dijk et al., 2002; Detwiler and Rajaram, 2007). In this study, we adopt the rate equations developed by Dreybrodt (1996):
where k1 and kn are rate constants (in mol cm−2 s−1), C represents the concentration of Ca2+ ions (in mol L−1), and Ceq denotes the equilibrium concentration in the H2O-CO2-CaCO3 system. The Ceq is determined by the concentrations of calcium and dissolved CO2 in the solution at the water table. These concentrations result from complex flow and dissolution processes occurring from the surface down to the water table – including flow and reactions within the soil, epikarst, and vadose zone – which are beyond the scope of this study. The reaction follows a linear rate law up to the switch concentration Cs, transitioning to a nonlinear rate law between Cs and Ceq. Here we assume that rates are entirely controlled by surface reaction, and ignore the concentration gradient perpendicular to flow. This approximation is valid for situations where the solutions are close to equilibrium (Gabrovšek, 2000), which is mostly the case in the presented scenarios (Yuan et al., 2002; Wan et al., 1999). The reaction ordern and the switch concentration Cs are experimentally determined and influenced by the impurity content in the limestone (Eisenlohr et al., 1999). Experimental studies have reported reaction orders ranging from 3 to 11. For this study, we use n=4, Cs=0.9 Ceq, mol cm−2 s−1, and mol cm−2 s−1 (Gabrovšek and Dreybrodt, 2000; Dreybrodt et al., 2005). Studies on the dissolution kinetics of calcium carbonate minerals under turbulent flow (Buhmann and Dreybrodt, 1985a, b; Liu and Dreybrodt, 1997) indicate that the rate constant in turbulent conditions is an order of magnitude greater than that under laminar flow.
The change in concentration ΔC along an individual fracture can be determined by applying the principle of mass conservation within a water parcel passing along the fracture. This can be analytically calculated for a plane parallel fracture, as shown in the Supplements. The change in concentration along the fracture is converted to mass removed from the fracture walls and the change of aperture during time Δt:
where L is the fracture length, ρ is the density of calcite (2.5 g cm−3), is the molar mass of calcite (100 g mol−1), and q is the flow rate.
To calculate the change in concentration along a fracture, the calcium concentration at the input node must be known. This input concentration is determined as the flow-weighted average of all inflows to that node. To ensure that all required concentrations are available when needed, the computation proceeds in a cascading sequence, starting from nodes with the highest hydraulic heads and moving downstream (see the Supplement). A uniform widening rate is assumed along each fracture. Once the fracture apertures in the entire phreatic zone are updated to reflect dissolution widening within a time step, the evolution time step is completed.
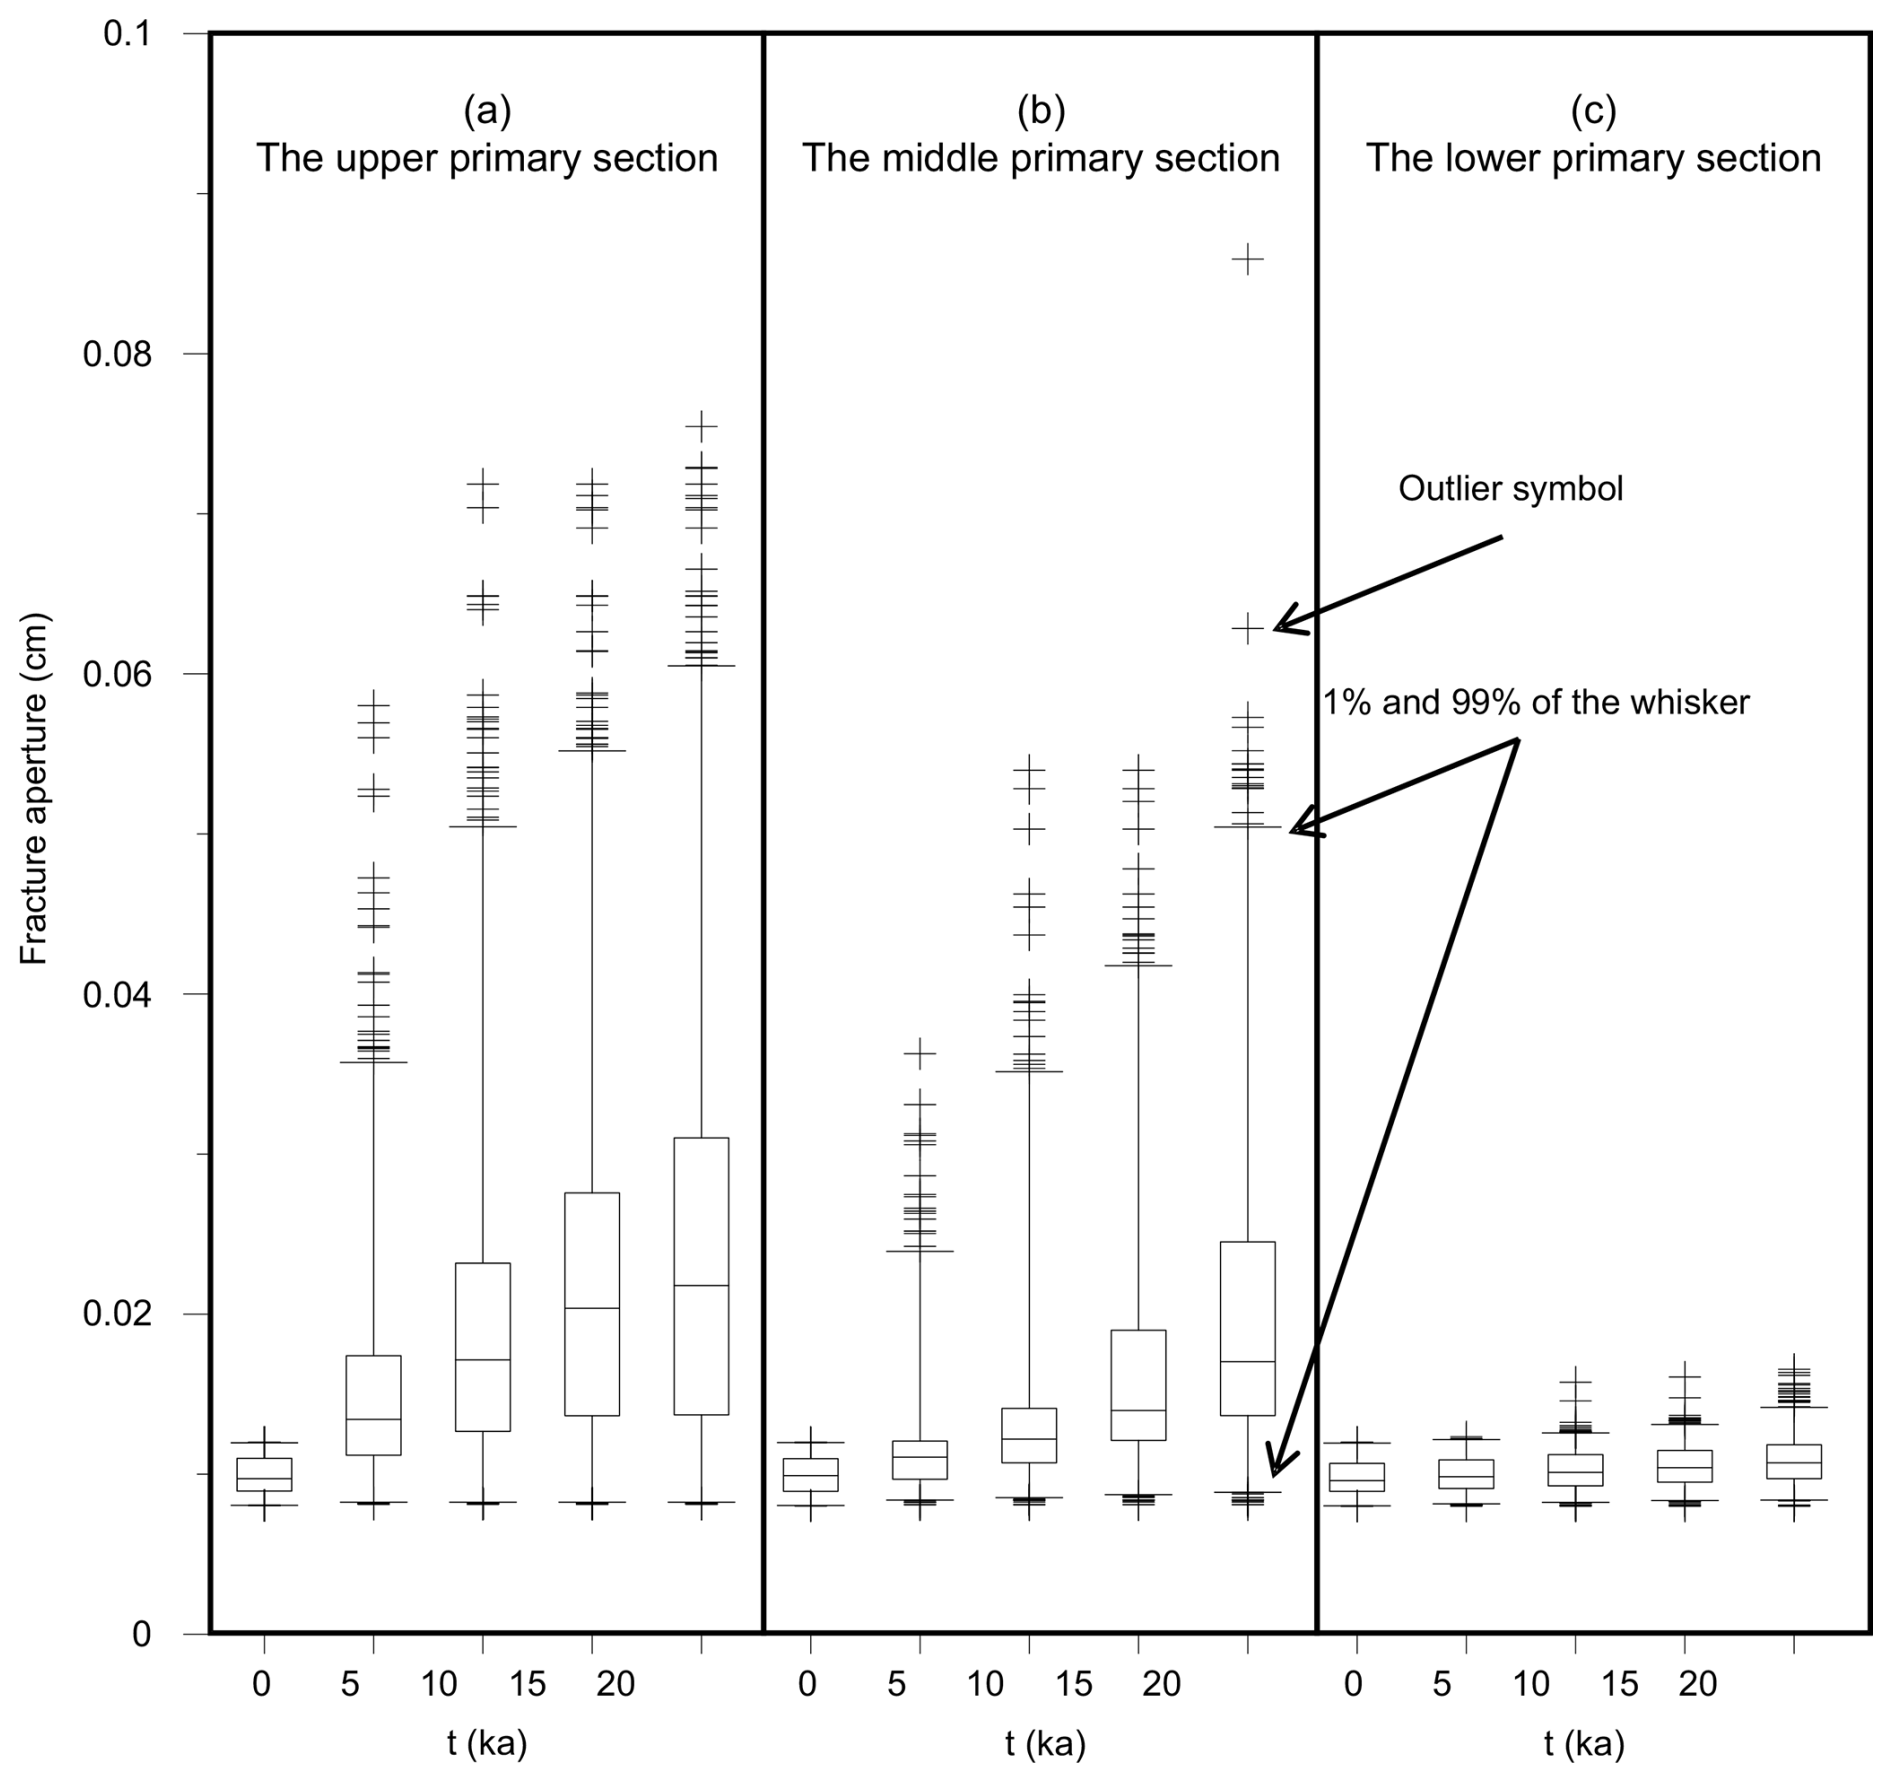
Figure 7The box-whisker plot of fracture aperture under natural evolution for 20 thousand years in three primary sections (see Fig. 5).
As an example of an aquifer, where the concept of LKB formation can be applied is Luojiaao interfluve aquifer, located between the two reaches of the Qingjiang river meander. Hubei Province, China (Fig. 4a and b). On the western side of the interfluve, the Geheyan Reservoir was constructed, which is one of three karst reservoirs along the river (Xu and Yan, 2004). The water level in the reservoir is above the original water divide, which was determined by boreholes (Fig. 4c). However, the leakage and its trend could not be determined with field methods.
Previous studies (Yuan et al., 2002; Shen et al., 1997; Wan et al., 1999) revealed cave development near both riverbeds, with an absence of caves in the water divide region. Although we lack knowledge on the possible previous karstification stages at this particular site, we expect that the water divide in the interfluve is a result of karstification under rainfall recharge, and that the LKB may play a crucial role in reservoir leakage.
3.1 Construction of conceptual and numerical model of an initial aquifer
The conceptual model, translated into a numerical one, is based on a simplified interpretation of field mapping data. The modelled domain represents a two-dimensional cross-section of a fractured limestone aquifer, 2000 m in length and 500 m in height. The initial conductive structures are gently dipping bedding planes (8–10°) and a set of near-vertical fractures with an average dip of 85°, both generated randomly using the statistical parameters listed in Table 1. Their initial apertures are uniformly distributed, with a mean value of 0.01 cm. After identifying fracture intersections (nodes) and removing all dead-end segments, the resulting fracture network consists of 4073 intersection nodes and 7401 fracture segments, with segment lengths ranging from 0.01 to 143 m. The average segment length is 15.74 m.
Boundary conditions include a constant hydraulic head of 100 m applied to the left and right sides of the domain (from elevations −100 to 100 m), and seepage boundaries between 100 and 400 m elevation. A uniform infiltration rate of 200 mm yr−1 is applied to the water table nodes.
Reconstructing hydrogeochemical boundary conditions at the water table is inherently challenging. Based on measurements of soil CO2 and Ca2+ concentrations from three boreholes and two springs, we assume a closed-system equilibrium concentration (Ceq) of 2 mmol L−1 (Yuan et al., 2002; Wan et al., 1999). The saturation ratio of infiltrating water is assumed to be . The total simulation time is set to 100 000 years, with model convergence evaluated at each time step.
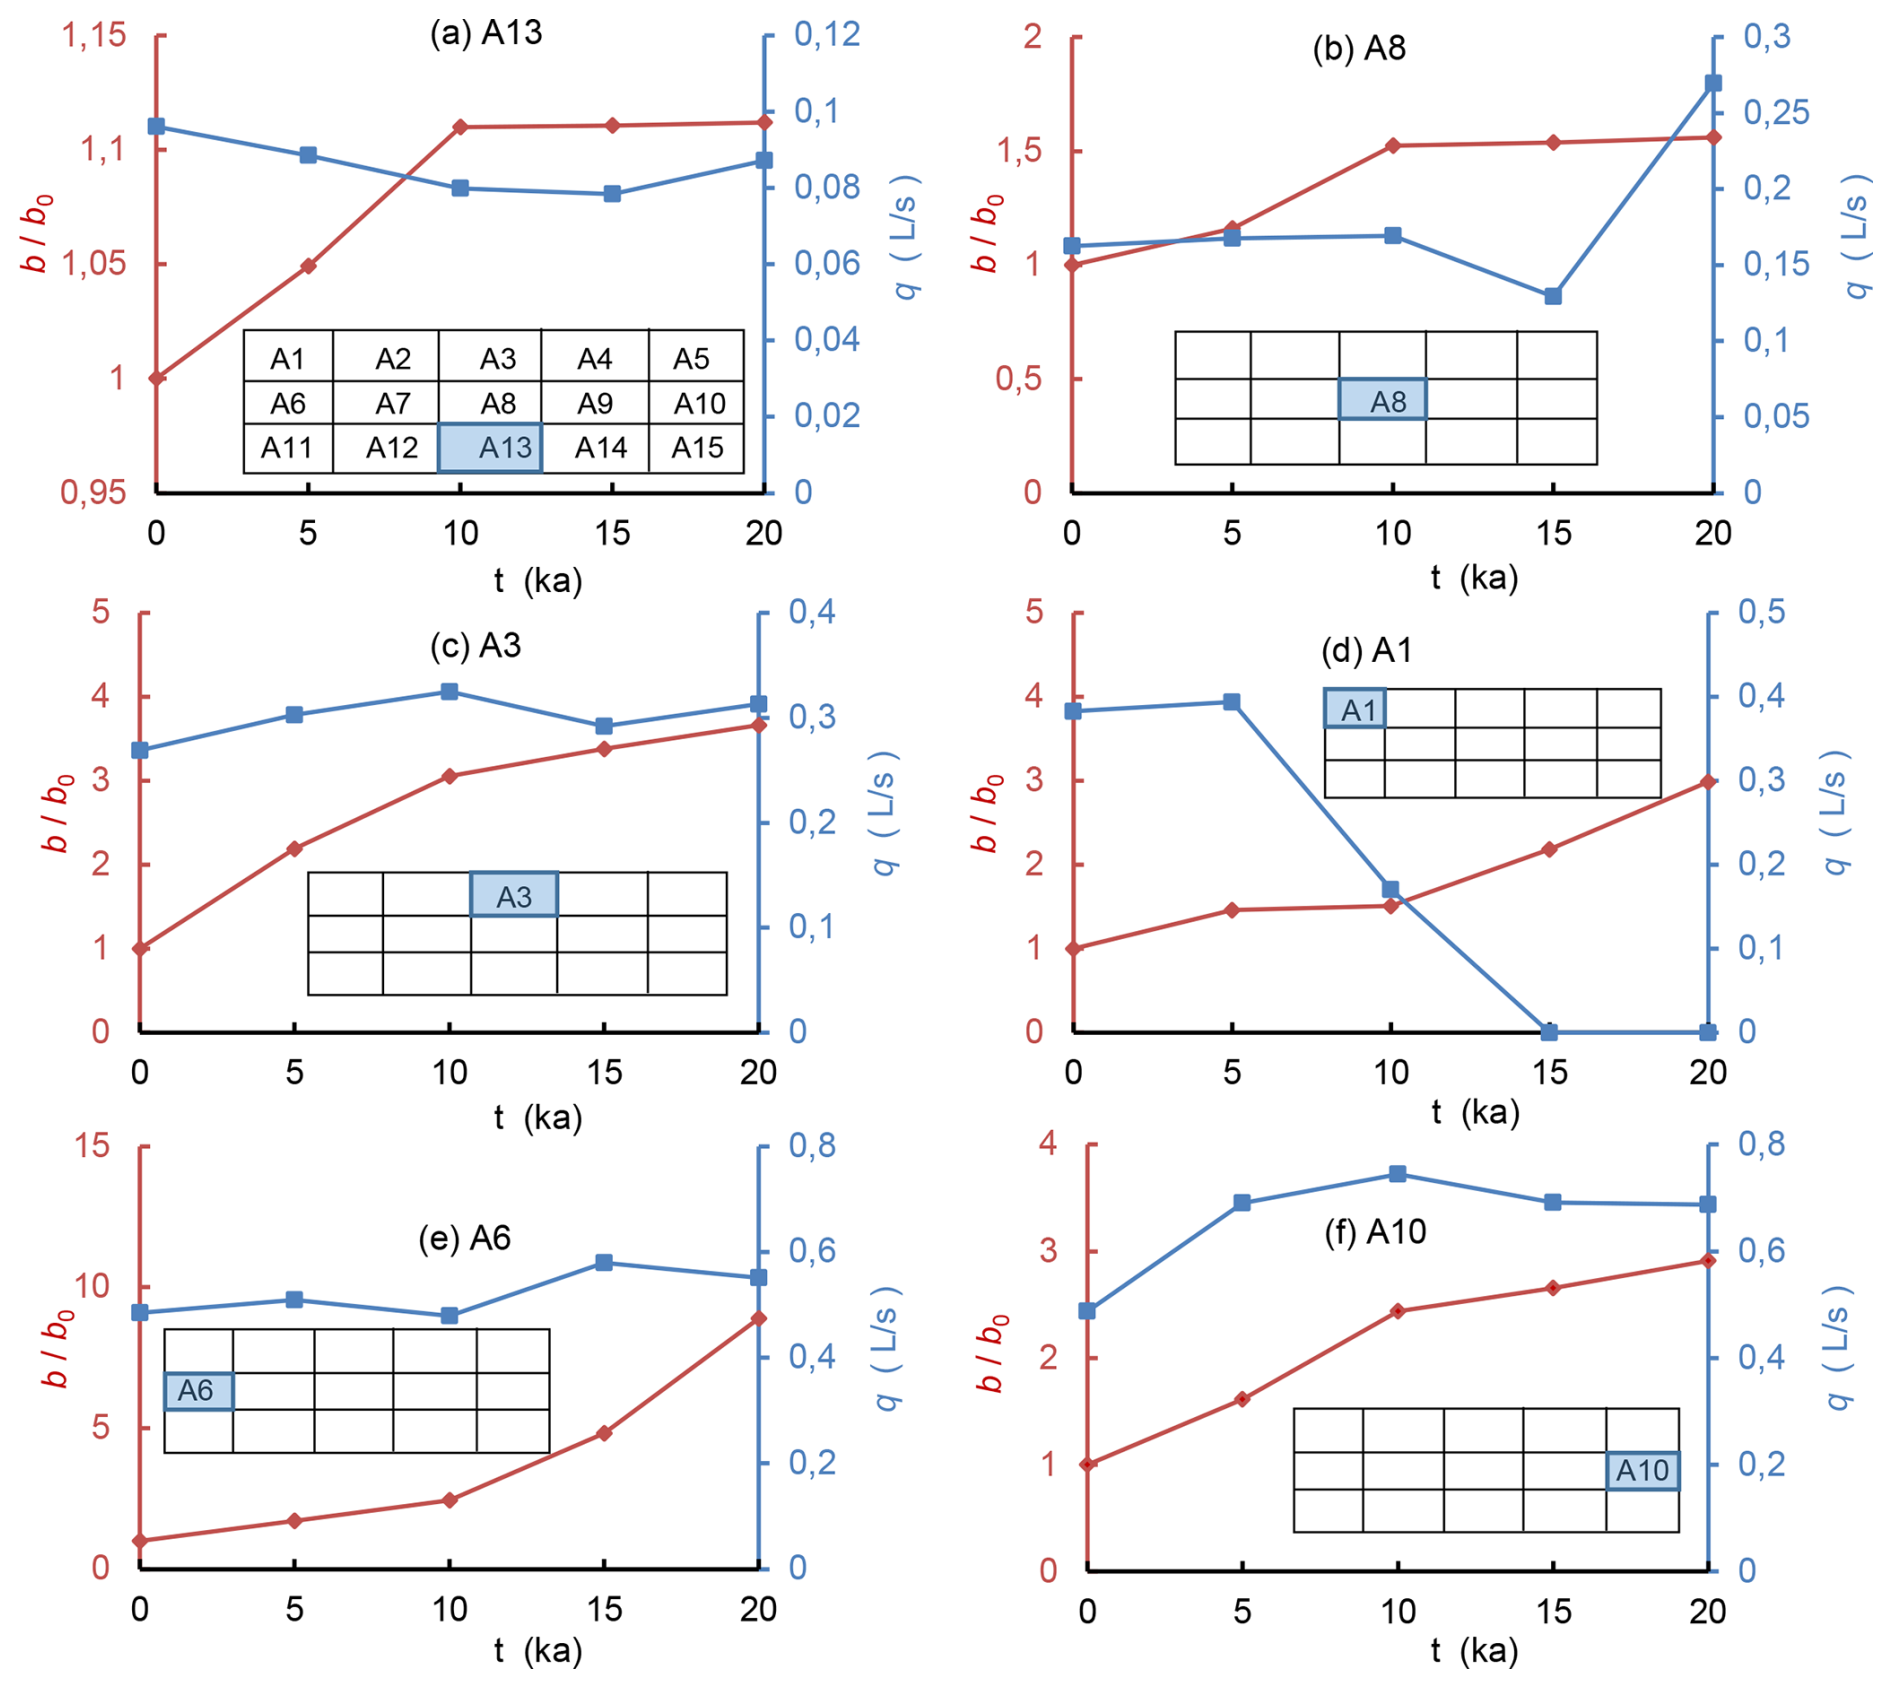
Figure 8The relative change in the average aperture and the change in discharge rate q (flow out) in different subsections.
3.2 Model of karstification under distributed uniform recharge
The modelling results are shown in Fig. 5. We observe the expected drop of water table due to increasing transmissivity of the aquifer. The groundwater divide remained close to the middle of the domain, whilst the elevation of the highest wet node, which represents the divide ridge, descended from 350 to 230 m at 10 ka and to 185 m at 20 ka.
As expected, there is a fringe of high dissolution rates close to the water table. Below the water table, the fracture widening is relatively slow. As the water table gradually decreases, the fringe of high dissolution rates migrates vertically through the aquifer and increases the hydraulic conductivity.
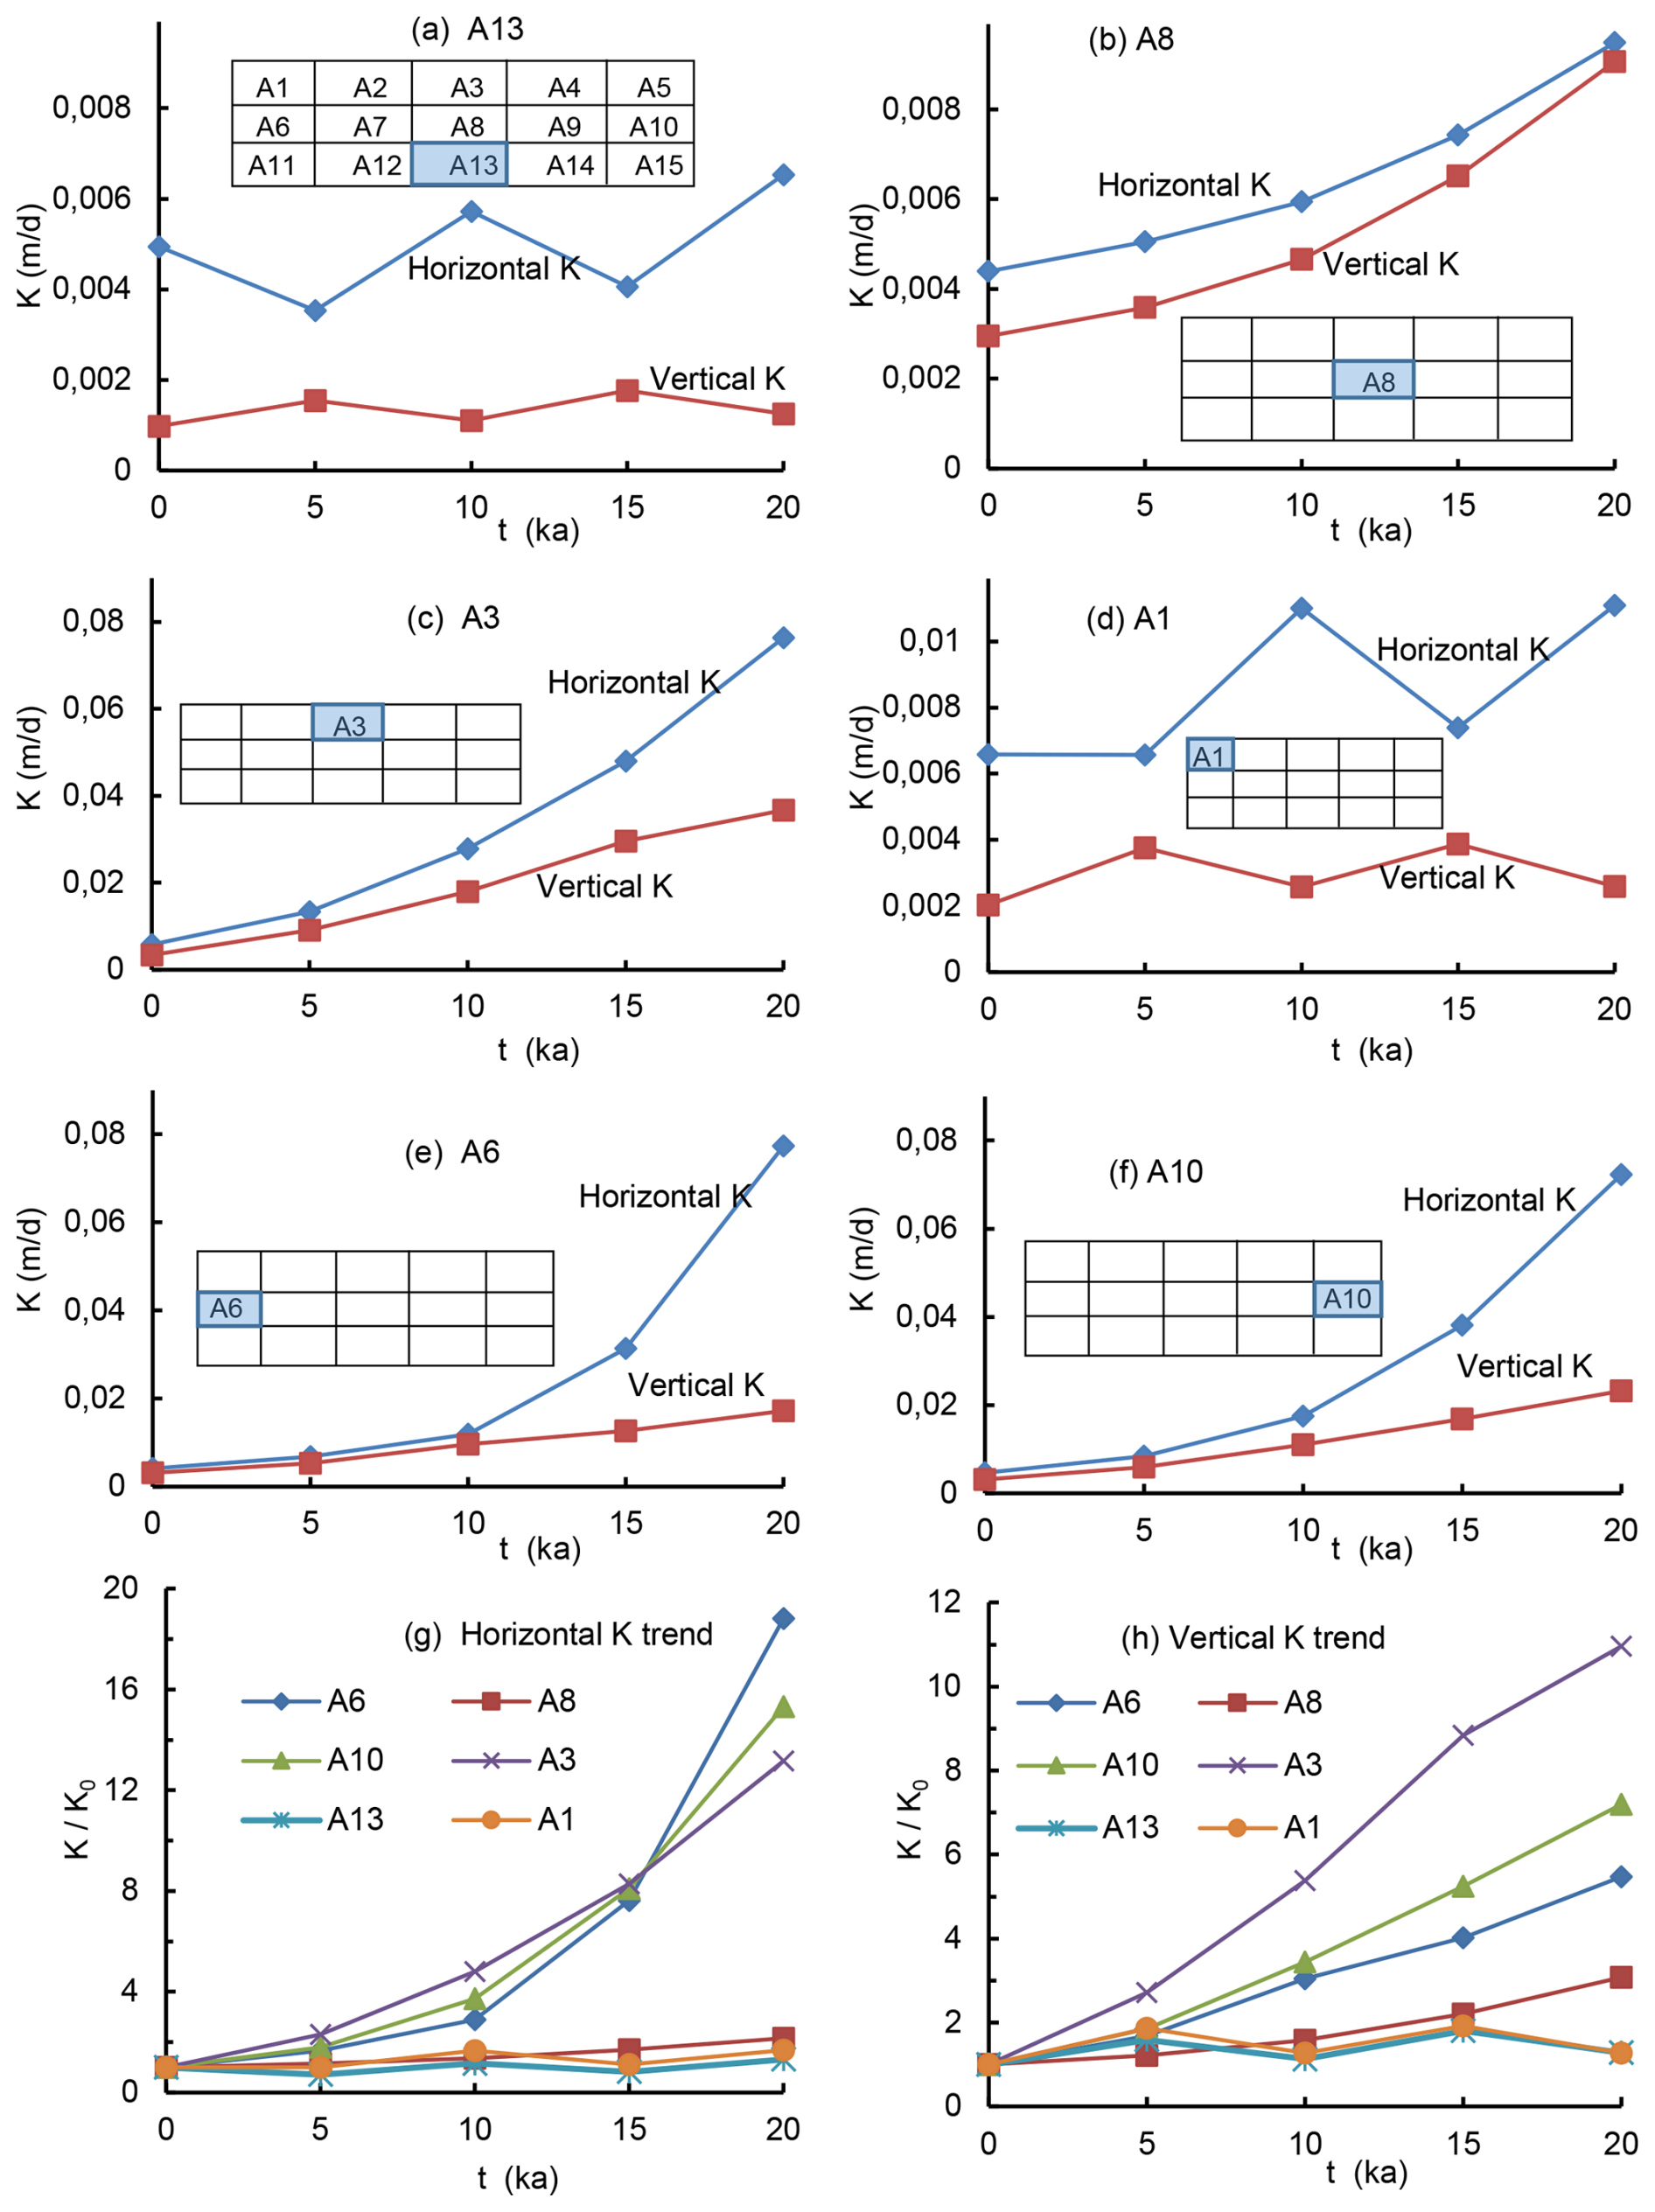
Figure 9Changes and increasing trends of the equivalent conductivity K in the different subsections during 20 ka natural evolution process.
3.3 Changes in fracture aperture and discharge during karstification
The fracture aperture distributions at three evolution time steps are shown in Fig. 6. To facilitate the discussion, we have divided the aquifer into 15 subsections along three vertical primary sections, as shown in Fig. 5a. The variation of aperture statistics in three vertical sections is shown in Fig. 7. The water table with dissolution fringe mainly descends through the upper section, which experience the evident change in aperture (Gabrovšek and Dreybrodt, 2001; Hubinger and Birk, 2011).
The changes of apertures and discharge rates in several representative subsections are shown in Fig. 8. Generally, the change of apertures drops along vertical directions and is higher near the left and right boundary. In the lower section, the change of aperture is minimal (A13).
The discharge rate in each subsection was computed by checking the fractures that cross the boundary and flow into the subsection. The lateral aquifer width was assumed to be 100 m. The A13 subsection has the lowest discharge, which changes the least over time. The discharge in the A8 subsection changed more slowly than that in other parts of the middle primary section. The A3 subsection, in the middle part of the upper primary section, exhibited a much greater leakage trend than did the lower parts. From the aperture and discharge analysis, we concluded that a low-karstified area exists mainly in the middle and lower primary sections.
3.4 Changes in conductivity K and formation of the LKB
To further elucidate the formation of an LKB, we calculated vertical and horizontal hydraulic conductivity in each subsection. To do this, we “cut out” a section at certain stage of evolution, and calculated confined flow rate for a given head difference along horizontal and vertical direction, respectively. Thus horizontal and vertical equivalent K values, and the changes and trends in the representative subsection were computed (Fig. 9). Notably, the fractures below 50 m in the lower subsections (A11 to A15), remained unevolved. The horizontal K varied between 0.005 and 0.008 m d−1 in the different subsections, and the vertical K varied between 0.001 and 0.002 m d−1.
The middle subsections A7, A8, and A9 experienced low level of karstification, in particular, subsection A8 (less than 0.01 m d−1), which combined with the lower section forms an LKB, which could effectively prevent horizontal flow. In the A6 and A10 subsections, the K increased by more than one order of magnitude.
The upper primary section was also tested to determine whether it included a low permeable part. Note that here only phreatic karst process is considered, therefore most fractures in subsection A1 did not experience widening. The water table descended through subsection A3, where the conductivity trends increased in both the horizontal and vertical directions compared with those in the other subsections. Although the upper primary area does not exhibit a low conductivity, its underlying low permeable rock-blocks have already been recognized as an LKB.
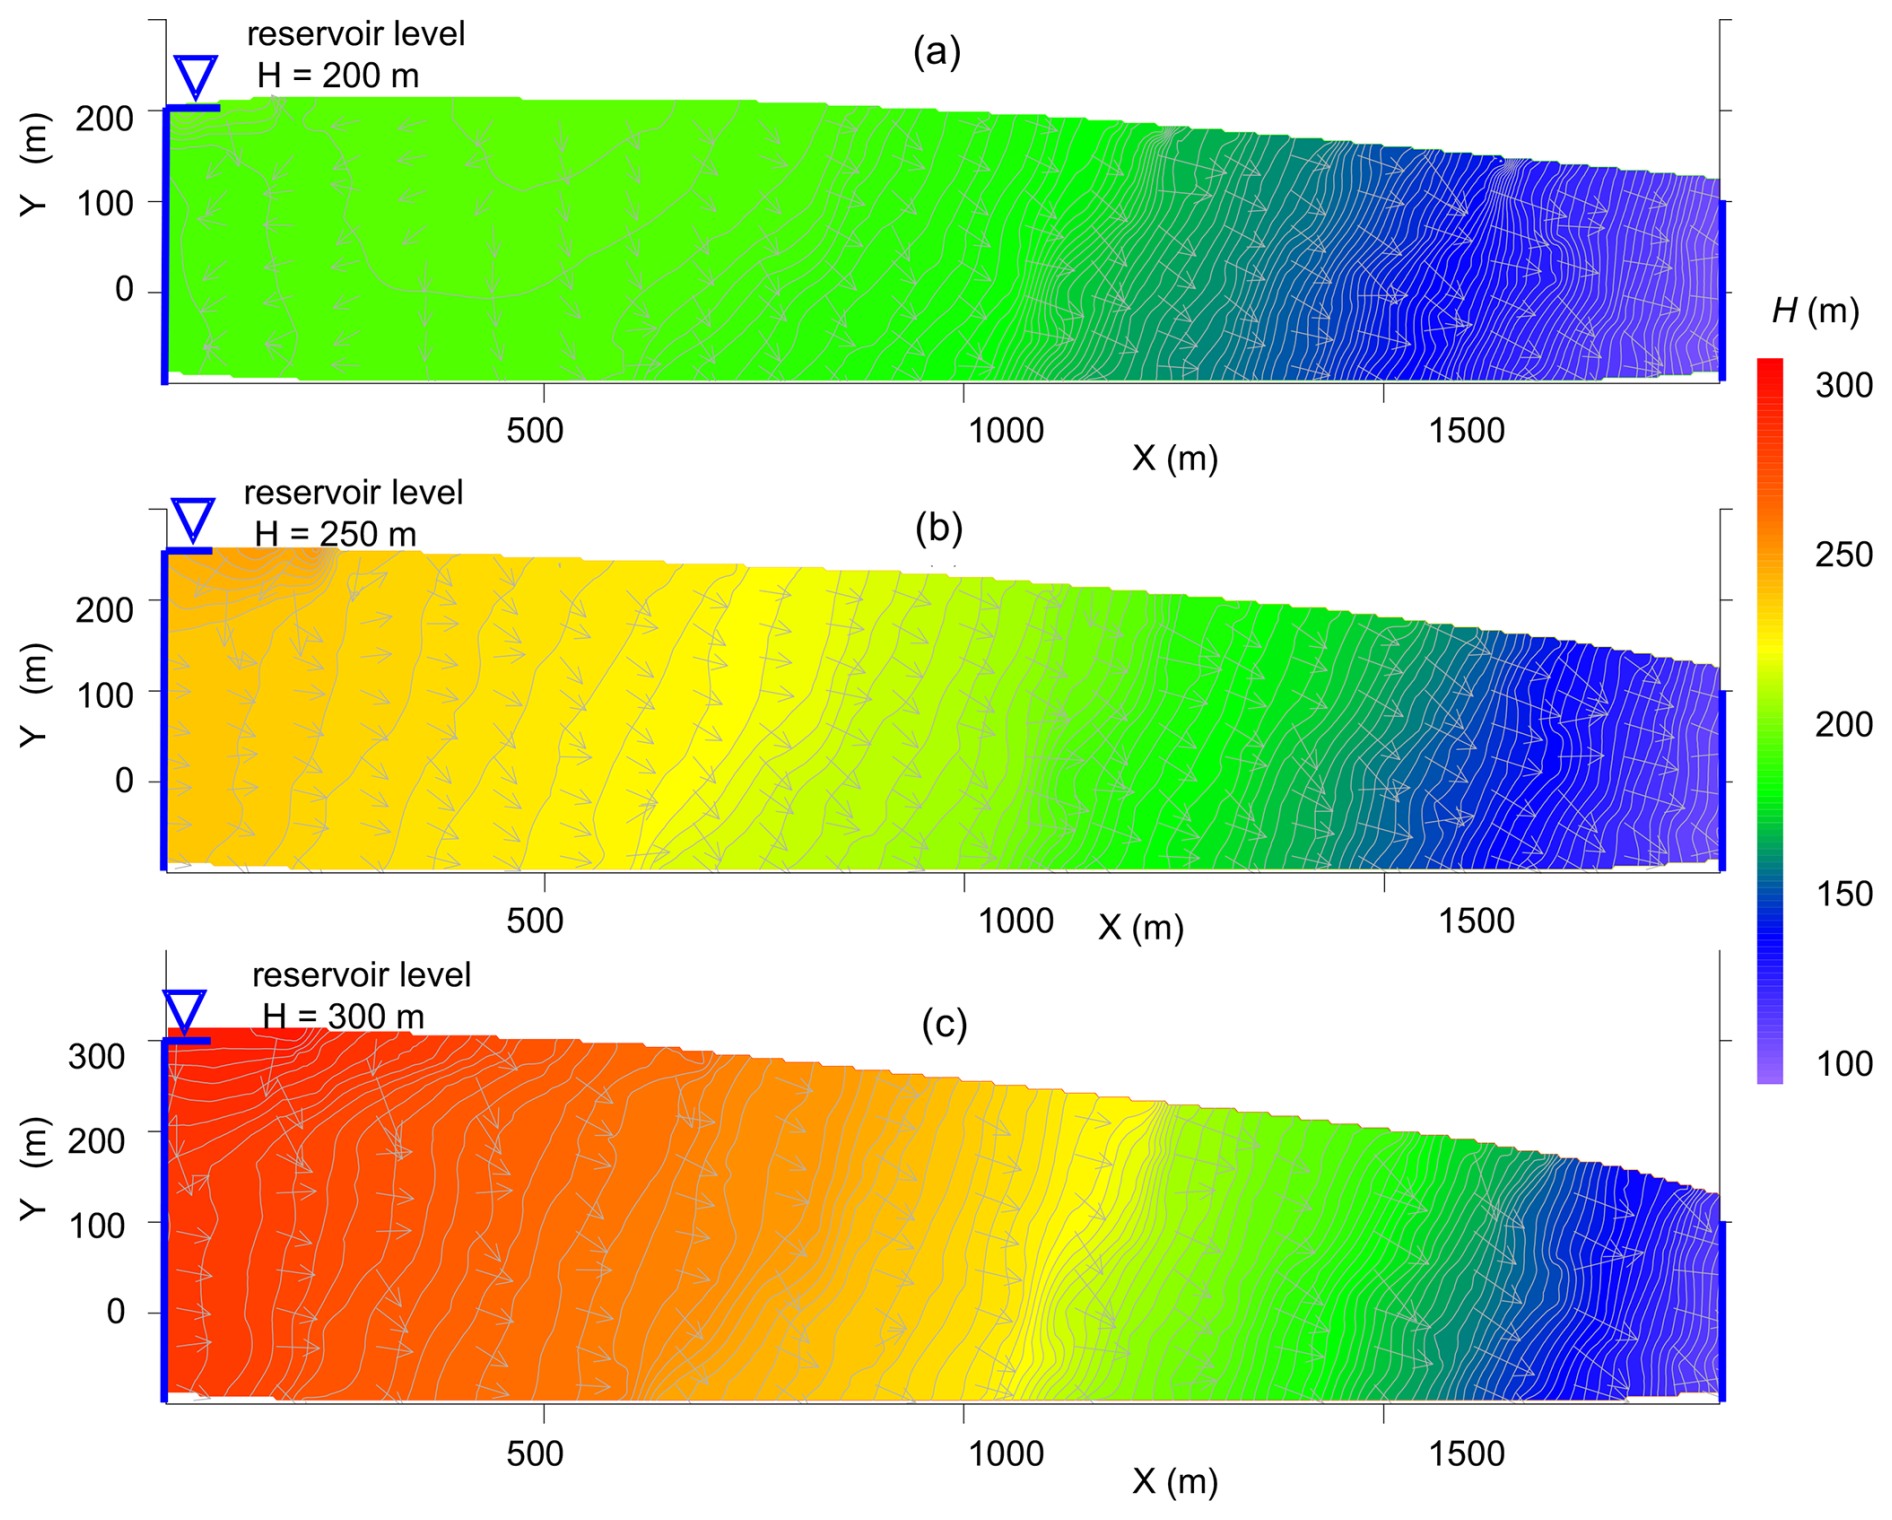
Figure 10Flow fields within the aquifer, which has evolved for 20 000 years under natural conditions, after the application of reservoir boundary conditions on the left side at: (a) 200, (b) 250, and (c) 300 m.
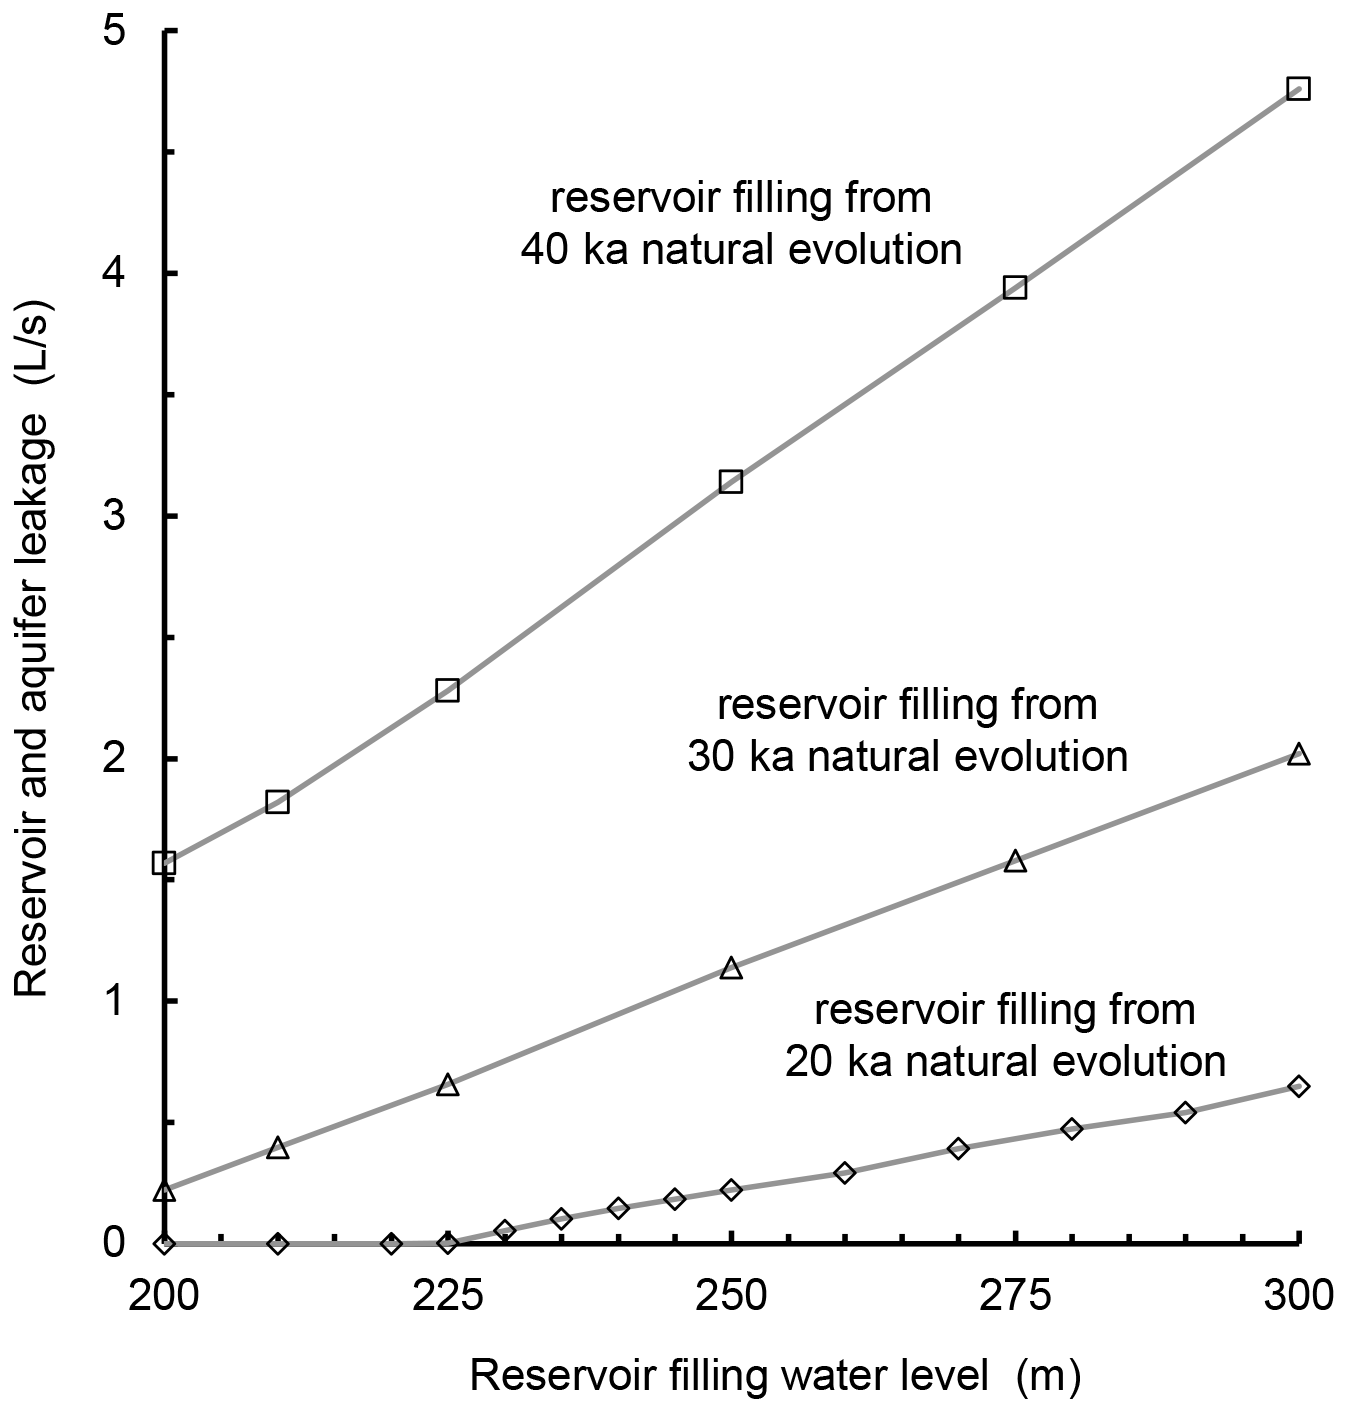
Figure 11Leakage as a function of reservoir level for aquifer after 20, 30 and 40 ka of evolution. The lateral width is 100 m.
To verify the relevance of LKB formation on reservoir leakage, as in the case of Luojiaao interfluve, we now apply reservoir boundary conditions to an evolved aquifer. The borehole data revealed that the natural water divide level is 50 to 80 m above the river, which roughly corresponds to the situation in our synthetic aquifer after 20 ka of evolution.
4.1 Reservoir leakage with various reservoir levels
First, we test the leakage through the aquifer at different reservoir water by applying constant head of 200, 250 and 300 m, on the left boundary (presenting reservoir) of the aquifer which has evolved for 20 ka. The flow fields are shown in Fig. 10. In case of 200 m, the groundwater divide still exists, although it is shifted towards the left boundary. However, the water still flows from the aquifer to the reservoir. When the water is raised to 250 m, as shown in Fig. 10b, the groundwater divide moves almost to the left boundary, so that the flow to the reservoir is only local (upper left), however, deeper the flow is directed from the reservoir to the aquifer. At 300 m, as shown in Fig. 10c, the flow direction is almost entirely from the reservoir to the aquifer.
Figure 11 shows the reservoir leakage at different water levels through the aquifer at different stage of evolution, assuming the lateral width of the aquifer is 100 m. For the aquifer after 20 ka of evolution under rainfall recharge, no leakage is observed below 225 m, as the water divide is still present and high enough to drive water from the aquifer to the reservoir. For 30 and 40 ka “old aquifers”, leakage is present at all levels applied and increases linearly with the reservoir level. The actual water level of the Geheyan reservoir is 200 m, which is below the level, where significant leakage may be expected from the model.
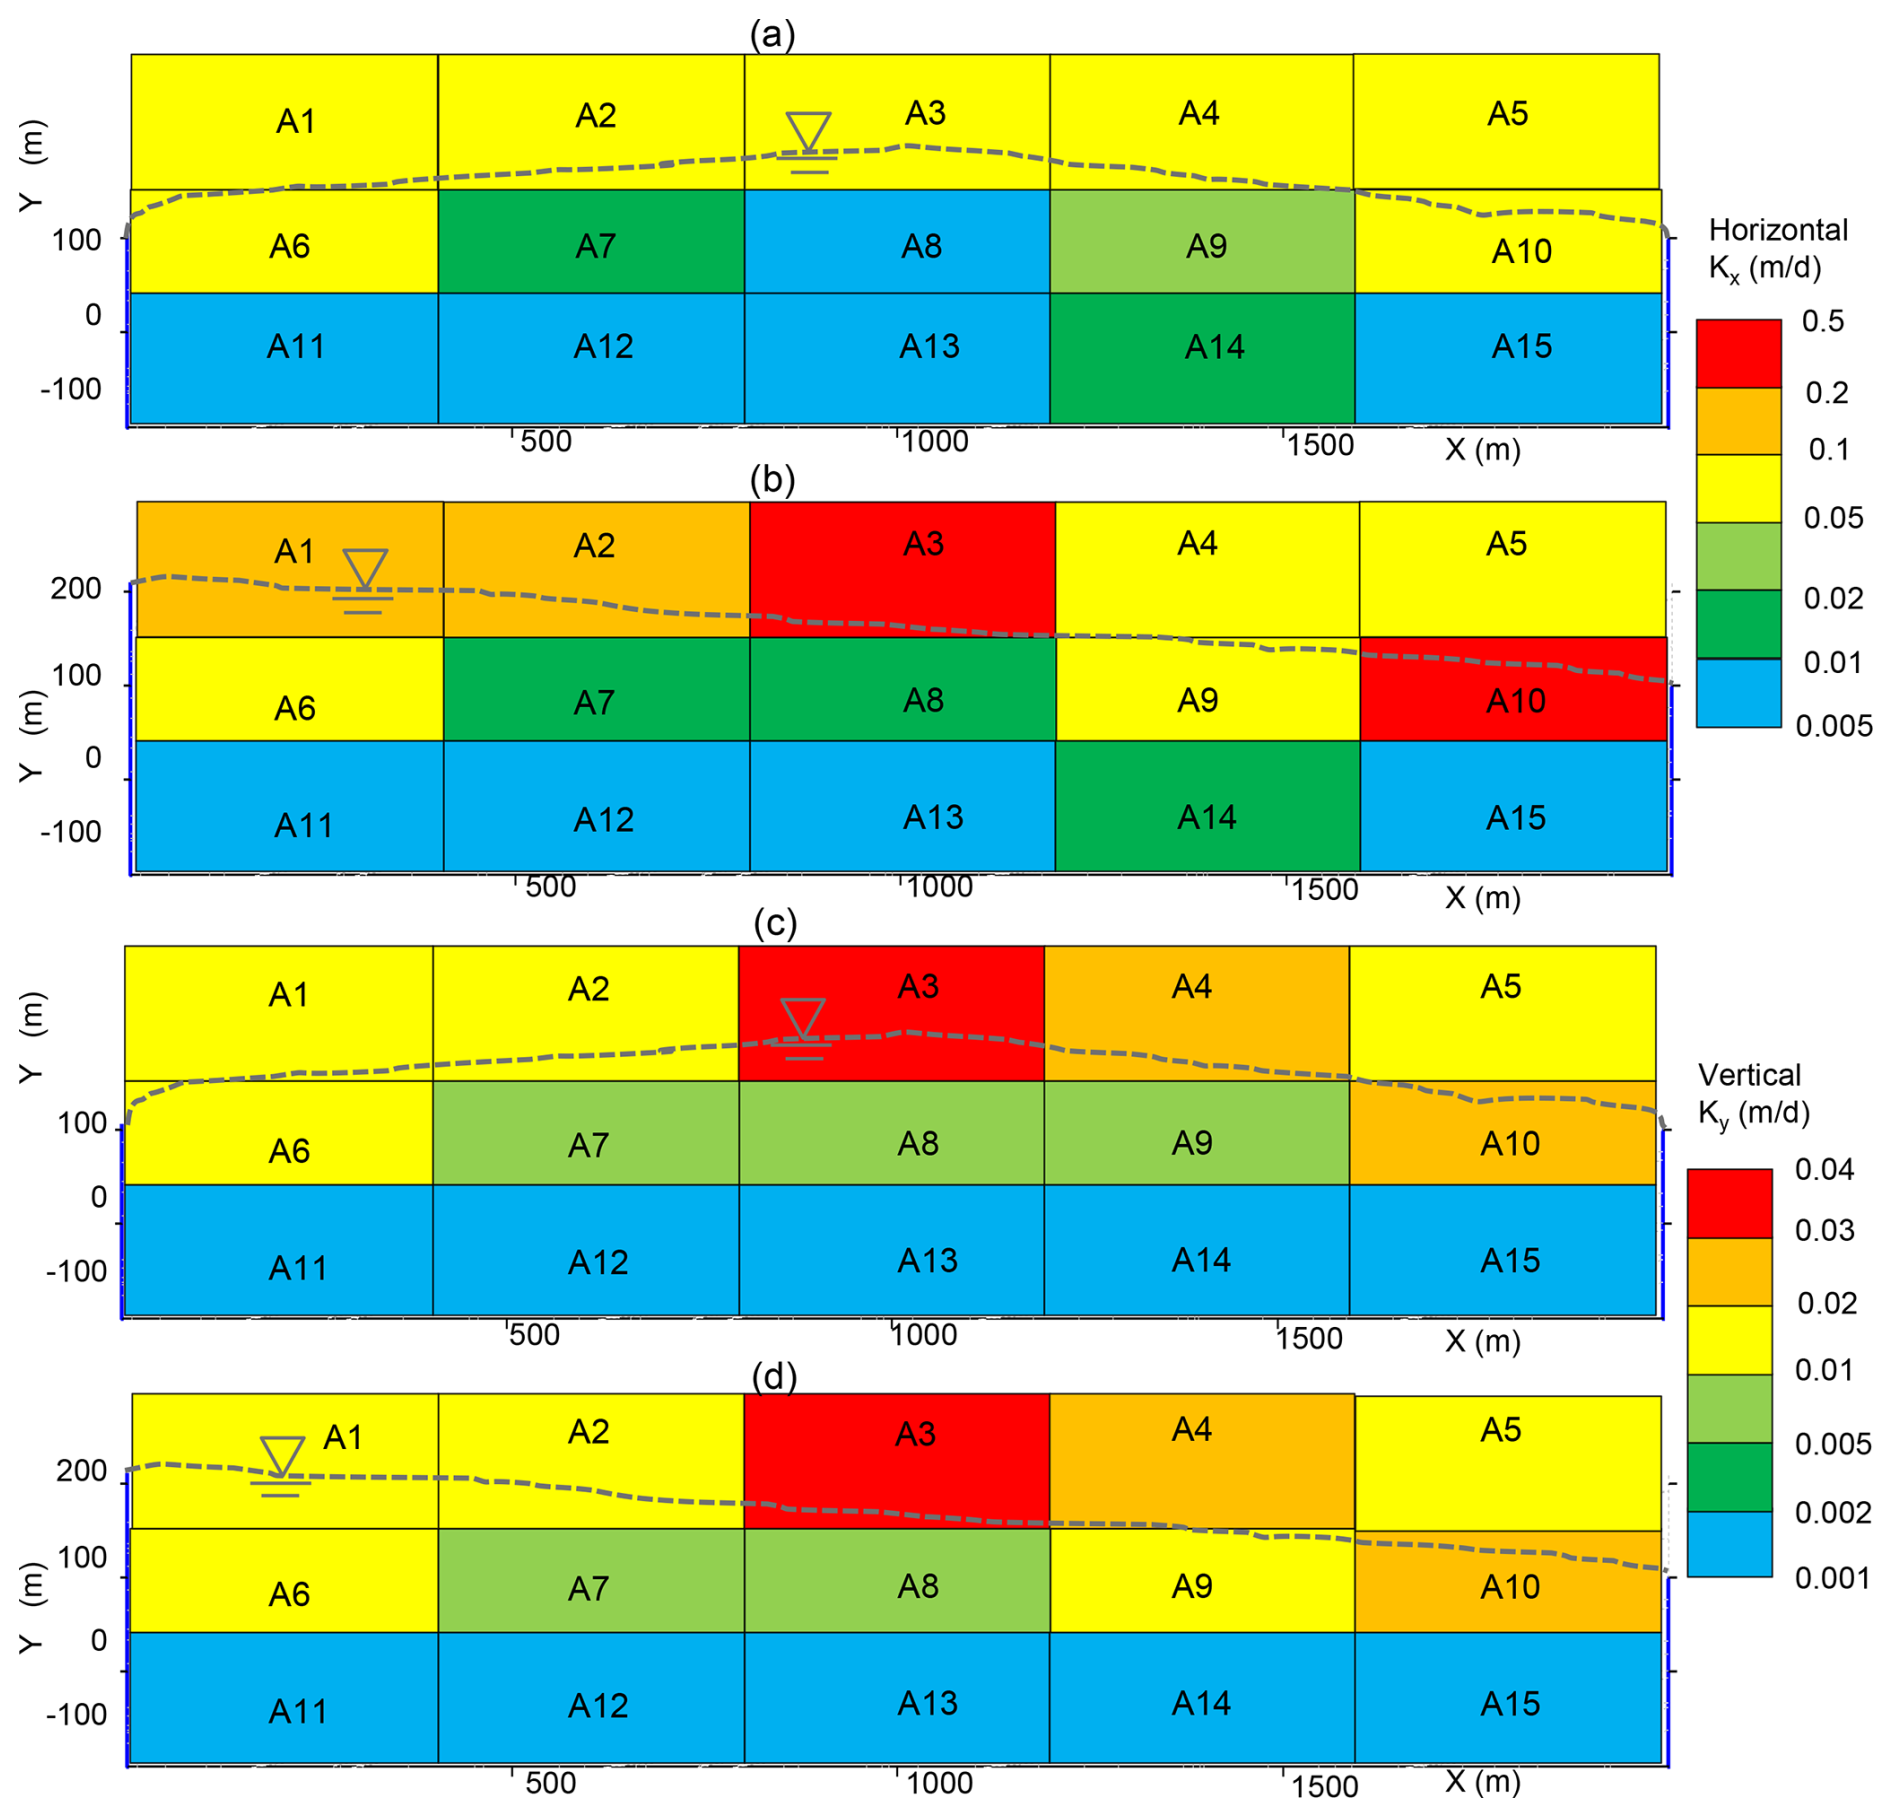
Figure 12Variation of hydraulic conductivity (K) in the karst aquifer before and after reservoir filling: horizontal (a) and vertical (c) distribution of hydraulic conductivity after 20 ka of natural evolution; horizontal (b) and vertical (d) distribution of K after one thousand years of reservoir conditions. The saturation ratio () of reservoir water is 0.8.
4.2 LKB changes before and after reservoir filling
If water in the river is aggressive to calcite, evolution of aquifer continues after the reservoir filling. We assume that the saturation ratio () of reservoir water is 0.8. Figure 12 shows the distribution of hydraulic conductivities in an aquifer, which has evolved naturally for 20 ka and then under the influence of reservoir for one thousand years. The subsections A8 and A13 maintained the lowest conductivity also after reservoir filling. Based on the conductivity analysis of the middle and lower primary sections, we conclude that the developed LKB remained a continuous, low-permeability barrier throughout 1000 years of reservoir filling conditions.
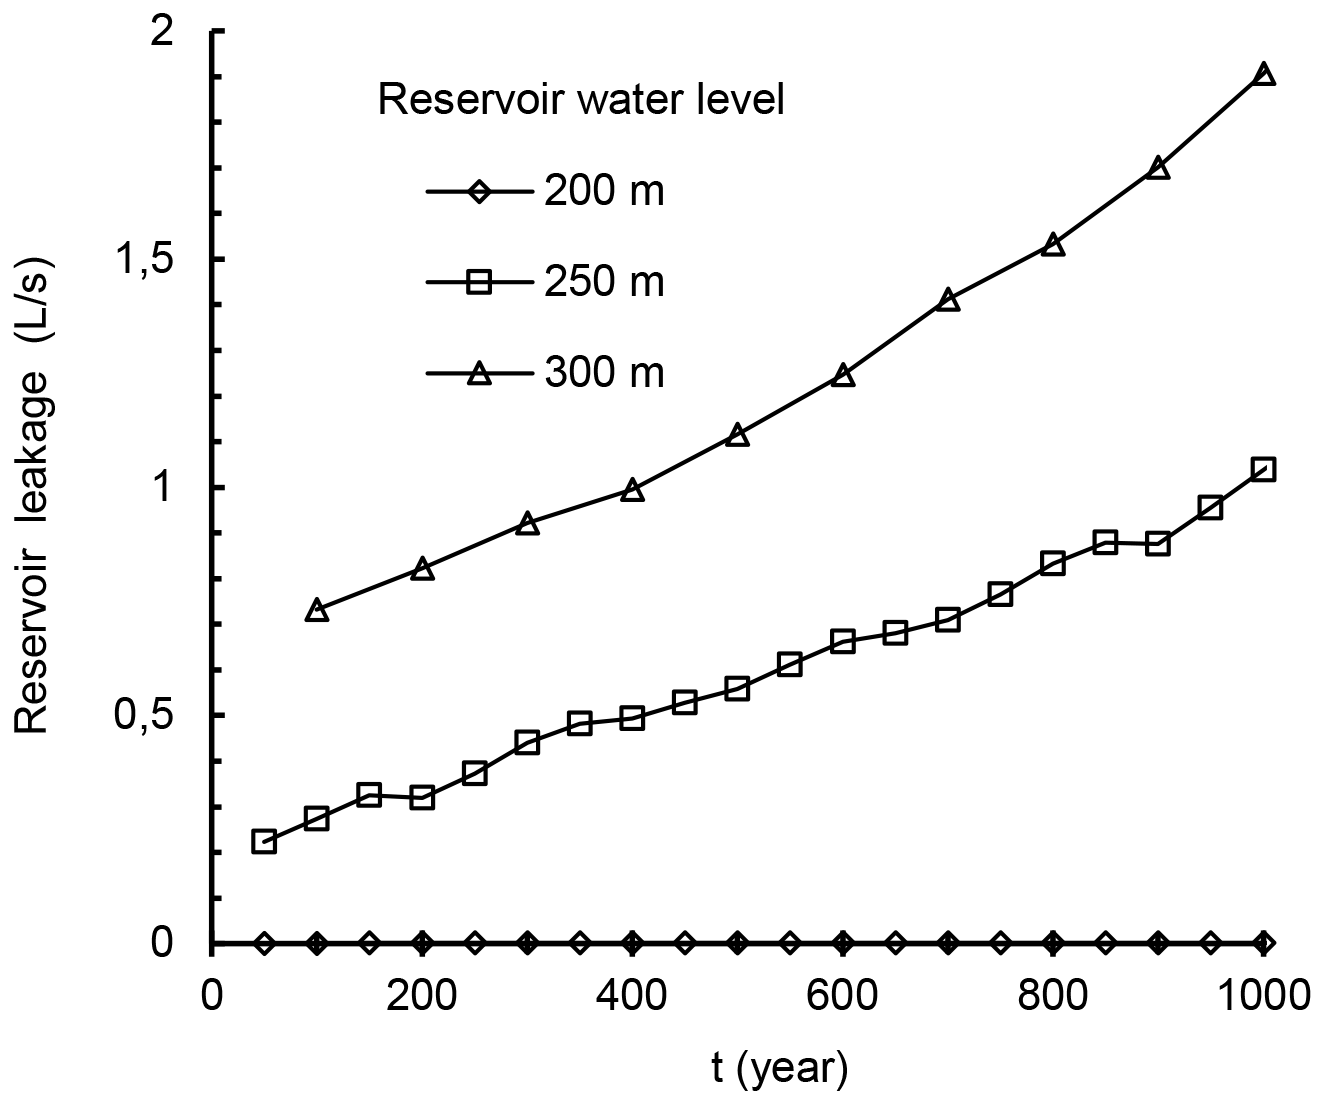
Figure 13Reservoir leakage through karst aquifers over one thousand years (assuming that the aquifer lateral width is 100 m).
Figure 13 illustrates the increasing trend of reservoir leakage over a 1000-year period of reservoir operation. Leakage rates were estimated assuming a lateral aquifer width of 100 m. At the 200 m reservoir level, no leakage occurs initially, resulting in no further evolution over time. For the 250 and 300 m levels, leakage remains below 2 L s−1 over the entire 1000-year span.
While the severity of leakage under these idealized conditions may appear acceptable during long-term reservoir operation, the final determination of a permissible water level must consider a broader range of factors. These include geological uncertainties, site-specific topographic features, and social safety requirements, all of which play critical roles in the decision-making process.
The fracture flow velocity distribution during the natural condition evolution process and under different water levels of the reservoir is shown in Fig. 14. Areas with low flow velocity in the central part indicate low permeability and weak karstification. The high-velocity flow region forms an arch-shaped region along the permeable fringe, which has developed along the descending water table.
In the water divide region, the LKB forms, mitigating flow beneath the fringe. Under reservoir conditions, leakage becomes substantial only when the reservoir level rises well above the LKB, causing the water divide to shift towards the reservoir and initiating flow along the permeable arch.
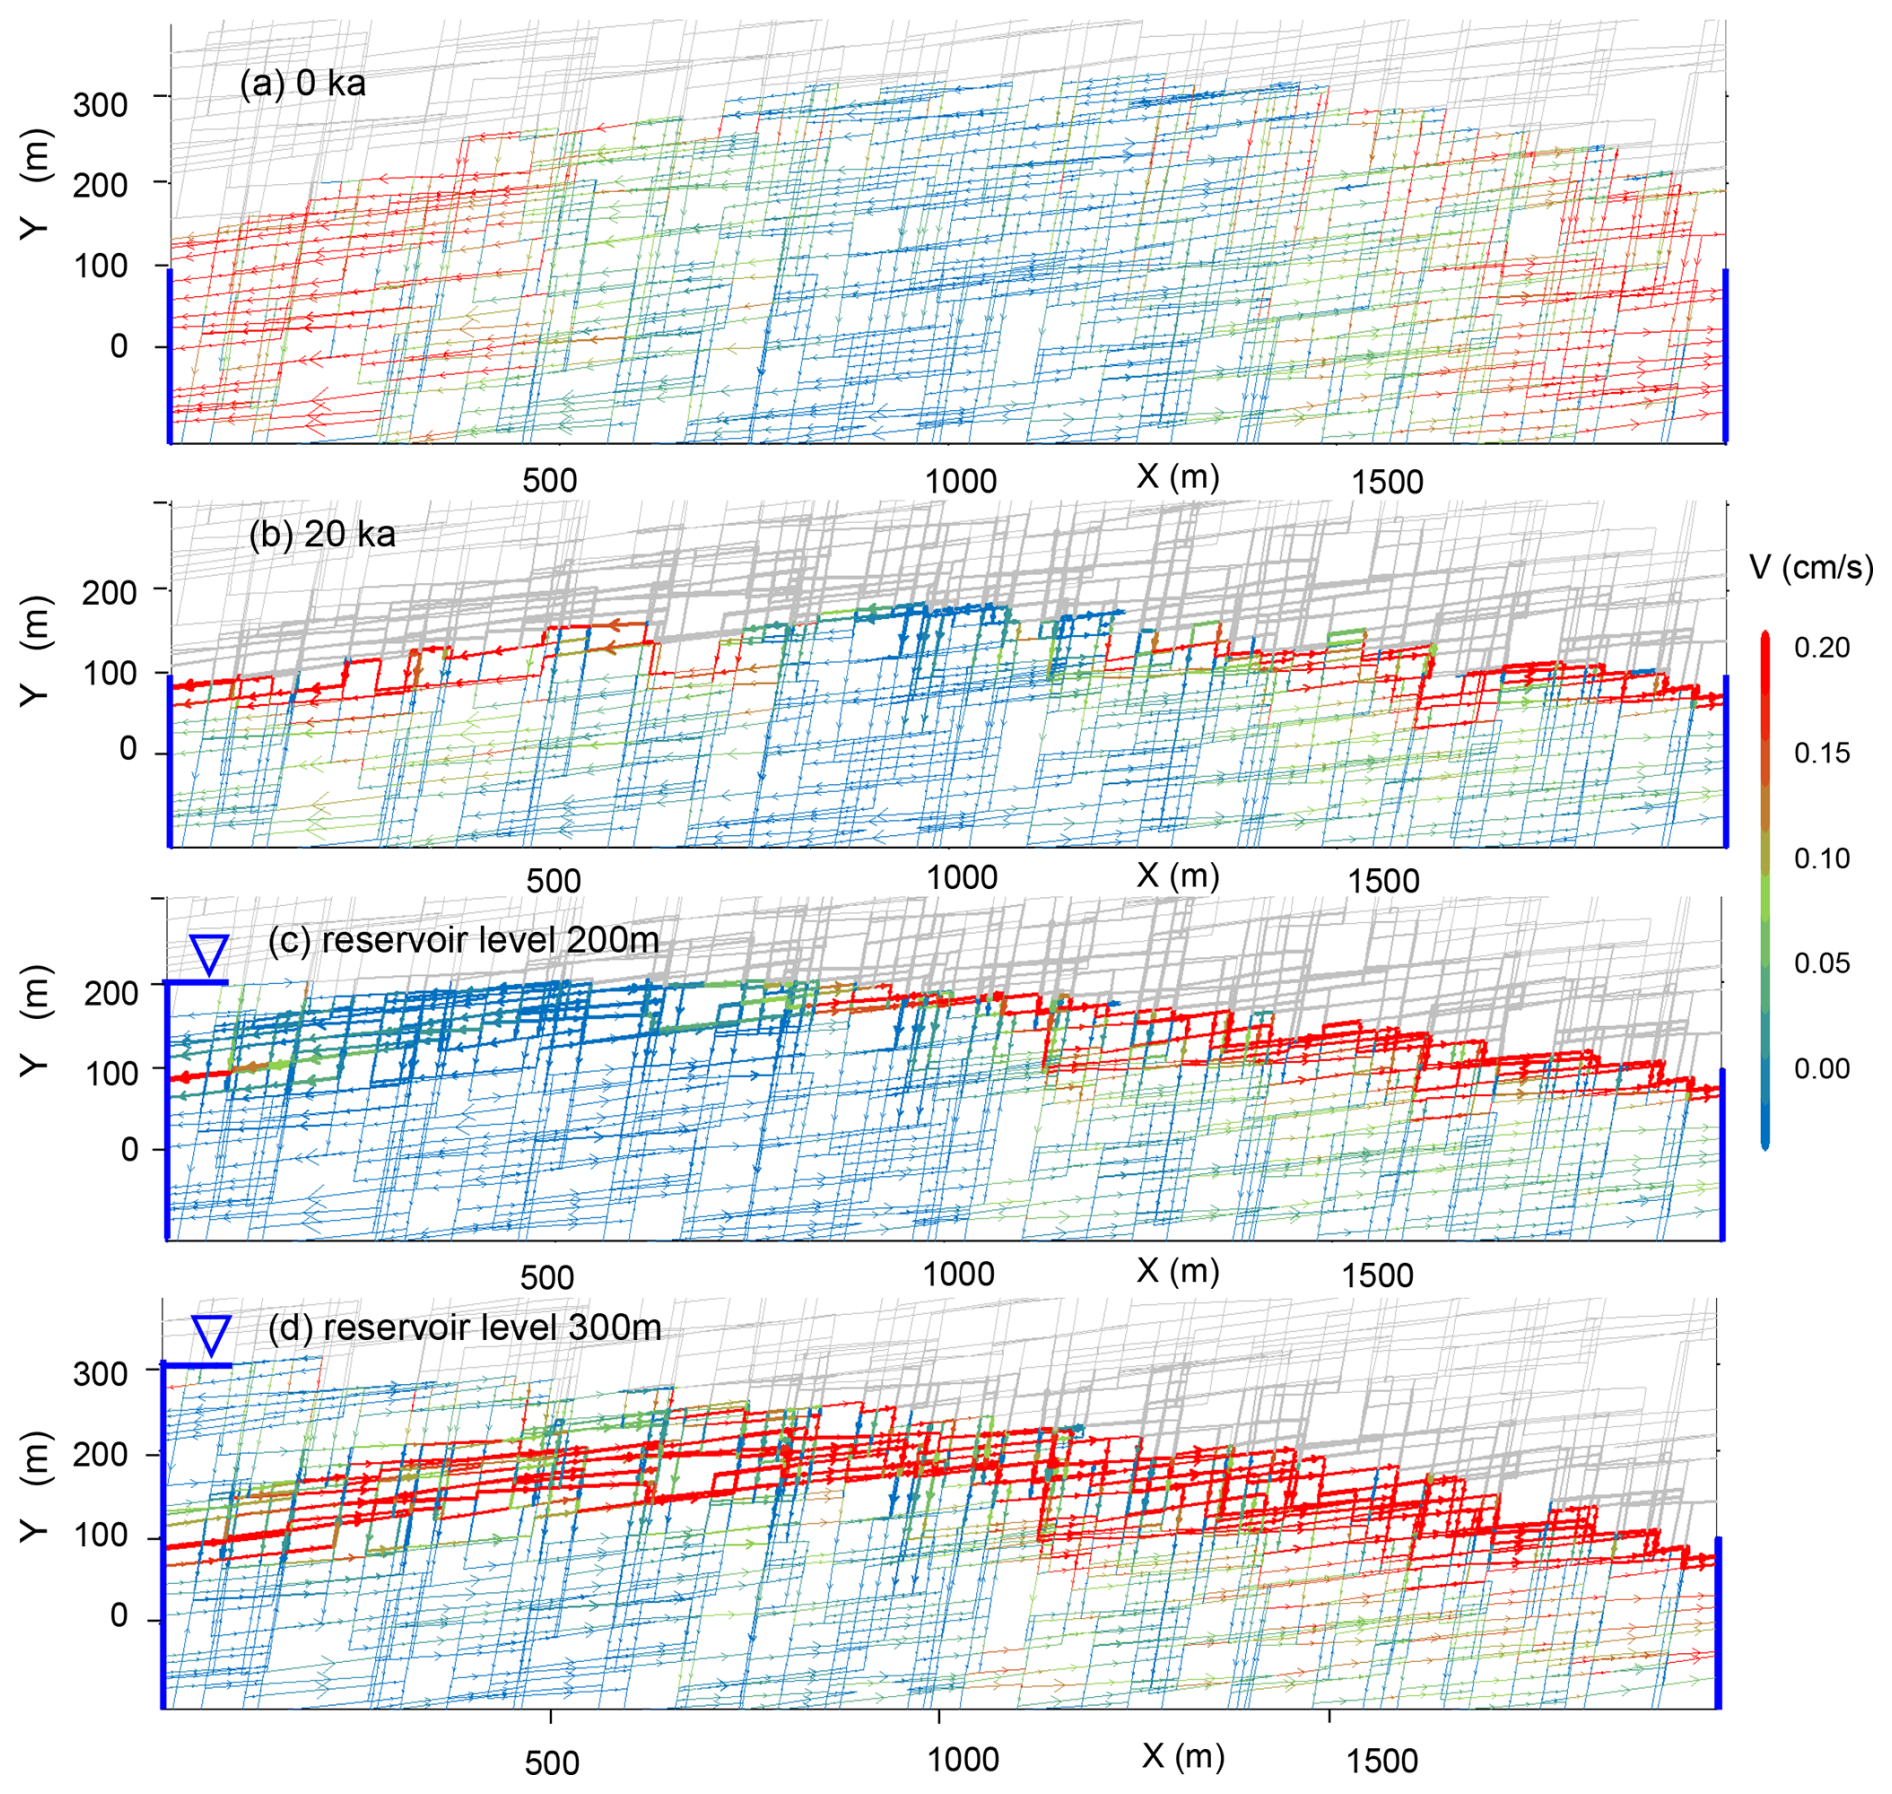
Figure 14Velocity distribution in the aquifer at different stages and conditions: (a) at the onset of karstification, (b) after 20 ka of natural evolution prior to reservoir impoundment, (c) after 20 ka of natural evolution and then with a reservoir level of 200 m, and (d) after 20 ka of natural evolution and with a reservoir level of 300 m.
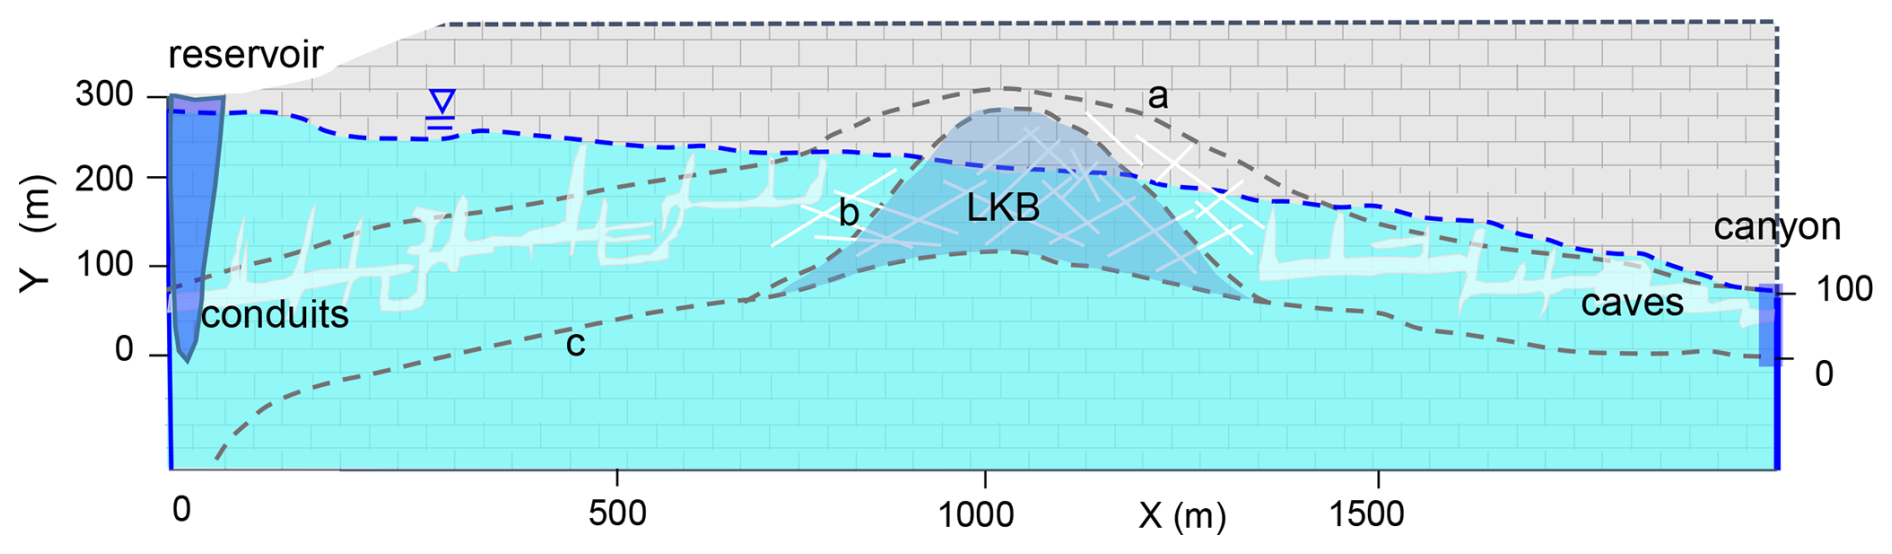
Figure 15Conceptualisation of the low-karstified rock-blocks (LKB) in the water divide region (shaded area between dotted lines b and c). The zone below line c exhibits minimal karstification. Line a indicates the naturally evolving water table prior to reservoir impoundment, with conduits and caves forming on both sides of this water level.
The concept of LKB, also demonstrated by our model, is summarized in Fig. 15. The dotted line is the evolving water table under natural conditions. Below line c, the fractures have experienced almost no karstification. Between lines a and b, well-karstified zones have developed on both sides of the descending water table area. In contrast, the region between lines b and c exhibits only moderate fracture widening. This section – designated as the LKB – acts as a naturally low-permeability zone that helps mitigate potential leakage from the reservoir.
In a broader sense, karstification presents a form of nucleation, where flow-induced dissolution and changes in porosity are coupled through feedback mechanisms (Edery et al., 2021; Molins et al., 2014). In unconfined aquifers under constant recharge conditions, dissolution is most intense near the water table. This process creates a highly permeable fringe that effectively channels inflow toward both sides of the water divide. As this fringe migrates downward across the aquifer cross-section, it leaves behind a distinctive porosity imprint. Simultaneously, it inhibits deeper penetration of the inflowing solution, favouring the preferential development of horizontal fractures. Moreover, flow along the water table increases progressively from the water divide toward the discharge points. As a result the water divide zone is less karstified than the regions close to the output. Similar anisotropic, directional changes, including fingers or preferential flows, has also been observed through experimental studies and other numerical simulations (Rege and Fogler, 1989; Shavelzon and Edery, 2022; Singurindy and Berkowitz, 2003).
Reservoir leakage is highly sensitive to the relative elevation of the reservoir water level and the elevation of the low-permeability-block (LKB). Identifying the water table position within the aquifer prior to reservoir impoundment can help locate the LKB and potentially reduce the need for costly engineering measures to prevent leakage (Zhou and Li, 1996).
The presented model simplifies the system by neglecting many of the complexities observed in natural settings. Karst aquifers evolve in different climatological, hydrological and geological settings, and they often undergo multiple phases of karstification over geological timescales, driven by varying hydrological and geochemical boundary conditions. In active tectonic areas, the structure and boundary conditions may change during the karstification, which may continuously adapt to the terrain uplift and/or valley entrenchment (Gabrovšek et al., 2014). Therefore, any modelling related to a specific site must include all information on the environment in which an aquifer has evolved (Class et al., 2021; Hartmann et al., 2013). The initial structure of an aquifer is typically far more intricate than assumed in the model, potentially including pre-existing preferential flow paths, geochemical heterogeneity (e.g., interbedded layers of less soluble rock), and temporal variability in recharge. Additionally, the model does not account for the development of the vadose zone, which plays a crucial role in modifying the permeability of layers above the water table and influences the geochemical characteristics of the water at the water table. These features could be systematically incorporated into the model to investigate their influence on aquifer evolution.
Despite its limitations, the model effectively serves as a proof of concept, offering valuable insights for hydraulic engineering in karst regions.
All data used in this research are publicly available. The data and code used for simulating fracture phreatic water table and karst evolution are available at https://github.com/jiaoyj/Fracturetokarst2024 (last access: 19 November 2025) and https://doi.org/10.5281/zenodo.13836069 (Jiao et al., 2024).
The supplement related to this article is available online at https://doi.org/10.5194/hess-29-6685-2025-supplement.
YJ contributed with writing of the original draft, methodology and modifying the code. FG contributed with conceptualization, review and editing of the manuscript. XW contributed with conceptualization, review and editing of the manuscript. QY contributed with the original code, conceptualization, methodology and review.
The contact author has declared that none of the authors has any competing interests.
Publisher's note: Copernicus Publications remains neutral with regard to jurisdictional claims made in the text, published maps, institutional affiliations, or any other geographical representation in this paper. While Copernicus Publications makes every effort to include appropriate place names, the final responsibility lies with the authors. Views expressed in the text are those of the authors and do not necessarily reflect the views of the publisher.
The authors would like to thank the Rock Fracture Work Group at China University of Geosciences (Beijing).
This research has been supported by the National Natural Science Foundation of China (grant nos. 42377061, 41772249, 41702279), the Guangxi Key R&D Project (grant no. AB25069394), the Guizhou Academician Workstation (grant no. KXJZ[2024]005), the China Geological Survey (grant no. DD20251205), and the China Scholarship Council. The work of Franci Gabrovšek was supported by the Slovenian Research and Innovation Agency (ARIS) Karst Research (grant no. P60119B) and the European Research Council project KARST (grant no. 101071836).
This paper was edited by Heng Dai and reviewed by Márk Somogyvári and one anonymous referee.
Buhmann, D. and Dreybrodt, W.: The kinetics of calcite dissolution and precipitation in geologically relevant situations of karst areas: 1. Open system, Chem. Geol., 48, 189–211, https://doi.org/10.1016/0009-2541(85)90046-4, 1985a.
Buhmann, D. and Dreybrodt, W.: The kinetics of calcite dissolution and precipitation in geologically relevant situations of karst areas: 2. Closed system, Chem. Geol., 53, 109–124, https://doi.org/10.1016/0009-2541(85)90024-5, 1985b.
Chen, Z., Auler, A. S., Bakalowicz, M., Drew, D., Griger, F., Hartmann, J., Jiang, G., Moosdorf, N., Richts, A., Stevanovic, Z., Veni, G., and Goldscheider, N.: The World Karst Aquifer Mapping project: concept, mapping procedure and map of Europe, Hydrogeol. J., 25, 771–785, https://doi.org/10.1007/s10040-016-1519-3, 2017.
Class, H., Bürkle, P., Sauerborn, T., Trötschler, O., Strauch, B., and Zimmer, M.: On the role of density-driven dissolution of CO2 in phreatic karst systems, Water Resour. Res., 57, e2021WR030912, https://doi.org/10.1029/2021WR030912, 2021.
Clemens, T., Hückinghaus, D., Liedl, R., and Sauter, M.: Simulation of the development of karst aquifers: role of the epikarst, Int. J. Earth Sci., 88, 157–162, https://doi.org/10.1007/s005310050252, 1999.
Desai, C. S. and Li, G. C.: A residual flow procedure and application for free surface flow in porous media, Adv. Water Resour., 6, 27–35, https://doi.org/10.1016/0309-1708(83)90076-3, 1983.
Detwiler, L. R. and Rajaram, H.: Predicting dissolution patterns in variable aperture fractures: Evaluation of an enhanced depth-averaged computational model, Water Resour. Res., 43, W04403, https://doi.org/10.1029/2006WR005147, 2007.
Dijk, P. E., Berkowitz, B., and Yechieli, Y.: Measurement and analysis of dissolution patterns in rock fractures, Water Resour. Res., 38, https://doi.org/10.1029/2001WR000246, 2002.
Dreybrodt, W.: The role of dissolution kinetics in the development of karst aquifers in limestone: a model simulation of karst evolution, J. Geol., 98, 639–655, https://doi.org/10.1086/629431, 1990.
Dreybrodt, W.: Principles of early development of karst conduits under natural and man-made conditions revealed by mathematical analysis of numerical models, Water Resour. Res., 32, 3085–3096, https://doi.org/10.1029/96WR01332, 1996.
Dreybrodt, W. and Kaufmann, G.: Physics and chemistry of dissolution on subaerially exposed soluble rocks by flowing water films, Acta Carsologica, 36, 137–154, https://doi.org/10.3986/ac.v36i3.169, 2007.
Dreybrodt, W., Gabrovšek, F., and Romanov, D.: Processes of speleogenessis: a modelling approach, Založba ZRC, https://doi.org/10.3986/9789610503125, 2005.
Eisenlohr, L., Meteva, K., Gabrovšek, F., and Dreybrodt, W.: The inhibiting action of intrinsic impurities in natural calcium carbonate minerals to their dissolution kinetics in aqueous H2O-CO2 solutions, Geochim. Cosmochim. Acta, 63, 3007–3017, https://doi.org/10.1016/S0016-7037(99)00157-X, 1999.
Edery, Y., Stolar, M., Porta, G., and Guadagnini, A.: Feedback mechanisms between precipitation and dissolution reactions across randomly heterogeneous conductivity fields, Hydrol. Earth Syst. Sci., 25, 5905–5915, https://doi.org/10.5194/hess-25-5905-2021, 2021.
Finenko, M. and Konietzky, H.: Numerical simulation of turbulent fluid flow in rough rock fracture: 2D case, Rock Mechanics and Rock Engineering, 57, 451–479, https://doi.org/10.1007/s00603-023-03551-5, 2024.
Ford, D. and Williams, P. D.: Karst hydrogeology and geomorphology, John Wiley & Sons, ISBN: 9780470849972, 2007.
Gabrovšek, F.: Evolution of early karst aquifers: from simple principles to complex models, Založba ZRC, https://doi.org/10.3986/9616358138, 2000.
Gabrovšek, F. and Dreybrodt, W.: Role of mixing corrosion in calcite-aggressive H2O-CO2-CaCO3 solutions in the early evolution of karst aquifers in limestone, Water Resour. Res., 36, 1179–1188, https://doi.org/10.1029/1999WR900337, 2000.
Gabrovšek, F. and Dreybrodt, W.: A model of the early evolution of karst aquifers in limestone in the dimensions of length and depth, J. Hydrol., 240, 206–224, https://doi.org/10.1016/S0022-1694(00)00323-1, 2001.
Gabrovšek, F. and Dreybrodt, W.: Karstification in unconfined limestone aquifers by mixing of phreatic water with surface water from a local input: a model, J. Hydrol., 386, 130–141, https://doi.org/10.1016/j.jhydrol.2010.03.015, 2010.
Gabrovšek, F., Häuselmann, P., and Audra, P.: “Looping caves” versus “water table caves”: the role of base-level changes and recharge variations in cave development, Geomorphology, 204, 683–691, https://doi.org/10.1016/j.geomorph.2013.09.016, 2014.
Gabrovšek, F. and Dreybrodt, W.: Early hypogenic carbonic acid speleogenesis in unconfined limestone aquifers by upwelling deep-seated waters with high CO2 concentration: a modelling approach, Hydrol. Earth Syst. Sci., 25, 2895–2913, https://doi.org/10.5194/hess-25-2895-2021, 2021.
Harbaugh, A. W., Banta, E. R., Hill, M. C., and McDonald, M. G.: MODFLOW-2000, the US Geological Survey modular ground-water model: User guide to modularization concepts and the ground-water flow process, U.S. GEOLOGICAL SURVEY, Open-File Report 00-92, https://doi.org/10.3133/ofr200092, 2000.
Hartmann, A., Weiler, M., Wagener, T., Lange, J., Kralik, M., Humer, F., Mizyed, N., Rimmer, A., Barberá, J. A., Andreo, B., Butscher, C., and Huggenberger, P.: Process-based karst modelling to relate hydrodynamic and hydrochemical characteristics to system properties, Hydrol. Earth Syst. Sci., 17, 3305–3321, https://doi.org/10.5194/hess-17-3305-2013, 2013.
Hubinger, B. and Birk, S.: Influence of initial heterogeneities and recharge limitations on the evolution of aperture distributions in carbonate aquifers, Hydrol. Earth Syst. Sci., 15, 3715–3729, https://doi.org/10.5194/hess-15-3715-2011, 2011.
Jiang, Q., Yao, C., Ye, Z., and Zhou, C.: Seepage flow with free surface in fracture networks, Water Resour. Res., 49, 176–186, https://doi.org/10.1029/2012WR011991, 2013.
Jiang, X., Wan, L., Ge, S., Cao, G., Hou, G., and Hu, F.: A quantitative study on accumulation of age mass around stagnation points in nested flow systems, Water Resour. Res., 48, https://doi.org/10.1029/2012WR012509, 2012.
Jiao, Y., Gao, Y., Qiu, Z., Wang, Y., Xie, Y., Xue, L., and Yu, Q.: Fracturetokarst2024: karst phreatic flow and evolution under rainfall conditions, Zenodo [code] https://doi.org/10.5281/zenodo.13836069, 2024.
Jing, L., Ma, Y., and Fang, Z.: Modelling of fluid flow and solid deformation for fractured rocks with discontinuous deformation analysis (DDA) method, Int. J. Rock Mech. Min. Sci., 38, 343–355, https://doi.org/10.1016/S1365-1609(01)00005-3, 2001.
Kang, Q., Zhang, D., and Chen, S.: Simulation of dissolution and precipitation in porous media, J. Geophys. Res., 108, https://doi.org/10.1029/2003JB002504, 2003.
Kaufmann, G.: Modelling unsaturated flow in an evolving karst aquifer, J. Hydrol., 276, 53–70, https://doi.org/10.1016/S0022-1694(03)00037-4, 2003.
Liang, X., Liu, Y., Jin, M., Lu, X., and Zhang, R.: Direct observation of complex Tóthian groundwater flow systems in the laboratory, Hydrol. Process., 24, 3568–3573, https://doi.org/10.1002/hyp.7758, 2010.
Liu, Z. and Dreybrodt, W.: Dissolution kinetics of calcium carbonate minerals in H2O-CO2 solutions in turbulent flow: The role of the diffusion boundary layer and the slow reaction H2O + CO2→ H HCO, Geochim. Cosmochim. Acta, 61, 2879–2889, https://doi.org/10.1016/S0016-7037(97)00143-9, 1997.
Lomize, G. M.: Flow in fractured rocks, Gosenergoizdat, Moscow, 127–197, 1951.
Milanović, P. T.: Geological Engineering in Karst: dams, reservoirs, grouting, groundwater protection, water tapping, tunneling: with 190 figures, Zebra publishing ltd., Belgrade, ISBN: 9788674891254, 2000.
Milanović, P. T.: Engineering karstology of dams and reservoirs, CRC Press, Boca Raton, https://doi.org/10.1201/9780429453403, 2018.
Molins, S., Trebotich, D., Yang, L., Ajo-Franklin, J. B., Ligocki, T. J., Shen, C., and Steefel, C. I.: Pore-scale controls on calcite dissolution rates from flow-through laboratory and numerical experiments, Environ. Sci. Technol., 48, 7453–7460, https://doi.org/10.1021/es5013438, 2014.
Nogues, J. P., Fitts, J. P., Celia, M. A., and Peters, C. A.: Permeability evolution due to dissolution and precipitation of carbonates using reactive transport modelling in pore networks, Water Resour. Res., 49, 6006–6021, https://doi.org/10.1002/wrcr.20486, 2013.
Rege, S. D. and Fogler, H. S.: Competition among flow, dissolution, and precipitation in porous media, AIChE J., 35, 1177–1185, https://doi.org/10.1002/aic.690350713, 1989.
Rhoades, R. and Sinacori, M. N.: Pattern of ground-water flow and solution, Journal of Geology, 49, 785–794, 1941.
Romanov, D., Gabrovšek, F., and Dreybrodt, W.: Dam sites in soluble rocks: a model of increasing leakage by dissolutional widening of fractures beneath a dam, Engineering Geology, 70, 17–35, https://doi.org/10.1016/S0013-7952(03)00073-5, 2003.
Romanov, D., Gabrovšek, F., and Dreybrodt, W.: Leakage below dam sites in limestone terrains by enhanced karstification: a modelling approach, Environmental Geology, 51, 775–779, https://doi.org/10.1007/s00254-006-0394-y, 2007.
Sanderson, C. and Curtin, R.: Armadillo: a template-based C library for linear algebra, Journal of Open Source Software, 1, 26, https://doi.org/10.21105/joss.00026, 2016.
Sanderson, C. and Curtin, R.: Practical sparse matrices in C with hybrid storage and template-based expression optimisation, Mathematical and Computational Applications, 24, 70, https://doi.org/10.3390/mca24030070, 2019.
Shavelzon, E. and Edery, Y.: Modeling of Reactive Transport in Porous Rock: Influence of Peclet Number, EGU General Assembly 2022, Vienna, Austria, 23–27 May 2022, EGU22-8059, https://doi.org/10.5194/egusphere-egu22-8059, 2022.
Shen, J., Wan, J., Xu, S., Shi, B., and Zhang, T.: The effect of large reservoir impoundment on karst water environment in carbonate rock area- taking Geheyan reservoir as an example, Carsologica Sinica, 16, 397–402, http://zgyr.karst.ac.cn/article/id/19970414 (last access: 19 November 2025), 1997 (in Chinese).
Singurindy, O. and Berkowitz, B.: Evolution of hydraulic conductivity by precipitation and dissolution in carbonate rock, Water Resour. Res., 39, W1016, https://doi.org/10.1029/2001WR001055, 2003.
Smerdon, B. D., Mendoza, C. A., and McCann, A. M.: Quantitative investigations of the hydraulic connection between a large reservoir and a buried valley aquifer in southern Alberta, Canadian Geotechnical Journal, 42, 1461–1473, https://doi.org/10.1139/t05-065, 2005.
Su, B., Zhan, M., and Zhao, J.: The model test of the flow in smooth fracture and the study of its mechanism, Journal of Hydraulic Engineering, 5, 19–24, 1994 (in Chinese).
Tóth, J.: A theory of groundwater motion in small drainage basins in central Alberta, Canada, Journal of Geophysical Research, 67, 4375–4388, https://doi.org/10.1029/JZ067i011p04375, 1962.
Wan, J., Chao, N., Shen, J., and Cai, J.: Study on the carbon cycle in a karst system at the Luojiaao interfluve along the Qingjiang River of western Hubei, China, Carsologica Sinica, 18, 123–128, https://doi.org/10.3969/j.issn.1001-4810.1999.02.004, 1999 (in Chinese).
Wang, E.: Seepage calculation method in fissure networks on vertical section, Hydrogeology & Engineering Geology, 20, 27–29, 1993 (in Chinese).
Wang, X., Jiang, X., Wan, L., Ge, S., and Li, H.: A new analytical solution of topography-driven flow in a drainage basin with depth-dependent anisotropy of conductivity, Water Resour. Res., 47, W09603, https://doi.org/10.1029/2011WR010507, 2011.
Xu, R. and Yan, F.: Karst geology and engineering treatment in the Geheyan Project on the Qingjiang River, China, Engineering Geology, 76, 155–164, https://doi.org/10.1016/j.enggeo.2004.06.012, 2004.
Yu, Q., Shen, J., Wan, J., and Ohnishi, Y.: Some investigation on early organization of Karst system, Journal of China University of Geosciences, 10, 314–321, http://en.cnki.com.cn/Article_en/CJFDTOTAL-ZDDY199904007.htm (last access: 19 November 2025), 1999.
Yuan, D., Zhu, D., Weng, J., Zhu, X., Han, X., Wang, X., Cai, G., Zhu, Y., Cui, G., and Deng, Z.: Karst of China, Geological Publishing House, Beijing, ISBN: 7116014683, 1993 (in Chinese).
Yuan, D., Liu, Z., Lin, Y., Shen, J., He, S., Xu, S., Yang, L., Li, B., Qin, J., Cai, W., Cao, J., Zhang, M., Jiang, Z., and Zhao, J.: Karst dynamic system of China, Geological Publishing House, Beijing, ISBN: 7116037128, 2002 (in Chinese).
Zhang, R., Liang, X., Jin, M., Wan, L., and Yu, Q.: Fundamentals of hydrogeology, Geological Publishing House, Beijing, ISBN: 9787116109421, 2018 (in Chinese).
Zheng, H., Liu, D. F., Lee, C. F., and Tham, L. G.: A new formulation of Signorini's type for seepage problems with free surfaces, International Journal for Numerical Methods in Engineering, 64, 1–16, https://doi.org/10.1002/nme.1345, 2005.
Zhou, Z. and Li, Y.: Seepage estimation of the rock-mass in divide area at Geheyan Water Conservancy Project in Qingjiang River, Journal of Hohai University (Natural Sciences), 24, 101–104, 1996 (in Chinese).
- Abstract
- Introduction
- Modelling evolution of unconfined discrete fracture network
- Karstification of an unconfined interfluve aquifer with uniform recharge
- The influence of LKB on reservoir leakage
- Discussion and conclusions
- Data availability
- Author contributions
- Competing interests
- Disclaimer
- Acknowledgements
- Financial support
- Review statement
- References
- Supplement