the Creative Commons Attribution 4.0 License.
the Creative Commons Attribution 4.0 License.
 | 18 Nov 2025
Growth in agricultural water demand aggravates water supply-demand risk in arid Northwest China: more a result of anthropogenic activities than climate change
Yang You
Pingan Jiang
Yakun Wang
Wene Wang
Dianyu Chen
Xiaotao Hu
The dynamic evolution pattern of regional water supply-demand risks under the combined effects of climate change and human activities remains unclear, particularly against the backdrop of agricultural expansion in arid regions. This study focuses on the Tailan River Basin (TRB), a typical arid watershed in China and a vital base for high-quality fruit and grain production. By integrating the PLUS (Patch-generating Land Use Simulation) and InVEST (Integrated Valuation of Ecosystem Services and Tradeoffs) models, we constructed a water supply-demand risk assessment framework encompassing 24 climate-land change scenarios to quantify their impacts on regional water resource patterns and risks. Results reveal that climate change profoundly influences water supply, while land use significantly affects water demand. Under the Balanced Economic and Ecological Development Scenario (BES), 531.2 km2 of additional cultivated land could be developed by 2050. However, this cultivated land expansion leads to a sharp increase in irrigation water demand, with the minimum demand reaching 4.87 × 10⁸ m3, while the maximum regional water supply is only 0.16 × 10⁸ m3, resulting in a significant supply-demand gap (> 4.71 × 10⁸ m3). The risk assessment framework indicates that by 2050, the entire TRB will face a water supply-demand crisis, with at least 46 % of the area experiencing severe (Level III) or higher risks. The study demonstrates that continuous cultivated land expansion driven by agricultural activities – which drastically increases irrigation water demand – is the root cause of intensifying water supply-demand conflicts and high risks in the TRB. By 2050, the proportion of irrigation water to total water use will exceed 70 %, regardless of scenario. These findings underscore the necessity of deeply integrating multidisciplinary approaches within a water risk framework to elucidate land-eco-hydrological feedback mechanisms and better address water security challenges under climate change. The results provide a scientific basis for optimizing regional water-land resource allocation and promoting agro-ecological sustainable development.
- Article
(8695 KB) - Full-text XML
-
Supplement
(743 KB) - BibTeX
- EndNote


Irrigation water demand surge critically amplifies water supply-demand risk in arid regions.
Water resources in arid regions are more susceptible to anthropogenic impacts.
Regional water supply-demand risk continues to rise through the mid-21st century.
Drylands, covering 41 % of the Earth's land area, are critical components of global terrestrial ecosystems. They not only support 38 % of the world's population but also host approximately one-third of the planet's biodiversity hotspots (Berdugo et al., 2017; Li et al., 2021). However, these regions – predominantly located in developing countries (Huang et al., 2016; Chen et al., 2024c) – face extreme water scarcity and exhibit high ecological fragility (Li et al., 2021), making them particularly sensitive to human activities (especially agricultural practices) and climate change. Northwestern China's arid regions serve as a typical example of the interplay between ecological vulnerability and agricultural pressure. Since 1980, cultivated land in this area has expanded significantly by 25.87 % (Zhu et al., 2021), profoundly altering water and land resource allocation and ecological balance (Liu et al., 2025b). Although climate change has led to increased runoff (Li et al., 2025b) and rainfall (Yao et al., 2022) in the region, providing more available water resources (Chen et al., 2023a), agricultural activities dominated by continuous cultivated land expansion have sharply intensified regional water stress. Irrigation water use has now become the major consumer of water resources. Simultaneously, cultivated land expansion has elevated evapotranspiration levels (Zhu et al., 2025), and inefficient irrigation practices (e.g., the irrigation water use efficiency in Xinjiang is only 0.585) have further exacerbated groundwater over-extraction (Yan et al., 2025) and soil salinization (Perez et al., 2024). These factors have intensified the contradiction between water supply and demand, continuously constraining sustainable water use options, and amplifying ecological vulnerability (Huggins et al., 2022) and food security risks (Jones et al., 2024).
The imbalance between water supply and demand is influenced by both climate change and human activities (particularly agricultural practices). Climate change profoundly affects key processes in the hydrological cycle, including alterations in precipitation and evapotranspiration (Konapala et al., 2020). The AR6 Synthesis Report highlights that for every 0.5 °C increase in global temperature, extreme heatwaves, heavy rainfall, and regional droughts become more frequent and severe (Mukherji, 2023), elevating risks of extreme floods (surplus) and droughts (deficit). Research indicates that changes in critical climate variables (precipitation, temperature, evapotranspiration) significantly disrupt runoff patterns and alter the availability of surface water resources (Lipczynska-Kochany, 2018). Simultaneously, agricultural activities (e.g., irrigation) directly impact the water cycle by modifying hydrological processes such as evaporation, soil moisture, and water storage, while also affecting water and energy balances through artificially enhanced evaporation (Yan et al., 2025). Furthermore, agricultural activities directly shape water supply and demand by altering water use patterns and intensity, thereby creating bidirectional feedback loops with the water cycle and ecosystems (Chen et al., 2023b). Under the influence of climate change and agricultural activities, the mismatch between the natural endowment of water resources (in terms of spatiotemporal distribution) and human demands further exacerbates regional water scarcity, making it increasingly challenging to meet both ecological and societal needs (Caretta et al., 2022).
This mismatch and dislocation are jointly driven by climate change and human activities (particularly agricultural practices). Studies have demonstrated that the increased runoff observed during the 20th century resulted from the combined effects of climate change and land cover changes (Piao et al., 2007). Land use changes can influence precipitation patterns through modifications in surface energy balance, hydrological cycles, and large-scale atmospheric circulation (Zhang et al., 2025a), while climate change exacerbates the impacts of land alterations by reshaping the hydrological cycle, thereby aggravating meteorological extremes (e.g., floods and droughts). Furthermore, the relative influences of climate change and agricultural activities vary significantly across different environmental issues. Climate change dominates changes in runoff (Zeng et al., 2024), ecosystem services (Jia et al., 2024), and vegetation dynamics (Hu et al., 2025). In contrast, land use changes exert greater impacts than climate change on terrestrial productivity (He et al., 2025), carbon use efficiency (Chen et al., 2024b), and soil variables (Ding et al., 2024). However, the relative contributions of climate change and land use to water supply-demand balance, as well as how their interactions shape the spatial patterns and temporal evolution of supply-demand risks, remain poorly understood. Existing studies on water supply and demand have predominantly focused on unilateral impacts of either land use (Deng et al., 2024; Wen and Liu, 2025) or climate change (Gharib et al., 2023; Li et al., 2024). Simultaneously considering the effects of both climate and land use changes on water supply-demand balance is crucial and necessary (Liu et al., 2022; Guo et al., 2023). Therefore, investigating the response mechanisms of water supply-demand balance and risks under the combined effects of climate change and agricultural activities represents a critical scientific question that urgently needs to be addressed.
Model prediction serves as a powerful tool for analyzing land use changes, water resource evolution, and water supply-demand dynamics. The Patch-generating Land Use Simulation (PLUS) model, which integrates spatial, empirical, and statistical approaches, enables accurate analysis of drivers behind land use changes and patch evolution (Liang et al., 2021). Studies demonstrate that PLUS outperforms many other models in simulation precision, more realistically capturing the spatial characteristics of land use changes (Gao et al., 2022). The InVEST model excels in allocating water resources and evaluating water conservation functions at the watershed scale, offering advantages such as minimal data requirements and strong spatial representation capabilities. Its water yield module has been widely applied and validated for water supply assessments across diverse global basins (Chen et al., 2024a; Ma et al., 2024). The coupled PLUS-InVEST framework has been extensively utilized in fields such as carbon storage simulation, habitat quality assessment, and optimization of ecosystem service spatial patterns (Zhang et al., 2024; Huang et al., 2024; Wang et al., 2024b). Furthermore, the PLUS-InVEST coupled model has demonstrated good performance in regional water supply assessment (Liu et al., 2023). Although its effectiveness in comprehensive regional water-soil balance analysis remains insufficiently explored (Liu et al., 2022), it holds potential for functional expansion through integration with other methods, thereby better supporting efficient regional water and land resource management.
Based on this, our study focuses on a typical watershed in the arid region of Northwest China, aiming to investigate water supply-demand balance under the influence of climate change and human activities, and to identify the primary factors driving water supply-demand risks. The specific objectives of this research are: (i) to determine land change trends under six development scenarios (Natural Increase Scenario (NIS)/Food Security Scenario (FSS)/Economic Development Scenario (EDS)/Water Protection Scenario (WPS)/Ecological Protection Scenario (EPS)/Balanced Economy and Ecology Scenario (BES)) using the PLUS model, and to identify high-contribution factors driving land changes; (ii) to clarify the dynamics of water supply and demand under 24 land-climate combination scenarios (incorporating four climate change scenarios and six land use change scenarios), and to analyze the key drivers behind these changes; (iii) to quantify water supply-demand risks under these land-climate combination patterns and identify the main factors influencing these risks. By coupling multi-scenario analyses of climate and land use changes, this study systematically evaluates their impacts on water supply-demand patterns and associated risks in a typical arid basin, providing actionable recommendations for optimizing water-land resource allocation and promoting agro-ecological sustainable development in the region.
2.1 Study area
The Tailan River originates from the southern foothills of Tomur Peak in the Tianshan Mountains and is primarily recharged by alpine snow and ice melt, with a multi-year average runoff of 7.766 × 10⁸ m3. The Tailan River Basin (TRB) (Fig. 1) is a typical inland river basin in the arid region of northwestern China, covering a total area of 4218 km2. The basin features diverse landforms including gravel Gobi, alluvial plains, and fine soil plains, and is characterized by a continental arid climate of the northern temperate zone with intense solar radiation, high evaporation rates, an average annual precipitation of only 177.7 mm, and evaporation reaching 2912 mm. The mean annual temperature is 8.6 °C, with an average wind speed of 1.25 m s−1 (Fig. S1 in the Supplement). Located in southern Xinjiang, TRB's climatic and hydrological characteristics are highly representative of arid regions both in China and globally. The process of water resources formation in its high mountain areas and consumption in the oasis-desert zones reflects the universal water cycle and utilization patterns of inland river basins in arid regions. TRB has a relatively concentrated population and developed oasis agriculture, forming a diversified agricultural production structure dominated by cotton and food crops, alongside equally important forestry and fruit industries, making it a typical representative of oasis economic systems in arid regions. As an important regional producer of grain, cotton, oil, and fruits, TRB yields high-quality rice and cotton, as well as abundant walnuts, apples, red dates, and fragrant pears. Its water and land resource utilization patterns and oasis-desert ecosystem structure provide valuable references for other arid river basins. Therefore, although TRB is a single basin, its physiographic conditions, climatic and hydrological characteristics, ecological structure, and human activity patterns all reflect the universal attributes of inland river basins in arid regions, possessing both typicality and representativeness for regional pattern studies.
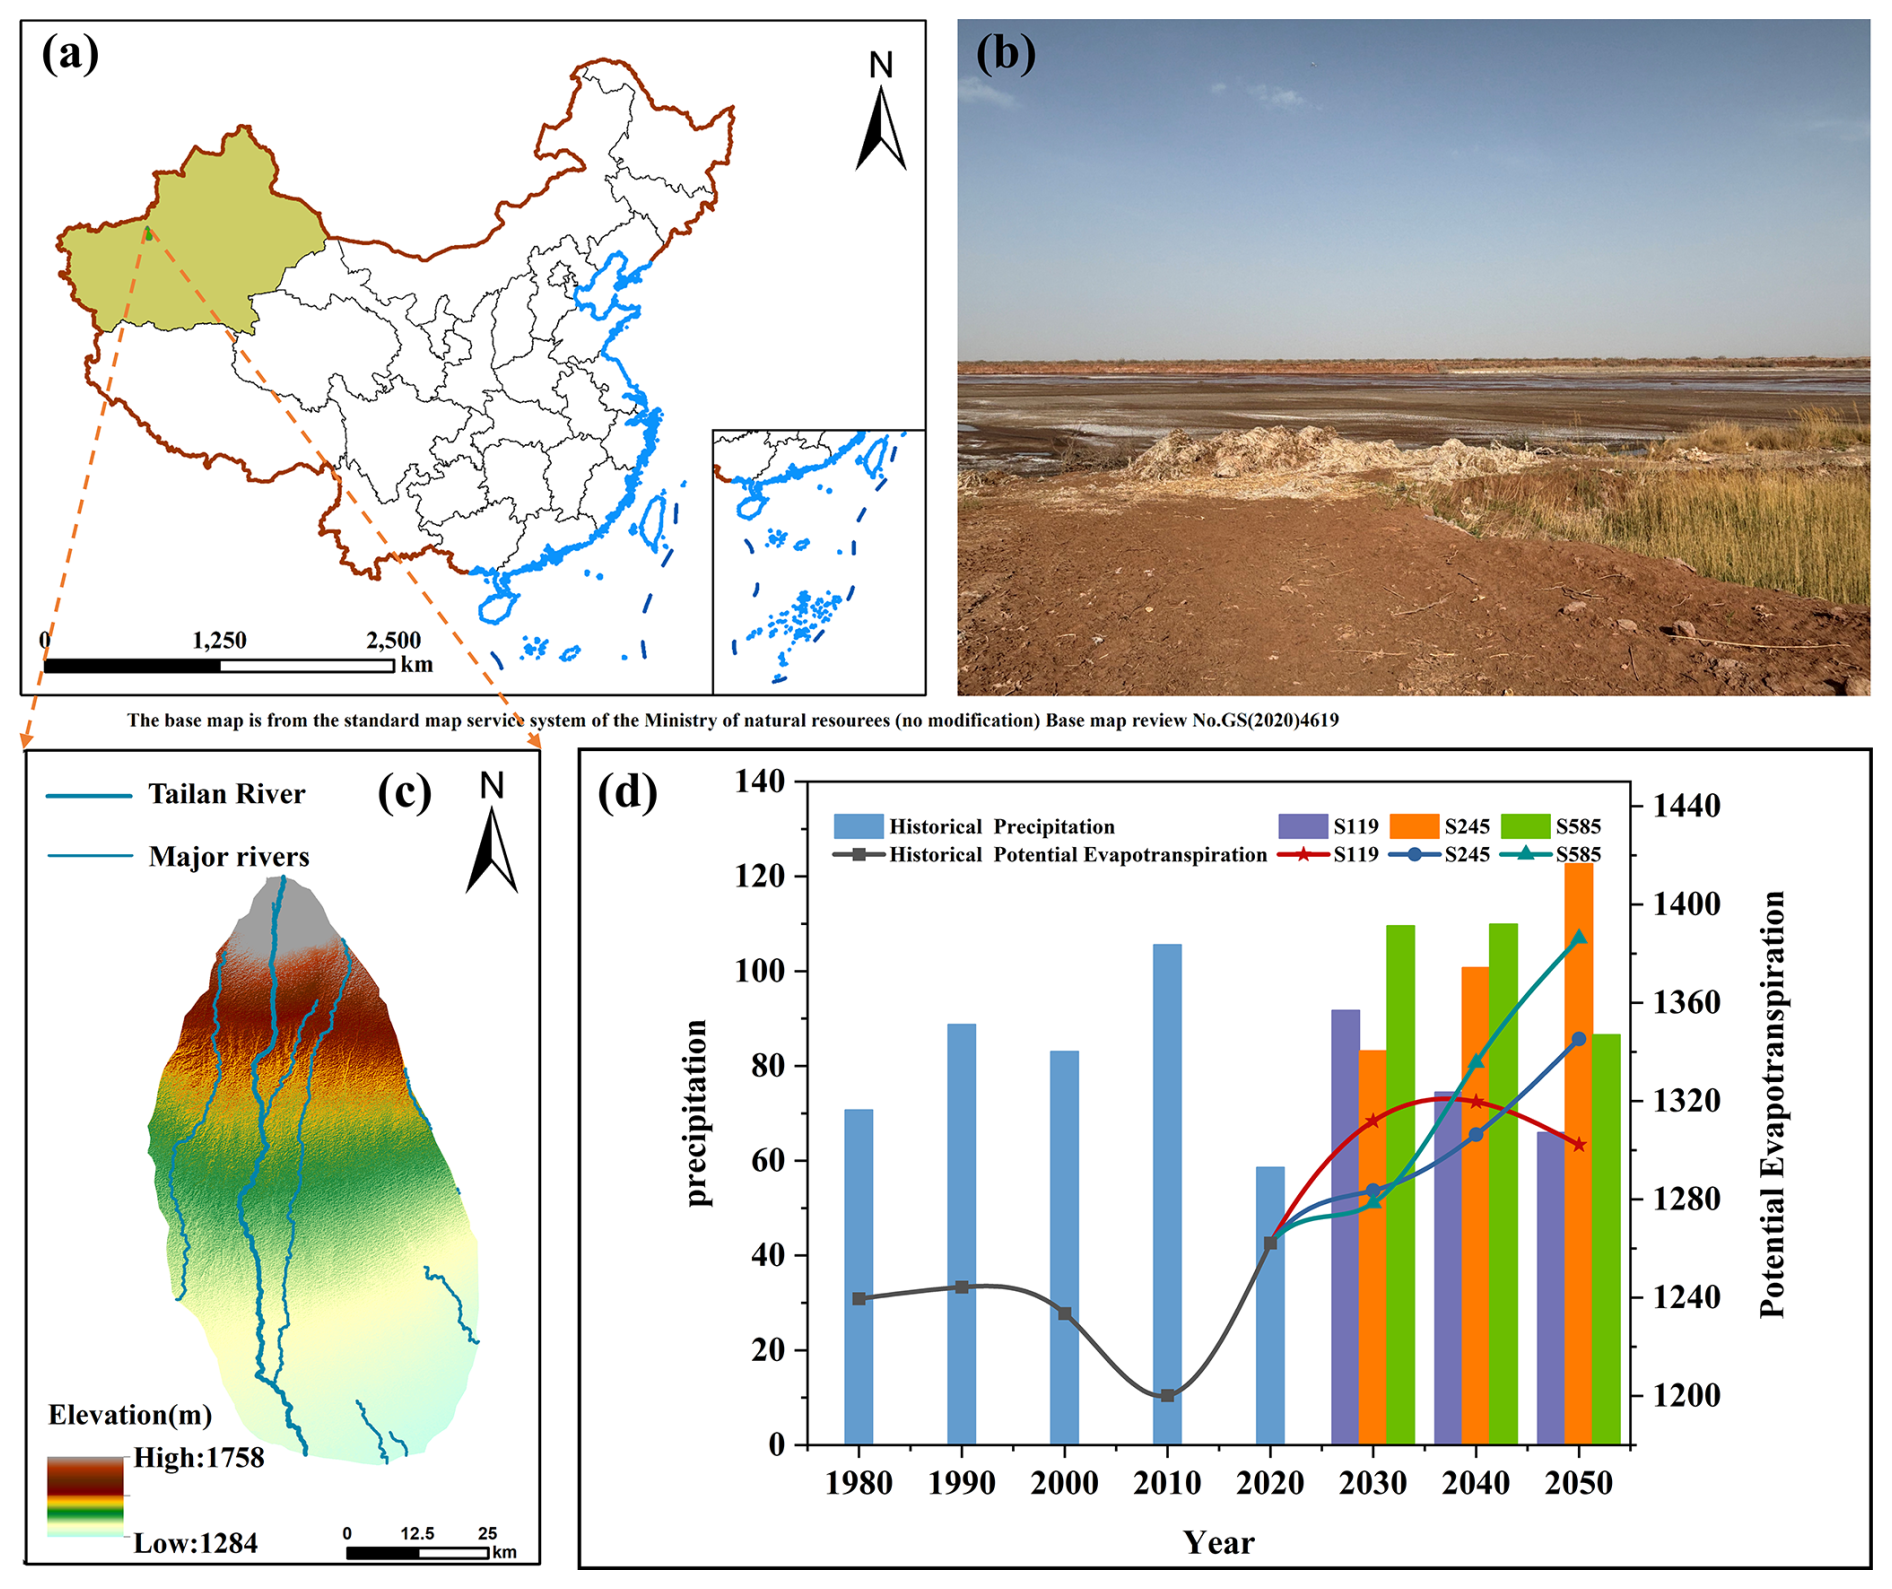
Figure 1Overview of the Tailan River Basin (TRB): (a) schematic map showing the location of TRB in China; (b) actual landscape of the Tailan River; (c) Digital Elevation Model (DEM) of TRB; (d) precipitation and potential evapotranspiration for historical and future periods in TRB (The base map is from the standard map service system of the Ministry of natural resources (no modification) Base map review No. GS (2020) 4619).
2.2 Datasets
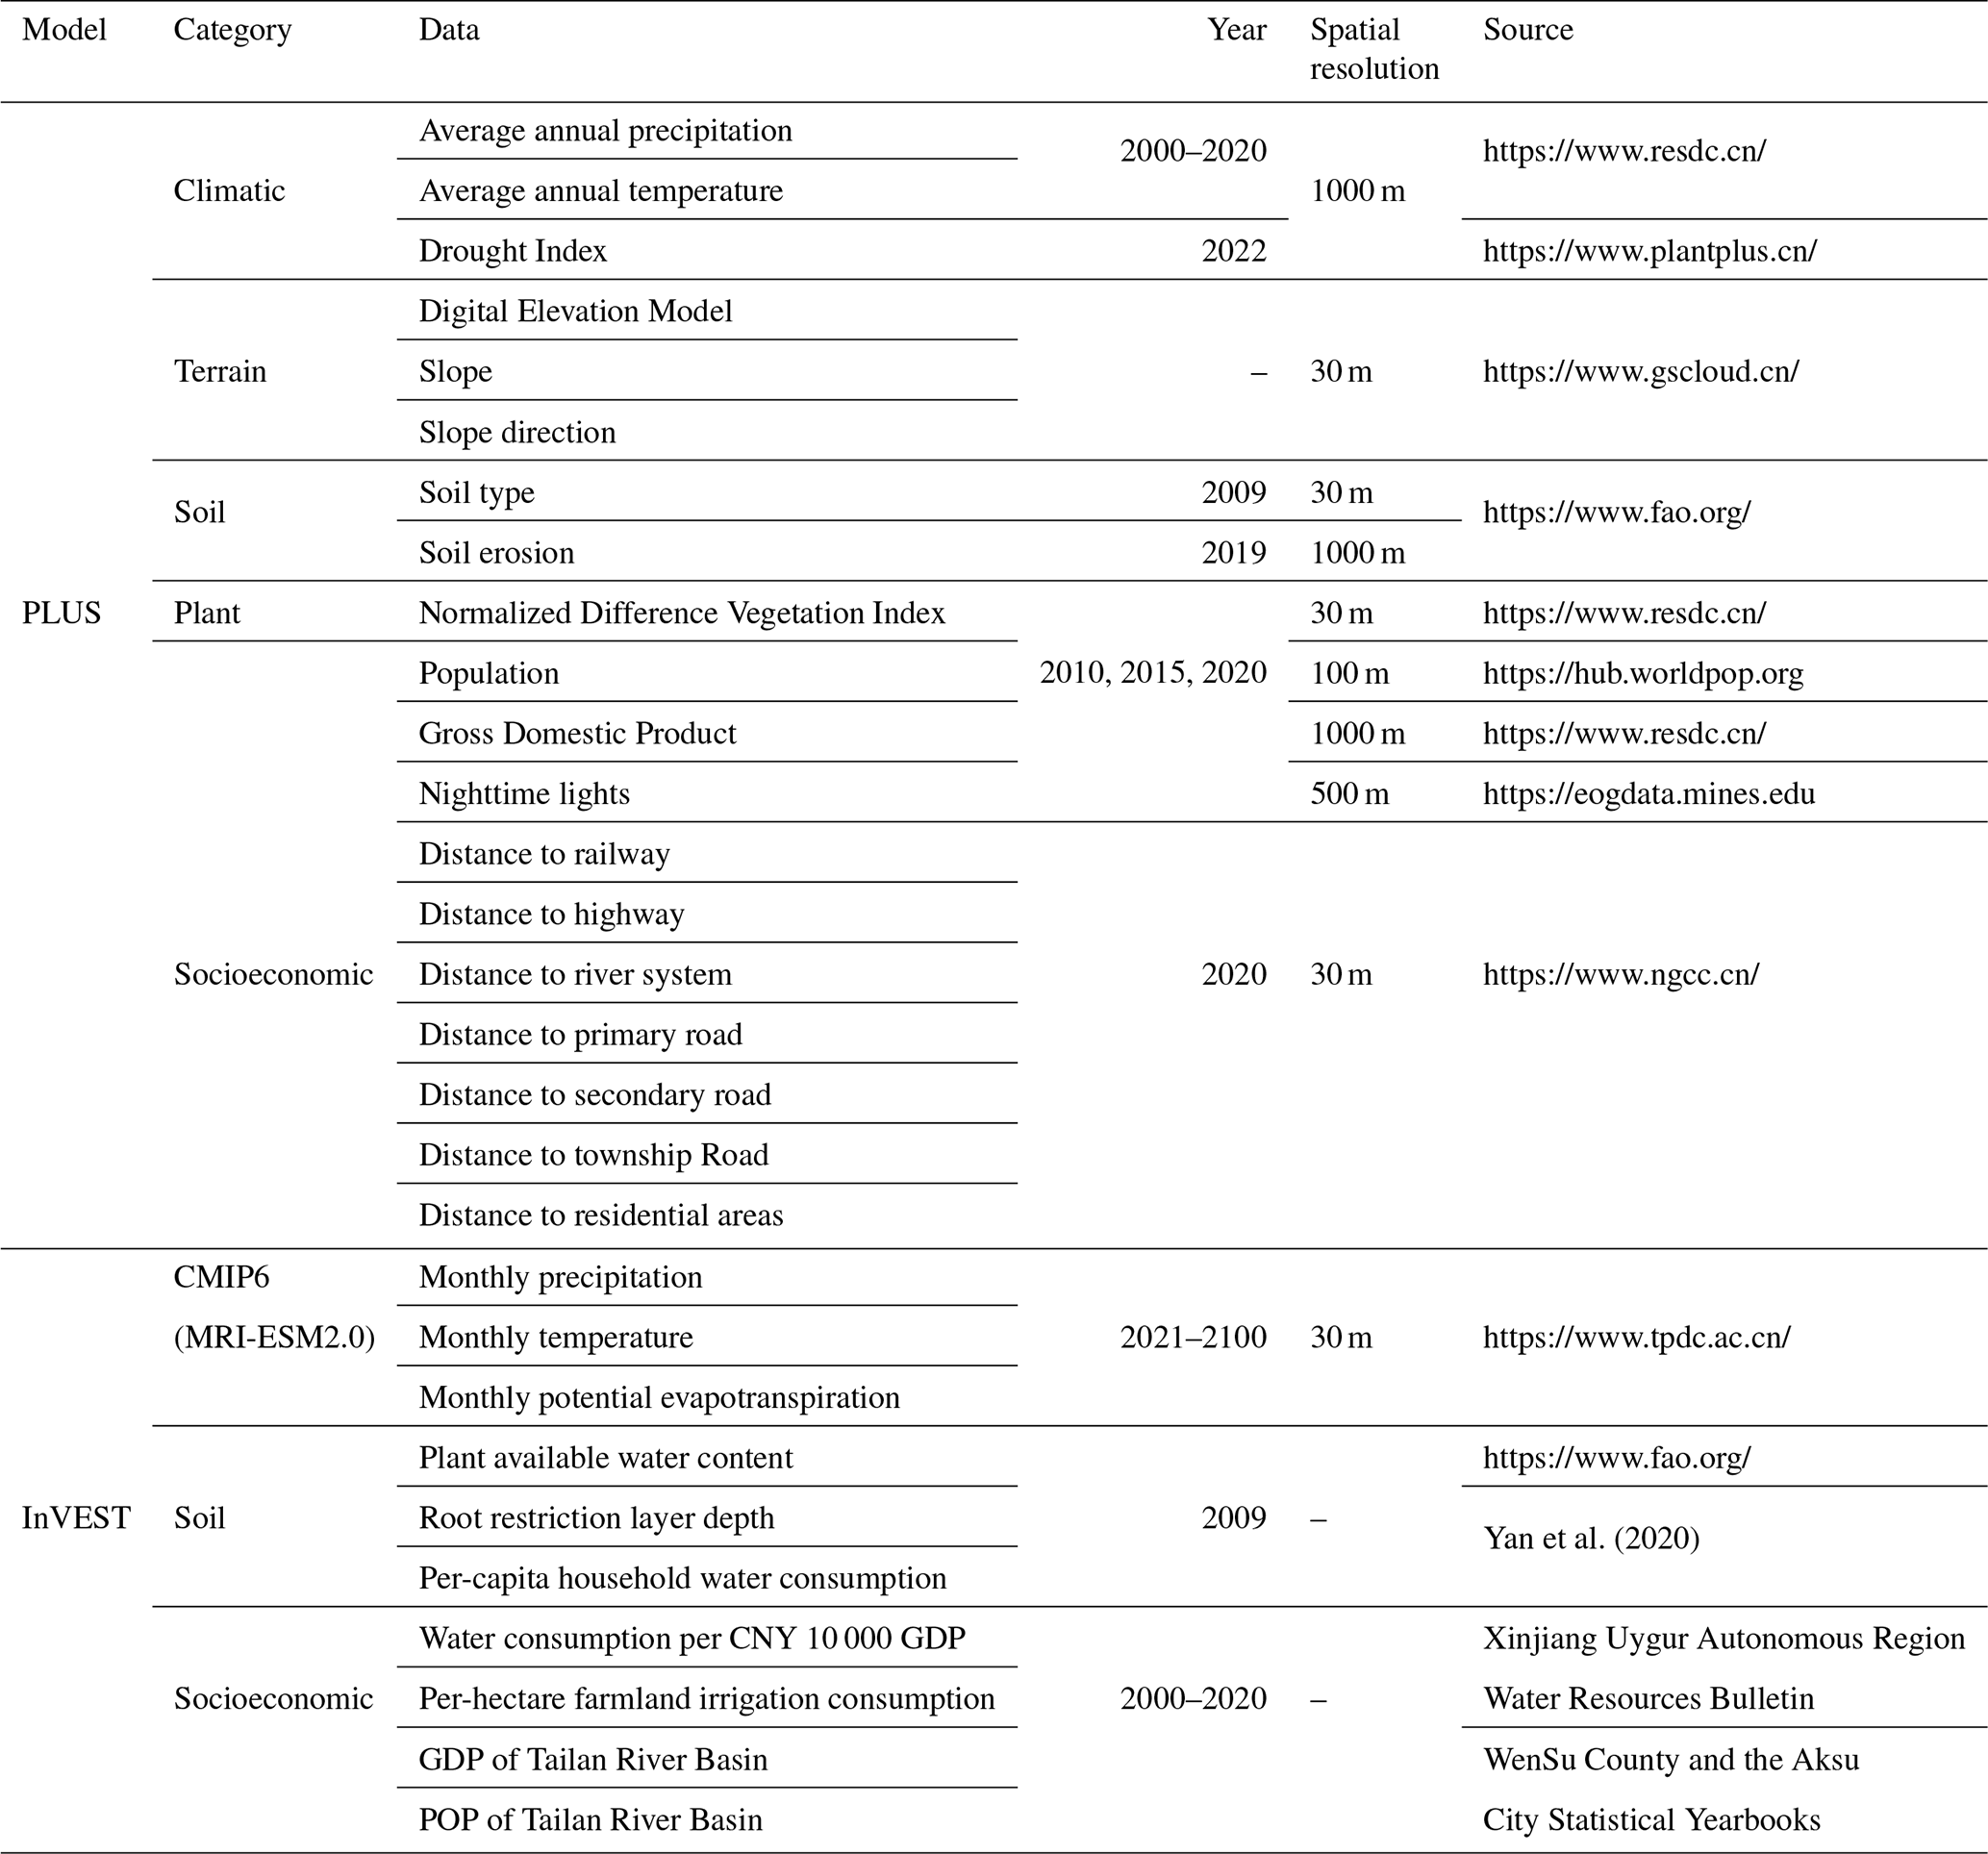
This study collected two sets of datasets to simulate land use and water supply-demand in the TRB (Table 1). The first set of data was used to simulate land use change, involving a total of 19 factors influencing land use to establish a driving factor library. These include 10 socio-economic factors, 3 climate factors, 3 topographic factors, 2 soil factors, and 1 vegetation factor. The second set of data was used to simulate water supply and demand quantities, with a total of 12 factors employed for the simulation. Additionally, land use and future climate were used as the base data, and land use data were obtained from RESDC (https://www.resdc.cn/, last access: 12 April 2025), constructed using interactive visual interpretation methods based on Landsat MSS, TM/ETM and Landsat 8 images (Zhuang et al., 1999), which include cultivated land, forest land, grassland, water bodies, built-up land and unutilized land, with an overall accuracy of more than 95 % (Liu et al., 2014). Future meteorological data were obtained from TPDC (https://www.tpdc.ac.cn/, last access: 1 June 2025), and Coupled Model Intercomparison Project (CMIP6) was selected as the data source. Considering the size of the study area, modeling efficiency, and information richness, bilinear interpolation was employed to harmonize the spatial resolution of all datasets to 30 m within the Krasovsky_1940_Albers coordinate system.
Table 1Data Factors of the Land-Climate Model in the Tailan River Basin. Last access for all web pages cited in this table is: 20 June 2025.
2.3 Methods
The research approach of this study is to first predict land use change in the TRB under six scenarios for the period 2020–2050 and screen for the high-contribution drivers of land change in the TRB. subsequently predict the change processes of water supply and demand quantities in the TRB under 24 land-climate combination patterns for 2020–2050, and analyze the key drivers of these water supply-demand changes. finally quantify water supply-demand risks under the land-climate combination patterns, identify the main factors influencing these water supply-demand risks, and propose management and policy recommendations aligned with regional development. The framework and workflow of this research approach are illustrated in Fig. 2.
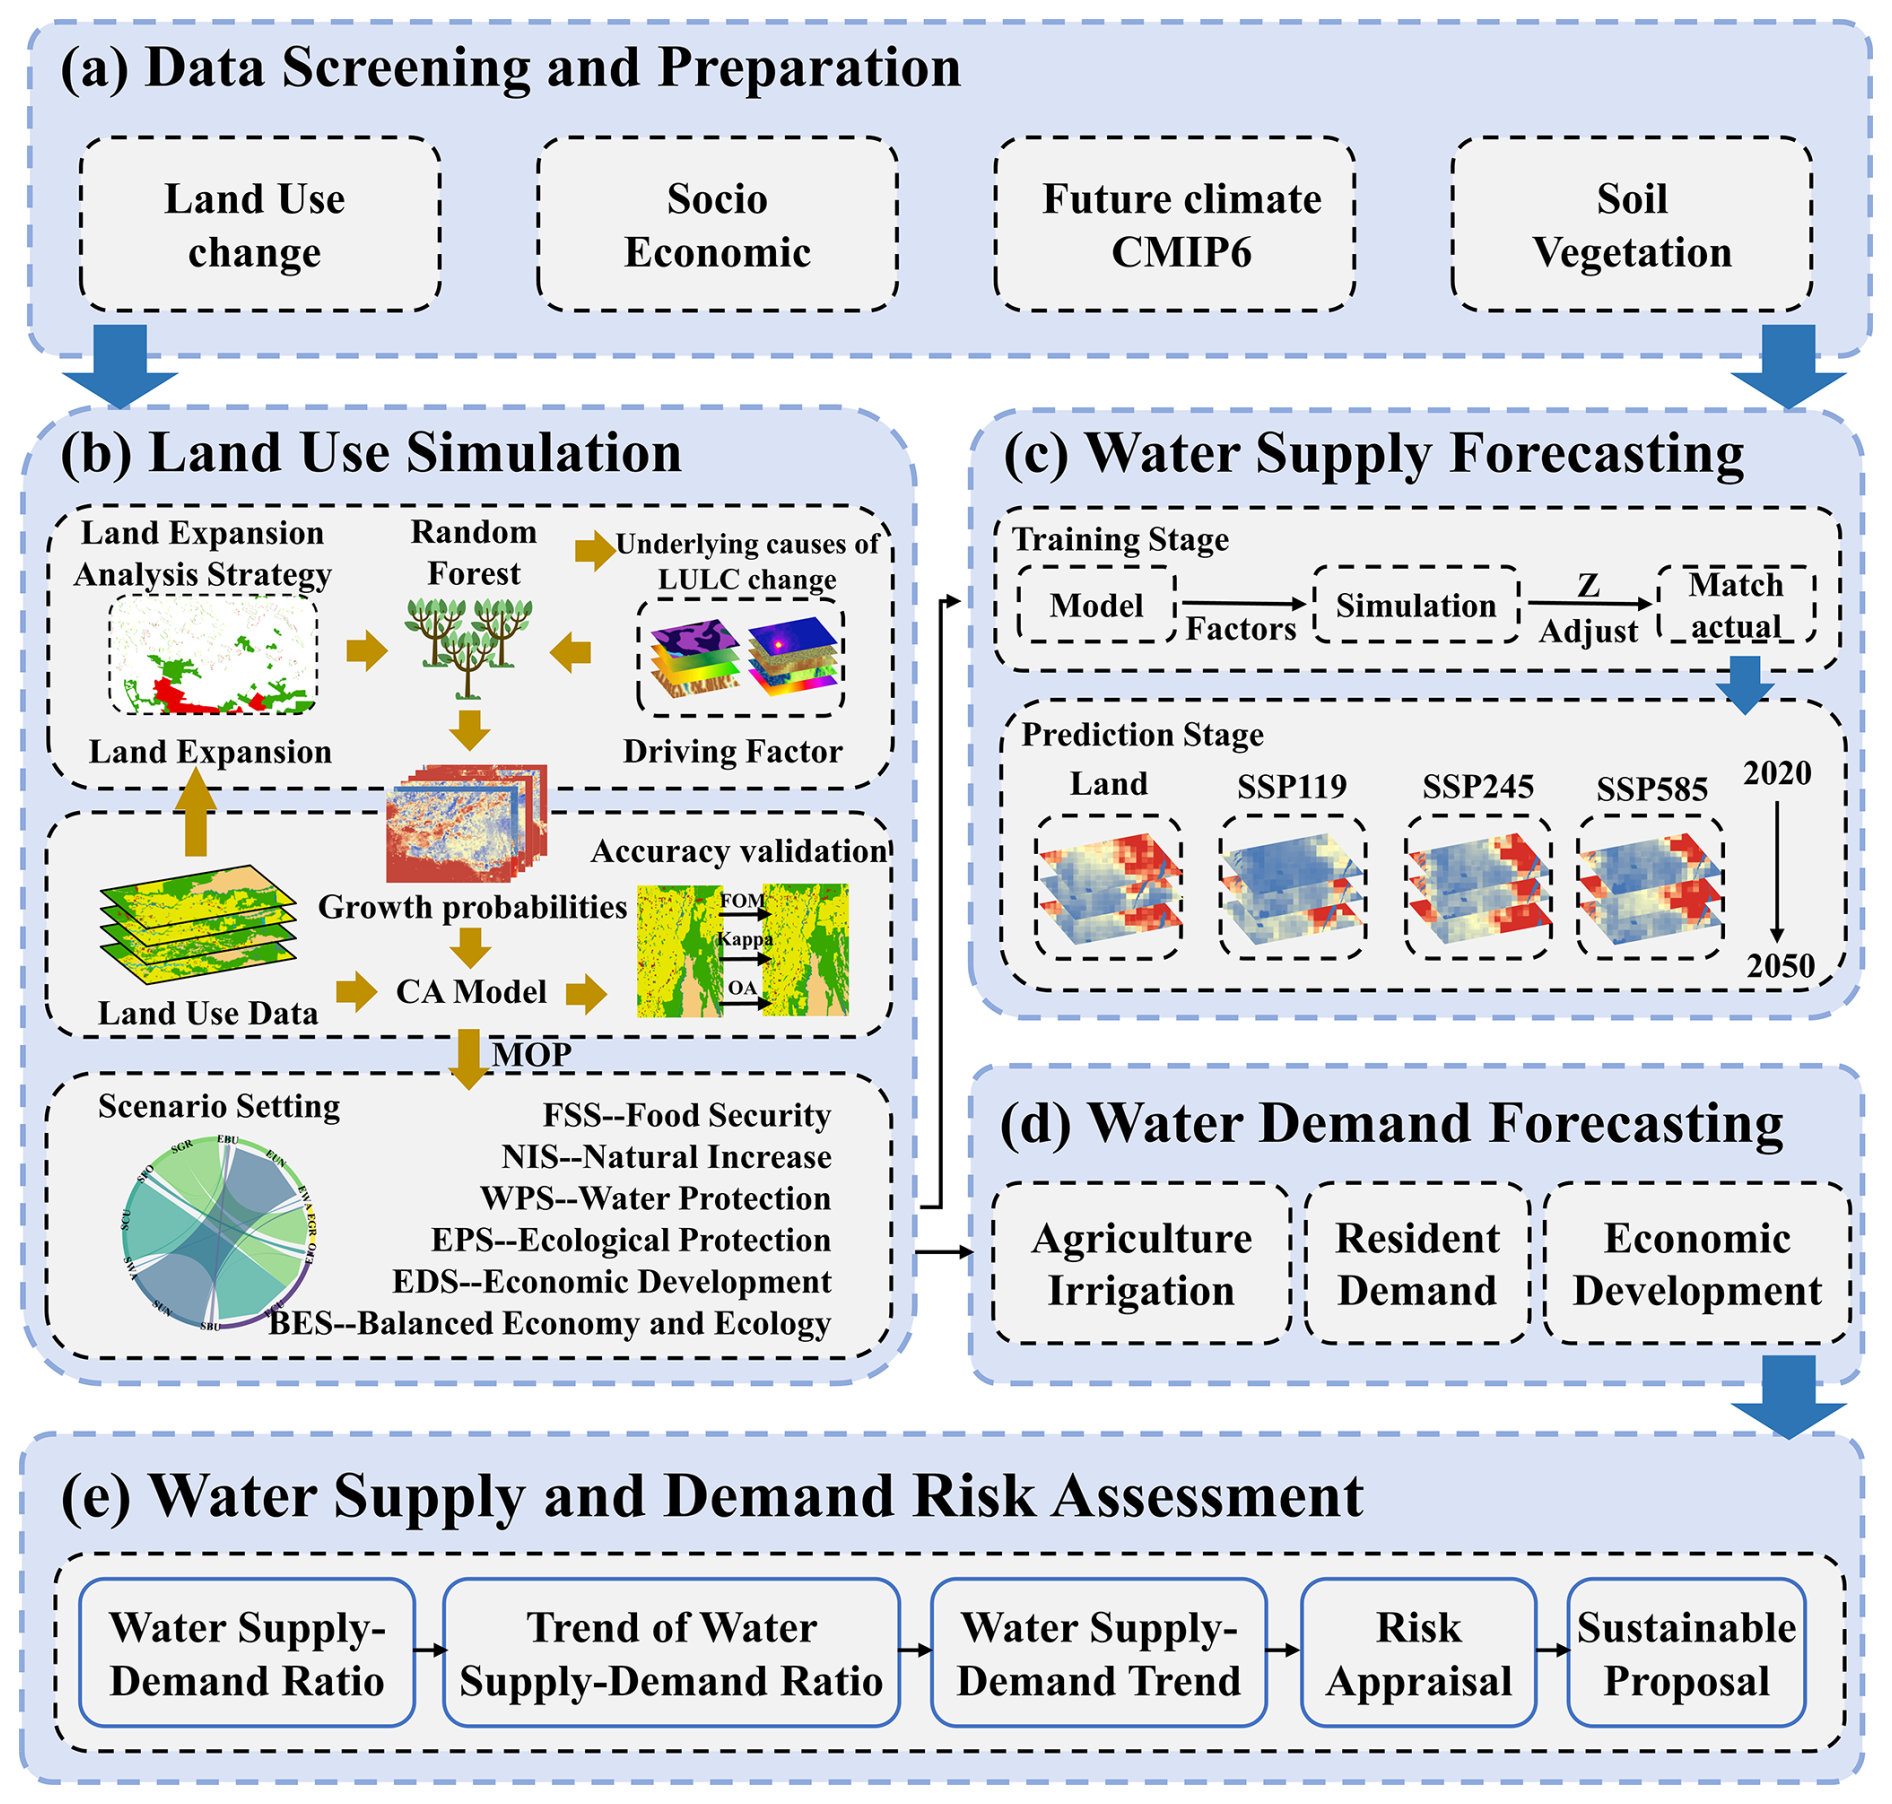
Figure 2Framework and Workflow for Multi-Scenario Water Supply-Demand Risk Assessment.
2.3.1 Land-climate model setting
To explore the diverse possibilities for TRB's development, this study integrated the “Aksu Prefecture National Economic and Social Development 14th Five-Year Plan and Long-Range Objectives Through the Year 2035”, the “Aksu Prefecture National Economic and Social Development Statistical Bulletin (2020–2024)”, the “Aksu Prefecture Territorial Spatial Plan (2021–2035)”, the “Xinjiang Uygur Autonomous Region Territorial Spatial Plan (2021–2035)”, and previous research findings (Kulaixi et al., 2023; Song et al., 2025) to establish six land development scenarios.
Natural Increase Scenario (NIS). Based on the land evolution process in the TRB from 2000 to 2020, this scenario maintains the current land transition processes, adds no new policy influences, and imposes no restrictions on the transfer probabilities between land use types. It serves as a baseline and reference for the other scenarios. It also functions as a control for observing transitions in the other restricted scenarios.
Food Security Scenario (FSS). Based on the characteristics of the TRB region, this scenario emphasizes food security and enhances agricultural productivity. It reduces (by 5 %) the transfer probability of cultivated land to other land use types while increasing (by 10 %) the transfer probability from other land use types to cultivated land.
Economic Development Scenario (EDS). Driven by accelerating urbanization and economic development needs, this scenario enhances economic construction and fundamental urban capacity. It increases (by 20 %) the transfer probability from cultivated land, forest land, grassland, and unused land to built-up land, keeps the transfer probability from water bodies to built-up land unchanged, and simultaneously protects the TRB's economic infrastructure by reducing (by 30 %) the probability of built-up land converting to other land use types except cultivated land.
Water Protection Scenario (WPS). Addressing water scarcity and the need for aquatic ecological balance, this scenario prioritizes safeguarding ecological functions such as water resource protection and water conservation from infringement. It prohibits the encroachment of existing water body areas by other land use types and reduces (by 30 %) the transfer probability from other land types to cultivated land.
Ecological Protection Scenario (EPS). Given the ecological fragility and sensitivity of the TRB, this scenario aims to enhance the resilience of its eco-environment. It restricts (by 30 %) the transfer probability from other land use types to built-up land and increases (by 20 %) the transfer probability from built-up land to forest land, grassland, water bodies, and unused land.
Balanced Economy and Ecology Scenario (BES). Responding to the dual demands of economic development and ecological governance in the TRB. This scenario seeks parallel development of urbanization and ecological conservation. It reduces (by 20 %) the transfer probability from grassland and water bodies to built-up land, and reduces (by 10 %) the transfer probability from cultivated land and forest land to built-up land. Building upon this, it reduces (by 20 %) the transfer probability from built-up land to forest land, and reduces (by 10 %) the transfer probability from built-up land to water bodies, grassland, and unused land.
In response to the increasingly severe climate change, combining historical rainfall and potential evapotranspiration trends in the TRB (Fig. 1). this scenarios with Shared Socio-economic Pathways (SSP) and Representative Concentration Pathways (RCP) under CMIP6 were selected. While SSP describes possible future socio-economic developments, RCP depicts future greenhouse gas concentration and radiative forcing scenarios (O'Neill et al., 2016, 2017). Here, the typical SSP-RCP scenarios from the second-generation climate model (MRI-ESM2.0) as developed by the Meteorological Research Institute (MRI) of Japan were used. This includes: (i) land, to compare current and future climate change; (ii) SSP119, the lowest radiative forcing scenario with radiative forcing of ≈ 1.9 W m−2 by 2100; (iii) SSP245, a medium radiative forcing scenario that stabilizes at ≈ 4.5 W m−2 by 2100; (iv) SSP585, a high forcing scenario with emissions rising to 8.5 W m−2 by 2100.
2.3.2 Land use projections
This study employed the PLUS model to predict land use evolution trends in the TRB. The PLUS model consists of the Land Expansion Analysis Strategy (LEAS) and the CA based on multi-type random patch seeds (CARS) (Liang et al., 2021). The LEAS module utilizes the random forest algorithm to explore the relationships between multiple driving factors and different land types, thereby determining the development potential for each land use type (Shi et al., 2023). The CARS module simulates patches of different land types by integrating a transition matrix and neighborhood weights of land use types to achieve the prediction outcome. In this study, the sampling rate of the random forest was adjusted to 0.2 and the number of decision trees was set to 60 to adapt to the geographical environment of the TRB. We selected the Figure of Merit (FOM), Overall Accuracy (OA), and Kappa index (Liu et al., 2017) to measure the accuracy of the simulations. To enhance the applicability and precision of the PLUS model, the collected 19 driving factors were used as a “factor bank”. Under consistent other simulation parameters, factors with lower contribution capabilities were systematically removed, and land use patterns for both 2015 and 2020 were simulated. Driving factors were screened based on the random forest algorithm within the LEAS module and the evaluation metrics. When the number of driving factors was reduced to 13, the simulation achieved the highest accuracy (Table S1 in the Supplement) and exhibited strong consistency (Fig. S2). Consequently, this study adopted these 13 driving factors for subsequent simulations.
2.3.3 Water supply and demand forecasting
1. Water supply forecasting
This study utilized the water yield module of the InVEST model to predict changes in water yield within the TRB (Tailan River Basin). The Budyko framework (Budyko and Miller, 1974) was applied to determine the difference between precipitation and actual evapotranspiration for each grid cell, which was then used to calculate water yield (Chen et al., 2024a). The calculation formula is as follows:
where Y(x) is the annual water yield of grid cell x; AET(x) is the actual evapotranspiration in grid cell x; and P(x) is the annual precipitation in grid cell x. Evapotranspiration of vegetation under the various land use types was calculated (i.e., after Zhang et al. (2004) as follows:
where PET(x) is the potential evapotranspiration (mm) of grid cell x, and ω is an empirical value related to natural climate and soil properties. The term ω(x) is calculated after Donohue et al. (2012) as:
where Z is a seasonal constant of the water yield model, representing hydrogeological characteristics such as regional precipitation distribution. Based on “the Wensu County Water Resources Development Plan for the 14th Five-Year Plan Period” and “the Comprehensive Report on the Tailan River Basin Planning”, the surface water resources volume in the plain area was determined to be 65 × 105 m3. Through manual optimization, it was found that when the model parameter Z = 7.5, the discrepancy between the simulated and observed values was minimized (Fig. S3).
AWC(x) is the effective water content of grid cell x; PAWC(x) is the effective water content of vegetation in grid cell x; MaxSoilDepth(x) is the maximum soil depth in grid cell x; and RootDepth(x) is the root depth in grid cell x. The term PAWC(x) is as follows (Zhou et al., 2005):
where SAND(x), SILT(x), CLAY(x), and OM(x) respectively stand for sand, silt, clay, and organic matter contents of grid cell x.
2. Water demand forecasting
As indicated by “the Wensu County Statistical Bulletin on National Economic and Social Development” and “the Aksu Statistical Bulletin on National Economic and Social Development”, the water use structure in the TRB (Tailan River Basin) is well-defined, primarily sourced from agricultural irrigation, residential consumption, and economic development activities. Therefore, this study conducted separate projections for agricultural water demand, domestic water demand, and economic water demand within the TRB. In order to account for the impact of climate change on the average crop water requirement in the TRB, and based on the findings of Li et al. (2020), which indicate that a temperature increase of 2 °C leads to an increase in the average crop water requirement of 19 mm, the formula for calculating irrigation water demand per hectare was derived as follows:
where Δcwd(a,b) represents the change in average crop water requirement for grid cell b in year a, T1 denotes the air temperature for a grid cell during the baseline period, and T2 denotes the air temperature for the same grid cell during the change period. n(a,b) is the irrigation water demand per hectare for grid cell b in year a under climate change impacts, and d0 is the irrigation water demand per hectare during the baseline period. Therefore, the calculation formulas for agricultural water demand, domestic water demand, and economic water demand are as follows:
where p(a,b) and g(a,b) are respectively the initial population and economic status of grid cell b in year a; POPa and GDPa are respectively the population and GDP in year a; pop(a,b) and gdp(a,b) respectively the calibrated population and GDP of grid cell b in year a; and agr(a,b) is the cultivated land area of grid cell b in year a. The terms la, ma, and na respectively represent the per capita water use, water use per CNY 10 000 of GDP, and irrigation water use per hectare of farmland in year a. To exclude recharge from the mountain in the study area, the amount of surface water resources in the mountains was equally dispersed in a raster. The population and GDP for 2030–2050 were determined using linear regression method. To exclude the water contribution from the upper reaches of the Tailan River to this study, the multi-year average runoff from the upper reaches was evenly allocated to each grid cell to reduce its influence on water demand calculations. Additionally, this study employed linear regression to project the population and GDP for the period 2030–2050, which was used to support the prediction of the temporal change in water demand within the TRB from 2030 to 2050.
2.3.4 Risk framing of water supply and demand
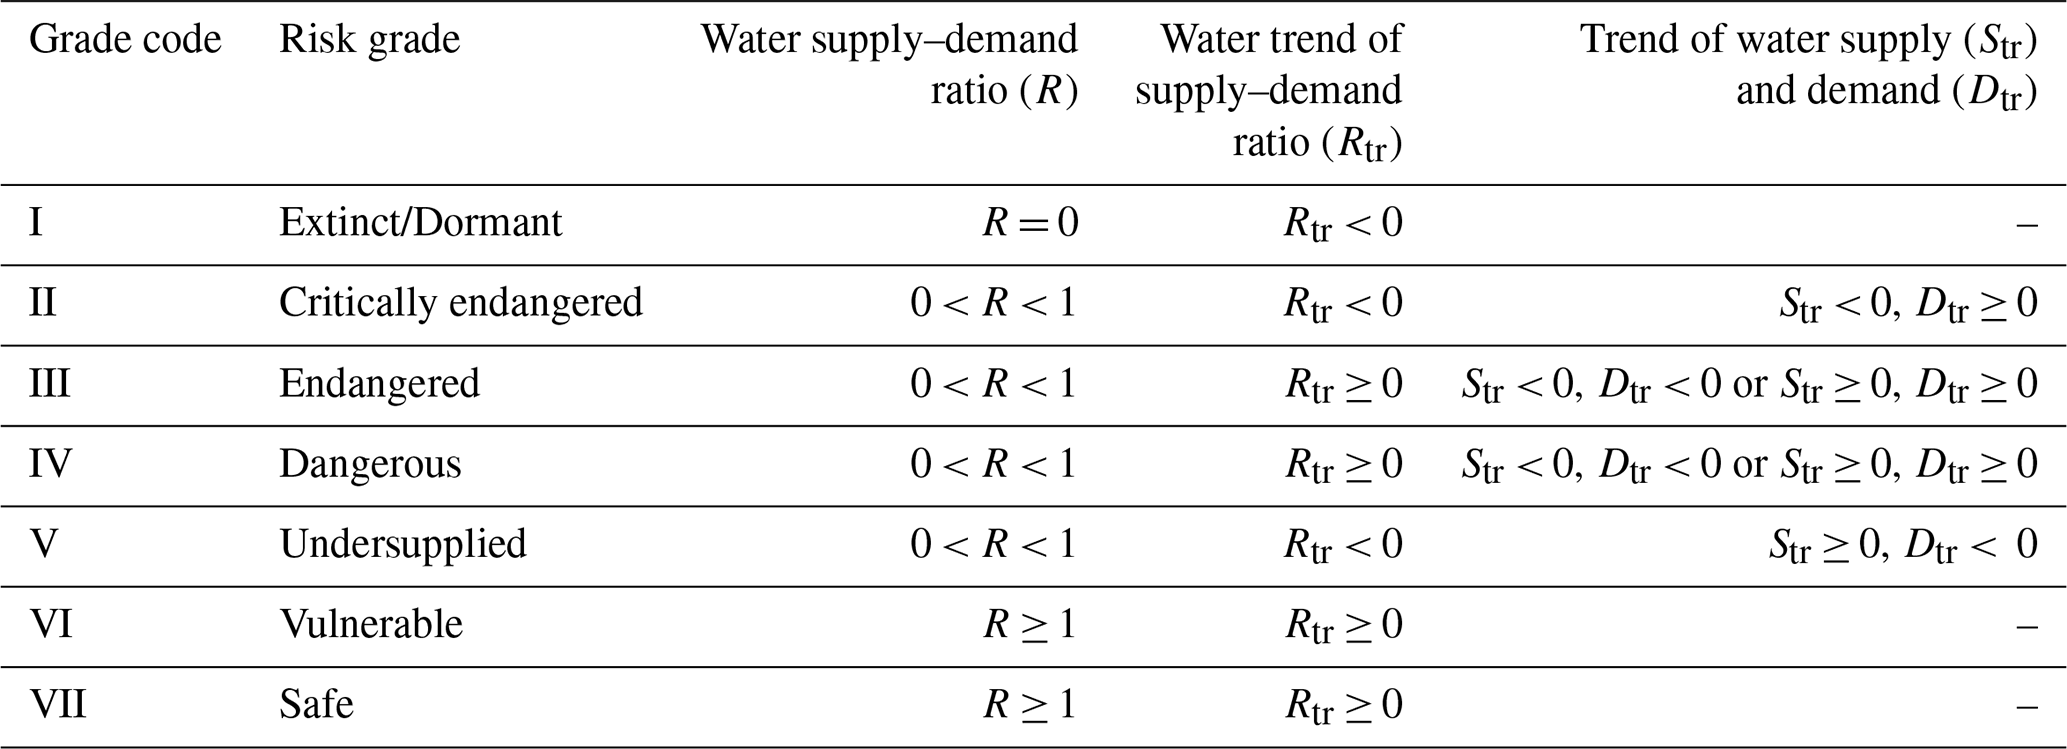
The water supply-demand risk framework serves as a crucial tool for assessing regional water supply-demand risks. Maron et al. (2017) classified the computational results generated within this framework into seven categories (Table 2), enabling the assessment of regional water risk levels by calculating the water supply-demand relationship and facilitating the quantification of regional water supply-demand risk grades. This framework comprises four indicators: the water supply-demand ratio, the trend in the water supply-demand ratio, the water supply trend, and the water demand trend. The calculation procedures for these indicators are as follows:
- 1.
The water supply and demand ratio that expresses spatial heterogeneity of water supply and demand contradictions:
where R(x) is the water supply-demand ratio of grid cell x; and WY(x) and WD(x) are respectively the water supply and demand of grid cell x.
- 2.
The trend of water supply-demand ratio expresses the relative changes in water supply and demand:
where Rtr is the difference between water supply-demand ratios in years i and j; Ri and Rj are respectively the water supply-demand ratios in years i and j.
- 3.
The trend of water supply and demand volume expresses the absolute changes in water supply and demand volume:
where Str and Dtr are respectively the differences in water supply and demand volumes; WYi and WYj respectively the water supply volumes in years i and j; WDi and WDj respectively the water demand volumes in years i and j.
Table 2Assessment of water supply and demand risk level in the study area.
3.1 Land use change characteristics under multiple scenarios
The evolution of land use in the TRB from 2020 to 2050 under six scenarios was simulated using the PLUS model. Overall, the land use structure remained relatively stable across the multiple scenarios, with the most significant changes primarily manifested in cultivated land (33 %) and grassland (29 %) areas (Fig. 3). Notably, grassland area generally exhibited significant degradation (with an average reduction of 535.36 km2), whereas cultivated land area expanded substantially (the contribution of population is the highest (0.22); Fig. 4) due to factors such as policy incentives and population growth (with an average increase of 524.87 km2). Under the NIS, the intensity of cultivated land reclamation continuously increased, with its proportion jumping from 33 % (2020) to 46 % (2050). A significant portion of this expansion stemmed from the reclamation of grassland. Simultaneously, the encroachment of built-up land also constituted a major component of grassland conversion. Compared to NIS, the FSS resulted in a greater expansion of cultivated land (545.28 km2). This scenario emphasizes intensive land use and promotes sustainable cultivated land development through the consolidation of fragmented farmland. The cultivated land expansion under FSS primarily originated from the conversion of grassland. Under the EDS, the area of built-up land surged from 62.88 km2 (2020) to 113.05 km2 (2050), significantly exceeding that in other scenarios. Relative to NIS, the WPS mitigated grassland reclamation and degradation, increased water conservation and ecological land, and augmented grassland area through soil conservation measures and the development of wasteland. Building upon WPS, the EPS further restricted human activities, resulting in the smallest built-up land area (104.08 km2). While controlling the growth rate of cultivated land area, it significantly increased the area of ecological land, such as grassland and water bodies, thereby further restoring the fragile ecosystems in the arid region. As a key measure to balance ecology and economy in the arid oasis region, the BES maintained a relatively high cultivated land area (531.20 km2) to safeguard the agricultural economic backbone. Simultaneously, it ensured that ecological land, such as woodland and water bodies, remained free from encroachment. Furthermore, it involved further development of unused land (wasteland and saline-alkali land), converting it into grassland (31.08 km2) with ecological conservation functions.
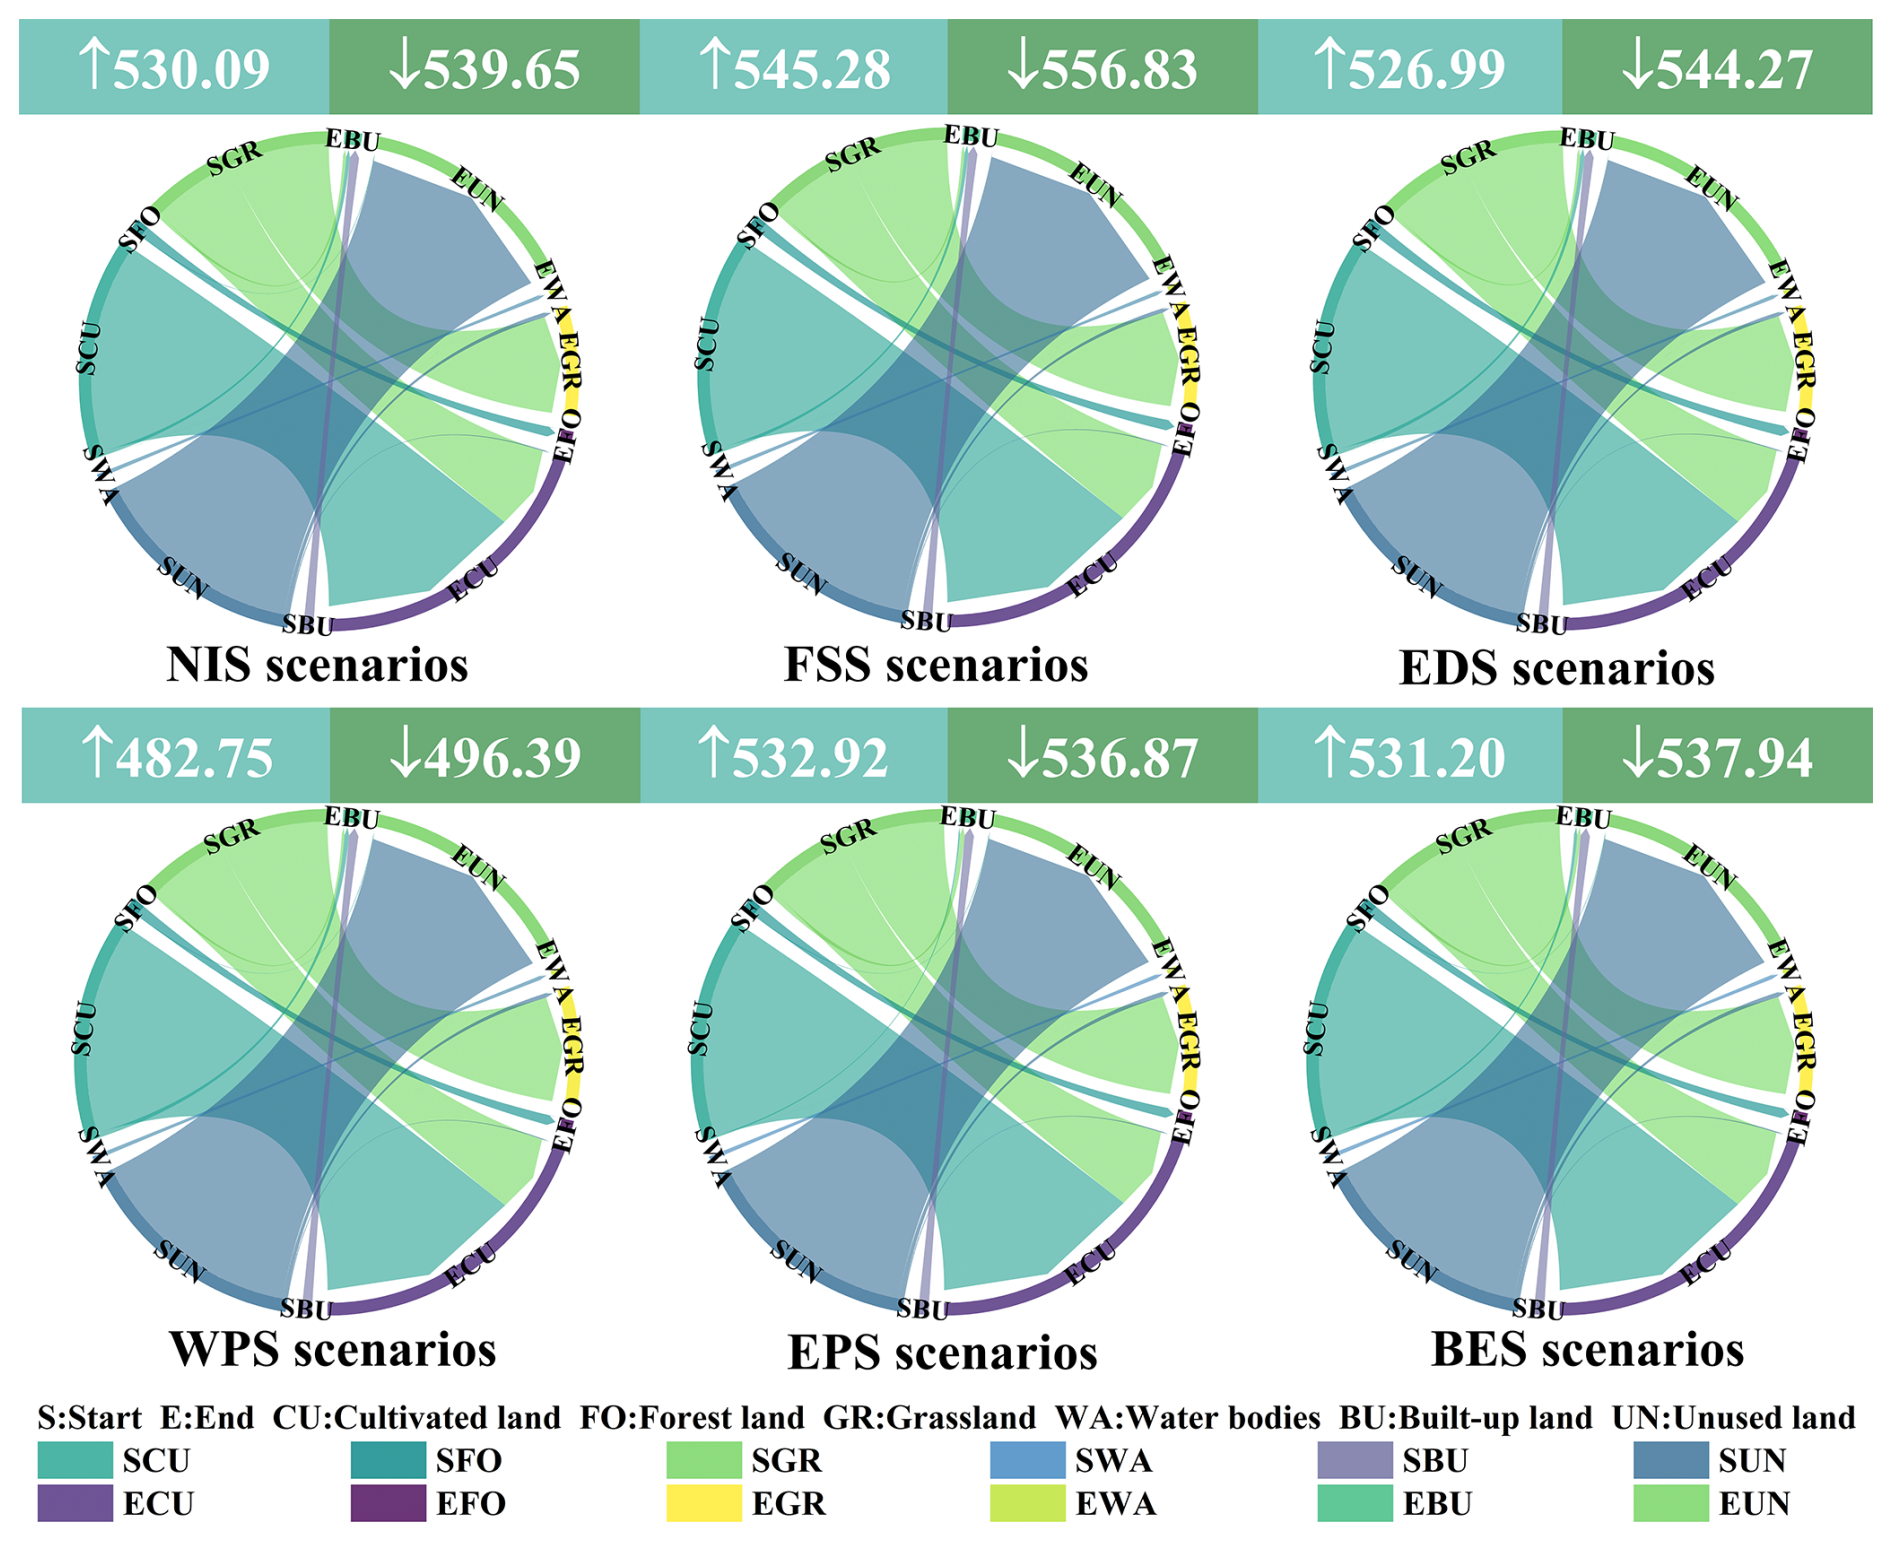
Figure 3Transfer process under six land-use scenarios in the Tailan River Basin, 2020–2050 (scenario labels indicate cultivated land expansion area (blue; in km2) and grassland degradation area (green; in km2)).
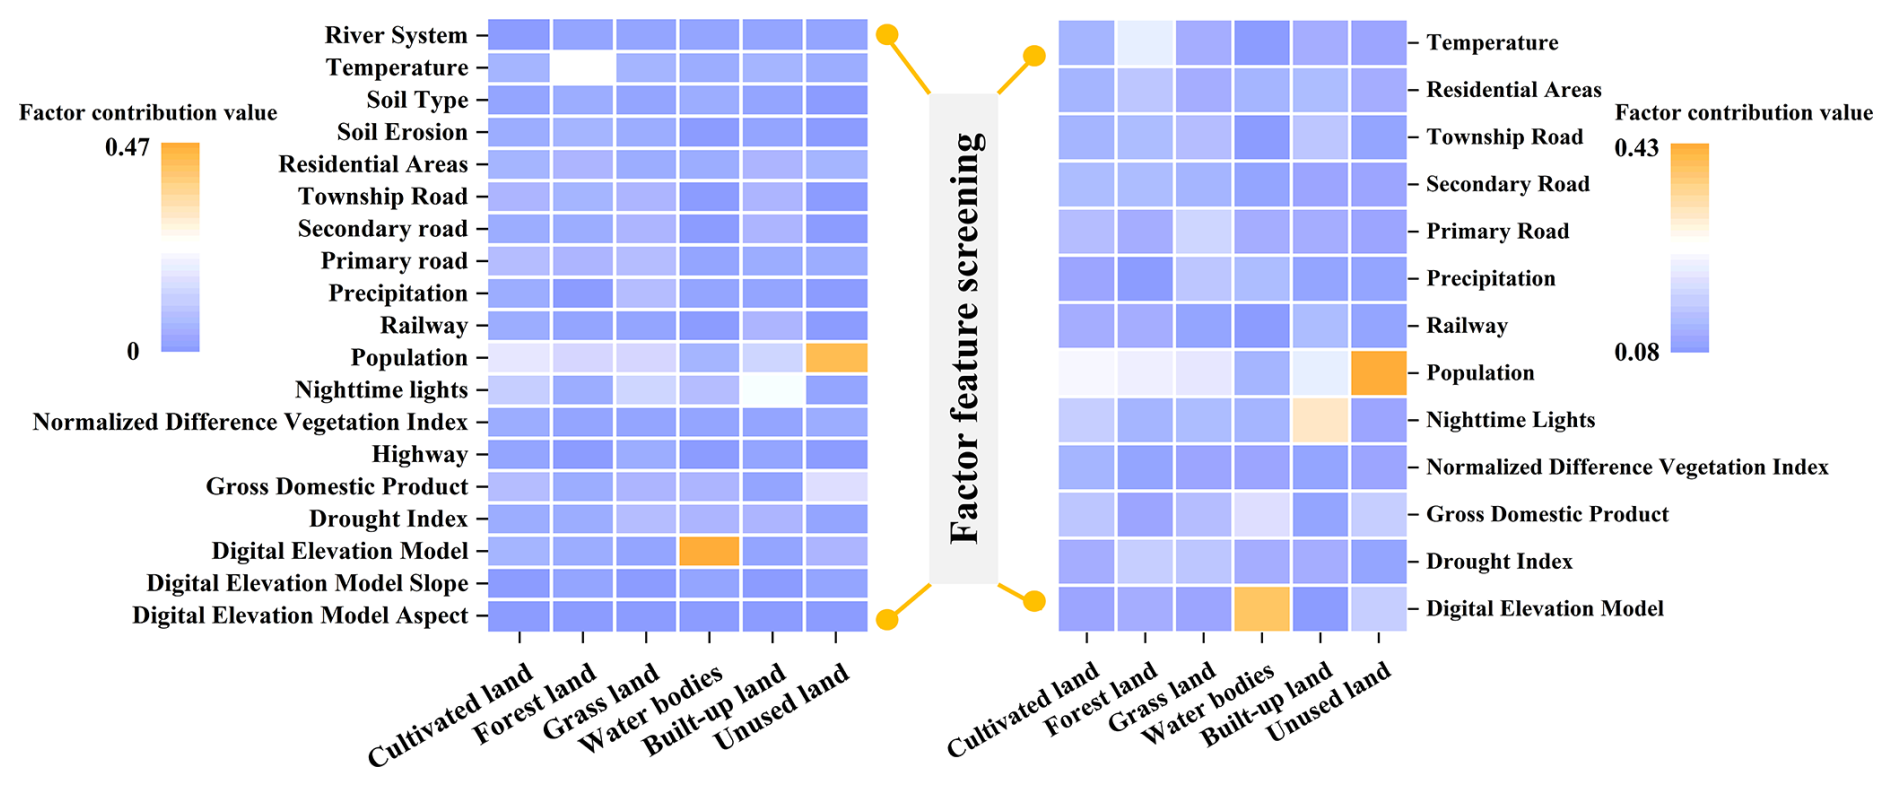
Different land types exhibit significantly varying degrees of responsiveness to driving factors due to differences in their spatial demand and evolutionary trajectories (Fig. 4). Specifically, population plays a core driving role in the evolution of multiple land types: it exhibits the highest contribution rates to cultivated land (0.22), forest land (0.19), grassland (0.17), built-up land (0.18), and unutilized land (0.43). Other key driving factors also show specific influences: the Nighttime Light Index has relatively high contributions to cultivated land (0.12) and built-up land (0.29), the Aridity Index to forest land (0.11) and grassland (0.09), and the Digital Elevation Model (DEM) also contributes significantly to water bodies (0.38).
3.2 Multi-scenario water supply-demand dynamics
3.2.1 Variation in water supply
Based on the InVEST model, the variation trends of water supply under different climate change and land use scenarios were investigated. The spatial distribution of water resources supply remains consistent across scenarios, with a stable water supply pattern (Fig. 5a). This pattern demonstrates markedly higher water supply in the northern region than elsewhere, which is closely linked to the spatial distribution of precipitation in the TRB. During 2020–2050, water supply trends under different scenarios show distinct variations: both Land and S245 exhibit an upward trend, with S245 increasing at an appreciably faster rate than land. In contrast, the water yield capacity of S119 and S585 gradually declines over time, though their decreasing trends differ substantially (Table S2). Furthermore, the contribution of water yield capacity from different land types to water supply also varies, with grassland providing higher water supply than cultivated land (Fig. 5a). Using the scenario maintaining current rainfall and potential evapotranspiration (Land) as the baseline, TRB's water supply fluctuates under different land use scenarios, ranging from 64.78 × 10⁵ to 65.7 × 10⁵ m3. Under different climate scenarios, TRB's water supply shows pronounced variations, with a fluctuation range of 25.33 × 10⁵ to 162.2 × 10⁵ m3 when referenced against the NIS baseline scenario. The highest water supply in TRB (162.8 × 10⁵ m3) occurs under the S245-FSS, while the lowest (25.23 × 10⁵ m3) is observed under the S119-EPS.
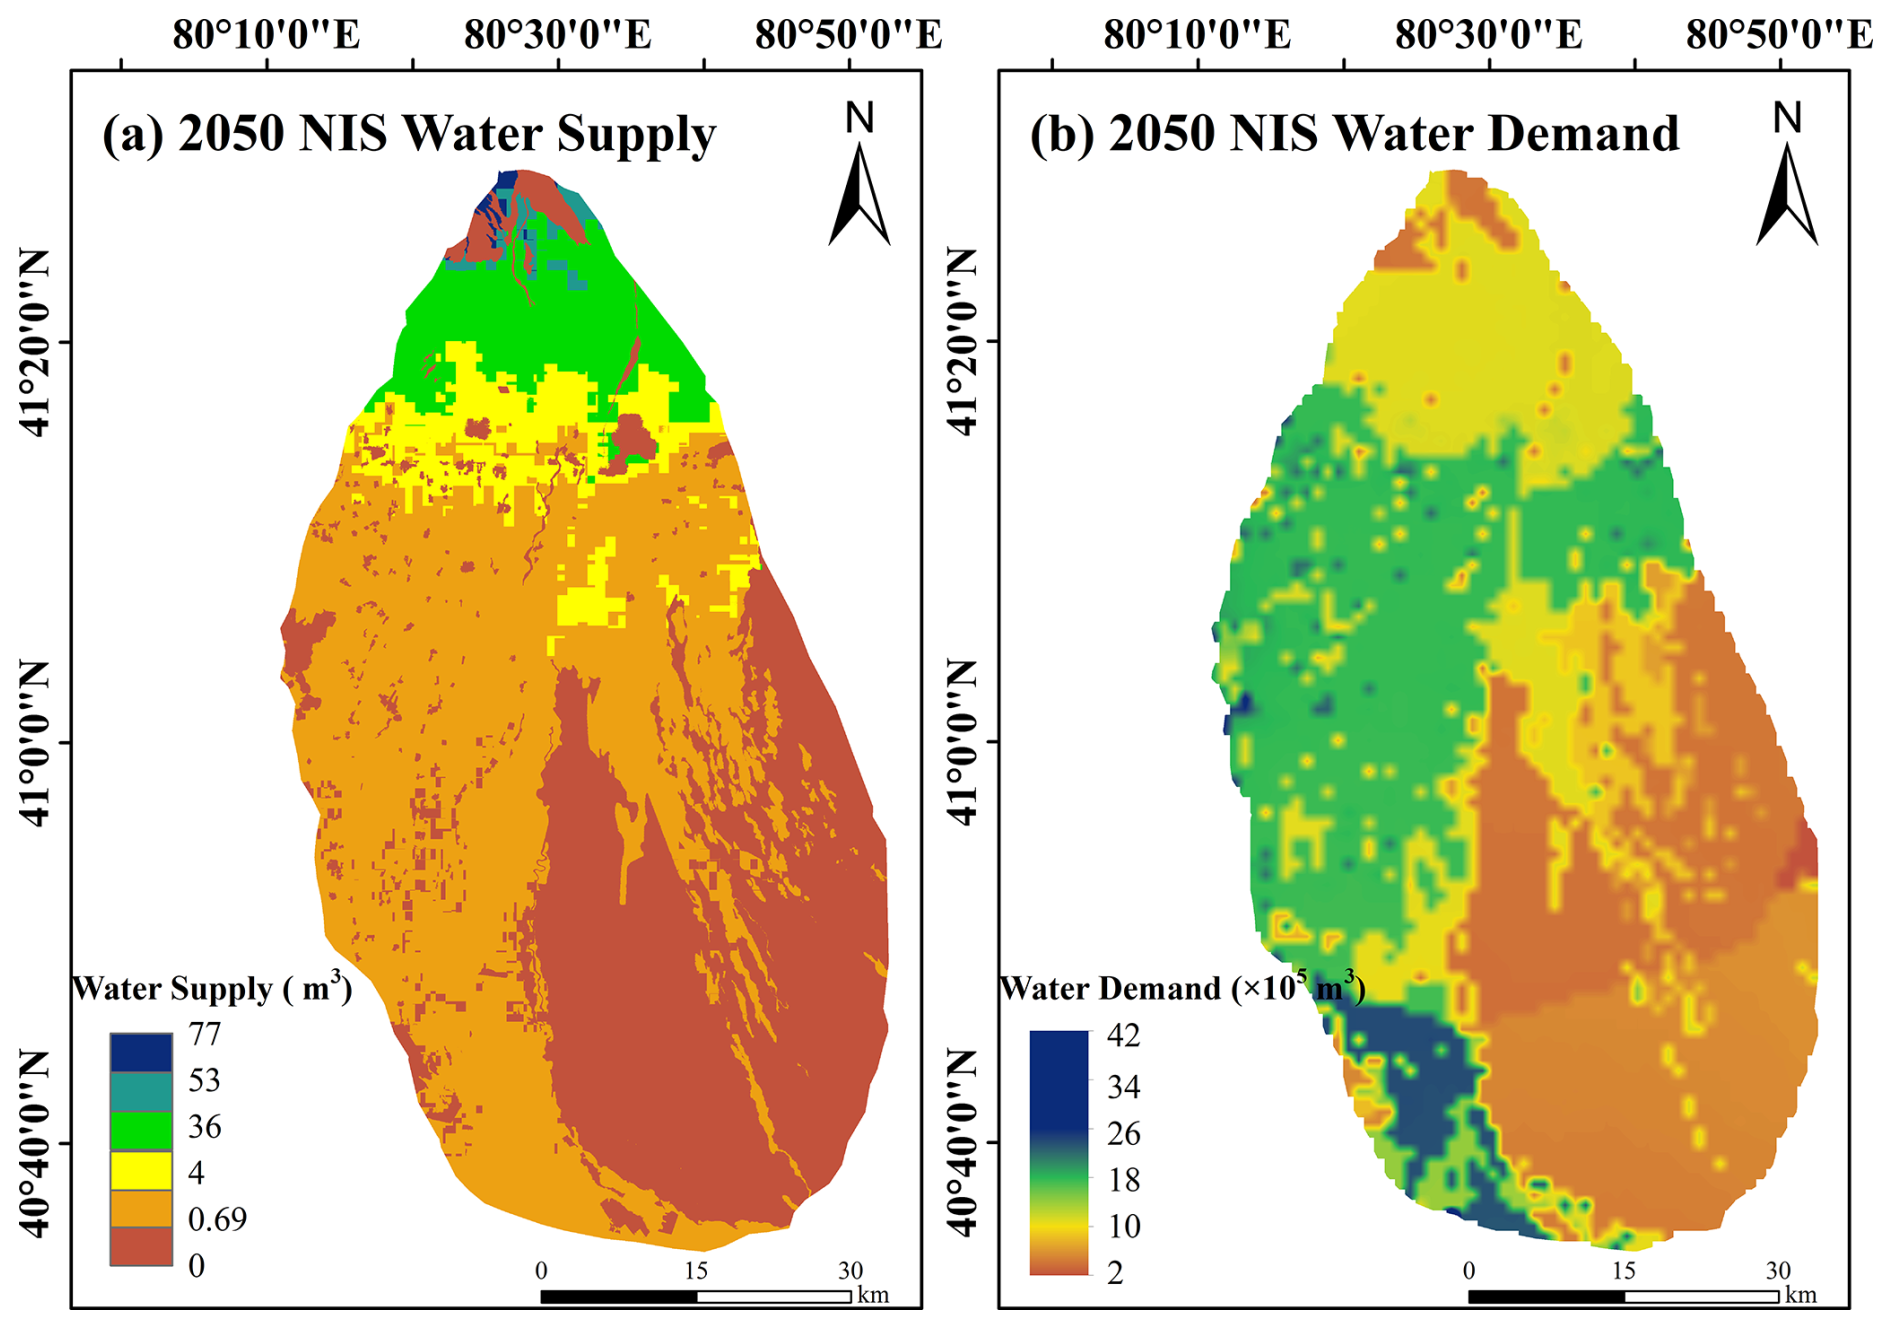
Figure 5Spatial patterns of (a) water supply and (b) water demand in the Tailan River Basin under the Natural Increase Scenario (NIS) in 2050.
3.2.2 Variation in water demand
Compared with water supply, the spatial distribution and pattern of water demand also remain relatively consistent and stable across different scenarios (Fig. 5b) This pattern exhibits stronger water demand capacity in the southwestern and central-eastern regions but weaker capacity in the northern and southeastern areas, which is closely associated with the spatial distribution of land use and population aggregation density in the TRB (Fig. 5b). During 2020–2050, water demand under all scenarios shows a continuous upward trend, though with significant variations in the rate of increase. Furthermore, the contribution of water demand capacity from different land types varies markedly, with cultivated land and built-up land demonstrating stronger demand capacity, while unutilized land shows the weakest capacity. Using the scenario maintaining current rainfall and temperature (Land) as the baseline. TRB's water demand exhibits significant variations under different land use scenarios (Table S2), ranging from 1575 × 105 to 4935 × 105 m3. Under different climate scenarios, TRB's water demand displays similar upward trends over time, with a fluctuation range of 1887 × 105 to 5316 × 105 m3 relative to the NIS baseline scenario. The highest water demand (5390 × 105 m3) occurs under the S585-FSS scenario, whereas the lowest (1575 × 105 m3) is observed in the Land-WPS scenario. Agricultural water use has consistently constituted the primary consumption component in the TRB. Across all land and climate change scenarios, irrigation accounts for over 70 % of the total share (Fig. 6a, b). Although the proportion of irrigation water gradually decreases over time, its total volume continues to increase (Fig. 6c). Nevertheless, unilateral studies of water supply or demand alone cannot directly reflect water resource allocation capacity. The impacts arising from supply-demand imbalances remain unclear and warrant further investigation. To better elucidate the impacts of water supply-demand dynamics on TRB's water resources, in-depth analysis of regional water security risks is required, which will facilitate the formulation of tailored water management and conservation strategies.
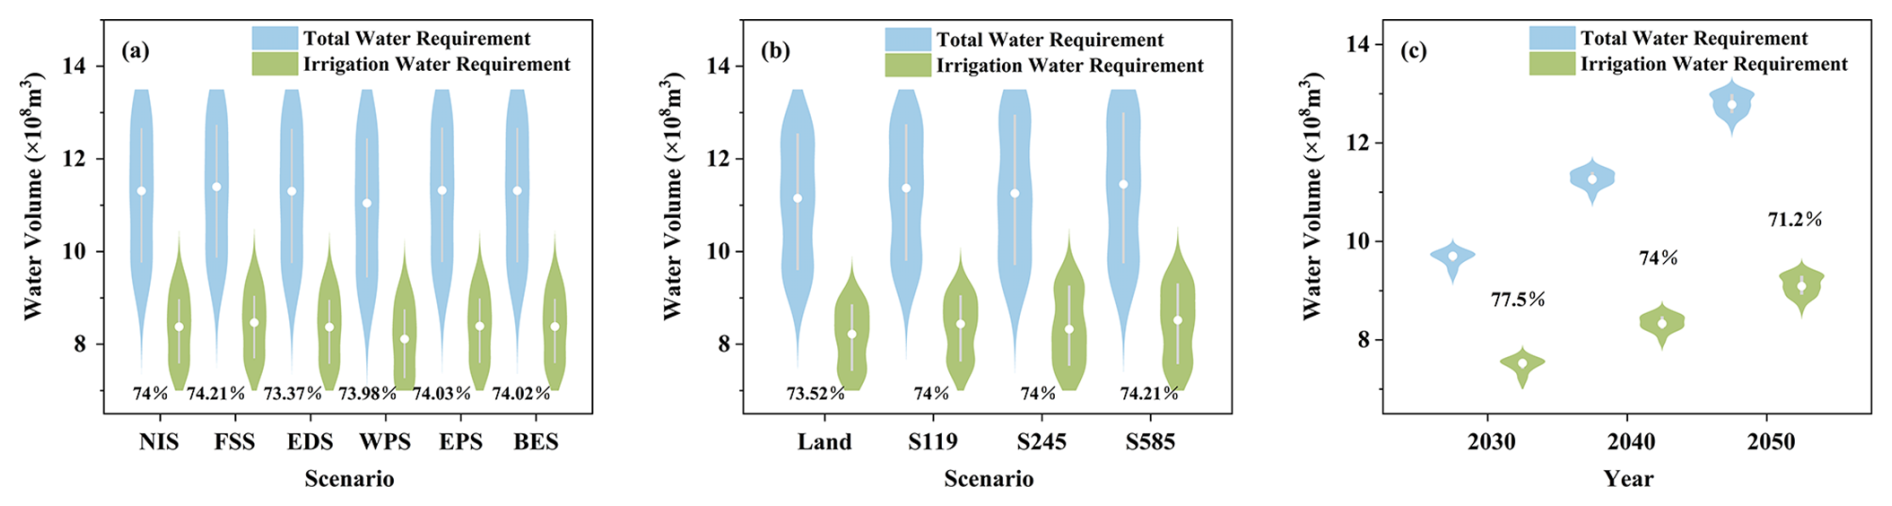
Figure 6Dynamics of total water demand and agricultural irrigation demand with proportional distribution across latitudinal gradients in the Tailan River Basin, 2030–2050; (a) different land change scenarios (Natural Increase Scenario (NIS)/Food Security Scenario (FSS)/Economic Development Scenario (EDS)/Water Protection Scenario (WPS)/Ecological Protection Scenario (EPS)/Balanced Economy and Ecology Scenario (BES)); (b) different climate change scenarios (Land/S119/S245/S585); (c) temporal evolution (percentages in the figure represent the proportion of irrigation water to the total water demand).
3.3 Multi-scenario water supply-demand risks and attribution
To assess water supply-demand risks in the TRB region, an evaluation framework was established using four indicators: water supply-demand ratio, trend of water supply-demand ratio, water supply trend, and water demand trend. Spatial patterns of water supply-demand risk in the TRB exhibit heterogeneity across scenarios (Fig. 7). Although risk classification levels vary under different climate scenarios, no grid cell in the TRB escapes hazardous (Level IV) risk (Table 2 indicates a 7-level classification system). This is closely linked to continuously increasing water demand in the TRB. Using NIS as the baseline, the scenario maintaining current rainfall and potential evapotranspiration (Land) shows the most severe water scarcity: Level II risk accounts for 51.31 %, while Level IV risk constitutes merely 0.85 %. Under the other three climate scenarios, water supply-demand risks are alleviated, with Level IV risk proportions being 29.24 % (S119), 53.60 % (S245), and 49.34 % (S585) respectively (Fig. 8). The S245-EPS scenario achieves maximum risk mitigation in the TRB, as its rainfall levels increase steadily per decade among the three climate scenarios (Fig. 1d), thereby alleviating regional water stress. While the TRB's harsh current climate exacerbates water risks, future climatic changes may moderately alleviate these risks compared to present conditions. In summary, by 2050 the entire TRB will face water supply-demand crises, with at least 46 % of the area subjected to endangered (Level III) risk, including no less than 10 % of land confronting critical endangered (Level II).
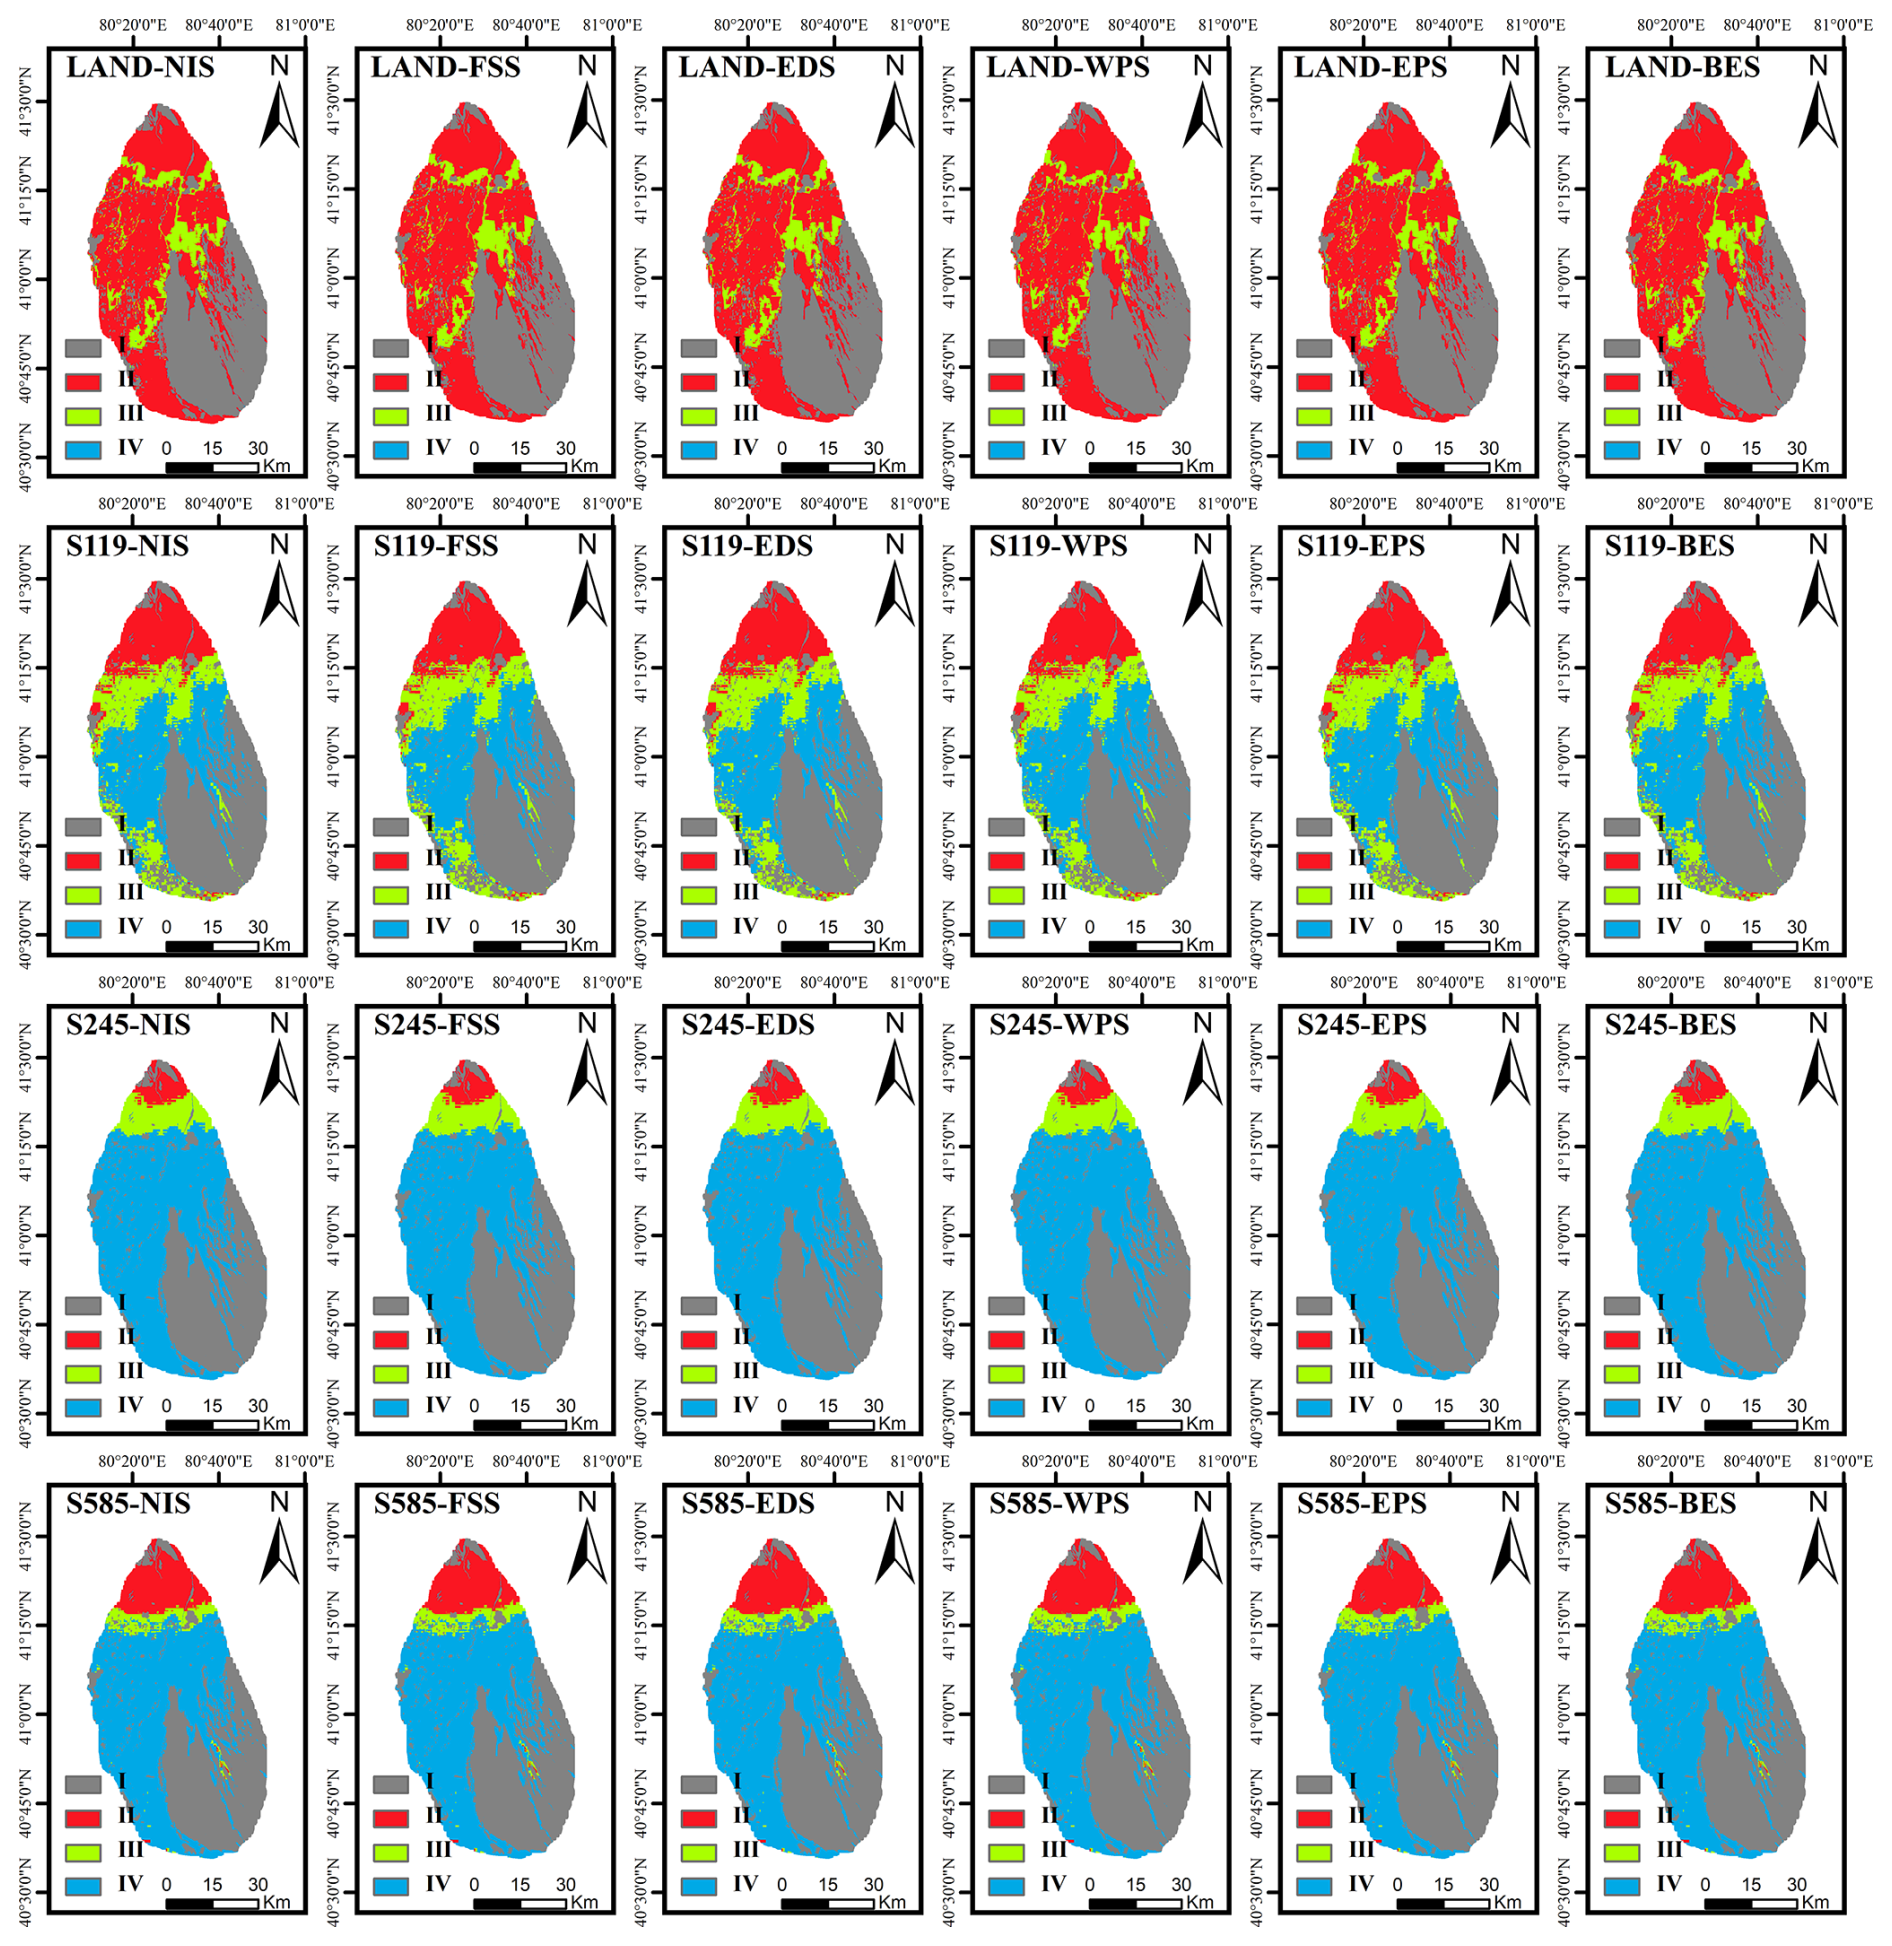
Figure 7Spatial evolution of water supply-demand risk classification levels in the Tailan River Basin under 24 climate-land combination scenarios (2020–2050) (Land change scenarios (Natural Increase Scenario (NIS)/Food Security Scenario (FSS)/Economic Development Scenario (EDS)/Water Protection Scenario (WPS)/Ecological Protection Scenario (EPS)/Balanced Economy and Ecology Scenario (BES)); Climate change scenarios (Land/S119/S245/S585); Color gradient indicates decreasing risk from Level I (highest) to Level VII (lowest)).
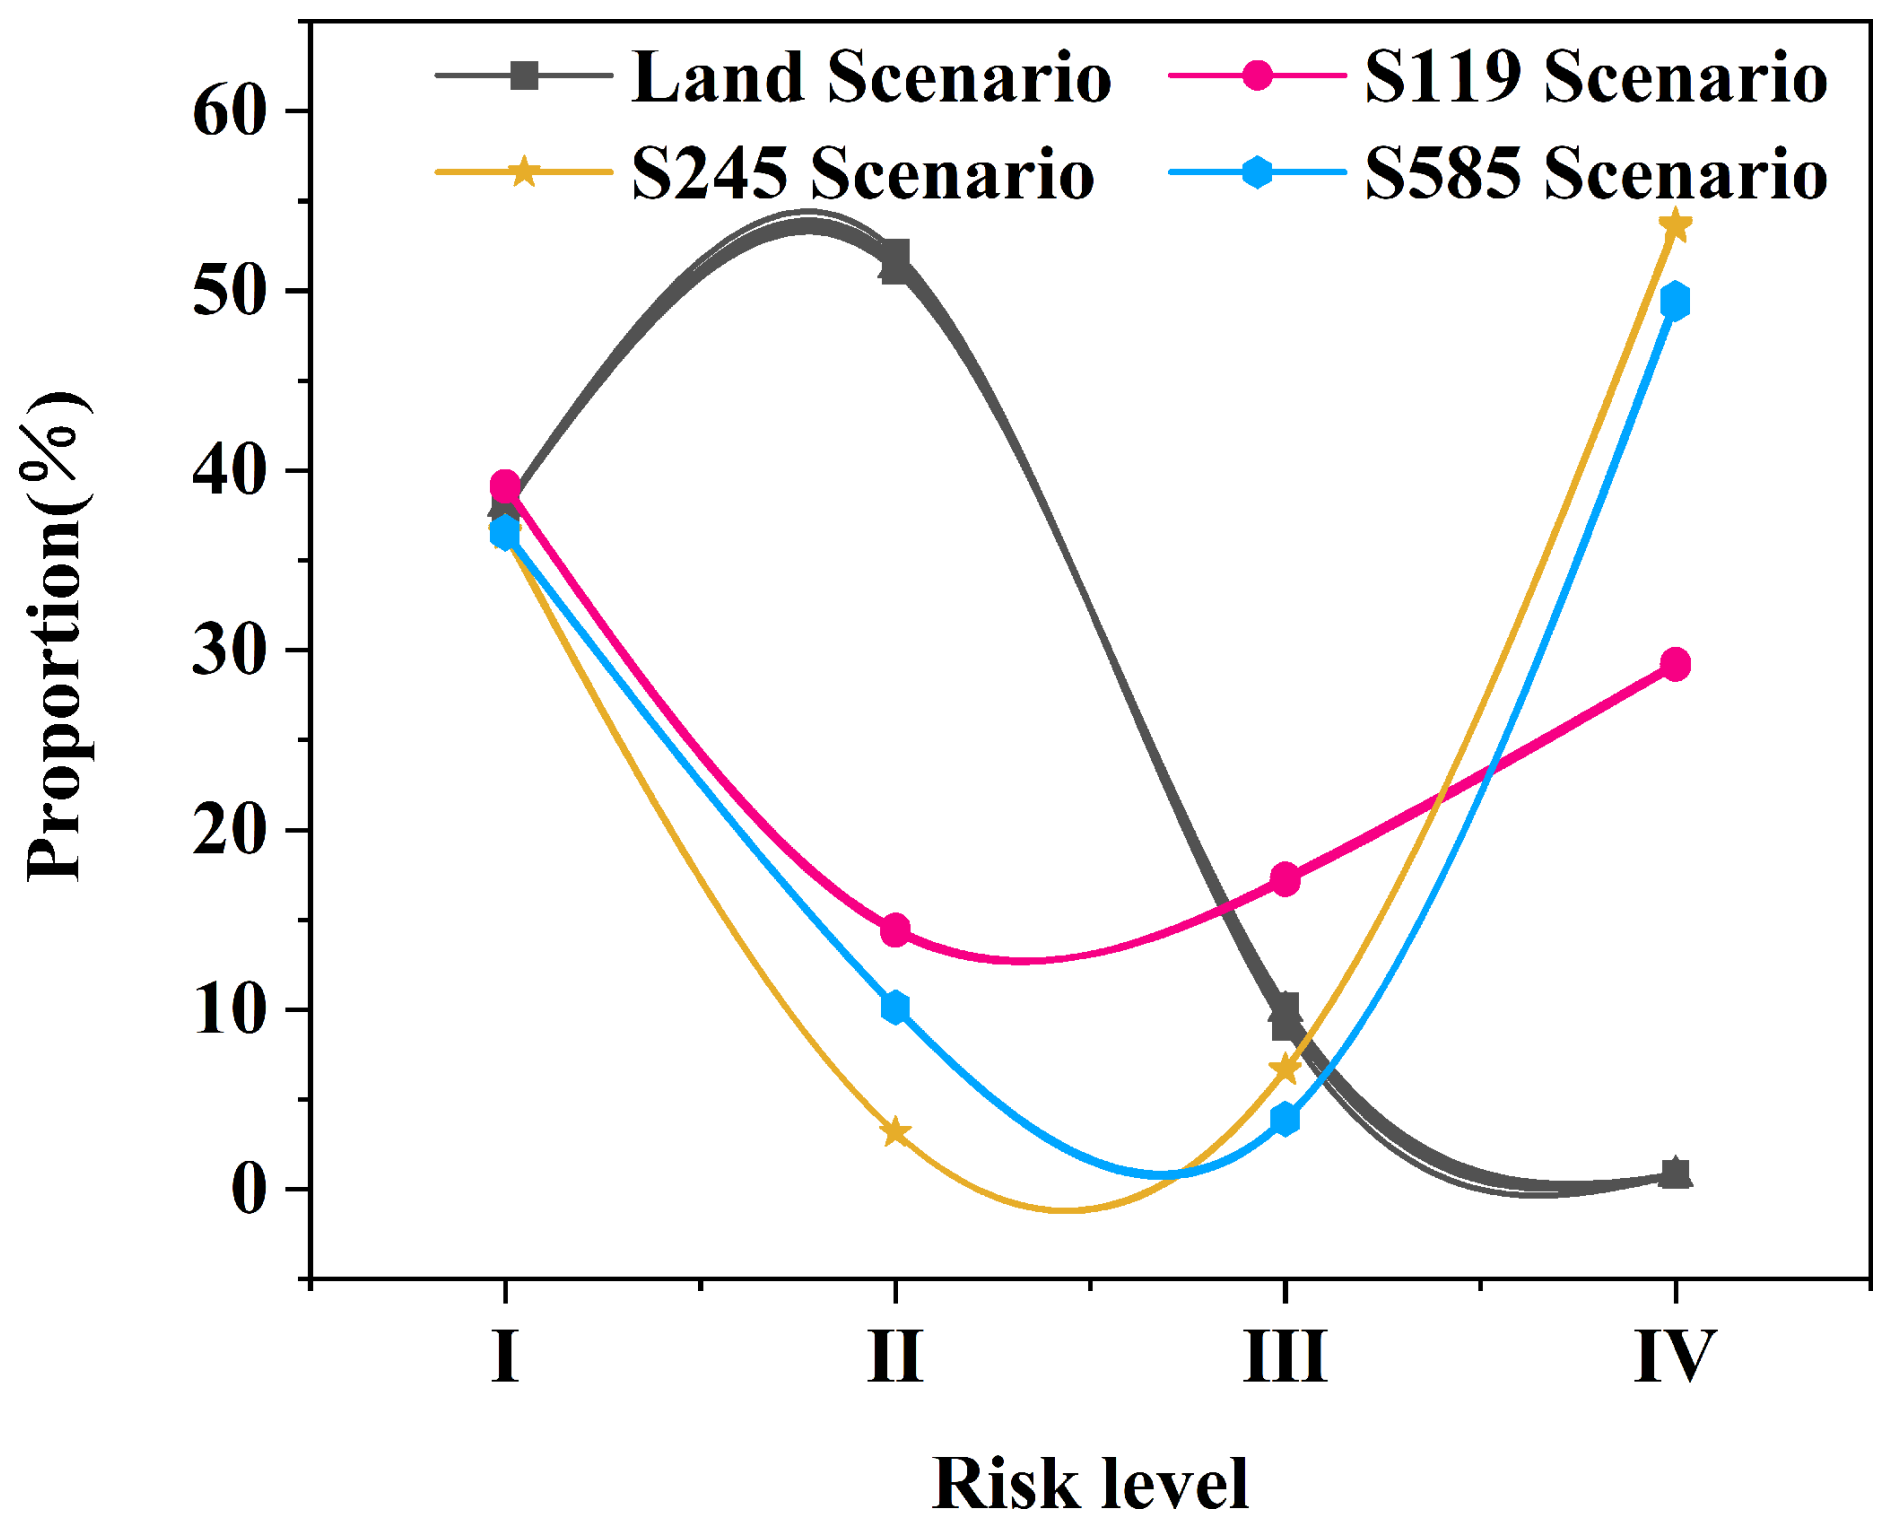
Figure 8Temporal variation in proportional distribution of risk classification levels across the Tailan River Basin (TRB) under 24 climate-land combination scenarios (2020–2050) (decreasing risk from I to VII).
4.1 Multi-scenario land use spatial patterns
Land use changes alter regional hydrological processes and water resource patterns – such as infiltration, groundwater recharge, baseflow, and runoff – thereby affecting regional water supply and demand dynamics (Lin et al., 2007). During 2020–2050, land type transitions in the TRB will predominantly involve cultivated land and grassland, which will profoundly influence water supply-demand dynamics (Fig. 3). In this study, the Food Security Scenario (FSS) prioritizes cohesive cultivated land expansion with high intensification and contiguity (1937.58 km2). Although rapid cultivated land growth directly boosts regional agricultural economies, it significantly increases agricultural irrigation water demands (Sharofiddinov et al., 2024), intensifying pressure on water supply-demand balance. Notably, under the Economic Development Scenario (EDS), further intensification of human activities exacerbates this pressure. Rapid urbanization not only elevates domestic and industrial water demands (He et al., 2021) but may also degrade water quality and availability by altering surface runoff and amplifying non-point source pollution (Strokal et al., 2021).
In contrast, the Ecological Protection Scenario (EPS) reinforces ecological barriers by restraining agricultural expansion and limiting grassland conversion, thereby reducing water consumption. The Water Protection Scenario (WPS) mitigates land fragmentation, potentially preserving more natural hydrological processes and water conservation functions. Together, these measures slow ecological degradation and indirectly support long-term water sustainability. These results demonstrate that the rate of natural resource consumption by human activities (particularly agricultural practices) far exceeds the rate of natural recovery, and this antagonistic relationship weakens as human interventions intensify. Consequently, the Balanced Economic and Ecological Development Scenario (BES) seeks to reconcile economic growth with ecological conservation (especially water resources) by moderately controlling cultivated land and construction land expansion (reducing encroachment on grassland to 689.17 km2), making it a prioritized land use model for the future. Different land use scenarios highlight the critical leverage of land use policies in water resource management. The significant spatial heterogeneity across the region calls for targeted strategies to alleviate future pressures from human activities (especially agriculture) on water resource systems.
Table S1 indicates that using more driving factors does not necessarily improve model performance, and the selection of these factors is a critical source of uncertainty in the results. Although the Random Forest algorithm effectively addresses multicollinearity among factors, complex interactions between driving factors can still introduce noise and increase the predictive uncertainty of simulations (Liang et al., 2021). Specifically, this study achieved optimal simulation accuracy with 13 driving factors. Adding factors with low contributions beyond this number distorted the direction and quantity of simulations, thereby reducing model accuracy. Conversely, when the number of factors was reduced to 7, simulation performance declined significantly. This high sensitivity suggests that the PLUS model is vulnerable to input uncertainty; the absence of key driving factors directly increases bias in the accuracy of simulations. The significant differences in factor contributions (Fig. 4) further highlight uncertainties arising from human activities. The intensity of human activities and population distribution density profoundly influence land use change processes. Changes in population size trigger cascading effects on land resources, agricultural ecosystems, and water resources by altering wealth levels and food calorie demands (Beltran-Peña et al., 2020; Harifidy et al., 2024). Land use change is a multidirectional process, and quantifying human activities (e.g., economic dynamics and population migration) remains challenging. Climate variability further exacerbates simulation uncertainties. Therefore, it is essential to employ multi-scenario simulations to provide decision-makers with a range of possible future land change pathways, thereby reducing policy risks.
4.2 Land use and climate change impacts on water supply-demand dynamics
4.2.1 Impacts of climate change and land use on water supply
Water supply in the TRB is jointly constrained by human activities and climate change. Under the same climate change conditions, there are differences in water supply between different land use scenarios (Table S2), and these differences are caused by different land use structures (Jia et al., 2022). Analysis of variance across the 24 climate-land combination scenarios revealed that their variability range was significantly lower than that of different climate change scenarios (Table S3), indicating that climate change (precipitation) exerts a more pronounced influence on water supply in the TRB than human activities (land use) (Luo et al., 2025). Because precipitation change is the decisive factor driving interannual water supply variation (Zhang et al., 2025b), water yield capacity is highly sensitive to rainfall levels (Shirmohammadi et al., 2020). Significantly similar trends between rainfall and water supply have been found in 17 typical Chinese basins (Guo et al., 2023), and this has also been validated in multiple watersheds in Argentina (Nuñez et al., 2024), the Gulf of Mexico Basin (Ouyang, 2025), and the United States (Duarte et al., 2024).
Furthermore, precipitation exerts a profound influence on the spatial distribution of water resources (Zhang et al., 2011). Rainfall determines the uneven distribution of water resources across different regions, and this influence exhibits distinct characteristics in arid versus humid areas (Zhang et al., 2014; Feng et al., 2025). In arid regions, water supply demonstrates a significant correlation with rainfall, and precipitation can explain a substantial portion of the variability in water availability (Adem et al., 2024). Notably, although water supply in humid areas is more sensitive to rainfall variations than in arid regions, the extreme scarcity of water resources in arid areas means that even minor changes in precipitation can lead to significant discrepancies in water supply-demand relationships. Consequently, arid regions face higher risks and vulnerability regarding water scarcity and thus require greater attention (Taylor et al., 2019).
4.2.2 Impacts of climate change and land use on water demand
Water demand in the TRB is also constrained by both human activities and climate change (Table S2). Under the same land use scenario, water demand varies across different climate scenarios, with this variation driven by temperature-induced changes in irrigation water use (Li et al., 2020). Analysis of variance across the 24 climate-land combination scenarios revealed that the impact of climate change on water demand was significantly lower than that of land use changes (Table S3), indicating that human activities (land use) exert a more substantial influence on water demand in the TRB than climate change. It is clear that irrigation water consumption accounts for the majority of TRB water consumption (Fig. 6). Changes in TRB's irrigation water are closely linked to (1) conversions between cultivated land and other land types, and (2) adjustments in planting patterns within cultivated areas. Studies demonstrate that volatile land allocation significantly affects agricultural irrigation, particularly through land type conversions (Cao et al., 2024). Simultaneously, land fragmentation levels influence water user numbers, while changes in irrigated area and frequency intensify irrigation water pressure (Sharofiddinov et al., 2024). This indicates that expanding cultivated land areas drive increased irrigation water usage (Liu et al., 2025a), aligning with our findings. Additionally, planting area and planting structure significantly impact irrigation water use (Chen et al., 2020). Sun et al. (2024) confined irrigation water within manageable levels while boosting yield and carbon sequestration by adjusting rice, maize, and soybean cultivation areas; Other research reduced irrigation water by 34.48 % while decreasing crop greenhouse gas emissions by 10 % through planting structure optimization (Li et al., 2025a). Moreover, interactions between irrigation technology and planting structure adjustments affect irrigation demand. Wu et al. (2024) found that combining deficit irrigation with high-density planting reduces irrigation water by 20 % without compromising cotton yield. Furthermore, growers' strong traditional agricultural values make produce value and labor costs more critical concerns than irrigation water consumption (McArthur and McCord, 2017; Nourou et al., 2025).For instance, widespread maize cultivation (an economic crop) in the TRB substantially increases regional irrigation water volumes (Huang et al., 2015).Consequently, adjusting regional cropping structures within a macro-agricultural framework is crucial for ensuring sustainable water use and safeguarding growers' economic returns.
Currently, most studies on water supply and demand focus primarily on the unilateral impacts of either climate or human activities (land use changes) (Wen and Liu, 2025; Bai et al., 2025; Deng et al., 2024), or emphasize recent temporal changes. For example, Chen et al. (2024a) quantitatively evaluated the water conservation function of the Yangtze River over the past 40 years, while Ma et al. (2023) analyzed the effects of land use and land cover (LULC) changes on water yield (WY) in the Bosten Lake region from 2000 to 2020. However, studies have shown that complex interactive feedback mechanisms exist between climate change and land use, but their degrees of influence on water resources differ (Qi et al., 2025). Changes in water supply and demand are also affected by their combined impacts (Dey and Mishra, 2017; Tan et al., 2025; Tian et al., 2025). Therefore, it is essential to assess future water supply-demand relationships under the dual influences of climate and land use changes. Based on comprehensive calculations across 24 climate-land combination scenarios, this study revealed a notable disparity between the change in water supply (137.47 × 10⁵ m3) and the change in water demand (3815 × 105 m3), indicating that human activities have a greater impact on water resources in the TRB than climate change. This significant imbalance between water supply and demand will have profound implications for regional water supply-demand risks.
4.3 Land Use and Climate Change Impacts on Water Supply-Demand Risks
By mid-century, water resource vulnerability in the TRB will be profoundly impacted by climate change and human activities (Fig. 7). Global parallels exist: Lu et al. (2024) demonstrated under multiple land-climate scenarios that synergies between crop production and water yield requirements increase agricultural output but exacerbate water deficits. Chen et al. (2023a) documented significant oasis expansion in China (1987–2017), where increased precipitation and runoff provided partial compensation, yet climate-land changes substantially altered regional water supply. Gaines et al. (2024) found forest cover crucial for maintaining consistent surface water areas across climate-land cover scenarios. Based on this, the study established a water supply-demand risk assessment framework, confirming that water demand continues to increase over time, primarily driven by expanding cropland leading to rising irrigation water needs – a finding consistent with previous reports (Qi et al., 2025). Furthermore, this growing demand will exacerbate water supply-demand risks. Although agriculture water demand share of total water demand declines during 2020–2050, it remains dominant (70 %) (Fig. 6). This correlates directly with Sect. 4.2 findings: (1) conversions between cultivated land and other land types, and (2) adjustments in planting patterns within cultivated areas. Crucially, the arid TRB's limited rainfall cannot meet growing irrigation demands, elevating water supply-demand risk (Land scenario). Compared to current rainfall, three other climate scenarios increase precipitation (2020–2050), improving supply and moderately reducing water supply-demand risk (Figs. 7–8). Nevertheless, supply-demand gaps persist at nearly 2 orders of magnitude, with all areas remaining in “hazardous (Level IV) risk”. Thus, human activities remain the primary driver of TRB's water supply-demand risks. Human activities dominate multiple dimensions within these climate-human interactions. Wang et al. (2025) identified human withdrawals as the key driver of reduced runoff and dampened seasonal variability in the Wei River Basin. Similarly, human exceed climate effects on soil moisture decline in China's monsoon loess critical zone (Wang et al., 2024a). Therefore, amid increasing uncertainty, integrating multi-method approaches within water risk frameworks to decipher land-eco-hydrological feedbacks, quantify risks, implement preemptive water regulations, and minimize secondary disasters to ecosystems and societies is imperative.
4.4 Limitations and recommendations for future research
Nevertheless, this study has certain limitations.
- 1.
While land use change served as the starting point of our research, and multiple driving factors were incorporated for land change simulation, uncertainties in the direction and process of land evolution persist – despite the use of defined transition probability ranges and multiple land use scenarios. These uncertainties may constrain an in-depth exploration of the conversion and evolution processes among different land classes. Although we filtered out driving factors with low contributions, the influence of the TRB's unique geographical environment and ecological processes on land class conversion warrants further investigation. Future studies could explore the impact of arid region ecology-climate-environment on land use transition processes under the premise of quantifying national land planning and government policy guidance.
- 2.
This study utilized the InVEST model to simulate water yield and employed 24 climate-land combination scenarios to reduce uncertainty in TRB's development. Although the biophysical table in the water yield module was constructed based on the FAO's Crop Evapotranspiration: Guidelines for Computing Crop Water Requirements (https://www.fao.org/, last access: 20 June 2025) and relevant research (Yan et al., 2020), the evapotranspiration coefficients and plant root depth parameters relied heavily on accurate input values. The dynamic nature of crop growth and water demand processes introduces additional uncertainty into the simulations. To better isolate the independent effects of climate, soil, and vegetation on water supply, follow-up studies should incorporate long-term crop observation data and crop models based on clarified regional cropping structures. This would help refine key parameters (e.g., evapotranspiration coefficients) and disentangle the individual contributions of climate, soil, and vegetation to water supply, thereby reducing uncertainties in the simulation process.
Located in an arid oasis region, water resources constitute the lifeline for human activities and ecosystems in the TRB. However, the arid and rain-scarce climate of TRB has led to a continuous amplification of the impact of human activities on the ecological environment, with irrigation water demand escalating daily (Chen et al., 2023a; Zhu et al., 2025). Concurrently, human survival necessitates improved living standards and economic development, intensifying human-land conflicts. Based on our findings, we recommend adopting the Balanced Economy and Ecology Scenario (BES) development model in the TRB, implementing diverse water-saving measures (sprinkler irrigation, subsurface drip irrigation, brackish water irrigation) to control water consumption (Han et al., 2022; Liang et al., 2024), thereby expanding cultivable land reserves.
Elucidating the impacts of climate change and human activities on water supply-demand risks is critical. We applied the PLUS model with six land change scenarios to identify suitable land development strategies for the TRB, and coupled it with the InVEST model under 24 climate-land scenarios to simulate dynamic changes in water supply and demand. Based on this, a water supply-demand risk framework was established to quantify TRB's water supply-demand risks during 2020–2050. Results show that the Balanced Economy and Ecology Scenario (BES) land development model promotes agricultural growth while protecting ecological barriers, adding 531.2 km2 of cultivated land by 2050. However, this cultivated land expansion creates a water demand deficit (increasing to 4.87 × 10⁸ m3), while maximum regional supply reaches only 0.16 × 10⁸ m3, disrupting water balance. Consequently, the entire TRB will face water crises by 2050, with ≥ 46 % of the area subjected to endangered (Level III) risk. Climate change and human activities jointly drive escalating water supply-demand risks. The root cause lies in persistent cultivated land expansion from intensive human activities, increasing irrigation demand and intensifying supply-demand conflicts. Findings emphasize deep integration of multi-method approaches within the risk framework to decipher land-eco-hydrological feedbacks and consider the complex interrelationships between climate, land, and water supply-demand. Deepening understanding of these linkages is vital for developing effective water scarcity mitigation strategies, providing crucial scientific support for policymakers and land managers.
The data will be made available on request.
The supplement related to this article is available online at https://doi.org/10.5194/hess-29-6373-2025-supplement.
Conceptualization, YY, YKW, WEW, DYC and XTH; Data curation, YY; Formal analysis, YY, YKW and DYC; Funding acquisition, PAJ and XTH; Methodology PAJ, YKW and WEW; Project administration, PAJ, DYC and XTH; Resources, DYC and XTH; Supervision, PAJ, WEW and XTH; Writing – original draft, YY; Writing – review & editing, DYC and XTH.
The contact author has declared that none of the authors has any competing interests.
Publisher's note: Copernicus Publications remains neutral with regard to jurisdictional claims made in the text, published maps, institutional affiliations, or any other geographical representation in this paper. While Copernicus Publications makes every effort to include appropriate place names, the final responsibility lies with the authors. Views expressed in the text are those of the authors and do not necessarily reflect the views of the publisher.
This work was funded by the Major Science and Technology Project of Xinjiang Autonomous Region (2023A02002-1) and Key Research and Development Plan of Shaanxi Province (2023-YBNY-270). In addition, we would like to express our gratitude to both the editors and reviewers for their efforts and suggestions.
This research has been supported by the Major Science and Technology Project of Xinjiang Autonomous Region (2023A02002-1) and Key Research and Development Plan of Shaanxi Province (2023-YBNY-270).
This paper was edited by Lixin Wang and reviewed by two anonymous referees.
Adem, E., Chaabani, A., Yilmaz, N., Boteva, S., Zhang, L., and Elhag, M.: Assessing the impacts of precipitation on water yield estimation in arid environments: Case study in the southwestern part of Saudi Arabia, Sustain. Chem. Pharm., 39, 101539, https://doi.org/10.1016/j.scp.2024.101539, 2024.
Bai, Y., Han, C., Tang, F., Li, Z., Tian, H., Huang, Z., Ma, L., Hu, X., Wang, J., Chen, B., Sun, L., Cheng, X., and Han, H.: Potential Impacts of Land Use Change on Ecosystem Service Supply and Demand Under Different Scenarios in the Gansu Section of the Yellow River Basin, China, Remote Sens.-Basel., 17, 489, https://doi.org/10.3390/rs17030489, 2025.
Beltran-Peña, A., Rosa, L., and D'Odorico, P.: Global food self-sufficiency in the 21st century under sustainable intensification of agriculture, Environ. Res. Lett., 15, 095004, https://doi.org/10.1088/1748-9326/ab9388, 2020.
Berdugo, M., Kéfi, S., Soliveres, S., and Maestre, F. T.: Plant spatial patterns identify alternative ecosystem multifunctionality states in global drylands, Nat. Ecol. Evol., 1, 0003, https://doi.org/10.1038/s41559-016-0003, 2017.
Budyko, M. I. and Miller, D. H.: Climate and life, Academic Press, New York, 6, 461–463, https://doi.org/10.1016/0033-5894(67)90014-2, 1974.
Cao, D., Wang, Y., and Zang, L.: Land reallocation and collective action in the commons: Application of social-ecological system framework with evidence from rural China, Land Use Policy., 144, 107267, https://doi.org/10.1016/j.landusepol.2024.107267, 2024.
Caretta, M. A., Mukherji, A., Arfanuzzaman, M., Betts, R. A., Gelfan, A., Hirabayashi, Y., Lissner, T. K., Liu, J., Lopez Gunn, E., Morgan. R., Mwanga, S., and Suprat, S.: Chapter 4: Water, in: Climate Change 2022: Impacts, Adaptation, and Vulnerability. Contribution of Working Group II to the Sixth Assessment Report of the Intergovernmental Panel on Climate Change, Cambridge Univ. Press, Cambridge and New York, https://www.ipcc.ch/report/ar6/wg2 (last access: 3 November 2025), 2022.
Chen, G., Zuo, D., Xu, Z., Wang, G., Han, Y., Peng, D., Pang, B., Abbaspour, K. C., and Yang, H.: Changes in water conservation and possible causes in the Yellow River Basin of China during the recent four decades, J. Hydrol., 637, 131314, https://doi.org/10.1016/j.jhydrol.2024.131314, 2024a.
Chen, J., Pu, J., Li, J., and Zhang, T.: Response of carbon-and water-use efficiency to climate change and human activities in China, Ecol. Indic., 160, 111829, https://doi.org/10.1016/j.ecolind.2024.111829, 2024b.
Chen, M., Luo, Y., Shen, Y., Han, Z., and Cui, Y.: Driving force analysis of irrigation water consumption using principal component regression analysis, Agr. Water Manage., 234, 106089, https://doi.org/10.1016/j.agwat.2020.106089, 2020.
Chen, P., Wang, S., Liu, Y., Wang, Y., Wang, Y., Zhang, T., Zhang, H., Yao, Y., and Song, J.: Water availability in China's oases decreased between 1987 and 2017, Earth's Future, 11, e2022EF003340, https://doi.org/10.1029/2022EF003340, 2023a.
Chen, W., Li, G., Wang, D., Yang, Z., Wang, Z., Zhang, X., Peng, B., Bi, P., and Zhang, F.: Influence of the ecosystem conversion process on the carbon and water cycles in different regions of China, Ecol. Indic., 148, 110040, https://doi.org/10.1016/j.ecolind.2023.110040, 2023b.
Chen, Y., Fang, G., Li, Z., Zhang, X., Gao, L., Elbeltagi, A., Shaer, H., Duan, W., Wassif, O., Li, Y., Luo, P., Selmi, A., Yu, R., Yang, J., Hu, Y., Liu, C., Long, Y., Malik, I., Fu, A., Wistuba, M., Yang, Y., Zhu, C., and Gao, Y.: The crisis in oases: Research on ecological security and sustainable development in arid regions, Annu. Rev. Env. Resour., 49, 1–20, https://doi.org/10.1146/annurev-environ-111522-105932, 2024c.
Deng, G., Jiang, H., Wen, Y., Ma, S., He, C., Sheng, L., and Guo, Y.: Driving effects of ecosystems and social systems on water supply and demand in semiarid areas, J. Clean. Prod., 482, 144222, https://doi.org/10.1016/j.jclepro.2024.144222, 2024.
Dey, P. and Mishra, A.: Separating the impacts of climate change and human activities on streamflow: A review of methodologies and critical assumptions, J. Hydrol., 548, 278–290, https://doi.org/10.1016/j.jhydrol.2017.03.014, 2017.
Ding, R., Qin, Y., Li, T., and Fu, G.: Exploring spatiotemporal dynamics in temporal stability of soil carbon, nitrogen, phosphorus, and pH in Tibetan grasslands, Geoderma, 451, 117062, https://doi.org/10.1016/j.geoderma.2024.117062, 2024.
Donohue, R. J., Roderick, M. L., and McVicar, T. R.: Roots, storms and soil pores: Incorporating key ecohydrological processes into Budyko's hydrological model, J. Hydrol., 436, 35–50, https://doi.org/10.1016/j.jhydrol.2012.02.033, 2012.
Duarte, H. F., Kim, J. B., Sun, G., McNulty, S. G., and Xiao, J.: Climate and vegetation change impacts on future conterminous United States water yield, J. Hydrol., 639, 131472, https://doi.org/10.1016/j.jhydrol.2024.131472, 2024.
Feng, Y., Sun, F., and Deng, X.: Attributing the divergent changes of drought from humid to dry regions across China, J. Hydrol., 660, 133363, https://doi.org/10.1016/j.jhydrol.2025.133363, 2025.
Gaines, M. D., Tulbure, M. G., Perin, V., Composto, R., and Tiwari, V.: Projecting surface water area under different climate and development scenarios, Earth's Future, 12, e2024EF004625, https://doi.org/10.1029/2024EF004625, 2024.
Gao, L., Tao, F., Liu, R., Wang, Z., Leng, H., and Zhou, T.: Multi-scenario simulation and ecological risk analysis of land use based on the PLUS model: a case study of Nanjing, Sustain. Cities Soc., 85, 104055, https://doi.org/10.1016/j.scs.2022.104055, 2022.
Gharib, A. A., Blumberg, J., Manning, D. T., Goemans, C., and Arabi, M.: Assessment of vulnerability to water shortage in semi-arid river basins: The value of demand reduction and storage capacity, Sci. Total Environ., 871, 161964, https://doi.org/10.1016/j.scitotenv.2023.161964, 2023.
Guo, Q., Yu, C., Xu, Z., Yang, Y., and Wang, X.: Impacts of climate and land-use changes on water yields: Similarities and differences among typical watersheds distributed throughout China, J. Hydrol.-Reg. Stud., 45, 101294, https://doi.org/10.1016/j.ejrh.2022.101294, 2023.
Han, X., Kang, Y., Wan, S., and Li, X.: Effect of salinity on oleic sunflower (Helianthus annuus Linn.) under drip irrigation in arid area of Northwest China, Agr. Water Manage., 259, 107267, https://doi.org/10.1016/j.agwat.2021.107267, 2022.
Harifidy, R. Z., Hiroshi, I., Harivelo, R. Z. M., Jun, M., Kazuyoshi, S., and Keiichi, M.: Assessing future intra-basin water availability in madagascar: Accounting for climate change, population growth, and land use change, Water Res., 257, 121711, https://doi.org/10.1016/j.watres.2024.121711, 2024.
He, C., Liu, Z., Wu, J., Pan, X., Fang, Z., Li, J., and Bryan, B. A.: Future global urban water scarcity and potential solutions, Nat. Commun., 12, 4667, https://doi.org/10.1038/s41467-021-25026-3, 2021.
He, X., Zhang, F., Zhou, T., Xu, Y., Xu, Y., Jim, C. Y., Johnson., B. A., and Ma, X.: Human activities dominated terrestrial productivity increase over the past 22 years in typical arid and semiarid regions of Xinjiang, China, Catena, 250, 108754, https://doi.org/10.1016/j.catena.2025.108754, 2025.
Hu, Y., Cui, C., Liu, Z., and Zhang, Y.: Vegetation dynamics in Mainland Southeast Asia: Climate and anthropogenic influences, Land Use Policy, 153, 107546, https://doi.org/10.1016/j.landusepol.2025.107546, 2025.
Huang, J., Yu, H., Guan, X., Wang, G., and Guo, R.: Accelerated dryland expansion under climate change, Nat. Clim. Change, 6, 166–171, https://doi.org/10.1038/nclimate2837, 2016.
Huang, S., Krysanova, V., Zhai, J., and Su, B.: Impact of intensive irrigation activities on river discharge under agricultural scenarios in the semi-arid Aksu River basin, northwest China, Water Resour Manage., 29, 945–959, https://doi.org/10.1007/s11269-014-0853-2, 2015.
Huang, Y., Zheng, G., Li, X., Xiao, J., Xu, Z., and Tian, P.: Habitat quality evaluation and pattern simulation of coastal salt marsh wetlands, Sci. Total Environ., 945, 174003, https://doi.org/10.1016/j.scitotenv.2024.174003, 2024.
Huggins, X., Gleeson, T., Kummu, M., Zipper, S. C., Wada, Y., Troy, T. J., and Famiglietti, J. S.: Hotspots for social and ecological impacts from freshwater stress and storage loss, Nat. Commun., 13, 439, https://doi.org/10.1038/s41467-022-28029-w, 2022.
Jia, G., Hu, W. M., Zhang, B., Li, G., Shen, S. Y., Gao, Z. H., and Li, Y.: Assessing impacts of the Ecological Retreat project on water conservation in the Yellow River Basin, Sci. Total Environ., 828, 154483, https://doi.org/10.1016/j.scitotenv.2022.154483, 2022.
Jia, G., Li, C., Chen, X., Hu, Y., Chen, W., and Kang, J.: Impacts of Land Use and Climate Change on Water-Related Ecosystem Service Trade-offs in the Yangtze River Economic Belt, Ecosyst. Health Sust., 10, 0208, https://doi.org/10.34133/ehs.0208, 2024.
Jones, E. R., Bierkens, M. F., and van Vliet, M. T.: Current and future global water scarcity intensifies when accounting for surface water quality, Nat. Clim. Chang., 14, 629–635, https://doi.org/10.1038/s41558-024-02007-0, 2024.
Konapala, G., Mishra, A. K., Wada, Y., and Mann, M. E.: Climate change will affect global water availability through compounding changes in seasonal precipitation and evaporation, Nat Commun., 11, 3044, https://doi.org/10.1038/s41467-020-16757-w, 2020.
Kulaixi, Z., Chen, Y., Li, Y., and Wang, C.: Dynamic evolution and scenario simulation of ecosystem services under the impact of land-use change in an arid Inland River Basin in Xinjiang, China, Remote Sens., 15, 2476, https://doi.org/10.3390/rs15092476, 2023.
Li, C., Fu, B., Wang, S., Stringer, L. C., Wang, Y., Li, Z., Liu, Y., and Zhou, W.: Drivers and impacts of changes in China's drylands, Nat. Rev. Earth Environ., 2, 858–873, https://doi.org/10.1038/s43017-021-00226-z, 2021.
Li, F., Xin, Q., Fu, Z., Sun, Y., and Xiong, Y.: A refined supply-demand framework to quantify variability in ecosystem services related to surface water in support of sustainable development goals, Earth's Future, 12, e2023EF004058, https://doi.org/10.1029/2023EF004058, 2024.
Li, M., Wang, L., Singh, V. P., Chen, Y., Li, H., Li, T., Zhou, Z., and Fu, Q.: Green and efficient fine control of regional irrigation water use coupled with crop growth-carbon emission processes, Eur. J. Agron., 164, 127442, https://doi.org/10.1016/j.eja.2024.127442, 2025a.
Li, S., Wei, W., Chen, Y., Duan, W., and Fang, G.: TSWS: An observation-based streamflow dataset of Tianshan Mountains watersheds (1901–2019), Sci Data., 12, 708, https://doi.org/10.1038/s41597-025-05046-0, 2025b.
Li, Z., Fang, G., Chen, Y., Duan, W., and Mukanov, Y.: Agricultural water demands in Central Asia under 1.5 °C and 2.0 °C global warming, Agr. Water Manage., 231, 106020, https://doi.org/10.1016/j.agwat.2020.106020, 2020.
Liang, X., Guan, Q., Clarke, K. C., Liu, S., Wang, B., and Yao, Y.: Understanding the drivers of sustainable land expansion using a patch-generating land use simulation (PLUS) model: a case study in Wuhan, China, Comput. Environ. Urban, 85, 101569, https://doi.org/10.1016/j.compenvurbsys.2020.101569, 2021.
Liang, Y., Wen, Y., Meng, Y., Li, H., Song, L., Zhang, J., Ma, Z., Han, Y., and Wang, Z.: Effects of biodegradable film types and drip irrigation amounts on maize growth and field carbon sequestration in arid northwest China, Agr. Water Manage., 299, 108894, https://doi.org/10.1016/j.agwat.2024.108894, 2024.
Lin, Y. P., Hong, N. M., Wu, P. J., Wu, C. F., and Verburg, P. H.: Impacts of land use change scenarios on hydrology and land use patterns in the Wu-Tu watershed in Northern Taiwan, Landscape Urban Plan., 80, 111–126, https://doi.org/10.1016/j.landurbplan.2006.06.007, 2007.
Lipczynska-Kochany, E.: Effect of climate change on humic substances and associated impacts on the quality of surface water and groundwater: A review, Sci Total Environ., 640, 1548–1565, https://doi.org/10.1016/j.scitotenv.2018.05.376, 2018.
Liu, C., Jiang, E., Qu, B., Li, L., Hao, L., and Zhang, W.: Spatial–temporal evolution of economic-ecological benefits and their driving factors in Yellow River irrigation areas, Ecol. Indic., 173, 113419, https://doi.org/10.1016/j.ecolind.2025.113419, 2025a.
Liu, J., Kuang, W., Zhang, Z., Xu, X., Qin, Y., Ning, J., Zhou, W., Zhang, S., Li, R., Yan, C., Wu, S., Shi, X., Jiang, N., Yu, D., Pan, X., and Chi, W.: Spatiotemporal characteristics, patterns, and causes of land-use changes in China since the late 1980s, J. Geogr. Sci., 24, 195–210, https://doi.org/10.1007/s11442-014-1082-6, 2014.
Liu, X., Liang, X., Li, X., Xu, X., Ou, J., Chen, Y., Li, S., Wang, S., and Pei, F.: A future land use simulation model (FLUS) for simulating multiple land use scenarios by coupling human and natural effects, Landscape Urban Plan., 168, 94–116, https://doi.org/10.1016/j.landurbplan.2017.09.019, 2017.
Liu, X., Liu, Y., Wang, Y., and Liu, Z.: Evaluating potential impacts of land use changes on water supply–demand under multiple development scenarios in dryland region, J. Hydrol., 610, 127811, https://doi.org/10.1016/j.jhydrol.2022.127811, 2022.
Liu, Y., Jing, Y., and Han, S.: Multi-scenario simulation of land use/land cover change and water yield evaluation coupled with the GMOP-PLUS-InVEST model: A case study of the Nansi Lake Basin in China, Ecol. Indic., 155, 110926, https://doi.org/10.1016/j.ecolind.2023.110926, 2023.
Liu, Y., Wang, X., Tan, M., Zhang, F., and Li, X.: Impact of spatial transfer of farmland on the food-water-GHG nexus in China during 2000–2020, Resour. Conserv. Recy., 221, 108390, https://doi.org/10.1016/j.resconrec.2025.108390, 2025b.
Lu, Z., Li, W., and Yue, R.: Investigation of the long-term supply–demand relationships of ecosystem services at multiple scales under SSP–RCP scenarios to promote ecological sustainability in China's largest city cluster, Sustain. Cities Soc., 104, 105295, https://doi.org/10.1016/j.scs.2024.105295, 2024.
Luo, Y., Wu, L., Wang, R., Wang, X., Du, B., and Pang, S.: Will vegetation restoration affect the supply-demand relationship of water yield in an arid and semi-arid watershed?, Sci. Total Environ., 959, 178292, https://doi.org/10.1016/j.scitotenv.2024.178292, 2025.
Ma, S., Wang, L. J., Chu, L., and Jiang, J.: Determination of ecological restoration patterns based on water security and food security in arid regions, Agr. Water Manage., 278, 108171, https://doi.org/10.1016/j.agwat.2023.108171, 2023.
Ma, X., Zhang, P., Yang, L., Qi, Y., Liu, J., Liu, L., Fan, X., and Hou, K.: Assessing the relative contributions, combined effects and multiscale uncertainty of future land use and climate change on water-related ecosystem services in Southwest China using a novel integrated modelling framework, Sustain. Cities Soc., 106, 105400, https://doi.org/10.1016/j.scs.2024.105400, 2024.
Maron, M., Mitchell, M. G. E., Runting, R. K., Rhodes, J. R., Mace, G. M., Keith, D. A., and Watson, J. E. M.: Towards a threat assessment framework for ecosystem services, Trends Ecol. Evol., 32, 240–248, https://doi.org/10.1016/j.tree.2016.12.011, 2017.
McArthur, J. W. and McCord, G. C.: Fertilizing growth: Agricultural inputs and their effects in economic development, J. Dev. Econ., 127, 133–152, https://doi.org/10.1016/j.jdeveco.2017.02.007, 2017.
Mukherji, A.: Climate Change 2023 Synthesis Report, https://www.ipcc.ch/report/sixth-assessment-report-cycle/ (last access: 20 June 2025), 2023.
Nourou, A. I. M., Garba, M., Grimsby, L. K., and Aune, J. B.: Manual or Motorized Postharvest Operations of Pearl Millet in Maradi, Niger: Effects on Time and Energy Use, Profitability, and Farmers' Perceptions, Food Energy Secur., 14, e70054, https://doi.org/10.1002/fes3.70054, 2025.
Nuñez, J. A., Aguiar, S., Jobbágy, E. G., Jiménez, Y. G., and Baldassini, P.: Climate change and land cover effects on water yield in a subtropical watershed spanning the yungas-chaco transition of Argentina. J Environ Manage., 358, 120808, https://doi.org/10.1016/j.jenvman.2024.120808, 2024.
O'Neill, B. C., Tebaldi, C., van Vuuren, D. P., Eyring, V., Friedlingstein, P., Hurtt, G., Knutti, R., Kriegler, E., Lamarque, J.-F., Lowe, J., Meehl, G. A., Moss, R., Riahi, K., and Sanderson, B. M.: The Scenario Model Intercomparison Project (ScenarioMIP) for CMIP6, Geosci. Model Dev., 9, 3461–3482, https://doi.org/10.5194/gmd-9-3461-2016, 2016.
O'Neill, B. C., Kriegler, E., Ebi, K. L., Kemp-Benedict, E., Riahi, K., Rothman, D. S., van Ruijven, B. J., van Vuuren, D. P., Birkmann, J., Kok, K., Levy, M., and Solecki, W.: The roads ahead: narratives for shared socioeconomic pathways describing world futures in the 21st century, Global Environ. Chang., 42, 169–180, https://doi.org/10.1016/j.gloenvcha.2015.01.004, 2017.
Ouyang, Y.: Comparative analysis of evapotranspiration and water yield in basins of the Northern Gulf of America between the past and next 40 years, J. Environ Manage., 381, 125157, https://doi.org/10.1016/j.jenvman.2025.125157, 2025.
Perez, N., Singh, V., Ringler, C., Xie, H., Zhu, T., Sutanudjaja, E. H., and Villholth, K. G.: Ending groundwater overdraft without affecting food security, Nat. Sustain., 7, 1007–1017, https://doi.org/10.1038/s41893-024-01376-w, 2024.
Piao, S., Friedlingstein, P., Ciais, P., de Noblet-Ducoudré, N., Labat, D., and Zaehle, S.: Changes in climate and land use have a larger direct impact than rising CO2 on global river runoff trends, P. Natl. Acad. Sci. USA, 104, 15242–15247, https://doi.org/10.1073/pnas.0707213104, 2007.
Qi, P., Li, B., Zhang, D., Xu, H., and Zhang, G.: Supply and demand of agricultural water resources under future saline-alkali land improvement, Agr. Water Manage., 314, 109503, https://doi.org/10.1016/j.agwat.2025.109503, 2025.
Sharofiddinov, H., Islam, M., and Kotani, K.: How does the number of water users in a land reform matter for water availability in agriculture?, Agr. Water Manage., 293, 108677, https://doi.org/10.1016/j.agwat.2024.108677, 2024.
Shi, Q., Gu, C. J., and Xiao, C.: Multiple scenarios analysis on land use simulation by coupling socioeconomic and ecological sustainability in Shanghai, China, Sustain. Cities Soc., 95, 104578, https://doi.org/10.1016/j.scs.2023.104578, 2023.
Shirmohammadi, B., Malekian, A., Salajegheh, A., Taheri, B., Azarnivand, H., Malek, Z., and Verburg, P. H.: Impacts of future climate and land use change on water yield in a semiarid basin in Iran, Land Degrad. Dev., 31, 1252–1264, https://doi.org/10.1002/ldr.3554, 2020.
Song, K., Cheng, W., Wang, B., and Xu, H.: Impact of landform on Spatial-Temporal distribution and Scenario-Based prediction of carbon stocks in arid Regions: A Case study of Xinjiang, Catena, 250, 108781, https://doi.org/10.1016/j.catena.2025.108781, 2025.
Strokal, M., Bai, Z., Franssen, W., Hofstra, N., Koelmans, A., Ludwig, F., Ma, L., Puijenbroek, P., Spanier, J., Vermeulen, L., Vliet, M., Wijnen, J., and Kroeze, C.: Urbanization: an increasing source of multiple pollutants to rivers in the 21st century, npj Urban Sustain., 1, 24, https://doi.org/10.1038/s42949-021-00026-w, 2021.
Sun, J., Yang, Y., Qi, P., Zhang, G., and Wu, Y.: Development and application of a new water-carbon-economy coupling model (WCECM) for optimal allocation of agricultural water and land resources, Agr. Water Manage., 291, 108608, https://doi.org/10.1016/j.agwat.2023.108608, 2024.
Tan, X., Liu, B., Tan, X., Huang, Z., and Fu, J.: Combined impacts of climate change and human activities on blue and green water resources in a high-intensity development watershed, Hydrol. Earth Syst. Sci., 29, 427–445, https://doi.org/10.5194/hess-29-427-2025, 2025.
Taylor, C., Blair, D., Keith, H., and Lindenmayer, D.: Modelling water yields in response to logging and representative climate futures, Sci. Total Environ., 688, 890–902, https://doi.org/10.1016/j.scitotenv.2019.06.298,2019.
Tian, S., Wu, W., Chen, S., Li, Z., and Li, K.: Global Mismatch between Ecosystem Service Supply and Demand Driven by Climate Change and Human Activity, Environ. Sci. Ecotechnol., 100573, https://doi.org/10.1016/j.ese.2025.100573, 2025.
Wang, M., Jiang, S., Ren, L., Cui, H., Yuan, S., Xu, J., and Xu, C. Y.: Attribution of streamflow and its seasonal variation to dual nature-society drivers using CMIP6 data and hydrological models, J. Hydrol., 659, 133314, https://doi.org/10.1016/j.jhydrol.2025.133314, 2025.
Wang, Y., Hu, W., Sun, H., Zhao, Y., Zhang, P., Li, Z., and An, Z.: Soil moisture decline in China's monsoon loess critical zone: More a result of land-use conversion than climate change, P. Natl. Acad. Sci. USA, 121, e2322127121, https://doi.org/10.1073/pnas.2322127121, 2024a.
Wang, Y., Li, M., and Jin, G.: Optimizing spatial patterns of ecosystem services in the Chang-Ji-Tu region (China) through Bayesian Belief Network and multi-scenario land use simulation, Sci. Total Environ., 917, 170424, https://doi.org/10.1016/j.scitotenv.2024.170424, 2024b.
Wen, R. and Liu, Z.: Exploring trade-offs and synergies between economy development and ecosystem sustainability of the eco-fragile regions in the context of food security, J. Clean. Prod., 510, 145604, https://doi.org/10.1016/j.jclepro.2025.145604, 2025.
Wu, F., Tang, Q., Cui, J., Tian, L., Guo, R., Wang, L., Zheng, Z., Zhang, N., Zhang, Y., Lin, T.: Deficit irrigation combined with a high planting density optimizes root and soil water-nitrogen distribution to enhance cotton productivity in arid regions, Field Crop Res., 317, 109524, https://doi.org/10.1016/j.fcr.2024.109524 2024
Yan, F., Shangguan, W., Zhang, J., and Hu, B.: Depth-to-bedrock map of China at a spatial resolution of 100 meters, Sci. Data, 7, 2, https://doi.org/10.1038/s41597-019-0345-6, 2020.
Yan, H., Xie, Z., Jia, B., Li, R., Wang, L., Tian, Y., and You, Y.: Impact of groundwater overextraction and agricultural irrigation on hydrological processes in an inland arid basin, J. Hydrol., 653, 132770, https://doi.org/10.1016/j.jhydrol.2025.132770, 2025.
Yao, J., Chen, Y., Guan, X., Zhao, Y., Chen, J., and Mao, W.: Recent climate and hydrological changes in a mountain–basin system in Xinjiang, China, Earth-Sci. Rev., 226, 103957, https://doi.org/10.1016/j.earscirev.2022.103957, 2022.
Zeng, F., He, Q., Li, Y., Shi, W., Yang, R., Ma, M., Huang, W., Xiao, J., Yang, X., and Di, D.: Reduced runoff in the upper Yangtze River due to comparable contribution of anthropogenic and climate changes, Earth's Future, 12, e2023EF004028, https://doi.org/10.1029/2023EF004028, 2024.
Zhang, Q., Peng, J., Singh, V. P., Li, J., and Chen, Y.: Spatio-temporal variations of precipitation in arid and semiarid regions of China: the Yellow River basin as a case study, Global Planet. Change, 114, 38–49, https://doi.org/10.1016/j.gloplacha.2014.01.005, 2014.
Zhang, H., Li, X., Luo, Y., Chen, L., and Wang, M.: Spatial heterogeneity and driving mechanisms of carbon storage in the urban agglomeration within complex terrain: Multi-scale analyses under localized SSP-RCP narratives, Sustain. Cities Soc., 109, 105520, https://doi.org/10.1016/j.scs.2024.105520, 2024.
Zhang, L., Hickel, K., Dawes, W. R., Chiew, F. H. S., Western, A. W., and Briggs, P. R.: A rational function approach for estimating mean annual evapotranspiration, Water Resour. Res., 40, W02502, https://doi.org/10.1029/2003WR002710, 2004.
Zhang, M., Gao, Y., and Ge, J.: Different responses of extreme and mean precipitation to land use and land cover changes, npj Clim. Atmos. Sci., 8, 1–9, https://doi.org/10.1038/s41612-025-01049-1, 2025a.
Zhang, Q., Singh, V. P., Sun, P., Chen, X., Zhang, Z., and Li, J.: Precipitation and streamflow changes in China: changing patterns, causes and implications, J. Hydrol., 410, 204–216, https://doi.org/10.1016/j.jhydrol.2011.09.017, 2011.
Zhang, T., Shao, Q., and Huang, H.: Understanding the efficiency and uncertainty of water supply service assessment based on the Budyko framework: A case study of the Yellow River Basin, China, Ecol. Indic., 173, 113395, https://doi.org/10.1016/j.ecolind.2025.113395, 2025b.
Zhou, W., Liu, G., Pan, J., and Feng, X.: Distribution of available soil water capacity in China, J. Geogr. Sci., 15, 3–12, https://doi.org/10.1007/BF02873101, 2005.
Zhu, G., Qiu, D., Zhang, Z., Sang, L., Liu, Y., Wang, L., Zhao, K., Ma, H., Xu, Y., and Wan, Q.: Land-use changes lead to a decrease in carbon storage in arid region China, Ecol. Indic., 127, 107770, https://doi.org/10.1016/j.ecolind.2021.107770, 2021.
Zhu, Y., Zheng, Z., Zhao, G., Zhu, J., Zhao, B., Sun, Y., Gao, J., and Zhang, Y.: Evapotranspiration increase is more sensitive to vegetation greening than to vegetation type conversion in arid and semi-arid regions of China, Global Planet. Change, 244, 104634, https://doi.org/10.1016/j.gloplacha.2024.104634, 2025.
Zhuang, D., Liu, J., and Liu, M.: Research activities on land-use/cover change in the past ten years in China using space technology, Chin. Geograph. Sc., 9, 330–334, https://doi.org/10.1007/s11769-999-0006-3, 1999.