the Creative Commons Attribution 4.0 License.
the Creative Commons Attribution 4.0 License.
 | 07 Nov 2025
What is a drought-to-flood transition? Pitfalls and recommendations for defining consecutive hydrological extreme events
Bailey J. Anderson
Eduardo Muñoz-Castro
Lena M. Tallaksen
Alessia Matano
Jonas Götte
Rachael Armitage
Eugene Magee
Manuela I. Brunner
Research into rapid transitions between hydrological drought and flood is growing in popularity, in part due to media-reported catastrophic impacts from recent events. Droughts and floods are typically studied as events that are independent from one another. Thus, a clear definition and assessment of the methods used to define consecutive drought-to-flood transition events does not yet exist. Here, we use a series of eight catchments that have experienced real-world impacts from drought-to-flood transitions as case studies. We assess the suitability of and differences between event selection methods applied to observational data. We demonstrate that different threshold level methods can alter the characteristics of selected events. The number and timing of transitions differs substantially between threshold level approaches in highly seasonal regimes as opposed to those with a weaker seasonality. The time period used to define the maximum interval between drought and flood also influences whether transitions are detected. We show that the probability of a transition occurring within a set time window could vary substantially between different methodologies and catchments. We also show that previously applied methodologies would likely fail to detect transition events that have been broadly impactful in the historical record. For the eight case study events taken from media, governmental and scientific reports, only three of the transitions were successfully detected. We qualitatively assessed the streamflow time series of the case study catchments, and outline a number of potential pitfalls in the event detection process. Finally, we make recommendations regarding methodological choices in the context of potential impacts of interest, and outline some priorities for future methodological development and research.
- Article
(4573 KB) - Full-text XML
-
Supplement
(375 KB) - BibTeX
- EndNote


Consecutively occurring droughts and floods have received considerable media attention in recent years due to impacts resulting from large events. For example, in Italy, a severe multi-year drought in the Po River region, described as one of the worst on record (Montanari et al., 2023), was followed by the May 2023 flood in Emilia Romagna, affecting the lower tributaries of the Po. The flood event resulted in levee breaches, landslides, widespread infrastructure damage, and loss of life (Martina et al., 2024). From January 2010 to March 2012, large parts of England and Wales experienced a severe drought, which was ended abruptly by the wettest April to June period on record for much of the region. This period was characterized by heavy rainfall and flooding through the summer and autumn (Kendon et al., 2013; Parry et al., 2013; Marsh et al., 2013). There is growing recognition that, although droughts and floods represent opposite hydrological hazards, there is a need to study them in relation to one another because they may exacerbate the impacts, extent, or magnitude of each other under certain circumstances (Brunner et al., 2021; Ward et al., 2020).
Drought-to-flooded transitions, that is, floods that occur shortly after hydrological drought, challenge the effectiveness of disaster risk reduction measures that target only one hydrological extreme at a time, highlighting the need for integrated strategies that address both floods and droughts together (Ward et al., 2020; Brunner et al., 2021). Recently, Barendrecht et al. (2024) performed a global review of the drivers and impacts of drought-to-flood transitions, demonstrating the potential for increased impacts, the importance of short rainfall events as drivers of transitions, and highlighting the relative scarcity of research into consecutive drought and flood events. Management strategies may not be easily shifted to handle consecutive extremes, and measures taken to mitigate one extreme may adversely effect the other (Di Baldassarre et al., 2017; Ward et al., 2020). For example, quickly shifting between water storage strategies in dual-purpose reservoirs, which aid in the management of both flood and drought risk, can be difficult (Ward et al., 2020; Lal et al., 2020; Rogers and Tsirkunov, 2010). Further, wet and dry cycles can challenge the integrity of infrastructure. For instance, drought can increase the chance of levee and dike failures during flood events, which, in turn, can lower defenses against flood risk and reduce water supply during subsequent drought periods (Ward et al., 2020; Van Baars, 2005; van Huijgevoort et al., 2012; Hubble and De Carli, 2016). Socioeconomic challenges can also stem from insufficient recovery time between events as well as shifting land use practices during prolonged drought periods (Barendrecht et al., 2024; Ward et al., 2020; Gallina et al., 2016). Water quality issues may arise from pollutant accumulation during drought that is mobilized together with topsoil loss during subsequent runoff events (Barendrecht et al., 2024; Mishra et al., 2021; Levy et al., 2016; Laudon et al., 2005; Wurtsbaugh et al., 2019; Effler et al., 2001). Further concerns center around physical processes. For example, changes in soil properties during drought may result in increased runoff in some locations (Descroix et al., 2013; Matanó et al., 2024). Changes in soil infiltration rates are often cited as a cause of increases in surface runoff during precipitation events following dry periods (Gimbel et al., 2016; Barendrecht et al., 2024; Matanó et al., 2025).
From a meteorological or atmospheric perspective, the topic of drought-to-flood transitions has received a great deal of recent attention. Swain et al. (2025) reviewed the current literature on hydroclimate volatility (i.e., sudden, large and/or frequent transitions between opposite extremes). They further introduced a formal definition of the concept of “hydroclimatic whiplash”, in which the Standardized Precipitation Evapotranspiration Index is used to define swings in atmospheric conditions. They show increasing hydroclimatic volatility, including rapid swings between wet and dry states in the atmosphere (Swain et al., 2025). Others have similarly shown an increasing probability of risk from an intensification of rapid swings between hydroclimatic extremes, relying on standardized indices (Casson et al., 2019; Na and Najafi, 2024). Although rapid changes between wet and dry conditions have been widely studied in the meteorological sciences, attention to this phenomenon is relatively new in hydrology.
To our knowledge, only a few large sample analyses of drought-to-flood transition events have been published to date. Götte and Brunner (2024) investigate the distribution and frequency of drought-to-flood transition occurrence in the United States and highlight that transition times vary within and between catchments. They find that a majority of detected transitions occur in the typical high flow season and are driven by snow melt, especially in high-altitude catchments. Matanó et al. (2024) explore historical drought-to-flood transitions at a global scale and argue that, by their definition, in which droughts are defined under a variable threshold and floods over a fixed monthly threshold, 24 % of floods globally have been preceded by drought conditions. Several more papers have been published that use standardized index approaches to further explore abrupt switches between dry and wet periods in streamflow (e.g. Liu et al., 2016b; Cui et al., 2025; Li et al., 2016).
Although scientific interest in the topic of drought-to-flood transitions is growing, the definition of a drought-to-flood transition event is not yet widely agreed upon. Detection of drought and flood events individually is usually performed using annual maxima/minima or threshold level approaches applied to the original streamflow time series (Meylan et al., 2012). The application of threshold level methods for drought and flood detection requires a number of choices, including the choice of threshold level approach and the threshold level itself, smoothing and aggregation of streamflow time series, and event merging windows (Stahl et al., 2020; Van Loon and Laaha, 2015). Depending on these choices, different drought and flood events may be identified, and the characteristics of those events can differ substantially (Tallaksen and Van Lanen, 2023).
A given methodological choice may therefore result in the selection of transition events that differ in their drivers and characteristics (e.g., timing, severity, duration) when a large number of disparate catchments are studied (England et al., 2019; Tallaksen and Van Lanen, 2023). For instance, drought events identified using a seasonal or daily varying threshold delineate “drought” in periods experiencing a deviation from the normal flow at that time of the year, regardless of whether or not it corresponds to absolute low flows or dry conditions. Depending on the context, these anomalies may or may not represent impactful events. As an example, drought events caused by a delay in the onset of the snowmelt season may be detected with this approach. This deficit could conceivably have impacts, for example, abnormally low water levels could reduce hydropower generation at the time of occurrence (Hisdal et al., 2024; Hisdal et al., 2000; Stahl et al., 2020; Tallaksen and Van Lanen, 2023). Failure to detect and accurately identify drought-to-flood transitions which are of interest in an analysis could lead to ineffective management strategies, misleading impact quantification, inaccurate risk assessments, or incomplete process understanding. Thus, further investigation into, and consideration of, how the choice of threshold influences the identification and characteristics of events is needed for burgeoning research into drought-to-flood transitions to deliver broadly meaningful results.
Here, we qualitatively and quantitatively assess a series of eight case study catchments and historical flood and drought events. We explore how imprecision in the definition of drought-to-flood transitions might lead to very different research outcomes, and we aim to better understand how to define drought-to-flood transitions. We are primarily focused on generating insight for contexts which require generalized definitions and approaches across a number of catchments. We focus specifically on drought and flood events identified in the original streamflow time series by applying threshold level approaches, rather than relying on standardized indices. This choice was made to ensure that the case studies pertain to impactful extreme events, rather than periods of anomalous flow. Furthermore, streamflow, to some extent, already represents an aggregate value, and standardized indices can be very sensitive to the temporal aggregation period (Lema et al., 2025). Further, the use of standardized indices such as the standardized streamflow index (SSI) could introduce additional uncertainty to the identification of transition events, including through the choice of distribution and fitting method (parametric method) as well as choice of non-parametric methods (Tijdeman et al., 2020). We apply three different threshold level approaches to the case study catchments, and compare the detected transition events with media reported events in both a quantitative and qualitative manner. The reported case study events allow us to evaluate the performance of transition detection methods against flood and drought events that have been reported by media outlets and national authorities. We use the media-documented events to evaluate the methods, assuming that these can be seen as a benchmark, since media has been shown to be a reliable source of information regarding impact occurrence (Stahl et al., 2016). This approach allows us to contextualize the definitions of drought-flood transitions relative to observed events in the case study analysis, and assess to what degree transitions are a concern in the selected catchments. In the quantitative analysis, we primarily focus on the characteristics of the detected transition events, asking:
-
How effectively do the methods detect the documented drought-to-flood transition events in each case study?
-
How does seasonality impact the detection of events?
-
How and why do the number and type of transition events detected differ among methods?
In the qualitative assessment, we discuss potential pitfalls in the definition of transition events based on existing literature and present these along with examples from the case study catchments.
2.1 Case studies
We select eight case study catchments (Fig. 1) for which media and/or scientific reports describe a flooding event following drought conditions, and for which daily or higher resolution streamflow data are available. The case study catchments include the Daintree River in Australia, the Ventura River in California, USA, the Rio Colorado in central Chile, the River Aire in Northern England, the River Savio in Italy (a tributary of the Po), the Emme in Switzerland, the Ulvåa River in Norway (a tributary of the Glomma), and the Llano River in Texas, USA. Catchment information, including gauge ID and data sources, catchment area, and the drivers of the case study events are included in the Supplement (Table S1).
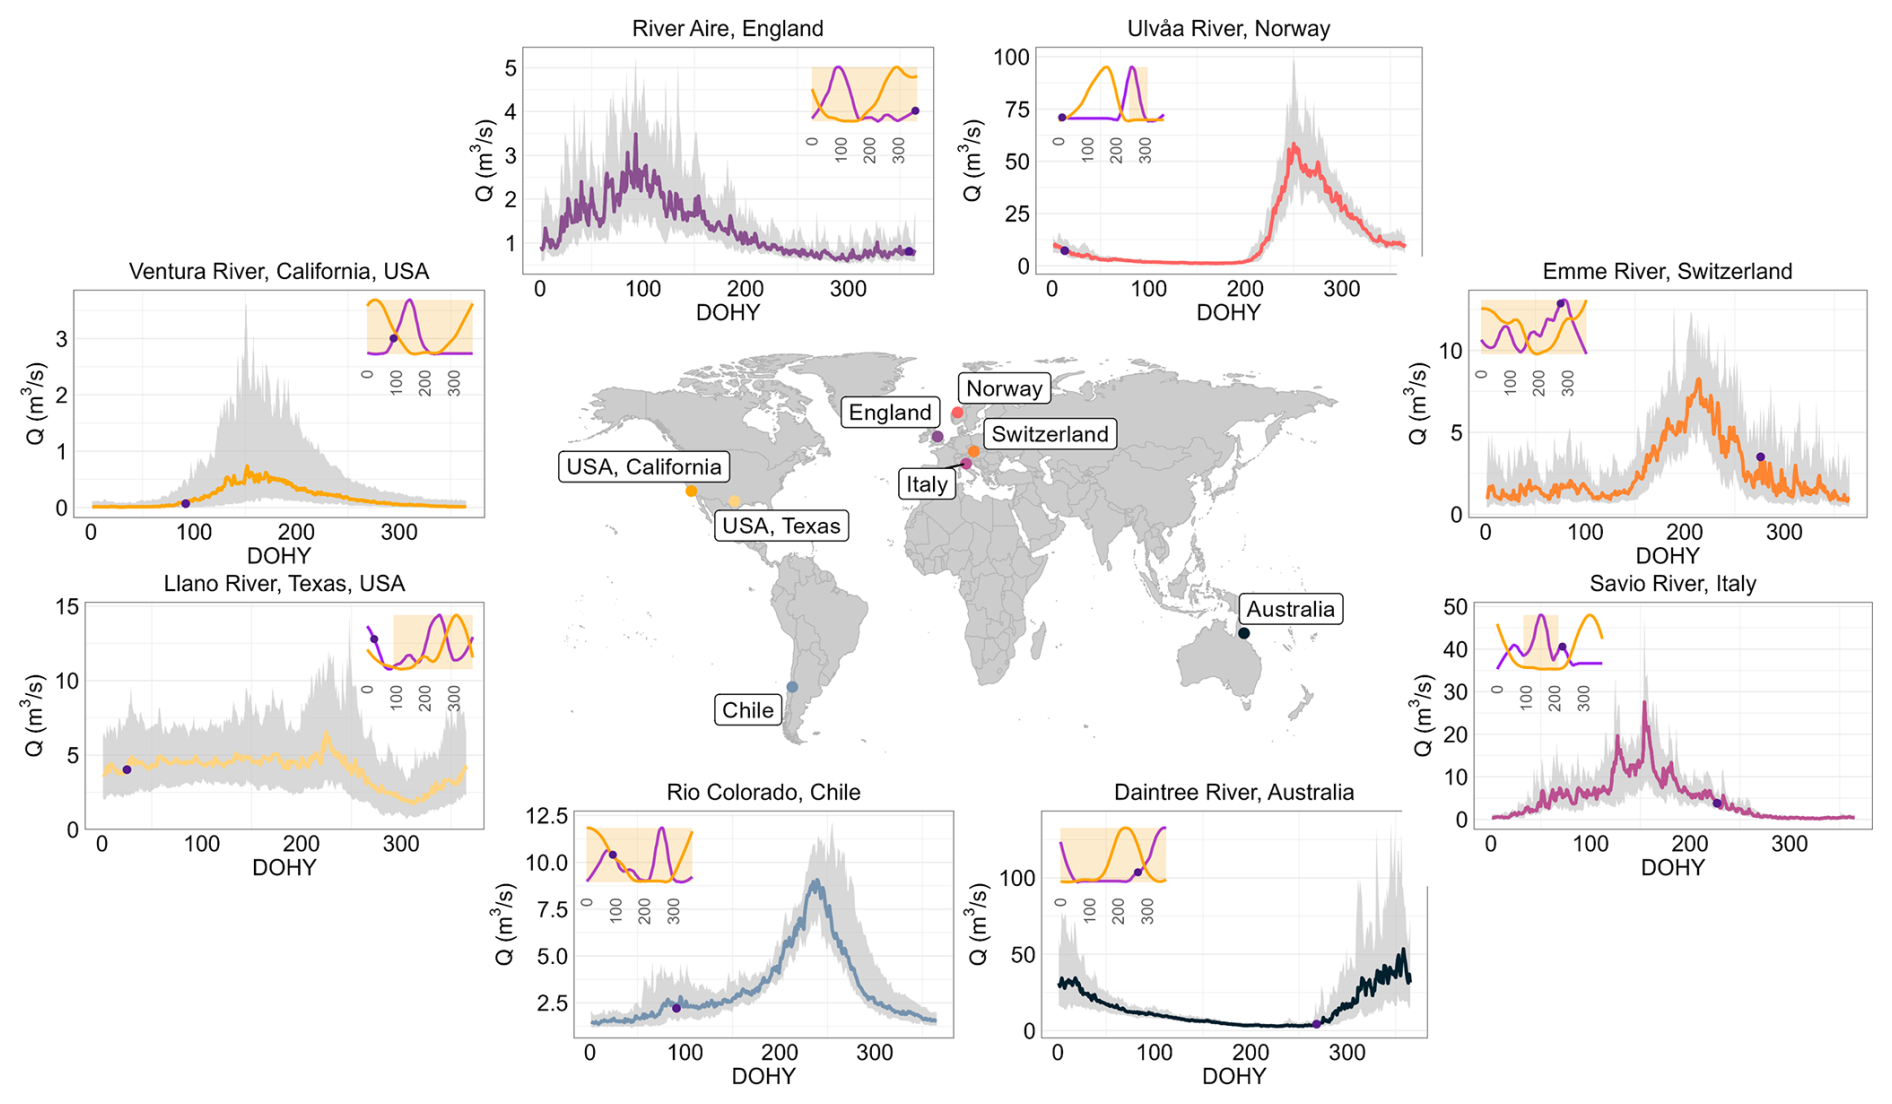
Figure 1Regime plots showing the median hydrograph (bold line) for each case study catchment. The grey ribbon represents the inter-quartile range for each day of the hydrological year (DOHY), beginning on 1 April in the Southern Hemisphere and 1 October in the Northern Hemisphere. In the upper corner of each regime plot, the loess-smoothed Q99 frequency distribution is included as a purple line and the loess smoothed frequency distribution of streamflow days under the 20th percentile as an orange line. The timing of the reported case study drought event is presented as an orange overlay and the timing of the reported case study flood as a purple dot. Multi-year drought spans the entire year in these plots. Note that these sub-plots are frequency distributions, ranging between 0 and 1, where higher values indicate a relatively greater frequency of occurrence. These indicate how well extreme flood timing and typical low flow season timing correspond to the median regime.
Reported drought-to-flood transitions are referred to as “case study events”. Drought impacts for these case study events range from relatively minor e.g. altered sensitivity to salinity in mangrove plants in Australia (Beckett et al., 2023), to more severe, e.g. wide spread policy reform due to an energy crisis caused, in part, by a reduction in water available for hydropower in Chile (Murillo and Foulon, 2006). Similarly wide ranging impacts were reported for floods. Some floods resulted in minor road closures and water inside buildings, e.g. in the Swiss case study (Bürki, 2022) whereas others, such as the Italian case study, resulted in multiple deaths, landslides, and billions of Euros in reported losses (Povoledo, 2023). A non-comprehensive table listing reported impacts and event occurrence dates is presented in Table 1.
Table 1Description of case study events.
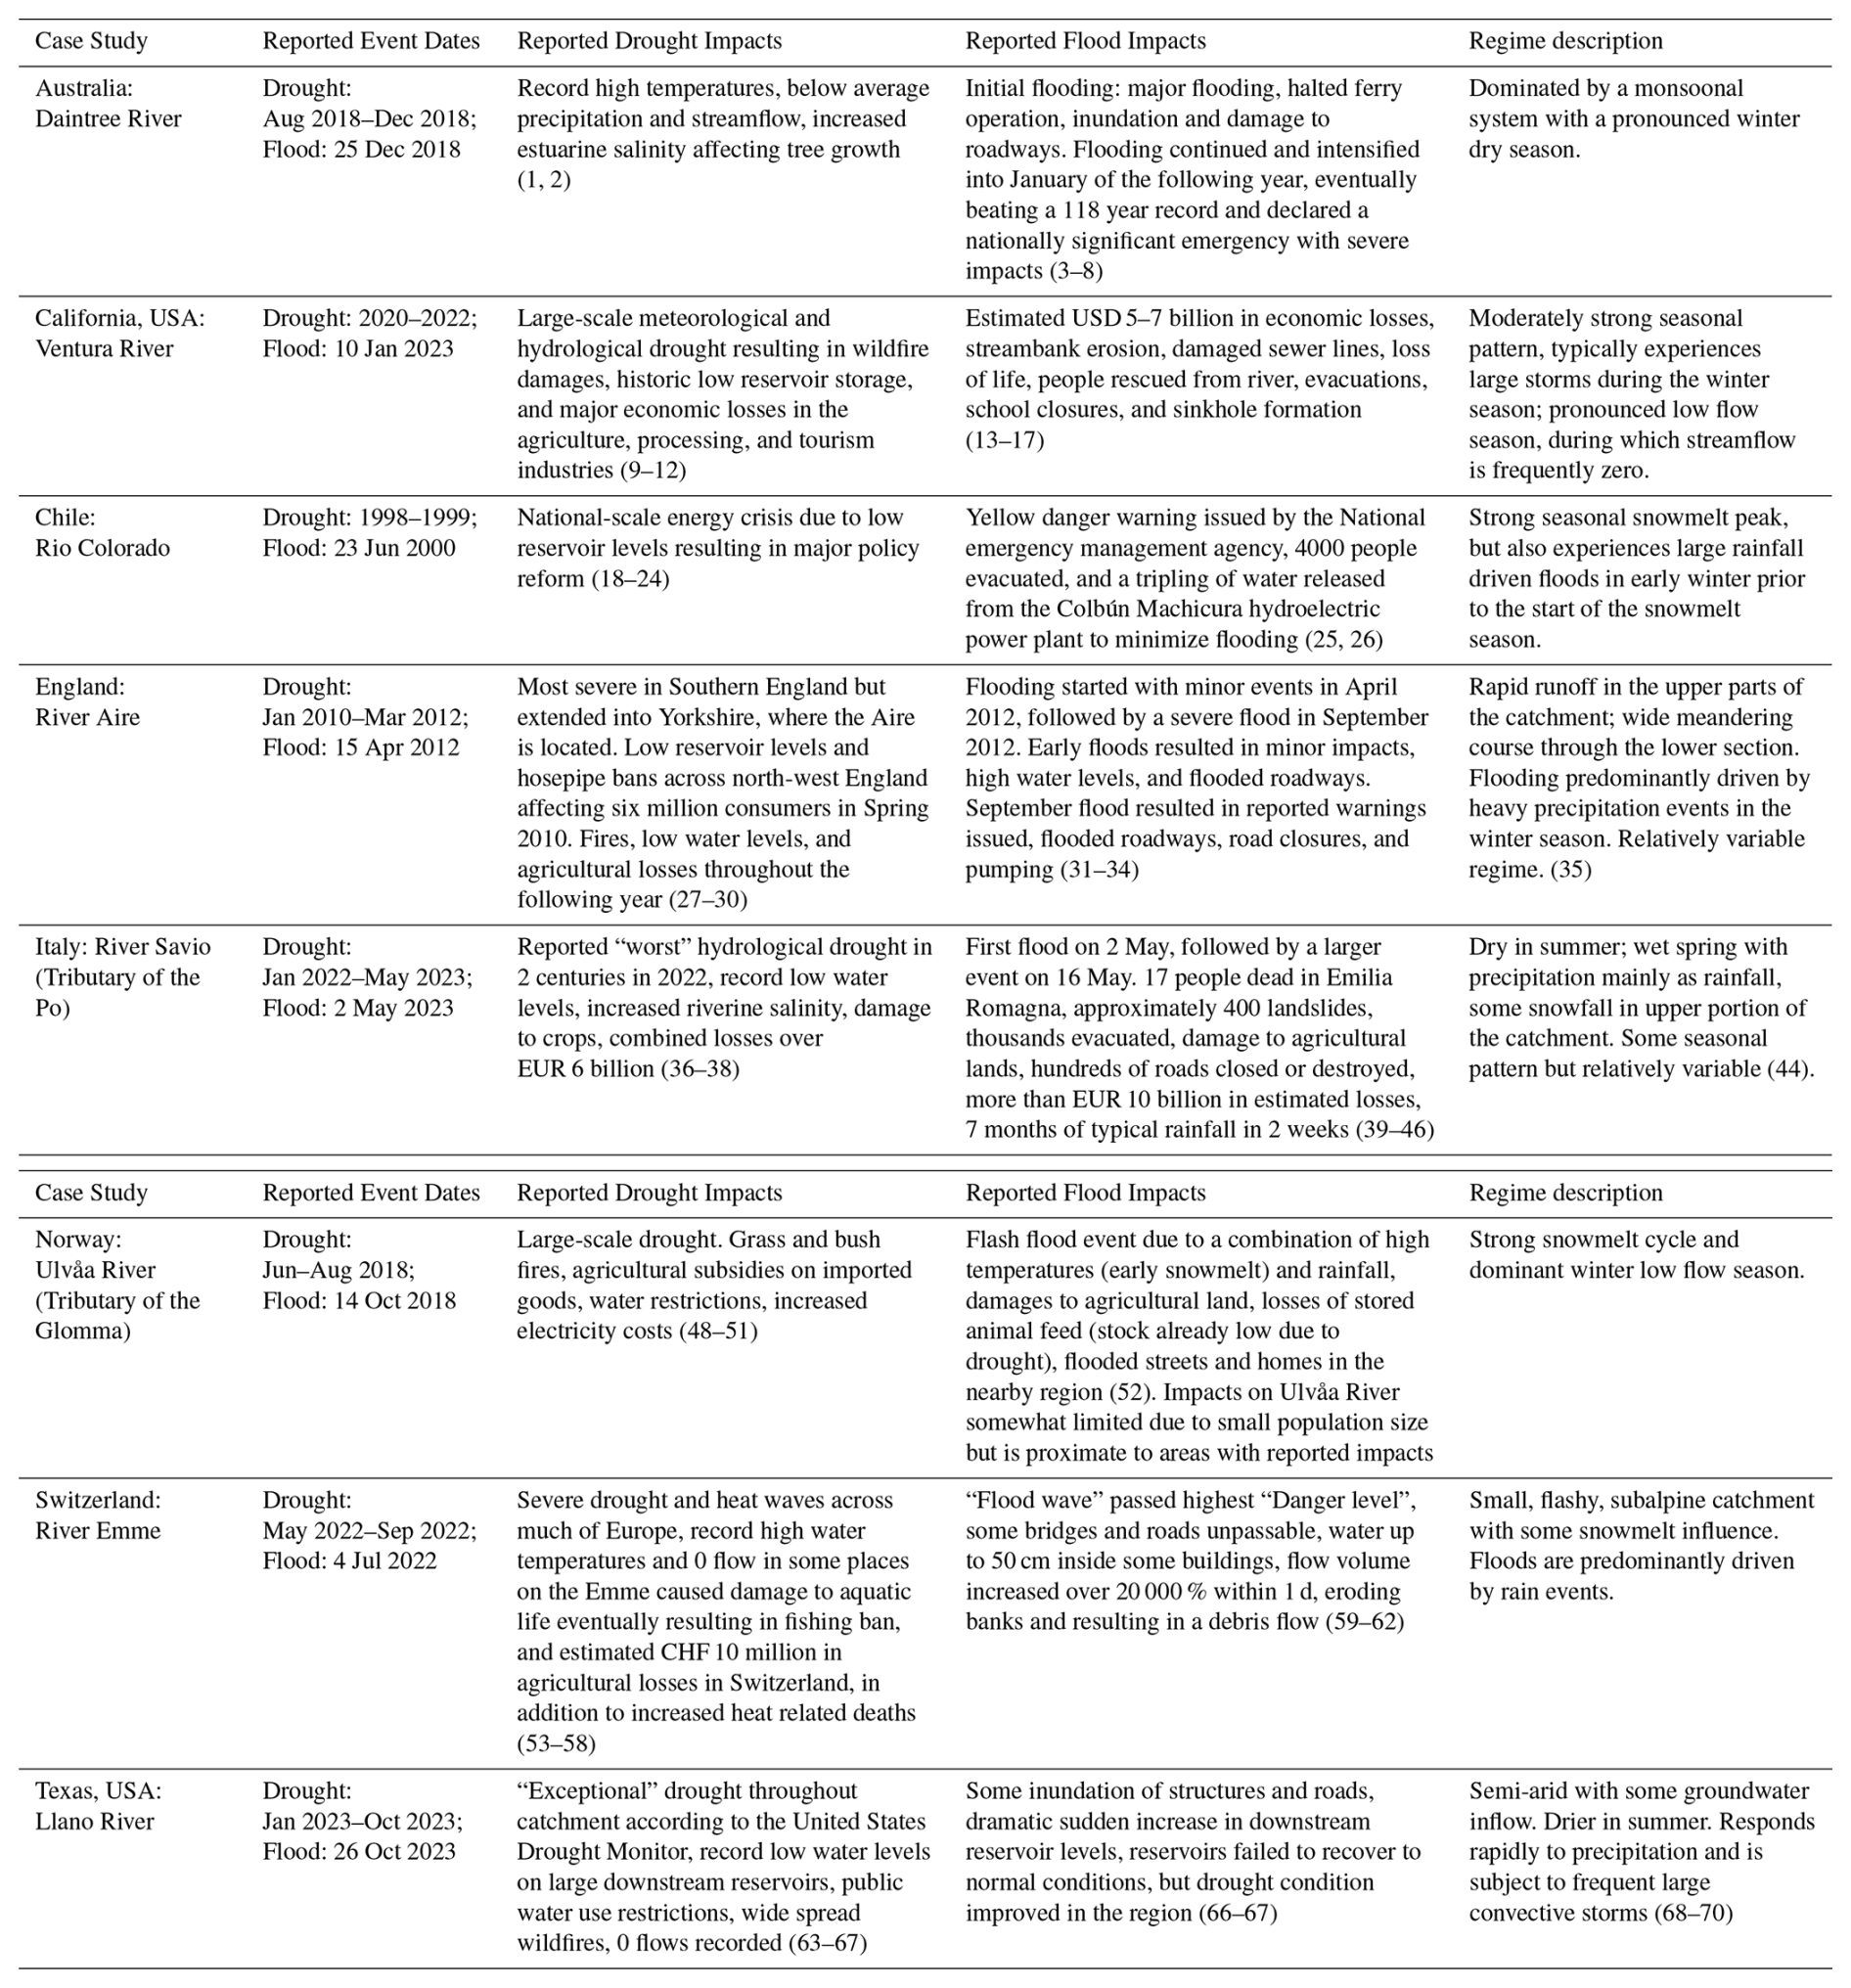
References: 1. Fagan (2023), 2. Beckett et al. (2023), 3. Staff Writers (2018), 4. Hyam and Wiggins (2019), 5. Turton (2023), 6. Turton (2019), 7. Office of the Official Secretary to the Governor-General (2020), 8. Australian Associated Press (2019), 9. Medellín-Azuara et al. (2022), 10. Escriva-Bou et al. (2022), 11. Lund and Rypel (2023), 12. Sheffield and Kalansky (2022), 13. Freedman (2023), 14. Navarro (2023), 15. Lloyd and Leon (2023), 16. Davies (2023), 17. KCAL News Staff (2023), 18. Murillo and Foulon (2006), 19. Serra (2022), 20. Biblioteca del Congreso Nacional (1999), 21. Kim et al. (2022), 22. Garreaud et al. (2017), 23. Oertel et al. (2020), 24. La Tercera en Internet (2000), 25. Emol.nacional (2000b), 26. Emol.nacional (2000a), 27. Parry et al. (2013), 28. Kendon et al. (2013), 29. Marsh et al. (2013), 30. BBC News (2012a), 31. Wainwright (2012), 32. Mead (2024), 33. BBC News (2012b), 34. Harvey (2012), 35. UK Environment Agency (2009), 36. Montanari et al. (2023), 37. Santalucia (2023), 38. Chelli (2023), 39. Povoledo (2023), 40. AP News (2023), 41. The European Space Agency (2023), 42. D'Emilio (2023), 43. Stober (2023), 44. Arrighi and Domeneghetti (2024), 45. Valente et al. (2023), 46. Ascione and Valdano (2024), 47. Cilli (2020), 48. Bakke et al. (2020), 49. Berglund (2018a), 50. Berglund (2018c), 51. Skaland et al. (2019), 52. Berglund (2018b), 53. Schweizer Radio und Fernsehen (2022), 54. Bundesamt für Umwelt (2022), 55. Ballester et al. (2023), 56. Swissinfo.ch (2022), 57. Le News (2022), 58. Jorio (2023), 59. LandschaftsRaume Napfgebiet (2022), 60. Flury and Schmuki (2022), 61. Bürki (2022), 62. Liechti (2023), 63. Lower Colorado River Authority (2023), 64. Morrissiey (2023), 65. Vu (2023), 66. Skinner (2023a), 67. Skinner (2023b), 68. Furl et al. (2018), 69. Nielsen-Gammon et al. (2005), 70. Smith et al. (2000).
We define “reported” drought periods based on the earliest reported start date and latest reported end date found in the media, scientific, or governmental reports of the events as in Table 1. For “reported” flood events, we are primarily concerned with the first day of flooding in order to define a transition. For this reason, we use only the earliest reported start date, as opposed to the date of the most severe flooding. It is possible that media reports may be misleading in terms of event location or precise timing. We aimed to validate event occurrence and the correspondence of spatial area by allowing for buffer periods around flood events, confirming the presence of a flood on the expected dates in the time series of all cases, relying on more than one report for all events, and seeking scientific and governmental reports which listed specific catchment IDs rather than news media alone, when available. Validation in the case of drought was more difficult, given the generally wider spatial areas, and varied definitions used in reporting.
In addition to reported drought-to-flood transition events, the case study catchments were selected to represent a range of hydrological regimes and to facilitate a higher degree of generalization across hydro-climates. We qualitatively describe the regimes based on the degree to which they are influenced by snow, seasonality in the median, high, and low streamflow norms, and variability in the daily flow regime (Table 1). In this study, we considered several highly seasonal catchments with clearly defined high and low flow seasons as well as limited streamflow variability in the low flow season, such as monsoonal types (River Daintree in Australia) and snow dominated regimes (Ulvåa River in Norway), mixed regime types experiencing influence from both snowmelt and rainfall (Rio Colorado in Chile, Savio River in Italy) and predominantly pluvial regimes (Ventura River in California, USA, River Aire in England), including one semi-arid regime (Llano River in Texas, USA) and one flashy sub-alpine regime (Emme River in Switzerland; Fig. 1). Further descriptions of the case study events are included in the discussion as relevant.
2.2 Data
In addition to the case study events, we used daily mean streamflow data for the complete time series in the selected catchments. The length of the time series and the degree of missing values vary, but six of the eight catchments have daily streamflow series longer than 40 years with at least 95 % coverage after removing any negative or null values, which would be indicative of data error. The Chilean and Italian sites are an exception. In these catchments, 20 and 17 years of 95 % complete data were available, respectively. These catchments were retained despite their relatively short length due to the importance of individual events and the intention to cover a wide geographic range. Although differences in the time series length and period covered could influence inter-catchment comparison, this effect would be consistent across all threshold level approaches and methodological combinations in one catchment, so that the approaches can be fairly compared for each site. Although more complete data records are available for some catchments in both Italy and Chile, catchments that also reported clear impacts from drought-to-flood transition events, could not be found at this time. In addition to daily mean streamflow data, sub-daily data was obtained for the catchment in Switzerland and used in the qualitative analysis. The hydrological data are taken from publicly available large sample and national hydrological datasets as described in Table S1. Additional case studies in South America, Asia, and Africa were considered, including, but not limited to, the 2011 event in the middle-lower Yangtze river in China, the drought-to-flood transition in January 2017 in Peru, and the 2024 floods in Kenya, which followed an unprecedented multi-year drought from 2020 to 2023. However, we were unable to acquire sufficiently long and high-quality streamflow time series corresponding to these events.
2.3 Quantitative methods
2.3.1 Event detection approaches
We test and compare three different threshold level methods for drought, including (1) a daily varying threshold defined as a rolling percentile for each day of the year (across all years) plus 15 d before and after it. This 31 d window was selected because it offers sufficient smoothing to capture seasonal behavior without over-smoothing, and represents the monthly time scale (Van Loon and Van Lanen, 2012; Tallaksen and Van Lanen, 2023), (2) a seasonally varying threshold defined as two separate fixed thresholds, one for autumn and winter and one for spring and summer, and (3) a fixed threshold defined as a singular percentile of the complete time series (Fig. 2c–e). Each of these three approaches is calculated from the smoothed daily streamflow time series, in which the previous 30 d are used to calculate a rolling mean for each day in the time series. The previous 30 d are used, rather than a centered period, so that rapidly occurring flood events do not result in an earlier drought end date. The thresholds are then compared to the smoothed time series. All three approaches are commonly used in hydrological research, although each highlights different streamflow characteristics (Tallaksen and Van Lanen, 2023). Further, they have been previously applied for the detection of drought-to-flood transitions (Götte and Brunner, 2024; Matanó et al., 2024). We do not consider how the durations, intensities, drivers, or intermittency of drought or flood events might influence outcomes in this manuscript.
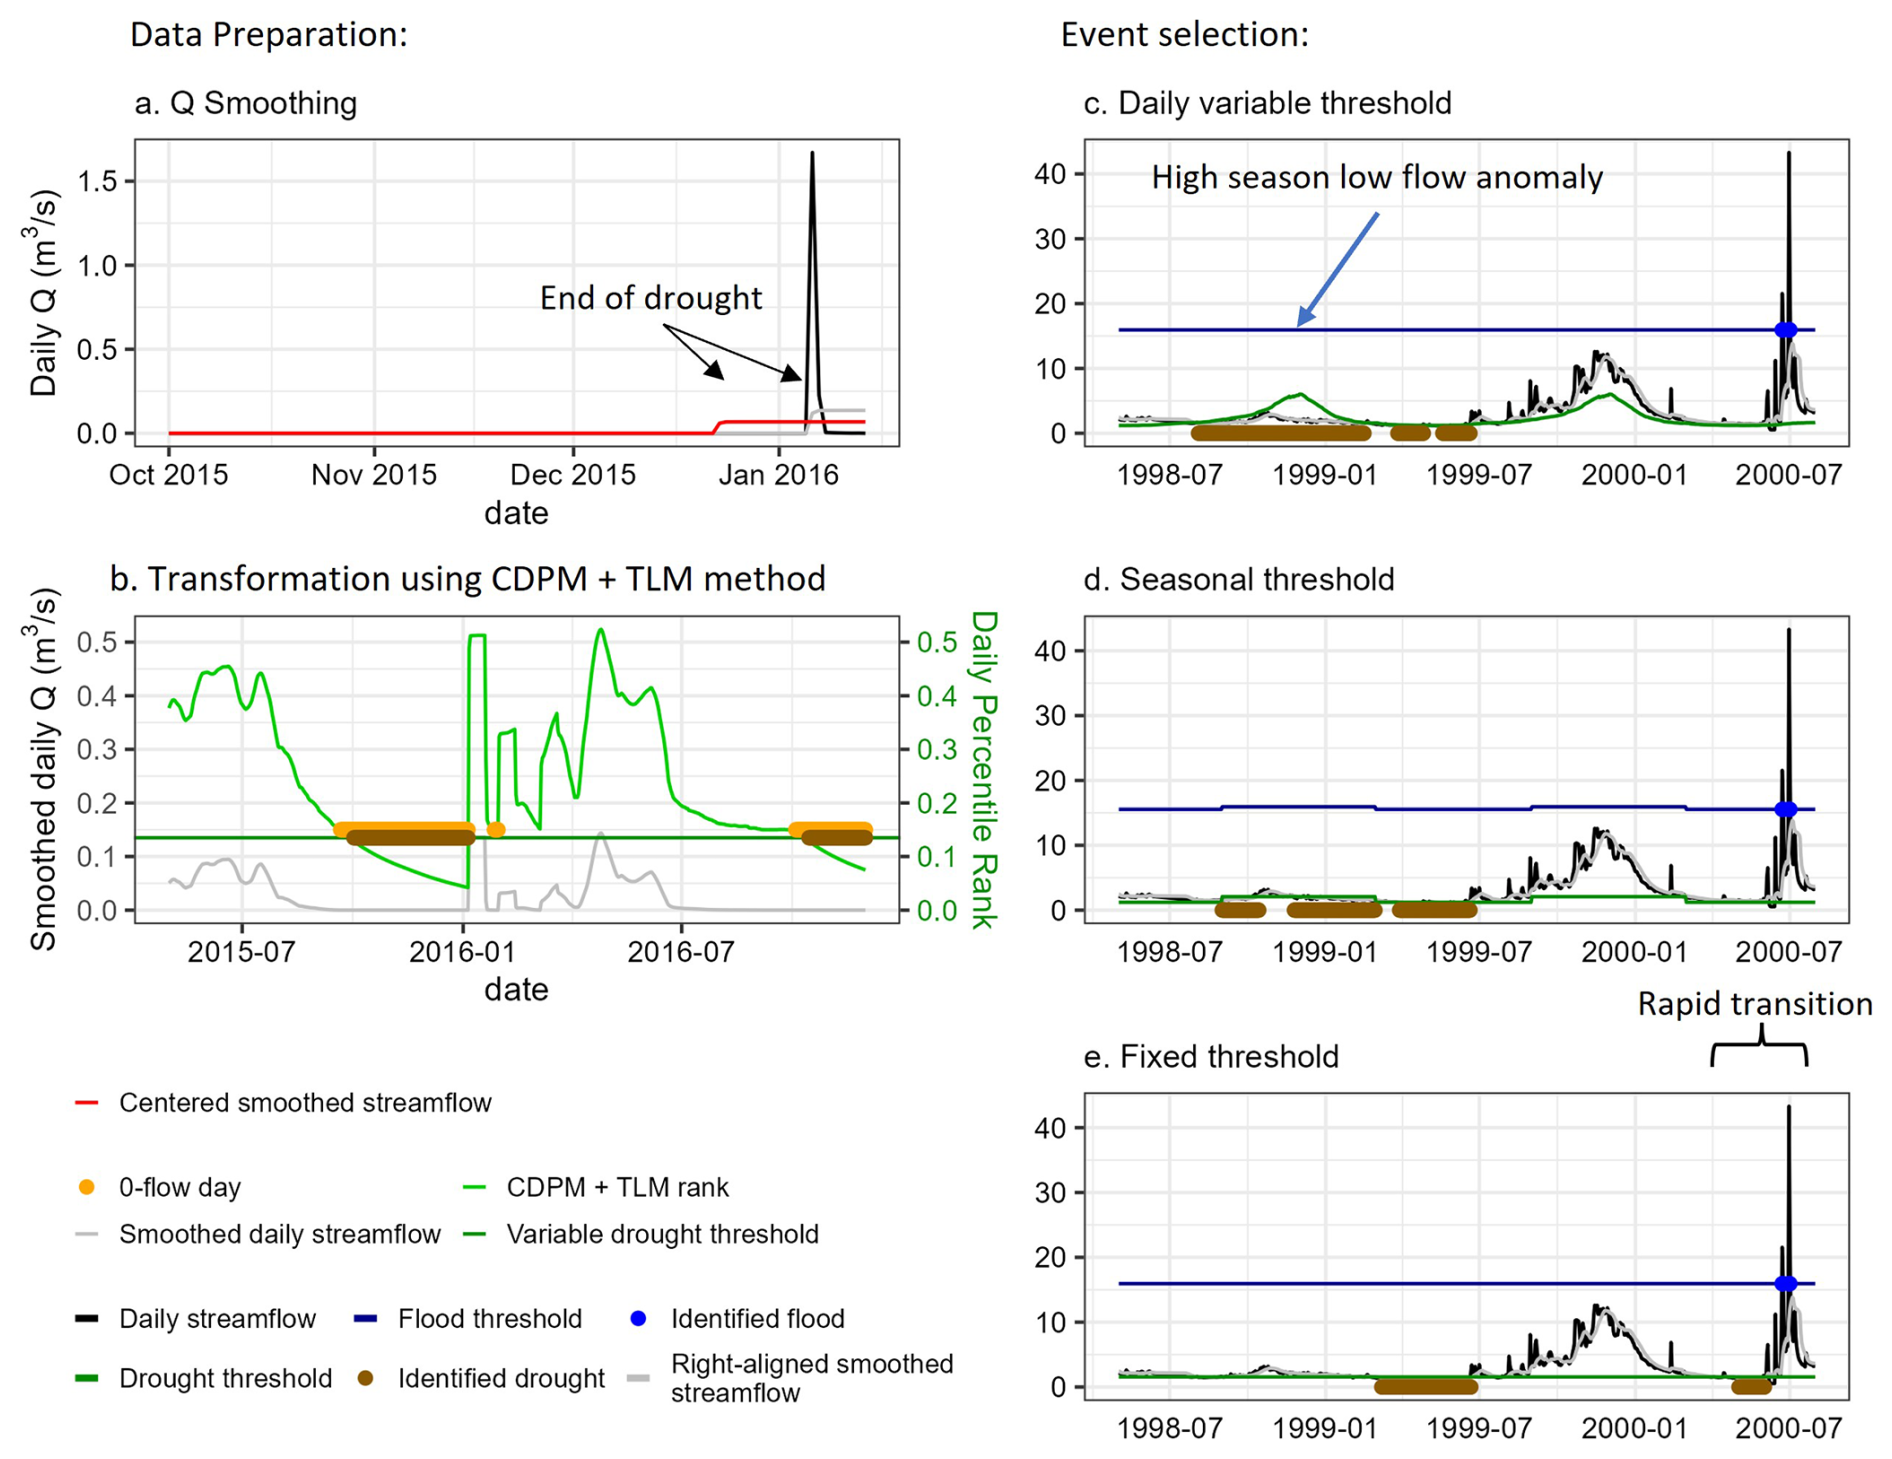
Figure 2Methodology in brief: The first column shows the data preparation phase in which streamflow is smoothed (a) and converted to percentiles for drought detection using the combined CDPM and TLM methods (b). The second column shows the event selection process in which the threshold levels and the transitions time intervals are applied. Specifically, panel (a) shows an example of the streamflow smoothing approach used for the detection of drought periods, demonstrating how a center-aligned smoothing window would result in an early drought end date as compared to a right-aligned window, as used here. Panel (b) gives an example of the combined CDPM + TLM methods used for the smoothing and setting of drought thresholds in intermittent streams. Here, the threshold is represented by the corresponding ranked percentiles on the right y axis, while the smoothed daily flow is in the original units on the left y axis. Both panels (a) and (b) are examples from the catchment in California. Panels (c)–(e) show daily variable, seasonal, and fixed thresholds for drought respectively, and fixed (c, e) and seasonal (d) thresholds for flood. Panel (e) demonstrates a rapid transition between drought and flood as detailed in the text. Panels (c)–(e) are examples from the Chilean catchment. In these panels, the thresholds are shown relative to the original streamflow values, rather than relative to the ranked percentiles (as in b), to facilitate visualization.
The drought thresholds are calculated using a combination of the threshold level method (TLM) and the consecutive dry period method (CDPM) as described in van Huijgevoort et al. (2012) and demonstrated in (Fig. 2b). This approach deals with zero-flow days in intermittent and ephemeral rivers by numbering consecutive zero flow days and calculating percentile statistics based on these counts. The intention of this approach is to allow for the detection of drought in zero-flow periods if the duration of the period is exceptional. We apply this approach equally for all threshold level types. We then identify negative streamflow anomalies using the thresholds and the 31 d smoothed (right-aligned) daily values (Fig. 2a). Drought periods were required to have a duration of at least 30 d to avoid the inclusion of minor events (Van Loon and Laaha, 2015; Brunner and Chartier-Rescan, 2024), and individual drought periods separated by less than 15 d were merged to singular events (Van Loon and Van Lanen, 2012; Tallaksen et al., 1997; Fleig et al., 2006).
We defined the flood threshold based on a percentile of the un-smoothed, original daily streamflow series and then selected events over the threshold using a peaks over threshold (POT) approach, where singular peaks were detected as floods. We do not require that peaks be independent because in the present context we are interested in the first date over the threshold, rather than the characteristics of the flood event. We test both a seasonal and a fixed threshold to detect events. A daily varying threshold is not considered for floods because it is not commonly used in the literature largely because it is assumed that floods need to have a certain magnitude in order to be impactful. The same approaches were applied to detect floods from the sub-daily streamflow in the Swiss case study, as part of the qualitative analysis, given the flashy regime.
The percentile values used for the threshold levels were selected so that the average number of drought events detected was 0.5 ± 0.005 yr−1 (∼12th–15th percentiles depending on approach) and the average number of floods was 2 ± 0.005 yr−1 (99th percentile) regardless of the approach. To do this, we repeated the event detection procedure using a range of threshold levels until the desired number of events was achieved. Alternatively, the same percentile value could have been used for all methods. However, threshold level methods may result in the selection of a proportion of streamflow which is not equivalent to the stated percentile (Brunner and Voigt, 2024), in part because of the imposed minimum duration for drought periods. Thus, this approach ensures that the same number of events is compared, rather than the same number of days below the threshold, ensuring a more fair comparison. The number of drought events is lower than the number of floods, because drought events represent prolonged periods of low flow, whereas floods typically occur over short periods of hours to days.
2.3.2 Definition of drought-to-flood transitions
Similar to previous work (Götte and Brunner, 2024; Matanó et al., 2024), we consider events to represent a transition by defining a maximum time interval between events. Here, if the time interval between the end of a drought (the date on which smoothed streamflow exceeds the drought threshold) and the start of a flood (the date on which streamflow exceeds the flood threshold) is less than 90 d, we consider this to be a drought-to-flood transition. We subdivide these time intervals into rapid (14 d) and seasonal transitions (90 d) as in Götte and Brunner (2024). In order to test whether we capture droughts and floods that correspond to the case study events, we allow a buffer window of ±5 d on either side of the reported flood event. This buffer is to accommodate potential discrepancies between the media reporting timing and precise location of the events and the hydrological response in the data. For droughts, we do not allow a buffer period, but consider a drought to be detected if it overlaps with the media reported drought period.
2.3.3 Methods comparison
We compare the different threshold level methods and assess how the detected events differ. In the first instance, we consider whether or not the case study drought and flood events, i.e. those reported in the media, are detected, and secondarily whether or not they are considered to be a “transition” event. Then, we compare the threshold level methods for the entire streamflow time series, and, taking into account the hydrological regime types, and analyze potential differences in the detection of transition events and their characteristics, primarily the timing of events.
Second, existing literature typically defines transitions by pre-selecting the time interval between drought and flood event, which is not explicitly linked to transition probability or physical processes. Therefore, next, we consider how the probability of these preselect windows differs between catchments. (1) We begin by calculating the time interval between each drought event and the first subsequent flood event, resulting in a series of time interval values for each catchment. (2) Next, we fit a Generalized Extreme Value (GEV) model to the negative time interval series using L-moments for parameter estimation (chosen for stability with small samples). We then map results back to the original scale to obtain the cumulative distribution function (cdf). Model adequacy was assessed using QQ plots with a parametric 95 % simulation envelope focused on the lower 30 % of the distribution, given our interest is in the probability of short duration transitions. Based on visual inspection, the GEV provided a reasonable fit in all case studies except California, where it likely underestimates the probability of very short intervals. (3) From the cdf for each catchment, we extract the probability of 14 and 90 d transition periods. To quantify uncertainty, we use a parametric bootstrap to simulate datasets from the fitted GEV distribution, refit using L-moments, recompute the cdf and take the 2.5 % and 97.5 % pointwise percentile intervals from 500 replicates.
2.4 Qualitative assessment
Finally, we visually examine the time series of the case study catchments to contextualize which methodological approaches will result in the detection of transitions that are likely to have certain impacts, or which result from process changes that can be meaningfully interpreted in the desired context. Following visual inspection, we discuss examples of potential challenges and pitfalls in the event detection process and offer recommendations for future event detection strategies.
3.1 Quantitative assessment
3.1.1 Case study events are infrequently captured
The drought-to-flood transition events were not consistently detected for the reported periods, often due to discrepancies in detection of the individual events (Fig. 3). For one of the eight cases, we do not detect the drought event using any method. For an additional three catchments we do not detect a drought in the reported period with one or two of the methods. For four of the eight cases, we detect a drought in the reported drought period using every method.
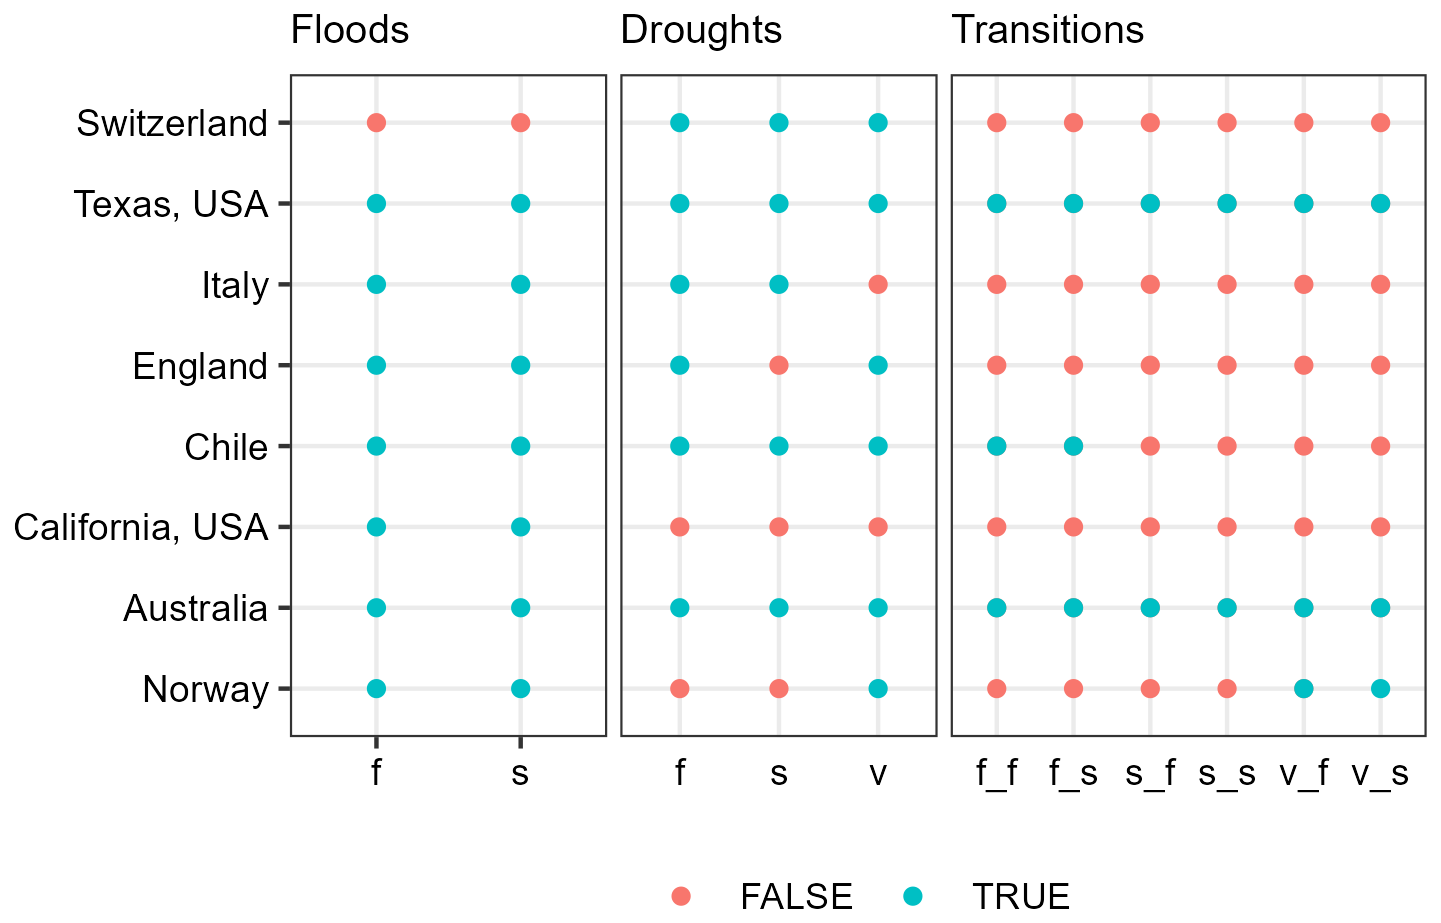
Figure 3Summary of case study event detection across sites and methodologies. “True” indicates that an event was detected during the reported period. Threshold level method names are abbreviated as daily variable (v), seasonal (s), and fixed (f), and combinations used for transition detection are labeled with the drought method followed by the flood method (e.g. “f_s” corresponds to a fixed drought threshold and a seasonal flood threshold definition).
Detected drought events often only partially overlap with the reported drought periods. Using the Emme catchment in Switzerland as an example, each threshold level method detected a drought event at some point during the reported-drought period (Fig. 4a, Table 1), however, none of the detected events spanned the full reported-drought period (January 2022–December 2022 for the Emme). Instead, the drought appeared to occur over the course of several months between May and September, depending on the methodology. Detected drought events are often very short relative to the reported drought periods, or are detected as multiple shorter, intermittent, drought events (ex. Fig. 4a).
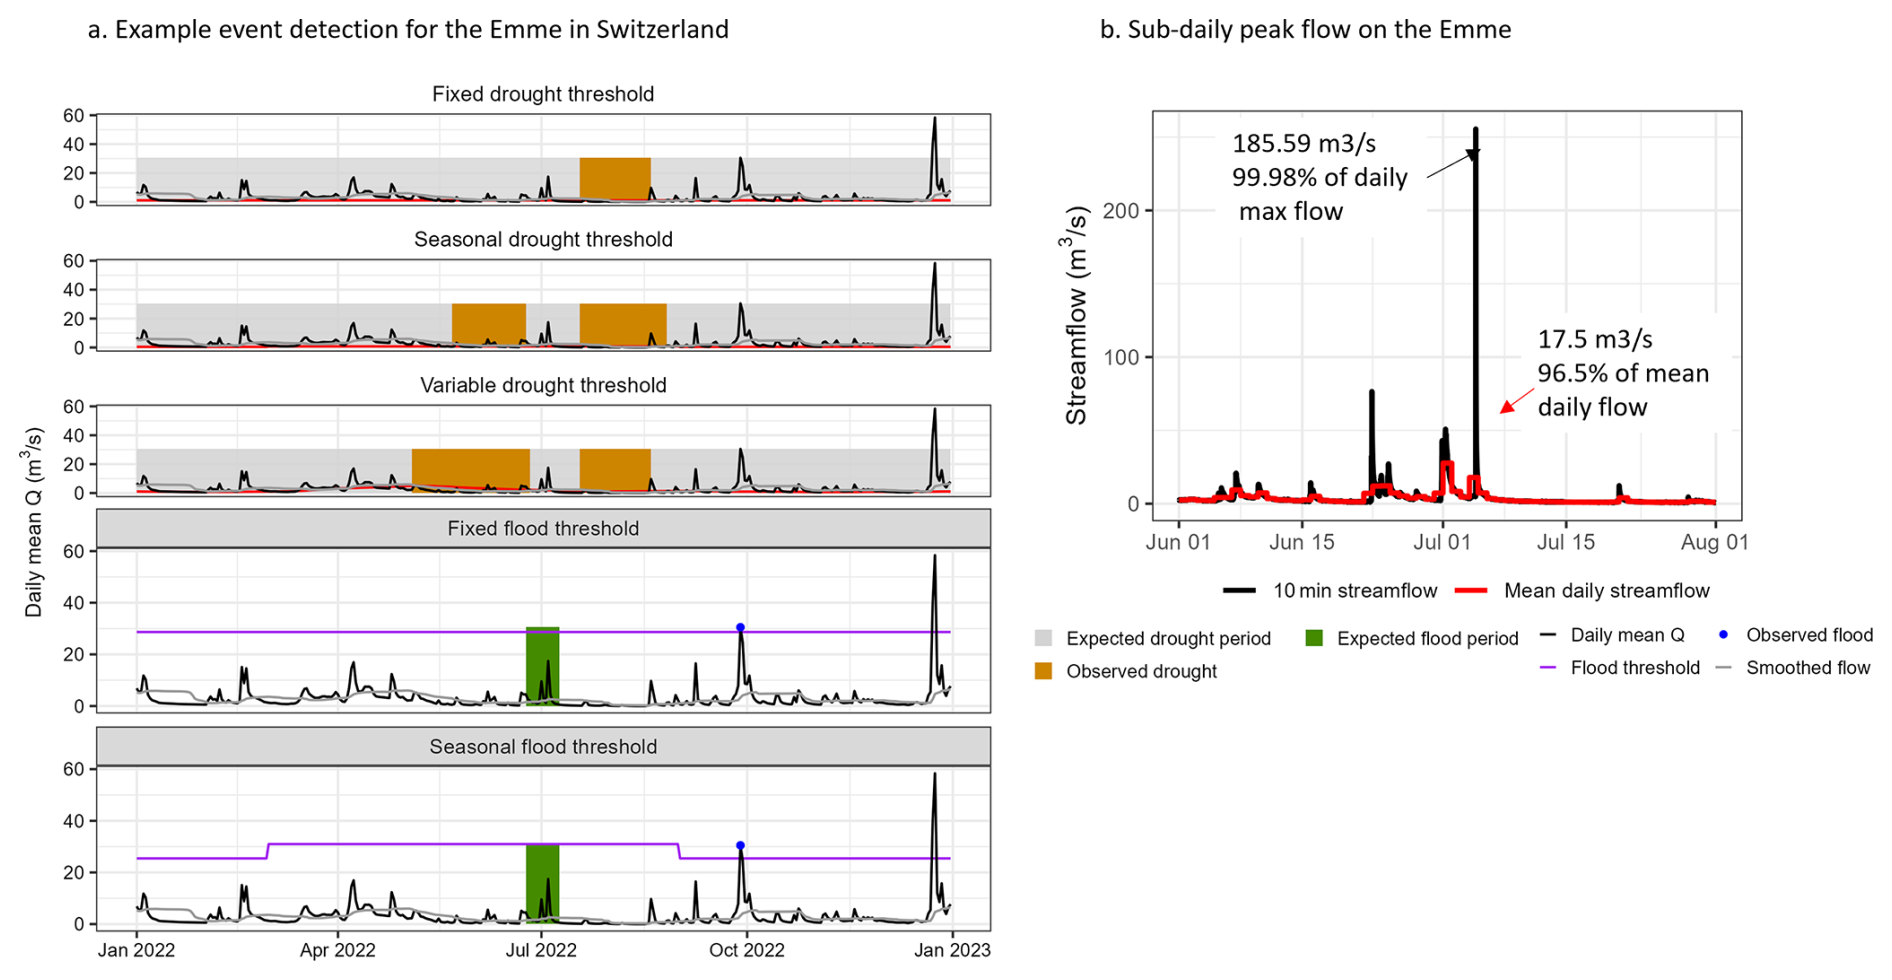
Figure 4Detection of case study events. Panel (a) shows an example (Emme River in Switzerland) illustrating the detected drought events during the case study period, while no flood was detected on the reported date. Panel (b) shows how the flood peak for the case study event on the Emme differs between the daily mean and sub-daily streamflow time series.
A similar result is visible in the time series of the Savio River in Italy (Fig. 5). Here, only the fixed and the seasonally fixed thresholds detect drought events during the reported drought period (i.e., during the low flow season in Summer 2022, despite noticeably lower than typical streamflow throughout the 2022 and early 2023 hydrological years). The results in the River Savio suggest that the drought threshold levels used in this analysis may be too strict to capture the observed event. Second, these results show a concentration of drought events in the early years of the time series (Fig. 5a), highlighting the effect that trends in streamflow can have on threshold setting, and thus event detection, if non-stationarity is present.
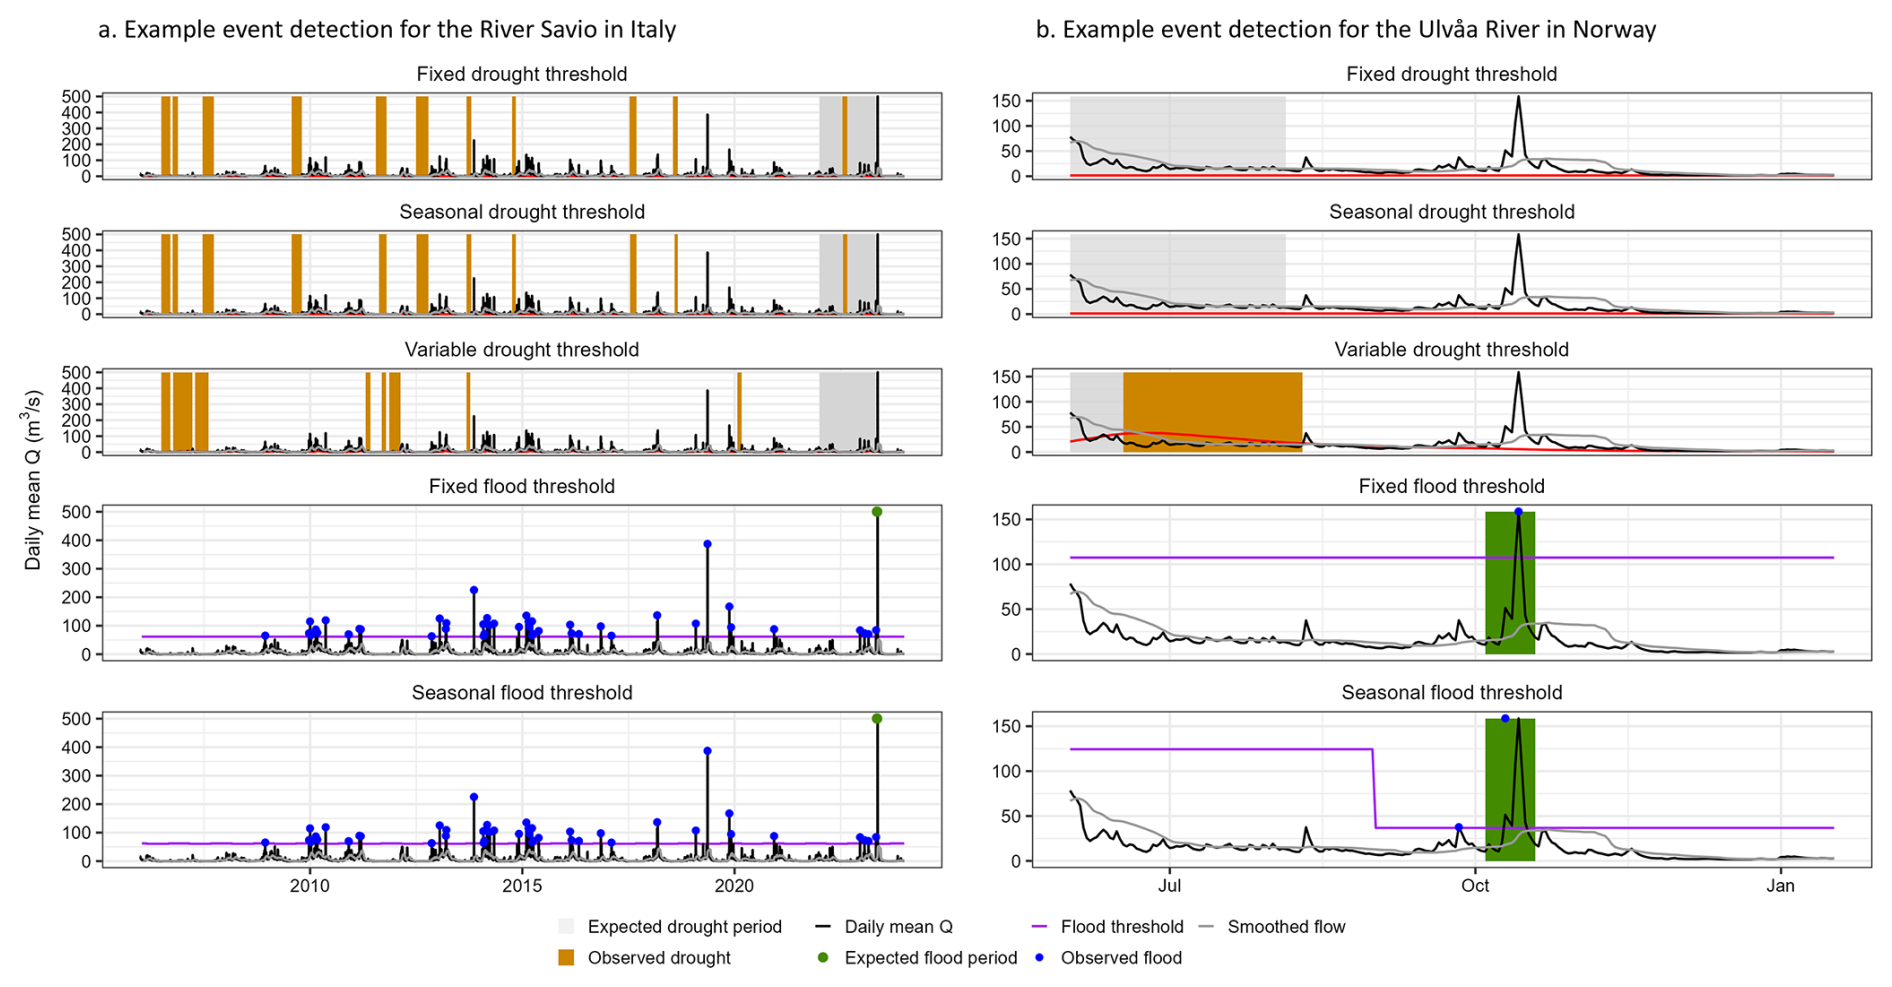
Figure 5Detection of case study events in (a) the River Savio in Italy, here shown together with the complete available streamflow time series, and (b) the Ulvåa River in Norway shown here for the 2018 case study event only.
Flood events are detected, regardless of the threshold level method, for all catchments except for the Swiss case study. The reported flood event at this location was not detected by either threshold type using the daily mean streamflow data (Fig. 4a). However, given data availability and the understanding that this is a responsive regime (Table S1), we also examined the hourly streamflow time series for this catchment. Although the peak daily mean flow (17 m3 s−1) on the date of the case study flood was not extreme, the hourly streamflow peak (255 m3 s−1 corresponding to the 99.99th percentile of daily maximum time series) far exceeded the flood threshold. In this example, the transition from low flow, to flood, and back to low flow occurred within less than 12 h. The daily mean flow was therefore insufficient to capture the extreme flood event or the transition (Fig. 4b).
Overall, we do not detect transitions for four out of eight catchments (Switzerland, England, Italy, and California), regardless of methodology. In Texas and Australia, however, the case study transition is detected by every threshold level combination. In both cases, a large, sudden, precipitation-driven flood followed a drought period in the low flow season. In the Chilean case study, a transition is only detected when the fixed threshold is used. This event, however, actually falls outside of the reported drought period (Fig. 2e). In this case, the time interval between the reported drought period and the flood period was larger than 90 d, meaning that it would not have been considered given a predefined temporal lag of 90 d as used here. Finally, for the Norwegian case study (Fig. 5b), the transition is only detected when a variable drought threshold is used. The other methodologies do not detect anomalously low flow (i.e., lower than normal flow) outside the typical low flow season, whether in the summer or winter season, as drought. The flood event, driven by a combination of snowmelt and rainfall, was detected by both approaches.
3.1.2 The choice of threshold level method affects detection of transitions
When considering the entire streamflow time series, rather than just the case study events, the number of detected transitions varies greatly across the catchments and different combinations of threshold level approaches (Fig. 6). In the catchments with marked seasonality (e.g. Norway, Australia), we generally see an increase in the number of transition events when a seasonal flood threshold is used, as compared to a fixed one. For example, the seasonal flood threshold is substantially lower in the low flow season, as compared to the high flow season, in the Norwegian catchment, allowing for smaller floods to be detected in this period. Here, the combination thresholds plays a major role in determining the number of events detected.
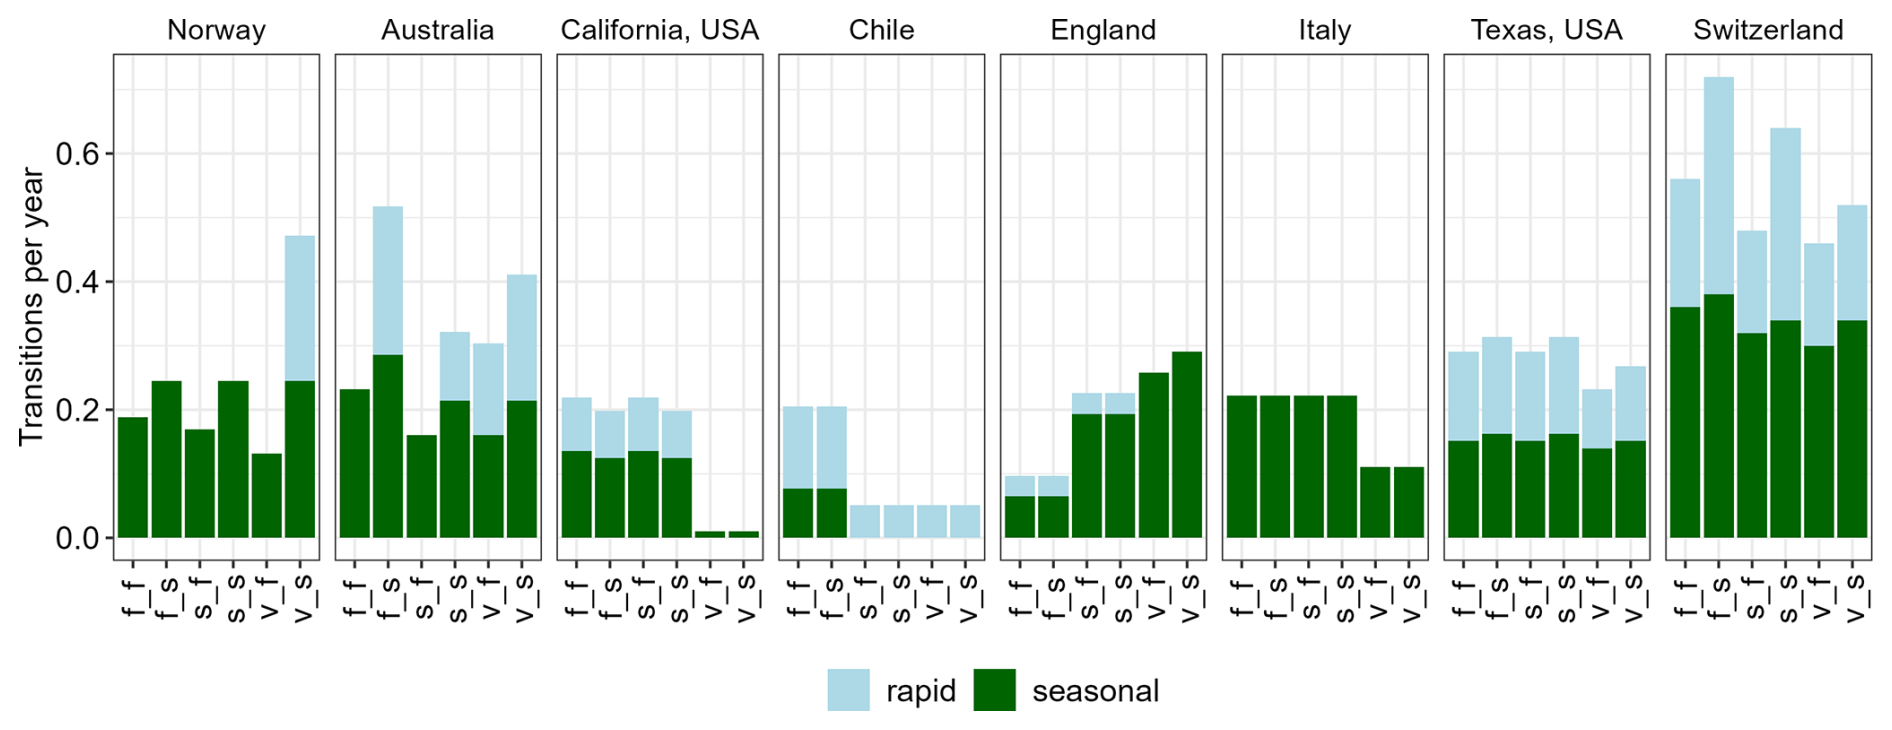
Figure 6Number of drought-to-flood transition events per year (y axis) detected in the complete time series for the eight case study catchments. The x axis shows the different threshold approach combinations, where the first letter represents the threshold level approach for drought, and the second, the threshold level approach for floods, as previously.
In catchments with moderately strong seasonality and a pluvial (California, England) or mixed regime type (Chile, Italy), differences in the detection of transition events appear to be most strongly related to the drought threshold level method (Fig. 6). The Chilean catchment experiences a pronounced dry season, with generally non-zero flow, often followed sharply by a rainfall driven flood season prior to the snowmelt period (Fig. 1; Table 1). In this case, most detected transitions are rapid, and we find that more variable drought threshold level methods (v and s) result in a reduction in the number of transition events. Although droughts were detected throughout the year when variable drought thresholds were used, in this case, all detected transition events occurred when the low flow season was followed by a rainfall driven flood prior to the snow melt period. When fixed drought thresholds were used, the drought period was able to extend later into the dry season in more years, and thus, some snowmelt floods were captured as transition events. The Italian case produced a somewhat similar phenomenon (Fig. 6). For the English catchment, we see the inverse: increasingly variable drought threshold level methods result in increased numbers of transition events. This is not surprising, as floods typically occur in the middle of the high flow season, and thus, droughts which extend into the early part of the high flow season (with variable thresholds) will increase transition detection. The naive split of the high and low flow season for the seasonal threshold used here, does not perfectly align with the seasons in the English catchment. It is possible, therefore, that better alignment would have resulted in an increase in transition events, as smaller, but earlier, floods may have been detected, as observed in the Norwegian case.
In the catchments with very low seasonality (Switzerland and Texas), we find that the number of transition events is high overall (in the Swiss case, around one transition every 2 years). In these cases, allowing for variability in the flood threshold level has some effect on event detection, almost entirely because the seasonal flood threshold is slightly lower in half the year, so more floods are detected. The choice of threshold level methods has little importance when seasonality is weak.
Finally, intermittent flow can also present challenges in event detection which differ between methodologies. In the Californian catchment, which regularly experiences zero flow in the dry season followed by a pronounced wet season in winter, a variable drought threshold (using the combined CDPM + TLM method) detects very few transition events, in part, because the later part of the dry season typically experiences zero-flow (Fig. 7). Although the intention of the combined CDPM + TLM method is to allow for the detection of hydrological drought in intermittent rivers (van Huijgevoort et al., 2012), this still presents a problem here. The method performs well with fixed annual (Fig. 2b) and seasonal thresholds. However, the use of a variable threshold may mean that the start of the zero-flow period is not considered to be a drought if dry conditions are typical in the rolling-window, even if drought was present earlier in the season, leading to the identification of intermittent drought periods (Fig. 7). This may pose a problem for the detection of transition events at the end of the zero-flow season if a variable threshold is applied.
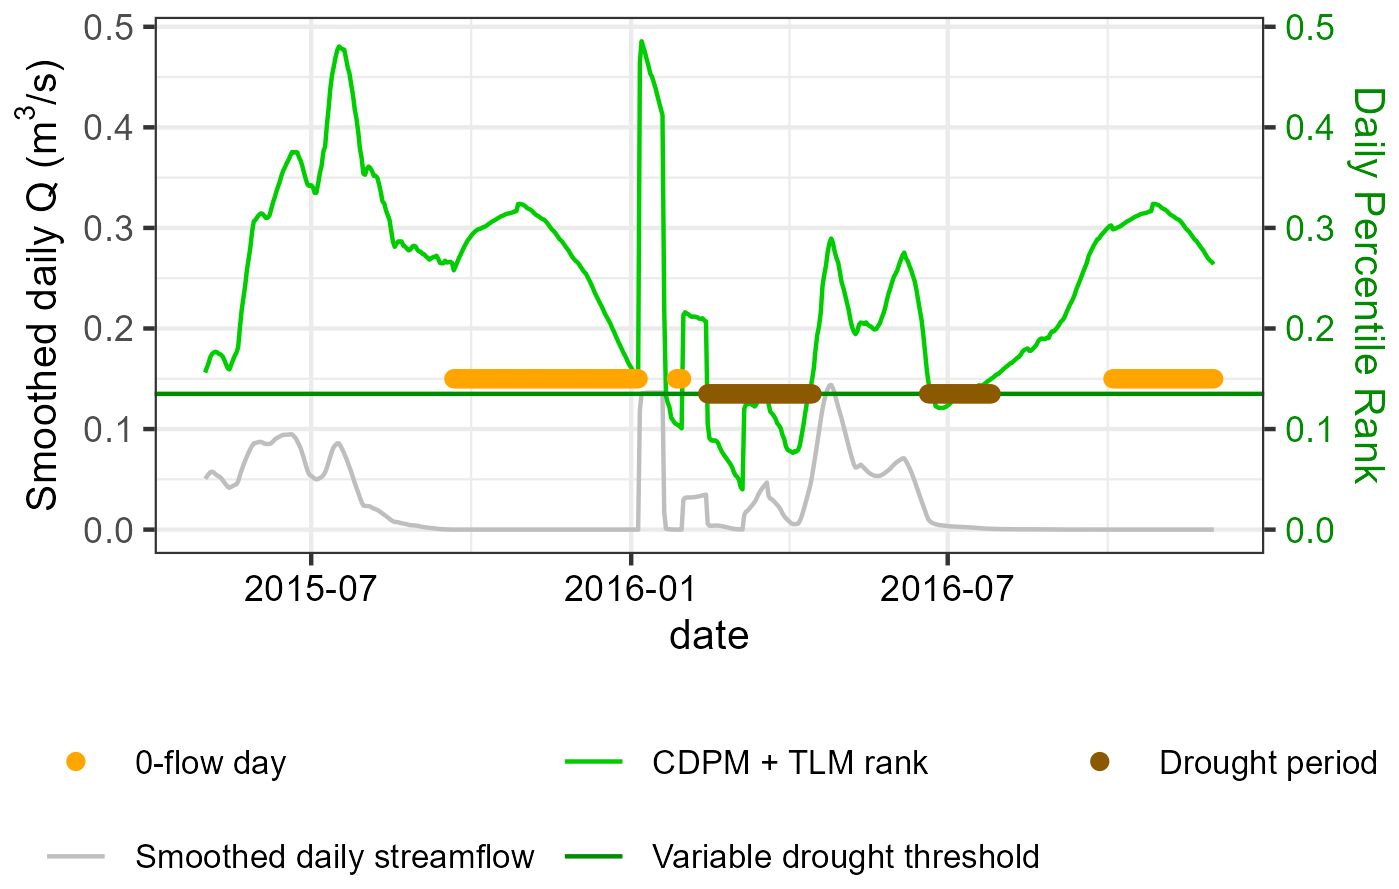
Figure 7Drought detection using the combined CDPM + TLM method using a daily varying threshold for the intermittent Ventura River in California, USA. Here the threshold is represented by the corresponding percentiles on the right y axis, while the smoothed daily flow is in original units on the left y axis. Note that in the zero-flow periods in summer 2016, the method does not detect drought, since the duration of the zero-flow period is not below the percentile threshold for the rolling window period, as opposed to the same approach applied with a fixed 2 or seasonally fixed threshold.
3.1.3 Choice of event detection method affects event seasonality and characteristics
As noted above, individual flood and drought events, whether or not they comprise a transition, exhibit different characteristics depending on the choice of threshold level method. Notably, the timing of events varies substantially between methodologies and streamflow regimes (Fig. 8a). For example, fixed thresholds result in a relatively consistent timing of the onset and end of drought in a majority of locations (Fig. 8a). With increasing variability in the threshold definition (s, v), the variability of detected drought timing also increases. Fixed thresholds, in flow regimes with a seasonal signal, will generally detect drought in the low flow season, but variable thresholds (including seasonal) will allow the detection of low streamflow anomalies even during high flow seasons. To some extent, the same types of seasonal patterns can be seen for floods, although most of the case study catchments exhibit similar flood seasonality for both methodological approaches (Fig. 8).
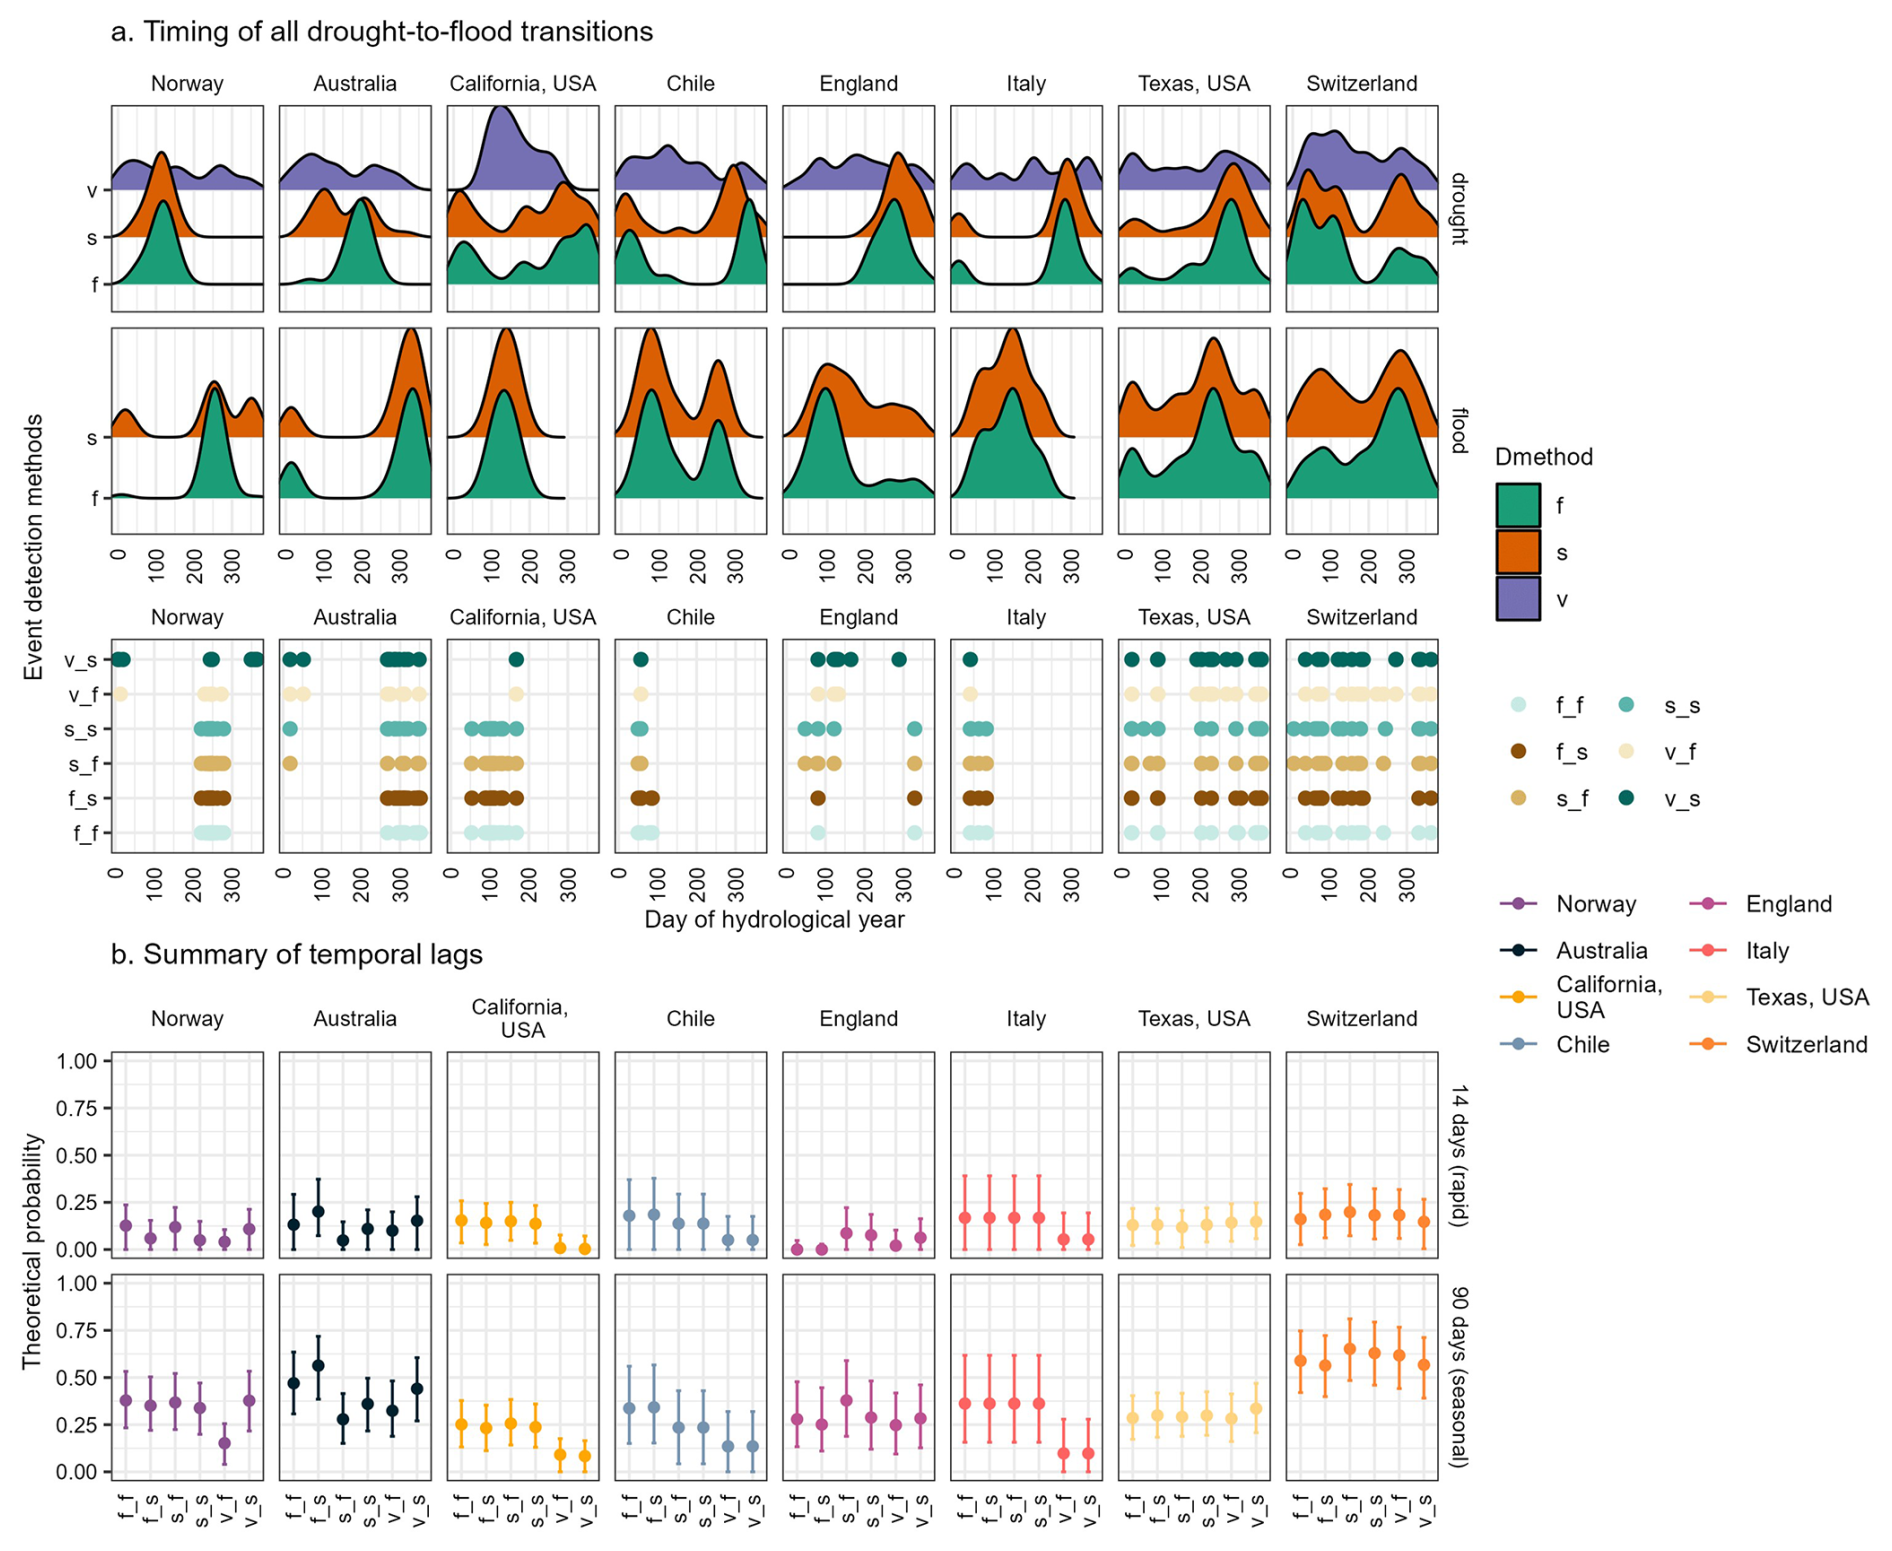
Figure 8(a) Timing of drought (first row), flood (second row) and transitions events, defined as the start date for the flood event (last row), detected using different threshold approaches for the eight case study catchments (columns). The day of the hydrological year is on the x axis, where the first of April is day one in the southern hemisphere and October first is day one in the northern hemisphere. Threshold level method names are abbreviated as daily variable (v), seasonal (s), and fixed (f). As above, for the transition timing panel, the drought threshold level method is first, and the flood method is second, so that the abbreviation represents the combined approach. The catchments are ordered from highly seasonal regimes on the left to highly variable regimes on the right. (b) Theoretical probability of transitioning between drought and flood in 14 (top) and 90 (bottom) days. Here the error bars represent the 95 % confidence interval of the bootstrap resampled distribution.
These results are generally in line with expectations. Fixed thresholds can be expected to detect events which are more in line with the seasonal norms, e.g. flood events which occur during the high flow season and droughts which occur during the low flow season. These events are more likely to be driven by larger scale processes, for example, drought periods driven by cold winter weather or floods driven by snow melt in the spring, although very severe events would be detected outside of seasonal patterns. Using a fixed threshold (f: based on a percentile from the whole series) ensures that drought events have absolute low flow terms (and that floods have absolute high flow). In contrast, variable thresholds (v), and to a lesser extent, seasonal thresholds (s), are sensitive to anomalies within a season. This means they can capture atypical events, which may not necessarily be large in terms of absolute magnitude. For example, droughts during typically wet periods which may be indicative of short-term rainfall deficits or a delay in the snow melt season. Flood events during drier periods, driven by intense, short-duration rainfall which does not result in a large absolute magnitude of flow, could also be detected. In other words, variable thresholds may detect events which are not extreme in an absolute sense, but which are anomalous in a specific time of year. In regimes which do not have a strong seasonal cycle, the threshold choices should not result in the detection of substantially different events.
Although the timing of drought and flood events in this analysis individually vary widely, the timing of drought-to-flood transition events does not vary as systematically between methodologies as the events do separately (Fig. 8a). The catchments which show highly seasonal flood timing regardless of methodological approach also have relatively consistent transition timing, in a broad seasonal sense e.g. in the first 100 d of the hydrological year in the Chilean case, although the timing is more limited to the beginning of the season when variable and seasonal drought thresholds were used. This suggests that the flood timing is a determining factor in whether or not a transition occurs. In the Texas and Switzerland case study catchments, where seasonality is limited, transitions are widely dispersed throughout the year regardless of the approach.
3.1.4 Transition time window length
From the previous sections, it is clear that the time window between drought and flood events impacts the detection of transitions. This is especially true since different methods can result in different drought end dates, thus potentially excluding events from being defined as transitions if the end date is shifted by a few days. These time intervals, which are typical based on previous literature, have also been selected without explicit consideration of typical conditions in a catchment, physical processes driving response, or impacts. While quantifying physical process changes and impacts is outside of the scope of this analysis, we do assess how the preselected time intervals between events relate to what might typically be expected in a catchment. We defined here the probability of time intervals between all drought events and the first subsequent flood period and related this to the preselected time windows (Fig. 8b).
The results indicate that, depending on the methodological approach and the flow regime, the probability of a transition can vary. For example, in the Norwegian case, the probability of a 14 d time interval between the end of drought and start of flood ranges from 4.1 % when a variable threshold is used with a fixed threshold (v_f), to 12.7 % when fixed thresholds are used (f_f). On the other end, the probability of a transition within 14 d in the Swiss case study catchment is generally high, ranging from a 14.7 % to 19.8 % probability of occurrence within this time window, across all the approaches. These results highlight the need for more research on how to best define transitions when characterizing them as extreme events. For instance, while 14 d may be quick from some perspectives and in some locations, a transition with a 20 % chance of occurring is hardly extreme. The approach tested here offers one potential avenue for exploring extremeness in transition duration. However, it is important to acknowledge that the confidence intervals for these estimates generally overlap between methods, that the theoretical distribution applied here to estimate probabilities may not represent a good fit in all locations. Further, different parametric assumptions may bias probability estimates, especially when sample size is small.
3.2 Qualitative assessment
As we have established, different approaches may not select events that exhibit the same traits or carry the same impacts. Accordingly, studies focusing on different impacts may require different definitions as each definition emphasizes certain aspects of droughts and floods.
Variable thresholds are adapted to the seasonal cycle in that they select events that deviate from the smoothed threshold all year round, and accordingly these events may or may not correspond to dry soils or reduced water availability especially when droughts are detected in the high flow season. For example, in the Australian catchment, droughts can be detected during the monsoon season (Amale et al., 2023) and although such events are representative of anomalous seasonal flows, they are unlikely to represent low flows from an annual perspective, i.e., they may not correspond to an absolute water deficit. Droughts in the high flow period in monsoonal regimes may also be caused by a delay in the onset of the high flow season as seen in 1990 in the Daintree River in Australia (Fig. 9a). When followed by a typical, or even above average wet season, as is the case here, such an event may result in drought-like impacts, or may not, depending on the context (e.g. for agriculture, Amale et al., 2023; Lisonbee et al., 2020; Fitzpatrick et al., 2015). On the other hand, in snow-dominated catchments when, for instance, a particularly cold winter is followed by a delayed, but otherwise typical snowmelt season, this could also result in the detection of drought by variable threshold level methods which may then be followed by a typical flood (Brunner et al., 2023). While such events may have impacts on industry, whether or not these represent important transition events is unclear.
On the other hand, fixed thresholds will favor drought periods which occur predominantly in the primary low flow season, and, as such, correspond to low flow conditions in absolute terms. Although these events represent absolute streamflow deficits, they can also correspond to somewhat normal conditions if the threshold is not low enough. For example, identifying the low flow period as a drought may be misleading in catchments where low flow periods always occur during the same time of the year (e.g. winter in snow-rich regions). If a fixed threshold is too low or does not accommodate the possibility of a secondary low flow season (e.g. summer), in a seasonal regime, droughts that occur outside of the primary low flow season may be missed. This is demonstrated in the 2018 case study example in Norway (Fig. 9c and d), where an early and reduced melt season and high temperatures resulted in a mild summer drought in the case study catchment (Bakke et al., 2020). Here, the fixed threshold method failed to capture a drought that occurred at the end of the snowmelt season (summer 2018), and as a consequence, did not capture the transition event, while the variable threshold succeeded in capturing the event. Missing drought periods outside of the primary low flow season could result in failure to detect meaningful transitions driven by anomalous weather events, such as the heavy rainfall, high temperatures, and in this case, seasonally atypical snowmelt timing. Here, using a seasonally fixed threshold would amplify seasonality (given that there are two dominating low flow seasons), and might offer a useful alternative.
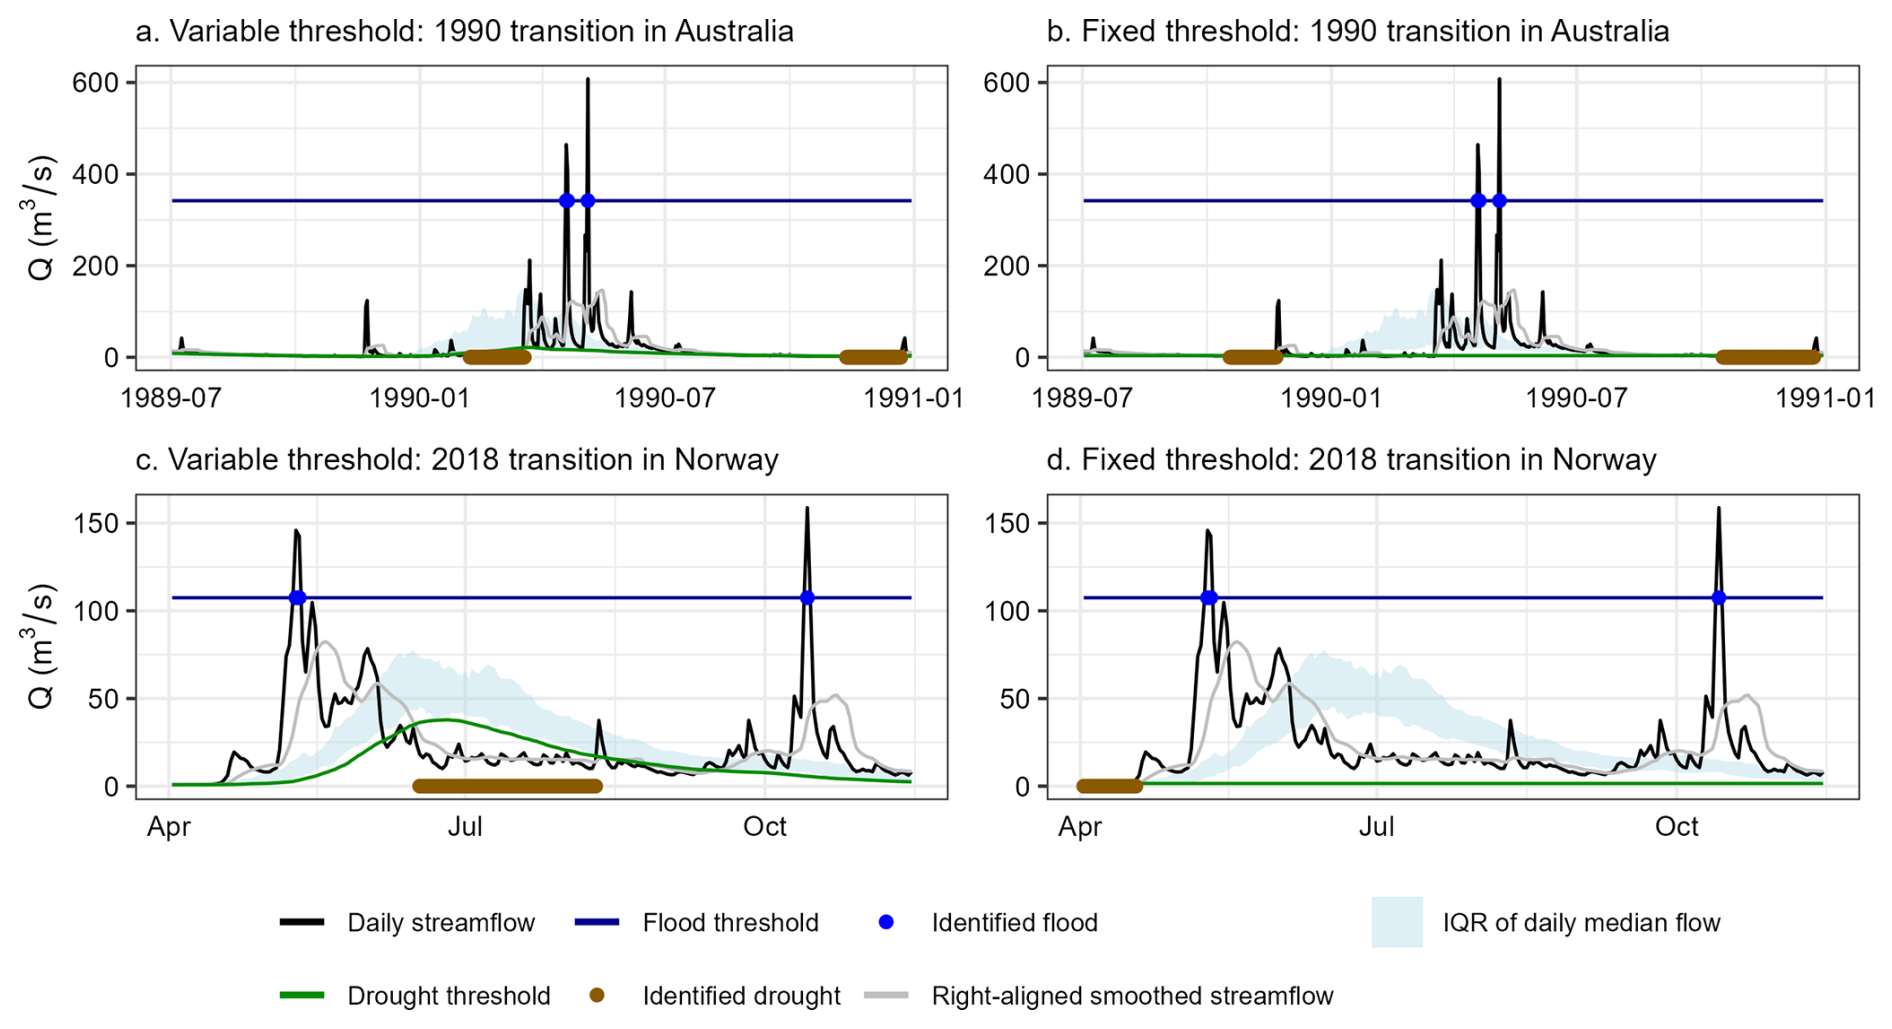
Figure 9Examples showing differences in drought-to-flood transitions in highly seasonal regimes, where (a) shows a drought event caused by a delay in the onset of the monsoon season in Australia as detected by a variable threshold, but not by a fixed threshold (b). In this case, the “area under the curve” of flow volume in the high flow season was above average (7789 between 15 December 1989 and 15 August 1990 vs. the median of 6201). (c) and (d) show the case study event in Norway. In this example the variable threshold detects drought at the end of the snowmelt season, while a fixed annual threshold misses the event.
In the Norwegian and Australian examples in this section (Fig. 9), the transition event is best detected by the variable threshold level approach for drought. This aligns with previous literature which suggests that a variable threshold is more appropriate in a seasonal context (Van Loon and Laaha, 2015). However, whether the detected transitions are impactful depends on the sector of interest. In snowy climates it is common to distinguish between winter and summer low flows, both of which may be of potential interest for different reasons. For example, a winter low flow may be caused by very low temperatures. This can limit subsurface flow to groundwater wells or rivers, and thus impact local water supply, even though normal snow conditions may be present (Tallaksen and Hisdal, 1997). Meanwhile, summer low flow might be caused by a lack of snowmelt run off, i.e. low streamflow and may be accompanied by reduced soil moisture and water in storage. Thus, one might opt to focus on uniquely on summer or winter low flow, or might be interested in conditions which correspond to dry soils or reduced storage. These examples highlight the need for consideration of drivers and impacts when researching drought-to-flood transition events, a challenge which also extends to catchments with a weaker, but still present, seasonal cycle.
In catchments with a limited seasonal cycle, the difference between threshold level approaches is of marginal, if any, importance. However, it is worth noting that in catchments that react quickly to precipitation events, as in the Texas and Switzerland case studies, and in catchments that experience a pronounced dry and rainy season, such as in the cases of Australia and California, the normal condition can be one of dramatic swings between low and high flow conditions. In these cases, very dry conditions may not be highlighted as drought, especially when a variable threshold is used, if the average condition at that time of year is dry or if dry periods are short and punctuated. Transitions detected in such cases may represent a magnification or acceleration of a normal pattern of wetting and drying cycles as the most extreme examples of the normal pattern will be selected.
Finally, whether or not a drought-to-flood transition is apparent in the streamflow data can also be influenced by human behavior. For example, the Ventura River in California provides a substantial proportion of the water supply to the local municipality (Walter, 2015). The river is managed in order to sustain flows during prolonged dry spells via the Casitas Reservoir since cycling between drought and flood periods is the norm in the catchment (Walter, 2015). One news source noted that the local government halted water extractions in 2021, during the case study drought-to-flood transition event, thus preventing the river from running dry (Feraday, 2021). Management strategies like these may mean that, without place specific knowledge, drought, and therefore also drought-to-flood transitions, may be overlooked in many managed catchments. This could present a problem when attempting to study such events in a research context.
4.1 Event detection challenges
The results of the quantitative and qualitative analyses highlight that different types of drought-to-flood transition events bring their own challenges. These challenges primarily relate to the need to adapt the methodology to the impacts or physical processes that drive interest in drought-to-flood transition events. Poor methodological choices may result in failure to detect impactful events.
4.1.1 Challenges with drought detection
Selecting appropriate threshold level approaches for drought detection can be particularly difficult. Variable thresholds for drought may be most appropriate for use in drought-to-flood transitions research in cases when it is not important that a catchment be “dry” in an absolute sense. For example, rapid changes between anomalously low and high flows, regardless of the absolute amount of water in a catchment, could present significant management problems for e.g., water quality or environmental flows. In the Italian case study catchment, cycles of low and high streamflow can increase eutrophication, a concern in the Adriatic Sea into which the Savio River flows (Sani et al., 2024), and fish health can be effected by rapid shifts in hydrologic condition (Ceola et al., 2018). Similarly, hydropower production through run-of-the-river power plants may be sensitive to deviations from typical conditions because these rely on the natural flow of a river (Schaefli, 2015). Thus, lower than normal winter low flows in a snow-driven alpine catchment could result in a reduction in hydropower generation from such plants. Deviations from the average condition could therefore be impactful, while the identification of the low flow season, as might be detected using a fixed threshold, may not be.
Fixed thresholds and seasonal thresholds, on the other hand, may be appropriate in a transitions context when the primary concerns are the detection of longer drought periods, or periods in which soil and river flow conditions are “dry” in absolute terms. Hazards that relate to changes in soil properties may be more closely linked to dry conditions. For example, the occurrence of dry spells followed by heavy rainfall has been shown to lead to an increase in landslide occurrence (Tichavský et al., 2019), and wet/dry cycling can lead to increases in soil erosion (Weng et al., 2024; AghaKouchak et al., 2020) and degradation (Ye et al., 2011). Earthen structures and levees may be more likely to fail as a result of switches between drought, corresponding to an absolute deficit of water, and flood events (Robinson and Vahedifard, 2016; Ward et al., 2020; Janga et al., 2024). Serious water quality issues resulting from the build up of toxic materials in sediments that are washed away by subsequent rainfall may also occur (Schönbrunner et al., 2012; Lisboa et al., 2020). For example, the River Aire, in England, is an industrialized catchment in which heavy metals from industry and contaminated road dust are accumulated in sediments during the low flow season and mobilized at high concentrations in streamflow, rather than being diluted, during high flow events (Carter et al., 2006). Finally, if concerns are primarily around the likelihood of increased runoff from precipitation events due to soil hydrophobicity, prolonged drought periods accompanied by absolutely dry conditions may be most appropriate.
4.1.2 Challenges with flood detection
In general, the definition of floods in the context of drought-to-flood transitions as defined here is somewhat more straight forward compared to the definition of drought. The primary challenge appears to be the selection of threshold levels and data resolution, although this is not necessarily a trivial matter.
According to the media-reports, the 2022 drought event, which affected the Emme River in Switzerland was severe and had wide reaching impacts (Table 1). The subsequent flood event was also extreme (Table 1). Our analysis of the sub-daily data on the Emme River in Switzerland suggested that rapid floods, like those that are driven by short rain events, may be entirely missed using daily mean streamflow. This point has also been demonstrated by previous research (Bartens et al., 2024). In line with the results of Barendrecht et al. (2024), this could be problematic because many floods that follow drought may be “flashy” in character and driven by high intensity rainfall, especially for rapid transition events. Given that sub-daily, or instantaneous peak streamflow is not available in most catchments globally (Fill and Steiner, 2003; Bartens et al., 2024; Ding et al., 2014), it may suffice to use lower flood thresholds applied to daily mean streamflow in transition studies. Lower thresholds, however, may still result in the exclusion of some important, and inclusion of some less important, events (e.g in the Emme case, Fig. 4). This calls to attention the need for increased research into how and when droughts magnify the impacts of flood events. To adequately capture rapid drought-to-flood events at a global scale, alternative methodologies should be explored, and flood drivers, event-based approaches, and higher temporal resolution precipitation series should be considered.
4.1.3 Challenges with transitions detection
In addition to the previously discussed pitfalls and concerns with adequately capturing the impacts of interest in transition research, it is clear that current methodologies may fail to capture transition events that have been impactful in the real world. This is demonstrated by our analysis of the case study events in which the transitions were only consistently detected (using all methodological approaches) for two catchments (Texas and Australia). In some cases, failure to detect transitions appears to be due to a failure to detect drought and flood events individually. In others, it is more likely due to the challenge of defining an appropriate time interval between events. This effect is critical because the end date of the drought event can be highly variable when different threshold types and levels are used, thus extending this “window” between events.
4.2 Recommendations
In summary, when designing a study that incorporates many regime types, it is important to consider the drivers and characteristics of drought and flood events so that the main physical processes, impacts or sectors of interest are represented. What is impactful in one sector may have no effect in another, and studying drought to flood transitions without taking this into account will limit the interpretability of results. For instance, a 14 d transition window between drought and the 98th percentile of streamflow in the Emme River in Switzerland is substantially less extreme than the same transition would be in the River Aire in England. Thus it may be assumed to be less likely to have as severe of impacts. Similarly, a drought-to-flood transition could have significant impacts in locations with greater socio-economic, infrastructural or ecosystem vulnerability, even if the time interval between the two anomalies far exceeds the seasonal window applied in previous research. In contrast, the same event (in terms of magnitude or rate of change) may not qualify as a transition in a less vulnerable location where the recovery process between the end of a drought and start of a flood is faster, even if the transition window is statistically extreme. In this sense, the definition of drought-to-flood transitions would benefit from a more location specific approach, and increased research into what, specifically, leads the impacts of these events to be amplified when occurring in close succession.
To some extent, different threshold level types can be chosen so that they are appropriate to the impacts of interest. However, many impacts could be sufficiently (or insufficiently) represented by any of the tested approaches. The methodologies evaluated in this study could be further modified and new methodologies could be developed to better capture and characterize drought-to-flood transitions for different regimes.
One approach could be to apply a secondary filtering step after the initial event selection process. For instance, one could apply a variable drought threshold and then filter to only retain those events representing drought conditions that meet certain criteria. For example, droughts that occur in the snowmelt season in snow dominated catchments could be removed, focusing on summer drought events. Explicitly considering the drivers of drought and flood events, or at a minimum, filtering for the seasonality could bypass some potential pitfalls and allow for a more deliberate selection of events.
Another possible approach is to consider time intervals between drought and flood events, as well as the magnitude of shifts between low and high flow probabilistically. Generally, communities and industry that exist in close proximity to rivers have adapted to the normal conditions of that river (Di Baldassarre et al., 2015). In other words, hydrological events that would be considered extreme in some locations may be un-impactful in others. Further, even if droughts and floods that comprise transition events are not individually extreme, their combined effects may be both statistically rare and/or particularly harmful (Zscheischler et al., 2020; Tilloy et al., 2019; Liu et al., 2016a). Thus, when defining hydrological transitions, one possible option to avoid applying arbitrary thresholds or time intervals across many catchments, may be to probabilistically define parameters of the methodology relative to the normal condition of individual or geographically proximate rivers. For time intervals, this could involve a similar process to that presented in Fig. 8b, and then selecting a threshold probabilistically. Changes in magnitude could also be defined probabilistically. For instance, if large swings between low and high flows are typical, very high magnitude changes may be needed to warrant consideration (Swain et al., 2025). Although a probabilistic approach would not be explicitly tied to impacts or physical processes, such approaches would allow events to be defined relative to normal conditions within a catchment. In this way, analyses could take into consideration the relative rarity of drought-to-flood transitions as combined events.
4.3 Limitations
Although this analysis is intended to compare methodological approaches for the detection of streamflow droughts and floods in the context of drought-to-flood transitions, it is necessary to make some choices in regards to the methodologies applied. The threshold levels and approaches used, minimum time periods and aggregation and smoothing windows applied, may all have some effect on the type, timing and presence of transition events detected. Other choices, such as the 30 d minimum drought duration, or the decision to merge drought periods that are less than 15 d apart are somewhat arbitrary. These choices were made based on existing literature to facilitate comparison in a consistent framework. Use of media reports may present challenges, as these can mix event types (e.g. hydrological and meteorological drought). Additionally, the streamflow time series in some catchments (e.g. the Chilean case study) can have quality issues, such as data gaps, which often occur during periods of extremely high flows. This could introduce biases in the selection of flood events from the time series. Despite these challenges, the case studies provide a unique dataset covering a wide range of regimes necessary to understand the pro et cons of the methodologies and how their choice can influence the detection, or failure to detect, known and important drought-to-flood transition events.
In this paper, we have analyzed eight catchments that have experienced real-world impacts from drought-to-flood transitions. For these catchments, we have assessed the suitability of and differences between threshold level approaches for drought and flood detection in a transitions context. We have demonstrated that different threshold level approaches can result in the selection of different drought and flood events, and that when combined, this can influence the number and seasonality of detected transition events.
Further, we have shown that despite reported impacts, many of the case study events were not detected as transitions when using methods common in existing literature. In addition to differences between methodological choices, this may also be due to a still limited understanding of what makes a transition impactful. This challenge which may differ substantially depending on the context, and we highlight potential problems with the existing approaches in some scenarios. We demonstrate that in some cases (e.g. the Emme in Switzerland), rapid floods caused by short rainfall events may be missed in daily time series or when strict thresholds are used. We show that the probability of transition within a given time window between drought end and flood start dates can differ substantially for the same events depending on the applied method, and we highlight the importance of selecting an appropriate time window when defining drought-to-flood transitions. We further show that caution should be applied when choosing methodology to ensure that detected events have the desired characteristics. Finally, as an aside, although we have only considered flood as an absolute high flow over a fixed (or seasonally fixed) threshold, it is possible that rapid fluctuations between wet and dry conditions regardless of the magnitude of the events could be meaningful in some contexts (e.g. for run-of-the river hydropower generation, or ecological health).
There is currently no “one size fits all” approach to transition detection, instead, we recommend that future research into drought-to-flood transitions needs to be designed carefully, taking into account how definition and methodological choice can influence the type, characteristics, and potential impacts of detected drought-to-flood transitions. We suggest that some of the outlined pitfalls can be avoided by applying secondary filtering steps to select only events in a particular season or with certain drivers, by making efforts to specify the impacts that are of interest in an analysis, or by probabilistically defining transitions based on the dynamics of individual catchments. The physical characteristics of droughts defined using different approaches should be considered in the context of the specific impacts or physical process changes that are of interest. Finally, as a matter of priority, new methodologies should be developed that are designed to capture transitions jointly and further research is needed into how droughts and floods influence one another.
The source code used to generate the results presented in this paper may be made available on request from the corresponding author, as well as from https://doi.org/10.32614/RJ-2016-036 (Vitolo et al., 2017). The analyses were carried out using study-specific workflows that are not yet prepared for public distribution. Detailed descriptions of each processing step are provided in the Methods and Supplement.
All data used in this analysis are publicly available from the national and regional authorities or large sample datasets: Arpae Emilia-Romagna (2025), DeCicco et al. (2024) (https://doi.org/10.5066/P9X4L3GE), Falcone (2017) (https://doi.org/10.5066/F7HQ3XS4), Fowler et al. (2020) (https://doi.org/10.1594/PANGAEA.921850), do Nascimento et al. (2024a) (https://doi.org/10.5281/zenodo.13255133), do Nascimento et al. (2024b), NRFA (2025), Norwegian Water Resources and Energy Directorate (2025), Höge et al. (2023) (https://doi.org/10.5281/zenodo.7784633), Kauzlaric et al. (2023) (https://doi.org/10.5281/zenodo.7691294), USGS (2024) and Alvarez-Garreton et al. (2018) (https://doi.org/10.1594/PANGAEA.894885). These are additionally detailed in Table S1.
The supplement related to this article is available online at https://doi.org/10.5194/hess-29-6069-2025-supplement.
BJA, EMC, MIB, RA, and EM contributed to the conceptualization of the study. BJA, EMC, and MIB contributed to data curation and methodology. BJA carried out all of the formal analysis, visualization, project administration, and software components, as well as writing and preparation of the first draft. MIB acquired the funding support and provided supervision. BJA and LMT conducted the investigation. All coauthors contributed to editing, review and validation.
At least one of the (co-)authors is a member of the editorial board of Hydrology and Earth System Sciences. The peer-review process was guided by an independent editor, and the authors also have no other competing interests to declare.
Publisher's note: Copernicus Publications remains neutral with regard to jurisdictional claims made in the text, published maps, institutional affiliations, or any other geographical representation in this paper. While Copernicus Publications makes every effort to include appropriate place names, the final responsibility lies with the authors. Views expressed in the text are those of the authors and do not necessarily reflect the views of the publisher.
The authors thank Emiliano Gellati for assistance with accessing the Norwegian streamflow data.
This research has been supported by the Schweizerischer Nationalfonds zur Förderung der Wissenschaftlichen Forschung (grant no. 200021_214907).
This paper was edited by Xing Yuan and reviewed by two anonymous referees.
AghaKouchak, A., Chiang, F., Huning, L. S., Love, C. A., Mallakpour, I., Mazdiyasni, O., Moftakhari, H., Papalexiou, S. M., Ragno, E., and Sadegh, M.: Climate Extremes and Compound Hazards in a Warming World, Annual Review of Earth and Planetary Sciences, 48, 519–548, https://doi.org/10.1146/annurev-earth-071719-055228, 2020. a
Alvarez-Garreton, C., Mendoza, P. A., Boisier, J. P., Addor, N., Galleguillos, M., Zambrano-Bigiarini, M., Lara, A., Puelma, C., Cortes, G., Garreaud, R., McPhee, J., and Ayala, A.: The CAMELS-CL dataset, PANGAEA [data set], https://doi.org/10.1594/PANGAEA.894885, 2018. a
Amale, H. S., Birthal, P. S., and Negi, D. S.: Delayed monsoon, irrigation and crop yields, Agricultural Economics, 54, 77–94, https://doi.org/10.1111/agec.12746, 2023. a, b
AP News: Severe flooding in Italy kills 2; drought persists, AP News, https://apnews.com/article/floods-agriculture-drought-deaths-italy-30ec2bfd7d3efc3491c9f12024b6c181 (last access: 24 October 2025), 2023. a
Arpae Emilia-Romagna: Dext3r–Hydrological Data Platform, Arpae Emilia-Romagna [data set], https://simc.arpae.it/dext3r/ (last access: 25 November 2024), 2025. a
Arrighi, C. and Domeneghetti, A.: Brief communication: On the environmental impacts of the 2023 floods in Emilia-Romagna (Italy), Nat. Hazards Earth Syst. Sci., 24, 673–679, https://doi.org/10.5194/nhess-24-673-2024, 2024. a
Ascione, C. and Valdano, E.: How floods may affect the spatial spread of respiratory pathogens: the case of Emilia-Romagna, Italy in May 2023, https://doi.org/10.1101/2024.09.20.24314056, 2024. a
Australian Associated Press: Queensland flooding: Daintree River beats 118 year record, cutting off residents, The Guardian, https://www.theguardian.com/australia-news/2019/jan/27/queensland-flooding-emergency-alert-as-daintree-river-beats-118-year-record (last access: 24 October 2025), 2019. a
Bakke, S. J., Ionita, M., and Tallaksen, L. M.: The 2018 northern European hydrological drought and its drivers in a historical perspective, Hydrol. Earth Syst. Sci., 24, 5621–5653, https://doi.org/10.5194/hess-24-5621-2020, 2020. a, b
Ballester, J., Quijal-Zamorano, M., Méndez Turrubiates, R. F., Pegenaute, F., Herrmann, F. R., Robine, J. M., Basagaña, X., Tonne, C., Antó, J. M., and Achebak, H.: Heat-related mortality in Europe during the summer of 2022, Nature Medicine, 29, 1857–1866, https://doi.org/10.1038/s41591-023-02419-z, 2023. a
Barendrecht, M. H., Matanó, A., Mendoza, H., Weesie, R., Rohse, M., Koehler, J., de Ruiter, M., Garcia, M., Mazzoleni, M., Aerts, J. C. J. H., Ward, P. J., Di Baldassarre, G., Day, R., and Van Loon, A. F.: Exploring drought-to-flood interactions and dynamics: A global case review, WIREs Water, e1726, https://doi.org/10.1002/wat2.1726, 2024. a, b, c, d, e
Bartens, A., Shehu, B., and Haberlandt, U.: Flood frequency analysis using mean daily flows vs. instantaneous peak flows, Hydrol. Earth Syst. Sci., 28, 1687–1709, https://doi.org/10.5194/hess-28-1687-2024, 2024. a, b
BBC News: Drought conditions spread in England, BBC News, https://www.bbc.com/news/uk-17533235 (last access: 24 October 2025), 2012a. a
BBC News: Parts of England no longer in drought after heavy rain, BBC News, https://www.bbc.com/news/uk-18032552 (last access: 24 October 2025), 2012b. a
Beckett, H. A. A., Neeman, T., Fuenzalida, T. I., Bryant, C., Latorre, S. C., Ovington, L. I., Sack, L., Meir, P., and Ball, M. C.: Ghosts of dry seasons past: Legacy of severe drought enhances mangrove salinity tolerance through coordinated cellular osmotic and elastic adjustments, Plant, Cell & Environment, 46, 2031–2045, https://doi.org/10.1111/pce.14604, 2023. a, b
Berglund, N.: Drought blamed for high power rates, https://www.newsinenglish.no/2018/07/13/drought-blamed-for-high-electricity-rates/ (last access: 24 October 2025), 2018a. a
Berglund, N.: Flash floods sweep through valleys, https://www.newsinenglish.no/2018/10/14/flash-floods-sweeping-through-valleys/ (last access: 24 October 2025), 2018b. a
Berglund, N.: Norway hasn't been so dry since 1947, https://www.newsinenglish.no/2018/07/11/norway-hasnt-been-so-dry-since-1947/ (last access: 24 October 2025), 2018c. a
Biblioteca del Congreso Nacional: Biblioteca del Congreso Nacional | Ley Chile, https://www.bcn.cl/leychile (last access: 24 October 2025), 1999. a
Brunner, L. and Voigt, A.: Pitfalls in diagnosing temperature extremes, Nature Communications, 15, 2087, https://doi.org/10.1038/s41467-024-46349-x, 2024. a
Brunner, M. I. and Chartier-Rescan, C.: Drought Spatial Extent and Dependence Increase During Drought Propagation From the Atmosphere to the Hydrosphere, Geophysical Research Letters, 51, e2023GL107918, https://doi.org/10.1029/2023GL107918, 2024. a
Brunner, M. I., Slater, L., Tallaksen, L. M., and Clark, M.: Challenges in modeling and predicting floods and droughts: A review, WIREs Water, 8, e1520, https://doi.org/10.1002/wat2.1520, 2021. a, b
Brunner, M. I., Götte, J., Schlemper, C., and Van Loon, A. F.: Hydrological Drought Generation Processes and Severity Are Changing in the Alps, Geophysical Research Letters, 50, e2022GL101776, https://doi.org/10.1029/2022GL101776, 2023. a
Bundesamt für Umwelt (BAFU): Hitzewelle und Trockenheit, https://www.bafu.admin.ch/bafu/de/home/themen/wasser/extremereignisse/niedrigwasser/niedrigwasser-ereignisse/hitzewelle-und-trockenheit.html (last access: 24 October 2025), 2022. a
Bürki, M.: Das Hochwasser war im Kemmeriboden-Bad schlimmer als 2014, Der Bund, https://www.derbund.ch/vorsicht-vor-wassermassen-und-schwemmholz-in-der-emme-859041848931 (last access: 24 October 2025), 2022. a, b
Carter, J., Walling, D. E., Owens, P. N., and Leeks, G. J. L.: Spatial and temporal variability in the concentration and speciation of metals in suspended sediment transported by the River Aire, Yorkshire, UK, Hydrological Processes, 20, 3007–3027, https://doi.org/10.1002/hyp.6156, 2006. a
Casson, N. J., Contosta, A. R., Burakowski, E. A., Campbell, J. L., Crandall, M. S., Creed, I. F., Eimers, M. C., Garlick, S., Lutz, D. A., Morison, M. Q., Morzillo, A. T., and Nelson, S. J.: Winter Weather Whiplash: Impacts of Meteorological Events Misaligned With Natural and Human Systems in Seasonally Snow-Covered Regions, Earth's Future, 7, 1434–1450, https://doi.org/10.1029/2019EF001224, 2019. a
Ceola, S., Pugliese, A., Ventura, M., Galeati, G., Montanari, A., and Castellarin, A.: Hydro-power production and fish habitat suitability: Assessing impact and effectiveness of ecological flows at regional scale, Advances in Water Resources, 116, 29–39, https://doi.org/10.1016/j.advwatres.2018.04.002, 2018. a
Chelli, G.: Po river drought in 2022 was the worst of the last two centuries, Nature Italy, https://doi.org/10.1038/d43978-023-00121-9, 2023. a
Cilli, S.: Evaluation of bedload yield in two small sand-bed rivers of the Ravenna province (Italy), PhD thesis, https://hdl.handle.net/11392/2487848 (last access: 24 October 2024), 2020. a
Cui, H., Jiang, S., Ren, L., Qin, T., Zhu, Q., Fang, X., and Xu, C.-Y.: Identification of drought-flood abrupt alternation by a new non-stationary framework considering natural-social system impacts, Journal of Hydrology, 654, 132899, https://doi.org/10.1016/j.jhydrol.2025.132899, 2025. a
Davies, R.: USA – Rescues and Evacuations in California After Atmospheric River Triggers More Floods, Flood List, https://floodlist.com/america/usa/california-atmospheric-river-floods-january-2023 (last access: 24 October 2025), 2023. a
DeCicco, L., Hirsch, R., Lorenz, D., Watkins, D., and Johnson, M.: dataRetrieval: Retrieval Functions for USGS and EPA Hydrologic and Water Quality Data (Version 2.7.15) [R], U.S. Geological Survey, https://doi.org/10.5066/P9X4L3GE, 2024. a
D'Emilio, F.: Rain-swollen rivers flood some towns in north Italy; Venice prepares to raise mobile dike in lagoon, AP News, https://apnews.com/article/italy-floods-venice-rain-emilia-romagna-0c14ed1883e785c452139a31ebd55a99 (last access: 24 October 2025), 2023. a
Descroix, L., Moussa, I. B., Genthon, P., Sighomnou, D., Mahé, G., Mamadou, I., Vandervaere, J.-P., Gautier, E., Maiga, O. F., Rajot, J.-L., Abdou, M. M., Dessay, N., Ingatan, A., Noma, I., Yéro, K. S., Karambiri, H., Fensholt, R., Albergel, J., Olivry, J.-C., Descroix, L., Moussa, I. B., Genthon, P., Sighomnou, D., Mahé, G., Mamadou, I., Vandervaere, J.-P., Gautier, E., Maiga, O. F., Rajot, J.-L., Abdou, M. M., Dessay, N., Ingatan, A., Noma, I., Yéro, K. S., Karambiri, H., Fensholt, R., Albergel, J., and Olivry, J.-C.: Impact of Drought and Land – Use Changes on Surface – Water Quality and Quantity: The Sahelian Paradox, in: Current Perspectives in Contaminant Hydrology and Water Resources Sustainability, IntechOpen, https://doi.org/10.5772/54536, 2013. a
Di Baldassarre, G., Viglione, A., Carr, G., Kuil, L., Yan, K., Brandimarte, L., and Blöschl, G.: Debates–Perspectives on socio-hydrology: Capturing feedbacks between physical and social processes, Water Resources Research, 51, 4770–4781, https://doi.org/10.1002/2014WR016416, 2015. a
Di Baldassarre, G., Martinez, F., Kalantari, Z., and Viglione, A.: Drought and flood in the Anthropocene: feedback mechanisms in reservoir operation, Earth Syst. Dynam., 8, 225–233, https://doi.org/10.5194/esd-8-225-2017, 2017. a
Ding, J., Haberlandt, U., and Dietrich, J.: Estimation of the instantaneous peak flow from maximum daily flow: a comparison of three methods, Hydrology Research, 46, 671–688, https://doi.org/10.2166/nh.2014.085, 2014. a
do Nascimento, T. V. M., Rudlang, J., Höge, M., van der Ent, R., Chappon, M., Seibert, J., Hrachowitz, M., and Fenicia, F.: EStreams: An Integrated Dataset and Catalogue of Streamflow, Hydro-Climatic Variables and Landscape Descriptors for Europe, Zenodo [data set], https://doi.org/10.5281/zenodo.13255133, 2024a. a
do Nascimento, T. V. M., Rudlang, J., Höge, M., van der Ent, R., Chappon, M., Seibert, J., Hrachowitz, M., and Fenicia, F.: EStreams: An integrated dataset and catalogue of streamflow, hydro-climatic and landscape variables for Europe, Scientific Data, 11(1), 879, https://doi.org/10.1038/s41597-024-03706-1, 2024b. a
Effler, E., Isaäcson, M., Arntzen, L., Heenan, R., Canter, P., Barrett, T., Lee, L., Mambo, C., Levine, W., Zaidi, A., and Griffin, P. M.: Factors contributing to the emergence of Escherichia coli O157 in Africa, Emerging Infectious Diseases, 7, 812–819, https://doi.org/10.3201/eid0705.017507, 2001. a
Emol.nacional: Alerta amarilla se mantiene en VII Región, Emol Nacional, https://www.emol.com/noticias/nacional/2000/06/23/24309/alerta-amarilla-se-mantiene-en-vii-region.html (last access: 24 October 2025), 2000a. a
Emol.nacional: Preocupa crecida de ríos Teno y Lontué en VII Región, Emol Nacional, https://www.emol.com/noticias/nacional/2000/06/30/25226/preocupa-crecida-de-rios-teno-y-lontue-en-vii-region.html (last access: 24 October 2025), 2000b. a
England Jr., J. F., Cohn, T. A., Faber, B. A., Stedinger, J. R., Thomas Jr., W. O., Veilleux, A. G., Kiang, J. E., and Mason Jr., R. R.: Guidelines for determining flood flow frequency–Bulletin 17C, USGS Numbered Series 4-B5, U. S. Geological Survey, Reston, VA, https://doi.org/10.3133/tm4B5, 2019. a
Escriva-Bou, A., Medellin-Azuara, J., Hanak, E., Abatzoglou, J., and Viers, J.: Drought and California's Agriculture, Public Policy Institute of California, https://www.ppic.org/wp-content/uploads/policy-brief-drought-and-californias-agriculture.pdf (last access: 24 October 2025), 2022. a
Fagan, J.: Mangroves remember droughts – this could be bad news for our coastlines, ANU Reporter, https://reporter.anu.edu.au/all-stories/mangroves-remember-droughts-this-could-be-bad-news-for-our-coastlines (last access: 24 October 2025), 2023. a
Falcone, J. A.: U.S. Geological Survey GAGES-II time series data from consistent sources of land use, water use, agriculture, timber activities, dam removals, and other historical anthropogenic influences, U.S. Geological Survey [data set], https://doi.org/10.5066/F7HQ3XS4, 2017. a
Feraday, C.: City of Ventura Stops Pumping Water From Ventura River Amid Long-Running Lawsuit, KCLU, https://www.kclu.org/local-news/2021-09-02/city-stops-pumping-water-from-ventura-river-amid-long-running-lawsuit (last access: 24 October 2025), 2021. a
Fill, H. D. and Steiner, A. A.: Estimating Instantaneous Peak Flow from Mean Daily Flow Data, Journal of Hydrologic Engineering, 8, 365–369, https://doi.org/10.1061/(ASCE)1084-0699(2003)8:6(365), 2003. a
Fitzpatrick, R. G. J., Bain, C. L., Knippertz, P., Marsham, J. H., and Parker, D. J.: The West African Monsoon Onset: A Concise Comparison of Definitions, Journal of Climate, 28, 8673–8694, https://doi.org/10.1175/JCLI-D-15-0265.1, 2015. a
Fleig, A. K., Tallaksen, L. M., Hisdal, H., and Demuth, S.: A global evaluation of streamflow drought characteristics, Hydrol. Earth Syst. Sci., 10, 535–552, https://doi.org/10.5194/hess-10-535-2006, 2006. a
Flury, G. and Schmuki, D.: Die Flutwelle der Emme von Montagabend, Schweizer Radio und Fernsehen (SRF), https://www.srf.ch/meteo/meteo-stories/unwetter-videos-die-flutwelle-der-emme-von-montagabend (last access: 24 October 2025), 2022. a
Fowler, K., Acharya, S. C., Addor, N., Chou, C., and Peel, M.: CAMELS-AUS v1: Hydrometeorological time series and landscape attributes for 222 catchments in Australia, PANGAEA [data set], https://doi.org/10.1594/PANGAEA.921850, 2020. a
Freedman, A.: “Endless stream” of deadly atmospheric rivers bring fresh flood threats to California, Axios, https://www.axios.com/2023/01/09/california-atmospheric-river-storm-flooding-winds (last access: 29 October 2025), 2023. a
Furl, C., Sharif, H., Zeitler, J. W., Hassan, A. E., and Joseph, J.: Hydrometeorology of the catastrophic Blanco river flood in South Texas, May 2015, Journal of Hydrology: Regional Studies, 15, 90–104, https://doi.org/10.1016/j.ejrh.2017.12.001, 2018. a
Gallina, V., Torresan, S., Critto, A., Sperotto, A., Glade, T., and Marcomini, A.: A review of multi-risk methodologies for natural hazards: Consequences and challenges for a climate change impact assessment, Journal of Environmental Management, 168, 123–132, https://doi.org/10.1016/j.jenvman.2015.11.011, 2016. a
Garreaud, R. D., Alvarez-Garreton, C., Barichivich, J., Boisier, J. P., Christie, D., Galleguillos, M., LeQuesne, C., McPhee, J., and Zambrano-Bigiarini, M.: The 2010–2015 megadrought in central Chile: impacts on regional hydroclimate and vegetation, Hydrol. Earth Syst. Sci., 21, 6307–6327, https://doi.org/10.5194/hess-21-6307-2017, 2017. a
Gimbel, K. F., Puhlmann, H., and Weiler, M.: Does drought alter hydrological functions in forest soils?, Hydrol. Earth Syst. Sci., 20, 1301–1317, https://doi.org/10.5194/hess-20-1301-2016, 2016. a
Götte, J. and Brunner, M. I.: Hydrological Drought-To-Flood Transitions Across Different Hydroclimates in the United States, Water Resources Research, 60, e2023WR036504, https://doi.org/10.1029/2023WR036504, 2024. a, b, c, d
Harvey, F.: Heavy April rain “not enough to end drought”, The Guardian, https://www.theguardian.com/environment/2012/apr/20/heavy-april-rain-drought (last access: 24 October 2025), 2012. a
Hisdal, H., Tallaksen, L. M., Peters, E., Stahl, K., and Zaidman, M.: Drought event definition, ARIDE Technical Rep., 6, 15, https://www.droughtmanagement.info/literature/UNIVERSITYofOSLO_Drought_Event_Definition_2000.pdf (last access: 24 October 2025), 2000. a
Hisdal, H., Tallaksen, L. M., Gauster, T., Bloomfield, J. P., Parry, S., Prudhomme, C., and Wanders, N.: Hydrological drought characteristics, in: Hydrological Drought, Elsevier, 157–231, https://www.sciencedirect.com/science/article/pii/B9780128190821000060 (last access: 24 October 2025), https://doi.org/10.1016/B978-0-12-819082-1.00006-0, 2024. a
Höge, M., Kauzlaric, M., Siber, R., Schönenberger, U., Horton, P., Schwanbeck, J., Floriancic, M. G., Viviroli, D., Wilhelm, S., Sikorska-Senoner, A. E., Addor, N., Brunner, M., Pool, S., Zappa, M., and Fenicia, F.: Catchment attributes and hydro-meteorological time series for large-sample studies across hydrologic Switzerland (CAMELS-CH) (Version 0.1), Zenodo [data set], https://doi.org/10.5281/zenodo.7784633, 2023. a
Hubble, T. and De Carli, E.: Mechanisms and Processes of the Millennium Drought River Bank Failures: Lower Murray River, Tech. rep., https://doi.org/10.13140/RG.2.1.2379.9520, 2016. a
Hyam, R. and Wiggins, N.: Daintree River floods as torrential rain continues in Far North Queensland, ABC News, https://www.abc.net.au/news/2019-01-27/flood-alert-issued-as-daintree-floods-from-torrential-rain/10750906 (last access: 24 October 2025), 2019. a
Janga, J. K., Reddy, K. R., and Schulenberg, J.: Climate change impacts on safety of levees: A Review, in: Geotechnical Engineering Challenges to Meet Current and Emerging Needs of Society, CRC Press, https://doi.org/10.1201/9781003431749-310, 2024. a
Jorio, L.: Why water-rich Switzerland needs to monitor droughts, https://www.swissinfo.ch/eng/business/why-water-rich-switzerland-needs-to-monitor-droughts/48590018 (last access: 24 October 2025), 2023. a
Kauzlaric, M., Schürmann, S., Ummel, D., and Zischg, A.: Hourly discharge database HydroCH, Zenodo [data set], https://doi.org/10.5281/zenodo.7691294, 2023. a
KCAL News Staff: Ventura County hit hard by heavy rain; evacuation orders issued, CBS News, https://www.cbsnews.com/losangeles/news/ventura-county-hit-hard-by-heavy-rain-evacuation-orders-issued/ (last access: 24 October 2024), 2023. a
Kendon, M., Marsh, T., and Parry, S.: The 2010–2012 drought in England and Wales, Weather, 68, 88–95, https://doi.org/10.1002/wea.2101, 2013. a, b
Kim, Y., Kim, S., Jeong, H., and An, H.: Quantitatively defining megadrought based on drought events in central Chile, Geomatics, Natural Hazards and Risk, 13, 975–992, https://doi.org/10.1080/19475705.2022.2060763, 2022. a
La Tercera en Internet: A partir de hoy vuelven cortes de luz programados, La Tercera Internet, https://web.archive.org/web/20001207004200/http://www.tercera.cl/casos/luz/noticias/junio/noti13.html#expand (last access: 24 October 2025), 2000. a
Lal, P., Prakash, A., Kumar, A., Srivastava, P. K., Saikia, P., Pandey, A., Srivastava, P., and Khan, M.: Evaluating the 2018 extreme flood hazard events in Kerala, India, Remote Sensing Letters, 11, 436–445, https://doi.org/10.1080/2150704X.2020.1730468, 2020. a
LandschaftsRaume Napfgebiet: Rückblick Hochwasser Emme (4. Juli 2022), https://www.napfgebiet.ch/rueckblick-hochwasser-emme-4-juli-2022/ (last access: 24 October 2025), 2022. a
Laudon, H., Poléo, A. B. S., Vøllestad, L. A., and Bishop, K.: Survival of brown trout during spring flood in DOC-rich streams in northern Sweden: the effect of present acid deposition and modelled pre-industrial water quality, Environmental Pollution, 135, 121–130, https://doi.org/10.1016/j.envpol.2004.09.023, 2005. a
Le News: Switzerland breaks river temperature records, Le News CH, https://lenews.ch/2022/07/30/switzerland-breaks-river-temperature-records/ (last access: 24 October 2024), 2022. a
Lema, F., Mendoza, P. A., Vásquez, N. A., Mizukami, N., Zambrano-Bigiarini, M., and Vargas, X.: Technical note: What does the Standardized Streamflow Index actually reflect? Insights and implications for hydrological drought analysis, Hydrol. Earth Syst. Sci., 29, 1981–2002, https://doi.org/10.5194/hess-29-1981-2025, 2025. a
Levy, K., Woster, A. P., Goldstein, R. S., and Carlton, E. J.: Untangling the Impacts of Climate Change on Waterborne Diseases: a Systematic Review of Relationships between Diarrheal Diseases and Temperature, Rainfall, Flooding, and Drought, Environmental Science & Technology, 50, 4905–4922, https://doi.org/10.1021/acs.est.5b06186, 2016. a
Li, X., Zhang, Q., Zhang, D., and Ye, X.: Investigation of the drought–flood abrupt alternation of streamflow in Poyang Lake catchment during the last 50 years, Hydrology Research, 48, 1402–1417, https://doi.org/10.2166/nh.2016.266, 2016. a
Liechti, K.: Storms 2022 – Minor damage, no fatalities, https://www.wsl.ch/en/news/storms-2022-minor-damage-no-fatalities/ (last access: 24 October 2024), 2023. a
Lisboa, M. S., Schneider, R. L., Sullivan, P. J., and Walter, M. T.: Drought and post-drought rain effect on stream phosphorus and other nutrient losses in the Northeastern USA, Journal of Hydrology: Regional Studies, 28, 100672, https://doi.org/10.1016/j.ejrh.2020.100672, 2020. a
Lisonbee, J., Ribbe, J., and Wheeler, M.: Defining the north Australian monsoon onset: A systematic review, Progress in Physical Geography, 44, 398–418, https://doi.org/10.1177/0309133319881107, 2020. a
Liu, B., Siu, Y. L., and Mitchell, G.: Hazard interaction analysis for multi-hazard risk assessment: a systematic classification based on hazard-forming environment, Nat. Hazards Earth Syst. Sci., 16, 629–642, https://doi.org/10.5194/nhess-16-629-2016, 2016a. a
Liu, Z., Törnros, T., and Menzel, L.: A probabilistic prediction network for hydrological drought identification and environmental flow assessment, Water Resources Research, 52, 6243–6262, https://doi.org/10.1002/2016WR019106, 2016b. a
Lloyd, J. and Leon, B. D.: Relentless Storm Packs Another Wave of Downpours. When Will the Rain End?, Channel 4 News Los Angeles, https://www.nbclosangeles.com/weather-news/california-storm-los-angeles-rain-flooding-ventura-county-101-freeway/3070323/ (last access: 25 October 2025), 2023. a
Lower Colorado River Authority: No Highland Lakes water available for LCRA agricultural customers this year – LCRA – Energy, Water, Community, https://www.lcra.org/news/news-releases/no-highland-lakes-water-available-for-lcra-agricultural-customers-this-year/ (last access: 24 October 2025), 2023. a
Lund, J. and Rypel, A. L.: This Drought is Dead – Long Live the Drought, https://californiawaterblog.com/2023/03/26/this-drought-is-dead-long-live-the-drought/ (last access: 24 October 2025), 2023. a
Marsh, T., Parry, S., Kendon, M., and Hannaford, J.: The 2010–12 drought and subsequent extensive flooding – a remarkable hydrological transformation, Tech. rep., UK Centre for Ecology and Hydrology, Maclean Building Benson Lane Crowmarsh Gifford Wallingford Oxfordshire OX10 8BB UK, ISBN 9781906698447, https://nora.nerc.ac.uk/id/eprint/503643 (last access: 24 October 2025), 2013. a, b
Martina, V., Clara, D. P., Giulia, F., Ardigò, M., Giuseppe, G. R., Francesca, B., Chiara, R., and Luca, R.: The 2023 Floods in the Emilia-Romagna Region, Italy: A Retrospective Qualitative Investigation into Response Strategies and Criticalities, International Journal of Disaster Risk Reduction, 105089, https://doi.org/10.1016/j.ijdrr.2024.105089, 2024. a
Matanó, A., Berghuijs, W. R., Mazzoleni, M., de Ruiter, M. C., Ward, P. J., and Loon, A. F. V.: Compound and consecutive drought-flood events at a global scale, Environmental Research Letters, 19, 064048, https://doi.org/10.1088/1748-9326/ad4b46, 2024. a, b, c, d
Matanó, A., Hamed, R., Brunner, M. I., Barendrecht, M. H., and Van Loon, A. F.: Drought decreases annual streamflow response to precipitation, especially in arid regions, Hydrol. Earth Syst. Sci., 29, 2749–2764, https://doi.org/10.5194/hess-29-2749-2025, 2025. a
Mead, H.: Looking back: autumn deluge swells local river to dangerous levels, MSN, https://www.msn.com/en-gb/weather/topstories/looking-back-autumn-deluge-swells-local-river-to-dangerous-levels/ar-AA1rzLll (last access: 24 October 2025), 2024. a
Medellín-Azuara, J., Escriva-Bou, A., Rodríguez-Flores, J. M., Cole, S. A., Abatzoglou, J. T., Viers, J. H., Santos, N., Summer, D. A., Medina, C., and Arévalo, R.: Economic Impacts of the 2020–22 Drought on California Agriculture, UC Merced, https://cawaterlibrary.net/wp-content/uploads/2022/11/20AmSf-Economic_Impact_CA_Drought_V01.pdf (last access: 24 October 2025), 2022. a
Meylan, P., Favre, A.-C., and Musy, A.: Predictive Hydrology: A Frequency Analysis Approach, CRC Press, ISBN: 978-1-4398-8341-9, 2012. a
Mishra, A., Alnahit, A., and Campbell, B.: Impact of land uses, drought, flood, wildfire, and cascading events on water quality and microbial communities: A review and analysis, Journal of Hydrology, 596, 125707, https://doi.org/10.1016/j.jhydrol.2020.125707, 2021. a
Montanari, A., Nguyen, H., Rubinetti, S., Ceola, S., Galelli, S., Rubino, A., and Zanchettin, D.: Why the 2022 Po River drought is the worst in the past two centuries, Science Advances, 9, eadg8304, https://doi.org/10.1126/sciadv.adg8304, 2023. a, b
Morrissiey, D.: No flow in the Llano River, DailyTrib.com, https://www.dailytrib.com/2023/09/06/no-flow-in-the-llano-river/ (last access: 24 October 2025), 2023. a
Murillo, M. V. and Foulon, C. L.: Crisis and policymaking in Latin America: The case of Chile's 1998–99 electricity crisis, World Development, 34, 1580–1596, https://doi.org/10.1016/j.worlddev.2006.01.005, 2006. a, b
Na, W. and Najafi, M. R.: Rising risks of hydroclimatic swings: A large ensemble study of dry and wet spell transitions in North America, Global and Planetary Change, 238, 104476, https://doi.org/10.1016/j.gloplacha.2024.104476, 2024. a
Navarro, H.: Crews Rescue 14 From Swelling Ventura River During Storm, NBC Los Angeles, https://www.nbclosangeles.com/weather-news/crews-rescue-14-from-swelling-ventura-river-during-storm/3070037/ (last access: 24 October 2025), 2023. a
National River Flow Archive (NRFA), Centre for Ecology and Hydrology: The UK National River Flow Archive (NRFA) – daily, monthly and peak river flow data, Centre for Ecology and Hydrology [data set], https://nrfa.ceh.ac.uk/ (last access: 30 October 2025), 2025. a
Nielsen-Gammon, J. W., Zhang, F., Odins, A. M., and Myoung, B.: Extreme Rainfall in Texas: Patterns and Predictability, Physical Geography, 26, 340–364, https://doi.org/10.2747/0272-3646.26.5.340, 2005. a
Norwegian Water Resources and Energy Directorate (NVE): NVE Hydrological API, NVE [data set], https://hydapi.nve.no/UserDocumentation/, 2025. a
Oertel, M., Meza, F. J., and Gironás, J.: Observed trends and relationships between ENSO and standardized hydrometeorological drought indices in central Chile, Hydrological Processes, 34, 159–174, https://doi.org/10.1002/hyp.13596, 2020. a
Office of the Official Secretary to the Governor-General: North Queensland Floods 2019, Tech. rep., The Governor General of the Commonwealth of Australia, https://www.gg.gov.au/australian-honours-and-awardsnational-emergency-medal/north-queensland-floods-2019 (last access: 24 October 2025), 2020. a
Parry, S., Marsh, T., and Kendon, M.: 2012: from drought to floods in England and Wales, Weather, 68, 268–274, https://doi.org/10.1002/wea.2152, 2013. a, b
Povoledo, E.: Flood-Battered Italian Region May See More Violent and Frequent Storms, The New York Times, https://www.nytimes.com/2023/05/27/world/europe/italy-floods-emilia-romagna.html (last access: 24 October 2025), 2023. a, b
Robinson, J. D. and Vahedifard, F.: Weakening mechanisms imposed on California's levees under multiyear extreme drought, Climatic Change, 137, 1–14, https://doi.org/10.1007/s10584-016-1649-6, 2016. a
Rogers, D. and Tsirkunov, V.: Costs and benefits of early warning systems. Global Assessment Report on Disaster Risk Reduction, Risk and Vulnerability Assessment 69358, World Bank Group, Washington, D. C., http://documents.worldbank.org/ curated/en/609951468330279598/Global-assessment-report- on-disaster-risk-reduction-costs-and-benefits-of-early-warning-systems (last access: 24 October 2025), 2010. a
Sani, T., Marini, M., Campanelli, A., Machado Toffolo, M., Goffredo, S., and Grilli, F.: Evolution of Freshwater Runoff in the Western Adriatic Sea over the Last Century, Environments, 11, 22, https://doi.org/10.3390/environments11010022, 2024. a
Santalucia, P.: Lack of snow condemns Italy's Po to a desperately dry summer, AP News, https://apnews.com/article/italy-river-po-low-levels-2c144b8f034ccc5863a7924e9d37f324 (last access: 24 October 2025), 2023. a
Schaefli, B.: Projecting hydropower production under future climates: a guide for decision-makers and modelers to interpret and design climate change impact assessments, WIREs Water, 2, 271–289, https://doi.org/10.1002/wat2.1083, 2015. a
Schönbrunner, I. M., Preiner, S., and Hein, T.: Impact of drying and re-flooding of sediment on phosphorus dynamics of river-floodplain systems, Science of The Total Environment, 432, 329–337, https://doi.org/10.1016/j.scitotenv.2012.06.025, 2012. a
Schweizer Radio und Fernsehen: Trockene Monate wirken sich verheerend auf Schweizer Äcker aus, Schweizer Radio und Fernsehen (SRF), https://www.srf.ch/news/schweiz/hitzesommer-2022-trockene-monate-wirken-sich-verheerend-auf-schweizer-aecker-aus (last access: 24 October 2025), 2022. a
Serra, P.: Chile's electricity markets: Four decades on from their original design, Energy Strategy Reviews, 39, 100798, https://doi.org/10.1016/j.esr.2021.100798, 2022. a
Sheffield, A. and Kalansky, J.: California-Nevada Drought Status Update, https://www.drought.gov/drought-status-updates/california-nevada-drought-status-update-10-18-22 (last access: 24 October 2025), 2022. a
Skaland, R. G., Colleuille, H., Andersen, A. S. H., Mamen, J., Grinde, L., Tajet, H. T. T., Lundstad, E., Sidselrud, L. F., Tunheim, K., Hanssen-Bauer, I., Benestad, R., Heiberg, H., and Hygen, H. O.: Tørkesommeren 2018, Tech. rep., Meteorologisk Institutt, https://www.google.com/url?sa=t&source=web&rct=j& opi=89978449&url=https://www.met.no/publikasjoner/met-info/_/attachment/download/e0ef32dc-d9ac-4506-b6bb-3ceeb0d88ce6:98ec5c085e3d8ddc04f158cda767c676b6fbc142/ T%25C3%25B8rkesommeren%25202018.pdf&ved=2ahUKE wjj4e-e3JGMAxUw0wIHHYQ_DiQQFnoECBQQAQ&usg= AOvVaw3-2LDKyfOKhdaE-5E1n3II (last access: 24 October 2025), 2019. a
Skinner, A.: Chart Shows Lake Travis' Dramatic Change in Water Levels After Sudden Flood, News Week, https://www.newsweek.com/chart-shows-lake-travis-dramatic-change-water-levels-after-sudden-flood-1839063 (last access: 24 October 2025), 2023a. a
Skinner, A.: Texas River Floods After Massive Water Level Increase Overnight, News Week, https://www.newsweek.com/texas-river-floods-after-massive-water-level-increase-overnight-1838326 (last access: 24 October 2025), 2023b. a
Smith, J. A., Baeck, M. L., Morrison, J. E., and Sturdevant-Rees, P.: Catastrophic Rainfall and Flooding in Texas, Journal of Hydrometeorology, 1, 5–25, https://doi.org/10.1175/1525-7541(2000)001<0005:CRAFIT>2.0.CO;2, 2000. a
Staff Writers: Daintree Ferry closed as river flooding causes chaos, Newsport, https://archive.newsport.com.au/2018/december/daintree-ferry-closed-as-river-flooding-causes-chaos (last access: 24 October 2025), 2018. a
Stahl, K., Kohn, I., Blauhut, V., Urquijo, J., De Stefano, L., Acácio, V., Dias, S., Stagge, J. H., Tallaksen, L. M., Kampragou, E., Van Loon, A. F., Barker, L. J., Melsen, L. A., Bifulco, C., Musolino, D., de Carli, A., Massarutto, A., Assimacopoulos, D., and Van Lanen, H. A. J.: Impacts of European drought events: insights from an international database of text-based reports, Nat. Hazards Earth Syst. Sci., 16, 801–819, https://doi.org/10.5194/nhess-16-801-2016, 2016. a
Stahl, K., Vidal, J.-P., Hannaford, J., Tijdeman, E., Laaha, G., Gauster, T., and Tallaksen, L. M.: The challenges of hydrological drought definition, quantification and communication: an interdisciplinary perspective, Proc. IAHS, 383, 291–295, https://doi.org/10.5194/piahs-383-291-2020, 2020. a, b
Stober, E.: IN PHOTOS: Flooding in Italy leaves 14 dead, cars submerged, thousands without power, Global News, https://globalnews.ca/news/9713487/italy-floods-photos/ (last access: 24 October 2025), 2023. a
Swain, D. L., Prein, A. F., Abatzoglou, J. T., Albano, C. M., Brunner, M., Diffenbaugh, N. S., Singh, D., Skinner, C. B., and Touma, D.: Hydroclimate volatility on a warming Earth, Nature Reviews Earth & Environment, 6, 35–50, https://doi.org/10.1038/s43017-024-00624-z, 2025. a, b, c
Swissinfo.ch: Swiss lakes and rivers drop to record lows due to continuing drought, https://www.swissinfo.ch/eng/climate-change/swiss-lakes-and-rivers-drop-to-record-lows-due-continuing-drought/47828220 (last access: 24 October 2025), 2022. a
Tallaksen, L. M. and Hisdal, H.: Regional analysis of extreme streamflow drought duration and deficit volume, IAHS Publication, 246, 141–150, 1997. a
Tallaksen, L. M. and Van Lanen, H. A.: Hydrological drought: processes and estimation methods for streamflow and groundwater, Elsevier Science, https://doi.org/10.1016/C2017-0-03464-X, 2023. a, b, c, d, e
Tallaksen, L. M., Madsen, H., and Clausen, B.: On the definition and modelling of streamflow drought duration and deficit volume, Hydrological Sciences Journal, 42, 15–33, https://doi.org/10.1080/02626669709492003, 1997. a
Tichavský, R., Ballesteros-Cánovas, J. A., Šilhán, K., Tolasz, R., and Stoffel, M.: Dry Spells and Extreme Precipitation are The Main Trigger of Landslides in Central Europe, Scientific Reports, 9, 14560, https://doi.org/10.1038/s41598-019-51148-2, 2019. a
Tijdeman, E., Stahl, K., and Tallaksen, L. M.: Drought Characteristics Derived Based on the Standardized Streamflow Index: A Large Sample Comparison for Parametric and Nonparametric Methods, Water Resources Research, 56, e2019WR026315, https://doi.org/10.1029/2019WR026315, 2020. a
Tilloy, A., Malamud, B. D., Winter, H., and Joly-Laugel, A.: A review of quantification methodologies for multi-hazard interrelationships, Earth-Science Reviews, 196, 102881, https://doi.org/10.1016/j.earscirev.2019.102881, 2019. a
The European Space Agency: Satellites map aftermath of Emilia-Romagna floods, https://www.esa.int/Applications/Observing_the_Earth/Satellites_map_aftermath_of_Emilia-Romagna_floods (last access: 24 October 2025), 2023. a
Turton, S.: How climate change can make catastrophic weather systems linger for longer, The Conversation, https://theconversation.com/how-climate-change-can-make-catastrophic-weather-systems-linger-for-longer-111832 (last access: 24 October 2025), 2019. a
Turton, S.: North Queensland's record-breaking floods are a frightening portent of what's to come under climate change, The Conversation, https://theconversation.com/north-queenslands-record-breaking-floods-are-a-frightening-portent-of-whats-to-come-under-climate-change-220039 (last access: 24 October 2025), 2023. a
UK Environment Agency: River Aire: Catchment flood management plan, Tech. rep., UK Environment Agency, https://www.gov.uk/government/publications/river-aire-catchment-flood-management-plan (last access: 24 October 2025), 2009. a
U.S. Geological Survey: Watershed Boundary Dataset (WBD), U.S. Geological Survey [data set], https://www.usgs.gov/national-hydrography/watershed-boundary-dataset (lat access: 30 October 2025), 2024. a
Valente, M., Zanellati, M., Facci, G., Zanna, N., Petrone, E., Moretti, E., Barone-Adesi, F., and Ragazzoni, L.: Health System Response to the 2023 Floods in Emilia-Romagna, Italy: A Field Report, Prehospital and Disaster Medicine, 38, 813–817, https://doi.org/10.1017/S1049023X23006404, 2023. a
Van Baars, S.: The horizontal failure mechanism of the Wilnis peat dyke, Géotechnique, 55, 319–323, https://doi.org/10.1680/geot.2005.55.4.319, 2005. a
van Huijgevoort, M. H. J., Hazenberg, P., van Lanen, H. A. J., and Uijlenhoet, R.: A generic method for hydrological drought identification across different climate regions, Hydrol. Earth Syst. Sci., 16, 2437–2451, https://doi.org/10.5194/hess-16-2437-2012, 2012. a, b, c
Van Loon, A. F. and Laaha, G.: Hydrological drought severity explained by climate and catchment characteristics, Journal of Hydrology, 526, 3–14, https://doi.org/10.1016/j.jhydrol.2014.10.059, 2015. a, b, c
Van Loon, A. F. and Van Lanen, H. A. J.: A process-based typology of hydrological drought, Hydrol. Earth Syst. Sci., 16, 1915–1946, https://doi.org/10.5194/hess-16-1915-2012, 2012. a, b
Vitolo, C., Fry, M., and Buytaert, W.: rnrfa: An R package to Retrieve, Filter and Visualize Data from the UK National River Flow Archive, The R Journal [software], 8(2), 102–116, https://doi.org/10.32614/RJ-2016-036, 2017. a
Vu, K.: Texas drought has deepened amid this year's brutal heat, The Texas Tribune, https://www.texastribune.org/2023/10/02/texas-drought-agriculture-wildfires/ (last access: 24 October 2025), 2023. a
Wainwright, M.: The river Aire carries floodwater through Leeds at 1.30pm, The Guardian, https://www.theguardian.com/uk/the-northerner/2012/sep/25/floods-river-aire-leeds-swale-morpeth (last access: 24 October 2025), 2012. a
Walter, L.: Ventura River Watershed Management Plan, Technical Report, Ventura River Watershed Council, https://venturawatershed.org/the-watershed-plan (last access: 24 October 2025), 2015. a, b
Ward, P. J., De Ruiter, M. C., Mård, J., Schröter, K., Van Loon, A., Veldkamp, T., Von Uexkull, N., Wanders, N., AghaKouchak, A., Arnbjerg-Nielsen, K., Capewell, L., Carmen Llasat, M., Day, R., Dewals, B., Di Baldassarre, G., Huning, L. S., Kreibich, H., Mazzoleni, M., Savelli, E., Teutschbein, C., Van Den Berg, H., Van Der Heijden, A., Vincken, J. M., Waterloo, M. J., and Wens, M.: The need to integrate flood and drought disaster risk reduction strategies, Water Security, 11, 100070, https://doi.org/10.1016/j.wasec.2020.100070, 2020. a, b, c, d, e, f, g
Weng, X., Zhu, J., Wang, D., Chen, H., Wang, S., and Qing, Y.: Exploring the relationship between drought-flood abrupt alternation and soil erosion over Guangdong, China through a convection-permitting model, Geomatics, Natural Hazards and Risk, 15, 2383779, https://doi.org/10.1080/19475705.2024.2383779, 2024. a
Wurtsbaugh, W. A., Paerl, H. W., and Dodds, W. K.: Nutrients, eutrophication and harmful algal blooms along the freshwater to marine continuum, WIREs Water, 6, e1373, https://doi.org/10.1002/wat2.1373, 2019. a
Ye, W.-M., Qi, Z.-Y., Chen, B., Xie, J., Huang, Y., Lu, Y.-R., and Cui, Y.-J.: Mechanism of cultivation soil degradation in rocky desertification areas under dry/wet cycles, Environmental Earth Sciences, 64, 269–276, https://doi.org/10.1007/s12665-010-0846-2, 2011. a
Zscheischler, J., Martius, O., Westra, S., Bevacqua, E., Raymond, C., Horton, R. M., van den Hurk, B., AghaKouchak, A., Jézéquel, A., Mahecha, M. D., Maraun, D., Ramos, A. M., Ridder, N. N., Thiery, W., and Vignotto, E.: A typology of compound weather and climate events, Nature Reviews Earth & Environment, 1, 333–347, https://doi.org/10.1038/s43017-020-0060-z, 2020. a