the Creative Commons Attribution 4.0 License.
the Creative Commons Attribution 4.0 License.
 | 06 Nov 2025
A novel framework for accurately quantifying wetland depression water storage capacity with coarse-resolution terrain data
Boting Hu
Liwen Chen
Yanfeng Wu
Jingxuan Sun
Y. Jun Xu
Qingsong Zhang
Accurate quantification of wetland depression water storage capacity (WDWSC) is imperative for comprehending the wetland hydrologic regulation functions to support integrated water resources management. Considering the challenges posed by the high acquisition cost of high-resolution lidar DEM or the absence of field measurements for most wetland areas, urgent attention is required to develop an accurate estimation framework for WDWSC using open-source, low-cost, multi-source remote sensing data. In response, we developed a novel framework, WetlandSCB, utilizing coarse-resolution terrain data for accurate estimation of WDWSC. This framework overcame several technical difficulties, including biases in above-water topography, incompleteness and inaccuracy of wetland depression identification, and the absence of bathymetry. Validation and application of the framework were conducted in two national nature reserves of northeast China. The study demonstrated that, by integrating the priority-flood algorithm, morphological operators, and prior information, one can accurately delineate the wetland depression distribution, with overall accuracy and kappa coefficient both exceeding 0.95. The use of a water occurrence map can effectively correct numerical biases in above-water topography, with Pearson coefficient and R2 increasing by 0.33 and 0.38, respectively. Coupling spatial prediction and modeling with remote sensing techniques yielded highly accurate bathymetry estimates, with < 3 % relative error compared with field measurements. Overall, the WetlandSCB framework achieved estimation of WDWSC with < 10 % relative error compared with field topographic and bathymetric measurements. The framework and its concept are transferable to other wetland areas globally where field measurements and/or high-resolution terrain data are unavailable, contributing to a major technical advancement in estimating WDWSC in river basins.
- Article
(14720 KB) - Full-text XML
- BibTeX
- EndNote


Wetlands are multifunctional ecosystems, considered as nature-based solutions for effective water management in river basins (Thorslund et al., 2017). They exert a profound influence on watershed hydrologic processes and water resource availability through their hydrologic regulation functions, such as maintaining baseflow, buffering floods, and delaying droughts (Acreman and Holden, 2013; Wu et al., 2023). These functions are essential for enhancing watershed resilience and ensuring water security (Cohen et al., 2016; Evenson et al., 2018; Lane et al., 2018). Wetland depression water storage capacity (hereafter abbreviated as WDWSC) represents a critical component of wetland hydrologic regulation functions. Quantitative study of the WDWSC contributes to advancing scientific understanding of wetland hydrologic regulation functions and to improving integrated water resources management at the watershed scale (Ahmad et al., 2020; Fang et al., 2019; Jones et al., 2018; Shook et al., 2021).
The WDWSC can be defined as the maximum surface water volume that each wetland depression can store without spilling to down-gradient waters (Jones et al., 2018). Previous studies predominantly employed wetland depression identification algorithms to derive wetland depression topography from terrain data. In a vector-based contour representation, wetland depressions are shown as nested closed contours, with inner contours at lower elevations than the outer ones (Wu and Lane, 2016). Area–depth pairs are derived from the contour lines of wetland depressions and hypsometric curves are constructed by applying curve-fitting methods to the obtained pairs (e.g., Haag et al., 2005; Wu and Lane, 2016). Therefore, the key determinants for the accuracy of the WDWSC calculation are the rationality of the wetland depression identification algorithms and the precision of terrain data.
Many scholars have conducted research on wetland depression identification algorithms, which can be mainly categorized into three types: depression filling, depression breaching, and hybrid, combining both filling and breaching approaches (Wu et al., 2019). Among these, the priority-flood algorithm within the depression filling category is widely adopted as a prevalent algorithm for wetland depression identification (Barnes et al., 2014; Lindsay, 2016; Wu et al., 2019; Zhou et al., 2016). The priority-flood algorithm works by flooding DEM cells inward from their edges using a priority queue to determine the sequence of cells to be flooded. Wu et al. (2019) and Rajib et al. (2020) demonstrated the feasibility of accurately deriving wetland depression topography using the priority-flood algorithm in the Pipestem watershed and Upper Mississippi river basin, respectively.
Bare-earth high-resolution airborne light detection and ranging (lidar) DEM can provide accurate topographic information of wetland depressions, significantly improving the estimation accuracy of the WDWSC. For example, Jones et al. (2018) used high-resolution lidar DEM to estimate WDWSC in the Delmarva Peninsula. However, the high acquisition cost of lidar DEM renders it impractical for large-scale estimation of WDWSC. Global open-access spaceborne-derived DEMs (hereafter referred as global DEMs), such as the Shuttle Radar Topography Mission (SRTM), the ALOS Global Digital Surface Model, and the Terra Advanced Spaceborne Thermal Emission and Reflection Radiometer (ASTER) Global Digital Elevation Model, offer topographic information at a fine spatial scale. However, compared with the bare-earth lidar DEM, the global DEMs exhibit three obvious limitations. First, radar altimetry cannot penetrate water surfaces, so the global DEMs produced from radar altimetry do not provide any bathymetric information. Second, in certain regions, there may be substantial numerical discrepancies in above-water topography. The above-water DEMs demonstrate systematic overestimation caused by canopy height and their accuracy is significantly influenced by terrain slope (Marešová et al., 2024; Simard et al., 2024). Third, the global DEMs often suffer from lower horizontal and vertical resolutions (Chen et al., 2022; Liu et al., 2019; Liu et al., 2024).
Due to the limitations in global DEMs, delineation of wetland depression areas using the advanced priority-flood algorithm also suffers from three problems: the bias in above-water topography (Fig. 1a and b), incompleteness and inaccuracy of wetland depression identification (Fig. 1c), and the absence of bathymetric information (Fig. 1d) (Gdulová et al., 2020; Hawker et al., 2019; Li et al., 2011; Liu et al., 2024).
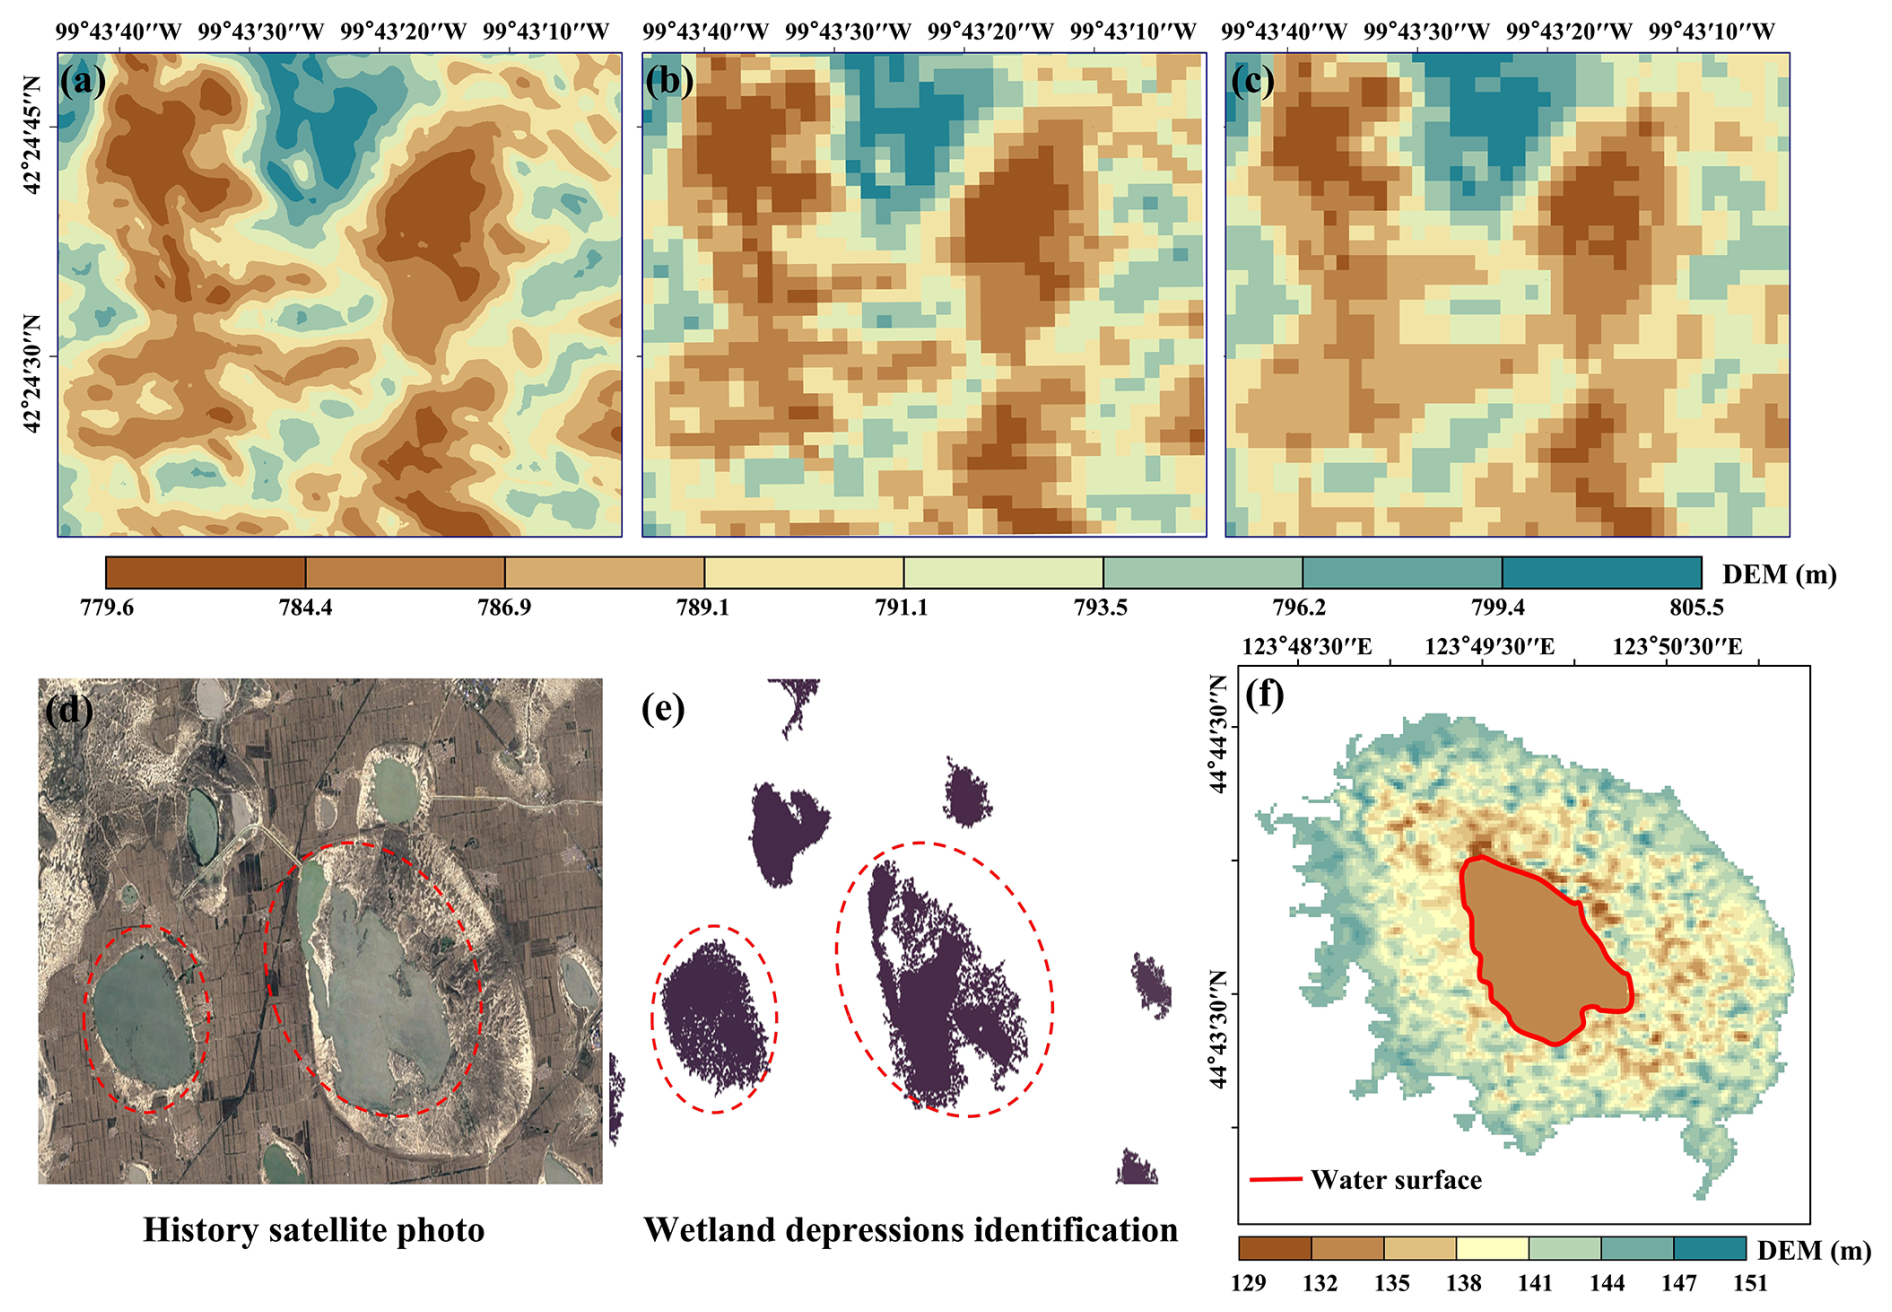
Figure 1(a–c) Wetland depression extraction based on the priority-flood algorithm and global DEMs showing the issues caused by the bias of above-water topography. Panels (a)–(c) illustrate the discrepancies in above-water topography between the lidar DEM and ALOS DEM, where (a) shows the 1 m spatial resolution lidar DEM and (b) displays the lidar DEM resampled to 30 m spatial resolution using the nearest-neighbor method. Panel (c) presents the 30 m spatial resolution ALOS DEM. (d–f) Incompleteness and inaccuracy of wetland depression identification. Panel (d) shows a historical satellite image from 2013, and panel (e) depicts the spatial distribution of wetland depressions extracted using the priority-flood algorithm and ALOS DEM, which exhibits noticeable characteristics of incomplete boundaries and spatial fragmentation. The absence of bathymetric information is shown in (f), where the entire water surface is represented by a single elevation value of 129 m.
In an effort to minimize the impact of the absence of bathymetric information in global DEMs on the estimation accuracy of the WDWSC, researchers have conducted studies on the estimation of underwater hypsometric relationships of wetland depressions and the methods can be divided into two types: spatial prediction and modeling methods and remote sensing technologies. The spatial prediction and modeling methods assume that the bathymetry can be considered as a spatial extension of the surrounding exposed terrains due to long-term tectonic and geophysical evolution processes. Consequently, the underwater hypsometric relationship is assumed to be fundamentally similar to the above-water hypsometric relationship in wetland depressions (e.g., Ahmad et al., 2020; Bonnema et al., 2016; Bonnema and Hossain, 2017; Liu and Song, 2022; Tsai et al., 2010; Vanthof and Kelly, 2019; Verones et al., 2013; Wu and Lane, 2016; Xiong et al., 2021). However, the large numerical bias in the above-water topography of global DEMs in certain regions can distort the constructed above-water hypsometric relationship of wetland depressions, thus introducing significant uncertainty to the underwater hypsometric relationship estimated by this method (Khazaei et al., 2022; Zhan et al., 2021). Over the past few decades, remote sensing technologies have demonstrated remarkable capabilities in estimating underwater hypsometric relationships at large spatial scales, facilitated by the rapid emergence of various advanced satellite sensors, including optical, passive microwave, and radar instruments (Duan and Bastiaanssen, 2013; Gao, 2015; Liu et al., 2022). The commonly employed approach for estimating underwater hypsometric relationships requires simultaneous observations of water area provided by optical images (e.g., the Landsat series) and the corresponding water level provided by altimetry satellites (e.g., Sentinel-3, CryoSat-2, ICESat-2, Envisat). However, accuracy challenges arise due to numerical biases of altimetry satellites, cloud contamination in some optical images, and the occasional occurrence of one water area value corresponding to multiple water level values or vice versa (Li et al., 2019a, b; Liu et al., 2024).
In summary, previous studies using the global DEMs have overlooked critical issues, such as the incompleteness and inaccuracy of wetland depression identification, as well as biases in above-water topography, leading to significant uncertainties in WDWSC estimation. In addition, insufficient attention has been paid to the drawbacks and limitations of both spatial prediction and modeling methods and remote sensing technologies in estimating bathymetry. Consequently, a comprehensive and systematic solution for the accuracy estimation of WDWSC based on the global DEMs has not yet been developed. Therefore, this study aims to develop a framework for accurately estimating WDWSC by integrating multi-source remote sensing data and prior knowledge. Specifically, we integrated the priority-flood algorithm, morphological operators, and prior information on the water distribution map to delineate the spatial extent of wetland depression areas. We then corrected the bias in above-water topography based on the water occurrence map. Finally, we utilized remote sensing techniques to couple spatial prediction and modeling to estimate the bathymetry of wetland depression areas. The principle contribution of this developed framework, termed WetlandSCB, lies in addressing the challenges hindering the improvement of accuracy in estimating WDWSC based on global DEMs.
The WetlandSCB framework can be summarized in four steps, as illustrated in Fig. 2: step 1, delineation of wetland depression areas; step 2, above-water topography reconstruction; step 3, bathymetric information estimation; and step 4, hypsometric curve construction and WDWSC calculation. Each of the four steps is described in the following sections.
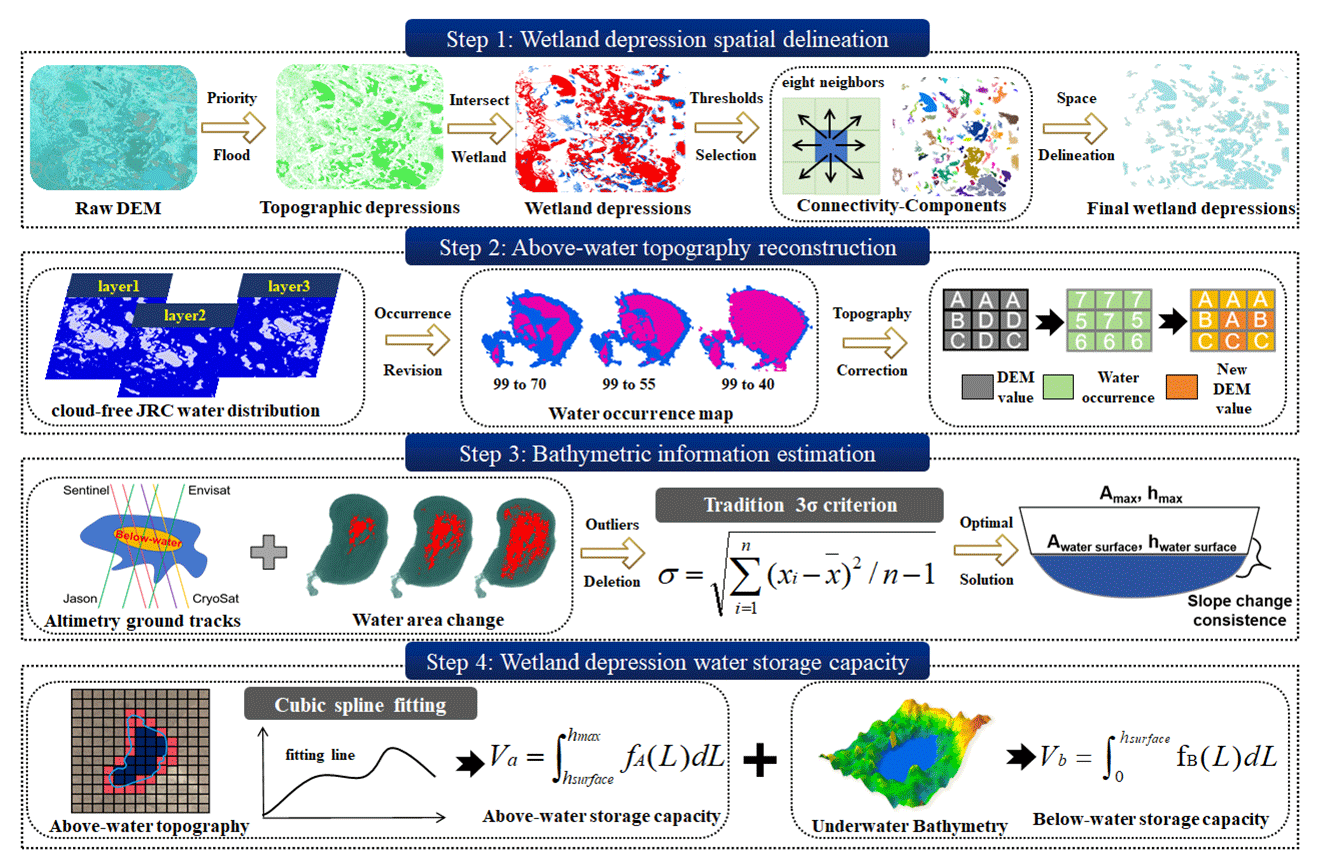
Figure 2Flowchart of the WetlandSCB framework for accurate estimation of wetland depression water storage capacity (WDWSC) comprising four technical steps. In step 1, spatial distribution of wetland depression areas are delineated. In step 2, wetland above-water topography is reconstructed. In step 3, bathymetric information of wetland depression areas is estimated. In step 4, a hypsometric curve (i.e., depth–area relation) is developed and WDWSC is quantified.
2.1 Wetland depression spatial delineation
We extracted the original wetland depression map from the SRTM DEM based on the priority-flood algorithm and wetland maps (Fig. 3). The priority-flood algorithm was applied to identify and fill sinks in the DEM, resulting in a depressionless DEM. By subtracting the original DEM from the depressionless DEM, an elevation difference grid was generated, with each cell value representing the depth of the depression. Subsequently, cells with elevation changes greater than zero were extracted and identified as topographic depressions. To eliminate the artifact wetland depressions, it was necessary to transform the wetland depression map into a binary image consisting of pixels of the required area, labeled as logical ones (wetland depression) and zeros (non-wetland depression). We then employed the eight-neighbor connectivity algorithm to extract the spatial extent of each wetland depression from the binary image. Artifact wetland depressions (e.g., rivers and channels) typically exhibit low circularity,
where P (m) and A (m2) are the perimeter and area of the wetland depression, respectively, and high eccentricity,
where Df (m) and Lm (m) represent, respectively, the distance between foci and the length of the major axis of the wetland depression, whereas true wetland depressions generally display high circularity and low eccentricity. By iteratively refining the threshold values of these indicators and validating the results through visual inspection, the optimal thresholds were established to effectively eliminate artifact wetland depressions (Ahmad et al., 2020).
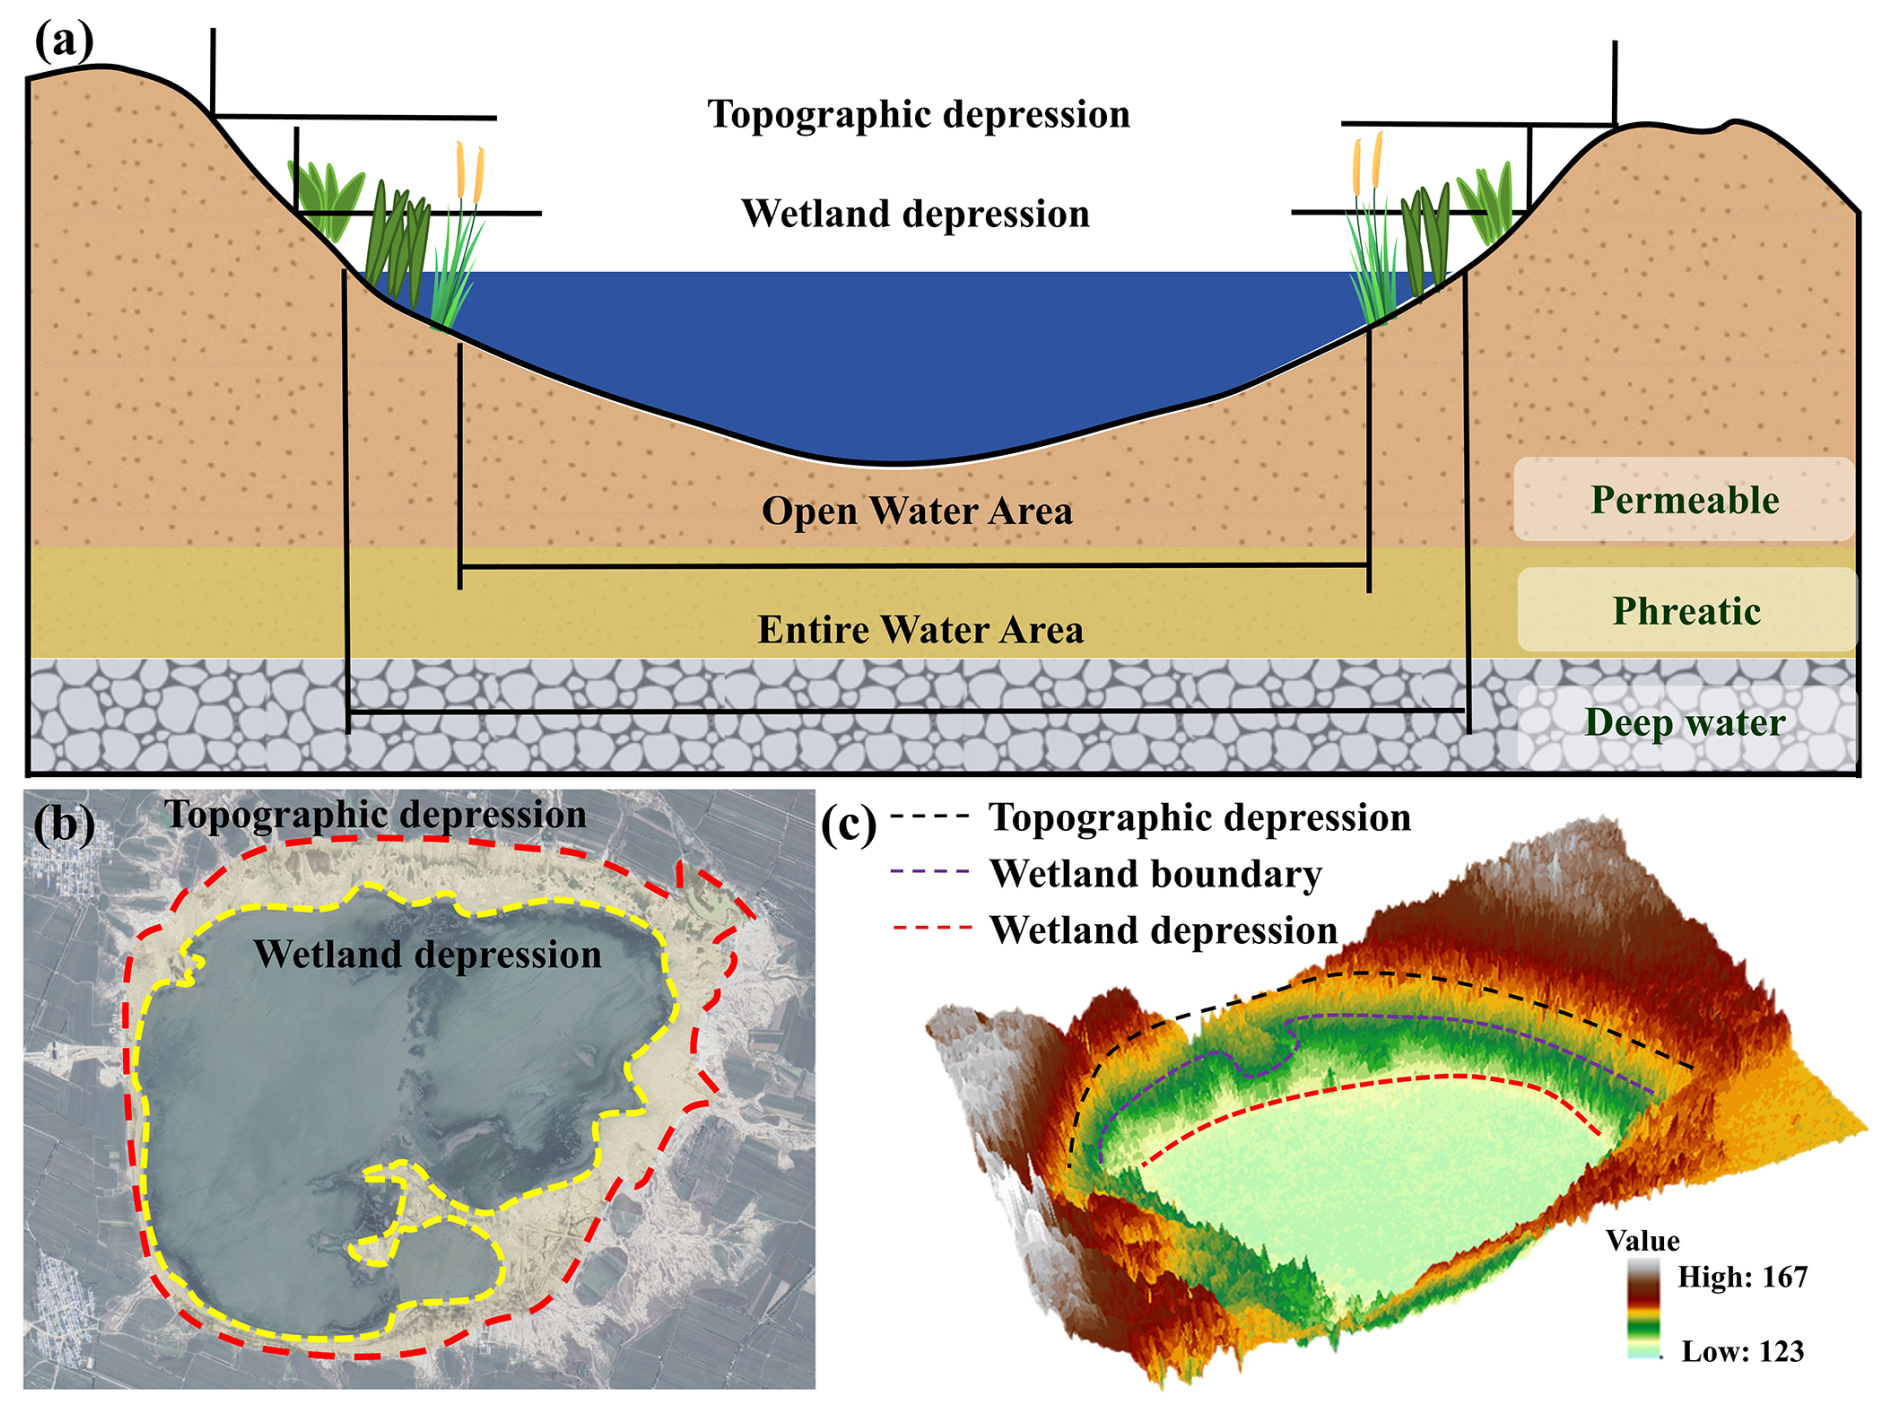
Figure 3(a) Conceptual diagram of wetland depression profile. (b) Representative wetland depression area located in Nenjiang river basin, China. (c) 3-dimensional diagram of wetland depression area.
Due to incompleteness and inaccuracy in identification of some wetland depressions in the original wetland depression map (Fig. 4a), morphological operators of erosion and dilation are applied for the initial spatial processing (Fig. 4b). The erosion operator erodes away the boundaries of wetland depressions to enhance their edges and remove noise. The dilation operator fills up any small hole (non-wetland depression pixels) surrounded by a group of wetland depression pixels (Pulvirenti et al., 2011a). The combined effect of the two operators is to remove noise while preserving the substantive features in the image. Specifically, on the Python platform, morphological operation was performed by first applying the erosion operator, followed by the dilation operator. These operations require a binary-valued kernel, where the output pixel value in the erosion step is determined by the minimum value within the kernel. A disk-shaped kernel with a 3-pixel radius was used, which is significantly smaller than typical wetland depressions but sufficient to eliminate speckle noise. The water distribution map, which is defined as the maximum water body distribution map, serves as prior information and effectively characterizes the spatial extent of wetland depressions (Fig. 4c). Therefore, after applying morphological operators, the wetland depression map is merged with the water distribution map within the depression boundaries through a union operation, ensuring the creation of a comprehensive and finalized wetland depression map (Fig. 4d).
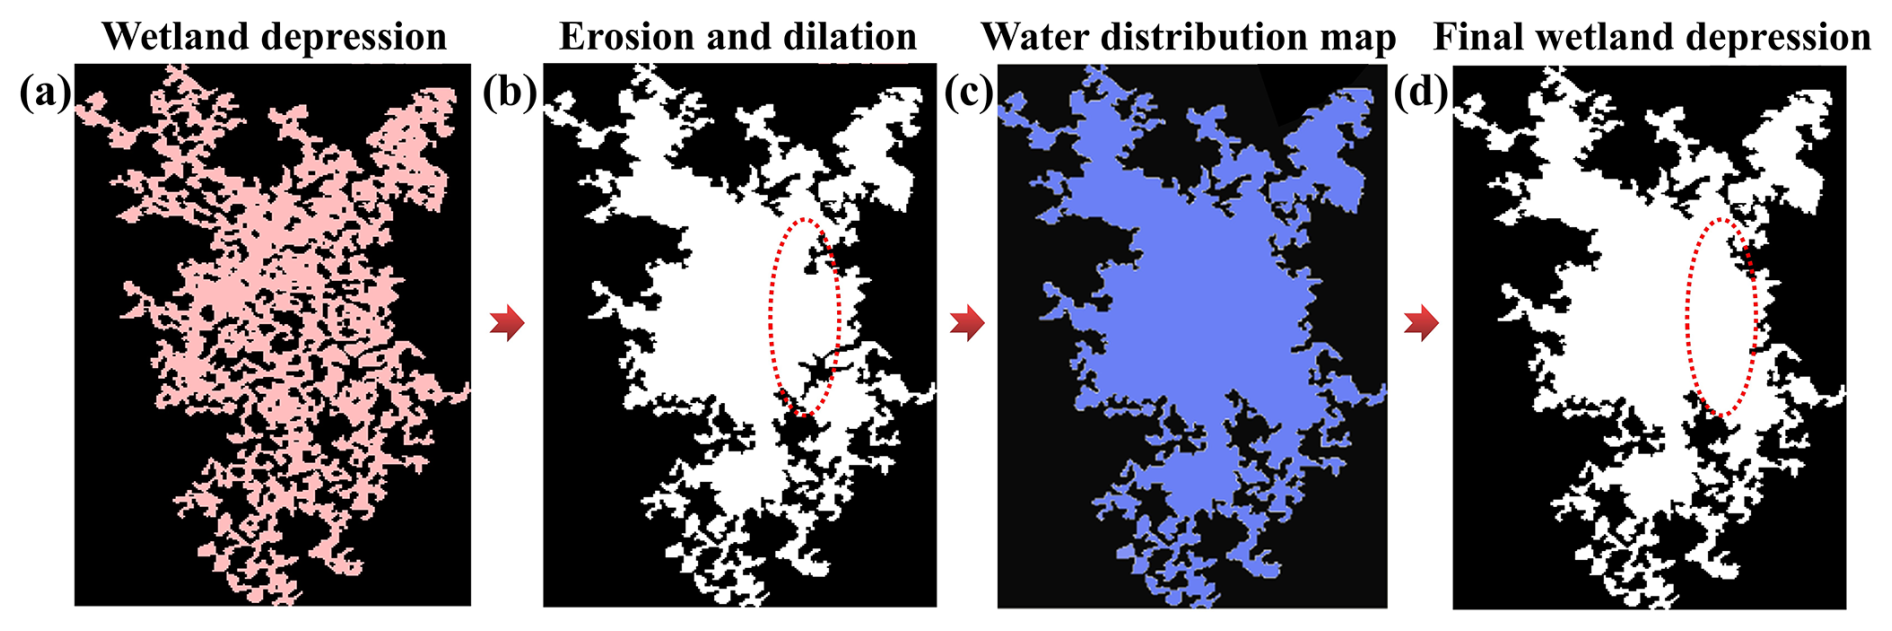
Figure 4Final wetland depression map derived from morphological operators and prior water distribution information. (a) Spatial distribution of the wetland depression before processing, with pink indicating wetland depression pixels. (b) Spatial distribution of the wetland depression after morphological operator processing, represented in white. (c) Maximum water extent within the wetland depression boundaries, highlighted in blue. (d) Refined spatial distribution of the wetland depression, obtained by combining (b) and (c) through a union operation. The red dotted ellipses indicate wetland depression pixels supplemented with prior information.
2.2 Above-water topography reconstruction
The basic idea is that the greater the water occurrence for a pixel (i.e., the more frequently it is covered by water), the deeper the water (Li et al., 2021). Therefore, if there is an accurate water occurrence map, a close relationship between the water occurrence and the topography for wetland depressions can be found. The water occurrence map is generated by summing the times that the pixel is detected as water and dividing it by the number of total valid observations. The open-source Global Surface Water Mapping Layers produced by the European Commission's Joint Research Centre (JRC) contains a water occurrence map, which has been widely used to describe the topography of wetland depressions globally or in different regions (Luo et al., 2019; Pickens et al., 2020; Yao et al., 2019; Zou et al., 2018b). Moreover, the global surface water dynamics maps produced by Global Land Analysis and Discovery (GLAD), also include a water occurrence map (Pickens et al., 2020). However, the cloud-free JRC water distribution images have temporal discontinuity. They are more available during dry seasons than wet seasons, which leads to deviations in the representation of real topography at the scale of individual wetland depressions (Chu et al., 2020).
To address this issue, this study proposes a method to restore the cloud-contaminated JRC water distribution images to improve the accuracy of the JRC water occurrence map. For wetland depression areas, the JRC water distribution images are classified into cloud-free and cloud-contaminated images using the cloud screening algorithm (a rudimentary cloud-scoring algorithm called simpleCloudScore) of the Google Earth Engine platform (Mullen et al., 2021). The Canny edge detection algorithm is used to obtain the water body boundary for the two types of image (Canny, 1986). Theoretically, if the water areas are the same, the water body boundary of the cloud-free image should overlap with the exposed water body boundary in the cloud-contaminated image (Fig. 5a). Therefore, by overlapping the water body boundaries of the cloud-free images with the cloud-contaminated images, the missing spatial extent of water bodies in the cloud-contaminated images can be filled. Theoretically, this method can be applied to wetland depression areas exceeding 0.0144 km2.
The corrected JRC water occurrence map is utilized to reconstruct above-water topography. This is because the water occurrence values within the same wetland depression correspond to elevation values of SRTM DEM (Fig. 5b and c). However, each corrected water occurrence value may correspond to multiple elevation values in the global DEMs. Therefore, the median of multiple elevation values is used as the unique elevation value corresponding to the water occurrence value.
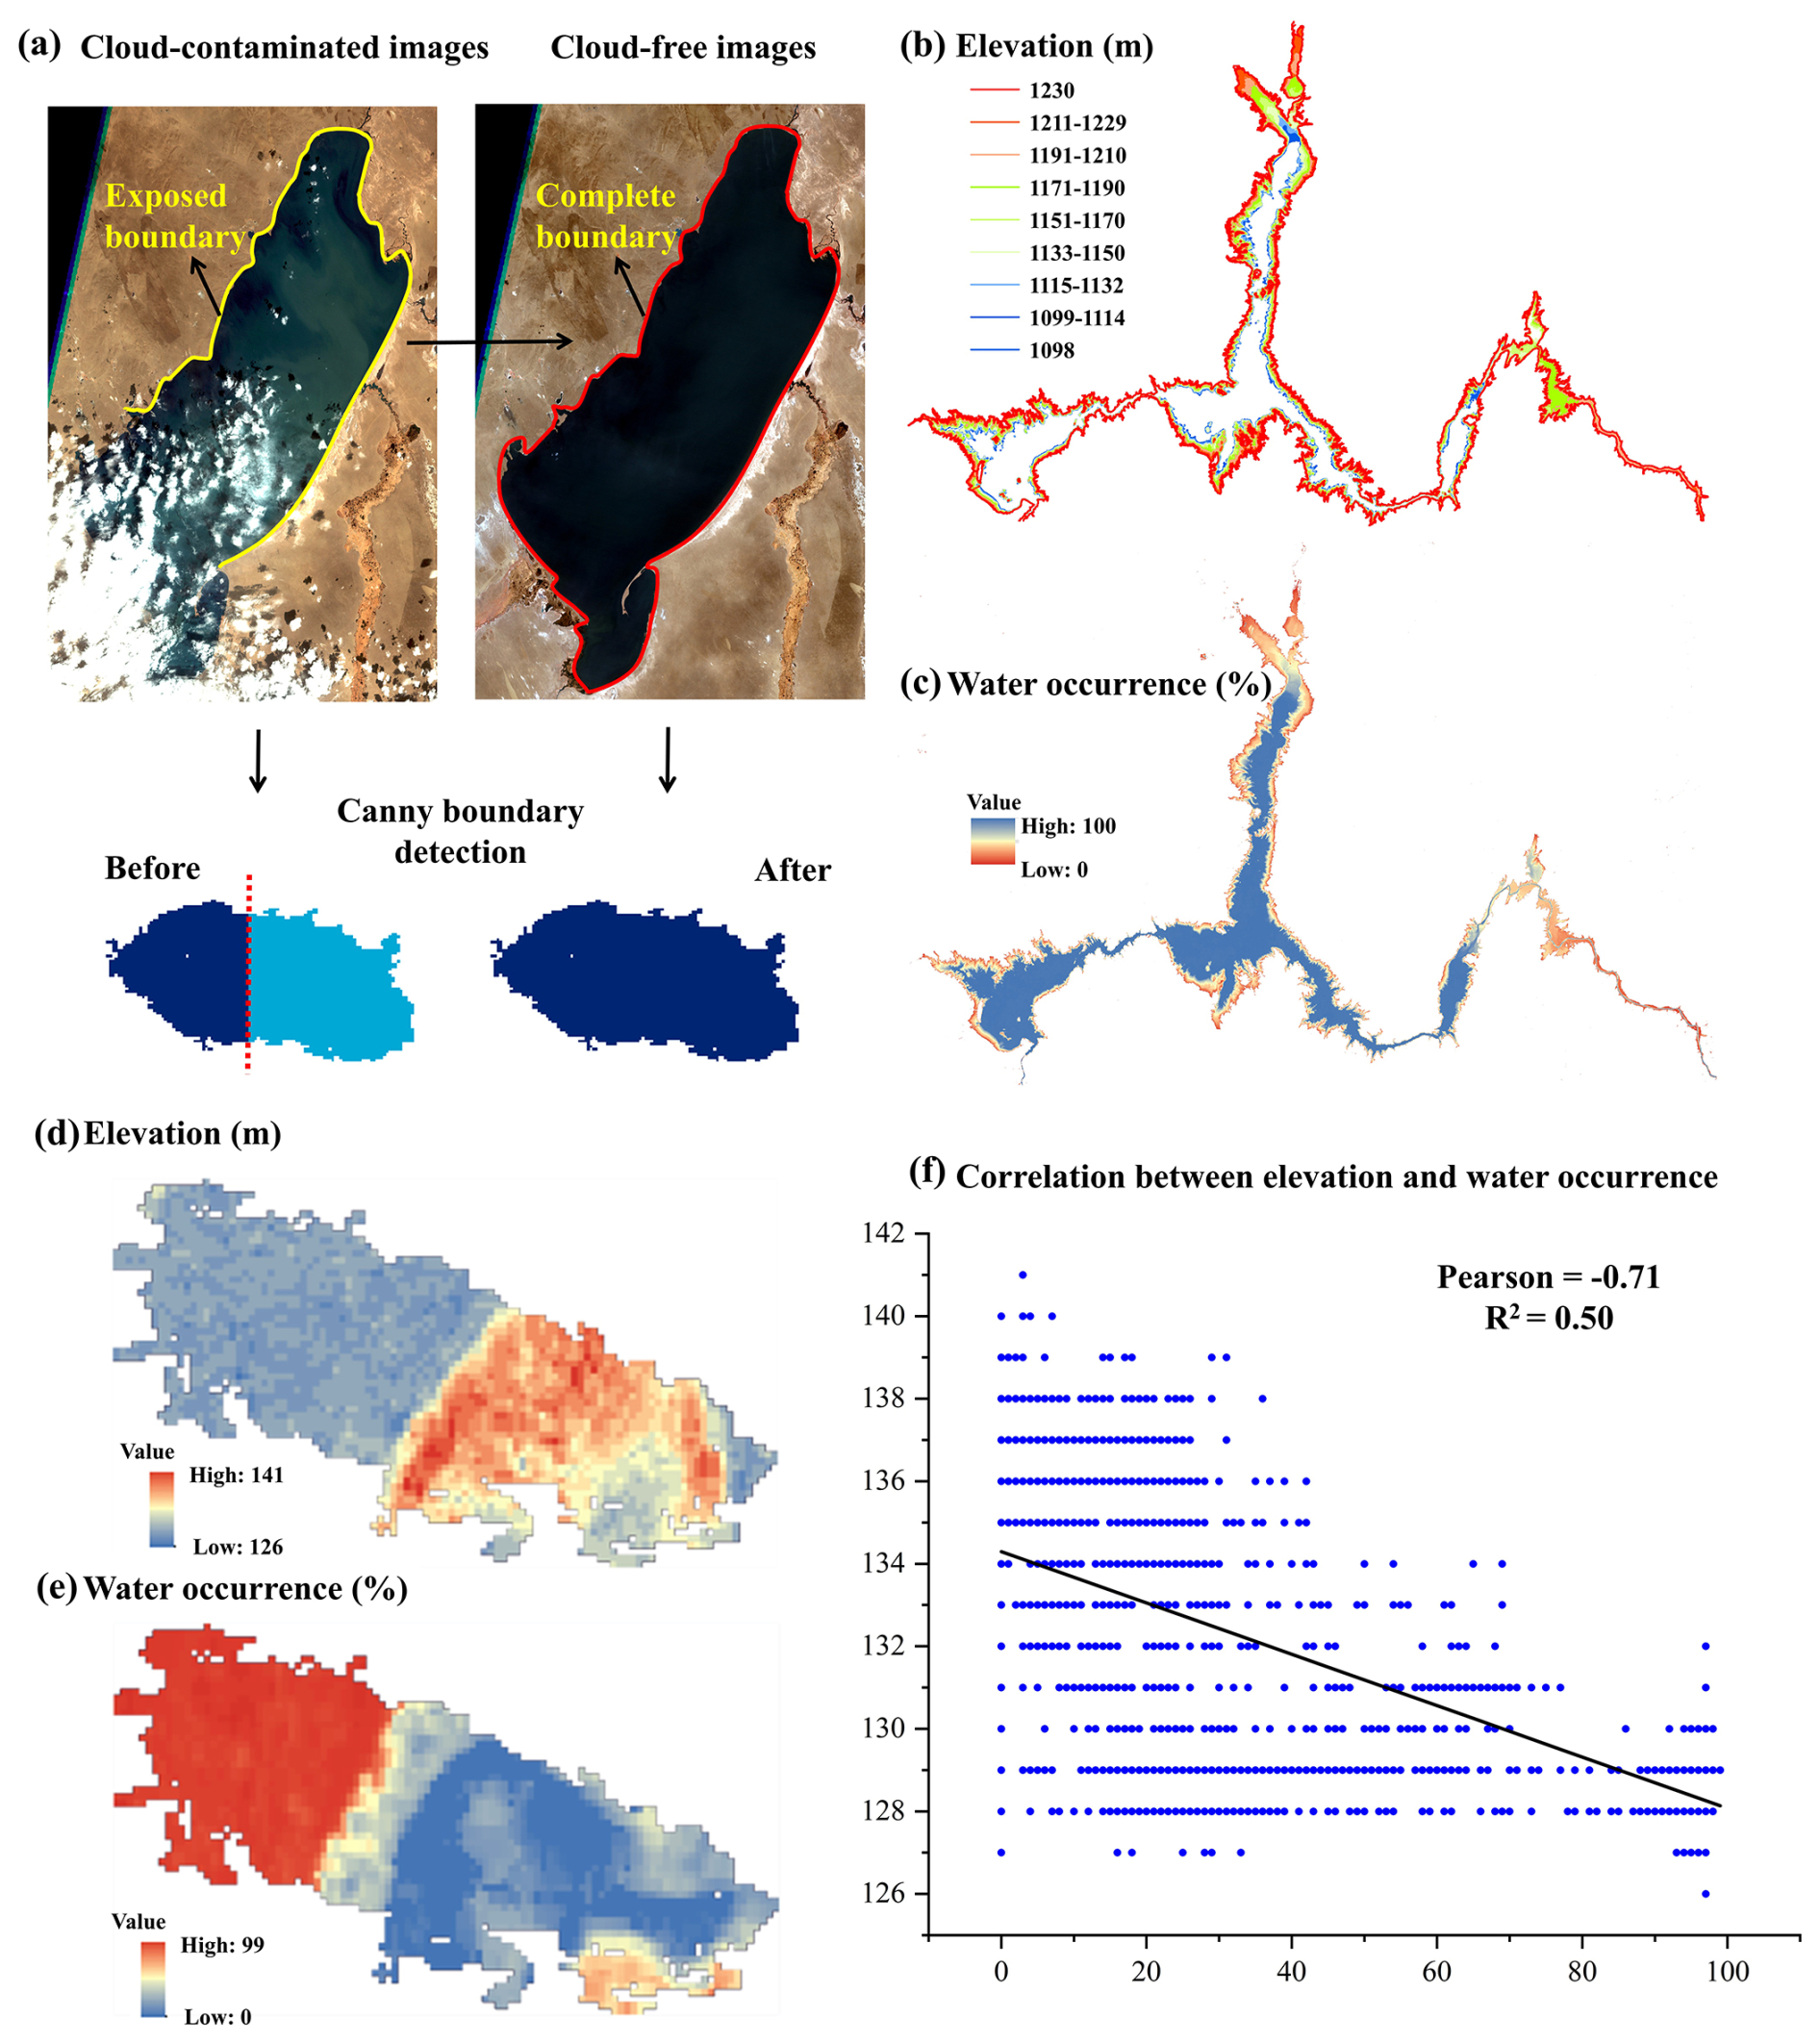
Figure 5Above-water topography reconstruction of wetland depression areas. (a) Restoration method of cloud-contaminated satellite images. (b) Lidar DEM and (c) JRC water occurrence map of Lake Mead in the United States. (d) SRTM DEM and (e) JRC water occurrence map of a representative wetland depression area located in the Nenjiang river basin. (f) Correlation between elevations and water occurrences in the wetland depression area.
2.3 Bathymetric information estimation
Using remote sensing technologies, simultaneous observations of water areas provided by optical images (e.g., Global Surface Water datasets) and the corresponding water levels from altimetry satellites (e.g., Sentinel-3) are employed to obtain underwater area–level pairs (Fig. 6). Furthermore, based on the principle of spatial prediction and modeling methods, the continuity of the slope profile between the above-water and underwater topography is used as a filtering criterion to refine the underwater area–level pairs, enabling precise characterization of the underwater topography of wetland depressions.
Multi-source altimetry satellites are matched with optical images to construct all area–level pairs for wetland depressions. By identifying water surface distributions in global DEMs, the area–level pairs that represent underwater hypsometric relationships within wetland depressions are filtered. Since altimetry satellite data are subject to various factors that influence the accuracy of water level monitoring, including intrinsic factors such as sensor performance and instrument resolution, as well as extrinsic factors like natural elements, the geometry of the wetland water body, boundary conditions, and vegetation characteristics (Zhou et al., 2023), some of the derived water level data exhibit substantial variability and uncertainty and are regarded as outliers. The 3σ rule is used to identify outliers in the underwater area–level pairs, defining an area–level pair as an outlier if its least squares residual exceeds three times the standard deviation. Moreover, DEM errors can be categorized into two types: systematic and random errors. To mitigate data noise, it is common practice to smooth the DEM before applying it for terrain analysis. Several filters commonly used for smoothing DEMs include median and mean filters, Gaussian filters, adaptive filters, and K-nearest mean filters (Lindsay, 2016). In this study, we use the smoothed SRTM DEM derived from the Gaussian filter to calculate the slope profile. As the slope profile is a crucial indicator reflecting the hypsometric relationship of wetland depressions (Clark and Shook, 2022; Sjöberg et al., 2022), we first form various combinations of the processed underwater area–level pairs (each water area value uniquely corresponds to a water level value in each combination), and calculate the slope profile value pu for each combination. Then the combination with pu closest to the above-water slope profile pa is taken as the optimal solution, which can effectively represent the underwater bathymetry of wetland depressions.
In this study, a logarithmic transformation is applied to the calculation formula for the slope profile p of wetland depressions established by Hayashi and van der Kamp (2000) to obtain
where h (m) and A (m2) represent the depth and area of wetland depressions, respectively, and w and d represent the different area–depth pairs. The least squares method is used to solve Eq. (3) to obtain the slope profile p value of wetland depressions.
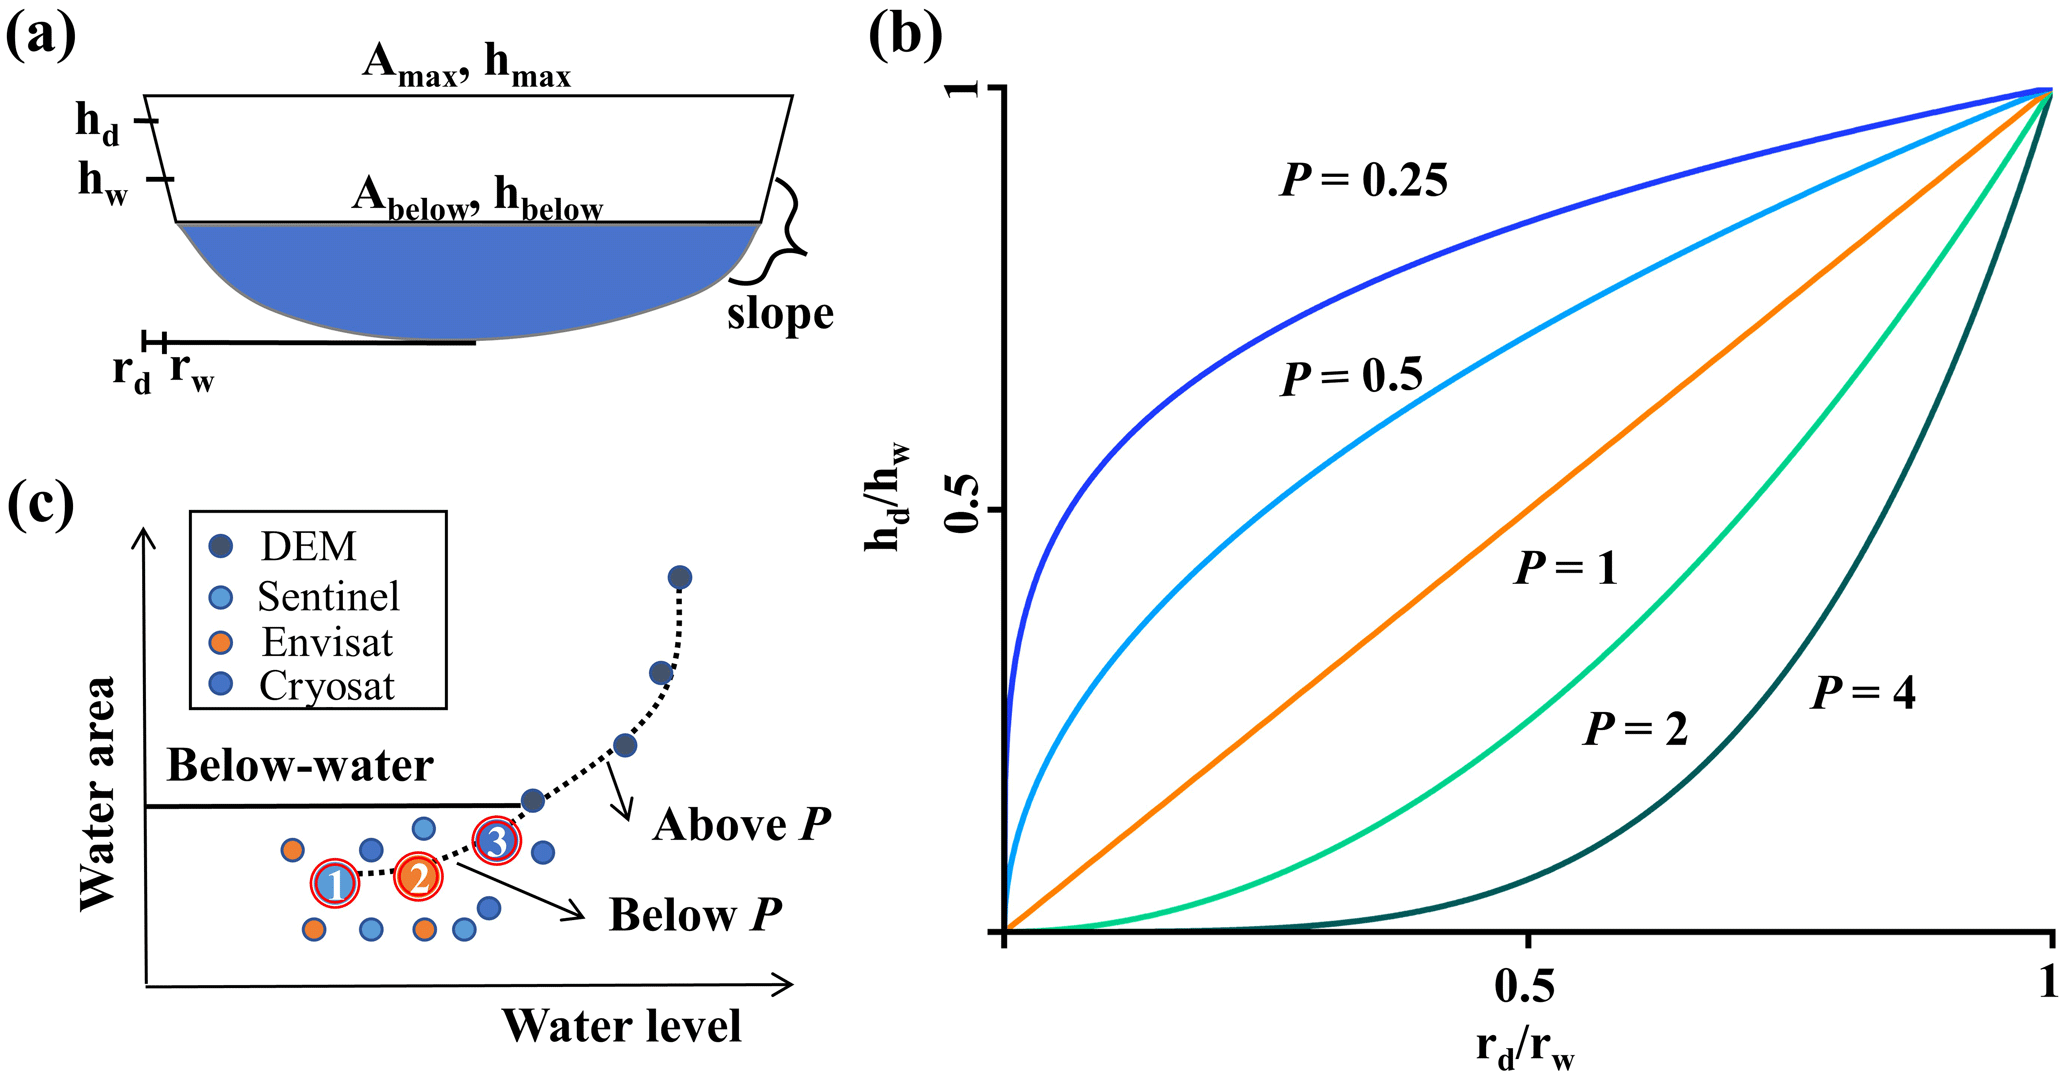
Figure 6Estimation of bathymetric information for wetland depression areas. (a) Schematic representation of a simplified wetland depression profile, where h (m), r (m), and A (m2) represent the depth of a wetland depression area, the distance between the edge and the center of the wetland depression, and the area of the wetland depression, respectively. (b) Wetland depression profile for various p values. (c) Methods for bathymetric estimation of wetland depressions, where Sentinel, Envisat, and CryoSat are different altimetry satellites, and the numbers 1, 2, and 3 are selected depth–area pairs.
2.4 Estimation of wetland depression water storage capacity
We derived the hypsometric relationship from the corrected above-water area–level pairs and estimated underwater area–level pairs of wetland depressions. The monotonic cubic spline and power function are employed to fit the hypsometric relationships (i.e., depth–area relations) to derive the above-water hypsometric curve fA(L) and the underwater hypsometric curve fB(L) (Messager et al., 2016; Yao et al., 2018), respectively (Fig. 7). Subsequently, based on the underwater hypsometric curve fB(L), the area enclosed by the water level from 0 to the maximum value and fB(L) is defined as the underwater storage capacity of the wetland depression. Similarly, based on the above-water hypsometric curve fA(L), the area enclosed by the water level from the minimum value (corresponding to the maximum value of fB(L)) to the maximum value (the elevation of the spilling point) and fB(L) is defined as the above-water storage capacity of the wetland depression. The total wetland depression water storage capacity is then obtained as the sum of both components (V):
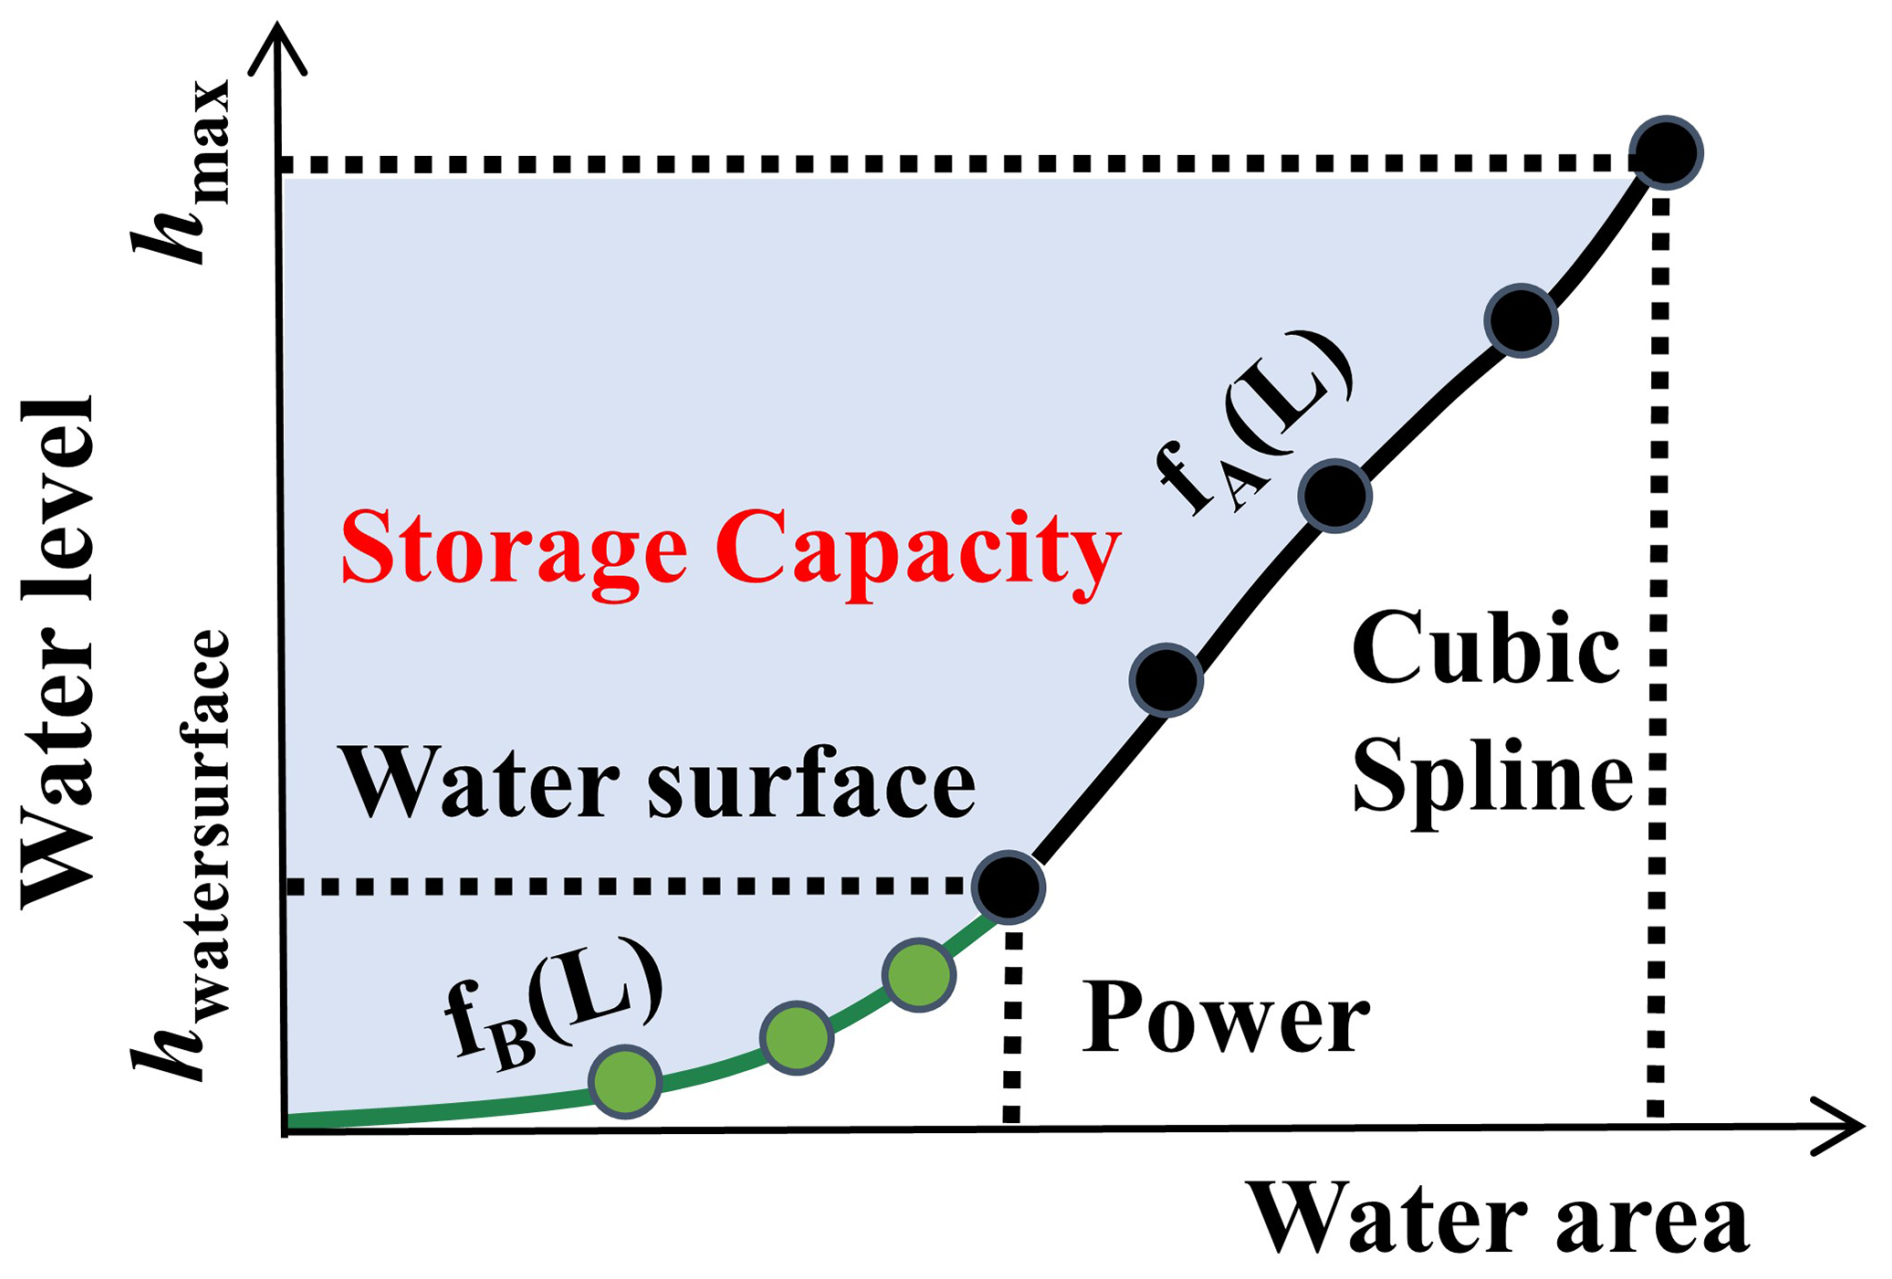
Figure 7Schematic diagram for the estimation of wetland depression water storage capacity. Two depth–area rating curves are applied, for the bathymetric volume and the above-water topographic volume.
3.1 Validation sites
We applied the WetlandSCB to two wetlands in the Nenjiang river basin (NRB), northeast China, to validate the framework. Draining a total area of 297 100 km2, the NRB is one of the largest river basins in north China. In this river basin, agricultural lands and wetlands (lakes and swamps) are prevalent (Wu et al., 2023). Recognized as critical regulators of the water balance within the NRB, wetlands are considered more important than other ecosystems in mitigating future hydrologic extremes and increasing water availability for agriculture (Chen et al., 2020; Wu et al., 2020a, b; 2022). For method validation and application of the WetlandSCB framework, we focused on two national nature reserves within the NRB: Baihe Lake and Chagan Lake. Baihe Lake, characterized as a marsh wetland, covers approximately 40 km2, predominantly comprising seasonal inundation zones, with an average water depth of less than 1 m. In contrast, Chagan Lake is a large lacustrine wetland of about 372 km2, mainly composed of perennial inundation zones, with an average water depth of 2.5 m. These two validation wetlands represent different characteristics in terms of type, area, and average water depth to verify the application robustness of our developed framework. Field measurements of topographic and bathymetric information (elevation and depth) were conducted for both Baihe Lake and Chagan Lake, consisting of 248 and 657 measurement points, respectively (Fig. 8). Specifically, we combined an ultrasonic echo sounder (D390, Chcnav, China) with a Global Positioning System (GPS) device and applied the field measurements according to the sectional method. Crewed vessels were used in areas of greater water depth and uncrewed remotely operated vessels were used in areas of lower water depth, with the aid of water rulers and hammers.
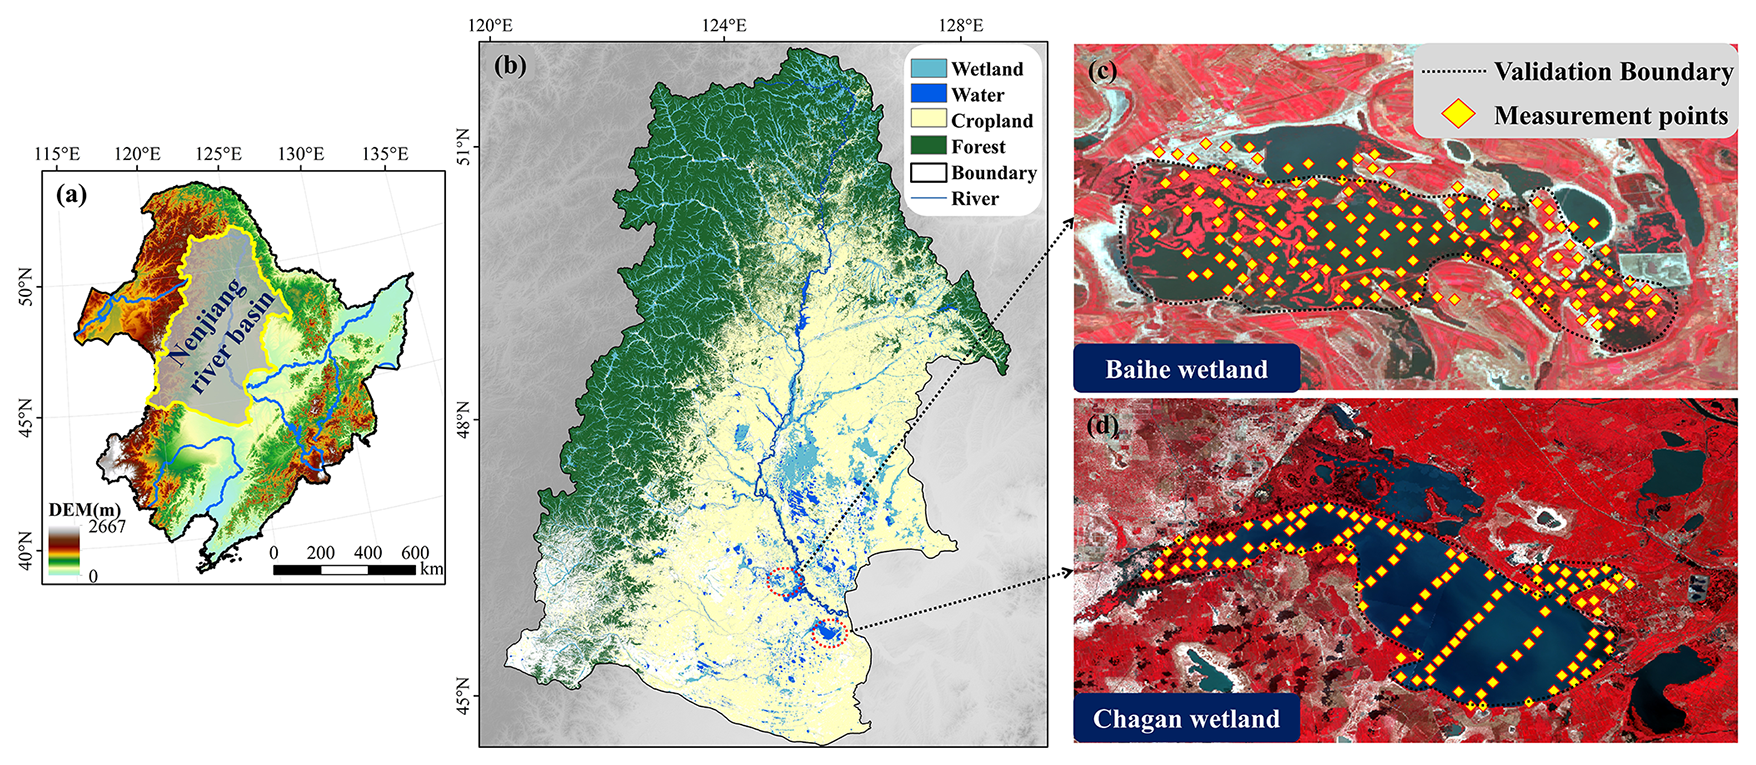
Figure 8Locations and distribution of elevation and depth measurements across Baihe Lake and Chagan Lake in the Nenjiang river basin, northeast China.
3.2 Datasets
The application of the WetlandSCB framework requires the following data: (i) the global DEMs sourced from SRTM DEM, with water distribution map sourced from the accompanying SRTM Water Body Data (https://earthexplorer.usgs.gov, last access: 10 February 2023, Farr and Kobrick, 2000; NASA, 2013); (ii) wetland maps extracted from the 30 m resolution land cover data for the years 1990–2019 (https://zenodo.org/records/5816591, last access: 2 August 2022, Yang and Huang, 2021), and the 30 m resolution wetland map in 2015 (http://northeast.geodata.cn/index.html, last access: 3 August 2022, Mao et al., 2020) (this study overlays the data from both sources to reduce the uncertainties in the wetland maps); (iii) water distribution maps and water occurrence maps obtained from the Global Surface Water datasets (https://earthengine.google.com, last access: 23 April 2023, Pekel et al., 2016); and (iv) altimetry satellite data sourced from the Sentinel-3A/3B products (https://scihub.copernicus.eu/, last access: 5 September 2023). In addition, pre-processing of Sentinel-3 altimetry data is performed using the geophysical and atmospheric correction method developed by Huang et al. (2019) to improve data accuracy:
where Hwaterlevel is the water level referenced to the EGM96 geoid, Halt is the altitude of the altimeter derived from modeling the satellite trajectory, R is the range computed through the time duration of the echoes, and Cor refers to the geophysical and environmental corrections:
where Cdry, Cwet, Ciono, CsolidEarth, Cpole, and CEGM96 are the dry tropospheric, wet tropospheric, ionospheric, solid Earth tide, polar tide, and EGM96 geoid corrections, respectively.
4.1 Performance evaluation of wetland depression spatial delineation and uncertainty analysis
The actual topographic and bathymetric information obtained from field measurements, along with the contour-tree method, provides the actual spatial distribution of wetland depression areas. Additionally, two spatial distributions of wetland depression areas are derived: one using the SRTM DEM combined with the priority-flood algorithm and the other using the SRTM DEM with the WetlandSCB framework. A comparative analysis of these three approaches is conducted to assess the accuracy differences in wetland depression spatial delineation by using four indicators: overall accuracy, kappa coefficient, producer's accuracy, and user's accuracy (Fig. 9a–f). The confusion matrix, also known as an error matrix, is a crucial method for evaluating land cover classification accuracy. It intuitively reflects the classification relationship between the evaluated data and the reference data. Key evaluation metrics include the above four indicators. For detailed calculation equations, refer to Liu et al. (2007). The results indicate that the WetlandSCB framework can accurately determine the spatial distribution of wetland depressions, with all four indicators exceeding 0.95. In contrast, the user's accuracy is above 0.93 in both validation wetlands (error of commission is 0.07) and the producer's accuracy is only 0.37 (error of omission is 0.63) in Baihe Lake, based on the priority-flood algorithm. Since the overall accuracy of wetland depression spatial delineation derived using the priority-flood algorithm exceeds 0.6 for both validation wetland sites, with a peak accuracy of 0.97 for Chagan Lake, the results demonstrate that the algorithm is highly effective in identifying wetland depressions but is limited by the numerical errors of the global DEMs, which lead to lower extraction accuracy of the spatial distribution of wetland depressions (Zhou et al., 2016). Since the overall accuracy, kappa coefficient, and producer's accuracy of wetland depression spatial delineation obtained using the WetlandSCB framework show significant improvements over those derived from the priority-flood algorithm for both validation wetlands, and there is a slight increase in user's accuracy for Chagan Lake, the results effectively demonstrate that the WetlandSCB framework outperforms the priority-flood algorithm in wetland depression spatial delineation.
Uncertainty in wetland depression spatial delineation using the WetlandSCB framework primarily arises from morphological operators and prior information on a water distribution map. Figure 9g and h show that, compared with morphological operators, prior information on the water distribution map can significantly alter the performance of wetland depression spatial delineation and is a key factor in determining the level of uncertainty. For instance, in Baihe Lake, the overall accuracy and kappa coefficient improved by 0.29 and 0.56, respectively, after processing with prior information on the water distribution map. Similar studies have also found that the type and reliability of prior information are major factors affecting the spatial filling performance of surface water maps (Aires et al., 2017; Pulvirenti et al., 2011b). Therefore, this study compared the wetland depression spatial delineation results based on three sets of prior information on water distribution: GLC-FCS30 (from Zhang et al., 2021), CLCD (from Yang and Huang, 2021), and JRC (Fig. 9i and j), where GLC-FCS30 and CLCD are 30 m resolution land cover datasets and JRC provides 30 m resolution water surface data. The overall accuracy differences for Baihe Lake and Chagan Lake ranged from 0.68 to 0.98 and from 0.93 to 0.99, respectively. In general, the accuracy levels of prior information from high to low were JRC > GLC-FCS30 > CLCD. This suggests that selecting highly reliable prior information on a water distribution map is an essential way to reduce uncertainty in the WetlandSCB framework.
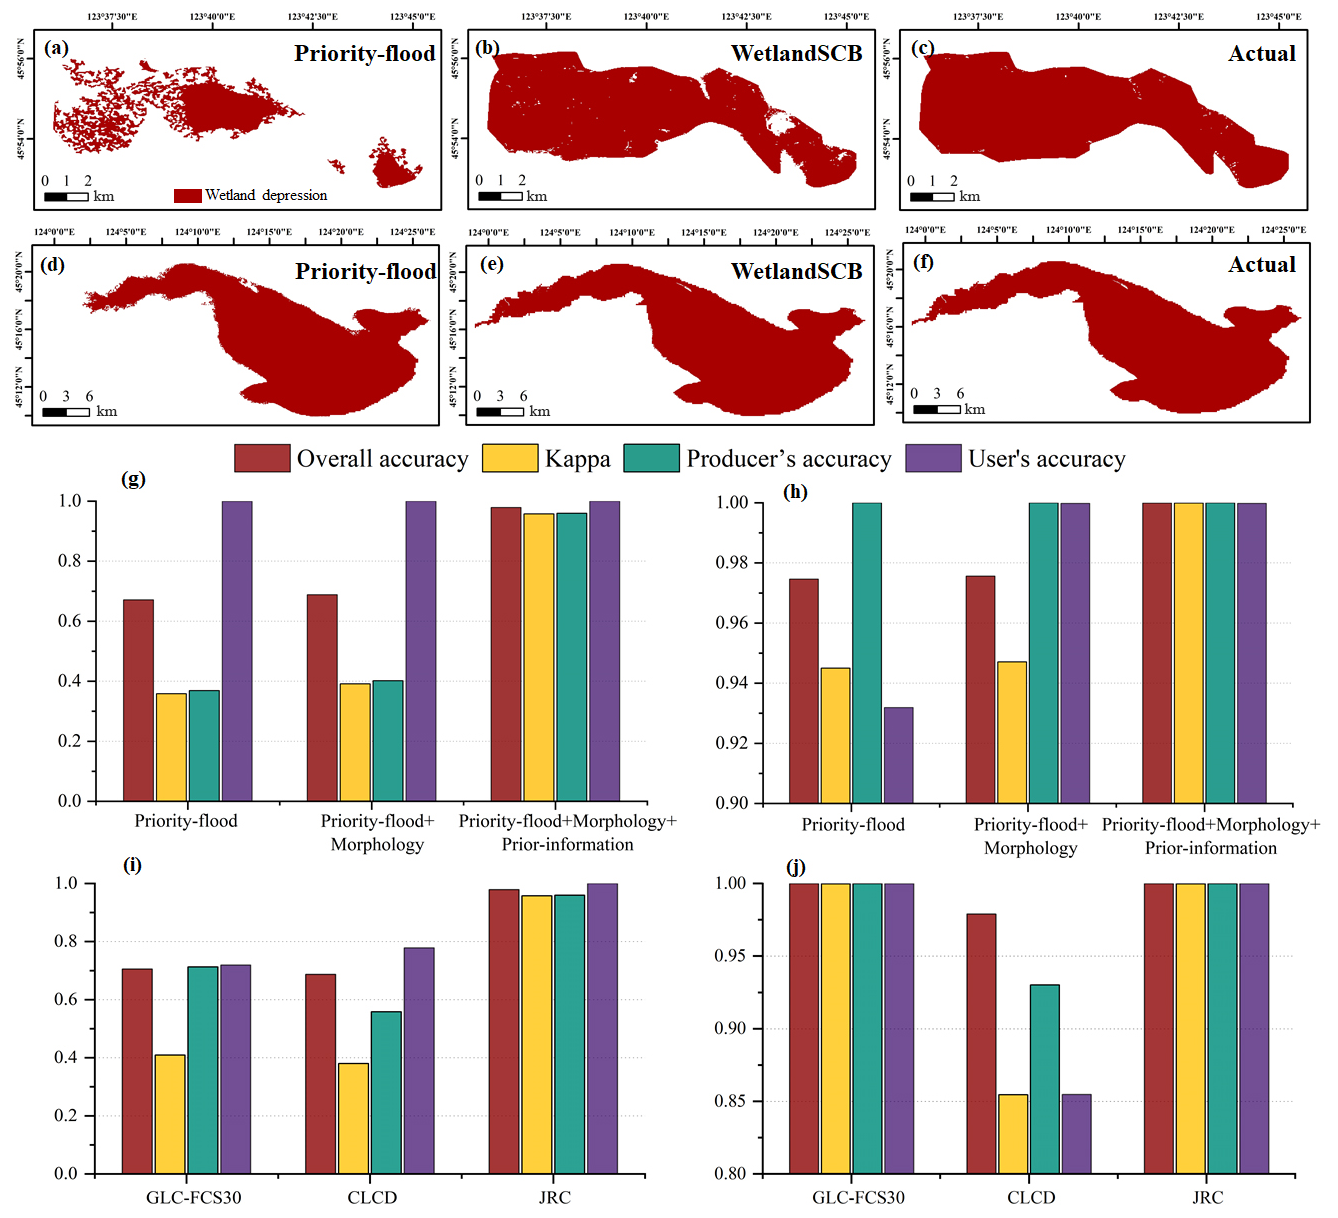
Figure 9(a–c) Spatial distribution of wetland depression areas in the Baihe Lake based on (a) priority-flood algorithm, (b) WetlandSCB framework, and (c) field measurements (the actual wetland depression map was derived from field measurements using the contour-tree method). (d–f) Corresponding results for Chagan Lake. (g, h) Impact of morphological operators and prior information on water distribution map from the WetlandSCB framework. (i, j) Influence of different prior information on water distribution map from the WetlandSCB framework.
4.2 Performance evaluation of above-water topography correction and uncertainty analysis
The consistency between the original and corrected above-water topography and the actual above-water topography obtained from field measurements can be evaluated using Pearson correlation coefficients and R2. The results indicate that the consistency between the original (the elevation information directly obtained from the SRTM DEM as the original above-water topography) and actual above-water topography is remarkably low, with R2<0.2 for both validation wetlands. Previous studies have also observed significant numerical discrepancies between the original and actual above-water topography in some regions (e.g., Mukul et al., 2017; Uuemaa et al., 2020). Compared with the original results, the consistency between the corrected and actual above-water topography significantly improves (Fig. 10). For example, the Pearson correlation coefficient and R2 reach 0.74 and 0.55 in Baihe Lake, respectively, demonstrating that the WetlandSCB framework can effectively correct numerical biases in above-water topography.
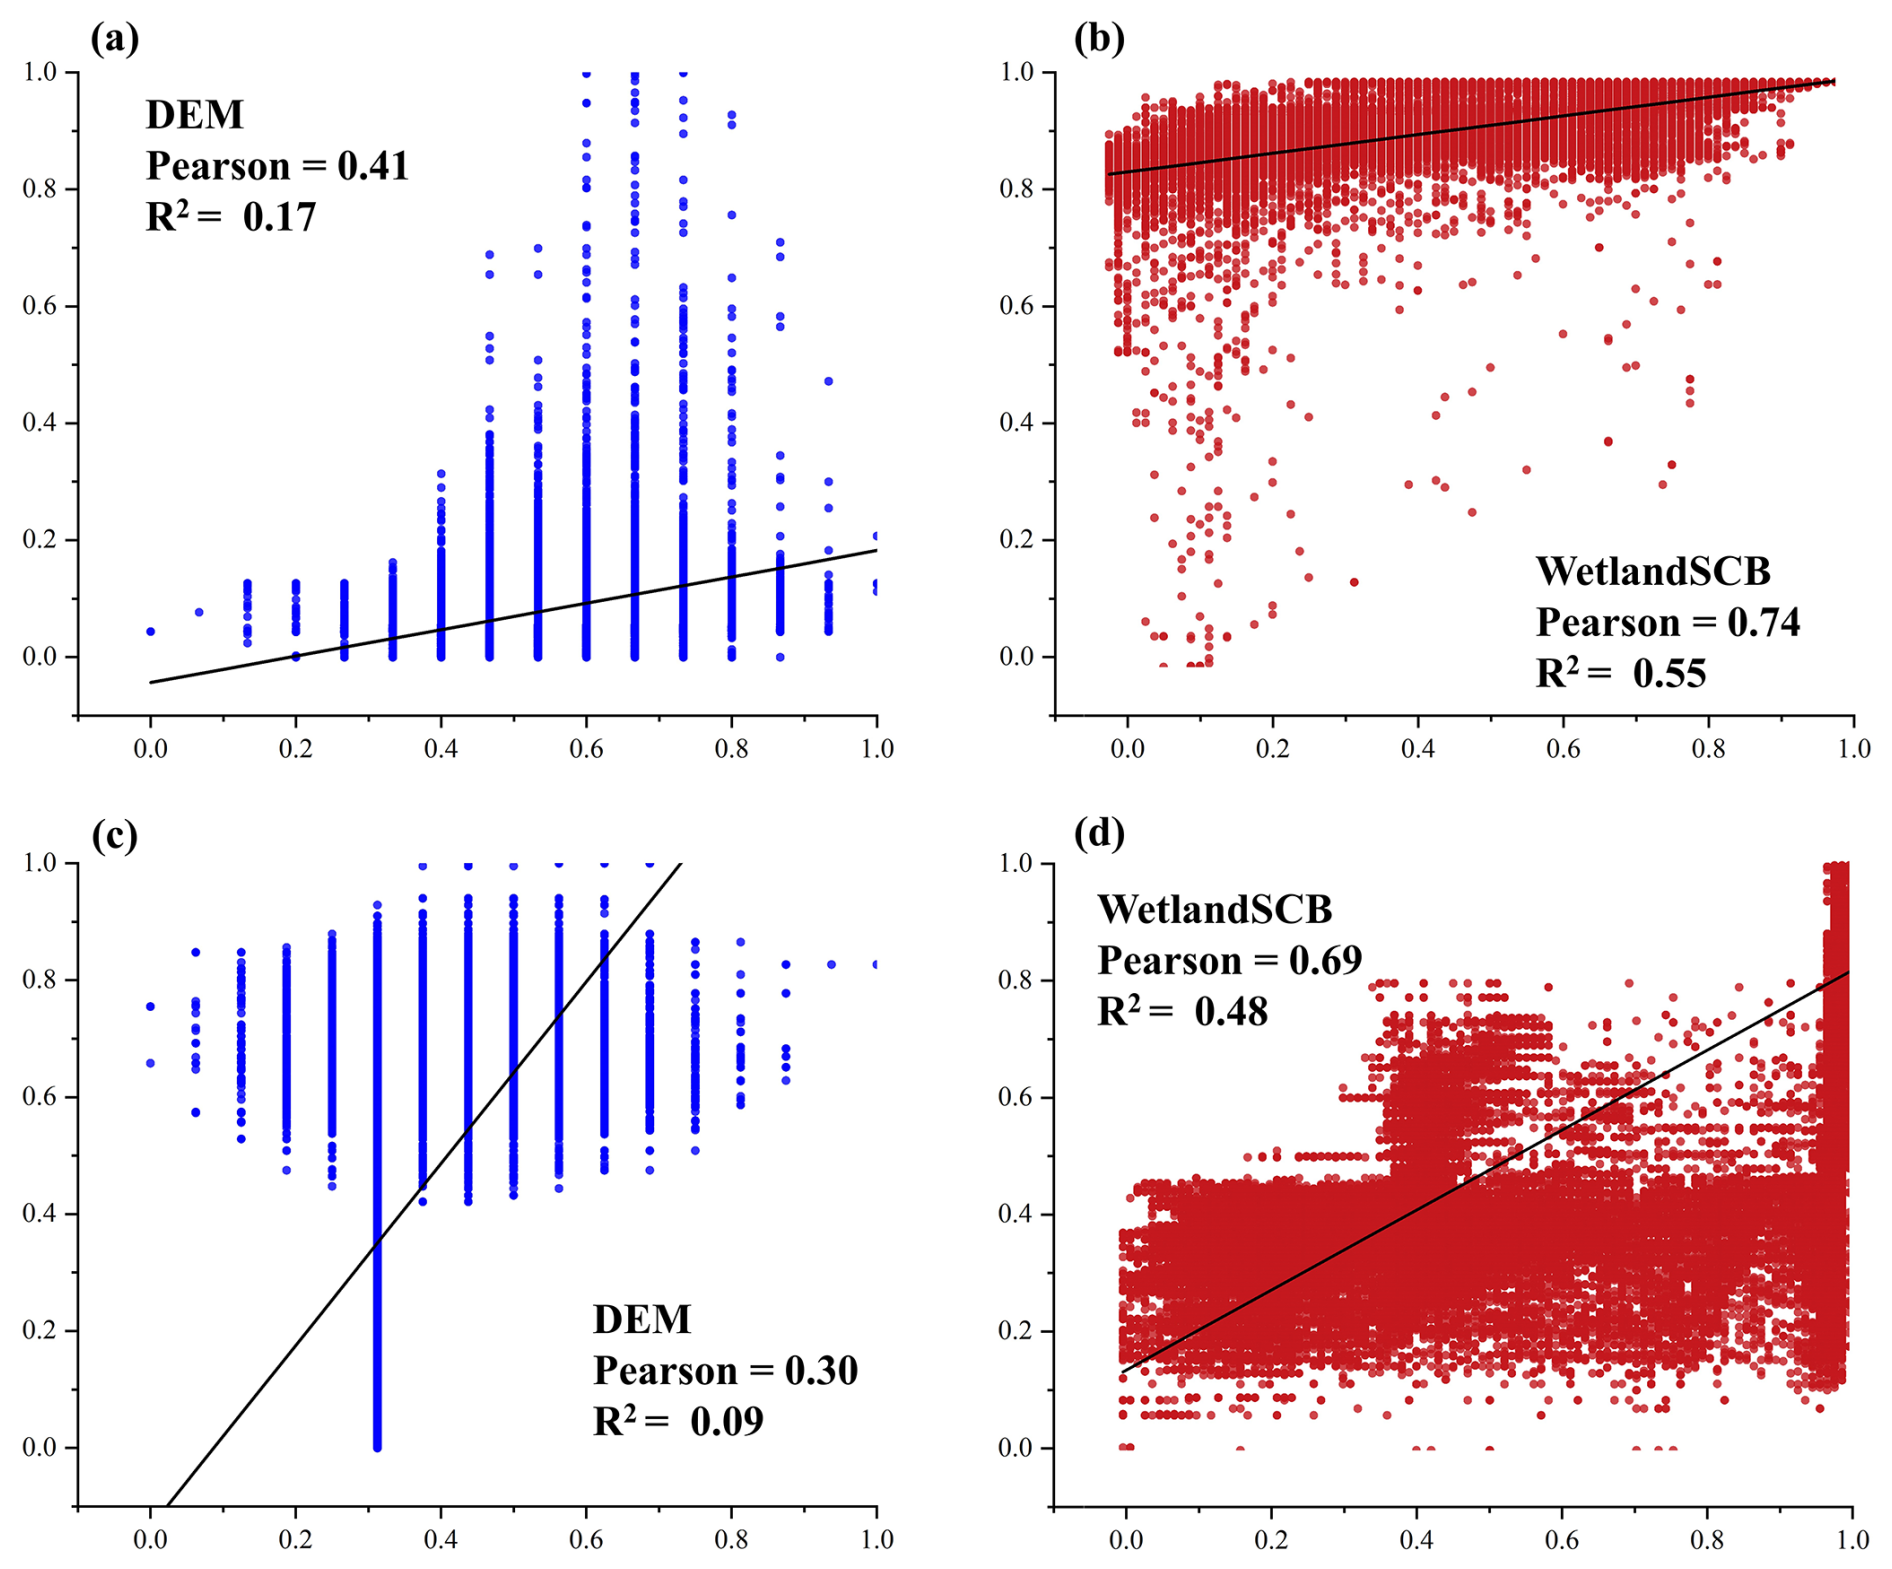
Figure 10(a, b) Consistency analysis results between original and corrected above-water topography for Baihe Lake. (c, d) Corresponding results for Chagan Lake. Elevation values are mapped to [0, 1] based on extreme value normalization.
Uncertainty in correcting above-water topography using the WetlandSCB framework depends primarily on the accuracy of the water occurrence map. Therefore, due to the negative relationship between water occurrence values and elevations in wetland depressions, this study compared the correlation differences between two sets of global-scale water occurrence maps, namely GLAD and JRC, and the actual above-water topography of two wetland depressions. The results show that the correlation level of GLAD is superior to JRC in Baihe Lake, while the opposite is observed in Chagan Lake. Additionally, the R2 values for both sets of water occurrence maps are less than 0.4 (Fig. 11c–f), and are significantly lower than the accuracy level of the corrected above-water topography. This clearly shows the superiority of the water occurrence map generated by the WetlandSCB framework over the GLAD or original JRC map.
It is to be noted that the water occurrence map generated by the WetlandSCB framework still has a certain level of uncertainty. First, the extraction of complete and accurate water spatial distribution from cloud-free images is constrained by such factors as the classification algorithm (Fig. 11a) (Pekel et al., 2016), but some correction algorithms have been proposed to enhance raw water distribution images (Zhao and Gao, 2018). Second, there is currently a lack of high-precision, temporally and spatially continuous, water distribution maps (Fig. 11b). Future efforts could include the use of image fusion methods, such as the Spatial and Temporal Adaptive Reflectance Fusion Mode, to fuse data from multi-source remote sensing products such as Sentinel-2, MODIS, and Landsat, which can effectively enhance the accuracy of the water occurrence map (He et al., 2019; Wang et al., 2016).
4.3 Performance evaluation of bathymetric information estimation
The slope profile p is used to describe the bathymetry of wetland depression areas. The calculated p values for Baihe Lake and Chagan Lake using the WetlandSCB framework are 7.45 and 4.08, respectively (Fig. 12). The actual bathymetric information obtained from field measurements is used to construct area–depth pairs. Subsequently, the actual slope profile p of the wetland depression is calculated based on the calculation formula established by Hayashi and van der Kamp (2000). The relative errors with respect to the actual p values obtained from field measurements are both less than 3 %, demonstrating the high accuracy of the framework in estimating underwater bathymetry.
To further prove the superiority of the WetlandSCB framework in estimating bathymetry, this study employed spatial prediction and modeling methods, which assume that the underwater slope profile is fundamentally similar to the above-water slope profile in wetland depressions, resulting in p values of 8.65 for Baihe Lake and 4.78 for Chagan Lake. The relative errors with respect to the actual p values are both greater than 18 %, indicating that this method may lead to substantial errors in some regions, as also reported by Papa et al. (2013) and Vanthof and Kelly. (2019). Furthermore, previous studies have often applied smoothing methods to the global DEMs to enhance the accuracy of topographic characterization in wetland depressions (e.g., Jones et al., 2018; Wu et al., 2019). In this regard, we further used the Gaussian-smoothed global DEMs and the spatial prediction and modeling methods to calculate p for Baihe Lake and Chagan Lake. The resulting values were 8.51 and 4.37, with relative errors of 17.63 % and 7.9 %, respectively. This underscores that smoothing methods do indeed contribute to improving the accuracy of topographic information in wetland depressions. Notably, the relative error for Chagan Lake is significantly lower than that for Baihe Lake, as is consistent with the findings of Liu and Song (2022), who reported that the spatial prediction and modeling methods are suitable for wetlands with long and narrow shapes. In summary, the comparative analysis reveals that the WetlandSCB framework demonstrates superior performance in bathymetric estimation for wetland depression areas. For Baihe Lake, the slope profile p derived from the WetlandSCB framework (7.45) exhibits closer agreement with the actual measured value (7.29) than those obtained from the spatial prediction and modeling method (8.65) and its enhanced version incorporating the smoothed SRTM DEM (8.51). Similarly, for Chagan Lake, the WetlandSCB framework yields a slope profile p (4.08) that more accurately approximates the actual value (4.05) compared with both the conventional spatial prediction and modeling method (4.78) and its enhanced version (4.37). These comparative results demonstrate the improved accuracy and reliability of the WetlandSCB framework in bathymetric characterization of wetland depression areas relative to the other methods.
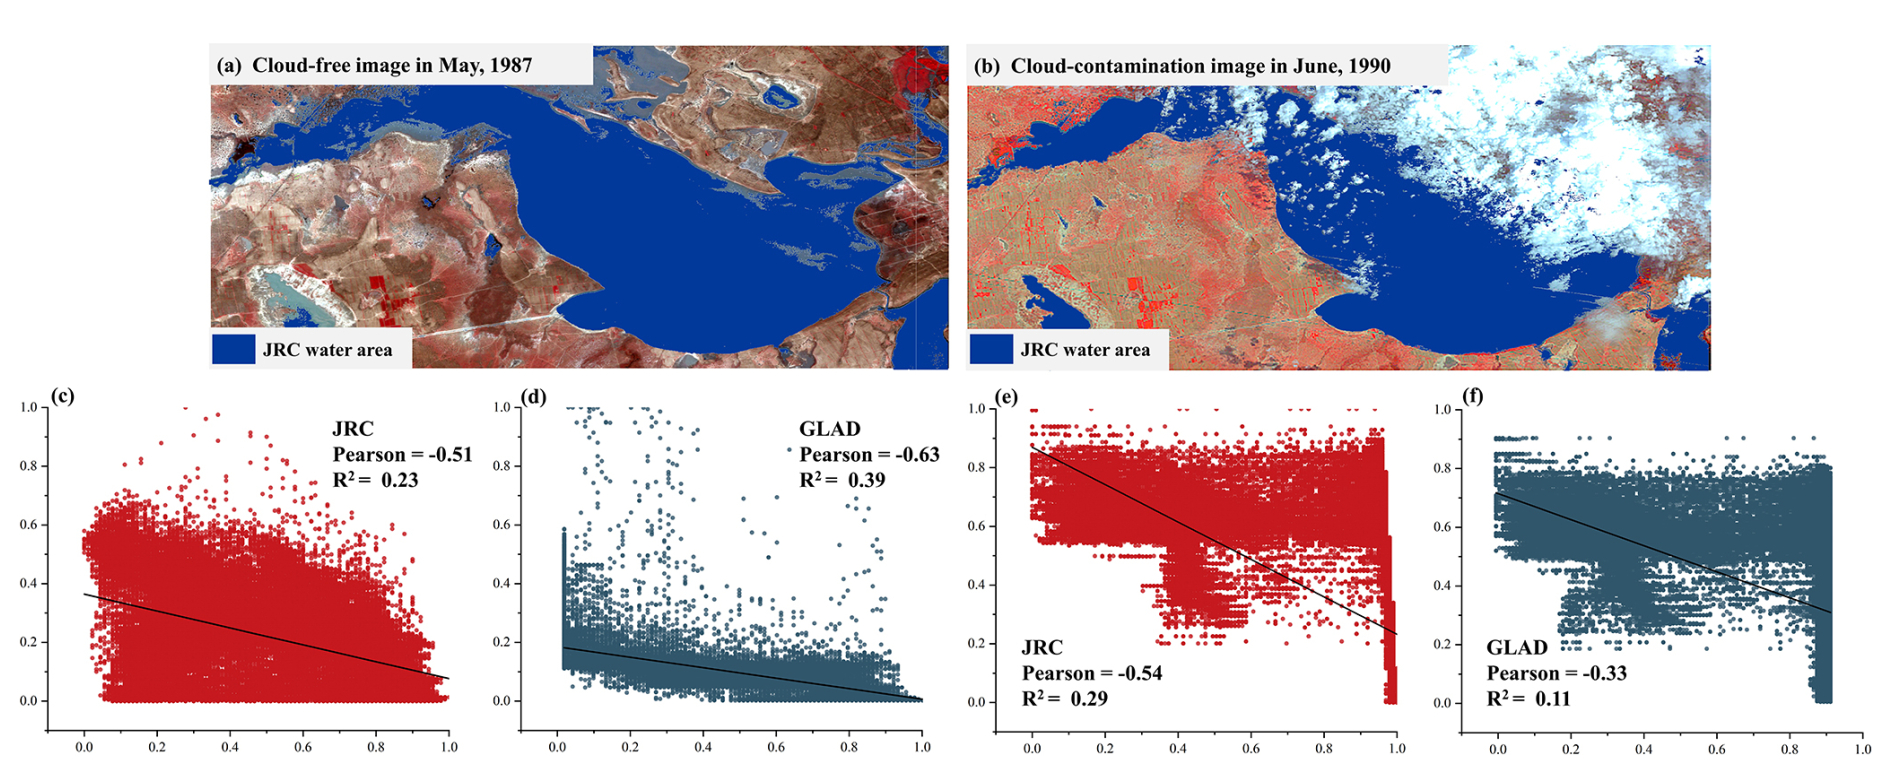
Figure 11(a, b) Sources of uncertainty in water occurrence map generated by the WetlandSCB framework. (c–f) Difference between two water occurrence maps on the performance of above-water topography correction in Baihe Lake and Chagan Lake.
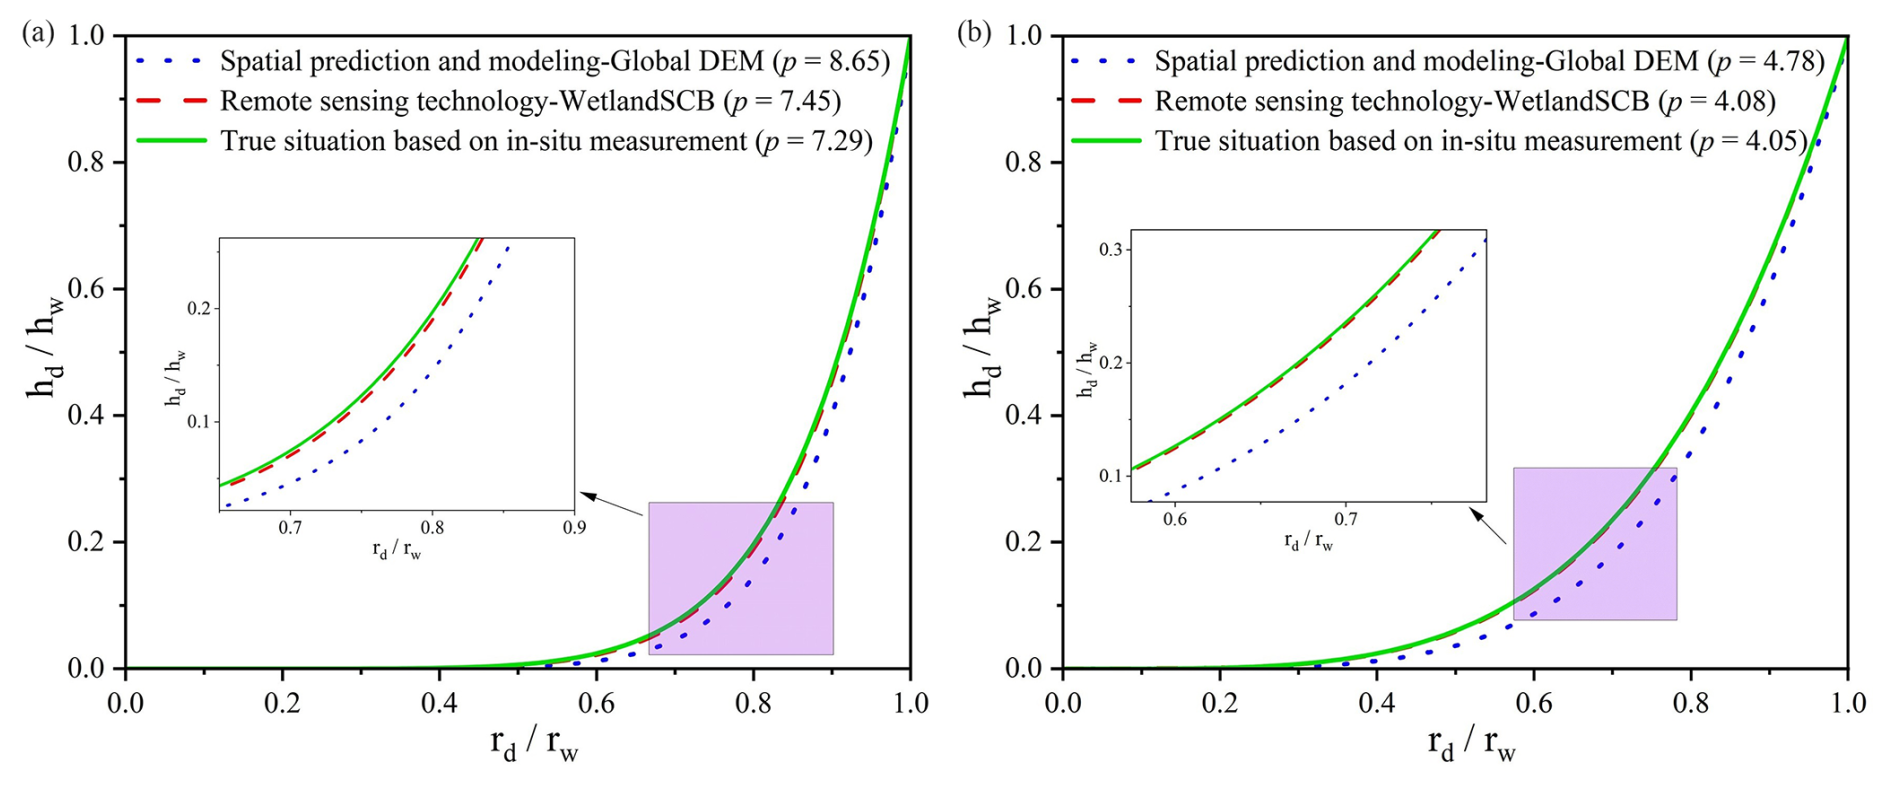
Figure 12Slope profile, p, of wetland depressions for (a) Baihe Lake and (b) Chagan Lake, calculated with spatial prediction and modeling methods, and the WetlandSCB framework in comparison with field measurements.
4.4 WetlandSCB framework application and implications for integrated water resources management
Wetland depressions are largely disregarded in many hydrologic modeling practices. Rare studies exist on how their exclusion can lead to potentially inaccurate model projections and understanding of hydrologic dynamics across the world's river basins (Rajib et al., 2020). This study applied a novel framework, delineating the topography and bathymetry of wetland depression areas and focusing on two distinctive wetlands to estimate WDWSC. Using field measurements of topography and bathymetry of Baihe Lake and Chagan Lake, depth–area hypsometric curves were constructed and the WDWSCs of Baihe Lake and Chagan Lake were estimated to be 61 and 526×106 m3, respectively (Fig. 13). The estimation results based on the WetlandSCB framework were, correspondingly, 55 and 521×106 m3. Furthermore, the use of elevation (to compute wetland depression depths) and areal extent has emerged as an efficient method to estimate surface water storage volume (Gao, 2015). After identifying wetland depressions, previous studies estimated the area and volume of each depression, based on a statistical analysis of the DEM cells comprising that wetland depression (Rajib et al., 2020; Wu et al., 2019; Wu and Lane, 2016). This study compared and analyzed the water storage capacities of Baihe Lake and Chagan Lake calculated using three medium-resolution 30 m DEM datasets: SRTM DEM, ALOS DEM, and MERIT DEM (Fig. 13c). The results show that the accuracy of WDWSC calculation is highly dependent on the DEM data quality, with the MERIT DEM providing the most accurate results, with relative errors averaging 25.7 % compared with the actual WDWSC. In contrast, the WDWSC calculation based on the WetlandSCB framework had relative errors of less than 10 %, which is a good level of accuracy in estimation precision (Moriasi et al., 2015), demonstrating that the WetlandSCB framework has the ability to accurately estimate WDWSC and can be applied to regions lacking field measurement data for global-scale wetland water storage capacity estimation.
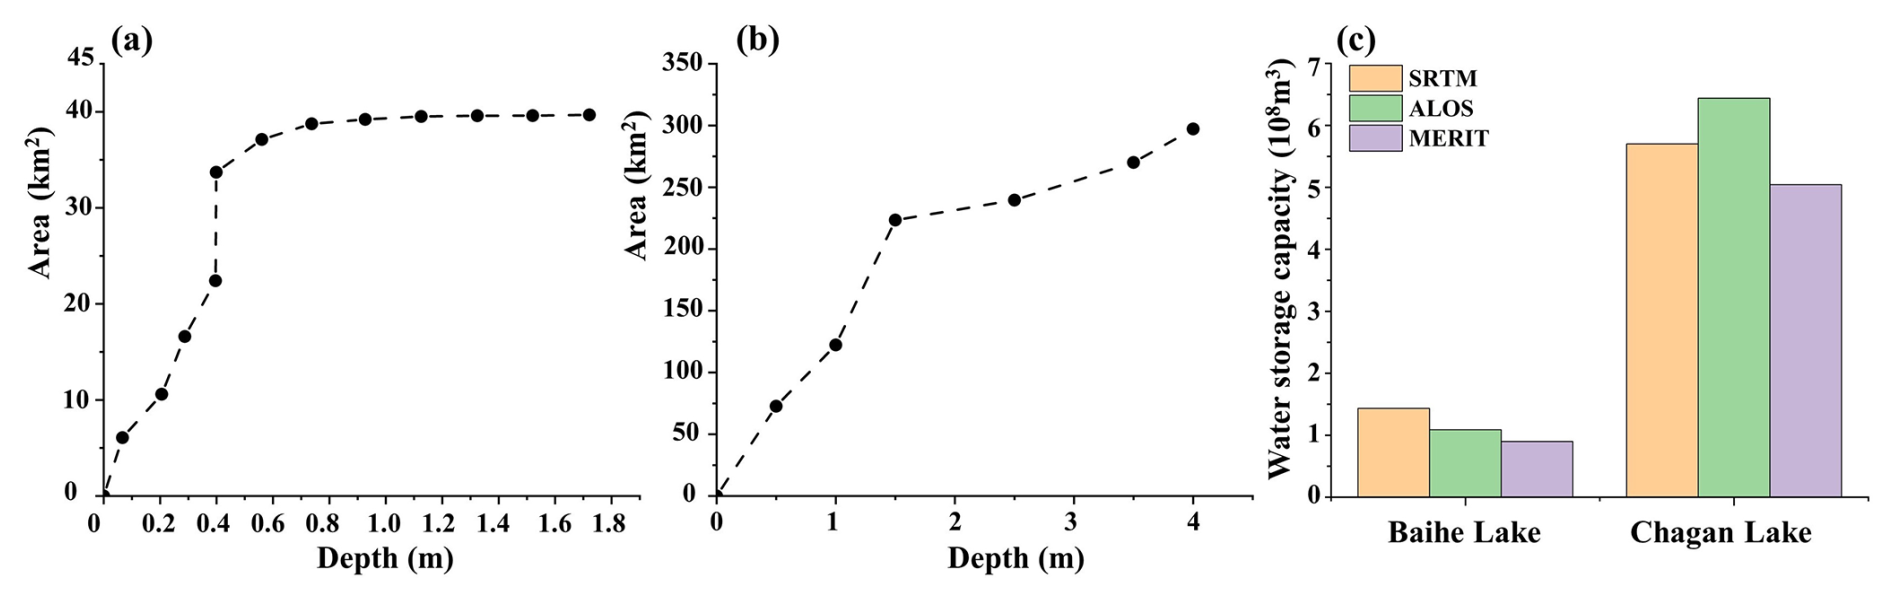
Figure 13(a, b) Dashed lines represent the actual hypsometric curve based on field measurements for (a) Baihe Lake and (b) Chagan Lake. (c) Calculation results of WDWSC based on three DEM datasets in validation wetland sites.
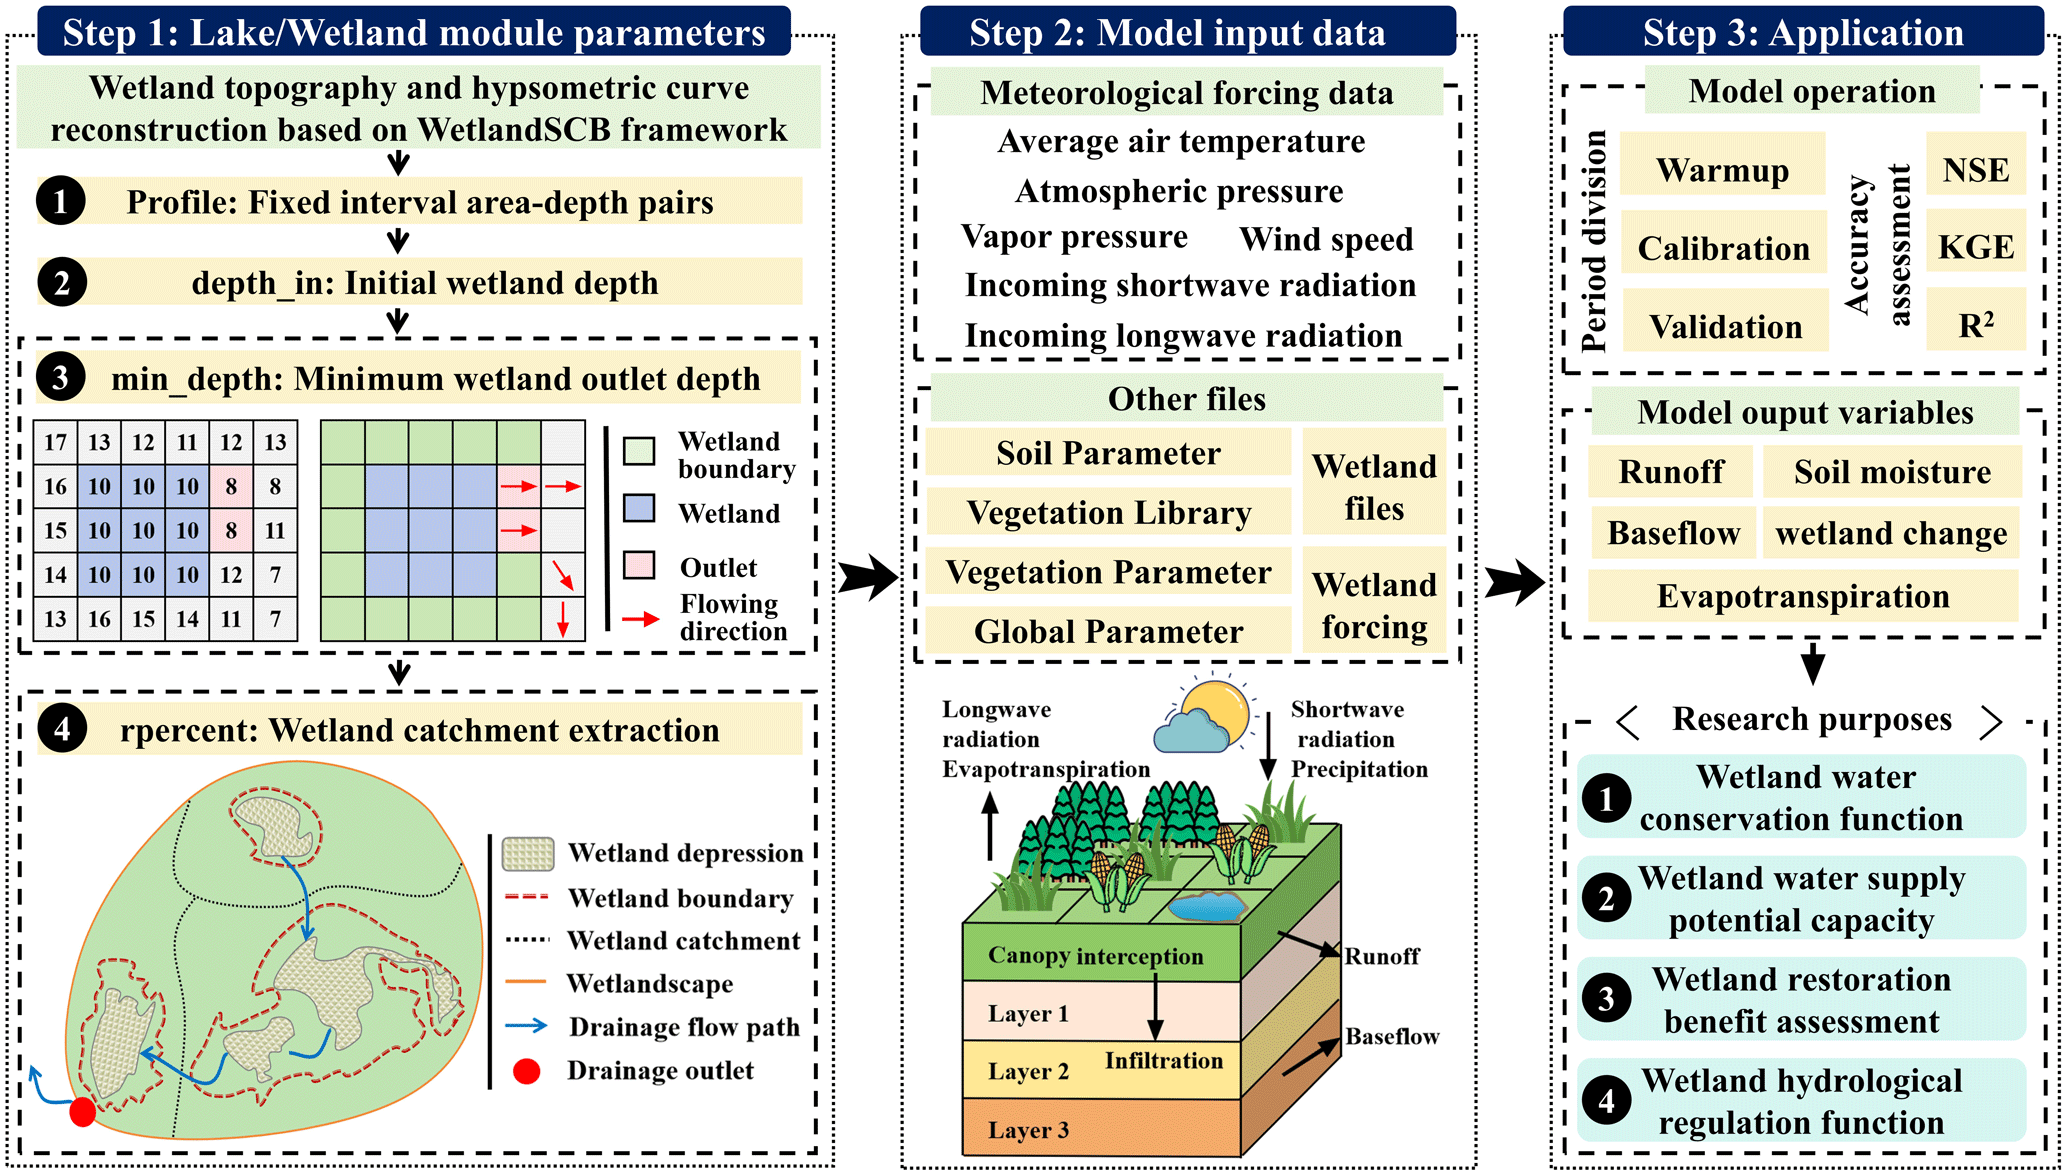
Figure 14Integration process and application outputs of WetlandSCB framework with variable infiltration capacity (VIC) hydrologic model.
Wetlands play a pivotal role in mitigating flood and drought risks, as well as addressing water scarcity challenges within a river basin. Previous studies underscore the significant impact of wetlands in attenuating future flood characteristics, including peak flows, mean flows, duration, and flow volume for various return period floods (Wu et al., 2023). Concurrently, wetlands contribute to enhancing baseflow during both summer and winter seasons in the NRB (Wu et al., 2020b). Given that the NRB is an agriculture-dominated river basin, wetlands serve as the main water supply nodes by collecting flash flooding and storing and purifying irrigation return flows. This reclaimed water can be efficiently reused for irrigation purposes in the NRB (Meng et al., 2019; Smiley and Allred, 2011; Zou et al., 2018a). The WDWSC is a key parameter for evaluating the flood control and water supply capacity of wetlands and is also an important prerequisite for understanding the impact of wetlands on extreme hydrologic events (Acreman and Holden, 2013). Therefore, the developed WetlandSCB framework, which can provide accurate estimation of the WDWSC, contributes to the management of food and water security in the NRB. Against the backdrop of global environmental change, characterized by an escalation in the intensity and frequency of extreme hydrologic events and the increasing disparity between water resource supply and demand, there is an urgent need for a novel integrated water resources management approach based on natural solutions (Rodell and Li, 2023; Thorslund et al., 2017; Yin et al., 2018). Wetlands have emerged as a nature-based solution in various water resources management practices (Ferreira et al., 2023). Taking advantage of the wetland hydrologic regulation functions is instrumental in addressing the risks of flood and drought disasters arising from global climate change and land use change, as well as the water scarcity risks stemming from agricultural–ecological water competition. This can help develop effective adaptation strategies and decisions for integrated water resources management.
Additionally, using the WetlandSCB framework, raster-scale wetland depression topographic information can be accurately reconstructed. Through flow direction analysis and watershed delineation methods, key parameters such as wetland inflow and outflow locations, wetland catchment boundaries, and other related characteristics can be identified (these steps can be performed using QGIS software). By integrating the hypsometric curve, water surface distribution data, and morphological characteristics of the wetland derived from the WetlandSCB framework, the initial wetland water level, the number of wetland layers, and the corresponding area–level pairs can be determined. Field surveys provide essential data on wetland soil and vegetation properties, as well as inflow volumes within the study area. Finally, the hydrologic model, coupled with the wetland module, can be implemented to support wetland eco-hydrologic research and integrated water resources management (Fig. 14).
This study developed a novel framework to accurately quantify wetland depression water storage capacity using coarse-resolution terrain data. The developed framework, WetlandSCB, integrates multi-source remote sensing data, historical maps, and prior knowledge, and achieves a high prediction of wetland depression distribution and water storage capacity. This is achieved through four steps: (1) integrating a priority-flood algorithm, morphological operators, and prior information on water distribution maps to delineate the spatial extent of wetland depression areas; (2) correcting numerical biases in above-water topography with a water occurrence map; (3) coupling spatial prediction and modeling with remote sensing techniques to estimate bathymetric information; and (4) quantifying depression area water storage capacity based on depth–area rating curves. The conclusions are listed next.
-
Processing the morphological operators and prior information on a water distribution map can accurately delineate the spatial extent of wetland depressions. The derived wetland depression map shows high spatial agreement with the true wetland depression map, with both the overall accuracy and the kappa coefficient exceeding 0.95. The performance of the WetlandSCB framework is superior to the priority-flood algorithm in wetland depression spatial delineation.
-
The water occurrence map can effectively correct numerical biases in above-water topography. Compared with the original results, the corrected topography exhibits high consistency with true above-water topography, with average increases of 0.33 and 0.38 in the Pearson coefficient and R2, respectively.
-
The coupling of spatial prediction and modeling methods with remote sensing techniques achieves high-precision estimation of underwater bathymetry of wetland depressions, demonstrating relative errors below 3 %, compared with field measurements. The results prove the superiority of the WetlandSCB framework over spatial prediction and modeling methods in underwater bathymetry estimation.
-
The WetlandSCB framework accurately estimates WDWSC with relative errors less than 10 %, compared with calculations based on field topography and bathymetry.
The concept and technical approaches are applicable to large-scale wetland depression water storage estimation, as well as to the regions where field measurements and/or high-resolution data are not available. Application of the WetlandSCB framework provides accurate distribution and depth–area relations of wetland depression areas, which can be incorporated in wetland modules of hydrologic models (e.g., HYDROTEL, SWAT, HYPE, CHRM) to improve the accuracy of flow and storage predictions in river basins.
The data used in this study are openly available for research purposes. The SRTM DEM and SRTM water body data can be downloaded at https://earthexplorer.usgs.gov (last access: 10 February 2023, Farr and Kobrick, 2000; NASA, 2013). Wetland maps are available at https://zenodo.org/records/5816591 (last access: 2 August 2022) and http://northeast.geodata.cn/data/datadetails.html?dataguid=267682210636266&docid=579 (last access: 3 August 2022, Mao et al., 2020). Water distribution maps and water occurrence maps are available at https://earthengine.google.com (last access: 23 April 2023, Pekel et al., 2016). Altimetry satellite data can be downloaded at https://scihub.copernicus.eu (last access: 5 September 2023, Copernicus Data Space Ecosystem).
BH, LC, and YW designed and executed the study. All authors contributed to the general idea, the discussion, and editing of the manuscript.
The contact author has declared that none of the authors has any competing interests.
Publisher’s note: Copernicus Publications remains neutral with regard to jurisdictional claims made in the text, published maps, institutional affiliations, or any other geographical representation in this paper. While Copernicus Publications makes every effort to include appropriate place names, the final responsibility lies with the authors.
This work was supported by the National Natural Science Foundation of China (grant no. 41877160 and U24A20570), the National Key Research and Development Program of China (grant nos. 2017YFC0406003 and 2021YFC3200203), and the Consulting Project Proposal of the Chinese Academy of Engineering (grant no. JL2023-17).
This research has been supported by the Strategic Priority Research Program of the Chinese Academy of Sciences, China (grant no. XDA28020501).
This paper was edited by Shraddhanand Shukla and reviewed by two anonymous referees.
Acreman, M. and Holden, J.: How wetlands affect floods, Wetlands, 33, 773–786, https://doi.org/10.1007/s13157-013-0473-2, 2013.
Ahmad, S. K., Hossain, F., Pavelsky, T., Parkins, G. M., Yelton, S., Rodgers, M., Little, S., Haldar, D., Ghafoor, S., Khan, R. H., Shawn, N. A., Haque, A., and Biswas, R. K.:Understanding volumetric water storage in monsoonal wetlands of Northeastern Bangladesh, Water Resour. Res, 56, e2020WR027989, https://doi.org/10.1029/2020WR027989, 2020.
Aires, F., Miolane, L., Prigent, C., Pham, B., Fluet-Chouinard, E., Lehner, B., and Papa, F.: A global dynamic long-term inundation extent dataset at high spatial resolution derived through downscaling of satellite observations, J. Hydrometeorol, 18, 1305–1325, https://doi.org/10.1175/JHM-D-16-0155.1, 2017.
Barnes, R., Lehman, C., and Mulla, D.: Priority-flood: An optimal depression-filling and watershed-labeling algorithm for digital elevation models, Comput. Geosci, 62, 117–127, https://doi.org/10.1016/j.cageo.2013.04.024, 2014.
Bonnema, M., Sikder, S., Miao, Y., Chen, X., Hossain, F., Ara Pervin, I., Mahbubur Rahman, S. M., and Lee, H.: Understanding satellite-based monthly-to-seasonal reservoir outflow estimation as a function of hydrologic controls, Water Resour. Res, 52, 4095–4115, https://doi.org/10.1002/2015WR017830, 2016.
Bonnema, M. and Hossain, F.: Inferring reservoir operating patterns across the Mekong Basin using only space observations, Water Resour. Res, 53, 3791–3810, https://doi.org/10.1002/2016WR019978, 2017.
Canny, J: A computational approach to edge detection, IEEE Trans. Pattern Anal. Mach. Intell., PAMI-8, 679–698, https://doi.org/10.1109/TPAMI.1986.4767851, 1986.
Chen, T., Song, C., Zhan, P., Yao, J., Li, Y., and Zhu, J.: Remote sensing estimation of the flood storage capacity of basin-scale lakes and reservoirs at high spatial and temporal resolutions, Sci. Total Environ, 807, 150772, https://doi.org/10.1016/j.scitotenv.2021.150772, 2022.
Chen, W., Nover, D., Yen, H., Xia, Y., He, B., Sun, W., and Viers, J.: Exploring the multiscale hydrologic regulation of multipond systems in a humid agricultural catchment, Water Res., 184, 115987, https://doi.org/10.1016/j.watres.2020.115987, 2020.
Chu, L., Oloo, F., Sudmanns, M., Tiede, D., Hölbling, D., Blaschke, T., and Teleoaca, I.: Monitoring long-term shoreline dynamics and human activities in the Hangzhou Bay, China, combining daytime and nighttime EO data, Big Earth Data, 4, 242–264, https://doi.org/10.1080/20964471.2020.1740491, 2020.
Clark, M. P. and Shook, K. R.: The Numerical Formulation of Simple Hysteretic Models to Simulate the Large-Scale Hydrological Impacts of Prairie Depressions, Water Resour. Res, 58, e2022WR032694, https://doi.org/10.1029/2022WR032694, 2022.
Cohen, M. J., Creed, I. F., Alexander, L., Basu, N. B., Calhoun, A. J., Craft, C., D'Amico, E., DeKeyser, E., Fowler, L., Golden, H. E., Jawitz, J. W., Kalla, P., Kirkman, L. K.,Lane, C. R., Lang, M., Leibowitz, S. G., Lewis, D.B., Marton, J., McLaughlin, D. L., Mushet D. M., Raanan-Kiperwas, H., Rains, M. C., Smith, L., and Walls, S. C.: Do geographically isolated wetlands influence landscape functions?, P. Natl. Acad. Sci. USA, 113, 1978–1986, https://doi.org/10.1073/pnas.1512650113, 2016.
Duan, Z. and Bastiaanssen, W. G. M.: Estimating water volume variations in lakes and reservoirs from four operational satellite altimetry databases and satellite imagery data, Remote Sens. Environ., 134, 403–416, https://doi.org/10.1016/j.rse.2013.03.010, 2013.
Evenson, G. R., Golden, H. E., Lane, C. R., McLaughlin, D. L., and D'Amico, E.: Depressional wetlands affect watershed hydrological, biogeochemical, and ecological functions, Ecol. Appl., 28, 953–966, https://doi.org/10.1002/eap.1701, 2018.
Fang, Y., Li, H., Wan, W., Zhu, S., Wang, Z., Hong, Y., and Wang, H.: Assessment of water storage change in China's lakes and reservoirs over the last three decades, Remote Sens., 11, 1467, https://doi.org/10.3390/rs11121467, 2019.
Farr, T. G. and Kobrick, M.: Shuttle Radar Topography Mission produces a wealth of data, Eos Trans. AGU, 81, 583–583, https://doi.org/10.1029/EO081i048p00583, 2000.
Ferreira, C. S., Kašanin-Grubin, M., Solomun, M. K., Sushkova, S., Minkina, T., Zhao, W., and Kalantari, Z.: Wetlands as nature-based solutions for water management in different environments, Curr. Opin. Environ. Sci. Health, 33, 100476, https://doi.org/10.1016/j.coesh.2023.100476, 2023.
Gao, H.: Satellite remote sensing of large lakes and reservoirs: From elevation and area tostorage, Wiley Interdisciplinary Reviews: Water, 2, 147–157, https://doi.org/10.1002/wat2.1065, 2015.
Gdulová, K., Marešová, J., and Moudrý, V.: Accuracy assessment of the global TanDEM-X digital elevation model in a mountain environment, Remote Sens. Environ., 241, 111724, https://doi.org/10.1016/j.rse.2020.111724, 2020.
Haag, K. H., Lee, T. M., Herndon, D. C., County, P., and Water, T. B.: Bathymetry and vegetation in isolated marsh and cypress wetlands in the northern Tampa Bay area, 2000–2004, US Department of the Interior, US Geol. Surv., 2005-5109, 1–49, https://lccn.loc.gov/2005452253, 2005.
Hawker, L., Neal, J., and Bates, P.: Accuracy assessment of the TanDEM-X 90 digital elevation model for selected floodplain sites, Remote Sens. Environ., 232, 111319, https://doi.org/10.1016/j.rse.2019.111319, 2019.
Hayashi, M. and Van der Kamp, G.: Simple equations to represent the volume–area–depthrelations of shallow wetlands in small topographic depressions, J. Hydrol, 237, 74–85 ,https://doi.org/10.1016/S0022-1694(00)00300-0, 2000.
He, D., Zhong, Y., and Zhang, L.: Spectral–spatial–temporal MAP-based sub-pixel mappingfor land-cover change detection, IEEE Trans. Geosci. Remote Sens., 58, 1696–1717, https://doi.or10.1109/TGRS.2019.2947708, 2019.
Huang, Q., Li, X., Han, P., Long, D., Zhao, F., and Hou, A.: Validation and application of water levels derived from Sentinel-3A for the Brahmaputra River, Sci. China. Technol. Sc., 62, 1760–1772, https://doi.org/10.1007/s11431-019-9535-3, 2019.
Jones, C. N., Evenson, G. R., McLaughlin, D. L., Vanderhoof, M. K., Lang, M. W., McCarty, G. W., Golden, E. H., Lane, C.R., and Alexander, L. C.: Estimating restorable wetland water storage at landscape scales, Hydrol. Proc., 32, 305–313, https://doi.org/10.1002/hyp.11405, 2018.
Khazaei, B., Read, L. K., Casali, M., Sampson, K. M., and Yates, D. N.: GLOBathy, the global lakes bathymetry dataset, Sci. Data, 9, 36, https://doi.org/10.1038/s41597-022-01132-9, 2022.
Lane, C. R., Leibowitz, S. G., Autrey, B. C., LeDuc, S. D., and Alexander, L. C.: Hydrological, physical, and chemical functions and connectivity of non-floodplain wetlands to downstream waters: A review, J. Am. Water Resour. Assoc., 54, 346–371, https://doi.org/10.1111/1752-1688.12633, 2018.
Lindsay, J. B.: Whitebox GAT: A case study in geomorphometric analysis, Comput. Geosci, 95, 75–84, https://doi.org/10.1016/j.cageo.2016.07.003, 2016.
Liu, C., Frazier, P., and Kumar, L.: Comparative assessment of the measures of thematic classification accuracy, Remote Sens. Environ, 107, 606–616, https://doi.org/10.1016/j.rse.2006.10.010, 2007.
Liu, K. and Song, C.: Modeling lake bathymetry and water storage from DEM data constrained by limited underwater surveys, J. Hydrol., 604, 127260, https://doi.org/10.1016/j.jhydrol.2021.127260, 2022.
Liu, K., Song, C., Ke, L., Jiang, L., Pan, Y., and Ma, R.: Global open-access DEM performances in Earth's most rugged region High Mountain Asia: Amulti-level assessment, Geomorphology, 338, 16–26, https://doi.org/10.1016/j.geomorph.2019.04.012, 2019.
Liu, K., Song, C., Zhan, P., Luo, S., and Fan, C.: A Low-Cost Approach for Lake Volume Estimation on the Tibetan Plateau: Coupling the Lake Hypsometric Curve and Bottom Elevation, Front. Earth Sci., 10, 925944, https://doi.org/10.3389/feart.2022.925944, 2022.
Liu, K., Song, C., Zhao, S., Wang, J., Chen, T., Zhan, P., Fan, C., and Zhu, J.: Mapping inundated bathymetry for estimating lake water storage changes from SRTM DEM: A global investigation., Remote Sens. Environ., 301, 113960, https://doi.org/10.1016/j.rse.2023.113960, 2024.
Li, S., MacMillan, R. A., Lobb, D. A., McConkey, B. G., Moulin, A., and Fraser, W. R.: Lidar DEM error analyses and topographic depression identification in a hummocky landscape in the prairie region of Canada, Geomorphology, 129, 263–275, https://doi.org/10.1016/j.geomorph.2011.02.020, 2011.
Li, X., Long, D., Huang, Q., Han, P., Zhao, F., and Wada, Y.: High-temporal-resolution water level and storage change data sets for lakes on the Tibetan Plateau during 2000–2017 using multiple altimetric missions and Landsat-derived lake shoreline positions, Earth Syst. Sci. Data, 11, 1603–1627, https://doi.org/10.5194/essd-11-1603-2019, 2019a.
Li, Y., Gao, H., Jasinski, M. F., Zhang, S., and Stoll, J. D.: Deriving high-resolution reservoir bathymetry from ICESat-2 prototype photon-counting lidar and landsat imagery, IEEE Trans. Geosci. Remote Sens., 57, 7883–7893, https://doi.org/10.1109/TGRS.2019.2917012, 2019b.
Li, X., Ling, F., Foody, G. M., Boyd, D. S., Jiang, L., Zhang, Y., Zhou, P., Wang, Y., Chen, R., and Du, Y.: Monitoring high spatiotemporal water dynamics by fusing MODIS, Landsat, water occurrence data and DEM, Remote Sens. Environ., 265, 112680, https://doi.org/10.1016/j.rse.2021.112680, 2021.
Luo, S., Song, C., Liu, K., Ke, L., and Ma, R.: An effective low-cost remote sensing approach to reconstruct the long-term and dense time series of area and storage variations forlarge lakes, Sensors, 19, 4247, https://doi.org/10.3390/s19194247, 2019.
Mao, D., Wang, Z., Du, B., Li, L., Tian, Y., Jia, M., Zeng, Y., Song, K. Jiang, M., and Wang, Y.: National wetland mapping in China: A new product resulting from object-based and hierarchical classification of Landsat 8 OLI images, ISPRS-J. Photogramm. Remote Sens., 164, 11–25, https://doi.org/10.1016/j.isprsjprs.2020.03.020, 2020.
Marešová, J., Bašta, P., Gdulová, K., Barták, V., Kozhoridze, G., Šmída, J., Markonis, Y., Rocchini, D., Prošek, J., Pracná, P., and Moudrý, V.: Choosing the optimal global digital elevation model for stream network delineation: Beyond vertical accuracy, Earth Space Sci., 11, e2024EA003743, https://doi.org/10.1029/2024EA003743, 2024.
Meng, B., Liu, J. L., Bao, K., and Sun, B.: Water fluxes of Nenjiang River Basin with ecological network analysis: Conflict and coordination between agricultural development andwetland restoration, J. Clean Prod., 213, 933–943, https://doi.org/10.1016/j.jclepro.2018.12.243,2019.
Messager, M. L., Lehner, B., Grill, G., Nedeva, I., and Schmitt, O.: Estimating the volume and age of water stored in global lakes using a geo-statistical approach, Nat. Commun., 7, 13603, https://doi.org/10.1038/ncomms13603, 2016.
Moriasi, D. N., Gitau, M. W., Pai, N., and Daggupati, P.: Hydrologic and water quality models: Performance measures and evaluation criteria, Trans. ASABE, 58, 1763–1785, https://doi.org/10.13031/trans.58.10715, 2015.
Mukul, M., Srivastava, V., Jade, S., and Mukul, M.: Uncertainties in the shuttle radar topography mission (SRTM) Heights: Insights from the indian Himalaya and Peninsula, Sci. Rep., 7, 41672, https://doi.org/10.1038/srep41672, 2017.
Mullen, C., Penny, G., and Müller, M. F.: A simple cloud-filling approach for remote sensing water cover assessments, Hydrol. Earth Syst. Sci., 25, 2373–2386, https://doi.org/10.5194/hess-25-2373-2021, 2021.
NASA: NASA Shuttle Radar Topography Mission Water Body Data Shapefiles and Raster Files, NASA EOSDIS Land Processes Distributed Active Archive Center [data set], https://doi.org/10.5067/MEaSUREs/SRTM/SRTMSWBD.003, 2013.
Papa, F., Frappart, F., Güntner, A., Prigent, C., Aires, F., Getirana, A. C., and Maurer, R.: Surface freshwater storage and variability in the Amazon basin from multi-satellite observations, 1993–2007, J. Geophys. Res.-Atmos., 118, 11–951, https://doi.org/10.1002/2013JD020500, 2013.
Pekel, J. F., Cottam, A., Gorelick, N., and Belward, A. S.: High-resolution mapping of global surface water and its long-term changes, Nature, 540, 418–422, https://doi.org/10.1038/nature20584, 2016.
Pickens, A. H., Hansen, M. C., Hancher, M., Stehman, S. V., Tyukavina, A., Potapov, P., Marroquin, B., and Sherani, Z.: Mapping and sampling to characterize global inland waterdynamics from 1999 to 2018 with full Landsat time-series, Remote Sens. Environ., 243, 111792, https://doi.org/10.1016/j.rse.2020.111792, 2020.
Pulvirenti, L., Chini, M., Pierdicca, N., Guerriero, L., and Ferrazzoli, P.: Flood monitoringusing multi-temporal COSMO-SkyMed data: Image segmentation and signature interpretation, Remote Sens. Environ., 115, 990–1002, https://doi.org/10.1016/j.rse.2010.12.002, 2011a.
Pulvirenti, L., Pierdicca, N., Chini, M., and Guerriero, L.: An algorithm for operational flood mapping from Synthetic Aperture Radar (SAR) data using fuzzy logic, Nat. Hazards Earth Syst. Sci., 11, 529–540, https://doi.org/10.5194/nhess-11-529-2011, 2011b.
Rajib, A., Golden, H. E., Lane, C. R., and Wu, Q.: Surface depression and wetland waterstorage improves major river basin hydrologic predictions, Water Resour. Res., 56, e2019WR026561, https://doi.org/10.1029/2019WR026561, 2020.
Rodell, M. and Li, B.: Changing intensity of hydroclimatic extreme events revealed by GRACE and GRACE-FO, Nat. Water, 1, 241–248, https://doi.org/10.1038/s44221-023-00040-5, 2023.
Shook, K., Papalexiou, S., and Pomeroy, J. W.: Quantifying the effects of Prairie depressional storage complexes on drainage basin connectivity, J. Hydrol., 593, 125846, https://doi.org/10.1016/j.jhydrol.2020.125846, 2021.
Simard, M., Denbina, M., Marshak, C., and Neumann, M.: A global evaluation of radar-derived digital elevation models: SRTM, NASADEM, and GLO-30, J. Geophys. Res.-Biogeo., 129, e2023JG007672, https://doi.org/10.1029/2023JG007672, 2024.
Sjöberg, Y., Dessirier, B., Ghajarnia, N., Jaramillo, F., Jarsjö, J., Panahi, D. M., Xu, D., Zou, L., and Manzoni, S.: Scaling relations reveal global and regional differences in morphometry of reservoirs and natural lakes, Sci. Total Environ., 822, 153510, https://doi.org/10.1016/j.scitotenv.2022.153510, 2022.
Smiley Jr., P. C. and Allred, B. J.: Differences in aquatic communities between wetlands created by an agricultural water recycling system, Wetl. Ecol. Manag., 19, 495–505, https://doi.org/10.1007/s11273-011-9231-5, 2011.
Thorslund, J., Jarsjo, J., Jaramillo, F., Jawitz, J. W., Manzoni, S., Basu, N. B., Chalov, M.J., Creed, I. F., Goldenberg, R., Hylin, A., Kalantari, Z., Koussis, A. D., Lyon, S. W., Mazi, K., Mard, J., Persson, K., Pietro, J., Prieto, C., Quin, A., and Destouni, G.: Wetlands as large-scale nature-based solutions: Status and challenges for research, engineeringand management, Ecol. Eng., 108, 489–497, https://doi.org/10.1016/j.ecoleng.2017.07.012, 2017.
Tsai, J. S., Venne, L. S., McMurry, S. T., and Smith, L. M.: Vegetation and land use impact on water loss rate in playas of the Southern High Plains, USA, Wetlands, 30, 1107–1116, https://doi.org/10.1007/s13157-010-0117-8, 2010.
Uuemaa, E., Ahi, S., Montibeller, B., Muru, M., and Kmoch, A.: Vertical accuracy of freely available global digital elevation models (ASTER, AW3D30, MERIT, TanDEM-X, SRTM,and NASADEM), Remote Sens., 12, 3482, https://doi.org/10.3390/rs12213482, 2020.
Vanthof, V. and Kelly, R.: Water storage estimation in ungauged small reservoirs with the TanDEM-X DEM and multi-source satellite observations, Remote Sens. Environ., 235, 111437, https://doi.org/10.1016/j.rse.2019.111437, 2019.
Verones, F., Pfister, S., and Hellweg, S.: Quantifying area changes of internationally important wetlands due to water consumption in LCA, Environ. Sci. Technol., 47, 9799–9807, https://doi.org/10.1021/es400266v, 2013.
Wang, Q., Shi, W., and Atkinson, P. M.: Spatiotemporal subpixel mapping of time-series images, IEEE Trans. Geosci. Remote Sens., 54, 5397–5411, https://doi.org/10.1109/TGRS.2016.2562178, 2016.
Wu, Q. and Lane, C. R.: Delineation and quantification of wetland depressions in the Prairie Pothole Region of North Dakota, Wetlands, 36, 215–227, https://doi.org/10.1007/s13157-015-0731-6, 2016.
Wu, Q., Lane, C. R., Wang, L., Vanderhoof, M. K., Christensen, J. R., and Liu, H.: Efficient delineation of nested depression hierarchy in digital elevation models for hydrological analysis using level-set method, J. Am. Water Resour. Assoc., 55, 354–368, https://doi.org/10.1111/1752-1688.12689, 2019.
Wu, Y., Sun, J., Xu, Y. J., Zhang, G., and Liu, T.: Projection of future hydrometeorological extremes and wetland flood mitigation services with different global warming levels: A case study in the Nenjiang river basin, Ecol. Indic., 140, 108987, https://doi.org/10.1016/j.ecolind.2022.108987, 2022.
Wu, Y., Zhang, G., Rousseau, A. N., and Xu, Y. J.: Quantifying streamflow regulation services of wetlands with an emphasis on quickflow and baseflow responses in the Upper Nenjiang River Basin, Northeast China, J. Hydrol., 583, 124565, https://doi.org/10.1016/j.jhydrol.2020.124565, 2020a.
Wu, Y., Zhang, G., Rousseau, A. N., Xu, Y. J., and Foulon, É.: On how wetlands can provide flood resilience in a large river basin: a case study in Nenjiang river Basin, China, J. Hydrol., 587, 125012, https://doi.org/10.1016/j.jhydrol.2020.125012, 2020b.
Wu, Y., Sun, J., Blanchette, M., Rousseau, A. N., Xu, Y. J., Hu, B., and Zhang, G.: Wetland mitigation functions on hydrological droughts: From drought characteristics to propagation of meteorological droughts to hydrological droughts, J. Hydrol., 617, 128971, https://doi.org/10.1016/J.JHYDROL.2022.128971, 2023.
Xiong, L., Tang, G., Yang, X., and Li, F.: Geomorphology-oriented digital terrain analysis:Progress and perspectives, J. Geogr. Sci., 31, 456–476, https://doi.org/10.1007/s11442-021-1853-9, 2021.
Yang, J. and Huang, X.: 30 m annual land cover and its dynamics in China from 1990 to 2019, Earth Syst. Sci. Data, 2021, 1–29, https://doi.org/10.5194/essd-13-3907-2021, 2021.
Yao, F., Wang, J., Yang, K., Wang, C., Walter, B. A., and Crétaux, J. F.: Lake storage variation on the endorheic Tibetan Plateau and its attribution to climate change since the newmillennium, Environ. Res. Lett., 13, 064011, https://doi.org/10.1088/1748-9326/aab5d3, 2018.
Yao, F., Wang, J., Wang, C., and Crétaux, J. F.: Constructing long-term high-frequency time series of global lake and reservoir areas using Landsat imagery, Remote Sens. Environ., 232, 111210, https://doi.org/10.1016/j.rse.2019.111210, 2019.
Yin, J., Gentine, P., Zhou, S., Sullivan, S. C., Wang, R., Zhang, Y., and Guo, S.: Large increase in global storm runoff extremes driven by climate and anthropogenic changes, Nat. Commun., 9, 4389, https://doi.org/10.1038/s41467-018-06765-2, 2018.
Zhan, P., Song, C., Luo, S., Liu, K., Ke, L., and Chen, T.: Lake level reconstructed from DEM-based virtual station: Comparison of multisource DEMs with laser altimetryand UAV-LiDAR measurements, IEEE Trans. Geosci. Remote. Sens., 19, 1–5, https://doi.org/10.1109/LGRS.2021.3086582, 2021.
Zhang, X., Liu, L., Chen, X., Gao, Y., Xie, S., and Mi, J.: GLC_FCS30: Global land-cover product with fine classification system at 30 m using time-series Landsat imagery, Earth Syst. Sci. Data, 13, 2753–2776, https://doi.org/10.5194/essd-13-2753-2021, 2021.
Zhao, G. and Gao, H.: Automatic correction of contaminated images for assessment of reservoir surface area dynamics, Geophys. Res. Lett., 45, 6092–6099, https://doi.org/10.1029/2018GL078343, 2018.
Zhou, G., Sun, Z., and Fu, S.: An efficient variant of the priority-flood algorithm for filling depressions in raster digital elevation models, Comput. Geosci., 90, 87–96, https://doi.org/10.1016/j.cageo.2016.02.021, 2016.
Zhou, H., Liu, S., Mo, X., Hu, S., Zhang, L., Ma, J., Bandini, F., Grosen, H., and BauerGottwein, P.: Calibrating a hydrodynamic model using water surface elevation determined from ICESat-2 derived cross-section and Sentinel-2 retrieved sub-pixel river width, Remote Sens. Environ., 298, 113796, https://doi.org/10.1016/j.rse.2023.113796, 2023.
Zou, Y., Wang, L., Xue, Z., E, M., Jiang, M., Lu, X., Yang, S., Shen, X., Liu, Z., Sun, G., and Yu, X.: Impacts of agricultural and reclamation practices on wetlands in the AmurRiver Basin, Northeastern China, Wetlands, 38, 383–389, https://doi.org/10.1007/s13157-017-0975-4, 2018a.
Zou, Z., Xiao, X., Dong, J., Qin, Y., Doughty, R. B., Menarguez, M. A., Zhang, C., and Wang, J.: Divergent trends of open-surface water body area in the contiguous United States from 1984 to 2016, P. Natl. Acad. Sci. USA, 115, 3810–3815, https://doi.org/10.1073/pnas.1719275115, 2018b.