the Creative Commons Attribution 4.0 License.
the Creative Commons Attribution 4.0 License.
 | 03 Nov 2025
The impact of climate change on dam overtopping floods in Australia
Declan O'Shea
Conrad Wasko
Rory Nathan
Ashish Sharma
There is unequivocal evidence that climate change will change the risk profile of dams, which are critical pieces of infrastructure that safeguard water supply and provide flood mitigation for populated areas. A key input to assessing risks to dam safety is a probabilistic estimate of extreme flood magnitudes with the potential to overtop dams. However, few studies have attempted to consider climate change in such estimates due to the challenges involved. A recent examination of contemporary scientific findings pertinent to climate change impacts on the probability of dam overtopping floods has informed the projection of estimates made here. We project changes in the exceedance probabilities of overtopping floods, namely floods that exceed the dam crest flood, for 18 large dams in Australia under a range of global warming assumptions. Explicit consideration is given to the impacts of climate change on rainfall depth, rainfall temporal pattern, and rainfall losses resulting from changes in antecedent catchment wetness. We used event-based flood modelling and Monte Carlo sampling to appropriately represent the range of uncertainties associated with projecting estimates of extreme flood quantiles. The analysis is dependent on the degree of global warming, which allows results to be interpreted in terms of different greenhouse gas emission scenarios and future time horizons. Our results are consistent with general expectations that the probability of dam overtopping floods will increase with global warming. Specifically, we found that increases in rainfall depth had the largest impact for all 18 dams under climate change. Under 4 °C of global warming, which approximates conditions towards the end of this century under a high emissions scenario, the probability of overtopping floods was between 2.4–17 times that of historical conditions for the dams investigated. We also found that the overtopping probability has more than doubled compared to the historical baseline for four of the dams investigated here as a result of global warming that has already occurred.
- Article
(2690 KB) - Full-text XML
- BibTeX
- EndNote


A confluence of factors are needed to ensure dam safety including adequate governance, appropriate industry practices, sound infrastructure management decisions, and sufficient consideration of aging infrastructure and, in more recent decades, the consideration of climate change (Shirzaei et al., 2025). Failure to address all dam safety factors has led to a number of high profile dam failure cases in the last decade (Ferdowsi et al., 2024; France et al., 2018) often with devastating impacts. The number of flood disasters has risen, more than doubling in the last two decades (Yaghmaei et al., 2020), and this is expected to continue increasing with global warming (Wasko et al., 2021a). The estimation of extreme flood frequencies is therefore essential for managing flood responses and mitigation strategies including planning, design, and management of infrastructure, emergency responses, and the setting of insurance premiums. The changing nature of rare floods under climate change is of particular concern with respect to large high-risk infrastructure such as nuclear power plants (Prasad et al., 2011) and large dams (Nathan and Weinmann, 2019a), where failures would threaten lives, livelihoods, and facilities integral to supporting economic activity. The theoretical basis for flood estimation under a stationary climate is a relatively mature science and a degree of consensus is reflected in national guidelines that are widely used in practice throughout many parts of the world (Wasko et al., 2021b). Similarly, methods for assessing dam overtopping probabilities have also been extensively studied (e.g. Cho et al., 2024, 2025; Hsu et al., 2011; Kuo et al., 2007; Kwon and Moon, 2006; Michailidi and Bacchi, 2017; Rajabzadeh et al., 2023; Wang and Zhang, 2017). However, it has long been recognised that global warming is changing the hydrological cycle (e.g. Mitchell, 1989; Trenberth, 1999) and hence changing flood frequency (Barnett et al., 2008; Matalas, 1997).
There is irrefutable evidence that climate change has already impacted on elements that drive floods such as the frequency, intensity, and duration of rainfalls (Emori and Brown, 2005; Kunkel et al., 2013; Trenberth et al., 2003), with further changes projected to occur in the future. In addition to shifting the depth, location, and timing of rainfall during a flood event, changes in seasonal and sub-seasonal rainfall patterns also alter catchment moisture stores (Ho et al., 2022; Wasko et al., 2020; Woldemeskel and Sharma, 2016), which impact the subsequent flood response (e.g. Garg and Mishra, 2019; Ivancic and Shaw, 2015; Massari et al., 2023; Sivapalan et al., 2005). The impact of climate change on floods has been widely recognised in the scientific literature (Bates et al., 2008; Kundzewicz et al., 2014). However, the estimation of future floods is an ongoing challenge due to the compounding effects of aleatory (e.g. natural variability), epistemic (e.g. knowledge-based), and deep (e.g. climate change) uncertainties. Translating the available knowledge of climate change impacts on floods into guidance to inform practical applications for estimating future floods, particularly extreme floods, is therefore relatively immature (Wasko et al., 2021b).
Much of the scientific literature pertaining to the impact of climate change on floods is focused on non-stationary flood frequency analysis (Salas et al., 2018; Stedinger and Griffis, 2011). However, non-stationary flood frequency approaches accounting for climate change have not been widely adopted in industry guidelines due to limited findings of robust and meaningful covariates for informing non-stationarity (Faulkner et al., 2020; Wasko et al., 2021b). Another approach widely used in the scientific literature is the “chain-of-models” approach, where climate projections from general circulation models are downscaled and bias-correct to create local inputs for flood analysis (Hakala et al., 2019). While results from studies using a chain-of-models approach have been adopted in some flood estimation guidelines (e.g. Natural Resources Wales, Welsh Government, 2022; UK Environment Agency, 2022; Willems, 2013), the method involves the propagation of cascading uncertainties. Consequently, existing guidelines for assessing the impacts of climate change on extreme floods either overly simplify the complexities involved, or are dependent on methods that are too uncertain to justify their adoption in practice (Wasko et al., 2021b).
Many studies have acknowledged climate change as a source of increased risk to dams and the research focus has largely been on informing operational rules or adaptive management in the context of long-term changes in water supplies and demands (e.g. Fluixá-Sanmartín et al., 2021; Madani and Lund, 2010; Malerba et al., 2022; Tanaka et al., 2006). Some of these studies have included the consideration of a wide scope of climate change induced risks (e.g. changes in sedimentation rates, changes in water demands, and changes in population exposure), without explicitly quantifying changes in the probability of a dam overtopping flood. These studies used a chain-of-models approach resulting in projections of risk that range several orders of magnitude due to differences between general circulation model outputs. In contrast, examinations of climate change impacts on dam overtopping floods based on historical records have been based on the detection of trends in overtopping occurrence (Ahmadisharaf and Kalyanapu, 2015) or the prevailing hydroclimatology (Hwang and Lall, 2024). To date, there are a minimal number of studies quantifying the impact of climate change on dam overtopping probability. One such study by Lee and You (2013) provided a conceptual example for a reservoir located in Taiwan intended for exploring the relative sensitivities of the likelihood of dam overtopping floods to changes in rainfall and reservoir capacity with time under climate change. As a result, uncertainties in the runoff response were not considered and the rates of change used to represent climate change were neither explicitly linked with scenarios of climate change nor global warming. Another study by Lompi et al. (2023) considered climate change impacts on a dam in Spain using downscaled outputs from 12 climate models under two emission scenarios in a chain-of-models approach. There is an imperative for dam owners to better understand the change in frequency of extreme floods with the potential to overtop dams given the risk to downstream communities and industries dependent on the reservoir storage, as well as the potential for dams to be a device for mitigating climate change impacts (Boulange et al., 2021).
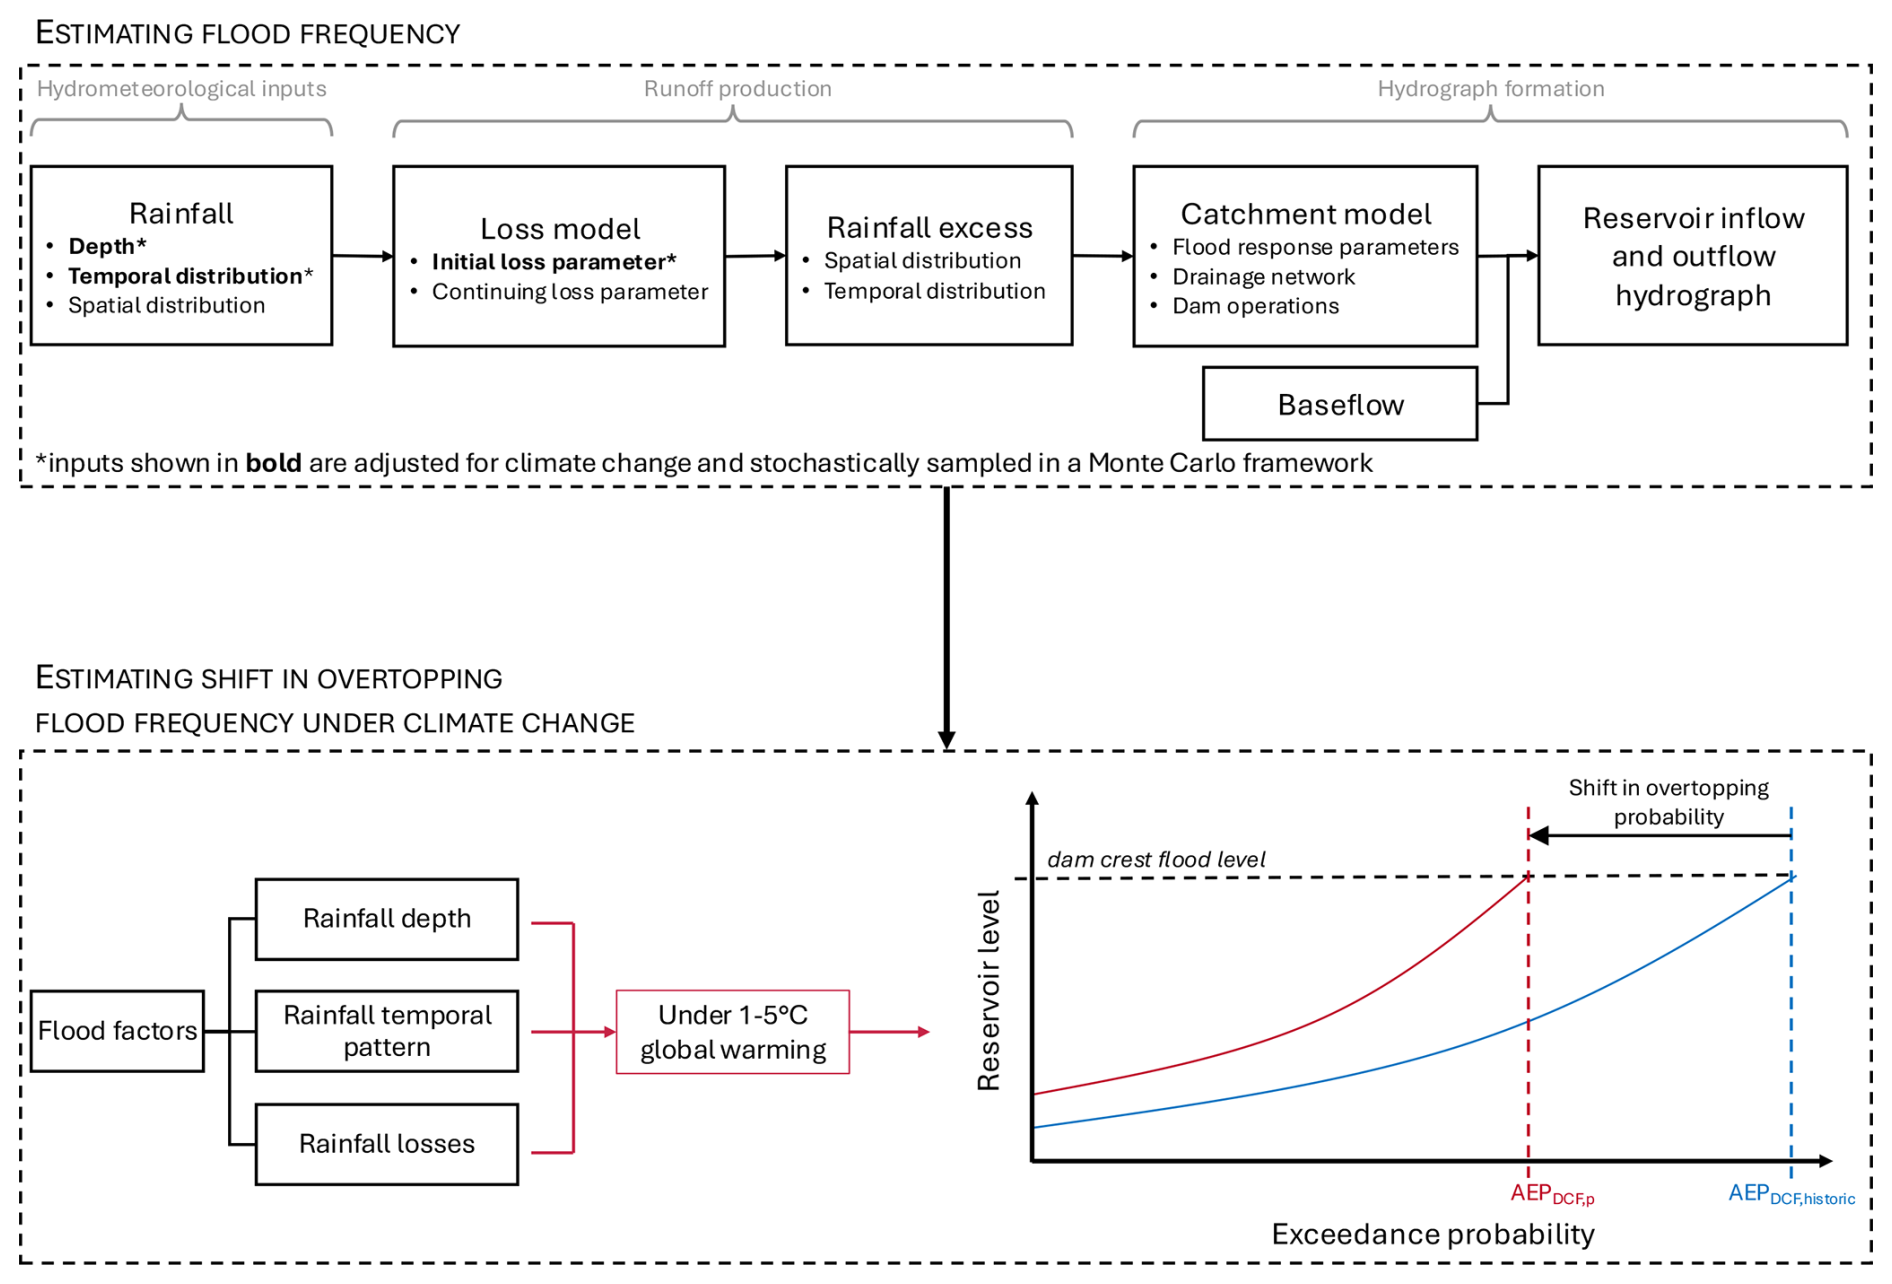
We assess the shift in the likelihood that dams will be overtopped by floods in a warming climate by explicitly considering three flood factors. These are: changes in rainfall intensities with temperature over a range of event magnitudes up to and including estimates of the Probable Maximum Precipitation (PMP) (Jakob et al., 2009; Visser et al., 2022); the rates of change in storm temporal patterns with temperature (Visser et al., 2023); and changes in catchment antecedent wetness (Ho et al., 2022, 2023). Event-based flood modelling is implemented within a stochastic framework as this approach is well suited to explicitly considering the impacts of global warming on the salient flood drivers. The impacts of climate change on overtopping floods are assessed by considering the flood drivers both individually and in combination, and for global warming ranging between 1–5 °C. We investigate the performance of 18 large water-supply dams across Australia, which span different climates and catchment sizes.
2.1 Case study locations
The 18 dams assessed in this study are owned and managed by nine major water agencies and utilities who are responsible for the largest dams in Australia. These 18 dams are primarily water supply dams and are all classified as large dams (ICOLD, 2011) with wall heights ranging from 16–166 m. The catchments upstream of these dams range from 28–15 300 km2 and are located across arid, temperate, and tropical climate zones (see Fig. 1 and Table 1) and are hydrologically independent with the exception of Somerset Dam located on a tributary upstream of Wivenhoe Dam. The catchment upstream of Somerset Dam is less than <20 % of the Wivenhoe Dam catchment. Somerset Dam was at full supply level when modelling Wivenhoe Dam and interactions between the two dams were not explicitly considered.
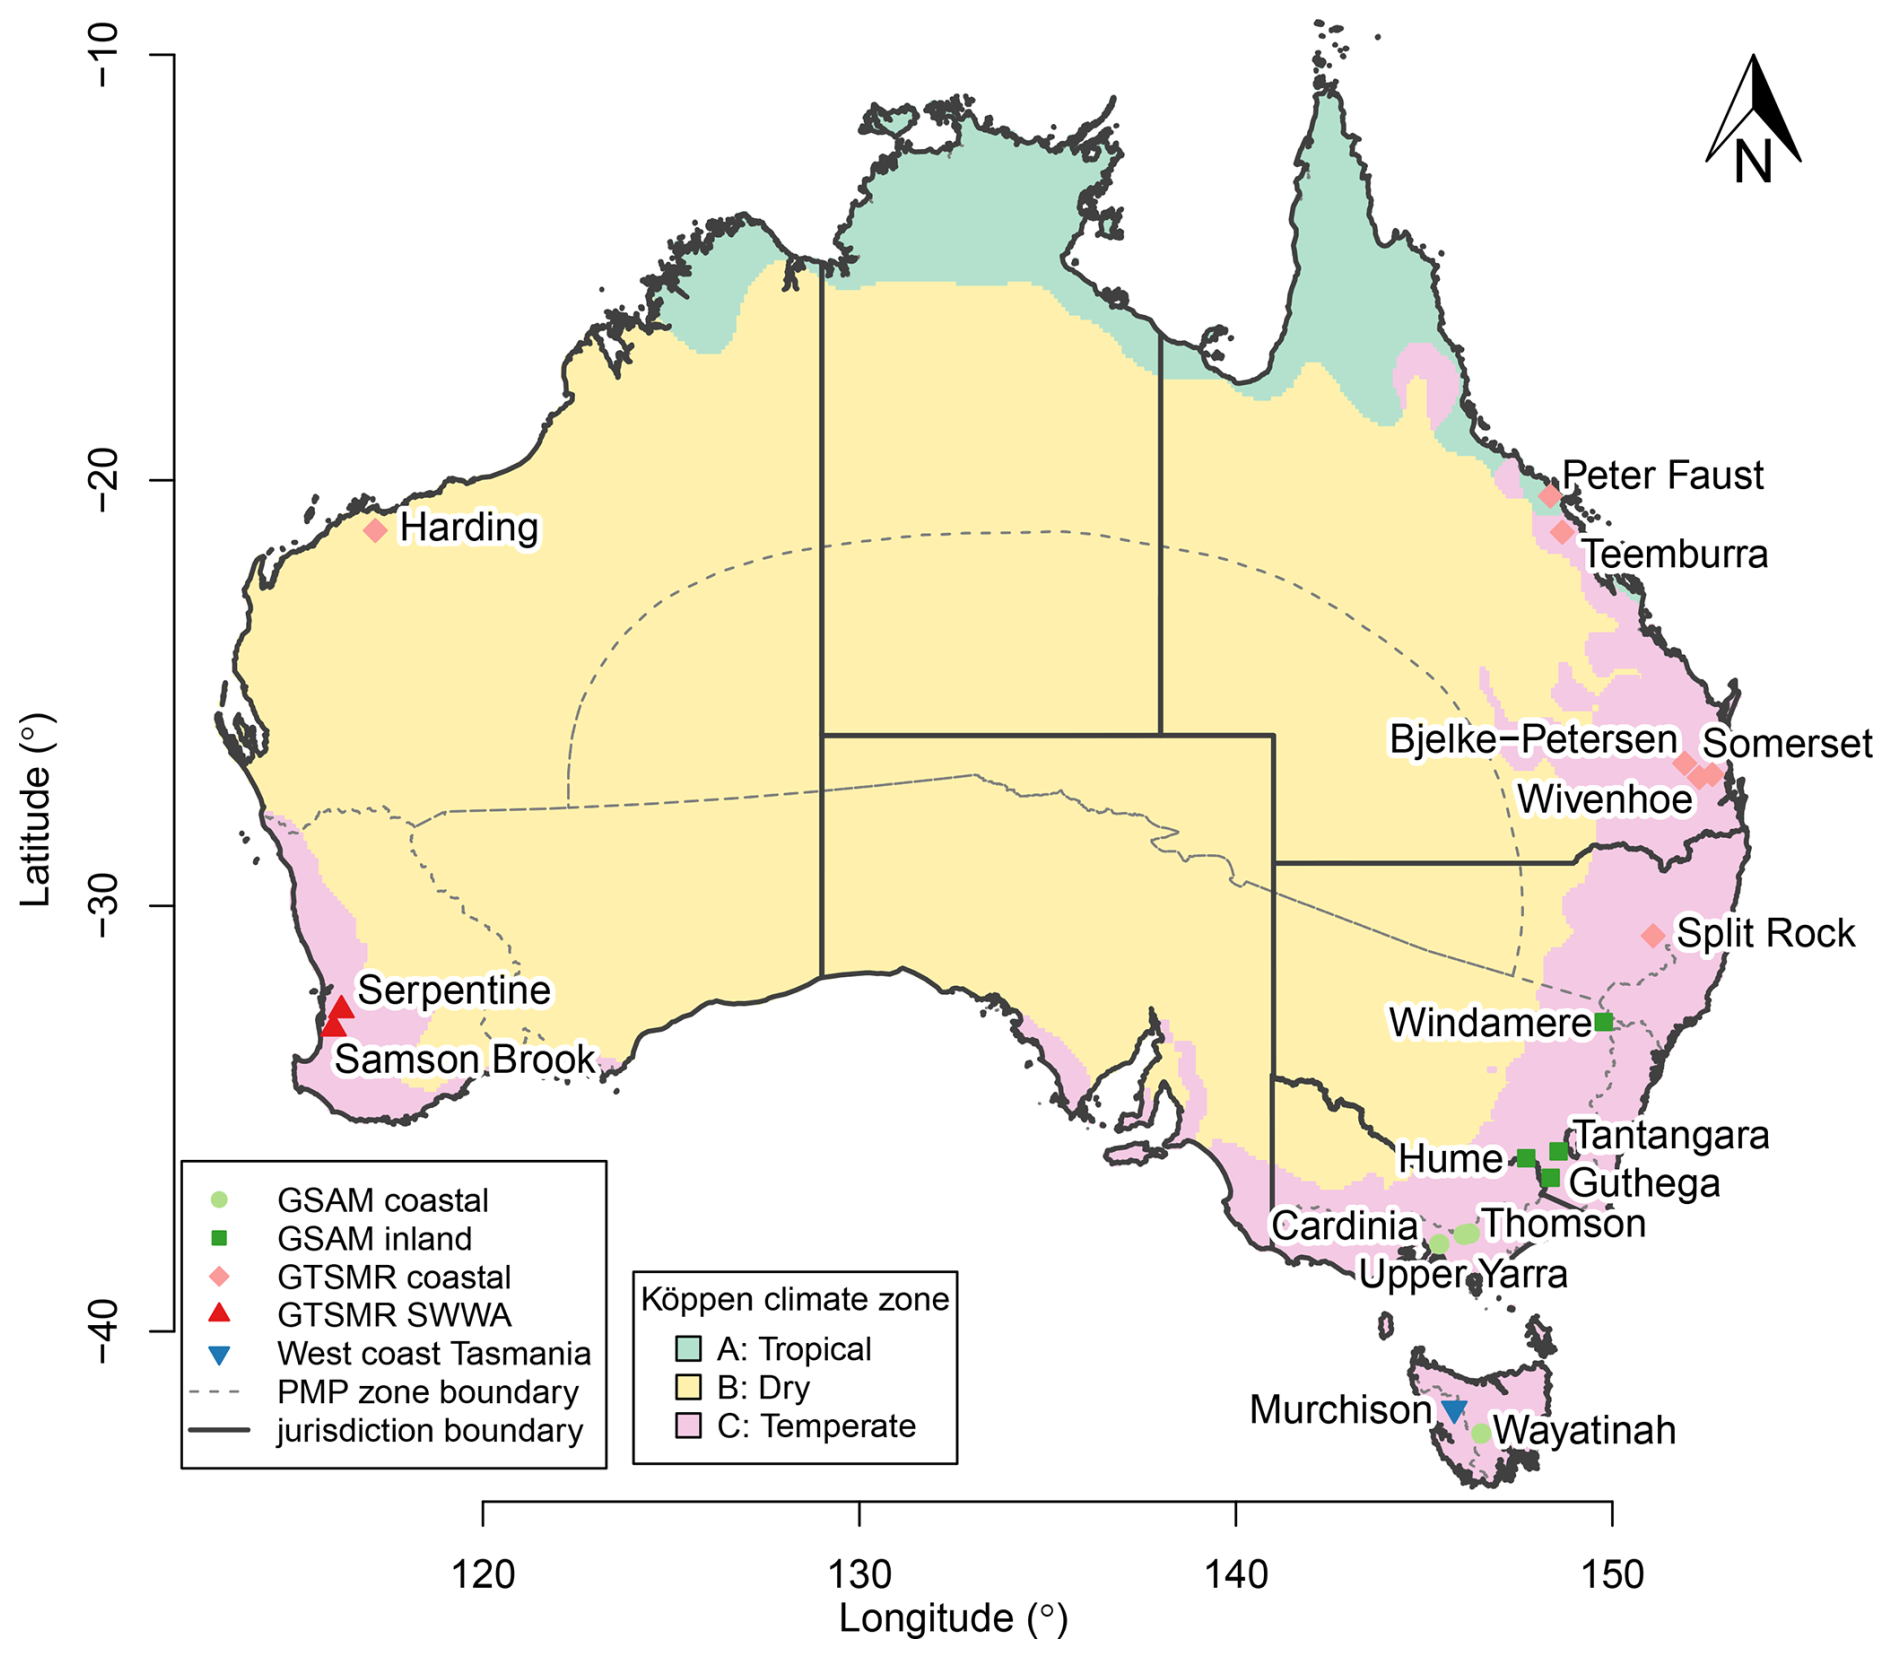
Figure 1Location of the 18 dams used for estimating shifts in the likelihood of overtopping floods under climate change in Australia and the associated zones used for estimating probable maximum precipitation. Köppen climate zones are from Peel et al. (2007). PMP zones are from Walland et al. (2003).
Table 1Catchment sizes, climate zones, PMP zones, and Natural Resource Management (NRM) regions of dam sites used for estimating shifts in the likelihood of overtopping floods under climate change.
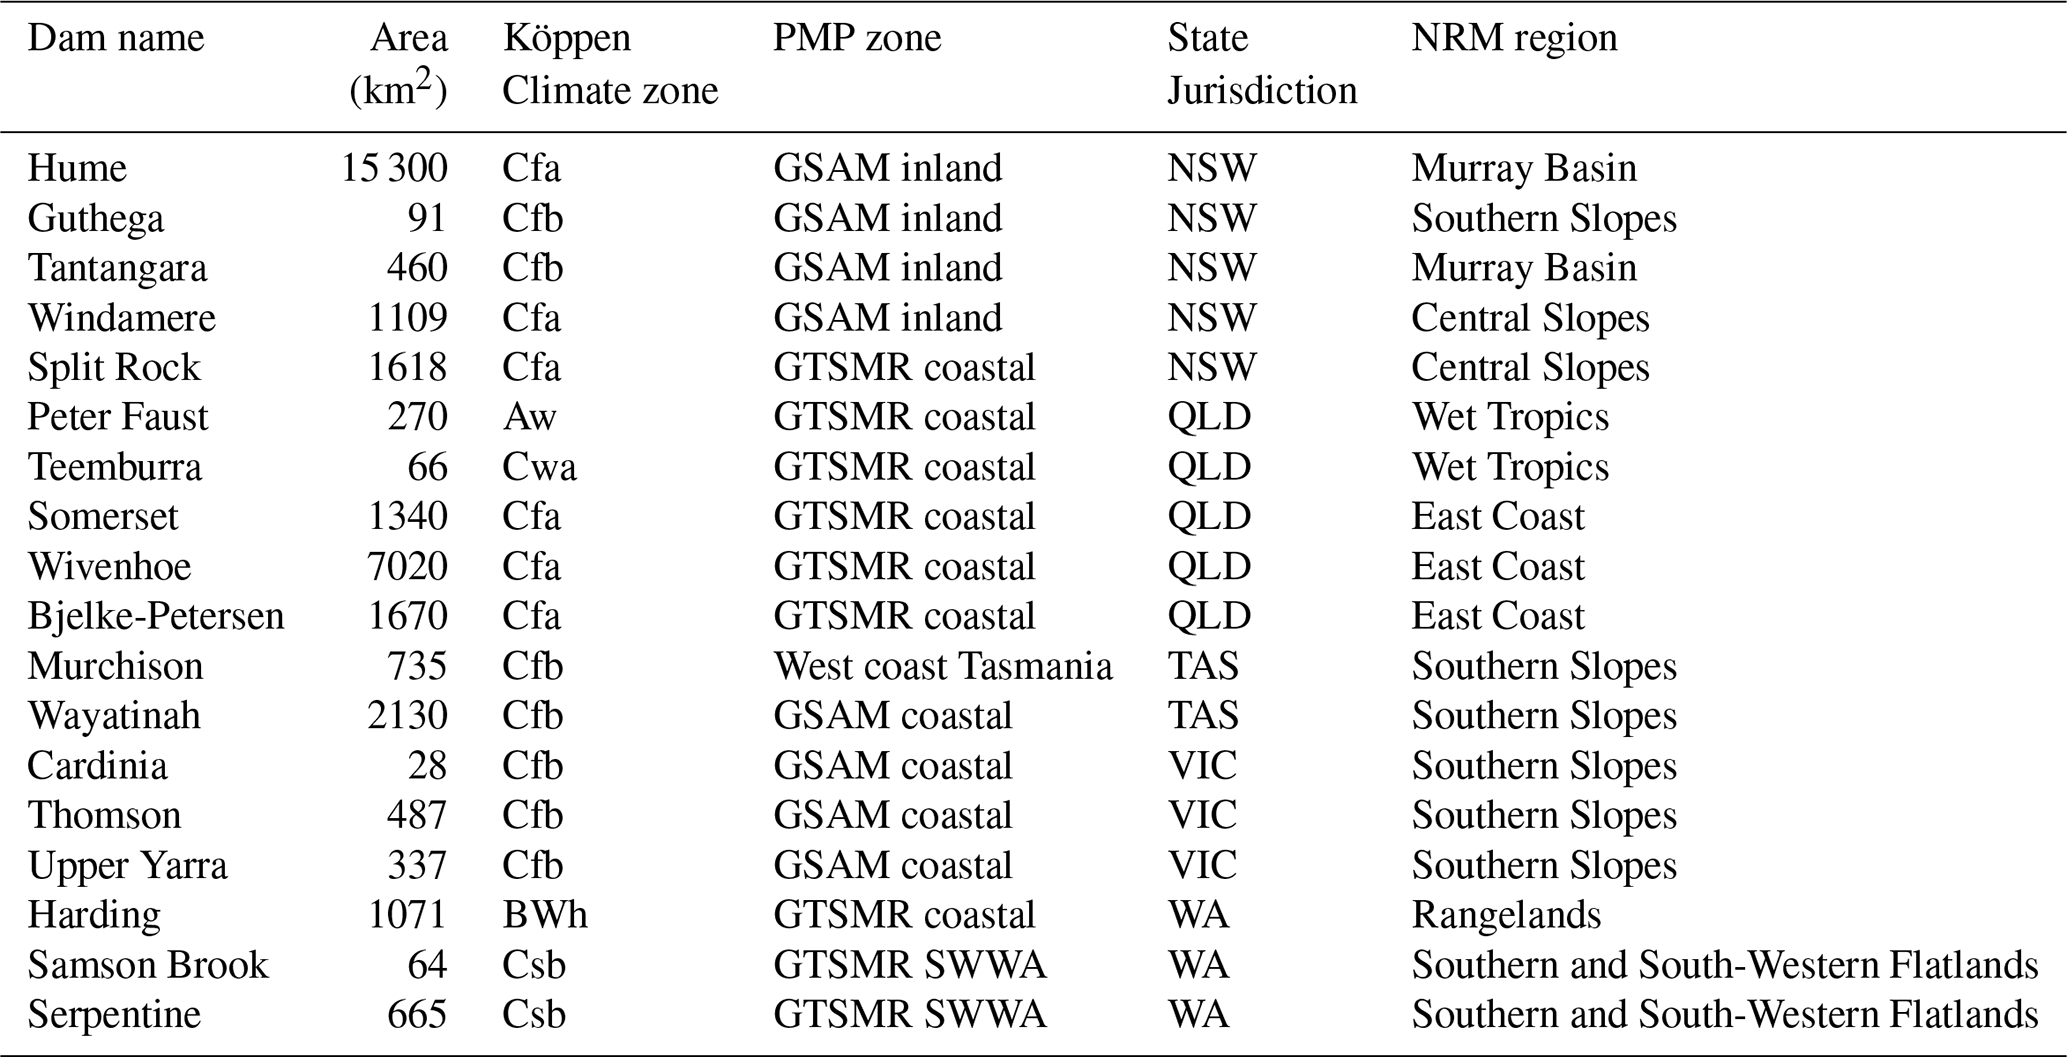
Köppen Climate zone abbreviations: Aw: equatorial, dry winter; BWh: arid, desert, hot; Cfa: warm temperate, fully humid hot summer; Cfb: warm temperate, fully humid, warm summer; Csb: warm temperate, dry, warm summer; Cwa: warm temperate, dry winter, hot summer. Jurisdiction abbreviations: NSW: New South Wales; QLD: Queensland; TAS: Tasmania; WA: Western Australia.
The case study dams are distributed across the Australian continent with the majority located in the more populous temperate climate zones. Together, these dams are subject to a diverse range of extreme storm mechanisms as distinguished by their classification between different zones used for estimating the probable maximum precipitation (PMP zones). Australia is divided into five PMP zones with the most prominent division being that of areas impacted by tropical storms, which are included in the Revised Generalised Tropical Storm Method (GTSMR – coastal and south-west Western Australia (SWWA)), and the south east of the continent, which is covered by the Generalised Southeast Australia Method (GSAM – coastal and inland) (see Fig. 1).
2.2 Event-based modelling
Flood exceedance probabilities were derived using event-based modelling within a Monte-Carlo framework. Event-based models were used as this method is best suited for both estimating extreme floods as well as explicitly accounting for climate change (Wasko et al., 2024b) while Monte-Carlo sampling allows for probabilistic sampling of the joint probabilities of flood inputs (Filipova et al., 2019; Kuczera et al., 2006; Nathan and Weinmann, 2019b). A schematic of the event-based modelling process is shown in Fig. 2. The event-based runoff and streamflow routing procedures used in RORB (Laurenson, 1964; Laurenson et al., 2010; Mein et al., 1974) were adopted here and emulated in the R software environment, referred to as R2ORB. This emulator handles data inputs, performs calculations, and generates outputs in a bespoke manner that enabled the analysis to focus on the aspects of flooding most relevant to exploring climate change impacts. The use of R2ORB enabled a focus on the aspects of flood hydrology modelling most relevant to the exploration of climate change impacts on dam hydrology, namely the catchment runoff-routing and reservoir routing to estimate peak reservoir outflows.
For each dam, the contributing catchment was modelled as a semi-distributed conceptual node-link model. The catchments were divided into sub areas, ranging in number from 4–19 subareas across the 18 case studies, to represent the stream network and allow for rainfall to be spatially distributed. Flood events were then modelled in R2ORB, which follows the generic modelling structure of event-based conceptual rainfall-runoff models (outlined in Fig. 2).
While changes in the initial reservoir levels in this Monte Carlo analysis could have been considered, such changes are dependent on operational procedures, which are influenced by social, economic, and political factors and can be modified by the dam owner, and are therefore beyond the scope of this study. As reservoir levels under climate change had only been modelled for two of the dams, we assumed that the reservoir was at a full supply level prior to the storm as this provides a worst-case scenario for estimating the probability of a dam crest flood. Flood events resulting from the critical duration storm were assessed, that is, the storm duration identified in previous dam assessments conducted by the dam owners as the storm duration that produced the largest reservoir outflows for extreme storms. We adopted the rainfall spatial distribution patterns used by the dam owners and these were fixed for each Monte Carlo simulation. In R2ORB, rainfalls were applied to the centroid of each sub area. The rainfall excess was calculated for each sub area using the initial loss continuing loss (ILCL) model. The rainfall excess was then routed through the catchment model representation of channels and the reservoir to simulate the lumped storage and attenuation of the flood and to calculate the hydrograph of the reservoir outflow (herein referred to as “outflow”). The outflow hydrograph was simulated 20 000 times by stochastically sampling rainfall depths, the initial loss parameter, and the rainfall temporal distribution in order to derive the outflow flood frequency curve. (See Appendix A for more details on the rainfall runoff model, the ILCL model, Monte Carlo sampling approach, and derivation of the outflow flood frequency curve.) The R2ORB models were configured to reproduce reservoir inflow and outflow hydrographs and flood frequency curves produced in RORB and used in practice by the dam owners for design flood estimation. The validation process is further described in Appendix A.
2.3 Assessing impacts of climate change
We use a baseline time period of 1961–1990, which is herein referred to as the historic period. The historic period approximates the mid-point for much of the information used to derive the design information provided in Australian Rainfall and Runoff, the national flood guidelines for Australia (Ball et al., 2019), which establishes a baseline of historic probabilistic flood estimates with which to compare climate change impacts. This differs from the 1850–1900 pre-industrial baseline period relevant to the Paris Agreement resulting in a difference of approximately 0.3 °C of global warming between the pre-industrial baseline period and the 1961–1990 historic period used here.
Climate change impacts on floods were examined by comparing outflow flood frequency curves derived from event-based modelling using information on rainfall depth, storm temporal patterns, and rainfall losses, as described above and in Appendix A. Historical dam operations are assumed to remain unchanged – we use the same relationships between reservoir height and outflow provided by the dam owners for assessments of overtopping probability under both historical climate and global warming. We also assume that land cover is unchanged under climate change as this is beyond the scope of this study. Surface roughness is assumed to be constant as the catchments used in this study are predominantly natural river channels where changes in slope and roughness tend to compensatory (Laurenson et al., 2010). Investigations into climate change impacts on the spatial distribution of rainfall have shown that the spatial extents of storms are changing (e.g. Chang et al., 2016; Ghanghas et al., 2023, 2024; Lochbihler et al., 2017; Wasko and Sharma, 2017) but results are as yet inconclusive and storm spatial patterns are therefore unchanged in this study. The historical AEP of the dam crest flood ranges from to across our 18 case studies. We therefore report the impacts of climate change on overtopping probability in terms of the relative shift in the annual exceedance probability (AEP) of the Dam Crest Flood (DCF) computed under historic (1961–1990) and future climatic conditions. The DCF is the flood event which, when routed through the dam storage, results in a peak water level that just reaches the crest level of the dam. The exceedance probability of the DCF is thus indicative of the probability that the dam is overtopped by a flood. Reporting climate impacts in terms of the relative shift in the overtopping flood probability provides a non-dimensional metric that facilitates comparison across dams of different sizes and configurations, though it should be stressed that this metric should not be directly equated with the risk of dam failure as dams vary in their ability to accommodate overtopping for different depths and durations.
We calculated the relative shift (RS) in the probability of overtopping as follows:
where AEPDCF,p is the projected annual exceedance probability of the notional DCF under increased mean global temperature, and AEPDCF is the annual exceedance probability of the DCF under historic conditions. The metric indicates the projected change in overtopping probability due to climate change, where a value of RS larger than 1 indicates an increased frequency of overtopping floods, while values less than 1 represent a decreased frequency. For example, if the probability of the notional DCF under historic climatic conditions is estimated to be 1 in 1 000 000, and the corresponding probability under future climate is estimated to be 1 in 500 000, the relative shift (RS) is 2.0; that is, the probability of a flood overtopping a dam is projected to double for the adopted climate scenario. Conversely, if the estimated AEP of the DCF under climate change is 1 in 2 000 000, then probability of overtopping floods halves (i.e. RS=0.5).
The impacts of climate change on the overtopping probability were assessed using rates of change (or uplift factors) that varied with the degree of global warming, as applied to storm depth, temporal patterns and initial losses. Our assessment of climate change impacts was conditioned upon changes in mean global temperature as this is the primary driver of changes in atmospheric circulation and moisture availability, which is also well simulated in general circulation models (Graham, 1995). Assessing the impacts of climate change with respect to increases in global temperatures also enables results to be translated to scenarios of climate change, future time horizons, and associated rates of global warming that are of interest to the dam owners. For example, our results based on a 4 °C increase in mean global temperature approximates a high emissions scenario towards the end of the 21st century (see Fig. 3). The rates of change used here to represent climate change impacts are consistent with the information provided from a systematic review, metanalysis, and summary by Wasko et al. (2024a, b), which were based on studies that employed outputs from global and regional climate models to calculate the impacts of global temperature increases on flood factors.
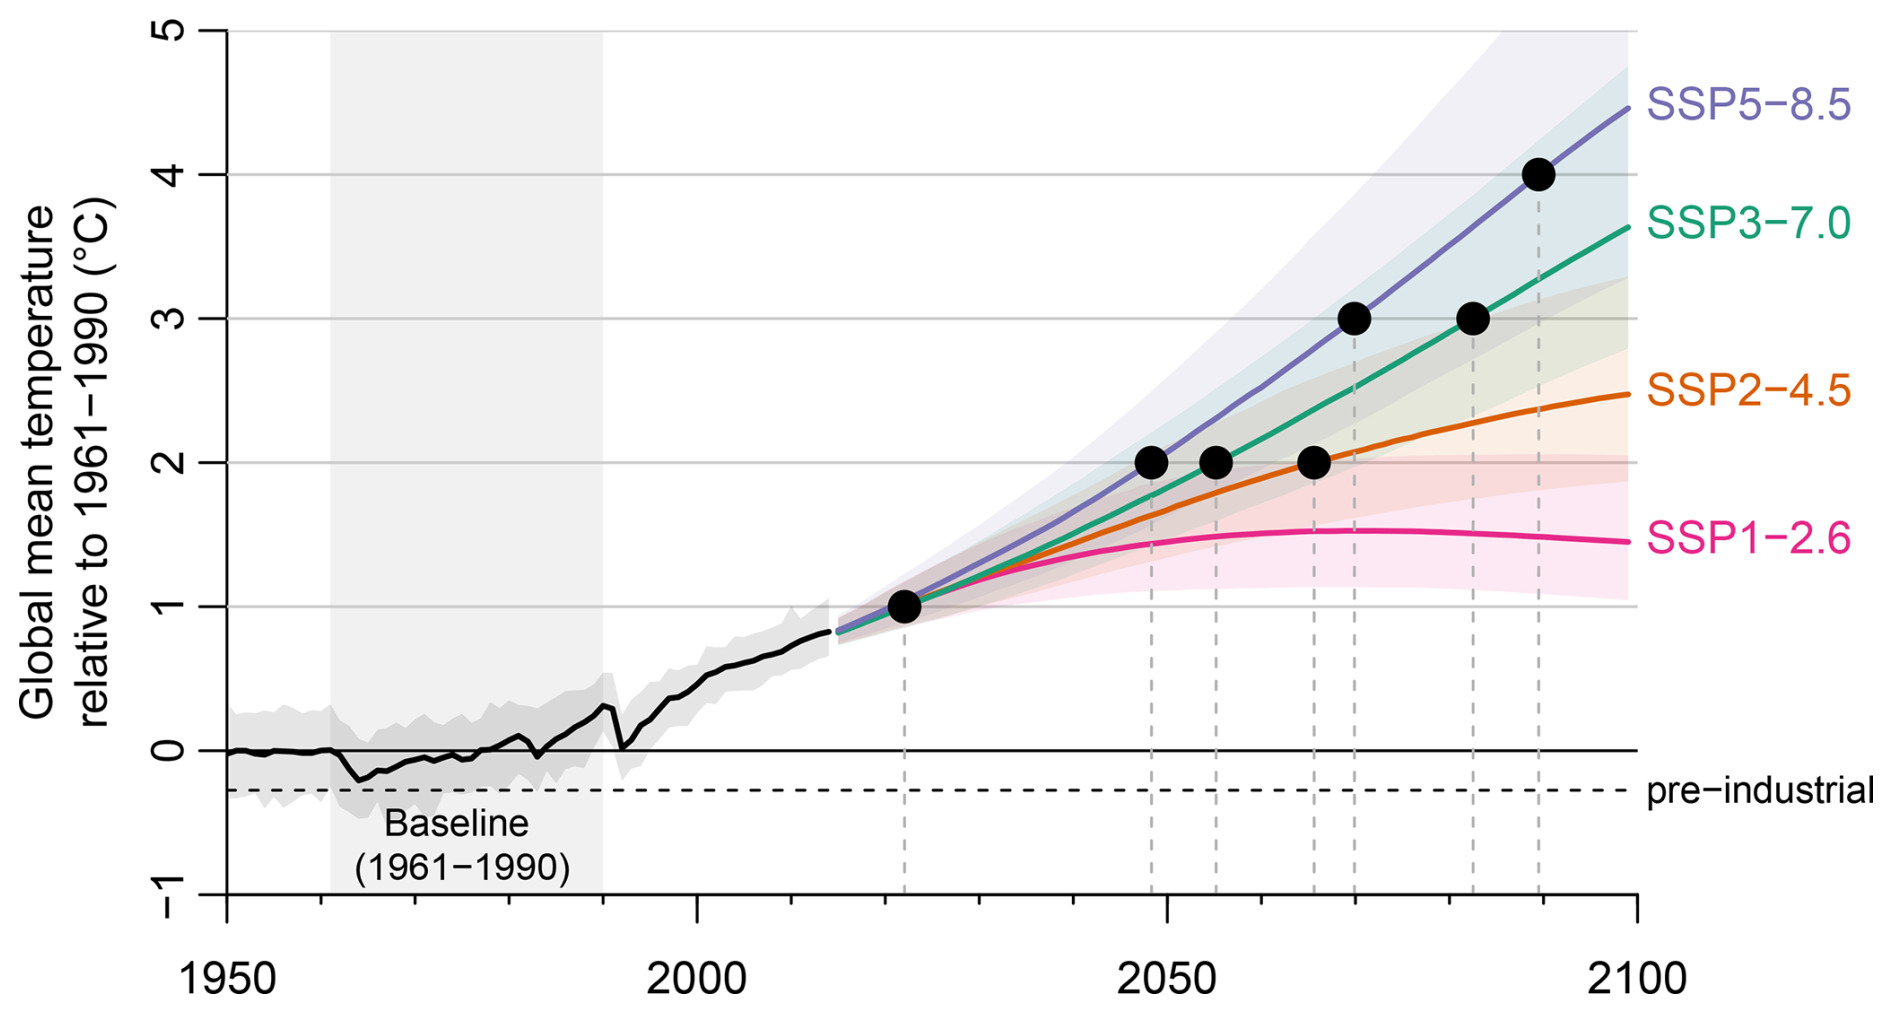
Figure 3Projected temperature increases associated with AR6 shared socioeconomic pathways relative to 1961–1990 and their associated uncertainties. Incremental increases in mean global temperature are plausible as a result of different climate scenarios at different future time horizons as shown by (solid black) circles for 1–4 °C increases. Data from Fyfe et al. (2021) in IPCC (2021b).
The rates of change in response to increases in global temperature of 1–5 °C in 1 °C increments were first applied to each flood factor individually with the two remaining flood factors reflecting historical values and flood frequency estimates were subsequently recalculated (refer to Fig. 2). The flood frequency estimates were again recalculated using inputs of rainfall depth, temporal pattern, and losses that were all adjusted to consider changes in global temperature. The range of global warming explored was chosen to facilitate the interpretation of the results under a variety of global climate change scenarios and commonly considered future time horizons. The rationale for the rates of change used to adjust the flood drivers under global warming are provided below.
2.3.1 Rainfall depth
There is substantial evidence that rainfall depths increase with increased global temperatures (Ali et al., 2021; Allan and Soden, 2008; Emori and Brown, 2005). In Australia, the relationship between temperature and rainfall has been investigated using both observed records (Hardwick Jones et al., 2010; Herath et al., 2018; Zhang et al., 2019) as well as modelled results (Chevuturi et al., 2018; Ju et al., 2021). Investigations into the association of rainfall with temperature in Australia have typically yielded results where the central tendencies of daily rainfall changes are in accordance with the Clausius-Clapeyron relationship, with greater associations found for rainfalls with shorter duration and those in tropical regions (Magan et al., 2020; Visser et al., 2021; Wasko et al., 2018). The impact of increased temperatures on rainfall depth in Australia have been found to be consistent with investigations elsewhere in the world (e.g. Allan and Soden, 2008; Gutiérrez et al., 2021).
Evidence from both observed and modelled results motivate efforts to update IDF estimates (Jayaweera et al., 2023; Schlef et al., 2023) and there has been recognition that this also applies to estimates of the probable maximum precipitation (PMP) (Kunkel et al., 2013; Salas et al., 2020; Wasko et al., 2024b), which is the theoretical maximum precipitation for a given duration and location (WMO, 2009). To date, changes in atmospheric water vapour content, at rates that approximate the Clausius-Clapeyron relationship, have been identified as the primary driver of increased PMP estimates, while evidence of, and the ability to resolve, changes in storm efficiency have been limited (Kunkel et al., 2013). Although statistical and hydrometeorological methods of estimating PMP yield similar results (Hershfield, 1965), estimates of the PMP are invariably dependent on the method and assumptions used to derive them. Adopting the operational procedure used by the relevant jurisdiction's authority is therefore essential to producing an appropriate historical baseline and projections of the PMP under climate change (Stratz and Hossain, 2014).
In Australia, generalised methods are used to derive estimates of the PMP as advocated by WMO (2009), which allow for data to be drawn from larger spatial regions to inform local estimates (see PMP zones in Fig. 1) by considering similarities in atmospheric dynamics and topography and thus the mechanisms driving extreme rainfall (WMO, 2009). Visser et al. (2022) assessed climate change impacts on PMP estimates using the operational methods used by the Bureau of Meteorology, Australia's national weather, climate, and water agency. In their study, it was found that persisting increases in dewpoint temperatures as a surrogate of atmospheric moisture content (Roderick et al., 2020) drive increases in PMP estimates and subsequent projections of dewpoint temperatures yielded increases in PMP estimates under climate change slightly above the Clausius-Clapeyron relationship. The findings of Visser et al. (2022) are in agreement with international and global findings of climate change impacts on PMP estimates (Kao et al., 2019; Kim et al., 2022, 2024; Rastogi et al., 2017; Rouhani and Leconte, 2020).
We therefore assessed changes in storm depth based on a rate of change of 8 % °C−1 for critical storm durations 24 h or longer. A rate of change of 9 % °C−1 and 8.4 % °C−1 for 12 and 18 h storm durations respectively. Our adopted rate of change factor is consistent with the results examining changes in rainfall depth and PMP depth with temperature in Australia and are recommended in Wasko et al. (2024a) based on a systematic review of observed historical trends, relationships between extreme rainfall and temperature and results modelled using both general circulation and regional models. The rate of change factor was applied as follows in Eq. (2):
where Ip is the projected rainfall depth, I is the historical design rainfall depth or intensity (e.g. from historic IDF curves or PMP estimates), α is the rate of change in units of % °C−1, and ΔT is the change in global (land and ocean) temperature.
2.3.2 Storm temporal patterns
The PMP zone-specific temporal patterns for each dam were used to estimate the baseline flood frequency (Bureau of Meteorology, 2006; Green et al., 2005; Nathan, 1992; Walland et al., 2003) (the temporal patterns for the case studies are shown in Fig. A1 in Appendix A). These temporal patterns are comprised of around ten storm patterns for different durations and different standard catchment areas. Information on how storm temporal patterns are expected to change in a warming climate were derived from Visser et al. (2023). The changes in storm temporal patterns were examined using a measure of the proportion of the storm event duration at which 50 % of the cumulative precipitation has occurred, denoted D50, where values of D50 range between 0 % and 100 %. Storms with a D50 value of less than 50 % are classified as “front-loaded events”, while D50 values greater than 50 % are “rear-loaded” events. It is expected that under climate change D50 values will slightly decrease in most regions meaning that storms are predominantly becoming more frontally loaded.
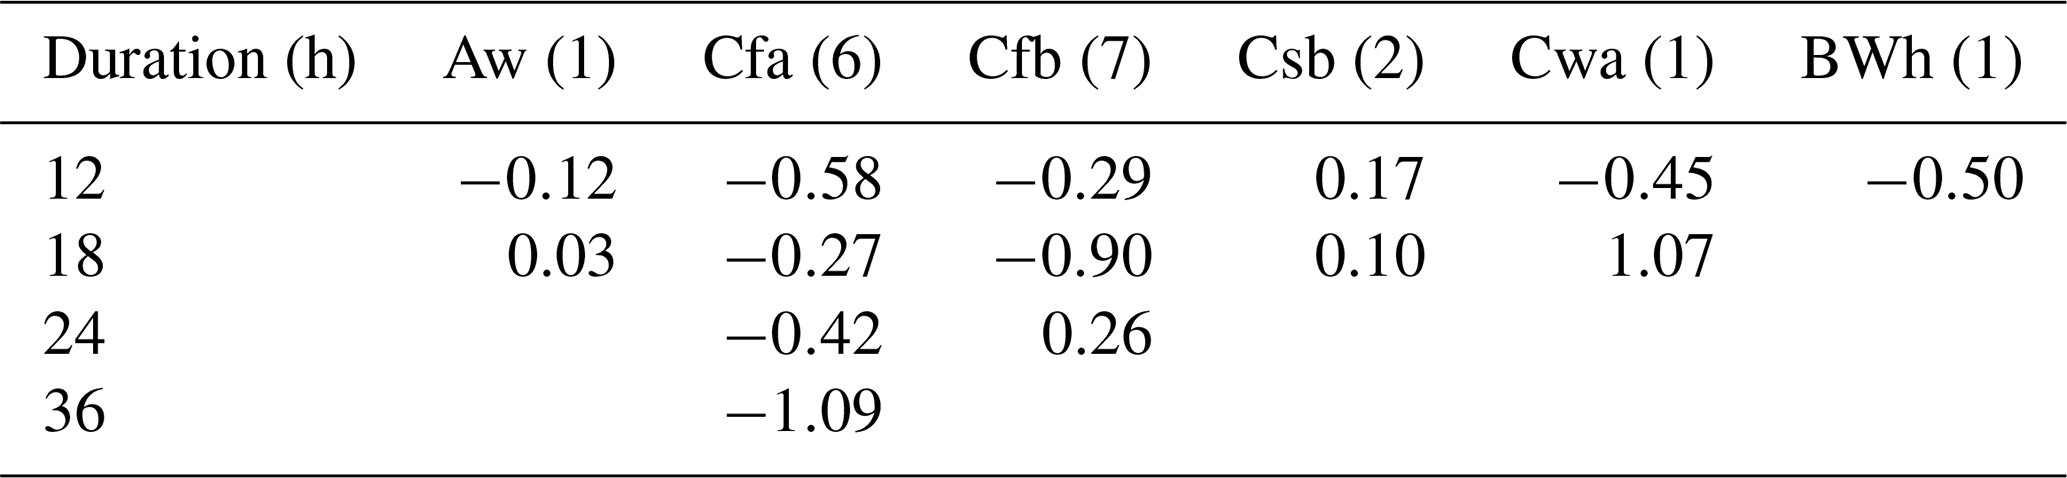
Climate change impacts on storm temporal patterns were assessed using the Köppen-Geiger zone-specific rate of change factors (% °C−1) from Fig. 9 in Visser et al. (2023). These rate of change factors are shown in Table 2 for the climate zones (with zones defined by historical climate) and storm durations relevant to this study that were calculated in Visser et al. (2023). The rate of change factor for the longest duration storm was adopted when the critical duration storm exceeded the length of storms analysed in Visser et al. (2023). The calculation of the percentage change in D50 is shown in Eq. (3).
where αD50 is the rate of change factor for D50. The change in D50 was calculated in response to 1 °C increases in temperature and rounded to the nearest percentage change. For example, applying a temporal pattern rate of change factor of −4 % °C−1 under a 4 °C increase in global temperature would result in a ΔD50 of −15 %.
Table 2Rate of change factors for storm temporal patterns by Köppen-Geiger zone (Aw: Equatorial, dry winter; Cfa: Warm temperate, fully humid, hot summer; Cfb: Warm temperate, fully humid, warm summer; Csb: Warm temperate, dry, warm summer; Cwa: Warm temperate, dry winter, hot summer; BWh: Arid, desert, hot). Numbers in parenthesis show the number of dams located in each zone.
For Monte Carlo simulations under historic climate conditions, the influence of natural variability in temporal patterns is accounted for by randomly selecting patterns from the available ensemble using a uniform distribution. To account for the tendency for storm patterns to become more front-loaded with warmer global temperature, the temporal patterns were sampled non-uniformly in order to achieve the targeted average shift in D50 as shown in Eq. (4):
where n is the number of temporal patterns, wi is the weighting of the ith temporal pattern where when ΔD50≠0, and D50,i is the D50 of the ith temporal pattern. In a uniform sampling of the temporal patterns and ΔD50=0. The weights needed to achieve the target ΔD50 were determined using a random sampling of 10 000 sets of weights such that , whilst minimising var(D50) to ensure as even a sampling of temporal patterns as possible to achieve the targeted shift in D50 to an accuracy of 10−5.
2.3.3 Rainfall losses
Projections of changes in initial and continuing loss were undertaken, respectively, for 205 and 273 catchments across Australia (Ho et al., 2023). The catchments included in the study by Ho et al. (2023) were those where a statistically significant relationship (at a significance level of α=0.05) was found between losses and antecedent soil moisture. Across most of Australia, rainfall losses are projected to increase under all climate change scenarios, with the largest increases seen for higher emission scenarios further into the future. Some exceptions included areas of western Tasmania and north-east Queensland where rainfall losses are projected to decrease slightly.
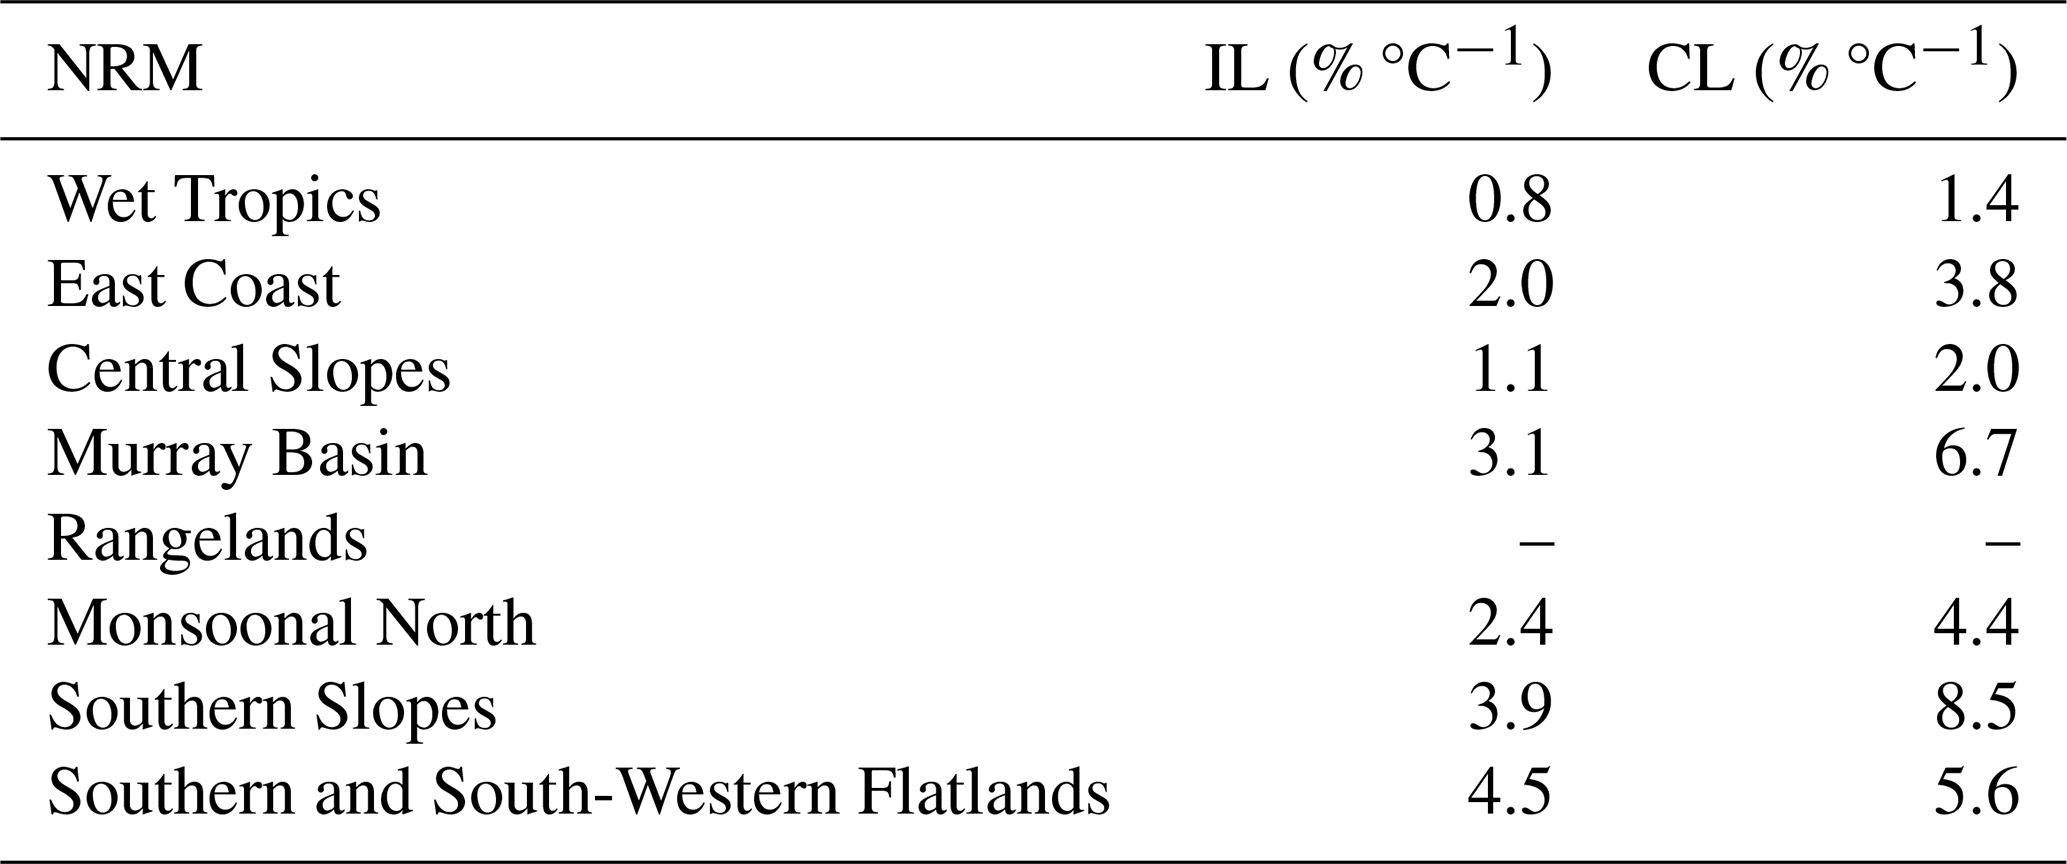
Projections of changes in rainfall losses were averaged over regions with similar hydroclimatic characteristics, termed “Natural Resource Management” (NRM) regions. These region-specific rainfall loss rates of change were derived from the results of Ho et al. (2023) but only used data from events that were equalled or exceeded on average once per year (1 EY), as opposed to the results presented in Ho et al. (2023), which included more common 5 EY events. The revised event selection was made here to help exclude the more frequent events where the soil moisture deficit may not have been fully satisfied by the incident rainfall. These regionally aggregated rainfall loss rates of change are documented in Wasko et al. (2024a) and are shown in Table 3 for the NRM regions relevant to the dams considered in this study. There was insufficient data to project changes in losses in the Rangelands NRM region. Consequently, values from the Monsoonal North NRM region were adopted as this was the closest proximity NRM region to the dam located in the Rangelands NRM region. The rates of change were applied to the mean parameter of the initial loss and to the constant value of the continuing loss.
Table 3Rates of change for rainfall losses, initial (IL) and continuing loss (CL), by Natural Resource Management (NRM) region.
We derived flood frequency curves in response to changes in the three different flood drivers (rainfall depth, rainfall temporal patterns, and rainfall losses), individually and combined, for each case study catchment, considering increases in global temperature of 1–5 °C. The increases in global temperature are relative to a baseline time period of 1961–1990 and present day global temperatures are estimated to be more than 1 °C above this baseline (see Table B1 in Appendix B). An example of the shifts in the derived flood frequency under climate change is shown for one of the catchments in north-east Australia in Fig. 4 (the results are anonymised here to avoid any inferences being made about the risk of overtopping to downstream communities). The red dashed horizontal line shows the outflow rate corresponding to the notional dam crest flood (DCF), the black curve represents the flood frequency curve under historical climatic conditions, and progressively darker grey lines show results for increasing degrees of global warming.
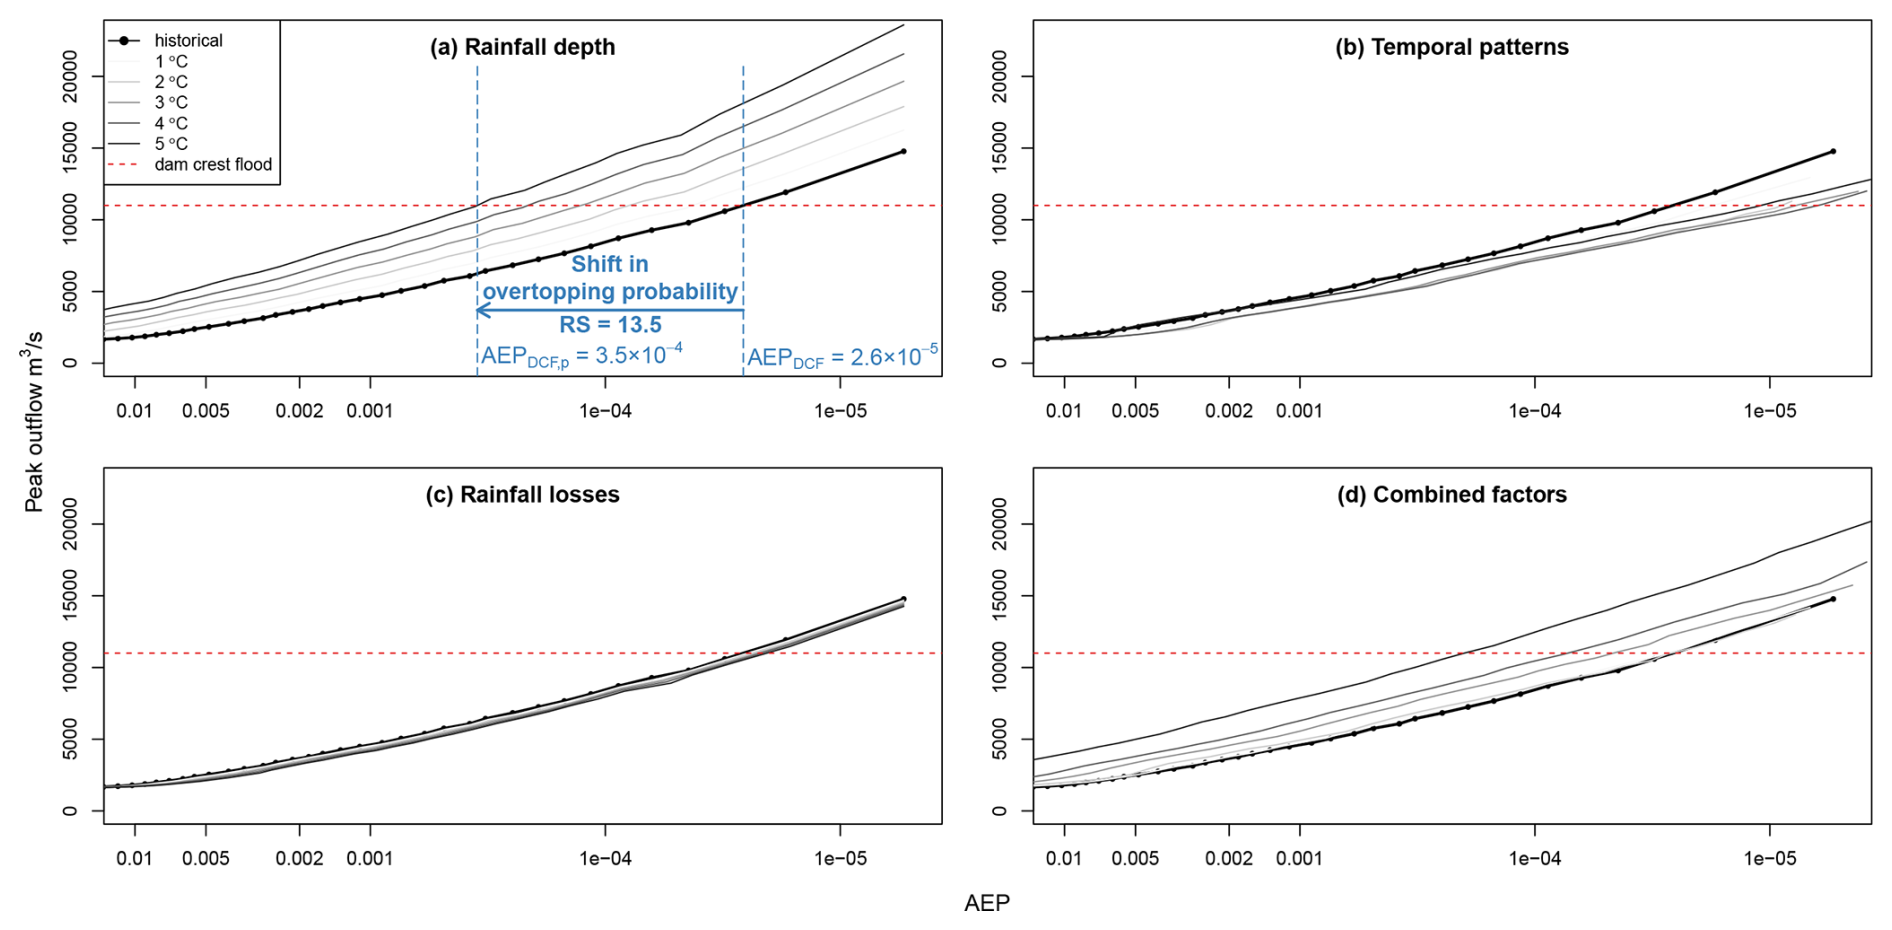
Figure 4Example of derived outflow flood frequency curves resulting from changes in the flood driver of (a) rainfall depth; (b) temporal patterns; (c) rainfall losses; and (d) a combination of all three flood drivers.
The shift in the reservoir outflow flood frequency curve resulting from changes in storm depth under different degrees of global warming is shown in Fig. 4a with darker lines showing flood frequency curves corresponding to higher degrees of global warming. The arrow shows the change in overtopping probability under 5 °C of global warming that can be similarly interpreted at the intersection of the dam crest flood and flood frequency curves for different degrees of global warming. The adopted rate of change value for precipitation depth in response to climate change is positive, meaning that rainfall depths are estimated to increase with increasing temperature. The derived flood frequency curves considering changes in rainfall depth under climate change are consequently steeper than the historic flood frequency curve representing an increased probability of the DCF being exceeded. The steeper flood frequency curves in response to changes in storm depth seen for this example in Fig. 4a are representative of the changes obtained due to increases in rainfall depths across all the case studies. In this example, the probability of exceeding the DCF is (approximately 1 in 38 500) under historical climate conditions. This probability increases to under a 5 °C increase in global temperatures resulting in the relative probability of overtopping increasing by 13.5.
The effect of changes in storm temporal patterns under global warming on the outflow flood frequency curve for this example case study site is shown in Fig. 4b. In this example, the rate of change for the storm temporal patterns was negative, meaning that storms will become increasingly front loaded under climate change resulting in the probability of exceeding the DCF decreasing. However, the decreases in the probability of exceeding the DCF were not continuous with increases in global temperature. At this site, a global temperature increase of 4 °C resulted in the largest change in overtopping probability. In addition to both the sign and magnitude of the temporal pattern shift the impact of changes in storm temporal patterns on floods are dependent on a catchment's time of concentration and existing storm attributes. As a result, the direction of change in the probability of extreme floods resulting from changes in storm pattern are specific to each catchment.
Shifts in the AEP of dam overtopping floods in response to changes in rainfall loss under climate change are shown in Fig. 4c. For this site, the increases in rainfall losses are small relative to the design rainfall depths at the probabilities of interest to the DCF resulting in a very small decrease in the probability of floods exceeding the DCF under climate change. The impact of changes in rainfall losses differed in magnitude between catchments in different regions. As seen in Table 3, the rates of change range from 0.8 %–4.5 % °C−1 for initial losses and 1.4 %–8.5 % °C−1 for continuing losses and the resulting decreases to the probability of exceeding the DCF were notable for some locations.
The combined impacts of changes in storm depth, storm temporal pattern, and rainfall loss in response to 1–5 °C of global warming are shown for this example case study site in Fig. 4d showing an overall increase in the probability of floods exceeding the DCF. A comparison of Fig. 4a–c with Fig. 4d shows that changes in rainfall depth exert the largest influence over changes in flood frequency under climate change, a finding that was universal across the dams investigated. From these derived flood frequency estimates we calculated the relative shift in the probability of the DCF (see Eq. 1) to summarise the results recalling that values less than 1 represent a decreased probability while values greater than 1 represent an increased probability in floods exceeding the DCF.
The shifts in overtopping frequency due to each flood driver are shown as box plots in Fig. 5a–c with Fig. 5d showing the response to the combined impacts of all three flood drivers. Each box plot is a summary of the results across the 18 dams. Global temperatures are currently more than 1 °C above the baseline time period used in this study and the probability of exceeding the DCF has already increased by up to 2.2 times and has more than doubled for two of the dams. For each flood driver, five box plots are shown representing increasing degrees of global warming. Similar to the results shown in Fig. 4, a comparison between Fig. 5a and d show that the AEP of the dam crest flood resulting from changes in all the flood drivers is most influenced by changes in the rainfall depth. However, the differences between Fig. 5a and d also reveal that the effects of changes in temporal patterns and rainfall losses are not negligible, despite their relatively small impacts when considered individually (see Fig. 5b and c noting the different scales on the y-axes compared to Fig. 5a and d). Interestingly, while the impacts of rainfall losses on reducing the probability of a dam crest flood are magnified with increased global warming, the impact of changes in temporal patterns do not necessarily change uni-directionally with increased global temperature. In addition, the direction of change in the storm temporal pattern was not indicative of the direction of change in the derived flood frequency curve. All catchments show decreases in the probability of a dam crest flood in response to 1–3 °C global temperature increases, while some of the catchments experience an increased probability of flooding under 4–5 °C of warming. These results indicate that changes in peak outflows in response to changes in temporal patterns are catchment specific and likely dependent on the catchment's time of concentration and other storm attributes such as the spatial distribution of rainfall.
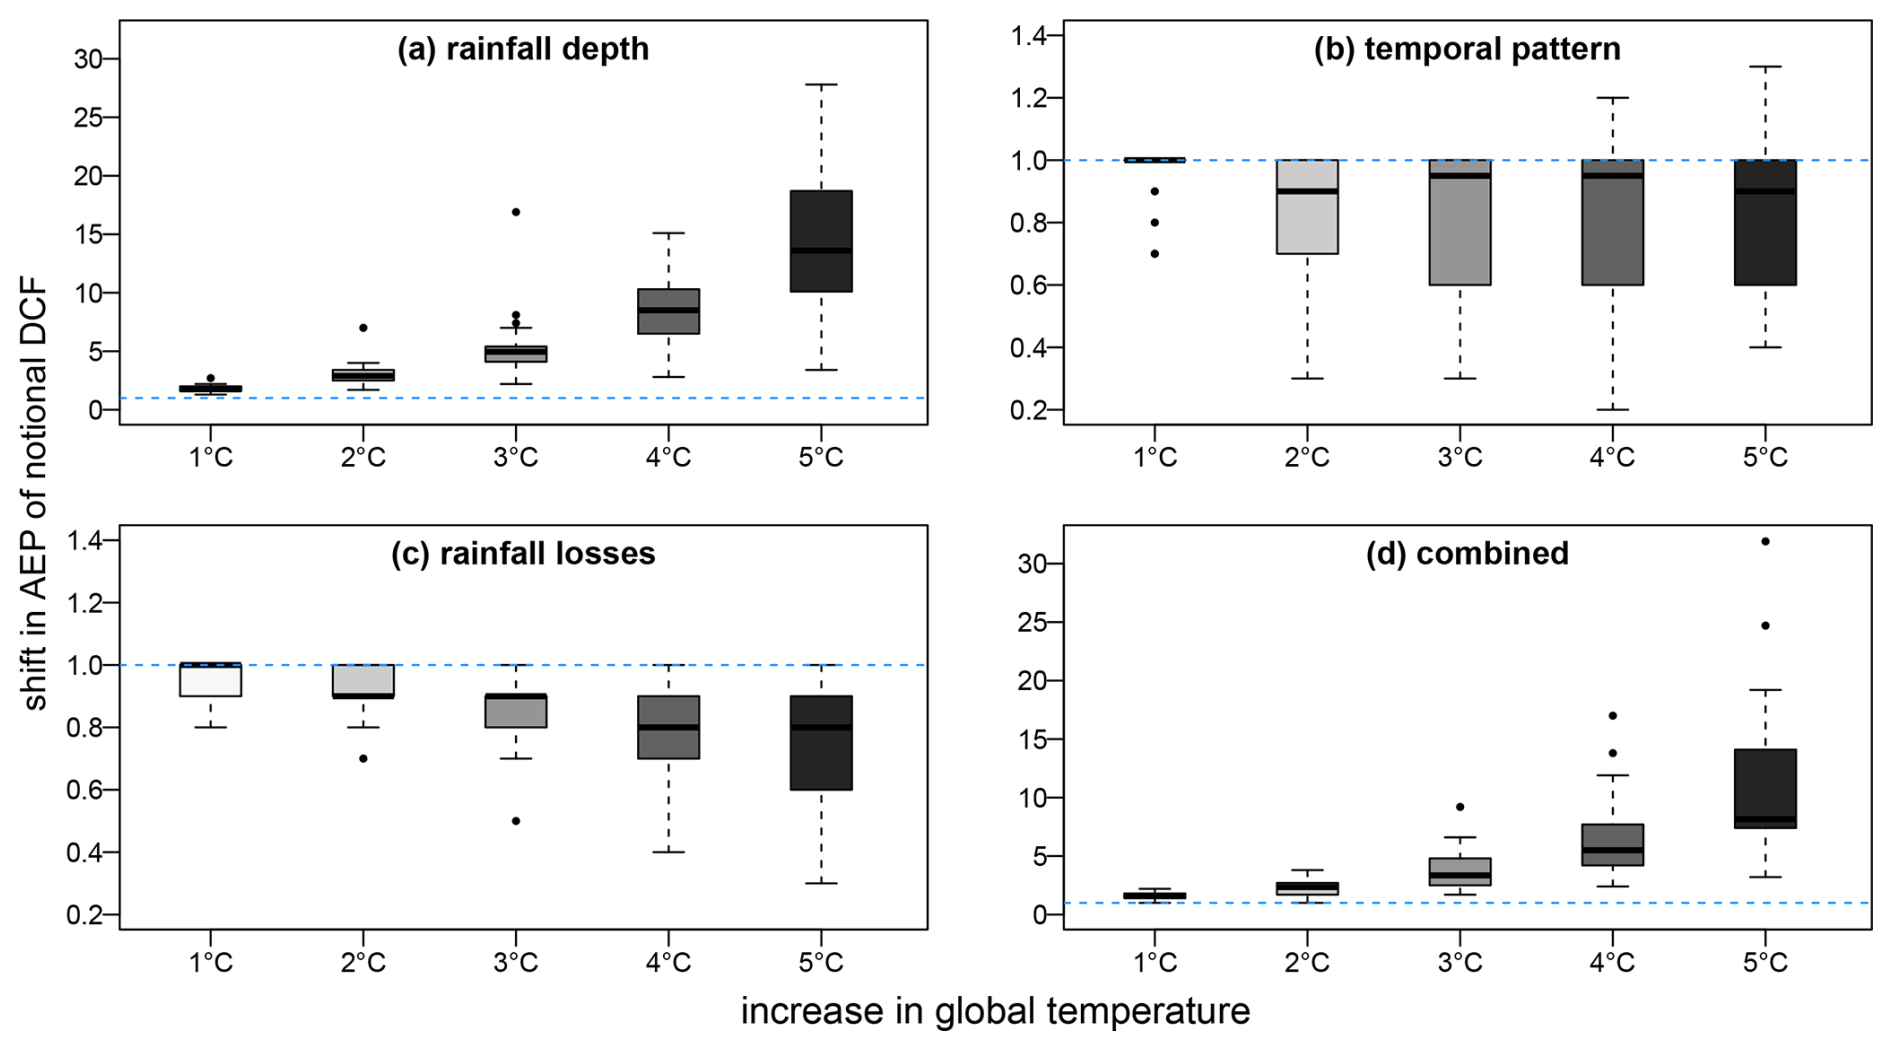
Figure 5Box plots of the relative shift in the annual exceedance probability (AEP) of the dam crest flood (DCF) for all 18 dams resulting from changes in (a) rainfall depth, (b) temporal pattern, (c) rainfall losses, and (d) all three flood drivers combined. Box plots show the median and interquartile range (IQR). Whiskers show the minimum and maximum values that lie within 1.5 times the IQR of the median value. Dashed blue line represents the historical baseline.
Overall, the impact of global warming increases the exceedance probability of the DCF at most locations, noting that a temperature increase of 1 °C approximates present conditions due to the baseline period of 1961–1990 adopted here (see Table B1 showing projections of global mean surface temperature changes for the current and near term period). The degree to which climate change is projected to increase the probability of a flood exceeding the DCF appears to be catchment- and dam-dependent. For example, Fig. 5d shows that under a 4 °C increase in global temperature, which approximates projected temperatures towards the end of the 21st century under medium to high emission scenarios (see Fig. 3 and Table B1), the probability of overtopping due to all drivers combined ranges from 2.4 to 17 times (median of 5.5) greater than the historic probability across the different dams.
It is necessary to translate knowledge from the realms of scientific theory, investigation, and experimentation to practice (Kiem and Austin, 2013). The estimation of flood frequency under climate change is a challenging endeavour due to the dynamic nature of flood mechanisms even under stationary climate assumptions. Yet projecting flood frequency under climate change is critical to ensuring that the risk is adequately managed particularly in high hazard systems with long (i.e. several decades to century-long) economic lifespans, such as large dams and nuclear power plants, which need to withstand extreme flood events under both current and future climate conditions. A scientific review aimed at consolidating the available information relevant to estimating floods under climate change in Australia was recently conducted by Wasko et al. (2024b) and the findings from the review were used to inform the rates of change used in this study. The work presented here was undertaken contemporaneously to an update of the Australian flood guidelines (Wasko et al., 2024a) also based on the summary findings of Wasko et al. (2024b) while another study by O'Shea et al. (2024) focused on more frequent events. The exchange between developing the new guidelines and the study presented here and that of O'Shea et al. (2024) was intended to ensure the practicality of the new guidelines, demonstrate an approach that could be translated globally for estimating flood frequency under climate change elsewhere in the world, as well as providing insights into the impact of climate change on floods for the case studies.
The 18 case studies considered here represent a broad sample of catchment and dam sizes, with all dams meeting the ICOLD classification of large dams (ICOLD, 2011), located across a range of climate zones. We found that changes to the probabilities of overtopping floods were most sensitive to changes in precipitation depth in response to global warming across all dams. While changes in temporal patterns and rainfall losses had a relatively smaller impact, they were not inconsequential. For many of the smaller catchments located in the southern temperate regions of Australia changes in rainfall losses and temporal patterns moderated the increased flood probability resulting from increased rainfall depth under climate change. It is also plausible that shifts in temporal patterns and rainfall losses will be more critical for more frequent floods compared with the extreme floods considered here, where changes in the extreme rainfalls relevant to overtopping floods overwhelm the changes in rainfall losses or temporal patterns. A supporting result was found in a study by O'Shea et al. (2024) focused on frequent (i.e. 1 in 5 AEP) and rare (i.e. 1 in 50 AEP) floods in response to climate change impacts on rainfall depth and rainfall losses. They found that flood peaks were more sensitive to climate change for more frequent floods compared with rare floods. O'Shea et al. (2024) also found a heightened sensitivity in the catchment located in a temperate climate compared to the catchment located in a tropical region. The increased sensitivity in response to shifts in rainfall losses can be attributed to the smaller runoff ratios associated with more frequent flood events as well as the smaller runoff ratios typical of Australian catchments located in temperate climates (Wasko and Guo, 2022), which make them more sensitive to changes in rainfall losses.
The ability to generalise likely climate change impacts on relative changes in the probability of overtopping floods based on dam-specific attributes, such as climate zone, catchment size, rainfall-runoff characteristics, reservoir capacity, and the configuration of outlet works (e.g. whether dam outflows are controlled by gates or fixed crest spillway) would be a valuable finding. Thus far, the sample size of catchments investigated both here and in the study by O'Shea et al. (2024) are insufficient to definitively conclude whether sensitivities in flood frequency under climate change can be associated with specific catchment characteristics, or, for this study, specific dam characteristics. The feasibility of future studies that considers a larger sample size of dams will be dependent on the availability of data and confidentiality requirements related to dam operations. At present, projecting estimates of the probability of dam overtopping floods as an indicator of dam failure requires a thorough site-specific investigation. Such an investigation is possible provided the availability of data to adequately model the rainfall runoff response and dam operations as well as the collation of climate change data relevant to regional changes in rainfall intensity, duration, and frequency, storm temporal patterns, and rainfall losses.
We used a conservative assumption that reservoirs are at full supply level prior to the storm, an assumption that provides a worst-case scenario with respect to the subsequent estimation of outflow flood frequencies. The interaction between increased reservoir airspace prior to a storm and increased precipitation depth under climate change has yet to be explored in the context of examining overtopping probability for the dams in this study. Such an investigation would require projections of the marginal distribution of the initial reservoir level under climate change for each dam. Initial reservoir levels are dependent on dam operational procedures that may be modified by the dam owner and such decisions are subject to social, economic, and political factors making them highly uncertain. It is anticipated that, all other things being equal, climate change will likely result in larger demands for water resulting in increased drawdown and evaporation of reservoirs prior to floods thereby increasing the potential for dams to attenuate floods, while impacts on the frequency and depth of storms will modify reservoir recharge. Indeed, the study by Lompi et al. (2023) for a dam in northern Spain showed that the near-term (2040) overtopping probability was reduced under a moderate emission scenario as a result of increased reservoir airspace. Continuous flood models are well suited to assessing higher frequency flood events relevant to changes in water demand and supply, in contrast to event-based models used here to estimate extreme flood frequency relevant to the economic design life span of dams. However, the difference in time scales relevant to estimating changes in reservoir airspace (i.e. years to decades) means that the consideration of decadal variability, in addition to climate change, becomes pertinent (Kiem et al., 2003; Malakar et al., 2024; Micevski et al., 2006). Information from decadal climate forecasts could potentially be used to inform shifts in stochastic weather generators relevant to continuous flood modelling (Dykman et al., 2024; Steinschneider and Brown, 2013) or rainfall intensity frequency duration curves relevant to event-based modelling (Jayaweera et al., 2023). In addition to accounting for climate variability and change, a comprehensive model of reservoir airspace would also consider broad policy decisions regarding the augmentation of water supply, demand management, and population change, considerations that are in the realm of deep uncertainty.
The change in global temperature was used as the covariate for projecting impacts of climate change on the flood drivers considered in this study, an approach recommended by Kunkel et al. (2020). General circulation models are able to model temperature with a high degree of confidence at both global and regional scales (IPCC, 2021a). Our approach therefore capitalises on one of the more reliable outputs from modelling projections of climate change. The choice of using a global spatial scale was made to be both consistent with IPCC projections as well as being representative of the primary driver of changes in atmospheric circulation and moisture stores. While it may seem intuitive to employ regional, or more local downscaled, projections of temperature given their demonstrated fidelity in general circulation models, the use of temperature on smaller spatial scales as a covariate of extreme rainfall has yielded inconsistent results (Chan et al., 2016; Wang et al., 2017). In contrast, global temperatures have been found to be better predictors of Australian rainfall (Jayaweera et al., 2024; Roderick et al., 2020). Furthermore, conditioning our assessment of changes in flood frequency under climate change on global temperature mean that the flood assessment can be conducted independent of projections of climate change, which is an involved process that includes developing scenarios, evaluating the suitability of general circulation models, evaluating downscaling and bias correcting methods, and selecting a manageable and representative suite of ensemble runs to consider. Our results, based on changes in global temperature, can then be mapped to various scenarios of climate change for any future time horizon as shown in Fig. 3. There is, however, value in finer spatial resolution numerical models in estimating flood frequency under climate change for new dam sitings as local climate impacts resulting from changes in land use and land cover have been shown to result in increases in estimations of the PMP of over 10 % (Stratz and Hossain, 2014).
The work presented here provides a basis for estimating changes in overtopping probability resulting from changes in the salient flood drivers. Estimating the probability of overtopping floods under climate change can be used to inform broader assessments of compounding dam risk that include consideration of rates of sedimentation and changes in the exposure of downstream populations and industries reliant on reservoir storages over time (Fluixá-Sanmartín et al., 2018). Such estimates can also inform decisions regarding relicensing or reoperating existing dams under climate change (Ho et al., 2017; Pittock and Hartmann, 2011; Watts et al., 2011). We note that our study was focused on climate change impacts on the frequency of dam crest floods across a sample of catchments. The granularity in representing the rainfall-runoff relationships and dam operations were therefore commensurate with this purpose. It is expected that dam owners would analyse their assets using more detailed and complex models of their catchments, dam operations, and potentially initial reservoir levels under climate change. In addition, our study only used the approximate central tendencies of the rates of change for adjusting rainfall depths, temporal patterns, and rainfall losses and only presented the best estimate of overtopping probability under climate change. We recommend that future studies explore the relative sources of uncertainties associated with the rates of change used for considering climate change and existing aleatory and epistemic uncertainties.
In addition to developing sound guidelines for practitioners to implement, the challenge of communicating and improving the understanding of flood risk in the broader population remains (Pielke, 1999) and with it the need to improve the communication of flood risk (Read and Vogel, 2015). Updating estimates of flood frequency under climate change can also ensure ex post evaluations of flood disasters are appropriately informed and attributions to climate change are not erroneously made at the expense of identifying and resolving other factors (Doss-Gollin James et al., 2020). It is crucial that communications of flood risk occur in parallel with improving understanding of the intended utility of water infrastructure so that levels of public confidence and expectations with respect to the preventative capacity of flood infrastructure are reasonable (Lave and Lave, 1991). We demonstrate here that it is possible to estimate changes in extreme flood frequency under climate change, but there is a societal imperative to act upon this knowledge and to recognise our increasing exposure to flood risk that results in part from climate change but more broadly from an expanding portfolio of assets in flood zones (Kundzewicz et al., 2014) that can be motivated by perverse economic incentives (Gourevitch et al., 2023).
We present the first assessment of changes in flood-induced dam overtopping probabilities under climate change based on contemporary understandings of climate change impacts on key flood drivers. Our assessment explicitly considers climate change impacts on rainfall depth, storm temporal patterns, and rainfall losses and was conducted in a manner designed to be readily adopted in industry applications. We estimated projections of flood frequency conditional upon scenarios of increased mean global temperatures using event-based flood modelling and Monte Carlo simulation to consider the joint probabilities of the salient flood drivers.
For the 18 dams examined, we found that the impacts of climate change under 4 °C global warming increases the probability of floods exceeding the dam crest flood by 2.4–17 times (with a median value of 5.5) compared to estimates based on historic climate conditions. Furthermore, current levels of global warming relative to the period used to inform historic flood frequency estimates in Australia mean that the probability of floods exceeding the dam crest flood has already more than doubled for two of the 18 dams investigated. Of the three flood drivers considered, changes in extremely rare rainfall depths relevant to dam crest floods had the largest impact increasing the probability by around an order of magnitude for most dams under 4 °C of global warming. In contrast, the change in extreme flood frequency resulting from changes in temporal patterns were marginal and the magnitude of impacts appear contingent on how runoff is routed through the catchment. Changes in rainfall losses slightly decreased the probability of overtopping floods across all locations resulting in the impact of increased rainfall intensity being slightly dampened.
Given the complex interaction of flood drivers, it is currently not possible to provide heuristics for estimating changes in flood frequency under climate change based on attributes such as catchment location, climate zone, or catchment or dam size. Assessments of climate change impacts on flood frequency need to instead, at present, be assessed in a site-specific manner. Our study provides a practical and tractable approach for estimating extreme flood frequency and dam overtopping probability under climate change that aligns with approaches widely used by practitioners making it feasible to be adopted globally.
For each case study dam, a semi-distributed conceptual node-link model of the catchment was used to represent the storage and routing of streamflow, where nodes represent either the centroid of a subarea where rainfall is added or junctions in the conceptual stream network, and links represent the main tributary streams along which streamflow is routed. Such node-link networks provide a simplified characterisation of the drainage network and are commonly used in event-based modelling (Pilgrim and Cordery, 1993). The catchments were divided into sub-areas where rainfall was assumed to be uniform within each subarea.
The initial loss continuing loss model (ILCL) was used to partition rainfall into rainfall losses and runoff that is then routed through the catchment stream network. Rainfall losses are separated into two components being the initial loss, which represents the depth of rainfall required to sufficiently wet the catchment before runoff commences, and the continuing loss, which is the rate of rainfall loss that occurs once the initial loss has been satisfied through to the end of the rainfall event. The runoff, or rainfall excess, Xt, at each time step is expressed as shown in Eq. (A1):
Where P is the rainfall depth (mm) and the subscript t or i denotes the timestep (h), IL is the initial loss parameter, and CL is the continuing loss parameter (mm h−1). The ILCL model was selected from a range of commonly used rainfall loss models as it is recommended design flood estimation in Australia (Hill and Thomson, 2019) and it has been shown to be most suitable for applications where estimates are made for floods that exceed the magnitude of observations (O'Shea et al., 2021).
The rainfall excess was then routed through the catchment stream network using a non-linear storage routing power function based on continuity as shown in Eq. (A2). This was used to model the attenuation and delay of runoff (i.e. overland flow) from a subarea, the routing of a hydrograph through a reach, as well as the routing of a hydrograph through a reservoir.
where S is the storage (m3), Q is the outflow (m3 s−1), m is a dimensionless exponent, and k is a dimensional empirical coefficient. A value of m=0.8 widely adopted in general practice was used here and represents the degree of non-linearity in the catchment response. The coefficient, k, is the product of kc, which represents the relative storage and delay of streamflow of the catchment, and kr, which is the relative delay time of each reach storage: kc was obtained by calibration to observed flood events, while kr is dependent on the relative reach length. Baseflows were added to the reservoir inflows to account for delayed streamflow contributions from prior rainfalls (these were generally less than 1 % of the peak flows), and outflows from the dam were calculated using appropriate storage-outflow relationships representative of the dam storage configuration and outlet works.
The outflow flood frequency curve for each dam was derived in response to the critical duration storm using the Total Probability Theorem (Haan, 1974; Nathan et al., 2003; Nathan and Weinmann, 2019b). Rainfall depths were sampled by using a stratified Monte Carlo sampling over the standardised normal probability domain of rainfall depths. This stratified sampling enables rare rainfall events to be sufficiently sampled. Here, the rainfall distribution was stratified into 100 divisions with 200 samples in each division, thus each flood frequency curve was based on the simulation of 20 000 flood events.
The flood exceedance quantiles were then calculated using Total Probability Theorem as shown in Eq. (A3).
where Ci is the conditioning variable (i.e. rainfall) with values that fall within the ith interval, X is the calculated flood value and hence the term P(X>x|Ci) is the conditional probability that the flood outcome X generated from Ci exceeds x. The term p(Ci) is the probability that the conditioning variable falls within the ith interval.
In addition to the sampling of rainfall depths, temporal patterns were stochastically sampled using a uniform distribution from an ensemble obtained from observed storms (Green et al., 2019), and initial rainfall losses were sampled from an empirical distribution based on the findings of Hill et al. (2014). The temporal patterns are dependent on the location and size of the catchment as well as the critical duration of the storm. The temporal patterns used in this study are shown in Figure A1.
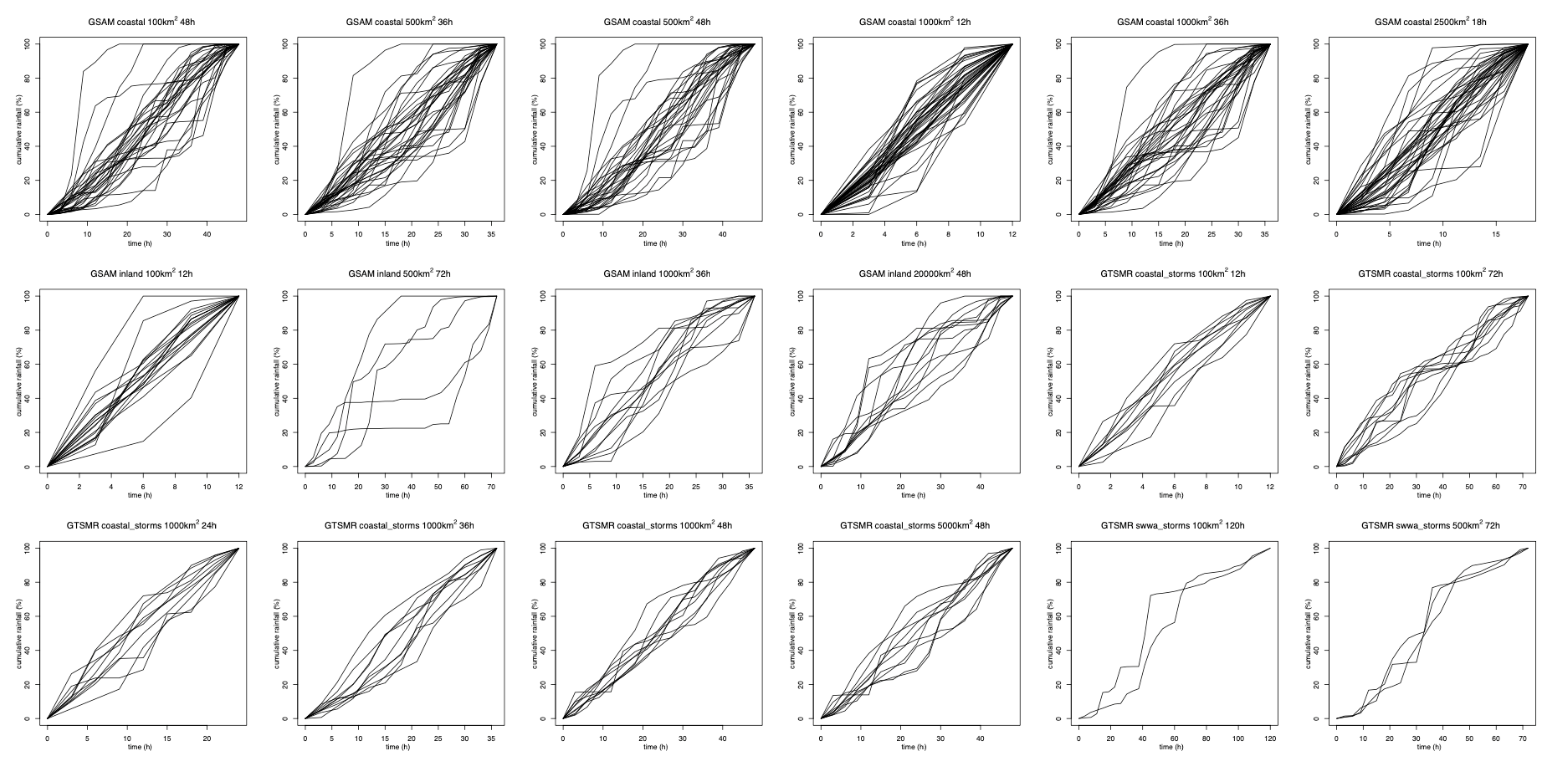
Figure A1Rainfall temporal patterns applied to the catchments upstream of the 18 case study dams.
The outputs of R2ORB were validated by comparing hydrographs simulated in both RORB and R2ORB in response to both a small and large rainfall event and by comparing the derived flood frequency curve for the critical duration storm. The validations were performed by initially setting both initial and continuing loss parameters to zero to ensure the catchment routing calculations were executed correctly. The coefficient kc was adjusted for R2ORB models that used a simplified network representation of the catchment. Simplified catchments were constructed by aggregating subareas and consolidating smaller reaches. The coefficient kc was manually adjusted in R2ORB to produce comparable hydrographs assessed using the Nash-Sutcliffe efficiency score. The hydrographs were then simulated again using median initial and continuing loss values and compared.
Table B1IPCC Sixth Assessment Report (AR6) global mean surface temperature change projections for four Shared Socioeconomic Pathway (SSP) climate scenarios relative to 1961–1990 baseline (which is notionally representative of the mid-point for much of the information used to derive the design information provided in ARR2019). The 90 % uncertainty interval is provided in parentheses∗.
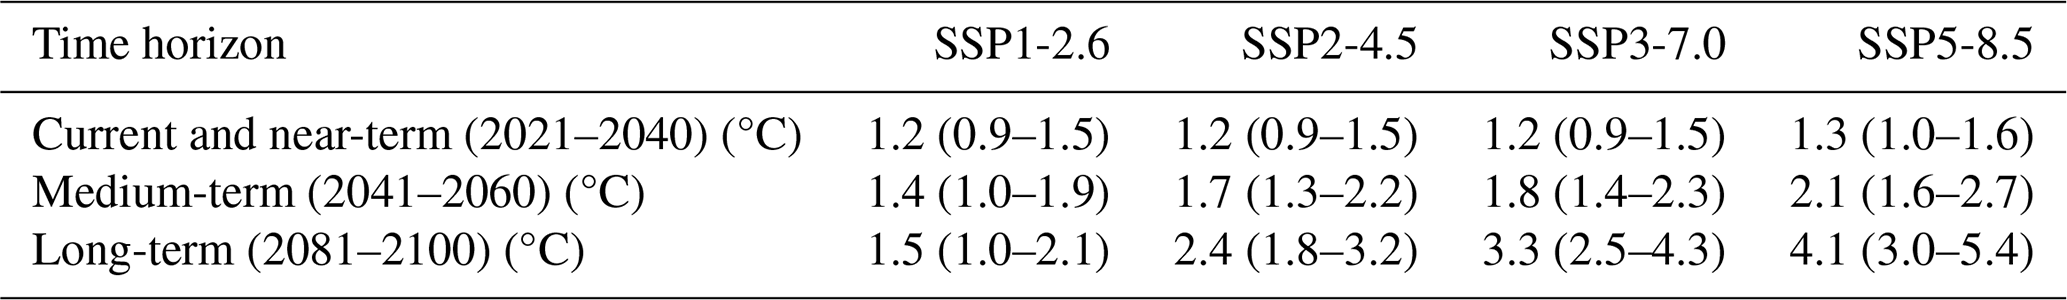
∗ Projections are adapted from the Summary for Policymakers of the Working Group I Contribution to the Intergovernmental Panel on Climate Change Sixth Assessment Report (Fyfe et al., 2021; IPCC, 2021b).
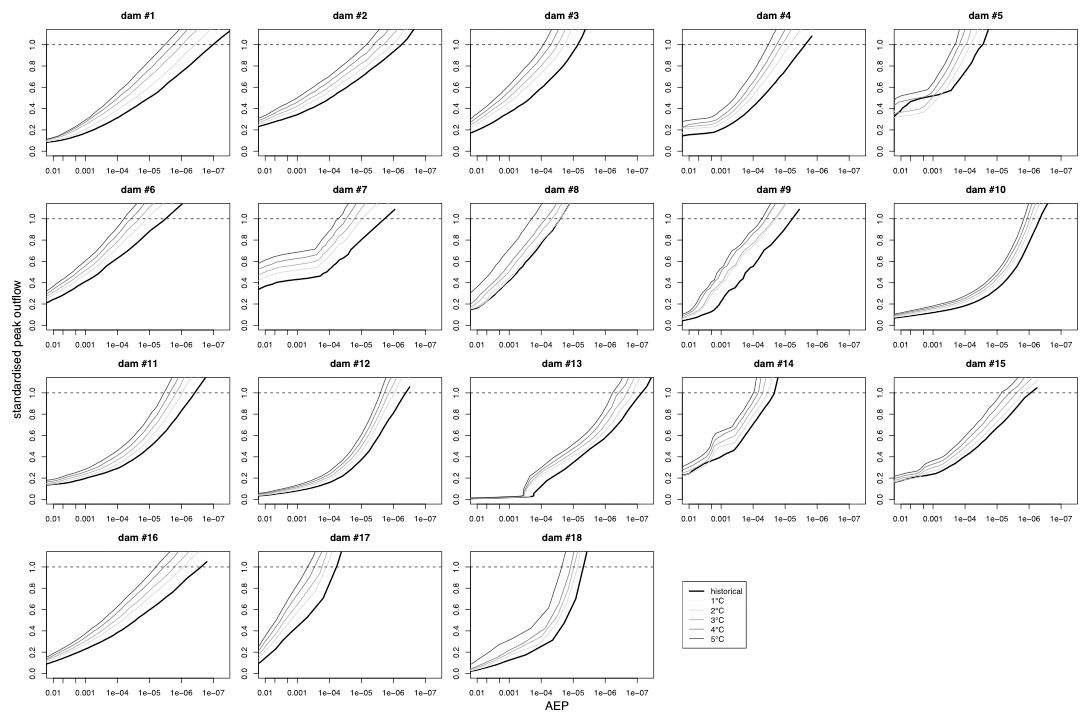
Figure C1Outflow flood frequency curves for historical conditions and climate change conditions resulting from a combination of all three flood drivers under 1–5 °C of global warming. Results anonymised for all 18 dams and outflows are standardised by the dam crest flood.
Software for implementing the RORB routing model in a stochastic framework can be freely downloaded from https://harc.com.au/software/rorb/ (last access: 23 October 2023), which provides a free, licensed, documented, and regularly updated product.
The HRS streamflow data set is publicly available from https://www.bom.gov.au/water/hrs/ (last access: 21 October 2021). Sub-daily rainfall data is available for a cost from the Australian Bureau of Meteorology or from the authors at reasonable request.
MH: conceptualisation, methodology, formal analysis, data curation, visualization; DOS: conceptualisation, methodology, data curation; CW: conceptualisation, methodology, data curation; RN: conceptualisation, methodology, formal analysis, software, resources, funding acquisition, project administration; AS: conceptualization, resources, funding acquisition, project administration. All authors contributed to the writing of the original draft, review, and editing.
The contact author has declared that none of the authors has any competing interests.
Publisher's note: Copernicus Publications remains neutral with regard to jurisdictional claims made in the text, published maps, institutional affiliations, or any other geographical representation in this paper. While Copernicus Publications makes every effort to include appropriate place names, the final responsibility lies with the authors. Views expressed in the text are those of the authors and do not necessarily reflect the views of the publisher.
Thanks to Matthew Scorah for processing the data for the temporal patterns. Catchment models used for verifying R2ORB were made available by the industry partners (listed here under “industry support”). This project was supported the Australian Research Council (ARC) Discovery Projects DP200101326 and industry support from the Queensland Department of Natural Resources, Mines and Energy, Hydro Tasmania, Melbourne Water Corporation, Murray-Darling Basin Authority, Seqwater, Snowy Hydro, Sunwater, West Australia Water Corporation, and WaterNSW. Declan O'Shea acknowledges the support of an Australian Government Research Training Program Scholarship and the University of Melbourne Lochrie Engineering Scholarship. Conrad Wasko acknowledges funding from the Australian Research Council (ARC) DE210100479 and the University of Sydney Horizon Fellowship. We thank the handling editor Daniel Viviroli and two anonymous reviewers for their feedback and suggestions that helped us to clarify our paper.
This research has been supported by the Australian Research Council (grant nos. DP200101326 and DE210100479).
This paper was edited by Daniel Viviroli and reviewed by two anonymous referees.
Ahmadisharaf, E. and Kalyanapu, A. J.: Investigation of the Impact of Streamflow Temporal Variation on Dam Overtopping Risk: Case Study of a High-Hazard Dam, in: World Environmental and Water Resources Congress 2015, 1050–1057, https://doi.org/10.1061/9780784479162.103, 2015.
Ali, H., Fowler, H. J., Lenderink, G., Lewis, E., and Pritchard, D.: Consistent Large-Scale Response of Hourly Extreme Precipitation to Temperature Variation Over Land, Geophysical Research Letters, 48, e2020GL090317, https://doi.org/10.1029/2020GL090317, 2021.
Allan, R. P. and Soden, B. J.: Atmospheric Warming and the Amplification of Precipitation Extremes, Science, 321, 1481–1484, https://doi.org/10.1126/science.1160787, 2008.
Ball, J., Babister, M., Nathan, R., Weeks, W., Weinmann, E., Retallick, M., and Testoni, I. (Eds.): Australian Rainfall and Runoff: A Guide to Flood Estimation, Commonwealth of Australia (Geoscience Australia), ISBN 978-1-925848-36-6, 2019.
Barnett, T. P., Pierce, D. W., Hidalgo, H. G., Bonfils, C., Santer, B. D., Das, T., Bala, G., Wood, A. W., Nozawa, T., Mirin, A. A., Cayan, D. R., and Dettinger, M. D.: Human-Induced Changes in the Hydrology of the Western United States, Science, 319, 1080–1083, https://doi.org/10.1126/science.1152538, 2008.
Bates, B., Kundzewicz, Z. W., and IPCC (Eds.): Climate change and water, 200 pp., ISBN 978-92-9169-123-4, 2008.
Boulange, J., Hanasaki, N., Yamazaki, D., and Pokhrel, Y.: Role of dams in reducing global flood exposure under climate change, Nature Communications, 12, 417, https://doi.org/10.1038/s41467-020-20704-0, 2021.
Bureau of Meteorology: Guidebook to the Estimation of Probable Maximum Precipitation: Generalised Southeast Australia Method, Bureau of Meteorology, 2006.
Chan, S. C., Kendon, E. J., Roberts, N. M., Fowler, H. J., and Blenkinsop, S.: Downturn in scaling of UK extreme rainfall with temperature for future hottest days, Nature Geoscience, 9, 24–28, https://doi.org/10.1038/ngeo2596, 2016.
Chang, W., Stein, M. L., Wang, J., Kotamarthi, V. R., and Moyer, E. J.: Changes in Spatiotemporal Precipitation Patterns in Changing Climate Conditions, Journal of Climate, 29, 8355–8376, https://doi.org/10.1175/JCLI-D-15-0844.1, 2016.
Chevuturi, A., Klingaman, N. P., Turner, A. G., and Hannah, S.: Projected Changes in the Asian-Australian Monsoon Region in 1.5 °C and 2.0 °C Global-Warming Scenarios, Earth's Future, 6, 339–358, https://doi.org/10.1002/2017EF000734, 2018.
Cho, E., Ahmadisharaf, E., Ahmadisharaf, A., Nematirad, R., and AghaKouchak, A.: Unraveling the Relationships between Trend of Dam Inflows, Hydrometeorological Variables, and Vegetation in Western and Southwestern United States, Journal of Hydrometeorology, 25, 1793–1808, https://doi.org/10.1175/JHM-D-23-0217.1, 2024.
Cho, E., Ahmadisharaf, E., Villarini, G., and AghaKouchak, A.: Historical changes in overtopping probability of dams in the United States, Nature Communications, 16, 6693, https://doi.org/10.1038/s41467-025-59536-1, 2025.
Doss-Gollin, J., Farnham, D. J., Ho, M., and Lall, U.: Adaptation over Fatalism: Leveraging High-Impact Climate Disasters to Boost Societal Resilience, Journal of Water Resources Planning and Management, 146, 01820001, https://doi.org/10.1061/(ASCE)WR.1943-5452.0001190, 2020.
Dykman, C., Sharma, A., Wasko, C., and Nathan, R.: Pyraingen: A python package for constrained continuous rainfall generation, Environmental Modelling & Software, 175, 105984, https://doi.org/10.1016/j.envsoft.2024.105984, 2024.
Emori, S. and Brown, S. J.: Dynamic and thermodynamic changes in mean and extreme precipitation under changed climate, Geophysical Research Letters, 32, https://doi.org/10.1029/2005GL023272, 2005.
Faulkner, D., Warren, S., Spencer, P., and Sharkey, P.: Can we still predict the future from the past? Implementing non-stationary flood frequency analysis in the UK, Journal of Flood Risk Management, 13, e12582, https://doi.org/10.1111/jfr3.12582, 2020.
Ferdowsi, A., Zolghadr-Asli, B., and AghaKouchak, A.: Dangers of aging water infrastructure, Science, 386, 158–158, https://doi.org/10.1126/science.adr1054, 2024.
Filipova, V., Lawrence, D., and Skaugen, T.: A stochastic event-based approach for flood estimation in catchments with mixed rainfall and snowmelt flood regimes, Nat. Hazards Earth Syst. Sci., 19, 1–18, https://doi.org/10.5194/nhess-19-1-2019, 2019.
Fluixá-Sanmartín, J., Altarejos-García, L., Morales-Torres, A., and Escuder-Bueno, I.: Review article: Climate change impacts on dam safety, Nat. Hazards Earth Syst. Sci., 18, 2471–2488, https://doi.org/10.5194/nhess-18-2471-2018, 2018.
Fluixá-Sanmartín, J., Escuder-Bueno, I., Morales-Torres, A., and Castillo-Rodríguez, J. T.: Accounting for Climate Change Uncertainty in Long-Term Dam Risk Management, Journal of Water Resources Planning and Management, 147, 04021012, https://doi.org/10.1061/(ASCE)WR.1943-5452.0001355, 2021.
France, J. W., Alvi, I. A., Dickson, P. A., Falvey, H. T., Rigbey, S. J., and Trojanowski, J.: Independent Forensic Team Report Oroville Dam Spillway Incident, 2018.
Fyfe, J., Fox-Kemper, B., Kopp, R., and Garner, G.: Summary for Policymakers of the Working Group I Contribution to the IPCC Sixth Assessment Report – data for Figure SPM.8 (v20210809), https://doi.org/10.5285/98af2184e13e4b91893ab72f301790db, 2021.
Garg, S. and Mishra, V.: Role of Extreme Precipitation and Initial Hydrologic Conditions on Floods in Godavari River Basin, India, Water Resources Research, 55, 9191–9210, https://doi.org/10.1029/2019WR025863, 2019.
Ghanghas, A., Sharma, A., Dey, S., and Merwade, V.: How Is Spatial Homogeneity in Precipitation Extremes Changing Globally?, Geophysical Research Letters, 50, e2023GL103233, https://doi.org/10.1029/2023GL103233, 2023.
Ghanghas, A., Sharma, A., and Merwade, V.: Unveiling the Evolution of Extreme Rainfall Storm Structure Across Space and Time in a Warming Climate, Earth's Future, 12, e2024EF004675, https://doi.org/10.1029/2024EF004675, 2024.
Gourevitch, J. D., Kousky, C., Liao, Y. (Penny), Nolte, C., Pollack, A. B., Porter, J. R., and Weill, J. A.: Unpriced climate risk and the potential consequences of overvaluation in US housing markets, Nature Climate Change, 13, 250–257, https://doi.org/10.1038/s41558-023-01594-8, 2023.
Graham, N. E.: Simulation of Recent Global Temperature Trends, Science, 267, 666–671, https://doi.org/10.1126/science.267.5198.666, 1995.
Green, J., Walland, D., Nandakumar, N., and Nathan, R.: Temporal patterns for the derivation of PMPDF and PMF estimates in the GTSM region of Australia, Australasian Journal of Water Resources, 8, 111–121, https://doi.org/10.1080/13241583.2005.11465248, 2005.
Green, J., Johnson, F., Beesley, C., and The, C.: Book 2: rainfall estimation, Chapter 3: design rainfall, in: Australian Rainfall and Runoff: A Guide to Flood Estimation, edited by: Ball, J., Babister, M., Nathan, R., Weeks, W., Weinmann, E., and Testoni, I., Commonwealth of Australia (Geoscience Australia), ISBN 978-1-925848-36-6, 2019.
Gutiérrez, J. M., Jones, R. G., Narisma, G. T., Alves, L. M., Amjad, M., Gorodetskaya, I. V., Grose, M., Klutse, N. A. B., Krakovska, S., Li, J., Martínez-Castro, D., Mearns, L. O., Mernild, S. H., Ngo-Duc, T., van den Hurk, B., and Yoon, J.-H.: Atlas, in: Climate Change 2021: The Physical Science Basis. Contribution of Working Group I to the Sixth Assessment Report of the Intergovernmental Panel on Climate Change, edited by: Masson-Delmotte, V., Zhai, P., Pirani, A., Connors, S. L., Péan, C., Berger, S., Caud, N., Chen, Y., Goldfarb, L., Gomis, M. I., Huang, M., Leitzell, K., Lonnoy, E., Matthews, J. B. R., Maycock, T. K., Waterfield, T., Yelekçi, O., Yu, R., and Zhou, B., Cambridge University Press, Cambridge, United Kingdom and New York, NY, USA, 1927–2058, https://doi.org/10.1017/9781009157896.021, 2021.
Haan, C. T.: Statistical methods in hydrology, 2nd edn., Iowa State Press, Ames, Iowa, ISBN 0-8138-1503-7, 1974.
Hakala, K., Addor, N., Teutschbein, C., Vis, M., Dakhlaoui, H., and Seibert, J.: Hydrological Modeling of Climate Change Impacts, in: Encyclopedia of Water, 1–20, https://doi.org/10.1002/9781119300762.wsts0062, 2019.
Hardwick Jones, R., Westra, S., and Sharma, A.: Observed relationships between extreme sub-daily precipitation, surface temperature, and relative humidity, Geophysical Research Letters, 37, https://doi.org/10.1029/2010GL045081, 2010.
Herath, S. M., Sarukkalige, R., and Nguyen, V. T. V.: Evaluation of empirical relationships between extreme rainfall and daily maximum temperature in Australia, Journal of Hydrology, 556, 1171–1181, https://doi.org/10.1016/j.jhydrol.2017.01.060, 2018.
Hershfield, D. M.: Method for Estimating Probable Maximum Rainfall, Journal AWWA, 57, 965–972, https://doi.org/10.1002/j.1551-8833.1965.tb01486.x, 1965.
Hill, P. and Thomson, R.: Chapter 3. Losses, in: Book 5 Flood Hydrograph Estimation, edited by: Ball, J., Babister, M., Nathan, R., Weeks, W., Weinmann, E., Retallick, M., and Testoni, I., ISBN 978-1-925848-36-6, 2019.
Hill, P., Graszkiewicz, Z., Taylor, M., and Nathan, R.: Australian Rainfall and Runoff Revision Project 6: Loss models for catchment simulation: Phase 4 analysis of rural catchments, 2014.
Ho, M., Lall, U., Allaire, M., Devineni, N., Kwon, H. H., Pal, I., Raff, D., and Wegner, D.: The future role of dams in the United States of America, Water Resources Research, 53, 982–998, https://doi.org/10.1002/2016WR019905, 2017.
Ho, M., Nathan, R., Wasko, C., Vogel, E., and Sharma, A.: Projecting changes in flood event runoff coefficients under climate change, Journal of Hydrology, 615, 128689, https://doi.org/10.1016/j.jhydrol.2022.128689, 2022.
Ho, M., Wasko, C., O'Shea, D., Nathan, R., Vogel, E., and Sharma, A.: Changes in flood-associated rainfall losses under climate change, Journal of Hydrology, 625, 129950, https://doi.org/10.1016/j.jhydrol.2023.129950, 2023.
Hsu, Y.-C., Tung, Y.-K., and Kuo, J.-T.: Evaluation of dam overtopping probability induced by flood and wind, Stoch. Environ. Res. Risk Assess., 25, 35–49, https://doi.org/10.1007/s00477-010-0435-7, 2011.
Hwang, J. and Lall, U.: Increasing dam failure risk in the USA due to compound rainfall clusters as climate changes, npj Natural Hazards, 1, 27, https://doi.org/10.1038/s44304-024-00027-6, 2024.
ICOLD: ICOLD Constitution, 2011.
IPCC: Climate Change 2021: The Physical Science Basis, edited by: Masson-Delmotte, V., Zhai, P., Pirani, A., Connors, S. L., Pean, C., Berger, S., Caud, N., Chen, Y., Goldfarb, L., Gomis, M. I., Huang, M., Leitzell, K., Lonnoy, E., Matthews, J. B. R., Maycock, T. K., Waterfield, T., Yelekci, O., Yu, R., and Zhou, B., Cambridge University Press, https://doi.org/10.1017/9781009157896.001, 2021a.
IPCC: Summary for Policymakers, in: Climate Change 2021: The Physical Science Basis. Contribution of Working Group I to the Sixth Assessment Report of the Intergovernmental Panel on Climate Change, edited by: Masson-Delmotte, V., Zhai, P., Pirani, A., Connors, S. L., Péan, C., Berger, S., Caud, N., Chen, Y., Goldfarb, L., Gomis, M. I., Huang, M., Leitzel, K., Lonnoy, E., Matthews, J. B. R., Maycock, T. K., Waterfield, T., Yelekçi, O., Yu, R., and Zhou, B., Cambridge University Press, Cambridge, United Kingdom and New York, NY, USA, 3–32, https://doi.org/10.1017/9781009157896.001, 2021b.
Ivancic, T. J. and Shaw, S. B.: Examining why trends in very heavy precipitation should not be mistaken for trends in very high river discharge, Climatic Change, 133, 681–693, https://doi.org/10.1007/s10584-015-1476-1, 2015.
Jakob, D., Smalley, R., Meighen, J., Xuereb, K., and Taylor, B.: Climate change and probable maximum precipitation, Bureau of Meteorology, Melbourne, 2009.
Jayaweera, L., Wasko, C., Nathan, R., and Johnson, F.: Non-stationarity in extreme rainfalls across Australia, Journal of Hydrology, 624, 129872, https://doi.org/10.1016/j.jhydrol.2023.129872, 2023.
Jayaweera, L., Wasko, C., and Nathan, R.: Modelling non-stationarity in extreme rainfall using large-scale climate drivers, Journal of Hydrology, 636, 131309, https://doi.org/10.1016/j.jhydrol.2024.131309, 2024.
Ju, J., Wu, C., Yeh, P. J.-F., Dai, H., and Hu, B. X.: Global precipitation-related extremes at 1.5 °C and 2 °C of global warming targets: Projection and uncertainty assessment based on the CESM-LWR experiment, Atmospheric Research, 264, 105868, https://doi.org/10.1016/j.atmosres.2021.105868, 2021.
Kao, S.-C., DeNeale, S. T., and Watson, D. B.: Hurricane Harvey Highlights: Need to Assess the Adequacy of Probable Maximum Precipitation Estimation Methods, Journal of Hydrologic Engineering, 24, 05019005, https://doi.org/10.1061/(ASCE)HE.1943-5584.0001768, 2019.
Kiem, A. S. and Austin, E. K.: Disconnect between science and end-users as a barrier to climate change adaptation, Climate Research, 58, 29–41, https://doi.org/10.3354/cr01181, 2013.
Kiem, A. S., Franks, S. W., and Kuczera, G.: Multi-decadal variability of flood risk, Geophysical Research Letters, 30, https://doi.org/10.1029/2002GL015992, 2003.
Kim, S., Sharma, A., Wasko, C., and Nathan, R.: Linking Total Precipitable Water to Precipitation Extremes Globally, Earth's Future, 10, e2021EF002473, https://doi.org/10.1029/2021EF002473, 2022.
Kim, S., Wasko, C., Sharma, A., and Nathan, R.: The role of regional water vapor dynamics in creating precipitation extremes, Journal of Hydrology X, 24, 100181, https://doi.org/10.1016/j.hydroa.2024.100181, 2024.
Kuczera, G., Lambert, M., Heneker, T., Jennings, S., Frost, A., and Coombes, P.: Joint probability and design storms at the crossroads, Australasian Journal of Water Resources, 10, 63–79, https://doi.org/10.1080/13241583.2006.11465282, 2006.
Kundzewicz, Z. W., Kanae, S., Seneviratne, S. I., Handmer, J., Nicholls, N., Peduzzi, P., Mechler, R., Bouwer, L. M., Arnell, N., Mach, K., Muir-Wood, R., Brakenridge, G. R., Kron, W., Benito, G., Honda, Y., Takahashi, K., and Sherstyukov, B.: Flood risk and climate change: global and regional perspectives, Hydrological Sciences Journal, 59, 1–28, https://doi.org/10.1080/02626667.2013.857411, 2014.
Kunkel, K. E., Karl, T. R., Easterling, D. R., Redmond, K., Young, J., Yin, X., and Hennon, P.: Probable maximum precipitation and climate change, Geophysical Research Letters, 40, 1402–1408, https://doi.org/10.1002/grl.50334, 2013.
Kunkel, K. E., Schlef, K., Brown, C., François, B., Demissie, Y., Yan, E., Lettenmaier, D. P., Wang, K. J., Wagner, A., Wigmosta, M. S., Karl, T. R., and Easterling, D. R.: Best Practices for Incorporating Non-stationarity in Extreme Precipitation and Flooding Design Values, Virginia, US, report no. RC-2517, 2020.
Kuo, J.-T., Yen, B.-C., Hsu, Y.-C., and Lin, H.-F.: Risk Analysis for Dam Overtopping – Feitsui Reservoir as a Case Study, Journal of Hydraulic Engineering, 133, 955–963, https://doi.org/10.1061/(ASCE)0733-9429(2007)133:8(955), 2007.
Kwon, H.-H. and Moon, Y.-I.: Improvement of overtopping risk evaluations using probabilistic concepts for existing dams, Stochastic Environmental Research and Risk Assessment, 20, 223–237, https://doi.org/10.1007/s00477-005-0017-2, 2006.
Laurenson, E. M.: A catchment storage model for runoff routing, Journal of Hydrology, 2, 141–163, https://doi.org/10.1016/0022-1694(64)90025-3, 1964.
Laurenson, E. M., Mein, R. G., and Nathan, R. J.: RORB version 6 runoff routing program – User manual, 2010.
Lave, T. R. and Lave, L. B.: Public Perception of the Risks of Floods: Implications for Communication, Risk Analysis, 11, 255–267, https://doi.org/10.1111/j.1539-6924.1991.tb00602.x, 1991.
Lee, B.-S. and You, G. J.-Y.: An assessment of long-term overtopping risk and optimal termination time of dam under climate change, Journal of Environmental Management, 121, 57–71, https://doi.org/10.1016/j.jenvman.2013.02.025, 2013.
Lochbihler, K., Lenderink, G., and Siebesma, A. P.: The spatial extent of rainfall events and its relation to precipitation scaling, Geophysical Research Letters, 44, 8629–8636, https://doi.org/10.1002/2017GL074857, 2017.
Lompi, M., Mediero, L., Soriano, E., and Caporali, E.: Climate change and hydrological dam safety: a stochastic methodology based on climate projections, Hydrological Sciences Journal, 68, 745–763, https://doi.org/10.1080/02626667.2023.2192873, 2023.
Madani, K. and Lund, J. R.: Estimated impacts of climate warming on California's high-elevation hydropower, Climatic Change, 102, 521–538, https://doi.org/10.1007/s10584-009-9750-8, 2010.
Magan, B., Kim, S., Wasko, C., Barbero, R., Moron, V., Nathan, R., and Sharma, A.: Impact of atmospheric circulation on the rainfall-temperature relationship in Australia, Environmental Research Letters, 15, 094098, https://doi.org/10.1088/1748-9326/abab35, 2020.
Malakar, Y., Snow, S., Fleming, A., Fielke, S., Jakku, E., Tozer, C., and Darbyshire, R.: Multi-decadal climate services help farmers assess and manage future risks, Nature Climate Change, 14, 586–591, https://doi.org/10.1038/s41558-024-02021-2, 2024.
Malerba, M. E., Wright, N., and Macreadie, P. I.: Australian farm dams are becoming less reliable water sources under climate change, Science of The Total Environment, 829, 154360, https://doi.org/10.1016/j.scitotenv.2022.154360, 2022.
Massari, C., Pellet, V., Tramblay, Y., Crow, W. T., Gründemann, G. J., Hascoetf, T., Penna, D., Modanesi, S., Brocca, L., Camici, S., and Marra, F.: On the relation between antecedent basin conditions and runoff coefficient for European floods, Journal of Hydrology, 130012, https://doi.org/10.1016/j.jhydrol.2023.130012, 2023.
Matalas, N. C.: Stochastic Hydrology in the Context of Climate Change, Climatic Change, 37, 89–101, https://doi.org/10.1023/A:1005374000318, 1997.
Mein, R. G., Laurenson, E. M., and McMahon, T. A.: Simple Nonlinear Model for Flood Estimation, Journal of the Hydraulics Division, 100, 1507–1518, https://doi.org/10.1061/JYCEAJ.0004101, 1974.
Micevski, T., Franks, S. W., and Kuczera, G.: Multidecadal variability in coastal eastern Australian flood data, Journal of Hydrology, 327, 219–225, https://doi.org/10.1016/j.jhydrol.2005.11.017, 2006.
Michailidi, E. M. and Bacchi, B.: Dealing with uncertainty in the probability of overtopping of a flood mitigation dam, Hydrol. Earth Syst. Sci., 21, 2497–2507, https://doi.org/10.5194/hess-21-2497-2017, 2017.
Mitchell, J. F. B.: The “Greenhouse” effect and climate change, Reviews of Geophysics, 27, 115–139, https://doi.org/10.1029/RG027i001p00115, 1989.
Nathan, R. and Weinmann, E.: Book 8 Very Rare to Extreme Flood Estimation, in: Book 8 Very Rare to Extreme Flood Estimation, ISBN 978-1-925848-36-6, 2019a.
Nathan, R. and Weinmann, E.: Chapter 4. Treatment of Joint Probability, in: Book 4 Catchment Simulation, edited by: Ball, J., Babister, M., Nathan, R., Weeks, W., Weinmann, E., Retallick, M., and Testoni, I., Commonwealth of Australia (Geoscience Australia), ISBN 978-1-925848-36-6, 2019b.
Nathan, R., Weinmann, E., and Hill, P.: Use of Monte Carlo Simulation to Estimate the Expected Probability of Large to Extreme Floods, in: 28th International Hydrology and Water Resources Symposium: About Water, Symposium Proceedings, Barton, A. C. T., 1.105–1.112, ISBN 0-85824-060-2, 2003.
Nathan, R. J.: The Derivation of Design Temporal Patterns for use with the Generalised Estimates of Probable Maximum Precipitation, Transactions of the Institution of Engineers, Australia, Civil Engineering, CE34, 139–150, 1992.
Natural Resources Wales, Welsh Government: Adapting to Climate Change: Guidance for Flood and Coastal Erosion Risk Management Authorities in Wales, ISBN 978-1-80535-019-4, 2022.
O'Shea, D., Nathan, R., Wasko, C., and Hill, P.: Implications of event-based loss model structure on simulating large floods, Journal of Hydrology, 595, 126008, https://doi.org/10.1016/j.jhydrol.2021.126008, 2021.
O'Shea, D., Nathan, R., Wasko, C., Ho, M., and Sharma, A.: Evaluation of key flood risk drivers under climate change using a bottom-up approach, Journal of Hydrology, 640, 131694, https://doi.org/10.1016/j.jhydrol.2024.131694, 2024.
Peel, M. C., Finlayson, B. L., and McMahon, T. A.: Updated world map of the Köppen-Geiger climate classification, Hydrology and Earth System Sciences, 11, 1633–1644, https://doi.org/10.5194/hess-11-1633-2007, 2007.
Pielke, R. A.: Nine Fallacies of Floods, Climatic Change, 42, 413–438, https://doi.org/10.1023/A:1005457318876, 1999.
Pilgrim, D. H. and Cordery, I.: Chapter 9 – Flood Runoff, in: Handbook of Hydrology, edited by: Maidment, D. R., McGraw-Hill, New York, ISBN 9780071711777, 1993.
Pittock, J. and Hartmann, J.: Taking a second look: climate change, periodic relicensing and improved management of dams, Mar. Freshwater Res., 62, 312–320, 2011.
Prasad, R., Hibler, L. F., Coleman, A. M., and Ward, D. L.: Design-Basis Flood Estimation for Site Characterization at Nuclear Power Plants in the United States of America, https://doi.org/10.2172/1036933, 2011.
Rajabzadeh, V., Hekmatzadeh, A. A., Tabatabaie Shourijeh, P., and Torabi Haghighi, A.: Introducing a probabilistic framework to measure dam overtopping risk for dams benefiting from dual spillways, Reliability Engineering & System Safety, 231, 109030, https://doi.org/10.1016/j.ress.2022.109030, 2023.
Rastogi, D., Kao, S.-C., Ashfaq, M., Mei, R., Kabela, E. D., Gangrade, S., Naz, B. S., Preston, B. L., Singh, N., and Anantharaj, V. G.: Effects of climate change on probable maximum precipitation: A sensitivity study over the Alabama-Coosa-Tallapoosa River Basin, Journal of Geophysical Research: Atmospheres, 122, 4808–4828, https://doi.org/10.1002/2016JD026001, 2017.
Read, L. K. and Vogel, R. M.: Reliability, return periods, and risk under nonstationarity, Water Resources Research, 51, 6381–6398, https://doi.org/10.1002/2015WR017089, 2015.
Roderick, T. P., Wasko, C., and Sharma, A.: An Improved Covariate for Projecting Future Rainfall Extremes?, Water Resources Research, 56, e2019WR026924, https://doi.org/10.1029/2019WR026924, 2020.
Rouhani, H. and Leconte, R.: Uncertainties of Precipitable Water Calculations for PMP Estimates in Current and Future Climates, Journal of Hydrologic Engineering, 25, 04019066, https://doi.org/10.1061/(ASCE)HE.1943-5584.0001877, 2020.
Salas, J. D., Obeysekera, J., and Vogel, R. M.: Techniques for assessing water infrastructure for nonstationary extreme events: a review, Hydrological Sciences Journal, 63, 325–352, https://doi.org/10.1080/02626667.2018.1426858, 2018.
Salas, J. D., Anderson, M. L., Papalexiou, S. M., and Frances, F.: PMP and Climate Variability and Change: A Review, Journal of Hydrologic Engineering, 25, 03120002, https://doi.org/10.1061/(ASCE)HE.1943-5584.0002003, 2020.
Schlef, K. E., Kunkel, K. E., Brown, C., Demissie, Y., Lettenmaier, D. P., Wagner, A., Wigmosta, M. S., Karl, T. R., Easterling, D. R., Wang, K. J., François, B., and Yan, E.: Incorporating non-stationarity from climate change into rainfall frequency and intensity-duration-frequency (IDF) curves, Journal of Hydrology, 616, 128757, https://doi.org/10.1016/j.jhydrol.2022.128757, 2023.
Shirzaei, M., Vahedifard, F., Sadhasivam, N., Ohenhen, L., Dasho, O., Tiwari, A., Werth, S., Azhar, M., Zhao, Y., Nicholls, R. J., and AghaKouchak, A.: Aging dams, political instability, poor human decisions and climate change: recipe for human disaster, npj Nat. Hazards, 2, 1–8, https://doi.org/10.1038/s44304-024-00056-1, 2025.
Sivapalan, M., Blöschl, G., Merz, R., and Gutknecht, D.: Linking flood frequency to long-term water balance: Incorporating effects of seasonality, Water Resources Research, 41, https://doi.org/10.1029/2004WR003439, 2005.
Stedinger, J. R. and Griffis, V. W.: Getting From Here to Where? Flood Frequency Analysis and Climate, JAWRA Journal of the American Water Resources Association, 47, 506–513, https://doi.org/10.1111/j.1752-1688.2011.00545.x, 2011.
Steinschneider, S. and Brown, C.: A semiparametric multivariate, multisite weather generator with low-frequency variability for use in climate risk assessments, Water Resources Research, 49, 7205–7220, https://doi.org/10.1002/wrcr.20528, 2013.
Stratz, S. A. and Hossain, F.: Probable Maximum Precipitation in a Changing Climate: Implications for Dam Design, Journal of Hydrologic Engineering, 19, 06014006, https://doi.org/10.1061/(ASCE)HE.1943-5584.0001021, 2014.
Tanaka, S. K., Zhu, T., Lund, J. R., Howitt, R. E., Jenkins, M. W., Pulido, M. A., Tauber, M., Ritzema, R. S., and Ferreira, I. C.: Climate Warming and Water Management Adaptation for California, Climatic Change, 76, 361–387, https://doi.org/10.1007/s10584-006-9079-5, 2006.
Trenberth, K. E.: Conceptual Framework for Changes of Extremes of the Hydrological Cycle With Climate Change, in: Weather and Climate Extremes: Changes, Variations and a Perspective from the Insurance Industry, edited by: Karl, T. R., Nicholls, N., and Ghazi, A., Springer Netherlands, Dordrecht, 327–339, https://doi.org/10.1007/978-94-015-9265-9_18, 1999.
Trenberth, K. E., Dai, A., Rasmussen, R. M., and Parsons, D. B.: The Changing Character of Precipitation, Bulletin of the American Meteorological Society, 84, 1205–1218, https://doi.org/10.1175/BAMS-84-9-1205, 2003.
UK Environment Agency: Flood risk assessments: climate change allowances, https://www.gov.uk/guidance/flood-risk-assessments-climate-change-allowances (last access: 11 May 2020), 2022.
Visser, J. B., Wasko, C., Sharma, A., and Nathan, R.: Eliminating the “Hook” in Precipitation–Temperature Scaling, Journal of Climate, 34, 9535–9549, https://doi.org/10.1175/JCLI-D-21-0292.1, 2021.
Visser, J. B., Kim, S., Wasko, C., Nathan, R., and Sharma, A.: The Impact of Climate Change on Operational Probable Maximum Precipitation Estimates, Water Resources Research, 58, e2022WR032247, https://doi.org/10.1029/2022WR032247, 2022.
Visser, J. B., Wasko, C., Sharma, A., and Nathan, R.: Changing storm temporal patterns with increasing temperatures across Australia, Journal of Climate, 1, 1–26, https://doi.org/10.1175/JCLI-D-22-0694.1, 2023.
Walland, D., Meighen, J., Xuereb, K., Beesley, C., and Hoang, T.: Revision of the generalised tropical storm method for estimating probable maximum precipitation, Bureau of Meteorology, Melbourne, HRS Report No. 8, 2003.
Wang, F. and Zhang, Q.-L.: Systemic Estimation of Dam Overtopping Probability: Bayesian Networks Approach, Journal of Infrastructure Systems, 23, 04016037, https://doi.org/10.1061/(ASCE)IS.1943-555X.0000328, 2017.
Wang, G., Wang, D., Trenberth, K. E., Erfanian, A., Yu, M., Bosilovich, M. G., and Parr, D. T.: The peak structure and future changes of the relationships between extreme precipitation and temperature, Nature Climate Change, 7, 268–274, https://doi.org/10.1038/nclimate3239, 2017.
Wasko, C. and Guo, D.: Understanding event runoff coefficient variability across Australia using the R package, Hydrological Processes, 36, e14563, https://doi.org/10.1002/hyp.14563, 2022.
Wasko, C. and Sharma, A.: Global assessment of flood and storm extremes with increased temperatures, Sci. Rep., 7, 7945, https://doi.org/10.1038/s41598-017-08481-1, 2017.
Wasko, C., Lu, W. T., and Mehrotra, R.: Relationship of extreme precipitation, dry-bulb temperature, and dew point temperature across Australia, Environmental Research Letters, 13, 074031, https://doi.org/10.1088/1748-9326/aad135, 2018.
Wasko, C., Nathan, R., and Peel, M. C.: Changes in Antecedent Soil Moisture Modulate Flood Seasonality in a Changing Climate, Water Resources Research, 56, e2019WR026300, https://doi.org/10.1029/2019WR026300, 2020.
Wasko, C., Sharma, A., and Pui, A.: Linking temperature to catastrophe damages from hydrologic and meteorological extremes, Journal of Hydrology, 602, 126731, https://doi.org/10.1016/j.jhydrol.2021.126731, 2021a.
Wasko, C., Westra, S., Nathan, R., Orr, H. G., Villarini, G., Villalobos Herrera, R., and Fowler, H. J.: Incorporating climate change in flood estimation guidance, Philosophical Transactions of the Royal Society A: Mathematical, Physical and Engineering Sciences, 379, 20190548, https://doi.org/10.1098/rsta.2019.0548, 2021b.
Wasko, C., Westra, S., Nathan, R., Jakob, D., Nielsen, C., Evans, J., Rodgers, S., Ho, M., Babister, M., Dowdy, A., and Sharples, W.: Chapter 6: Climate Change Considerations, in: Book 1: Scope and Philosophy, edited by: Ball, J., Babister, M., Nathan, R., Weeks, W., Weinmann, E., Retallick, M., and Testoni, I., Commonwealth of Australia (Geosciences Australia), ISBN 978-1-925848-36-6, 2024a.
Wasko, C., Westra, S., Nathan, R., Pepler, A., Raupach, T. H., Dowdy, A., Johnson, F., Ho, M., McInnes, K. L., Jakob, D., Evans, J., Villarini, G., and Fowler, H. J.: A systematic review of climate change science relevant to Australian design flood estimation, Hydrol. Earth Syst. Sci., 28, 1251–1285, https://doi.org/10.5194/hess-28-1251-2024, 2024b.
Watts, R. J., Richter, B. D., Opperman, J. J., and Bowmer, K. H.: Dam reoperation in an era of climate change, Mar. Freshwater Res., 62, 321–327, 2011.
Willems, P.: Revision of urban drainage design rules after assessment of climate change impacts on precipitation extremes at Uccle, Belgium, Journal of Hydrology, 496, 166–177, https://doi.org/10.1016/j.jhydrol.2013.05.037, 2013.
WMO: Manual on estimation of Probable Maximum Precipitation (PMP), World Meteorological Organization, Geneva, Switzerland, ISBN 978-92-63-11045-9, 2009.
Woldemeskel, F. and Sharma, A.: Should flood regimes change in a warming climate? The role of antecedent moisture conditions, Geophysical Research Letters, 43, 7556–7563, https://doi.org/10.1002/2016GL069448, 2016.
Yaghmaei, N., van Loenhout, J., Below, R., and Guha-Sapir, D.: Human cost of disasters: An overview of the last 20 years 2000–2019, Centre for Research on the Epidemiology of Disasters, UN Office for Disaster Risk Reduction, 2020.
Zhang, W., Villarini, G., and Wehner, M.: Contrasting the responses of extreme precipitation to changes in surface air and dew point temperatures, Climatic Change, 154, 257–271, https://doi.org/10.1007/s10584-019-02415-8, 2019.
- Abstract
- Introduction
- Materials and methods
- Results
- Discussion
- Conclusions
- Appendix A: R2ORB modelling and verification
- Appendix B: Global temperature projections
- Appendix C: Example outflow flood frequency curves
- Code availability
- Data availability
- Author contributions
- Competing interests
- Disclaimer
- Acknowledgements
- Financial support
- Review statement
- References