the Creative Commons Attribution 4.0 License.
the Creative Commons Attribution 4.0 License.
 | 23 Oct 2025
Enhancing evapotranspiration estimates under climate change: the role of CO2 physiological feedback and CMIP6 scenarios
Xiaofan Yang
Yu Chen
Virgílio A. Bento
Hongquan Song
Wei Shui
Jingyu Zeng
The future state of global evapotranspiration (ET) estimation under climate change remains uncertain. Current formulations primarily developed based on the high emission CMIP5 scenario, have been widely used to represent conditions under elevated greenhouse gas pathways. However, these formulations may not adequately capture the enhanced vegetation–climate interactions projected under the lower-emission scenarios of CMIP6. Without updates to account for evolving plant physiological responses to rising CO2, projections may overlook critical feedbacks between atmospheric CO2 concentrations, vegetation behavior, and hydrological processes.
To address this, developing CMIP6-specific formulations is essential to leverage its improved datasets and reduce uncertainties in future ET simulations. In this study, we update the Penman-Monteith evapotranspiration (PM-ET) model by incorporating the CO2-vegetation coupling effect. This is achieved using outputs from four Coupled Model Intercomparison Project Phase 6 (CMIP6) global climate models (GCMs) under four Shared Socioeconomic Pathways (SSP1-2.6, SSP2-4.5, SSP3-7.0, SSP5-8.5).
Results indicate a sustained historical increase in potential evapotranspiration (Ep). The inclusion of CO2 physiological effects reduces the deviation in projected ET trends by approximately 15 %–20 % compared to CMIP5-based frameworks, accounting for the increase in stomatal resistance driven by CO2 concentrations rising from ∼284 to ∼ 935 ppm. Furthermore, our model predicts an increasing dependence of ET projections on emission scenario, highlighting the growing influence of pathway-specific feedbacks.
Overall, our approach demonstrates greater compatibility with CMIP6 simulations, allowing for more accurate representation of ET responses to future CO2 increases. These findings provide valuable insights for advancing the analysis of nonlinear vegetation-atmosphere interactions and hydrological uncertainty under climate and physiological forcings.
- Article
(13597 KB) - Full-text XML
- BibTeX
- EndNote


-
CMIP6 integration enhances scenario-dependent ET trend sensitivity.
-
Nonlinear vegetation-atmosphere interactions amplify hydrological uncertainty.
-
Model updates improve Ep dynamics characterization under climate forcing.
-
High-emission scenarios show greater Ep acceleration and uncertainty.
Vegetation-climate interactions under rising atmospheric CO2 concentrations drive complex biogeochemical feedbacks that shape the global carbon-water cycle across diverse biomes. As a result, the relationship between vegetation dynamics and climate change has gained increasing prominence in Earth system science. The bidirectional feedbacks are fundamental to understand changes in global hydrological and carbon cycles (Yang et al., 2019; Xu et al., 2024).
On one hand, elevated CO2 levels trigger complex plant physiological responses, which influence the ecosystem hydrology (Sun et al., 2023; Li, 2024). For example, studies have shown that photosynthetic rates can increase by 12 %–25 % for every 100 ppm rise in CO2, while stomatal conductance decreases by 20 %–40 %. This reduction limits evaporative cooling, exacerbating extreme temperatures by 0.8–1.3 °C during drought periods (Zarakas et al., 2020; Li et al., 2024; Wu et al., 2024). Moreover, biome-specific responses create climatic asymmetries (Yang et al., 2023). Temperate forests exhibit adaptive resilience through phenological shifts, extending the growing season by 15.6±3.2 d to mitigate respiratory carbon losses during heat extremes (Ainsworth and Rogers, 2007; Keenan and Williams, 2018). In contrast, tropical ecosystems experience accelerated biomass loss due to compound warming and precipitation anomalies (Betts et al., 2007; Gimeno-Sotelo et al., 2024a, b). Soil carbon-climate interactions add further complexity, with elevated CO2 increased mineralization rates ...(Kong et al., 2023). Critical thresholds in plant hydraulic strategies also contribute to these differences (Medlyn et al., 2011; Wu et al., 2019).
On the other hand, the strength of CO2-driven vegetation feedbacks is constrained by water availability. Since 2000, compound drought-heatwave events have reduced global terrestrial water storage by 12 %–18 % and vegetation productivity by 9 %–15 % (Piao et al., 2007; Jones et al., 2016; Zhou et al., 2016; Lu et al., 2025). These phenomena are attributed to sustained evapotranspiration pressure (Xu et al., 2024). Although CO2 fertilization initially enhances vegetation growth in water-limited regions, subsequent hydrological constraints often offset these benefits (Jasechko et al., 2013; Young et al., 2022). Therefore, accurately capturing the interplay between biome-specific responses and hydrological limitations is essential for understanding the cascading effects of climate and physiological drivers on the carbon–water cycle.
Progress in evapotranspiration (ET) modelling is challenged by the need to account for CO2-climate coupling and regional hydrological variability. Widely used ET estimation methods, such as the Penman-Monteith Reference Crop (PM-RC) model, lack explicit consideration of CO2 effects (Stocker et al., 2018; Wu et al., 2021). As a result, traditional PM-RC models tend to overestimate future ET trends by 68 %–100 % due to inadequate representation of CO2-induced stomatal closure (Yang et al., 2016). To address this, Yang et al. (2019) developed a modified framework incorporating CO2-dependent stomatal resistance, with improved ET projections under high CO2 scenarios (Luo et al., 2018a, b). While high-resolution ET datasets have enhanced monitoring of extreme events (Pereira et al., 2015; Wu et al., 2021), alignment between climate model outputs and regional hydrological dynamics remains a critical challenge (Gimeno-Sotelo et al., 2024a). Consequently, the development of next-generation ET models that explicitly couple CO2-climate feedbacks with regional hydrological dynamics is urgently needed.
The Coupled Model Intercomparison Project Phase 6 (CMIP6) provides an improved framework for addressing these challenges. Its long-term, multi-scenario structure and inclusion of dynamic vegetation modules offer greater fidelity in representing vegetation–climate coupling (Eyring et al., 2016; O'Neill et al., 2016). The Shared Socioeconomic Pathways (SSPs) embedded within CMIP6 allow for systematic exploration of ET trajectories under divergent emission scenarios (Zeng et al., 2016; Jones et al., 2016; Wu et al., 2019). However, PM-RC-CO2 model proposed by Yang et al. (2019) still relies on formulas derived from CMIP5-era models, that the original coefficient () may introduce inconsistencies when applied to CMIP6 scenarios. This can reduce confidence in cross-generational model comparisons and potentially exaggerate ET sensitivity to CO2 rise. To fully leverage CMIP6's enhanced vegetation–climate framework, it is crucial to develop updated, scenario-specific formulations.
In this study, we advance ET modelling by integrating the CMIP6 climate projection system with the PM-RC-CO2 model proposed by Yang et al. (2019). We use outputs from four global climate model (GCMs) from CMIP6, across four shared socio-economic pathways (from scenarioMIP, SSP1-2.6, SSP2-4.5, SSP3-7.0, SSP5-8.5) for the period 2015–2100. Meanwhile, we used monthly outputs of precipitation, actual evapotranspiration, short and long wave radiation, and near-surface air temperature, air pressure, wind speed and specific humidity, to derive an updated PM-RC-CO2 Ep formulation. This framework improves the representation of interactions between stomatal resistance and aerodynamic drivers based on the characteristics of CMIP6 data. To assess performance, we compare the updated model against earlier formulations, evaluating Ep trends, scenario dependencies, and model outputs. The proposed framework provides a more robust characterization of Ep dynamics under the CMIP6 multi-scenario structure, thereby improving the simulation of future hydrological changes.
2.1 Data and model performance evaluation
To comprehensively assess the effects of CO2 concentration on ET changes, we used outputs from four selected CMIP6 GCMs: IPSL-CM6A-LR, GFDL-ESM4, CNRM-CM6-1, and MPI-ESM1-2-HR. These models were obtained from the CMIP6 data portal (https://esgf-node.llnl.gov/search/cmip6/, last access: 30 August 2024) and include simulations for both the historical period (1850–2014) and four future emission scenarios (2015–2100): SSP1-2.6, SSP2-4.5, SSP3-7.0, and SSP5-8.5.
Each model provides essential variables required for ET estimation, including monthly land surface data (runoff, precipitation, evapotranspiration, shortwave and longwave radiation) and near-surface atmospheric parameters (temperature, pressure, wind speed, and specific humidity). To ensure consistency across datasets, all outputs were resampled to a uniform spatial resolution of 0.25° × 0.25° by bilinear interpolation.
To evaluate the performance and reliability of the climate model simulations, we validated key variables against observational data from the W5E5 v2.0 dataset (https://data.isimip.org/search/simulation_round/ISIMIP3a/product/SecondaryInputData/climate_forcing/w5e5v2.0/, last access: 21 December 2024, 1979–2020). This comparison enabled the assessment of model skill in replicating observed climate and hydrological conditions, serving as a benchmark for subsequent ET modeling and scenario analyses.
The land use type data we used in this paper are from GLASS-GLC (http://www.glass.umd.edu/Overview.html, last access: 16 November 2024, period 1982–2015) (Liang et al., 2013, 2025).Compared with other land cover data sets, GLASS data has significant advantages in long-term time series and cross-year change monitoring, and can be widely used in ecological environment assessment, surface process simulation and global change research.
2.2 Determining rs over non-water-limited regions and months
To quantify the sensitivity of stomatal resistance (rs) under rising CO2 concentrations, we applied the widely used non-water limited screening method (Milly and Dunne, 2016; Yang et al., 2019). This method systematically integrates hydrological constraints and eliminates the influence of frozen water through temperature constraints, so as to effectively screen out the water limited areas and periods.
The procedure is outlined as follows:
-
The period of analysis (1861–2100) was divided into eight 30-year climatological periods.
-
For each period, monthly ET and P outputs were fitted to a parabolic function. Grid cells with a maximum slope of the ET–P curve less than or equal to 0.05 were retained, indicating minimal hydrological limitation.
-
Based on existing research, we further filtered the data by selecting only those grid–month combinations where the ET/P ratio was less than 2.0, excluding regions under strong evaporative demand relative to precipitation.
-
The intersection of non-water-limited domains across all eight 30-year periods was retained to ensure consistent spatiotemporal coverage.
-
To eliminate the influence of frozen water, we exclude grid cells and months with average temperatures below 10 °C.
This filtering process isolates vegetated regions and time periods with minimal hydrological constraints, thereby enabling a more accurate assessment of stomatal resistance responses to elevated CO2 concentrations.
2.3 Adjustment of the PM-RC-CO2 model
2.3.1 The Penman–Monteith model
The Penman-Monteith (PM) equation provides a robust framework for estimating reference evapotranspiration (ET0), synthesizing surface energy balance and aerodynamic transfer principles (Monteith, 1977; Monteith and Unsworth, 2013; Milly and Dunne, 2016). The models calculate evapotranspiration (E) as:
where s represents the slope of the saturation vapor pressure-temperature relationship (Pa K−1), γ denotes the psychrometric constant (Pa K−1), and ρa corresponds to air density (kg m−3). The specific heat at constant pressure (Cp, J kg−1 K−1) quantifies energy storage capacity. The vapor pressure deficit (D, Pa), drives evaporative demand, modulated by the temperature-dependent latent heat of vaporization (λ, J kg−1). Aerodynamic resistance (ra, s m−1) is derived from logarithmic wind profile theory.
2.3.2 PM-RC Ep model
The standardized PM-RC model adopts fixed biophysical parameters representing typical C3 crop physiology under non-drought conditions, including surface stomatal resistance (rs=70 s m−1), canopy height (0.12 m), and shortwave albedo (α=0.23), among others (Allen et al., 1998). Ep (mm d−1) is computed as:
2.3.3 PM-RC Ep model modified to account for atmospheric [CO2](PM-RC-CO2)
Yang et al. (2019) introduced a CO2 responsive modification to the PM model by parameterizing stomatal resistance. This modification is based on empirically derived significant regression coefficients from controlled experiments, enabling quantification of vegetation-atmosphere feedbacks under high CO2 conditions. This approach not only retains the biophysical basis of the original framework but also relates with the relationship between CO2 concentration and stomatal dynamics. The equation is:
Here, the term ([CO2] − 300) reflects the empirical modulation of stomatal resistance by CO2 concentration, where 300 ppm represents the preindustrial baseline (1860–1960). This coefficient was obtained from nonlinear regression analysis of plant physiological responses in controlled environments, and encapsulates vegetation feedbacks aligned with CMIP6 scenario-driven CO2 sensitivities.
2.3.4 Updated PM-RC-CO2 model
The original PM-RC-CO2 formulation was based on CMIP5-driven parameterization. Applying it directly to CMIP6 scenarios may introduce uncertainty due to differences in CO2–climate feedback representation. Therefore, we recalibrated the stomatal resistance–CO2 relationship using the CMIP6 multi-model ensemble, integrating vegetation physiological response and CO2-forcing within a physically consistent parameter space. The updated formulation is:
This version introduces a revised CMIP6-constrained empirical coefficient [CO2] − 300). Derived from a collection of four global climate models (GCMs), this parameter better captures the CO2-induced stomatal resistance (rs) effect and enhances model performance under the CMIP6 climate scenario.
2.4 Statistical Methods
To study changes in potential evapotranspiration (Ep) trends, we use the Bayesian Estimator of Abrupt Change, Seasonality, and Trend (BEAST) method (Zhao et al., 2019), which decomposes time-series into trend, seasonality, and residuals components and effectively handles nonlinear shifts (Li et al., 2022).
M-K trend test is a non parametric statistical test method (Mann, 1945). It can clearly detect the rise, fall or no trend in the time series data, and can more accurately capture the long-term trend without being disturbed by short-term fluctuations. It has been widely used in the field of climate change (Hamed, 2008; Machiwal et al., 2022). This study uses this method to analyze the global Ep results calculated by the original formula and the updated formula from 1850 to 2100.
We used Wilcoxon rank test to compare and analyze the results of different GCMS in different models at different periods. Wilcoxon signed rank test is a nonparametric statistical test used to compare the differences between two dependent variable samples (Cuzick, 1985). Like other nonparametric tests, this test does not assume a specific distribution of the analyzed data. The parameter test equivalent to Wilcoxon signed rank test is the dependent variable sample t test (or paired t test). If p<0.05, there is a significant difference between the two groups.
3.1 Model performance evaluation and CO2 Driven Surface Resistance Sensitivity
To assess the availability and reliability of climate model data, we compared four key climate variables (relative humidity, downward longwave radiation, downward shortwave radiation, and temperature) from the four global GCMs with observational data (Kling et al., 2012; Dahri et al., 2021; Zhang et al., 2024). Results indicate a strong agreement between model outputs and observations. For relative humidity (hurs), all models show high correlation coefficients (>0.85) and standard deviations within 10 % of observed values, indicating accurate humidity simulation (Fig. 1a). For the downward longwave radiation (rlds), model variability fits well with observations, with correlation coefficients above 0.75 and standard deviations mostly within 15 % (Fig. 1b). The downward shortwave radiation (rsds) shows slightly larger discrepancies, but still acceptable model performance (Fig. 1c), with correlation coefficients above 0.65 and standard deviations within 20 %. The simulation of temperature (tas) is particularly robust, with correlation coefficients exceeding 0.9 and standard deviations within 5 % (Fig. 1d). These results confirm that the selected GCMs are capable of accurately reproducing historical climatic conditions at the global scale.
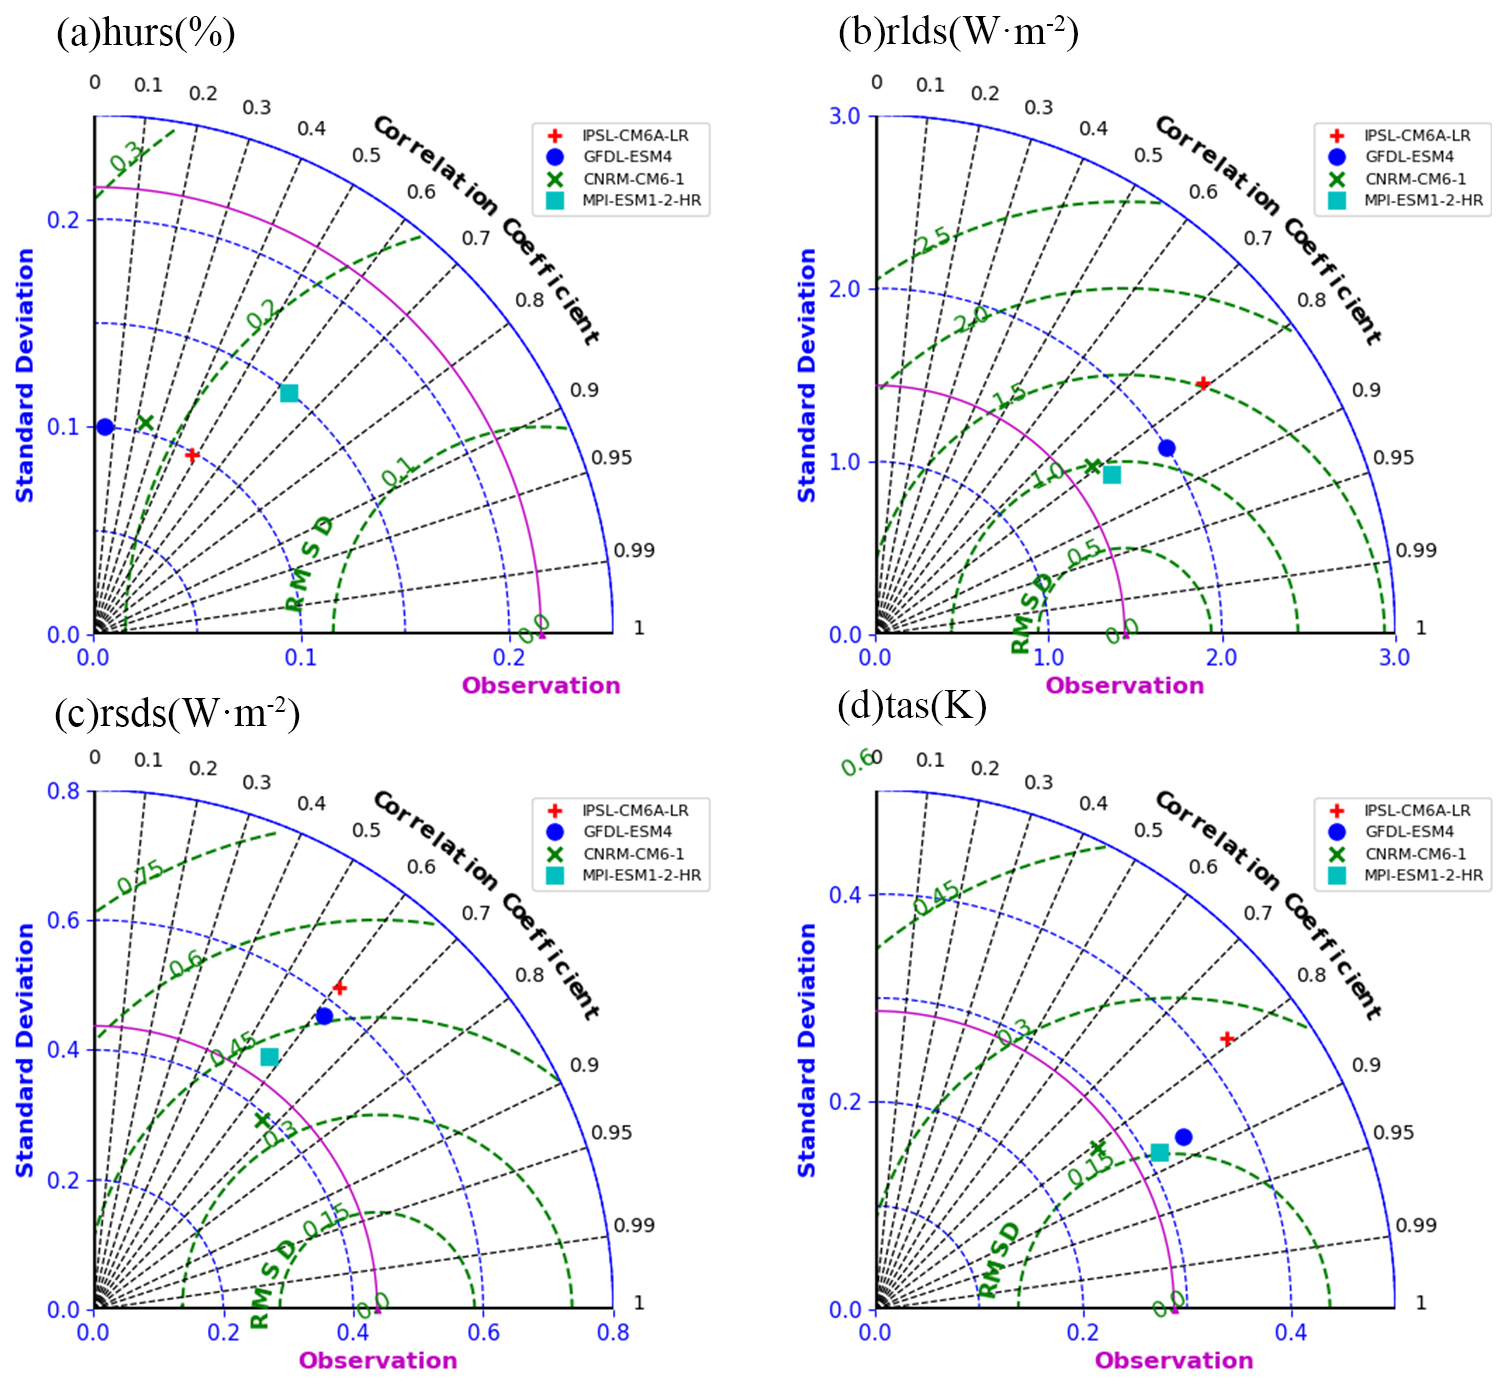
Figure 1Taylor diagrams of simulated climate variables compared to observations across the globe for the period 1979–2019. Panels show performance of four GCMs in simulating: (a) relative humidity (hurs), (b) downward longwave radiation (rlds), (c) downward shortwave radiation (rsds), and (d) near-surface air temperature (tas). The dashed green lines represent root mean square deviation (RMSD).
Using these validated models under multiple SSP scenarios, we evaluated the sensitivity of surface resistance (Δrs) to changes in atmospheric CO2 concentration (Δ[CO2]). A robust linear dependence was found between the two variables (Fig. 2), consistent across models. The inter model variability of the slope coefficient within ±15 % of the mean, demonstrating robustness. In historical simulations (1850–2014), the baseline CO2 concentration is ∼284 ppm, with surface resistance around ∼52 s m−1. Under the high emission SSP5-8.5 scenario (2071–2100), rs rises to ∼78 s m−1, while CO2 increases to ∼935 ppm. This implies a ∼50 % increase in rs for a ∼229 % increase in CO2, revealing a stronger ET model sensitivity compared to earlier CMIP5-based projections.
Additionally, the relative sensitivity parameter Sr remains spatially and temporally stable, ranging from 0.08 % ppm−1 to 0.11 % ppm−1 (Fig. 3). This confirms that CMIP6 models retain the CO2 rs coupling dynamics previously observed in CMIP5, but with increased sensitivity to CO2.
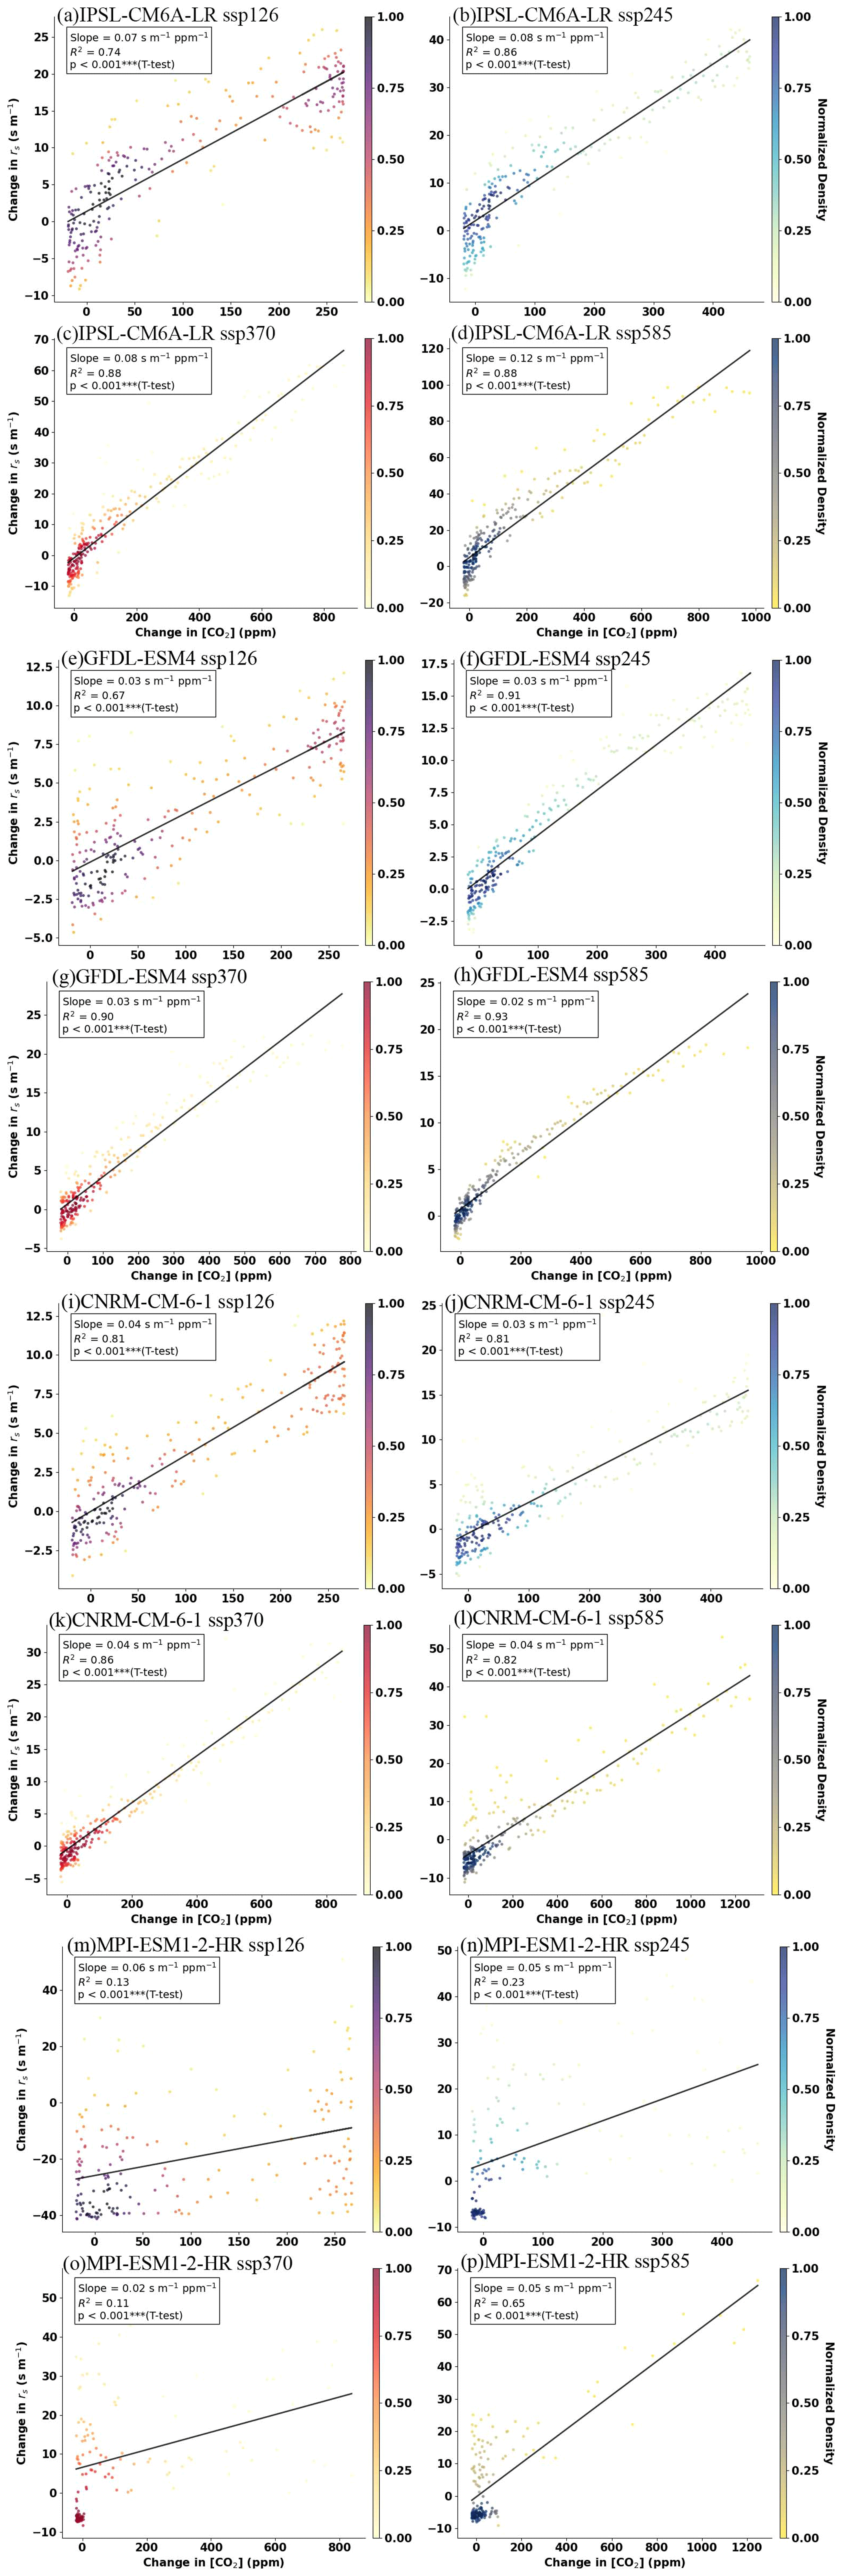
Figure 2Ensemble mean relationship between changes in stomatal resistance (rs) and atmospheric CO2 concentration ([CO2]) across four ESMs, relative to the 1851–1950 baseline, under different SSP scenarios. Panels (a)–(d) show IPSL-CM6A-LR results for SSP1-2.6, SSP2-4.5, SSP3-7.0, and SSP5-8.5; (e–h) GFDL-ESM4 results for the same scenarios; (i–l) CNRM-CM6-1 projections under equivalent SSPs; and (m–p) MPI-ESM1-2-HR simulations following the SSP scenario hierarchy. All analyses use a consistent baseline climatology (1851–1950) and apply the same radiative scaling conventions.
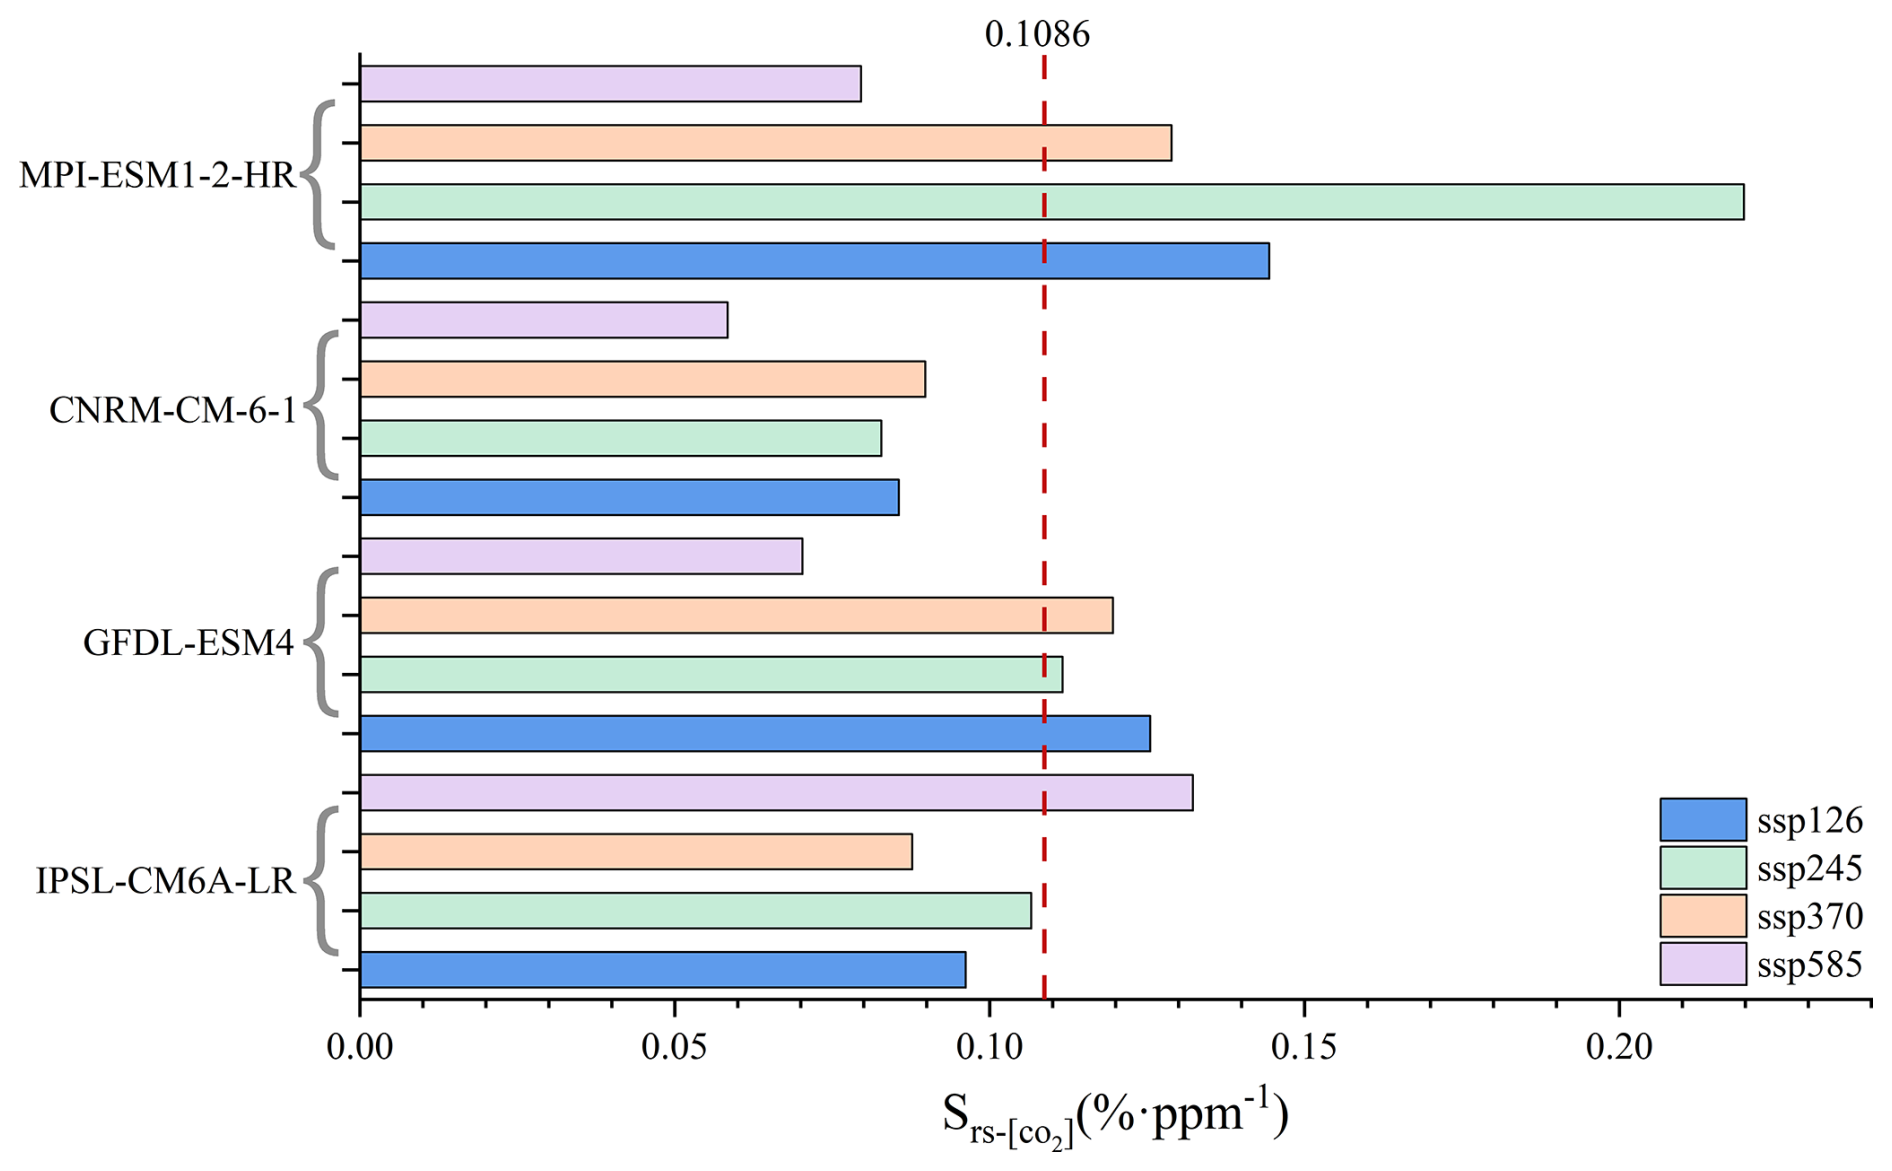
Figure 3Sensitivity of climate models to atmospheric CO2 concentrations under different SSP scenarios. The horizontal axis shows the sensitivity metric (% ppm−1), while the vertical axis lists the climate models. Colored bars represent different SSP scenarios. The dashed red line indicates the multi-model mean value of 0.1086.
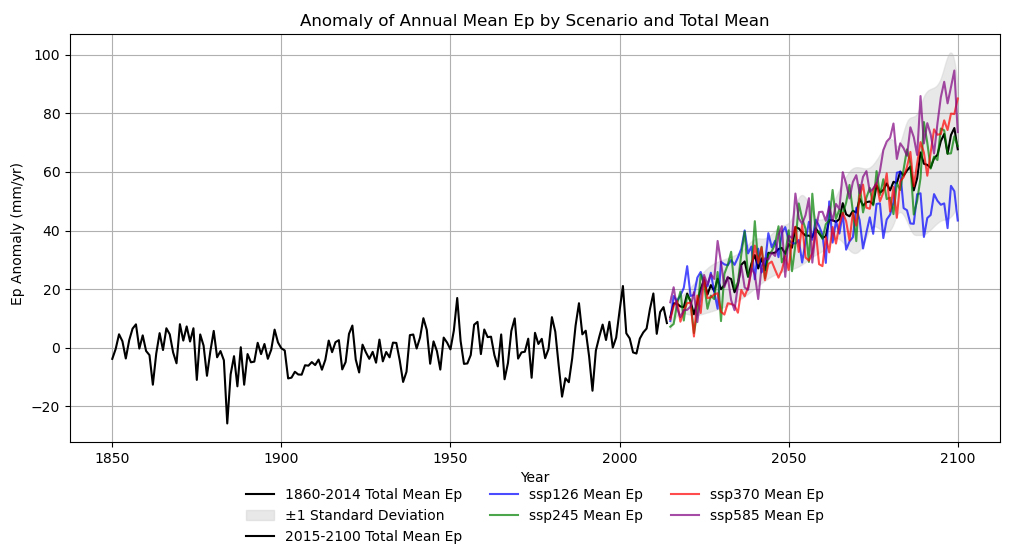
Figure 4Normalized annual mean Ep values across historical and future SSP scenarios. The black line represents the historical mean (1860–2014), while colored lines correspond to SSP1-2.6, SSP2-4.5, SSP3-7.0, and SSP5-8.5. The shaded gray area denotes ±1 standard deviation.
3.2 Annual Changes in Ep from the Updated PM-RC-CO2 Model
The updated PM-RC-CO2 model, calibrated using CMIP6 data, shows a persistent upward trend in potential evapotranspiration (Ep) during historical simulations (1860–2014). By more accurately capturing nonlinear vegetation–climate interactions, the updated formulation improves the representation of CO2-induced physiological feedbacks. This improvement is particularly evident under high-emission scenarios. From 2015 to 2100, the rates of Ep intensification differ across scenarios: under SSP5-8.5, the average decadal growth rate is approximately 2.1 %, whereas under SSP1-2.6, it stands at 1.2 %. Under SSP5-8.5, standardized Ep uncertainty (±1σ) rises from ±0.05 (2020–2040) to ±0.12 (2081–2100), indicating growing climate variability with increased CO2 concentrations.
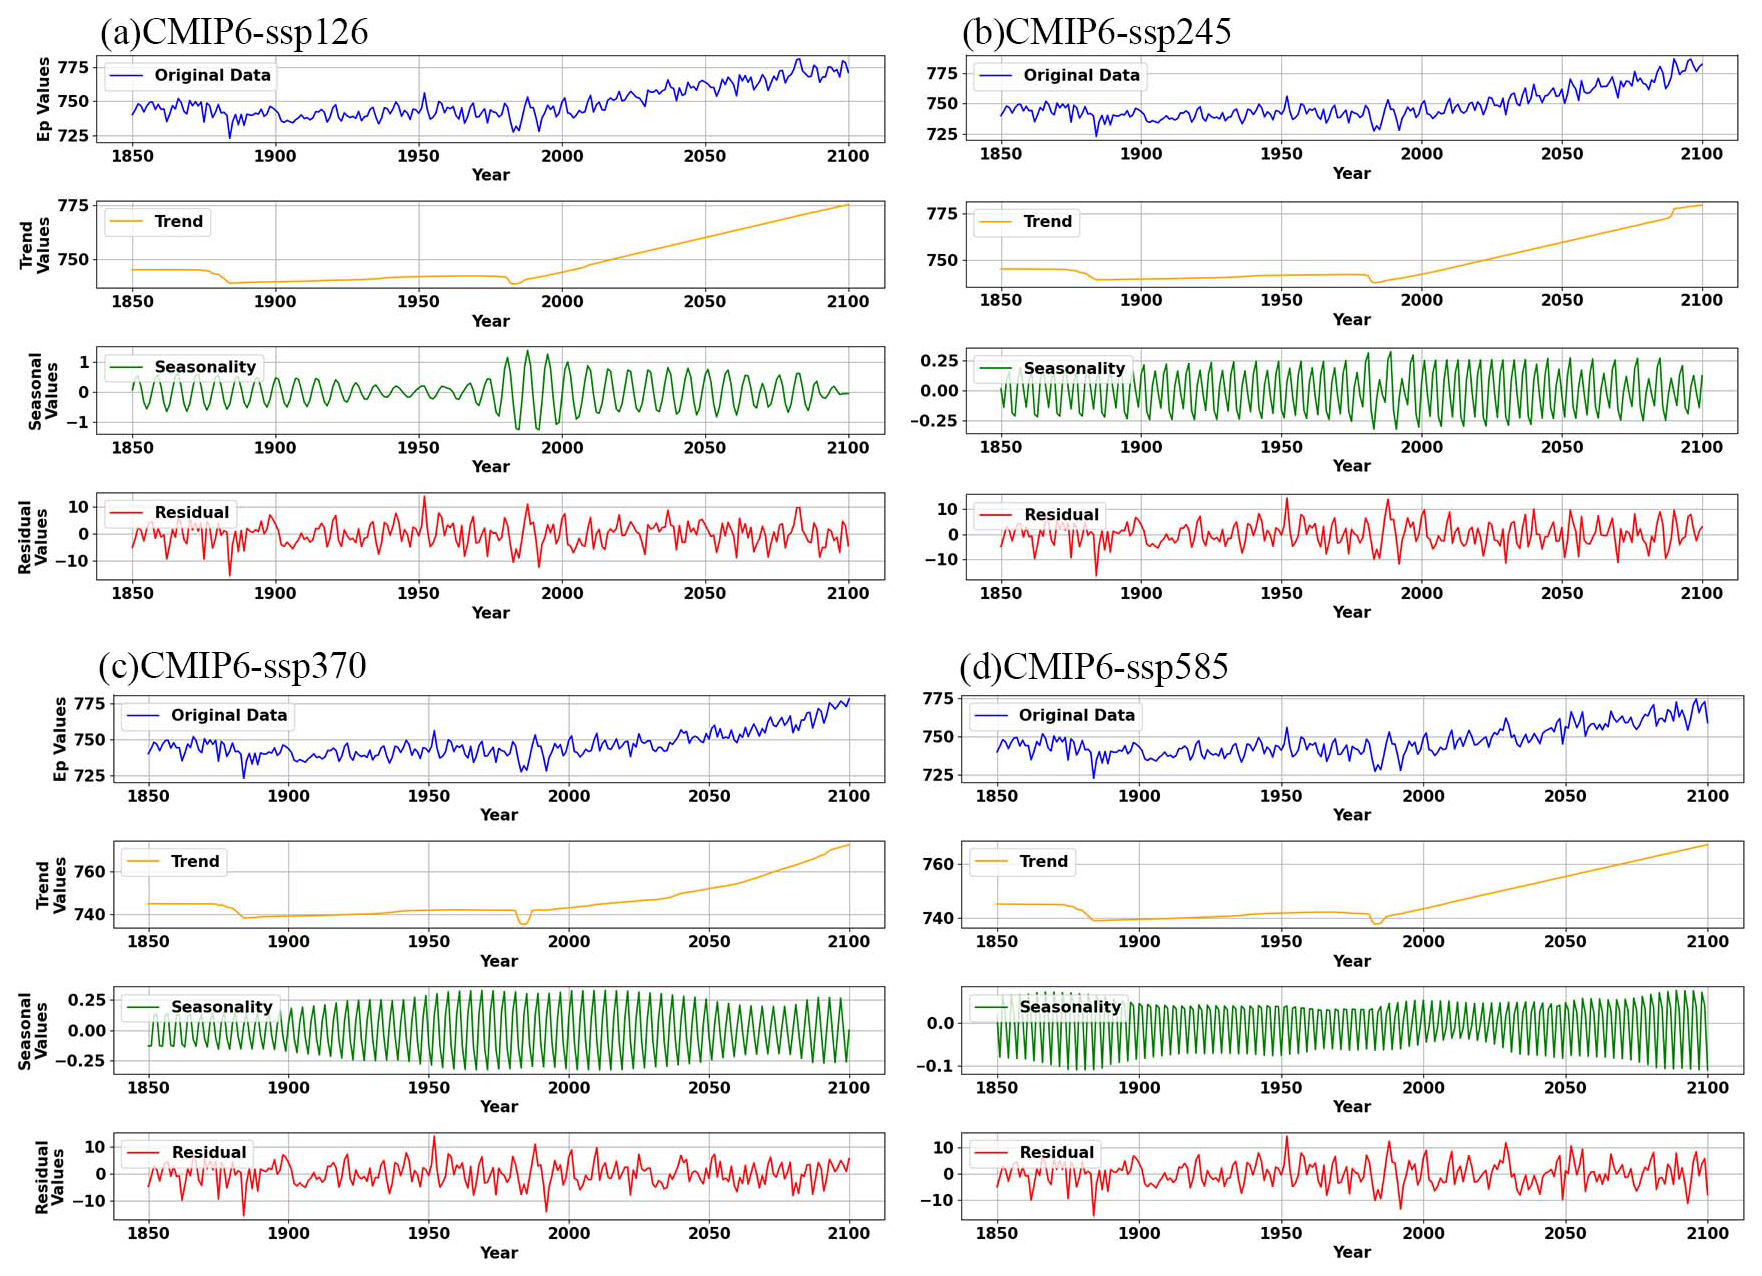
Figure 5Time series decomposition of climate variables from 1850 to 2100 under different SSP scenarios: (a) SSP1-2.6, (b) SSP2-4.5, (c) SSP3-7.0, (d) SSP5-8.5. Each panel illustrates long-term trends, seasonal patterns, and residual variations within the scenario.
In order to further explore the characteristics of scenario related trend changes, we decompose the standardized annual Ep trend from 1850 to 2100. The low-emission SSP1-2.6 scenario shows gradual Ep increase of 58.3±14 mm yr−1. The high-emission scenario (SSP5-8.5) exhibits a steeper Ep increase of 167.9±36 mm yr−1. Seasonal decomposition shows ongoing cyclical patterns, but under SSP5-8.5, the amplitude of seasonal signals weakens after 2050, reflecting rising climate instability. Despite uncertainties, BEAST's probabilistic framework confirms robust stratification under SSPs, with SSP5-8.5 trends exceeding SSP1-2.6 by 187 % by 2100.
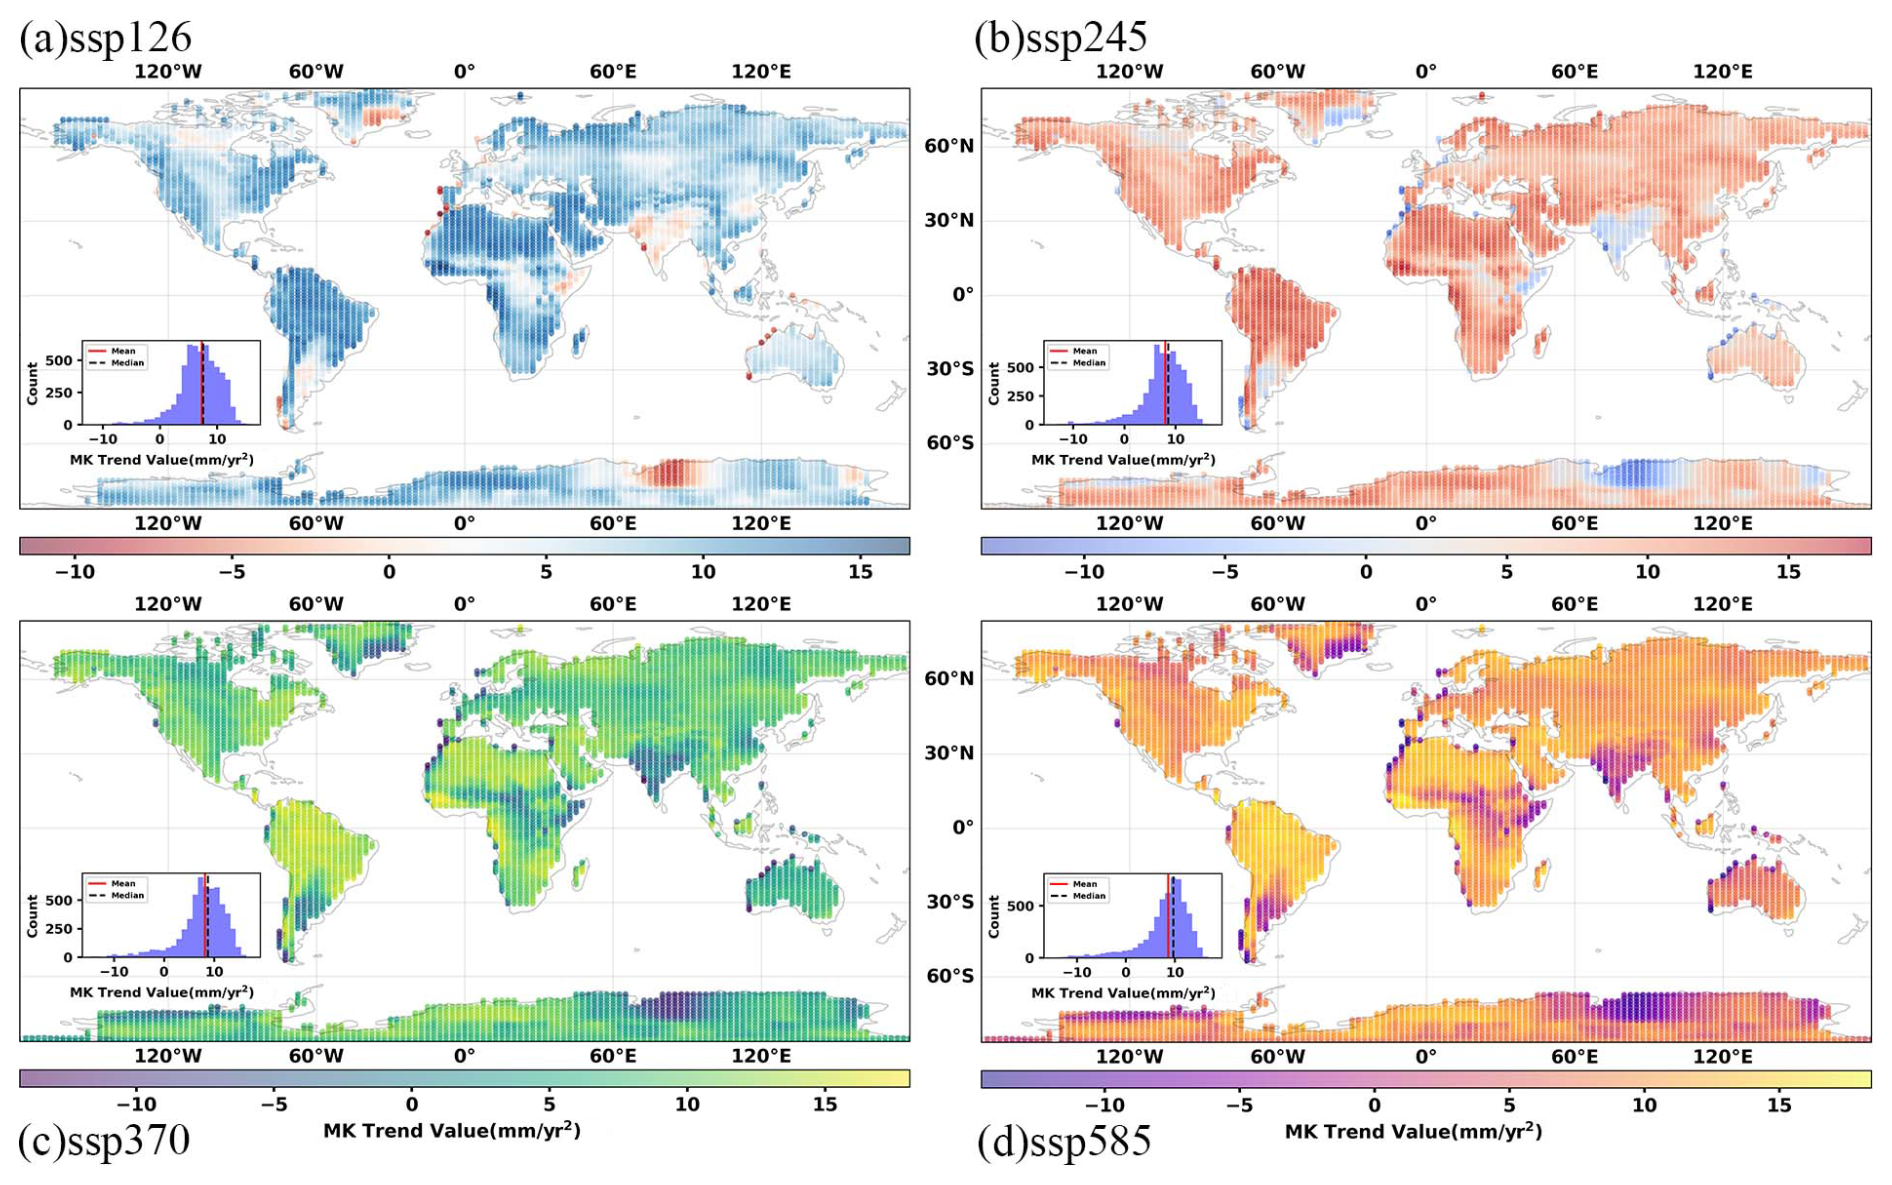
Figure 6Global Ep trend patterns derived from the Mann-Kendall (MK) method using the original ET-RC-CO2 model under (a) SSP1-2.6, (b) SSP2-4.5, (c) SSP3-7.0, and (d) SSP5-8.5. Associated histograms display the frequency distribution of Ep trend magnitudes across spatial domains.
3.3 Global Trends in Ep Calculated from Original and Updated PM-RC-CO2 Models
The original ET-RC-CO2 model Ep trend under different scenarios is shown in Fig. 6. Under the SSP1-2.6 scenario, the Ep trends show a relatively modest increase. This indicates that in this scenario, the changes in Ep are relatively stable although significant. However, when it comes to the SSP5-8.5 scenario, there are more pronounced increases in Ep, especially in tropical and mid-latitude regions. These areas experience a more substantial upward trend in Ep compared to other regions. The histograms in Fig. 6 further demonstrate that as scenarios become more extreme, there are higher frequencies of strong positive trends in Ep. This suggests that under the influence of different socioeconomic and climate scenarios, Ep exhibits diverse trends, with more extreme scenarios leading to more intense and frequent positive Ep trends.
Compared with the original model, the updated model using CMIP6 data (Fig. 7) has a similar spatial pattern, but there are significant differences in the trend amplitude. In SSP2-4.5 and SSP3-7.0, the trend magnitudes are consistently larger, indicating a more pronounced increase in Ep. This suggests that the updated model has an enhanced sensitivity to climatic shifts, as it captures more significant changes in Ep under these scenarios. The histograms also reflect this, showing a shift towards higher frequencies of strong positive trends in the more extreme scenarios.
Figure 8 compares the original and updated models. The spatial distribution of trend differences shows that the updated model predicts higher Ep trends by 2–3 mm yr−1 in many regions under SSP3-7.0 and SSP5-8.5. This indicates an enhanced sensitivity of the updated model to climatic shifts, particularly in these more extreme scenarios. The differences are more pronounced in certain areas, suggesting that the updated model may better capture the regional variations in Ep trends.
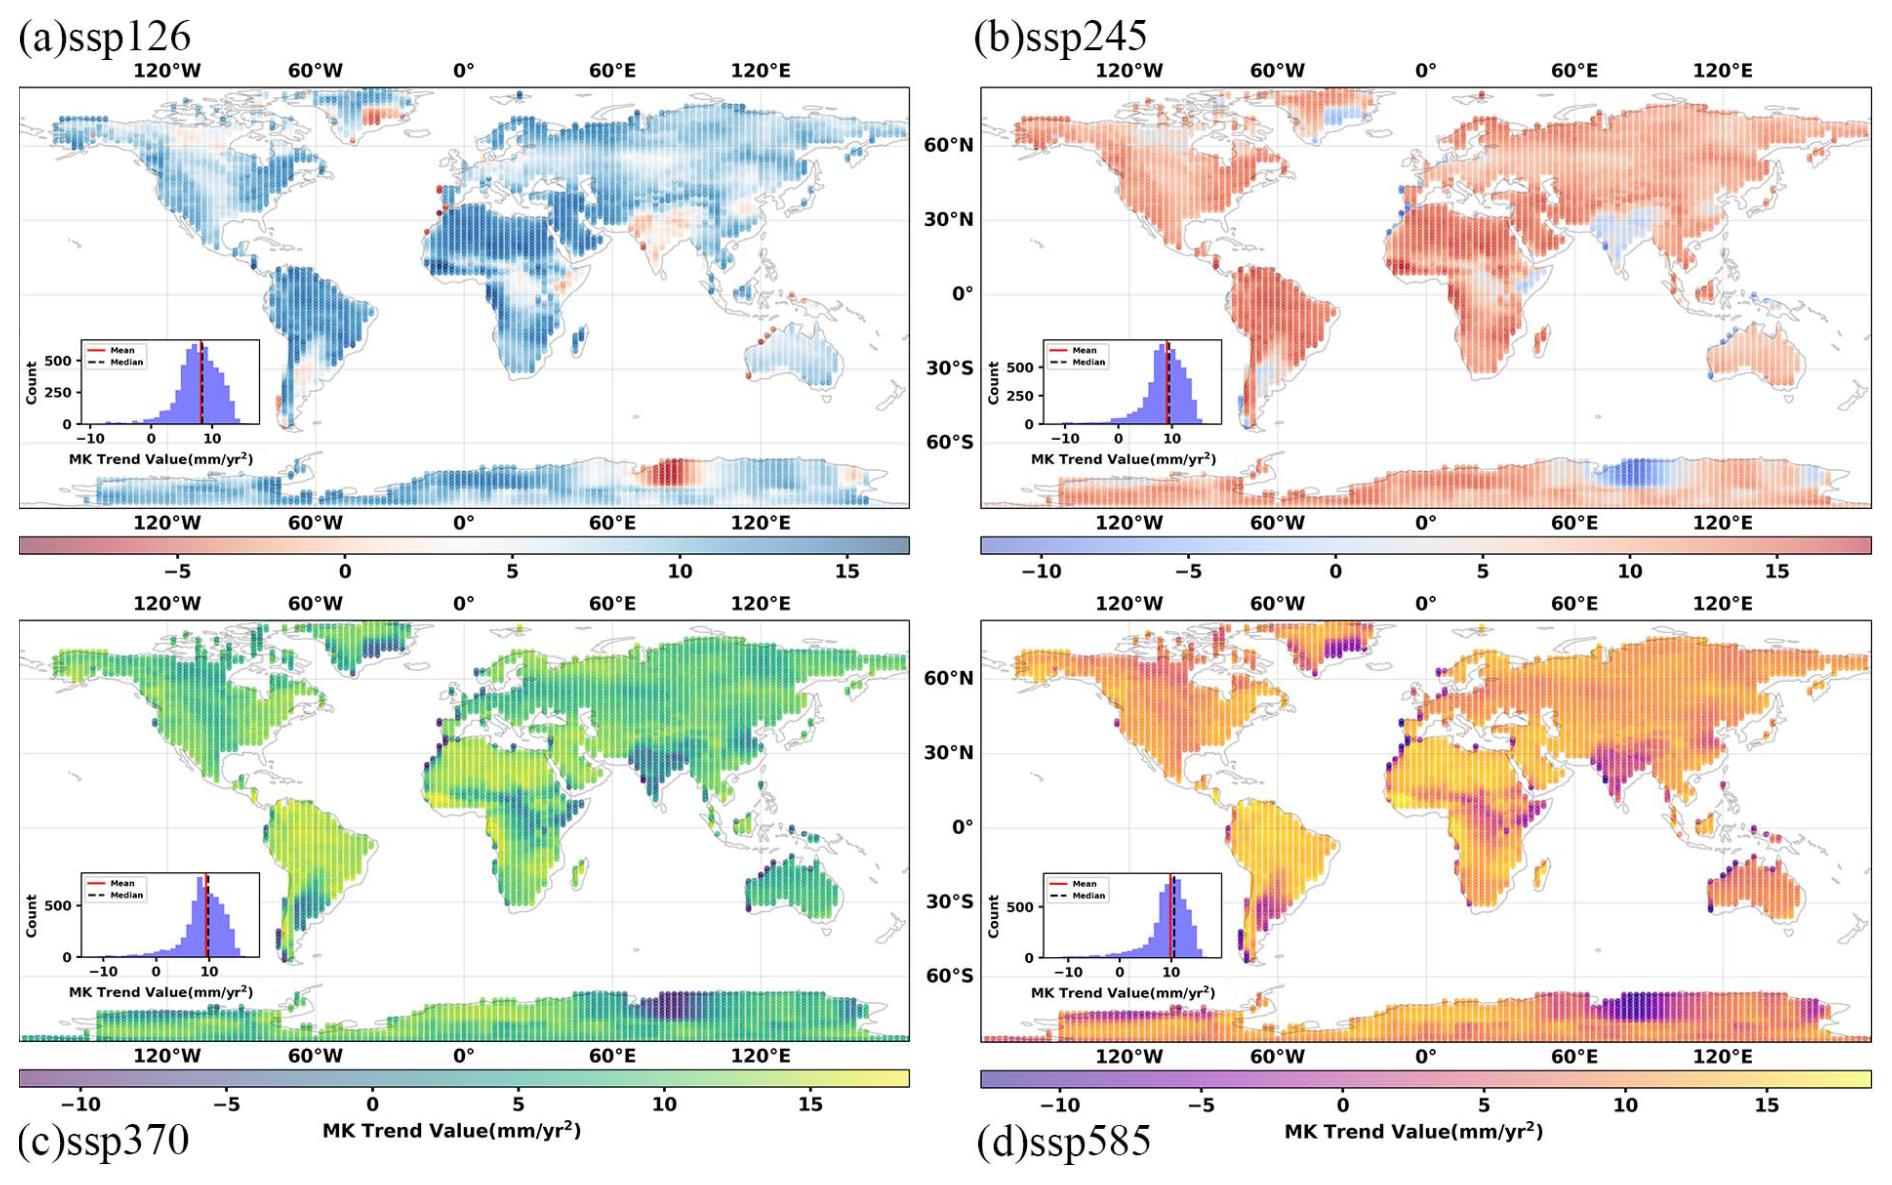
Figure 7Same as Fig. 6, but for the updated ET-RC-CO2 model.
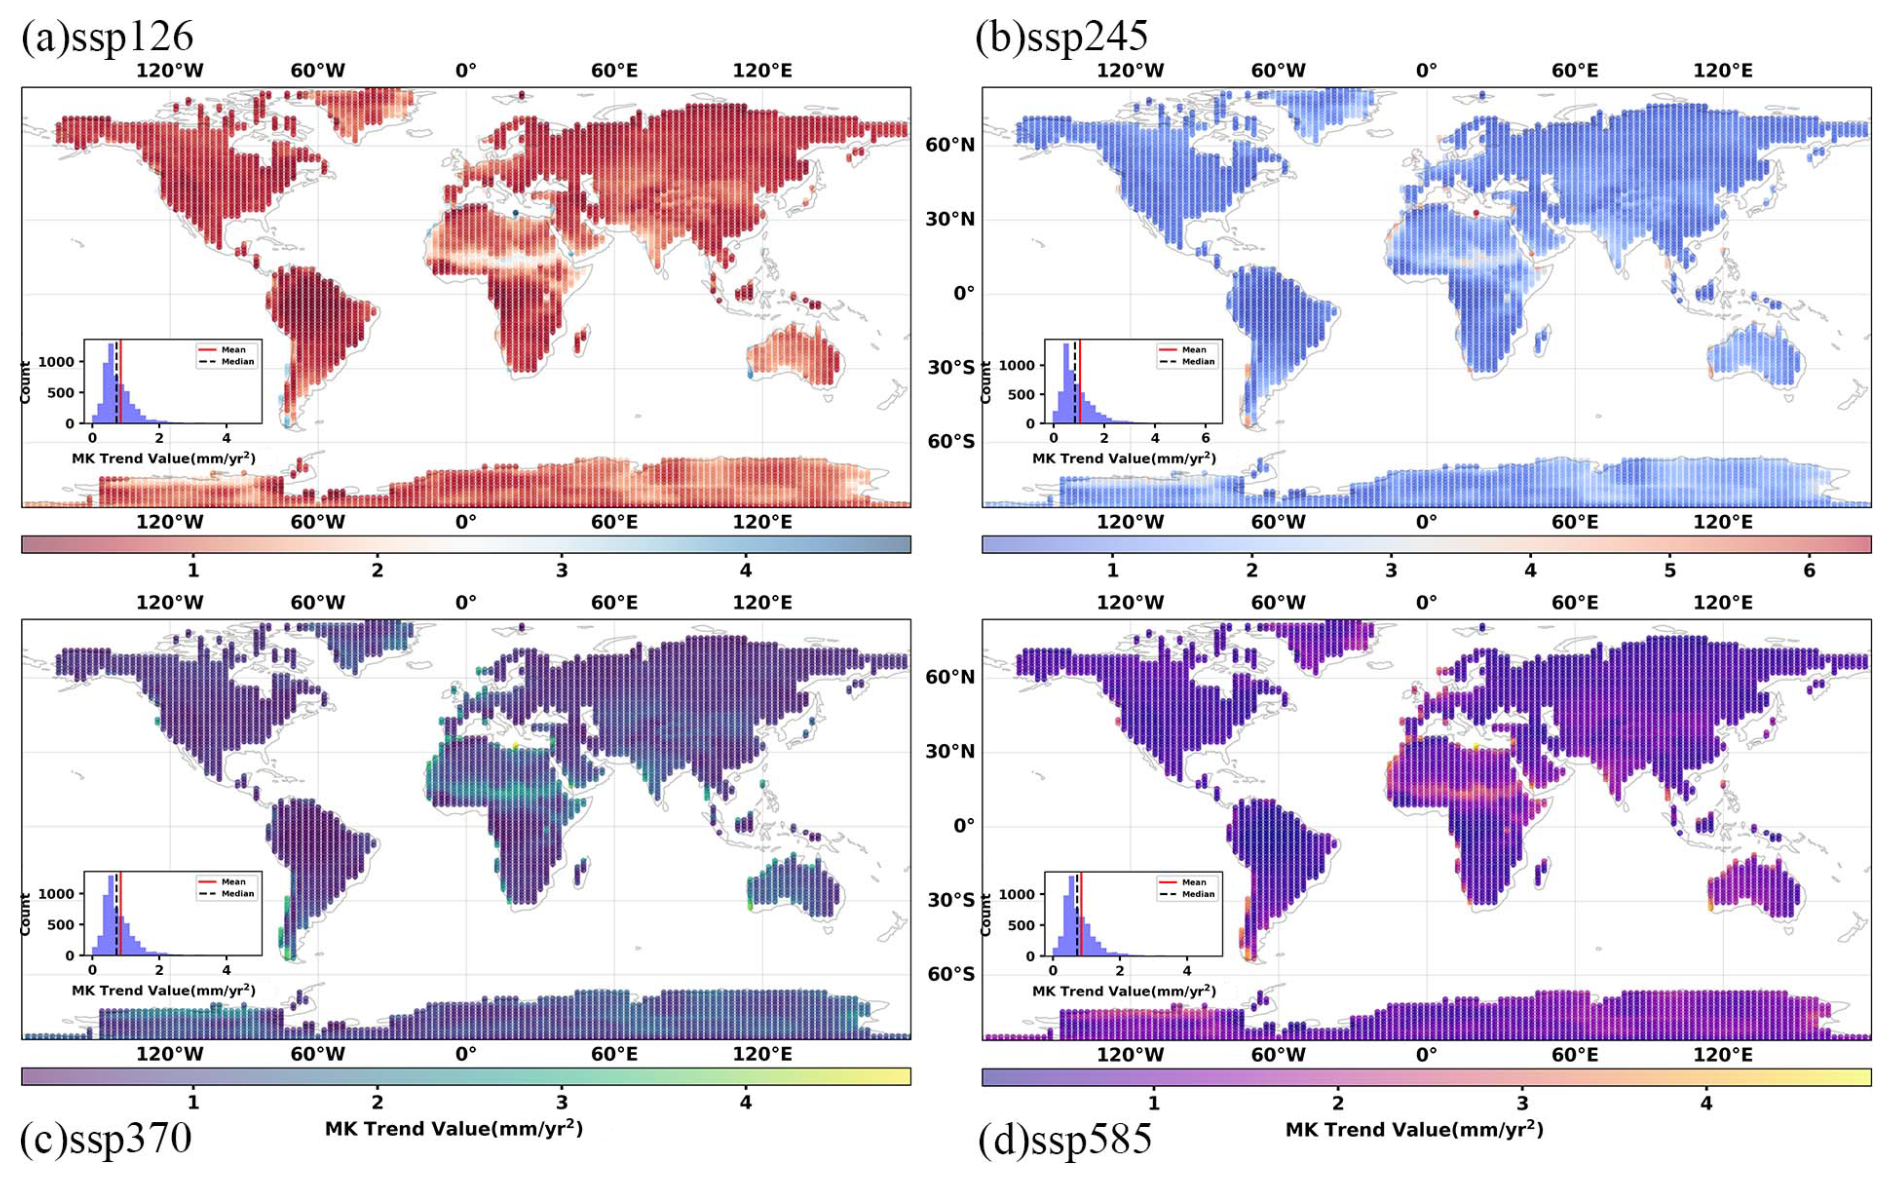
Figure 8Differences in global Ep trends between the updated and original ET-RC-CO2 models using CMIP6 data for (a) SSP1-2.6, (b) SSP2-4.5, (c) SSP3-7.0, and (d) SSP5-8.5. Associated histograms display the frequency distribution of Ep trend differences across spatial domains.
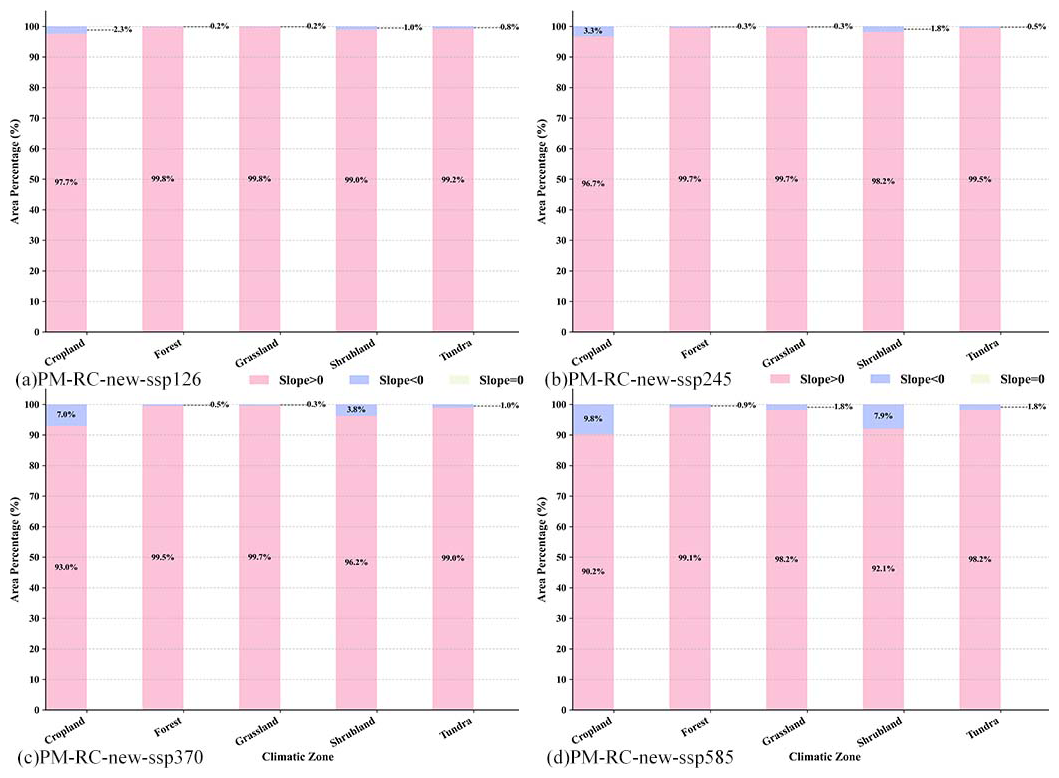
Regardless of the original or updated models, among the land use types such as Forest, Grassland and Tundra, the proportion of the area with MK trend greater than 0 (Slope >0) is generally very high (more than 95 %). These ecosystems are driven by climate change, and the Ep has a significant upward trend. The trend differentiation between Cropland and Shrubland is relatively obvious. For example, in the high emission scenario (SSP5-8.5), the proportion of farmland slope <0 in the updated model (1.8 %) is lower than that in the original model (5.3 %), and the proportion of shrub slope <0 in the updated model (3.9 %–9.5 %) is also different from that in the original model (8.3 %–18.6 %).
At the same time, updating the model effectively reduced the bias in trend estimation. The updated model also enhances the ability to capture CO2 physiological feedbacks and scenario-specific responses, thereby reducing biases in trend estimation. Under different scenarios, the proportion of Ep rising trend of various land uses under high emission scenarios (such as SSP5-8.5) is more prominent than that under medium and low emission scenarios (such as SSP1-2.6). This indicates that emission intensity exerts an amplifying effect on the differentiation of evapotranspiration trends across different land use types.
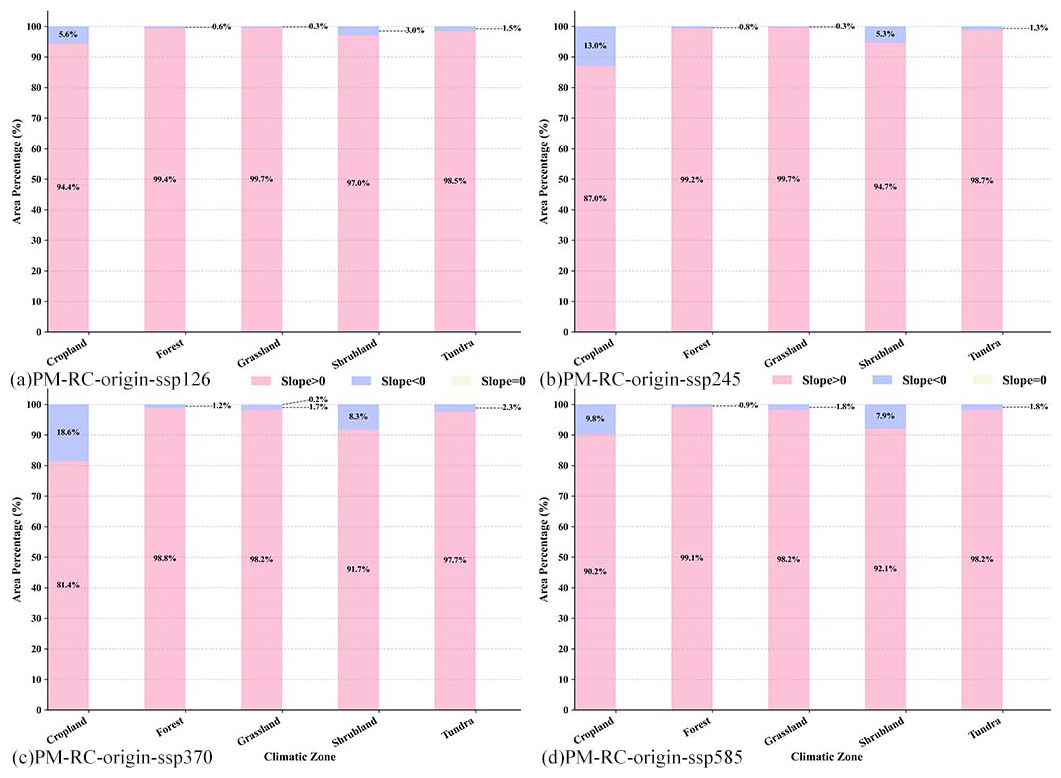
Figure 9Ep trend persentage across different land uses derived from the Mann-Kendall (MK) method using the original ET-RC-CO2 model under (a) SSP1-2.6, (b) SSP2-4.5, (c) SSP3-7.0, and (d) SSP5-8.5. The pink part represents MK trend greater than 0, the blue and purple part represents less than zero, and the light green part represents equal to zero.
3.4 Comparison Between Scenarios and Time Periods
We quantified Ep differences between original and updated models across scenarios (Fig. 11). Results show that the original model consistently underestimates Ep. Under SSP1-2.6, the updated formula's average Ep is 1.4 % higher than the original in the base period and 2.9 % higher in the late period. In SSP2-4.5, the difference widens from 1.3 % in the base period to 3.7 % in the late period. For SSP3-7.0, the late period difference reaches 5.0 %. In the high-emission SSP5-8.5, the late period difference is the largest at 6.3 %.
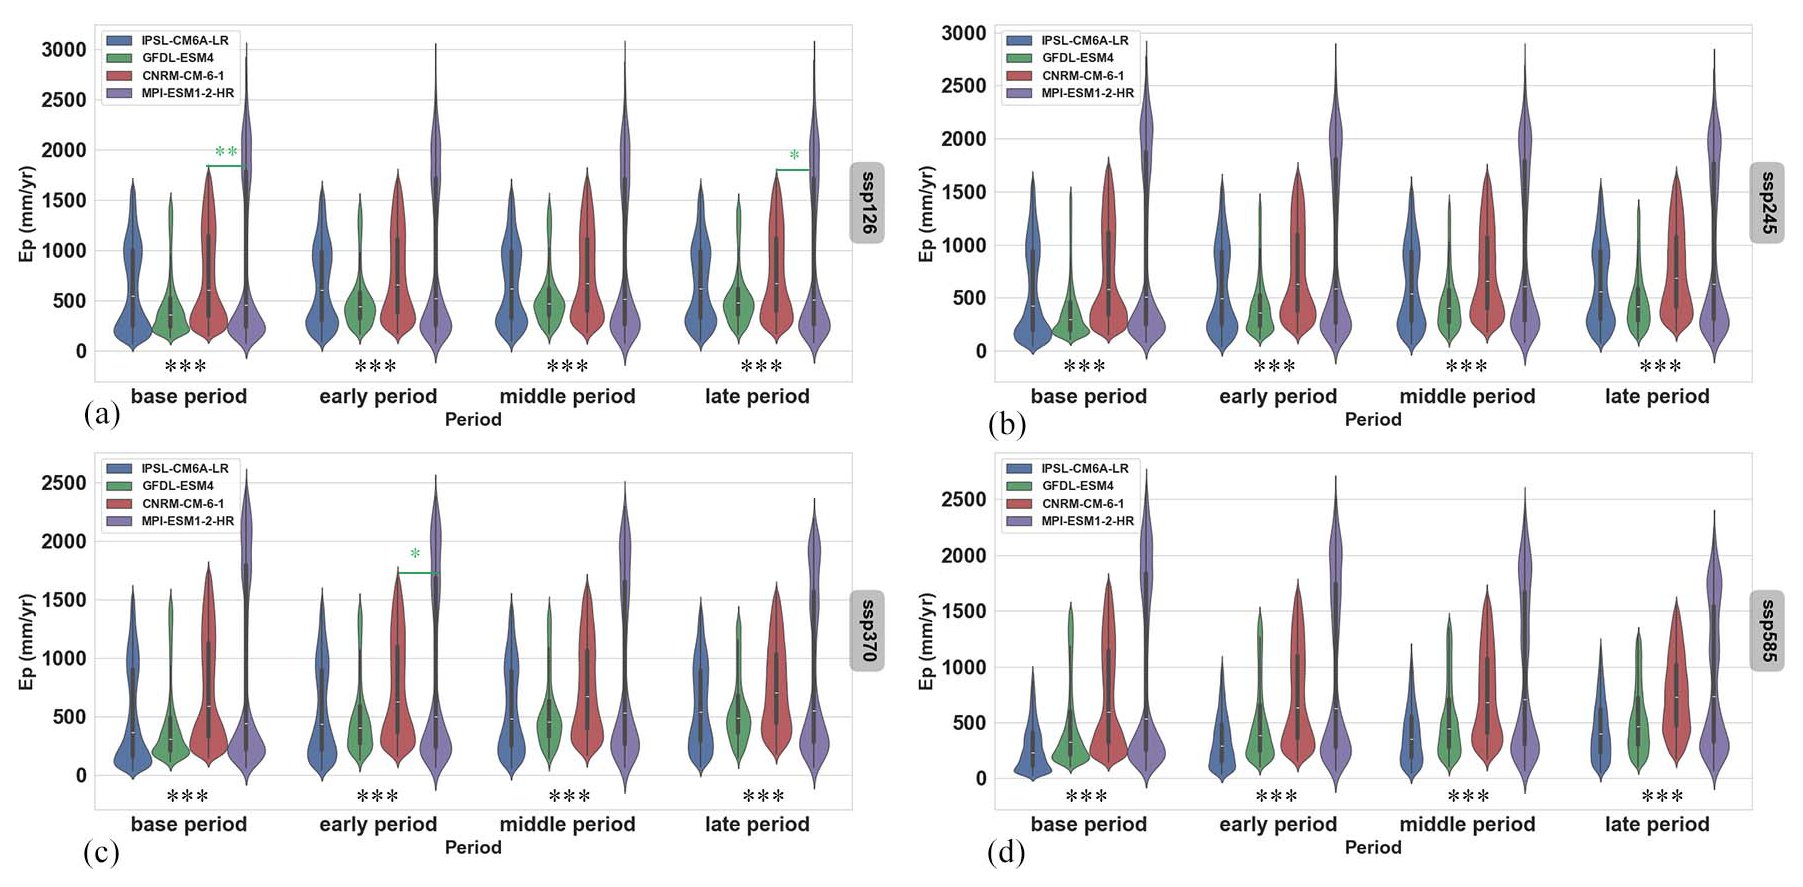
Moreover, we conducted a comparative analysis of the distributional results produced by the original and updated formulations across multiple models and time periods. Projections based on the original formulation (Fig. 12) indicate a marked increase in Ep severity from the historical baseline (1850–2014) to the late 21st century (2071–2100), with the biggest increases occurring after 2050. This upward trend persists under the updated formulation (Fig. 13), but the revised method exacerbates the projected Ep severity by an additional 12 %–18 %, particularly during the mid-century (2051–2070) and end-of-century under high-emission scenarios.
The comparative analysis (Figs. 12, 13) underscores the substantial sensitivity of Ep projections to the choice of model parameterization. Statistically significant differences (p<0.05) between the two methods were identified in 78 % of the late-century simulations. Notably, the divergence between original and updated formulations becomes increasingly pronounced with rising CO2 concentrations, particularly under high-forcing scenarios.
In the late 21st century under SSP3-7.0, the updated formulation systematically yields higher Ep means compared to the original: 5.1 % increase (599.9 vs. 578.7 mm yr−1) for IPSL-CM6A-LR, and 4.0 % (569.4 vs. 547.5 mm yr−1) for GFDL-ESM4. Under SSP5-8.5, MPI-ESM1-2-HR exhibits a 6.8 % increase (919.8 vs. 861.4 mm yr−1) by the end of a century, with its late-period Ep difference being 3.2 times larger than in the base period. Similarly, in CNRM-CM6-1, the Ep difference at the end of the century under SSP5-8.5 (758.2 vs. 715.4 mm yr−1) doubles that of SSP1-2.6 (773.8 vs. 751.9 mm yr−1) in the same period.
Overall, the updated formulation consistently produces higher Ep projections across all emission scenarios, with differences becoming more pronounced over time and with increasing emission intensity.
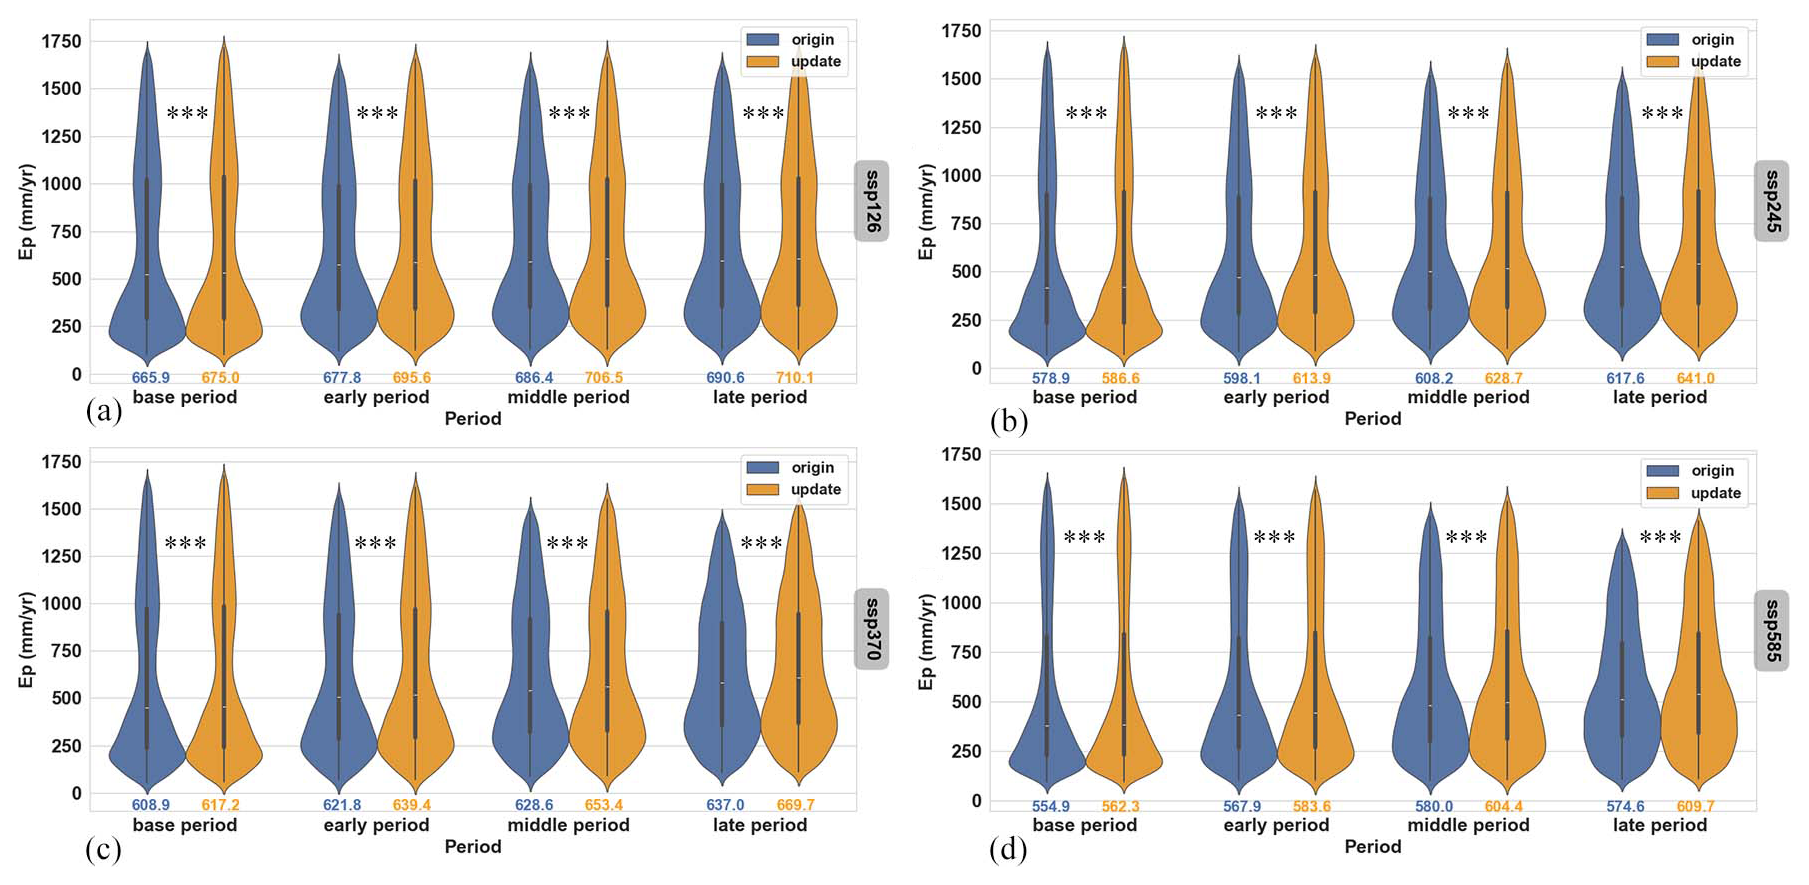
Figure 11Total annual Ep severity using both the original and updated ET-RC-CO2 formulas across different SSP scenarios and time periods: base (1850–2014), early (2015–2050), middle (2051–2070), and late (2071–2100). Panels: (a) SSP1-2.6, (b) SSP2-4.5, (c) SSP3-7.0, (d) SSP5-8.5. Significance levels: *** for p≤0.001, ** for p≤0.01, and * for p≤0.05.
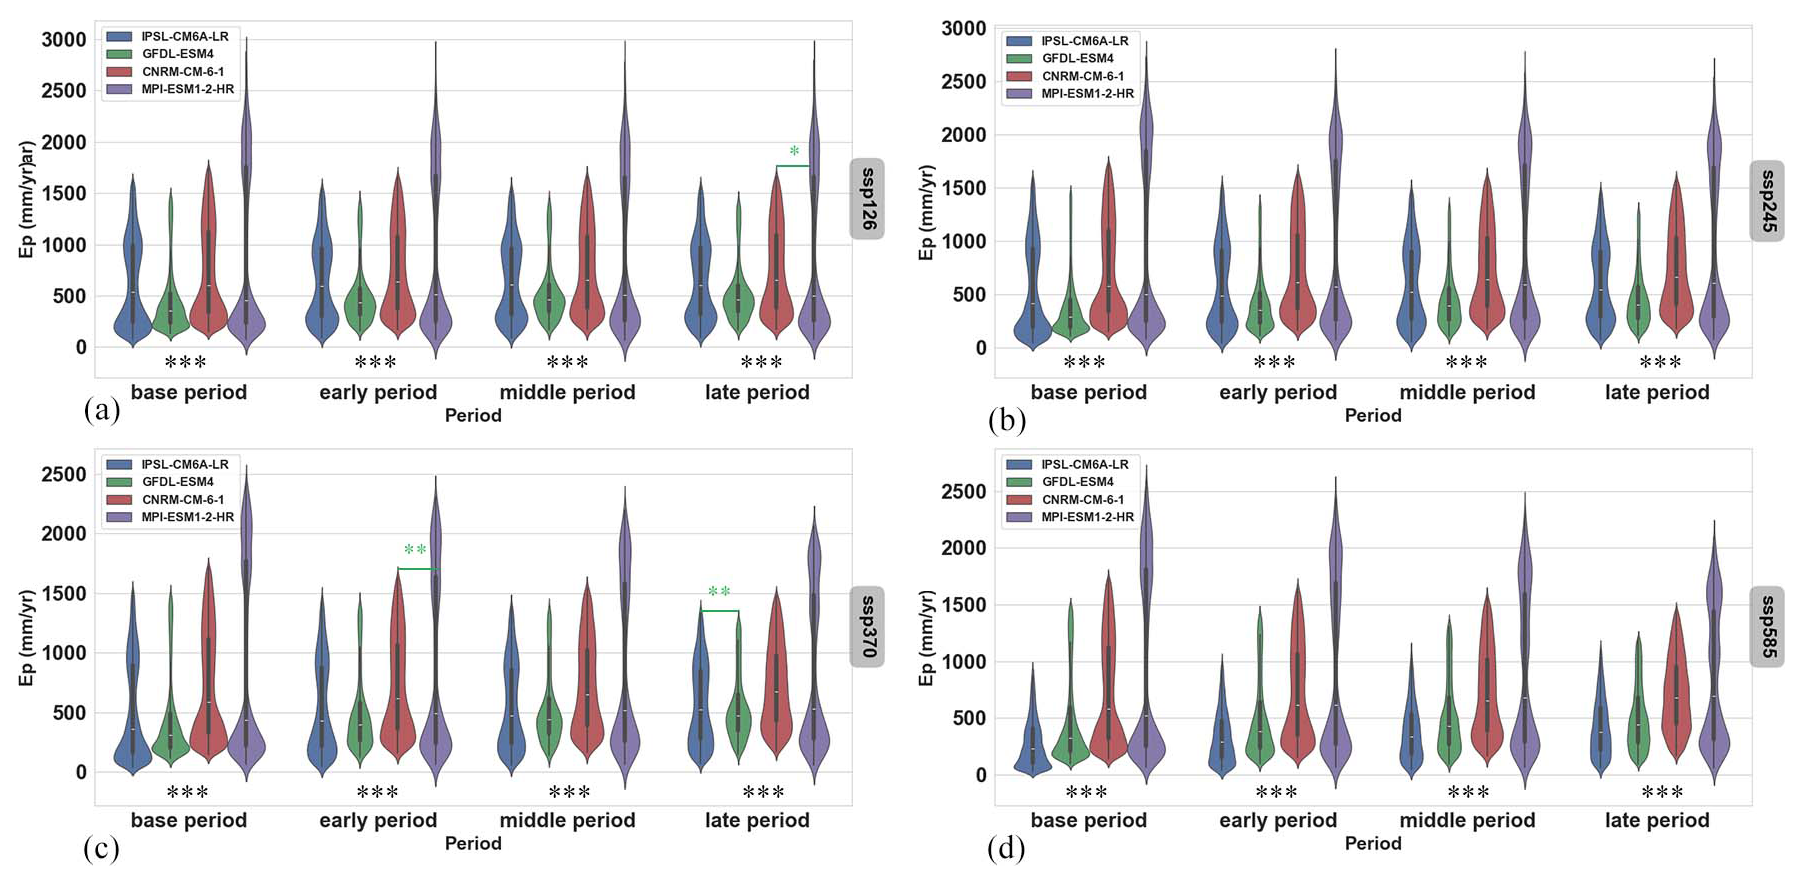
Figure 12Total annual Ep severity using the original ET-RC-CO2 formula across SSP scenarios and time periods: base (1850–2014), early (2015–2050), middle (2051–2070), and late (2071–2100). Panels: (a) SSP1-2.6, (b) SSP2-4.5, (c) SSP3-7.0, (d) SSP5-8.5. Significance levels: *** for p≤0.001, ** for p≤0.01, and * for p≤0.05. The upper green sign indicates p values between two GCMs; the lower sign indicates p value between all GCM pairs, except the lower green one.
The observed increase in Ep severity is consistent across multiple analytical methods, supporting earlier findings by Yang et al. (2023). Nevertheless, our results reveal that numerical estimates remain highly sensitive to model structure and parameterization schemes. Notably, evapotranspiration projections display heightened sensitivity during the latter half of the 21st century, especially under high-emission scenarios. This emphasizes the added value of incorporating CMIP6 data, which improves model responsiveness to evolving climatic drivers (Ma et al., 2018; Liu et al., 2022; Bai et al., 2025). These findings underscore the need for comprehensive, well-calibrated models in future climate risk assessments. A key insight from this study is the significant role of CO2-induced plant physiological responses in modulating evapotranspiration. To improve the robustness and predictive capability of future hydrological models, better integration of dynamic vegetation processes is essential.
4.1 Uncertainties Across Emission Scenarios
Substantial uncertainty persists in the current understanding and modelling of the ET process (Pan et al., 2020). As shown in Fig. 11, low-emission scenarios (such as SSP1-2.6) exhibit a more dispersed distribution across models than high-emission scenarios, leading to slightly elevated average Ep values under low-emission conditions.
To explore these uncertainties, we performed comparative analysis using ET models driven by the same forcing data. Distributions from both the original and updated formulations were evaluated across models and time periods (Figs. 10 and 11), helping to pinpoint sources of model uncertainty and guiding future improvements in ET estimates (Warszawski et al., 2014; Miralles et al., 2016).
Our results indicate that low- and medium-emission scenarios show greater inter-model variability. Moreover, the original model consistently underestimates long-term climate responses under medium- to high-emission scenarios. This underestimation may be attributed to a parameterization process that heavily relied on historical high-emission conditions, limiting it's ability to capture future feedback mechanisms under intensifying radiative forcings (Knowling et al., 2019; Cui et al., 2021).
Although the updated formulation demonstrates improved sensitivity to CO2 variations, there is still room for improvement – particularly under low-emission scenarios. These trends are shaped by varying driving factors, model architectures, and differences in parameterization approaches across existing ET datasets (Badgley et al., 2015; Michel et al., 2016). Future work should focus on reducing systemic bias in projections under low-emission scenarios.
4.2 Impacts, Limitations, and Prospects
This study relied on unadjusted CMIP6 outputs, which may introduce systematic errors when applied to the improved ET formulation. Future work could benefit from using bias-corrected CMIP6 datasets and accounting for systematic discrepancies in atmospheric forcing variables. Previous studies have shown that calibrated CMIP6 products can significantly enhance the representation of precipitation seasonality and CO2 trajectories (Raziei and Pereira, 2013a, b). Such improvements are especially critical in semi-arid regions, where more refined modeling can incorporate nonlinear feedbacks between stomatal conductance and atmospheric CO2, as well as biochemical parameterization for C3/C4 species (Ding et al., 2013; Potkay et al., 2025; Wu et al., 2025).
The current model assumes fixed vegetation responses to CO2, which is appropriate for large-scale analyses but less suitable for regional applications (Bao et al., 2021; Cui et al., 2023). Given the high specificity of vegetation types at regional scales, fixed-response models struggle to capture physiological variations among species. For finer-scale assessments, model accuracy can be enhanced by integrating detailed representations of vegetation physiological responses, such as dynamic correlation data between photosynthetic rate and CO2 concentration (Luo et al., 2018a, b). For example, dynamic stomatal conductivity models that respond to rapid CO2 and light fluctuations can increase transpiration estimates by 22 %–30 % under extreme conditions (Lawson and Vialet-Chabrand, 2019; Poyatos et al., 2016; Poyatos et al., 2021). The use of canopy conductance algorithms that account for photosynthetic pathway differences is also critical for accurately simulating ET in C4-dominated dryland ecosystems (Croft et al., 2017; Wei et al., 2019).
Advanced parameterization, such as linking foliar nitrogen and phosphorus content to photosynthetic efficiency, enables more ecosystem-specific transpiration estimates (Cernusak et al., 2010). When combined with vegetation indices like Normalized Differences Vegetation Index (NDVI) (Suarez et al., 2008; Sayago et al., 2017; Ballester et al., 2018), these refinements can reduce simulation error by up to 0.38 mm d−1 compared to FAO-56 methods (Allen et al., 2007; Pereira et al., 2021).
Integrating structural vegetation indices such as Leaf Area Index (LAI) and canopy height gradient, further improves the soil vegetation water coupling. Recent advances, such as the use of GEDI-derived canopy height products, have shown strong potential in separating soil evaporation from canopy transpiration via aerodynamic resistance calibration – particularly valuable in arid regions (Bao et al., 2022; Chen et al., 2022; Wu et al., 2024). Additionally, using the functional trait diversity threshold for grid selection has reduced uncertainty in carbon water coupling prediction in forest ecosystems by 12 %–15 % (Li et al., 2013; Xu et al., 2015; Zhang et al., 2018; Joswig et al., 2022; Wang et al., 2022).
These developments align with the improved Budyko framework, which integrates vegetation-mediated runoff elasticity and helps mitigate scale-dependent biases in regional ET partitioning (Roderick et al., 2014; Zeng et al., 2016; Mianabadi et al., 2019; Yang and Roderick, 2019; Scheff et al., 2022). Finally, improved spatial screening through moisture-limited grid selection criteria has been shown to reduce spatial heterogeneity in ET projections (Talsma et al., 2018; Lian et al., 2018; Lian et al., 2021).
This study integrates CMIP6 multi-scenario projections and CO2-vegetation coupling effects into the Penman-Monteith evapotranspiration (PM-ET) model, enhancing the representation of climate-vegetation interactions for improved hydrological projections. Methodological advances include the dynamic parameterization of stomatal resistance and scenario-dependent sensitivity analysis. The main findings are as follows:
-
The updated PM-ET model reduces CO2-induced evapotranspiration (ET) bias by 15 %–20 % compared to earlier approaches, showing improved consistency with CMIP6 simulations.
-
Evapotranspiration potential (Ep) exhibits a consistent upward trend – particularly under high-emission scenarios such as SSP5-8.5, where increases reach up to 635.1 mm yr−1 – driven by CO2-climate synergies.
-
Model parameterization plays a critical role in capturing CO2-physiological feedbacks; however, regional uncertainties remain due to heterogeneity in vegetation responses and methodological sensitivities – for instance, the distinct differences in responses between croplands and shrublands. Additionally, regional uncertainties persist due to heterogeneous vegetation responses and methodological sensitivities..
These findings highlight the need to further refine hydrological models by incorporating CMIP6-specific mechanisms, such as dynamic vegetation modules and biome-specific feedbacks. By improving the accuracy of scenario-based projections, this work contributes to more robust assessment of water resource risks under climate change and provides valuable insights for adaptation planning in both ecological and agricultural systems.
| λ | temperature-dependent latent heat of vaporization (J kg−1) |
| s | gradient of the saturation vapour pressure with respect to temperature(Pa K−1) |
| available energy (MJ m−2 d−1) | |
| ρa | air density (kg m−3) |
| Cp | specific heat at constant pressure(J kg−1 K−1) |
| rs | surface stomatal resistance (s m−1) |
| ra | Aerodynamic resistance (s m−1) |
| D | vapor pressure deficit (Pa) |
| γ | psychrometric constant (Pa K−1) |
| u | wind speed (m s−1) |
| T | air temperature (°C) |
| α | shortwave albedo |
All computer codes for data analysis are available from the corresponding author upon reasonable request.
All relevant data sets supporting this study have been explained in the text. No additional data sets were generated for this study.
XY: Conceptualization, Data curation, Project administration, Funding acquisition, Resources, Supervision, Software, Validation, Visualization, and Writing – Reviewing and Editing. YC: Formal analysis, Investigation, Resources, and Writing – Reviewing and Editing. HQ: Conceptualization, Writing – Reviewing and Editing. VAB: Validation, Formal analysis, and Writing – Reviewing and Editing. HS: Investigation; Writing- Reviewing and Editing. WS: Conceptualization, Writing- Reviewing and Editing. JZ: Formal analysis, Validation, Writing - Reviewing and Editing. QW: Methodology, Formal analysis, Validation, and Writing – Original draft preparation.
The contact author has declared that none of the authors has any competing interests.
Publisher's note: Copernicus Publications remains neutral with regard to jurisdictional claims made in the text, published maps, institutional affiliations, or any other geographical representation in this paper. While Copernicus Publications makes every effort to include appropriate place names, the final responsibility lies with the authors. Also, please note that this paper has not received English language copy-editing. Views expressed in the text are those of the authors and do not necessarily reflect the views of the publisher.
Our research was assisted by the National Key Research and Development Program of China (grant no. 2023YFC3006604), the Natural Science Foundation of Fujian Province (grant no. 2021J01627). We are also grateful for Yuting Yang, whose help was important in this work.
This research has been supported by China's National Key R&D Program (grant no. 2023YFC3006604) and Fujian Provincial Natural Science Foundation (grant no. 2021J01627).
This paper was edited by Xing Yuan and reviewed by two anonymous referees.
Ainsworth, E. A. and Rogers, A.: The response of photosynthesis and stomatal conductance to rising CO2: mechanisms and environmental interactions, Plant Cell Environ., 30, 258–270, https://doi.org/10.1111/j.1365-3040.2007.01641.x, 2007.
Allen, R. G., Tasumi, M., and Trezza, R.: Satellite-based energy balance for mapping evapotranspiration with internalized calibration (METRIC) – Model, J. Irrig. Drainage Eng-ASCE, 133, 380–394, https://doi.org/10.1061/(asce)0733-9437(2007)133:4(380), 2007.
Allen, R. G., Pereira, L. S., Raes, D., and Smith, M. J. F.: Rome: Crop evapotranspiration-Guidelines for computing crop water requirements-FAO Irrigation and drainage paper 56, 300, D05109, ISBN 92-5-104219-5, 1998.
Badgley, G., Fisher, J. B., Jiménez, C., Tu, K. P., and Vinukollu, R.: On Uncertainty in Global Terrestrial Evapotranspiration Estimates from Choice of Input Forcing Datasets, Journal of Hydrometeorology, 16, 1449–1455, https://doi.org/10.1175/JHM-D-14-0040.1, 2015.
Bai, H., Zhong, Y., Ma, N., Kong, D., Mao, Y., Feng, W., Wu, Y., and Zhong, M.: Changes and drivers of long-term land evapotranspiration in the Yangtze River Basin: A water balance perspective, Journal of Hydrology, 653, 132763, https://doi.org/10.1016/j.jhydrol.2025.132763, 2025.
Ballester, C., Zarco-Tejada, P. J., Nicolas, E., Alarcon, J. J., Fereres, E., Intrigliolo, D. S., and Gonzalez-Dugo, V.: Evaluating the performance of xanthophyll, chlorophyll and structure-sensitive spectral indices to detect water stress in five fruit tree species, Precision Agriculture, 19, 178–193, https://doi.org/10.1007/s11119-017-9512-y, 2018.
Bao, Y., Liu, T., Duan, L., Tong, X., Ji, H., Zhang, L., and Singh, V. P.: A comparative study of three stomatal conductance models for estimating evapotranspiration in a dune ecosystem in a semi-arid region, Sci. Total Environ., 802, https://doi.org/10.1016/j.scitotenv.2021.149937, 2022.
Bao, Y., Liu, T., Duan, L., Tong, X., Zhang, L., Singh, V. P., Lei, H., and Wang, G.: Comparison of an improved Penman-Monteith model and SWH model for estimating evapotranspiration in a meadow wetland in a semiarid region, Sci. Total Environ., 795, 148736, https://doi.org/10.1016/j.scitotenv.2021.148736, 2021.
Betts, R. A., Boucher, O., Collins, M., Cox, P. M., Falloon, P. D., Gedney, N., Hemming, D. L., Huntingford, C., Jones, C. D., Sexton, D. M. H., and Webb, M. J.: Projected increase in continental runoff due to plant responses to increasing carbon dioxide, Nature, 448, 1037–1041, https://doi.org/10.1038/nature06045, 2007.
Cernusak, L. A., Winter, K., and Turner, B. L.: Leaf nitrogen to phosphorus ratios of tropical trees: experimental assessment of physiological and environmental controls, New Phytol., 185, 770–779, https://doi.org/10.1111/j.1469-8137.2009.03106.x, 2010.
Chen, X., Yu, L., Cui, N., Cai, H., Jiang, X., Liu, C., Shu, Z., and Wu, Z.: Modeling maize evapotranspiration using three types of canopy resistance models coupled with single-source and dual-source hypotheses-A comparative study in a semi-humid and drought-prone region, Journal of Hydrology, 614, https://doi.org/10.1016/j.jhydrol.2022.128638, 2022.
Croft, H., Chen, J. M., Luo, X. Z., Bartlett, P., Chen, B., and Staebler, R. M.: Leaf chlorophyll content as a proxy for leaf photosynthetic capacity, Glob. Change Biol., 23, 3513–3524, https://doi.org/10.1111/gcb.13599, 2017.
Cui, N., He, Z., Jiang, S., Wang, M., Yu, X., Zhao, L., Qiu, R., Gong, D., Wang, Y., and Feng, Y.: Inter-comparison of the Penman-Monteith type model in modeling the evapotranspiration and its components in an orchard plantation of Southwest China, Agric. Water Manage., 289, 108541, https://doi.org/10.1016/j.agwat.2023.108541, 2023.
Cui, T., Sreekanth, J., Pickett, T., Rassam, D., Gilfedder, M., and Barrett, D.: Impact of model parameterization on predictive uncertainty of regional groundwater models in the context of environmental impact assessment, Environmental Impact Assessment Review, 90, 106620, https://doi.org/10.1016/j.eiar.2021.106620, 2021.
Cuzick, J.: A wilcoxon-type test for trend, Statistics in Medicine, 4, 87–90, https://doi.org/10.1002/sim.4780040112, 1985.
Dahri, Z. H., Ludwig, F., Moors, E., Ahmad, S., Ahmad, B., Ahmad, S., Riaz, M., and Kabat, P.: Climate change and hydrological regime of the high-altitude Indus basin under extreme climate scenarios, Sci. Total Environ., 768, https://doi.org/10.1016/j.scitotenv.2020.144467, 2021.
Ding, R. S., Kang, S. Z., Zhang, Y. Q., Hao, X. M., Tong, L., and Du, T. S.: Partitioning evapotranspiration into soil evaporation and transpiration using a modified dual crop coefficient model in irrigated maize field with ground-mulching, Agric. Water Manage., 127, 85–96, https://doi.org/10.1016/j.agwat.2013.05.018, 2013.
Eyring, V., Bony, S., Meehl, G. A., Senior, C. A., Stevens, B., Stouffer, R. J., and Taylor, K. E.: Overview of the Coupled Model Intercomparison Project Phase 6 (CMIP6) experimental design and organization, Geosci. Model Dev., 9, 1937–1958, https://doi.org/10.5194/gmd-9-1937-2016, 2016.
Gimeno-Sotelo, L., Fernández-Alvarez, J. C., Nieto, R., Vicente-Serrano, S. M., and Gimeno, L.: The increasing influence of atmospheric moisture transport on hydrometeorological extremes in the Euromediterranean region with global warming, Commun. Earth Environ., 5, 11, https://doi.org/10.1038/s43247-024-01787-9, 2024a.
Gimeno-Sotelo, L., Bevacqua, E., Fernández-Alvarez, J. C., Barriopedro, D., Zscheischler, J., and Gimeno, L.: Projected changes in extreme daily precipitation linked to changes in precipitable water and vertical velocity in CMIP6 models, Atmos. Res., 304, 8, https://doi.org/10.1016/j.atmosres.2024.107413, 2024b.
Hamed, K. H.: Trend detection in hydrologic data: The Mann–Kendall trend test under the scaling hypothesis, Journal of Hydrology, 349, 350–363, https://doi.org/10.1016/j.jhydrol.2007.11.009, 2008.
Jasechko, S., Sharp, Z. D., Gibson, J. J., Birks, S. J., Yi, Y., and Fawcett, P. J.: Terrestrial water fluxes dominated by transpiration, Nature, 496, 347, https://doi.org/10.1038/nature11983, 2013.
Jones, C. D., Arora, V., Friedlingstein, P., Bopp, L., Brovkin, V., Dunne, J., Graven, H., Hoffman, F., Ilyina, T., John, J. G., Jung, M., Kawamiya, M., Koven, C., Pongratz, J., Raddatz, T., Randerson, J. T., and Zaehle, S.: C4MIP – The Coupled Climate–Carbon Cycle Model Intercomparison Project: experimental protocol for CMIP6, Geosci. Model Dev., 9, 2853–2880, https://doi.org/10.5194/gmd-9-2853-2016, 2016.
Joswig, J. S., Wirth, C., Schuman, M. C., Kattge, J., Reu, B., Wright, I. J., Sippel, S. D., Rueger, N., Richter, R., Schaepman, M. E., van Bodegom, P. M., Cornelissen, J. H. C., Diaz, S., Hattingh, W. N., Kramer, K., Lens, F., Niinemets, U., Reich, P. B., Reichstein, M., Roemermann, C., Schrodt, F., Anand, M., Bahn, M., Byun, C., Campetella, G., Cerabolini, B. E. L., Craine, J. M., Gonzalez-Melo, A., Gutierrez, A. G., He, T., Higuchi, P., Jactel, H., Kraft, N. J. B., Minden, V., Onipchenko, V., Penuelas, J., Pillar, V. D., Sosinski, E., Soudzilovskaia, N. A., Weiher, E., and Mahecha, M. D.: Climatic and soil factors explain the two-dimensional spectrum of global plant trait variation, Nature Ecology & Evolution, 6, 36, https://doi.org/10.1038/s41559-021-01616-8, 2022.
Keenan, T. F. and Williams, C. A.: The Terrestrial Carbon Sink, in: Annual Review of Environment and Resources, Vol 43, edited by: Gadgil, A., and Tomich, T. P., Annual Review of Environment and Resources, Annual Reviews, Palo Alto, 43, 219–243, https://doi.org/10.1146/annurev-environ-102017-030204, 2018.
Kling, H., Fuchs, M., and Paulin, M.: Runoff conditions in the upper Danube basin under an ensemble of climate change scenarios, Journal of Hydrology, 424, 264–277, https://doi.org/10.1016/j.jhydrol.2012.01.011, 2012.
Knowling, M. J., White, J. T., and Moore, C. R.: Role of model parameterization in risk-based decision support: An empirical exploration, Advances in Water Resources, 128, 59–73, https://doi.org/10.1016/j.advwatres.2019.04.010, 2019.
Kong, R., Zhang, Z. X., Yu, Z. J., Huang, R. C., Zhang, Y., Chen, X., and Xu, C. Y.: Increasing sensitivity of dryland water use efficiency to soil water content due to rising atmospheric CO2, Sci. Total Environ., 905, 18, https://doi.org/10.1016/j.scitotenv.2023.167087, 2023.
Lawson, T. and Vialet-Chabrand, S.: Speedy stomata, photosynthesis and plant water use efficiency, New Phytol., 221, 93–98, https://doi.org/10.1111/nph.15330, 2019.
Li, D., Pan, M., Cong, Z. T., Zhang, L., and Wood, E.: Vegetation control on water and energy balance within the Budyko framework, Water Resour. Res., 49, 969–976, https://doi.org/10.1002/wrcr.20107, 2013.
Li, J., Li, Z. L., Wu, H., and You, N. S.: Trend, seasonality, and abrupt change detection method for land surface temperature time-series analysis: Evaluation and improvement, Remote Sens. Environ., 280, 20, https://doi.org/10.1016/j.rse.2022.113222, 2022.
Li, J., Zhang, Y., Bevacqua, E., Zscheischler, J., Keenan, T. F., Lian, X., Zhou, S., Zhang, H. Y., He, M. Z., and Piao, S. L.: Future increase in compound soil drought-heat extremes exacerbated by vegetation greening, Nat. Commun., 15, 12, https://doi.org/10.1038/s41467-024-55175-0, 2024.
Li, Y.: Climate feedback from plant physiological responses to increasing atmospheric CO2 in Earth system models, New Phytol., 244, 2176–2182, https://doi.org/10.1111/nph.20184, 2024.
Lian, X., Piao, S. L., Huntingford, C., Li, Y., Zeng, Z. Z., Wang, X. H., Ciais, P., McVicar, T. R., Peng, S. S., Ottle, C., Yang, H., Yang, Y. T., Zhang, Y. Q., and Wang, T.: Partitioning global land evapotranspiration using CMIP5 models constrained by observations, Nat. Clim. Chang., 8, 640, https://doi.org/10.1038/s41558-018-0207-9, 2018.
Lian, X., Piao, S. L., Chen, A. P., Huntingford, C., Fu, B. J., Li, L. Z. X., Huang, J. P., Sheffield, J., Berg, A. M., Keenan, T. F., McVicar, T. R., Wada, Y., Wang, X. H., Wang, T., Yang, Y. T., and Roderick, M. L.: Multifaceted characteristics of dryland aridity changes in a warming world, Nat. Rev. Earth Environ., 2, 232–250, https://doi.org/10.1038/s43017-021-00144-0, 2021.
Liang, S., Zhao, X., Liu, S., Yuan, W., Cheng, X., Xiao, Z., Zhang, X., Liu, Q., Cheng, J., Tang, H., Qu, Y., Bo, Y., Qu, Y., Ren, H., Yu, K., and Townshend, J.: A long-term Global LAnd Surface Satellite (GLASS) data-set for environmental studies, International Journal of Digital Earth, 6, 5–33, https://doi.org/10.1080/17538947.2013.805262, 2013.
Liang, S., He, T., Cheng, J., Jiang, B., Jin, H., Li, A., Li, S., Liu, L., Liu, X., Ma, H., Song, D.-X., Sun, L., Yao, Y., Yuan, W., Zhang, Y., Tian, F., and Li, L.: The High-resolution Global LAnd Surface Satellite (Hi-GLASS) Products Suite, Science of Remote Sensing, 12, 100263, https://doi.org/10.1016/j.srs.2025.100263, 2025.
Liu, Y., Jiang, Q., Wang, Q., Jin, Y., Yue, Q., Yu, J., Zheng, Y., Jiang, W., and Yao, X.: The divergence between potential and actual evapotranspiration: An insight from climate, water, and vegetation change, Sci. Total Environ., 807, 150648, https://doi.org/10.1016/j.scitotenv.2021.150648, 2022.
Lu, T. W., Han, Y., Deng, X. M., and Wu, Y. H.: Vegetation influence level on the water resources effectiveness over China, Environ. Res. Lett., 20, 11, https://doi.org/10.1088/1748-9326/adb8fe, 2025.
Luo, X. Z., Croft, H., Chen, J. M., Bartlett, P., Staebler, R., and Froelich, N.: Incorporating leaf chlorophyll content into a two-leaf terrestrial biosphere model for estimating carbon and water fluxes at a forest site, Agric. For. Meteorol., 248, 156–168, https://doi.org/10.1016/j.agrformet.2017.09.012, 2018a.
Luo, X. Z., Chen, J. M., Liu, J. E., Black, T. A., Croft, H., Staebler, R., He, L. M., Arain, M. A., Chen, B., Mo, G., Gonsamo, A., and McCaughey, H.: Comparison of Big-Leaf, Two-Big-Leaf, and Two-Leaf Upscaling Schemes for Evapotranspiration Estimation Using Coupled Carbon-Water Modeling, J. Geophys. Res.-Biogeosci., 123, 207–225, https://doi.org/10.1002/2017jg003978, 2018b.
Ma, X., Zhao, C., Tao, H., Zhu, J., and Kundzewicz, Z. W.: Projections of actual evapotranspiration under the 1.5 °C and 2.0 °C global warming scenarios in sandy areas in northern China, Sci. Total Environ., 645, 1496–1508, https://doi.org/10.1016/j.scitotenv.2018.07.253, 2018.
Machiwal, D., Meena, H. M., and Singh, D. V.: Chapter 34 – Overview of trend and homogeneity tests and their application to rainfall time series, in: Current Directions in Water Scarcity Research, edited by: Zakwan, M., Wahid, A., Niazkar, M., and Chatterjee, U., Elsevier, 599–620, https://doi.org/10.1016/B978-0-323-91910-4.00034-0, 2022.
Mann, H. B.: Nonparametric Tests Against Trend, Econometrica, 13, 245–259, https://doi.org/10.2307/1907187, 1945.
Medlyn, B. E., Duursma, R. A., Eamus, D., Ellsworth, D. S., Prentice, I. C., Barton, C. V. M., Crous, K. Y., de Angelis, P., Freeman, M., and Wingate, L.: Reconciling the optimal and empirical approaches to modelling stomatal conductance, Glob. Change Biol., 17, 2134–2144, https://doi.org/10.1111/j.1365-2486.2010.02375.x, 2011.
Mianabadi, A., Coenders-Gerrits, M., Shirazi, P., Ghahraman, B., and Alizadeh, A.: A global Budyko model to partition evaporation into interception and transpiration, Hydrol. Earth Syst. Sci., 23, 4983–5000, https://doi.org/10.5194/hess-23-4983-2019, 2019.
Michel, D., Jiménez, C., Miralles, D. G., Jung, M., Hirschi, M., Ershadi, A., Martens, B., McCabe, M. F., Fisher, J. B., Mu, Q., Seneviratne, S. I., Wood, E. F., and Fernández-Prieto, D.: The WACMOS-ET project – Part 1: Tower-scale evaluation of four remote-sensing-based evapotranspiration algorithms, Hydrol. Earth Syst. Sci., 20, 803–822, https://doi.org/10.5194/hess-20-803-2016, 2016.
Milly, P. C. and Dunne, K. A. J. N. C. C.: Potential evapotranspiration and continental drying, Nat. Clim. Chang., 6, 946–949, 2016.
Miralles, D. G., Jiménez, C., Jung, M., Michel, D., Ershadi, A., McCabe, M. F., Hirschi, M., Martens, B., Dolman, A. J., Fisher, J. B., Mu, Q., Seneviratne, S. I., Wood, E. F., and Fernández-Prieto, D.: The WACMOS-ET project – Part 2: Evaluation of global terrestrial evaporation data sets, Hydrol. Earth Syst. Sci., 20, 823–842, https://doi.org/10.5194/hess-20-823-2016, 2016.
Monteith, J. and Unsworth, M.: Principles of environmental physics: plants, animals, and the atmosphere, Academic press, https://doi.org/10.1016/C2010-0-66393-0, 2013.
Monteith, J. L.: Resistance of a partially wet canopy: whose equation fails?, Bound.-Lay. Meteorol., 12, 379–383, 1977.
O'Neill, B. C., Tebaldi, C., van Vuuren, D. P., Eyring, V., Friedlingstein, P., Hurtt, G., Knutti, R., Kriegler, E., Lamarque, J.-F., Lowe, J., Meehl, G. A., Moss, R., Riahi, K., and Sanderson, B. M.: The Scenario Model Intercomparison Project (ScenarioMIP) for CMIP6, Geosci. Model Dev., 9, 3461–3482, https://doi.org/10.5194/gmd-9-3461-2016, 2016.
Pan, S., Pan, N., Tian, H., Friedlingstein, P., Sitch, S., Shi, H., Arora, V. K., Haverd, V., Jain, A. K., Kato, E., Lienert, S., Lombardozzi, D., Nabel, J. E. M. S., Ottlé, C., Poulter, B., Zaehle, S., and Running, S. W.: Evaluation of global terrestrial evapotranspiration using state-of-the-art approaches in remote sensing, machine learning and land surface modeling, Hydrol. Earth Syst. Sci., 24, 1485–1509, https://doi.org/10.5194/hess-24-1485-2020, 2020.
Pereira, L. S., Allen, R. G., Smith, M., and Raes, D.: Crop evapotranspiration estimation with FAO56: Past and future, Agric. Water Manage., 147, 4–20, https://doi.org/10.1016/j.agwat.2014.07.031, 2015.
Pereira, L. S., Paredes, P., Hunsaker, D. J., López-Urrea, R., and Shad, Z. M.: Standard single and basal crop coefficients for field crops. Updates and advances to the FAO56 crop water requirements method, Agric. Water Manage., 243, 35, https://doi.org/10.1016/j.agwat.2020.106466, 2021.
Piao, S. L., Friedlingstein, P., Ciais, P., de Noblet-Ducoudré, N., Labat, D., and Zaehle, S.: Changes in climate and land use have a larger direct impact than rising CO2 on global river runoff trends, P. Natl. Acad. Sci. USA, 104, 15242–15247, https://doi.org/10.1073/pnas.0707213104, 2007.
Potkay, A., Cabon, A., Peters, R. L., Fonti, P., Sapes, G., Sala, A., Stefanski, A., Butler, E., Bermudez, R., Montgomery, R., Reich, P. B., and Feng, X.: Generalized Stomatal Optimization of Evolutionary Fitness Proxies for Predicting Plant Gas Exchange Under Drought, Heatwaves, and Elevated CO2, Glob. Change Biol., 31, https://doi.org/10.1111/gcb.70049, 2025.
Poyatos, R., Granda, V., Molowny-Horas, R., Mencuccini, M., Steppe, K., and Martínez-Vilalta, J.: SAPFLUXNET: towards a global database of sap flow measurements, Tree Physiol., 36, 1449–1455, https://doi.org/10.1093/treephys/tpw110, 2016.
Poyatos, R., Granda, V., Flo, V., Adams, M. A., Adorján, B., Aguadé, D., Aidar, M. P. M., Allen, S., Alvarado-Barrientos, M. S., Anderson-Teixeira, K. J., Aparecido, L. M., Arain, M. A., Aranda, I., Asbjornsen, H., Baxter, R., Beamesderfer, E., Berry, Z. C., Berveiller, D., Blakely, B., Boggs, J., Bohrer, G., Bolstad, P. V., Bonal, D., Bracho, R., Brito, P., Brodeur, J., Casanoves, F., Chave, J., Chen, H., Cisneros, C., Clark, K., Cremonese, E., Dang, H., David, J. S., David, T. S., Delpierre, N., Desai, A. R., Do, F. C., Dohnal, M., Domec, J.-C., Dzikiti, S., Edgar, C., Eichstaedt, R., El-Madany, T. S., Elbers, J., Eller, C. B., Euskirchen, E. S., Ewers, B., Fonti, P., Forner, A., Forrester, D. I., Freitas, H. C., Galvagno, M., Garcia-Tejera, O., Ghimire, C. P., Gimeno, T. E., Grace, J., Granier, A., Griebel, A., Guangyu, Y., Gush, M. B., Hanson, P. J., Hasselquist, N. J., Heinrich, I., Hernandez-Santana, V., Herrmann, V., Hölttä, T., Holwerda, F., Irvine, J., Isarangkool Na Ayutthaya, S., Jarvis, P. G., Jochheim, H., Joly, C. A., Kaplick, J., Kim, H. S., Klemedtsson, L., Kropp, H., Lagergren, F., Lane, P., Lang, P., Lapenas, A., Lechuga, V., Lee, M., Leuschner, C., Limousin, J.-M., Linares, J. C., Linderson, M.-L., Lindroth, A., Llorens, P., López-Bernal, Á., Loranty, M. M., Lüttschwager, D., Macinnis-Ng, C., Maréchaux, I., Martin, T. A., Matheny, A., McDowell, N., McMahon, S., Meir, P., Mészáros, I., Migliavacca, M., Mitchell, P., Mölder, M., Montagnani, L., Moore, G. W., Nakada, R., Niu, F., Nolan, R. H., Norby, R., Novick, K., Oberhuber, W., Obojes, N., Oishi, A. C., Oliveira, R. S., Oren, R., Ourcival, J.-M., Paljakka, T., Perez-Priego, O., Peri, P. L., Peters, R. L., Pfautsch, S., Pockman, W. T., Preisler, Y., Rascher, K., Robinson, G., Rocha, H., Rocheteau, A., Röll, A., Rosado, B. H. P., Rowland, L., Rubtsov, A. V., Sabaté, S., Salmon, Y., Salomón, R. L., Sánchez-Costa, E., Schäfer, K. V. R., Schuldt, B., Shashkin, A., Stahl, C., Stojanovic, M., Suárez, J. C., Sun, G., Szatniewska, J., Tatarinov, F., Tesar, M., Thomas, F. M., Tor-ngern, P., Urban, J., Valladares, F., van der Tol, C., van Meerveld, I., Varlagin, A., Voigt, H., Warren, J., Werner, C., Werner, W., Wieser, G., Wingate, L., Wullschleger, S., Yi, K., Zweifel, R., Steppe, K., Mencuccini, M., and Martínez-Vilalta, J.: Global transpiration data from sap flow measurements: the SAPFLUXNET database, Earth Syst. Sci. Data, 13, 2607–2649, https://doi.org/10.5194/essd-13-2607-2021, 2021.
Raziei, T. and Pereira, L. S.: Spatial variability analysis of reference evapotranspiration in Iran utilizing fine resolution gridded datasets, Agric. Water Manage., 126, 104–118, https://doi.org/10.1016/j.agwat.2013.05.003, 2013a.
Raziei, T. and Pereira, L. S.: Estimation of ETo with Hargreaves-Samani and FAO-PM temperature methods for a wide range of climates in Iran, Agric. Water Manage., 121, 1–18, https://doi.org/10.1016/j.agwat.2012.12.019, 2013b.
Roderick, M. L., Sun, F., Lim, W. H., and Farquhar, G. D.: A general framework for understanding the response of the water cycle to global warming over land and ocean, Hydrol. Earth Syst. Sci., 18, 1575–1589, https://doi.org/10.5194/hess-18-1575-2014, 2014.
Sayago, S., Ovando, G., and Bocco, M.: Landsat images and crop model for evaluating water stress of rainfed soybean, Remote Sens. Environ., 198, 30–39, https://doi.org/10.1016/j.rse.2017.05.008, 2017.
Scheff, J., Coats, S., and Laguë, M. M.: Why do the Global Warming Responses of Land-Surface Models and Climatic Dryness Metrics Disagree?, Earth Future, 10, 13, https://doi.org/10.1029/2022ef002814, 2022.
Stocker, B. D., Zscheischler, J., Keenan, T. F., Prentice, I. C., Peñuelas, J., and Seneviratne, S. I.: Quantifying soil moisture impacts on light use efficiency across biomes, New Phytol., 218, 1430–1449, https://doi.org/10.1111/nph.15123, 2018.
Suarez, L., Zarco-Tejada, P. J., Sepulcre-Canto, G., Perez-Priego, O., Miller, J. R., Jimenez-Munoz, J. C., and Sobrino, J.: Assessing canopy PRI for water stress detection with diurnal airborne imagery, Remote Sens. Environ., 112, 560–575, https://doi.org/10.1016/j.rse.2007.05.009, 2008.
Sun, S., Bi, Z., Xiao, J., Liu, Y., Sun, G., Ju, W., Liu, C., Mu, M., Li, J., Zhou, Y., Li, X., Liu, Y., and Chen, H.: A global 5 km monthly potential evapotranspiration dataset (1982–2015) estimated by the Shuttleworth–Wallace model, Earth Syst. Sci. Data, 15, 4849–4876, https://doi.org/10.5194/essd-15-4849-2023, 2023.
Talsma, C. J., Good, S. P., Miralles, D. G., Fisher, J. B., Martens, B., Jimenez, C., and Purdy, A. J.: Sensitivity of Evapotranspiration Components in Remote Sensing-Based Models, Remote Sens., 10, 28, https://doi.org/10.3390/rs10101601, 2018.
Wang, Y., Liu, B., Zhao, J., Ye, C., Wei, L., Sun, J., Chu, C., and Lee, T. M.: Global patterns and abiotic drivers of ecosystem multifunctionality in dominant natural ecosystems, Environment International, 168, https://doi.org/10.1016/j.envint.2022.107480, 2022.
Warszawski, L., Frieler, K., Huber, V., Piontek, F., Serdeczny, O., and Schewe, J.: The Inter-Sectoral Impact Model Intercomparison Project (ISI–MIP): Project framework, Proceedings of the National Academy of Sciences, 111, 3228–3232, https://doi.org/10.1073/pnas.1312330110, 2014.
Wei, S. S., Fang, H. L., Schaaf, C. B., He, L. M., and Chen, J. M.: Global 500 m clumping index product derived from MODIS BRDF data (2001–2017), Remote Sens. Environ., 232, 15, https://doi.org/10.1016/j.rse.2019.111296, 2019.
Wu, S., Gu, X., Peng, X., and Chen, L.: Comparative analysis of water-use strategies in three subtropical mangrove species: a study of sap flow and gas exchange monitoring, Tree Physiol., 44, https://doi.org/10.1093/treephys/tpae102, 2024.
Wu, T., Tissue, D. T., Jiang, M., Slot, M., Crous, K. Y., Yuan, J., Liu, J., Jin, S., Wu, C., Deng, Y., Huang, C., Shi, F., Fang, X., Li, R., and Mao, R.: Leaf Photosynthetic and Respiratory Thermal Acclimation in Terrestrial Plants in Response to Warming: A Global Synthesis, Glob. Change Biol., 31, https://doi.org/10.1111/gcb.70026, 2025.
Wu, T., Lu, Y., Fang, Y., Xin, X., Li, L., Li, W., Jie, W., Zhang, J., Liu, Y., Zhang, L., Zhang, F., Zhang, Y., Wu, F., Li, J., Chu, M., Wang, Z., Shi, X., Liu, X., Wei, M., Huang, A., Zhang, Y., and Liu, X.: The Beijing Climate Center Climate System Model (BCC-CSM): the main progress from CMIP5 to CMIP6 , Geosci. Model Dev., 12, 1573–1600, https://doi.org/10.5194/gmd-12-1573-2019, 2019.
Wu, X., Xu, Y. Q., Shi, J. C., Zuo, Q., Zhang, T., Wang, L. C., Xue, X. Z., and Ben-Gal, A.: Estimating stomatal conductance and evapotranspiration of winter wheat using a soil-plant water relations-based stress index, Agric. For. Meteorol., 303, 14, https://doi.org/10.1016/j.agrformet.2021.108393, 2021.
Xu, F., Qu, Y. P., Bento, V. A., Song, H. Q., Qiu, J. X., Qi, J. Y., Wan, L. L., Zhang, R. R., Miao, L. J., Zhang, X. S., and Wang, Q. F.: Understanding climate change impacts on drought in China over the 21st century: a multi-model assessment from CMIP6, npj Clim. Atmos. Sci., 7, 12, https://doi.org/10.1038/s41612-024-00578-5, 2024.
Xu, H., Detto, M., Fang, S., Li, Y., Zang, R., and Liu, S.: Habitat hotspots of common and rare tropical species along climatic and edaphic gradients, Journal of Ecology, 103, 1325–1333, https://doi.org/10.1111/1365-2745.12442, 2015.
Yang, X. J., Thornton, P. E., Ricciuto, D. M., and Hoffman, F. M.: Phosphorus feedbacks constraining tropical ecosystem responses to changes in atmospheric CO2 and climate, Geophys. Res. Lett., 43, 7205–7214, https://doi.org/10.1002/2016gl069241, 2016.
Yang, Y. T. and Roderick, M. L.: Radiation, surface temperature and evaporation over wet surfaces, Q. J. R. Meteorol. Soc., 145, 1118–1129, https://doi.org/10.1002/qj.3481, 2019.
Yang, Y. T., Roderick, M. L., Zhang, S. L., McVicar, T. R., and Donohue, R. J.: Hydrologic implications of vegetation response to elevated CO2 in climate projections, Nat. Clim. Chang., 9, 44, https://doi.org/10.1038/s41558-018-0361-0, 2019.
Yang, Y. T., Roderick, M. L., Guo, H., Miralles, D. G., Zhang, L., Fatichi, S., Luo, X. Z., Zhang, Y. Q., McVicar, T. R., Tu, Z. Y., Keenan, T. F., Fisher, J. B., Gan, R., Zhang, X. Z., Piao, S. L., Zhang, B. Q., and Yang, D. W.: Evapotranspiration on a greening Earth, Nat. Rev. Earth Environ., 4, 626–641, https://doi.org/10.1038/s43017-023-00464-3, 2023.
Young, A. M., Friedl, M. A., Novick, K., Scott, R. L., Moon, M., Frolking, S., Li, X. L., Carrillo, C. M., and Richardson, A. D.: Disentangling the Relative Drivers of Seasonal Evapotranspiration Across a Continental-Scale Aridity Gradient, J. Geophys. Res.-Biogeosci., 127, 19, https://doi.org/10.1029/2022jg006916, 2022.
Zarakas, C. M., Swann, A. L. S., Laguë, M. M., Armour, K. C., and Randerson, J. T.: Plant Physiology Increases the Magnitude and Spread of the Transient Climate Response to CO2 in CMIP6 Earth System Models, J. Clim., 33, 8561–8578, https://doi.org/10.1175/jcli-d-20-0078.1, 2020.
Zeng, Z. Z., Zhu, Z. C., Lian, X., Li, L. Z. X., Chen, A. P., He, X. G., and Piao, S. L.: Responses of land evapotranspiration to Earth's greening in CMIP5 Earth System Models, Environ. Res. Lett., 11, 10, https://doi.org/10.1088/1748-9326/11/10/104006, 2016.
Zhang, B., Chen, Y., Chen, X., Gao, L., Deng, H., and Liu, M.: Effectiveness and resilience of BMPs to watershed climate adaptation considering the uncertainty of hydrological model and GCMs, Climate Risk Management, 44, https://doi.org/10.1016/j.crm.2024.100612, 2024.
Zhang, S. L., Yang, Y. T., McVicar, T. R., and Yang, D. W.: An Analytical Solution for the Impact of Vegetation Changes on Hydrological Partitioning Within the Budyko Framework, Water Resour. Res., 54, 519–537, https://doi.org/10.1002/2017wr022028, 2018.
Zhao, K. G., Wulder, M. A., Hu, T. X., Bright, R., Wu, Q. S., Qin, H. M., Li, Y., Toman, E., Mallick, B., Zhang, X. S., and Brown, M.: Detecting change-point, trend, and seasonality in satellite time series data to track abrupt changes and nonlinear dynamics: A Bayesian ensemble algorithm, Remote Sens. Environ., 232, 20, https://doi.org/10.1016/j.rse.2019.04.034, 2019.
Zhou, D. C., Zhang, L. X., Li, D., Huang, D. A., and Zhu, C.: Climate-vegetation control on the diurnal and seasonal variations of surface urban heat islands in China, Environ. Res. Lett., 11, 11, https://doi.org/10.1088/1748-9326/11/7/074009, 2016.