the Creative Commons Attribution 4.0 License.
the Creative Commons Attribution 4.0 License.
 | 28 Oct 2025
Historical trends of seasonal droughts in Australia
Anna M. Ukkola
Elisabeth Vogel
Sanaa Hobeichi
Andy J. Pitman
Alex Raymond Borowiak
Keirnan Fowler
Australia frequently experiences severe and widespread droughts, causing impacts on food security, the economy, and human health. Despite this, recent research to comprehensively understand the past trends in Australian droughts is lacking. We analyse the past changes in seasonal-scale meteorological, agricultural, and hydrological droughts – defined using the 15th percentile threshold of precipitation, soil moisture, and runoff, respectively. We complement these traditional metrics with an impact-based drought indicator built from government drought reports using machine learning. Calculating trends in time and area under drought for the various drought types, we find that although there have been widespread decreases in Australian droughts since the early 20th century, extensive regions have experienced an increase in recent decades. However, these recent changes largely remain within the range of observed variability, suggesting that they are not unprecedented in the context of the historical drought events. The drivers behind these drought trends are multi-faceted, and we show that the trends can be driven by both mean and variability changes in the underlying hydrological variable. Additionally, using explainable machine learning techniques, we unpick the key hydrometeorological variables contributing to agricultural and hydrological drought trends. The influence of these variables varies considerably between regions and seasons, with precipitation often shown to be important but rarely the main driver behind observed drought trends. This suggests the need to consider multiple drivers when assessing drought trends.
- Article
(11131 KB) - Full-text XML
-
Supplement
(5721 KB) - BibTeX
- EndNote


Droughts are one of the most damaging extreme weather events (Wilhite, 2000). Large impacts from droughts are felt across various sectors including economic damage, ecological degradation, and the loss of human lives (Bond et al., 2008; Cravens et al., 2021; Douris and Kim, 2021; Zaveri et al., 2023). Droughts can threaten water supplies and food security (Peterson et al., 2021; Vogel et al., 2019) and have the potential to increase the risk and severity of heatwaves and wildfires (Adams et al., 2020; Jyoteeshkumar reddy et al., 2021). Australia is naturally prone to widespread and severe droughts (Falster et al., 2024). For example, during 2017–2019, southeastern Australia faced its most severe drought since reliable records began (Devanand et al., 2024). This drought led to severe threats to Sydney's water supply and intense agricultural impacts, culminating in the unprecedented and devastating 2019/20 “Black Summer” bushfires, which burnt 5.8 million ha across southeastern Australia (Abram et al., 2021).
Droughts have been changing regionally around the world (Seneviratne et al., 2021). However, this change is not globally uniform – for example, there is evidence of increased droughts in South America but decreased droughts in northern Europe (Seneviratne et al., 2021). It is therefore important to better understand how droughts have been changing at regional scales. Despite this, the historic changes in droughts across Australia are not well understood. Past studies have considered the mean changes to hydrological variables, including rainfall (Dey et al., 2019; Taschetto and England, 2009) and metrics such as the Palmer Drought Severity Index (PDSI) and the Standardised Precipitation Index (SPI) (Dai, 2011; Rashid and Beecham, 2019; Yildirim and Rahman, 2022). However, metrics like the PDSI and SPI depict both wet and dry periods, and therefore changes in these only quantify trends in the mean states, ignoring changes in variability. Droughts are anomalously dry periods driven by both the mean and variability, and it is important to consider changes to both of these aspects when quantifying drought trends (Ukkola et al., 2020). This is particularly true for Australia, which has extremely high variability in natural rainfall and streamflow (King et al., 2020; McMahon et al., 1987; Nicholls et al., 1997).
Evidence suggests that mean precipitation has been increasing across most of the Australian continent since the early 20th century (Ukkola et al., 2019), but there has been a decreasing trend across the southeast and southwest since the middle of the century (Dey et al., 2019). These decreasing trends from the mid-century are reflected in the streamflow and soil moisture in many areas (Dai, 2011; Wasko et al., 2021; Zhang et al., 2016), suggesting possible changes in droughts. Previous research that has considered the observed changes to anomalously dry periods, for both meteorological and agricultural droughts, across Australia showed that drought frequency, duration, and severity had been decreasing since 1911 across most of the continent, with some exceptions in the southwest and southeast (Gallant et al., 2013). However, changes over the last decade, which encompass major drought events (e.g. Devanand et al., 2024), have not been considered as these data were not available at the time. The areal extent of hydrological droughts has been increasing in southwestern and southeastern Australia and decreasing in the northern and central regions of the country since 1960 (Wasko et al., 2021). While this study was able to capture recent hydrological drought trends, it only focussed on one aspect of these droughts (areal extent) and only considered trends from 1960. Most studies have only considered one or two drought types and use different metrics, making a comparison across studies challenging. To gain a complete picture of historical drought trends, it is important to consider changes in multiple drought types, from meteorological to agricultural and hydrological droughts (Cook et al., 2020; Kirono et al., 2020), using metrics that quantify anomalously dry periods (Ukkola et al., 2020).
Here, we investigate changes in meteorological, agricultural, and hydrological droughts across Australia during 1911–2020. We complement the traditional drought metrics with an impact-based drought metric, which has been built by training a machine learning model on government drought impact reports. By considering these four different drought metrics, we provide a more complete overview of how Australian droughts have been changing over the historical period than previous studies have achieved. Additionally, we quantify the contribution of mean and variability changes to the drought trends and identify the key hydrometeorological variables contributing to agricultural and hydrological droughts.
Here, we first introduce the hydrometeorological and climate datasets used in the analysis (Sect. 2.1). We then describe the methods used to define the drought metrics (Sect. 2.2) and calculate the drought trends (Sect. 2.3). To better contextualise these trends, we outline the approach for determining their emergence from long-term variability (Sect. 2.4). Finally, we explain the methodology used to quantify the contributions of changes in the mean and variability to the drought trends (Sect. 2.5), as well as the techniques used to assess the importance of various hydrometeorological variables for agricultural and hydrological drought trends (Sect. 2.6).
2.1 Data
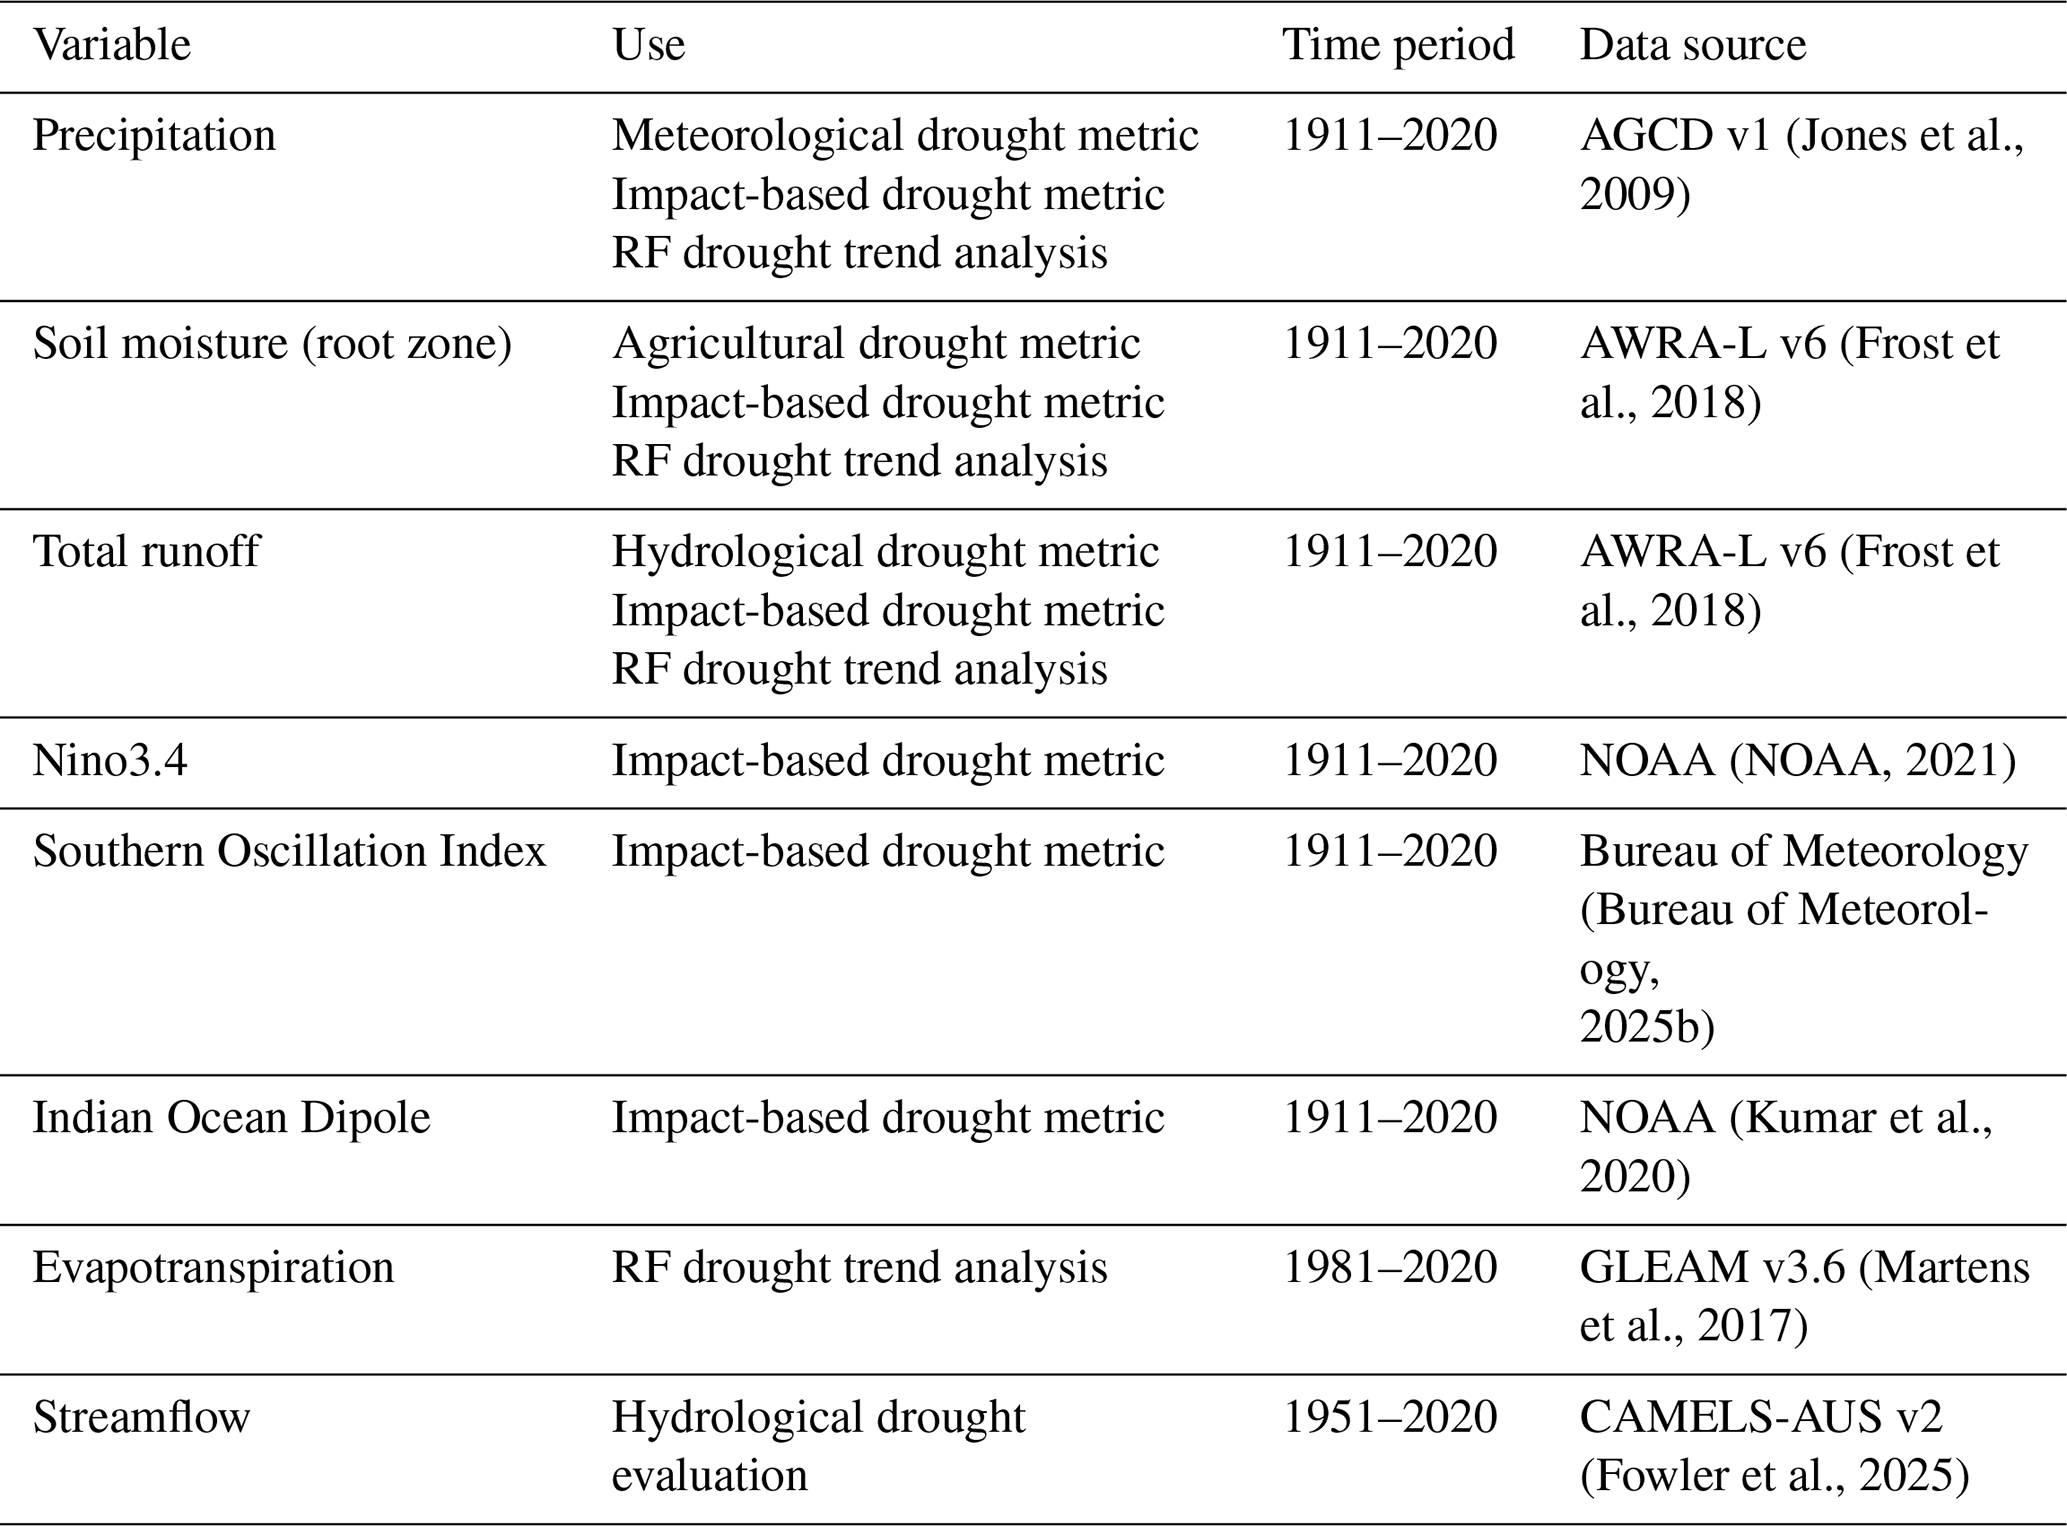
Table 1 provides all the data used in this study and identifies which part of the analysis the variable was used in (further discussed in following sections) and where the data were sourced from.
Precipitation was derived from the Australian Gridded Climate Data (AGCD) version 1 (Jones et al., 2009). AGCD is a gridded product of observed precipitation across Australia produced by interpolating observed station precipitation onto a 0.05° × 0.05° grid. The network of observation stations is sparse in very remote regions, making the interpolation methods unreliable in these areas (Vogel et al., 2021). Therefore, for our analysis, we have masked out grid cells in these regions.
Root zone soil moisture (top 1 m) and total runoff were obtained from the Australian landscape water balance model (AWRA-L; Frost et al., 2018) as continent-wide observations for these variables do not exist. AWRA-L is a semi-distributed hydrological model covering the whole of Australia, which underpins the Bureau of Meteorology's Australian Water Outlook (https://awo.bom.gov.au, last access: 8 October 2025). It is used to produce hydrological information on a range of timescales: from past hydrological conditions (Wasko et al., 2021) to seasonal forecasts (Pickett-Heaps and Vogel, 2022; Tian et al., 2021; Vogel et al., 2021) and future projections (Peter et al., 2024; Wilson et al., 2022). AWRA-L has been calibrated to observed streamflow, satellite soil moisture, and evapotranspiration across Australia (Frost et al., 2018) and evaluated using various hydrological observations, including in situ measurements of soil moisture, gauged streamflow, groundwater recharge, and flux-tower-based evapotranspiration (Frost and Wright, 2018). AWRA-L data are on the same grid as AGCD and therefore allows for a direct comparison between the two datasets. For a full description of AWRA-L version 6 and its evaluation, see Frost et al. (2018) and Frost and Wright (2018). Streamflow observations from the Australian edition of the Catchment Attributes and MEteorology for Large-sample Studies version 2 (CAMELS-AUS v2; Fowler et al., 2025) were used to evaluate AWRA-L-simulated hydrological droughts. This dataset provides streamflow observations at 561 river catchments across Australia.
There is no available dataset of gridded evapotranspiration (ET) observations, and we have therefore used ET data from the Global Land Evaporation Amsterdam Model (GLEAM) version 3.6 (Martens et al., 2017). GLEAM calculates ET through a combination of remotely sensed observations and reanalysis data (for variables such as soil moisture, air temperature, and radiation). GLEAM data have been rigorously validated against in situ evaporation observations and deemed to perform adequately (Martens et al., 2017). The GLEAM data are on a 0.25° × 0.25° grid and were regridded to the AGCD grid, using the nearest-neighbour method to allow for a direct comparison with the other gridded data products.
Table 1Data used in the study. RF drought trend analysis refers to the random forest (RF) analysis of contributions from hydrometeorological variables to drought trends (see Sects. 2.4 and 3.3 for this).
2.2 Drought metrics
2.2.1 Traditional drought metrics
We have used metrics for three common drought types, referred to as traditional drought metrics, describing meteorological (precipitation), agricultural (soil moisture), and hydrological (runoff) droughts. To identify drought months, the hydrological variables were averaged using 3-month running means so that the new value at any given month was the average of that month and the two preceding months. A drought threshold for each month was then set as the 15th percentile of the study period (1911–2020). A drought month was identified when the 3-month mean was below its corresponding 15th percentile threshold. We repeated this for annual-scale drought by using 12-month running means. We focus on the 3-month (seasonal) droughts in the main paper but present results for 12-month (annual) droughts in the Supplement.
Seasonal droughts were chosen as they impact multiple sectors in Australia including agriculture, water resources, and environmental systems (Gallant et al., 2013; Ukkola et al., 2024). Additionally, by looking at droughts at this timescale, we can determine the changes in individual seasons. We chose to use the 15th percentile as the drought threshold as this is approximately equal to an SPI threshold of −1 (i.e. a “moderate” drought; Mckee et al., 1993). Other drought thresholds would be valid, but previous studies have shown that the drought trends are largely insensitive to the choice of threshold (Kirono et al., 2020). By using the 15th percentile, we ensure a large enough sample size of drought events to reliably calculate trends; lower thresholds would likely give fewer significant trends but be unlikely to affect the sign of the change. With an empirical percentile method, no assumption of a specific statistical distribution of the hydrological variable is required, which allows for a consistent methodology across the three traditional drought metrics. This chosen method is consistent with previous studies (Ukkola et al., 2020, 2024) and similar to the definition used by the Australian Bureau of Meteorology (Bureau of Meteorology, 2025a).
2.2.2 Impact-based drought metric
To develop the impact-based drought metric, a random forest (RF) binary classification algorithm (Breiman, 2001) was used to model the relationship between observed drought impacts and climate conditions, as in Devanand et al. (2024). Various iterations of the RF model were created, using multiple aggregations of climate predictor variables, with the final version being optimised for highest performance when classifying unseen drought months. The final RF model uses six climate variables, ranging from large-scale modes of variability to localised climate conditions and the month of the year as predictors. Table 1 provides details of the climate variables used in the final model. The observed data of drought impacts consist of a database of months experiencing drought impacts reported by Australia's Bureau of Meteorology, the New South Wales (NSW) Department of Primary Industries, and the NSW Department of Planning, Industry and Environment. Examples of the observed drought impacts include crops being grazed or cut for hay or silage, reported effects on water supply in major towns or cities, and inadequate water availability in the main storage dam. Given the nature of these reports, it should be noted that they may be biased towards large population or agricultural regions. The drought impact reports were balanced by an equal number of months of “no-drought” events (see Fig. S1 in the Supplement for further details of location and time of these reports). RF models trained on drought impact reports have been shown to perform well in classifying drought events (Devanand et al., 2024; Hobeichi et al., 2022), outperforming traditional drought metrics for drought prediction and capturing non-linear or compounding relationships between climate variables and drought events that linear models might struggle to represent (Hobeichi et al., 2022). As a result, we have chosen to use RF models to construct our impact-based drought metric. While past studies have combined impact reports and machine learning to assess the drivers and predictability of drought (Devanand et al., 2024; Hobeichi et al., 2022), our methodology goes beyond these by applying the impact-based metric to historical drought trends. This allows us to compare trends in the traditional and impact-based drought metrics.
The performance of the RF model was assessed through out-of-sample testing. For this, 70 % of the reported drought events was used to train the RF model, with the other 30 % withheld to be used as test data. This was repeated 100 times, each time creating a new RF model at a new random split of the data. The performance of the RF model was assessed by aggregating the performance of each RF model on its 30 % out-of-sample data. Five performance metrics were used to assess the RF models: accuracy, precision, recall, balanced accuracy, f-1score, and false alarm rate. These are all commonly used in binary classification performance assessment and similar to those used by Hobeichi et al. (2022). The results of these performance metrics can be found in Fig. S2.
Once the model had been tested and evaluated, the impact-based drought metric was developed across southeastern Australia from 1911 to 2020 using all the available data (i.e. without withholding test data). The impact-based drought metric was developed for southeastern Australia as the drought-impact reports used in the training of the RF model are only available for this region. Note that this metric identifies drought months but does not provide information on the intensity of drought events.
2.2.3 Drought characteristics
Three characteristics of droughts are considered in this study: time under drought, area under drought, and drought intensity. Time under drought is calculated for all four drought types including the impact-based metric, whereas area under drought and drought intensity are calculated for the three traditional drought metrics only.
Time under drought was calculated from the binary time series of drought months (see Sect. 2.2.1 and 2.2.2) by summing the number of drought months per grid cell over distinct 5-year time blocks. Temporal resampling in 5-year blocks was done to create a continuous time series from which trends can be calculated while ensuring that each block is long enough to include drought and non-drought events. Multiple aggregation periods (2-, 3- and 7-year blocks) were also tested, and they had little effect on the results.
Area under drought was defined as the percentage of grid cells under drought at each time step (using the binary drought time series for each grid cell, see Sect. 2.1.1). Given the variation in climate conditions across Australia, this metric was calculated over the eight natural resource management (NRM) regions (Fig. 1). These NRM regions represent broad regions of similar climate conditions and biophysical factors (CSIRO and Bureau of Meteorology, 2015).
Drought intensity was defined as the relative deviation from the long-term mean. First, drought events were identified as consecutive months for which the relevant hydrological variable was below the 15th percentile threshold. The intensity was then calculated as the percentage difference between the climatological mean and the mean of the variable across all months for which the event lasted. By calculating the percentage difference rather than absolute differences, we were able to compare between drought types and across locations.
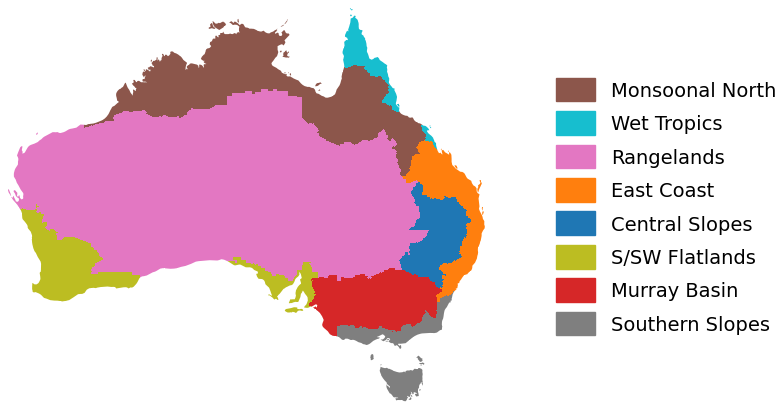
Figure 1The natural resource management (NRM) regions.
2.3 Drought trends
The Mann–Kendall (MK) trend test and the Theil–Sen (TS) slope estimator (Sen, 1968) are common non-parametric methods for respectively calculating the significance and slope of trends in hydrometeorological time series (Deitch et al., 2017; Humphrey et al., 2016; Zhang et al., 2016). The MK trend test has been shown to perform poorly when applied to autocorrelated data (Yue et al., 2002), so here we apply a modification of the MK trend test that addresses this issue, proposed by Yue and Wang (2004). This method uses a pre-whitening process to deal with autocorrelation. In doing so, there is a chance that it may reduce the power of the trend test due to the pre-whitening process potentially removing trend information in cases where the autocorrelation and trend are intrinsically linked (Yue and Wang, 2004). This means that the method is conservative, with borderline significant trends, and reduces the likelihood of over-estimating the trend significance. This modification of the MK trend test was used to calculate the significance and direction of the trend in each of the drought characteristics. The trend slope was then calculated using the TS slope estimator. These were both calculated using the yue_wang_modification_test function from the pyMannKendall Python package (Hussain and Mahmud, 2019). In rare cases, the MK trend test would detect a significant trend in the data, but the TS slope estimator would find the gradient of the trend slope to be zero. This occurs when the data contain many zero values. In these cases, the significance of the trend was set to be “insignificant” to keep consistency between the significance and the slope of the trend.
To ensure that hydrological drought trends are reliable, we evaluated them against observed hydrological drought trends based on in situ streamflow data from CAMELS-AUS v2. Details of this verification can be found in Sect. S1.1 of the Supplement.
2.4 Trend emergence tests
To better understand whether the trends are within the expected range of the historical variability, trend emergence tests were conducted. First, for area under drought trends, we analysed the changes in decadal means to identify long-term and lasting shifts in area under drought for each NRM region. If shifts have occurred, this method allows for the identification of the timing of the shift. Adopting the methods used in previous studies (Sun et al., 2018; Ukkola et al., 2019), 95 % confidence intervals were calculated for the decadal means. To do this, first the lag-1 autocorrelation, r1, was calculated:
where Y is the time series, Yi is the data at time step i, is the mean of the time series, and n is the total number of time steps. This was then used to calculate the effective sample size, ne:
Finally, from this we could find the confidence intervals of the decadal means of area under drought:
where σ2 is the variance of the whole time series. If the decadal means of area under drought are within these confidence intervals, it suggests that the changes in area under drought remain within the expected range of the historic variability. If the decadal means emerge outside the confidence intervals and remain outside until the end of the time series, then it is possible that the trend has emerged from the variability. Additionally, the signal-to-noise () ratio and the Kolmogorov–Smirnoff (KS) test were used to determine if both time and area under drought have emerged from their historical variability (see Sect. S1.2 in the Supplement for details). Both these tests are widely used methods to test for emergence (e.g. Hawkins et al., 2020; King et al., 2015). The method for detecting changes in decadal means was applied only to the area under drought trends.
2.5 Contributions from mean and variability changes
The drought trends identified in this study could be influenced by mean and variability changes to the relevant hydrological variable. The contribution of these mean and variability changes was assessed for trends in time under drought for each of the traditional drought types. We developed and applied a new methodology to isolate the contributions of mean and variability changes. Despite its simplicity, it offers further insight into the underlying causes of the drought trends. To calculate the contribution of changes in variability, the long-term trend was removed from the relevant hydrological variable using linear detrending. Drought months were then recalculated for this detrended hydrological variable, and the trend in time under drought of this new drought metric was calculated. As we have removed the change in the mean of the hydrological variable, this new trend is caused solely by the change in variability of the hydrological variable. We refer to this as the variability drought trend. The relative contributions from the variability and mean changes of the hydrological variable were then computed as
Often the contributions would act in opposite directions. For example, the variability drought trend may be negative when the original drought trend was positive. This would give a negative variability contribution and a mean contribution greater than 100 %. In these cases, we defined the drought trend to be purely caused by changes in the mean; consequently, the variability contribution was set to 0 % and the mean contribution to 100 %. The same logic was applied when the variability contribution was initially found to be above 100 % and the mean contribution negative: in these cases, the variability contribution was set to 100 % and the mean contribution to 0 %. Therefore, the final values for contributions of mean and variability change are in the range of 0 %–100 %.
2.6 Contribution of hydrometeorological variables
We identified the contribution of various hydrometeorological variables to agricultural and hydrological drought trends to identify the extent to which they are driven by precipitation versus other influences. These were assessed by linking drought trends to trends in hydrometeorological predictors using an RF model as a regression algorithm (Breiman, 2001). The influence of precipitation, ET, and runoff on agricultural drought trends, as well as the influence of precipitation, ET, and soil moisture on hydrological drought trends, were evaluated. Further details of these variables can be found in Table 1. For each variable, its trend, as well as the trend in its standard deviation, from 1981–2020 was calculated using the TS slope estimator. The period 1981–2020 was chosen as this was the longest time period for which all predictor data were available. A separate RF model was trained for each season and NRM region, with the 1981–2020 time under drought trend as the target variable and the trends in the hydrometeorological variables, along with the trends in their standard deviation, used as the predictors. This approach provides a new application of machine learning to Australian droughts by using it to untangle the key drivers of drought trends, with similar methods previously used to understand the drivers of individual drought events (Devanand et al., 2024).
Before implementing the RF models in this analysis, their ability to capture the drought trends was tested. Each RF model was assessed by withholding 30 % of the drought trend data to be used for out-of-sample testing. We iterated this 100 times, with a new model trained on a new random split of the data each time. The performance of the RF model was then assessed by finding the R2 score between the observed out-of-sample drought trends and the respective predicted drought trends. The R2 score for each RF model can be found in Table S1. These scores varied depending on region and season but were in the range of 0.46 to 0.84 (mean of 0.69) for agricultural drought trends and 0.38 to 0.70 (mean of 0.56) for hydrological drought trends. As a result, it was deemed that the models performed adequately to be used in this analysis.
Once the models had been tested, the final analysis was conducted by training the models on all the available data. For each season and NRM region, 100 models were trained with a different random seed for each iteration. The variable importance feature of RF models was used to assess the relative contributions of the predictor variables, with the results shown as the mean importance ranking of the 100 models. Here, we use the mean decrease in impurity (MDI) variable importance method (Breiman, 2001), with higher MDI scores indicating greater importance. RF models also allow for the assessment of variable importance through the permutation importance method. However, MDI is better at handling predictors that are highly correlated and is therefore more appropriate for our analysis. For each model, a random variable was generated and added as a predictor to give a baseline comparison for the importance scores of the other predictor variables. While the importance scores do not measure causal relationships, the predictors that rank highly will likely have a substantial influence on drought trends.
3.1 Time under drought trends
To understand if Australia has experienced a change in drought events, we examined the observed trends in time under drought. The trends were calculated for each of the three traditional metrics over the periods 1911–2020, 1951–2020, and 1971–2020 to assess how the trends have evolved over the historical period (Fig. 2). During 1911–2020, the time under drought decreased across the large majority of Australia. There are particularly large areas in the northwest of the country that show consistent and significant decreasing trends. Increasing drought trends are apparent in the southwest for the three drought types, as well as some regions on the east coast, in the southeast, and in Tasmania for agricultural and hydrological droughts.
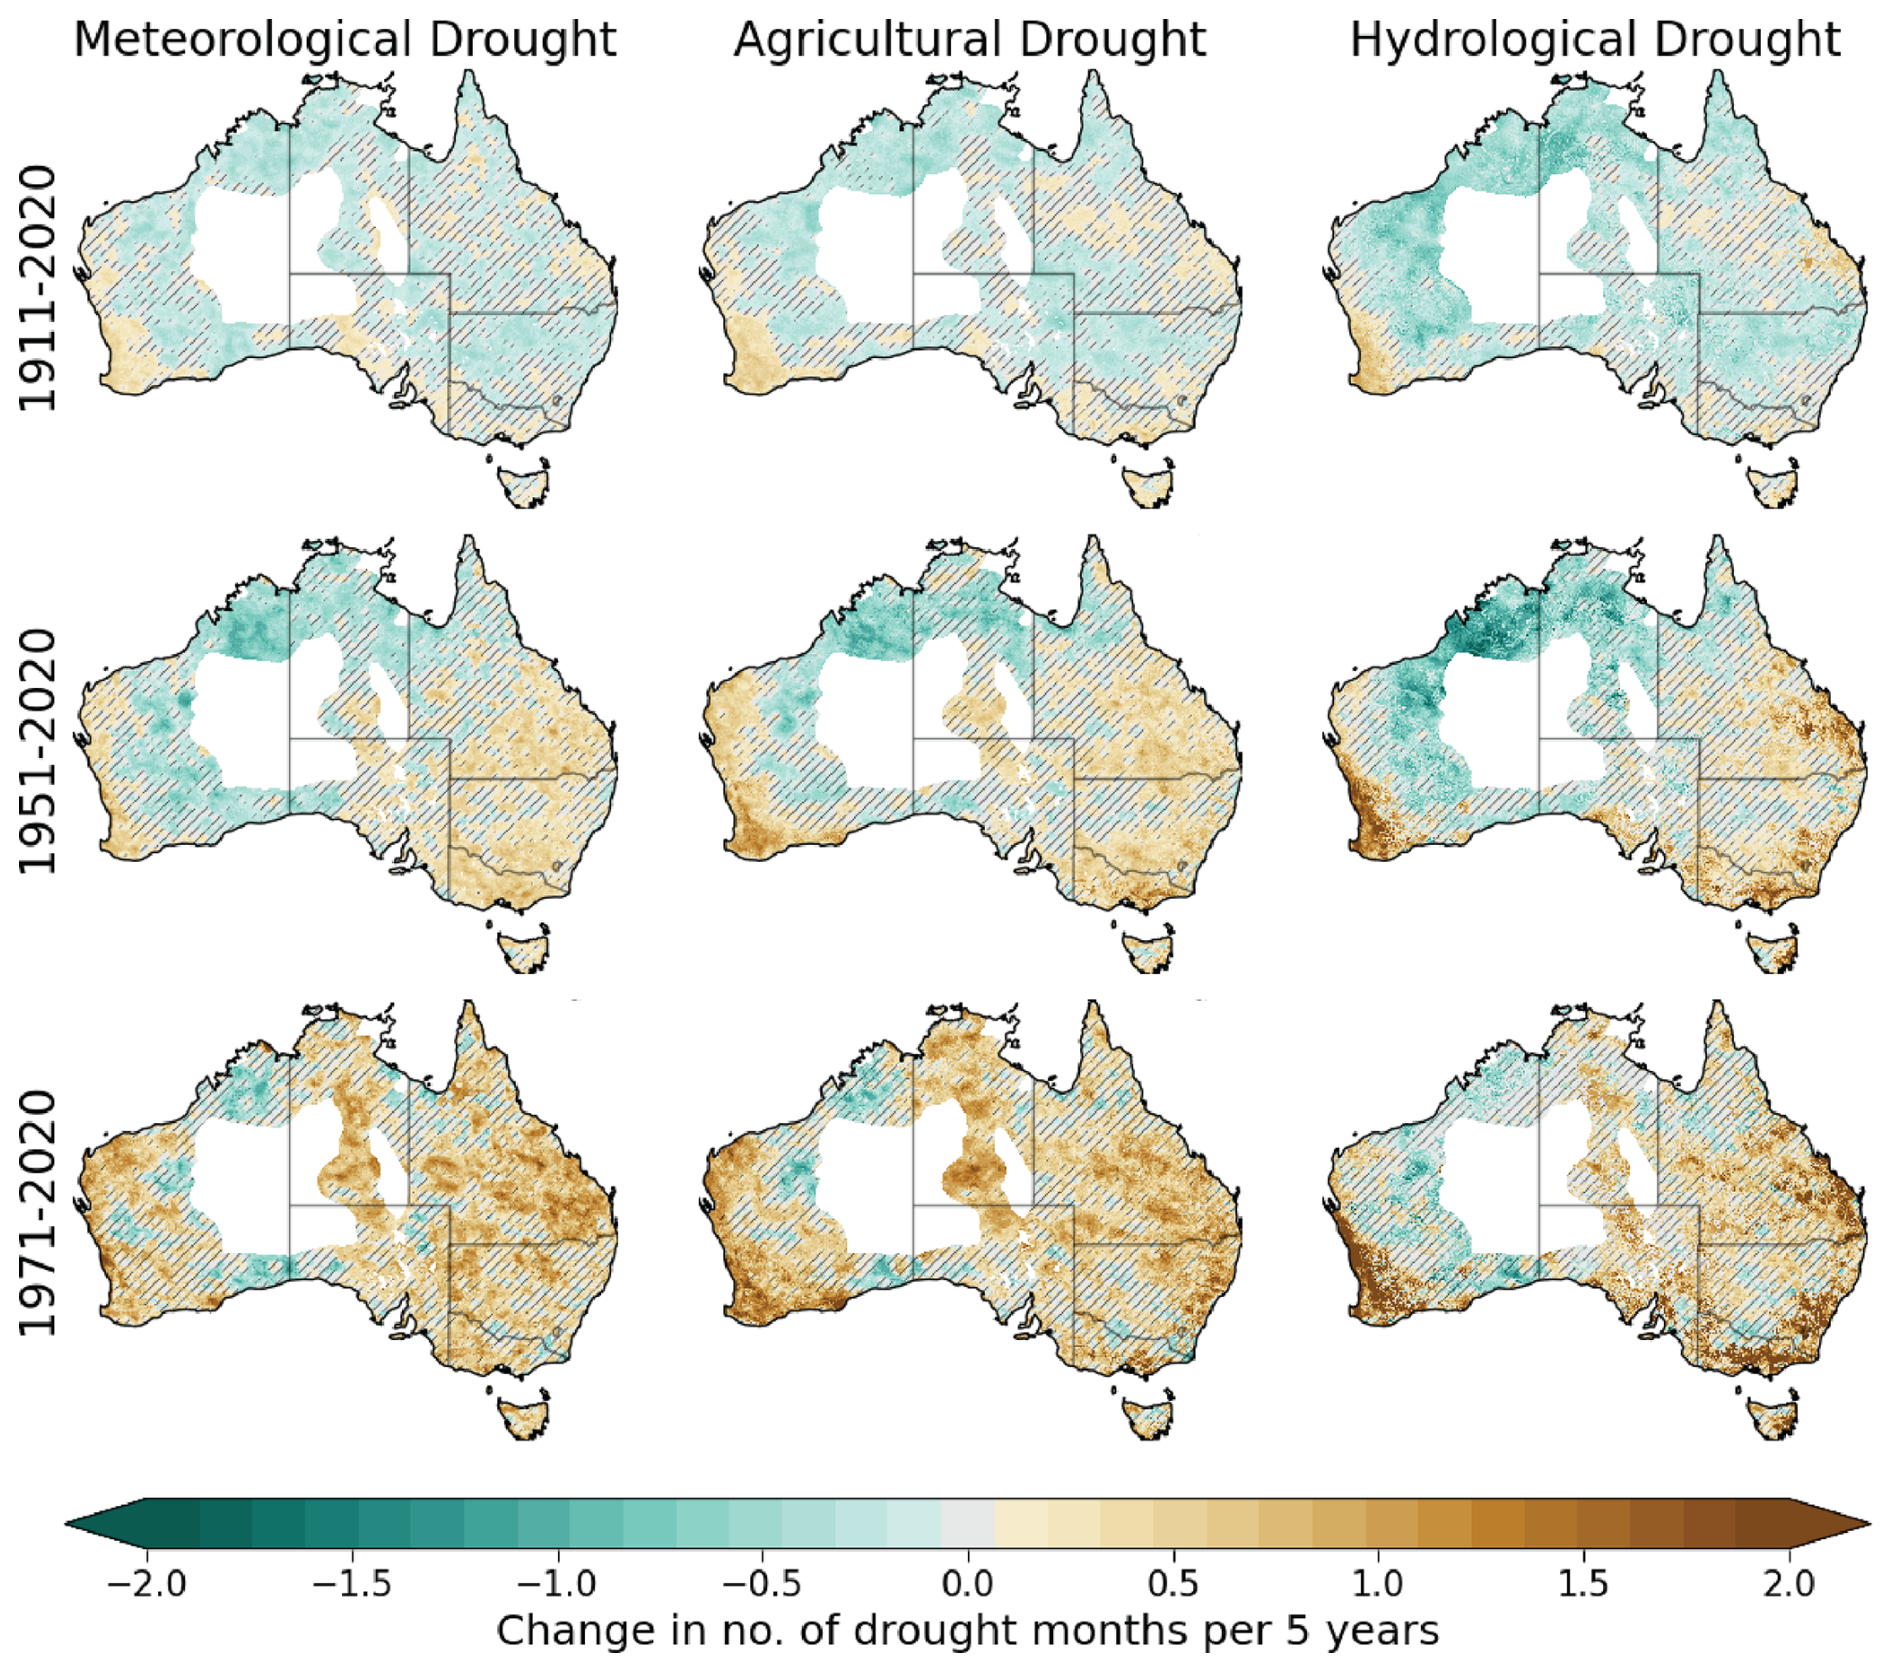
Figure 2Trends in time under drought for the three traditional drought types and three time periods. The maps show the change in the number of drought months per 5 years during the three time periods. The hatching indicates where the trend is not significant (p>0.05). The white spaces indicate the area masked out due to the sparse observation network.
Over 1951–2020, there are much larger areas of increasing trends in time under drought. This is particularly evident over the eastern half of the country and along much of the west coast. However, large areas in the north and northwest of the country still show significant reductions in time under drought. The areas of increasing trends are even larger for 1971–2020, with most of the country experiencing drying trends over this period. Many areas in central and northern Australia are showing increasing time under drought compared to decreases over the longer time period. Although some areas in the north are still showing decreasing trends, these areas are much smaller than for the 1951–2020 period. These trends are much stronger than what was seen over 1911–2020, with meteorological and agricultural droughts sometimes showing an increase of 3 or more extra drought months per 5 years and hydrological droughts sometimes increasing by over 6 extra drought months per 5 years.
Although these trends are often significant, there are few areas where the trend has emerged from the historic variability, as indicated by the KS test and the ratio (Fig. S3). The ratio shows no areas where the trend has emerged for meteorological and agricultural droughts and only 0.02 % of the country for hydrological drought. For meteorological and agricultural droughts, the KS test also only shows small areas (0.8 % and 0.6 %, respectively) where the trend has been found to have emerged. However, for hydrological drought, around 15.3 % of the country is showing emerging trends. When these changes are showing an increase, much of this is concentrated in the southwest, consistent with a strong decline in streamflow in this region (Petrone et al., 2010). There is also a substantial region of increasing emerged change near the east coast. However, most of the area (14.5 % of the country) showing an emerging trend is experiencing a decreasing trend. This is largely concentrated in the north and northwest – areas that have been experiencing a substantial increase in streamflow in recent decades (Wasko et al., 2021). However, given the inconsistency between the two tests, there is not strong evidence to suggest that these trends are outside the variability of the observational period. This is in line with evidence from the paleoclimate record which shows that the frequency of droughts in the southeast and southwest of Australia are within the natural variability of the climate when compared to paleoclimate data and climate models (Falster et al., 2024; O'Donnell et al., 2021; Vance et al., 2015). However, this does not necessarily mean there is no human influence in these trends. The baseline period used in the tests includes both natural and anthropogenic influences. This, alongside the high natural variability of Australia's climate, can mask emerging anthropogenic signals. Our tests simply show that there is not yet evidence of a robust climate change signal based on the available data, but future monitoring of these trends is essential to determine if they are predominantly anthropogenically or naturally driven.
These trends are largely reflected in the impact-based metric across southeastern Australia. The 1911–2020 period shows areas of decreasing time under drought across parts of inland southeastern Australia, whereas increasing trends are seen along the east coast (Fig. 3). However, much of the region shows no significant changes. However, during 1951–2020, trends show increasing time under drought over many regions, particularly along the coast and in western Victoria. The increases become widespread over the 1971–2020 period, covering most of the region. However, these trends are rarely significant, likely due to high variability of the impact-based drought metric and the shorter time period over which these trends were calculated. The trends in the impact-based metric support the results found using the traditional drought metrics, yielding similar results. This implies that the physical changes seen in the traditional metrics are likely mirrored in changes to drought impacts.
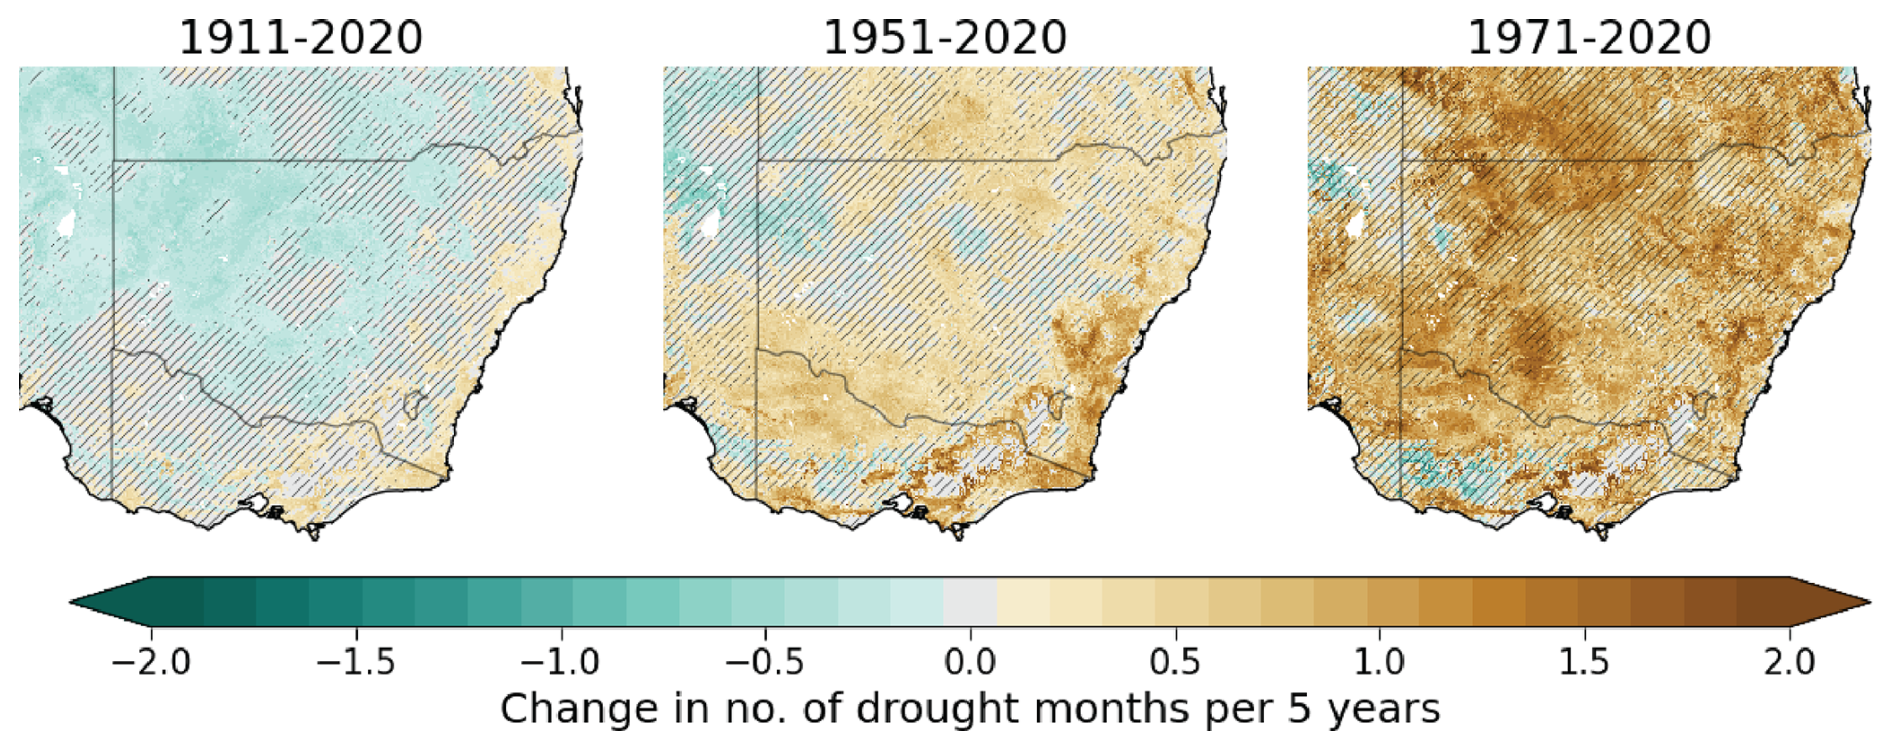
Figure 3Trends in time under drought for the impact-based drought metric. The maps show the change in the number of drought months per 5 years during the three time periods. The hatching indicates where the trend is not significant (p>0.05). The white spaces indicate the area masked out due to the sparse observation network.
We tested the robustness of the trends detected in the traditional drought metrics using alternative methods. We aggregated the drought months over different periods, i.e. over 2, 3, and 7 years (Figs. S4–S6), using a logistic regression model to model the changes in the drought months (Fig. S7) and calculated the metrics using 12-month aggregation periods instead of three (Fig. S8). All these methods give results that largely agree with those presented in the main paper. This suggests that our results are robust to our methodology. The trends in drought intensity indicate very similar patterns to the time under drought trends (Fig. S9).
3.2 Area under drought trends
Next, we quantify the area under drought trends across the eight NRM regions (Fig. 1) for the three traditional drought metrics. This allows for a more in-depth look at how droughts have been changing over the historical period. The time series of area under drought is plotted alongside the trends over each half of the time period (1911–1965 and 1966–2020) and the decadal means (Fig. 4). There is often a substantial difference in the trends over the two time periods. Over the whole period, there is a clear decline in area under drought for the northern and central regions (Monsoonal North, Wet Tropics, and Rangelands). This decline is especially prominent in the second half of the time series in the Monsoonal North and Rangelands; however, the decline is more prominent in the first half of the time series for the Wet Tropics. The S/SW Flatlands is the only region showing a consistent drying trend over the two periods. These findings are consistent with evidence of a decrease in southwestern Australia's rainfall and an increase in droughts (Seneviratne et al., 2021), in addition to an increase in rainfall in northern Australia (Dey et al., 2019). In contrast, the regions in the southeastern half of the country (East Coast, Central Slopes, Murray Basin, and Southern Slopes) show a change in the direction of the trend between the two periods. In the first half of the time series, they show a clear and often significant decreasing trend, but this changes to an increasing trend between 1966 and 2020. This is consistent with our findings of time under drought trends, where we see large areas across eastern and southeastern Australia begin to increase from around the mid-20th century.
These observed changes in area under drought, although often significant, largely lie within the range of historical variability. For the area under drought trends, we assessed the trend emergence using three methods: changes in decadal means, the KS test, and the ratio. The decadal averages in area under drought nearly always remain within the confidence intervals of expected decadal variability (Fig. 4). An exception to this is in the S/SW Flatlands and Southern Slopes, where the decadal averages rise above the confidence interval for hydrological droughts towards the end of the time series. However, for the Southern Slopes, the decadal averages fall back within the confidence intervals after having emerged beyond them, and, for the S/SW Flatlands, only the final decadal average of the time series is outside the confidence intervals. As a result, there is limited evidence that these changes have emerged beyond the expected historical variability of area under drought. Additionally, the KS test and ratio show that the changes remain within the historic variability for both meteorological and agricultural droughts (Figs. S10–S11). On the other hand, for hydrological drought, both tests show that the changes are outside the expected range for the Monsoonal North and the Rangelands. However, these never extend beyond an ratio of less than −2, which suggests that these levels of area under drought are unusual but not necessarily unfamiliar (Frame et al., 2017). As the decadal means for these areas remain within the confidence intervals, there is again inconsistency between tests. Consequently, there is not strong evidence to indicate that these changes fall beyond the range of observed variability during the historic period. Continued monitoring of these changes is necessary to determine whether or not they are driven by anthropogenic climate change.
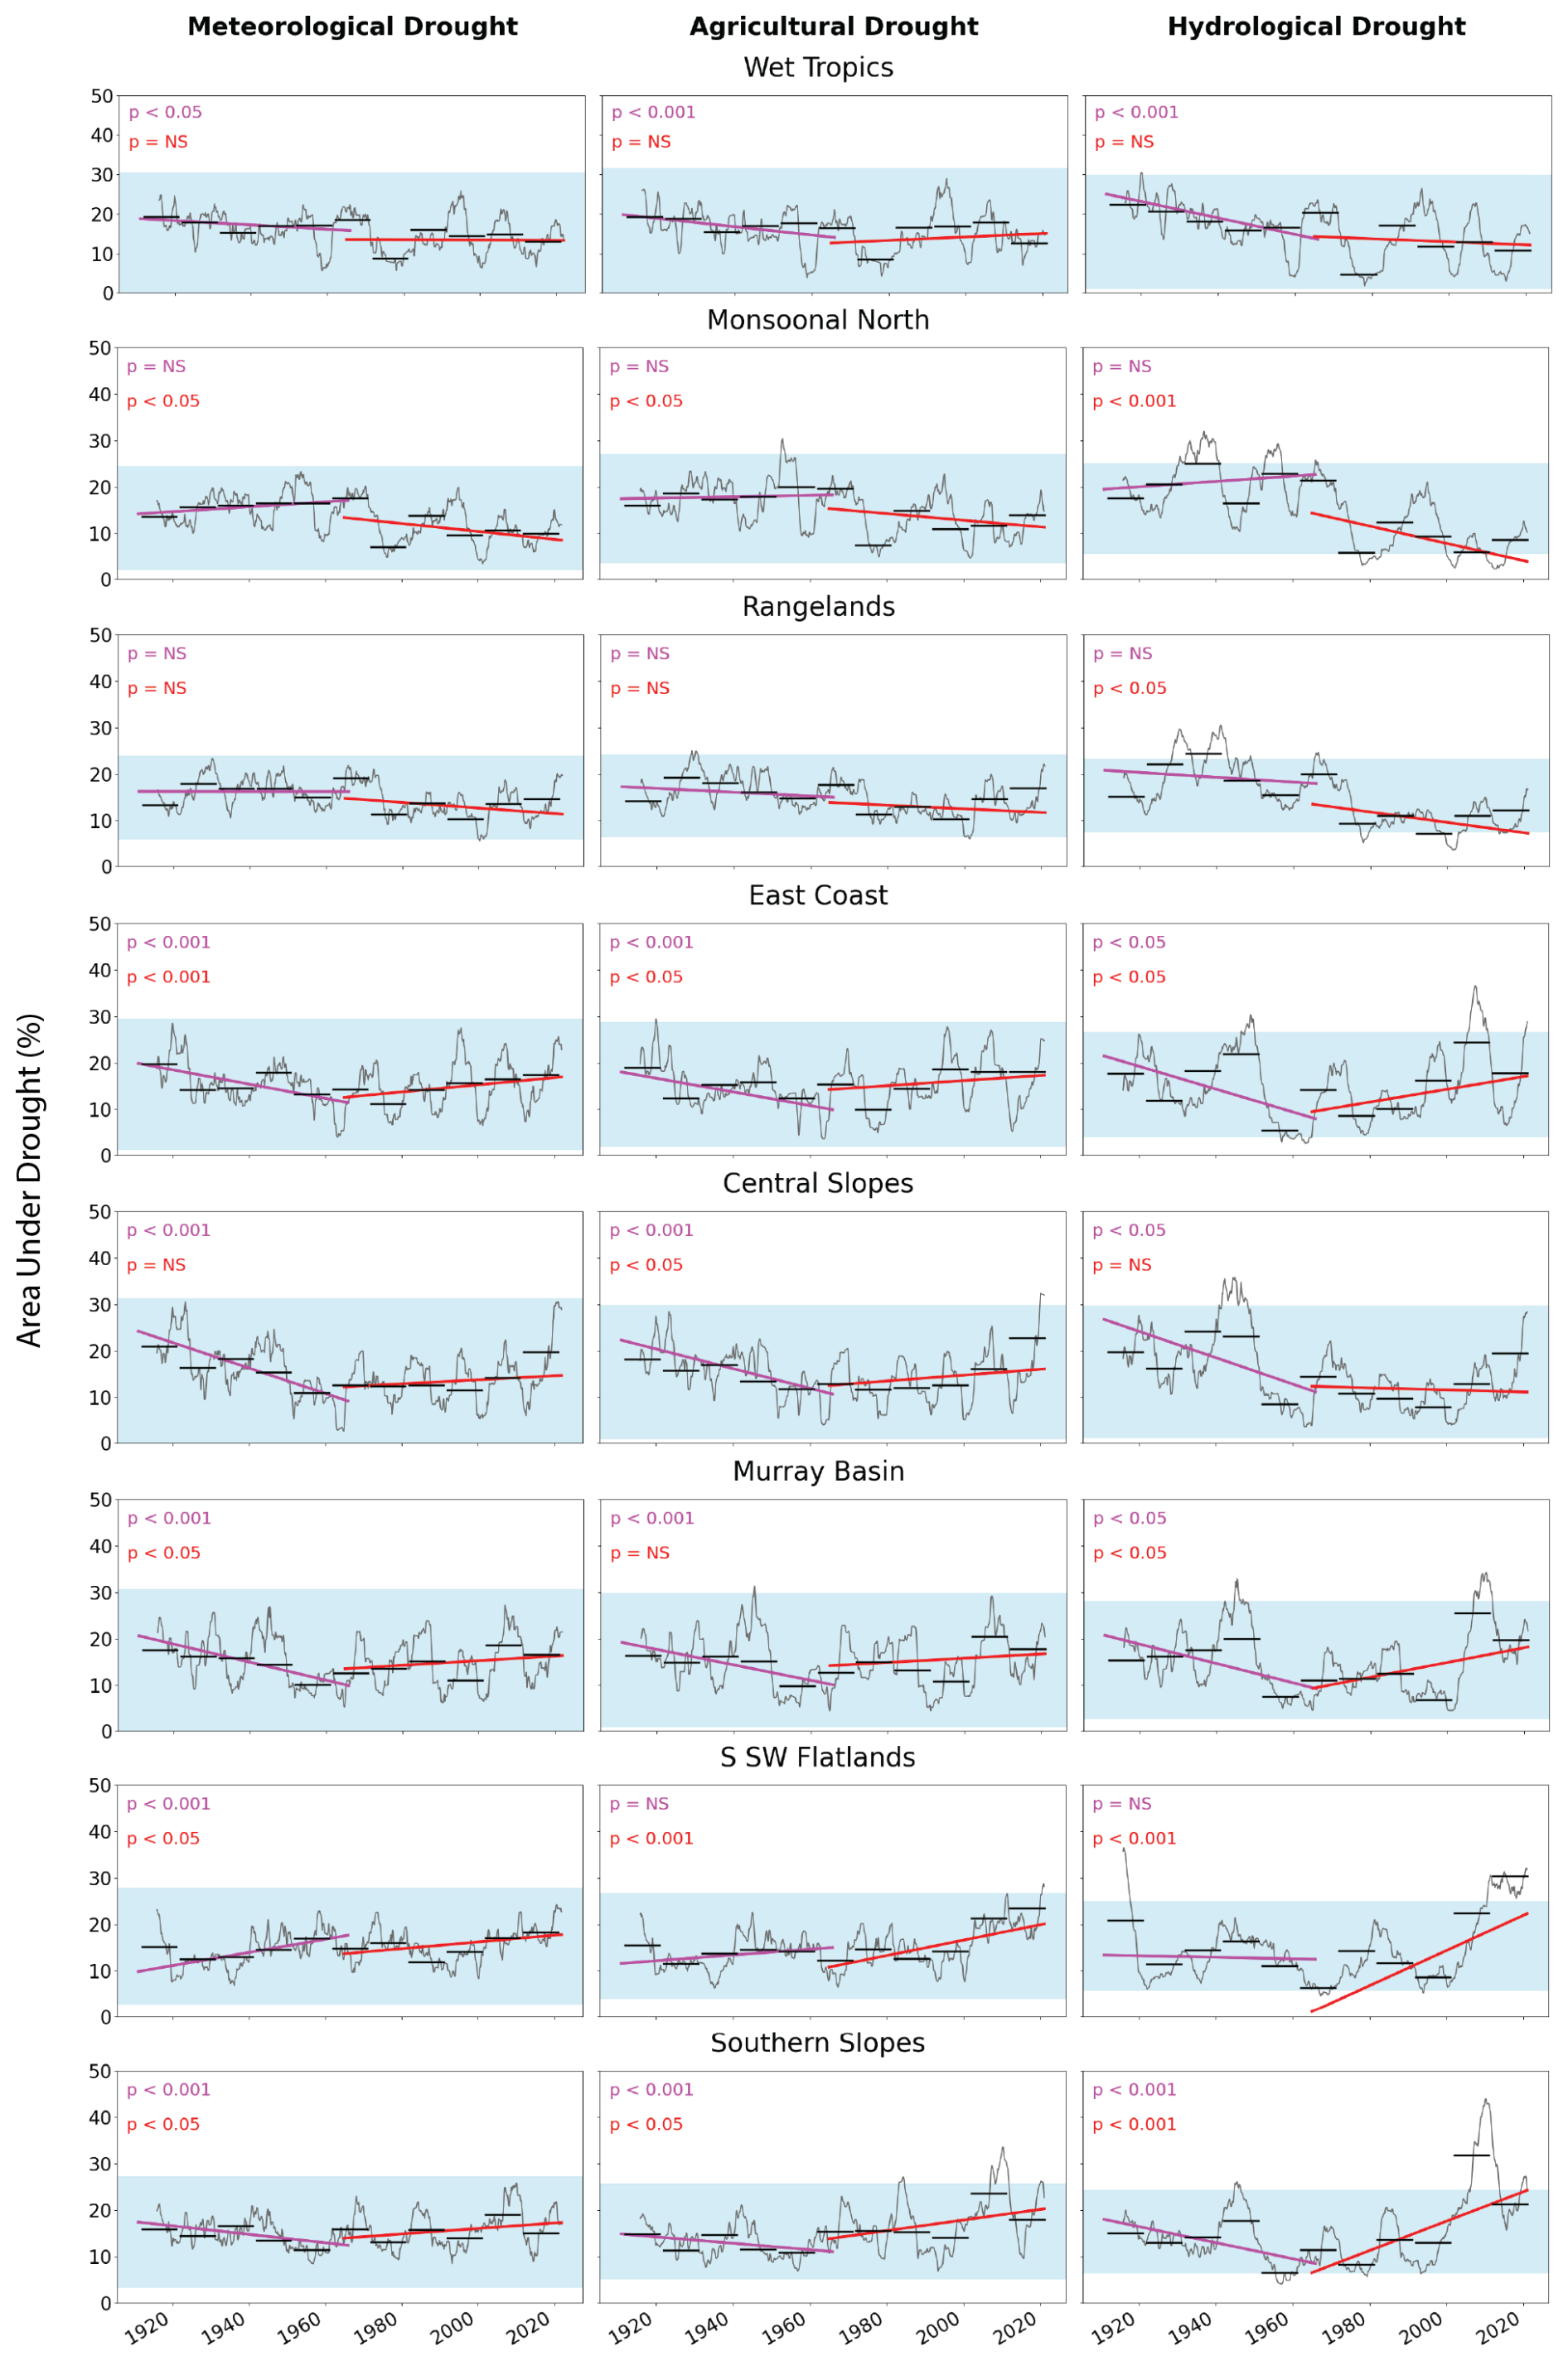
Figure 4Five-year rolling mean of area under drought for the three traditional drought metrics over the NRM areas. The trend from 1911 to 1965 is shown in magenta and the trend from 1966 to 2020 in red. The significance of these trends is indicated in the top left-hand corner of each plot (p= NS: not significant, p<0.05: significant, p<0.001: very significant). The horizontal black bars represent decadal means, and the light-blue shading indicates the range of the decadal confidence intervals (Eq. 3).
3.3 Drought trends per season
We next investigate drought trends over different seasons to understand the implications for sectors dependent on seasonal conditions, such as agriculture. The trends in time under drought differ strongly between summer (DJF) and winter (JJA) (Fig. 5). There are also clear differences for spring (SON) and autumn (MAM) (Fig. S12). These differences are apparent for all traditional drought types considered, but the differences between seasons are much less distinct in hydrological droughts. For the 1911–2020 period, DJF shows substantially larger areas of decreasing time under drought than JJA. In fact, only hydrological drought shows substantial areas of decreasing trends in JJA (36 % of the total area, compared to 15 % and 19 % for meteorological and agricultural droughts, respectively). The areas of decreasing hydrological drought trends are mostly concentrated in the northwest, whereas there are large areas of increasing meteorological and agricultural drought in the southwest. On the other hand, in DJF, 38 %–51 % of the area is experiencing decreasing drought and only 2 %–5 % is experiencing increasing trends. The areas of decreasing trends are largely concentrated in the western, northern, and southeastern regions.
As with the annual trends, more recent decades tend to show larger areas of increasing drought. However, in DJF, there are still large areas of decreasing drought (37 %–48 %) during 1951–2020, mostly over the western parts of the country. However, there are also areas of increasing trends on the eastern side, particularly for agricultural and hydrological droughts. In the 1971–2020 time period, the areas of decreasing drought reduce substantially (11 %–18 %). The areas of increasing drought are larger, although still mostly apparent in the east of the country. For JJA, during 1951–2020, there is little area of decreasing drought, particularly for meteorological and agricultural droughts (5 % and 9 %, respectively), and there are substantial areas (25 %–33 %) of increasing trends, particularly in the southwest, which receives the majority of its rainfall during the cool season (Potter et al., 2005). Over 1971–2020, the drying in the southwest is still apparent, but there is a large area of wetting over the eastern part of the south coast in meteorological and agricultural droughts. This area is seen to be drying during the other seasons and the annual trends.
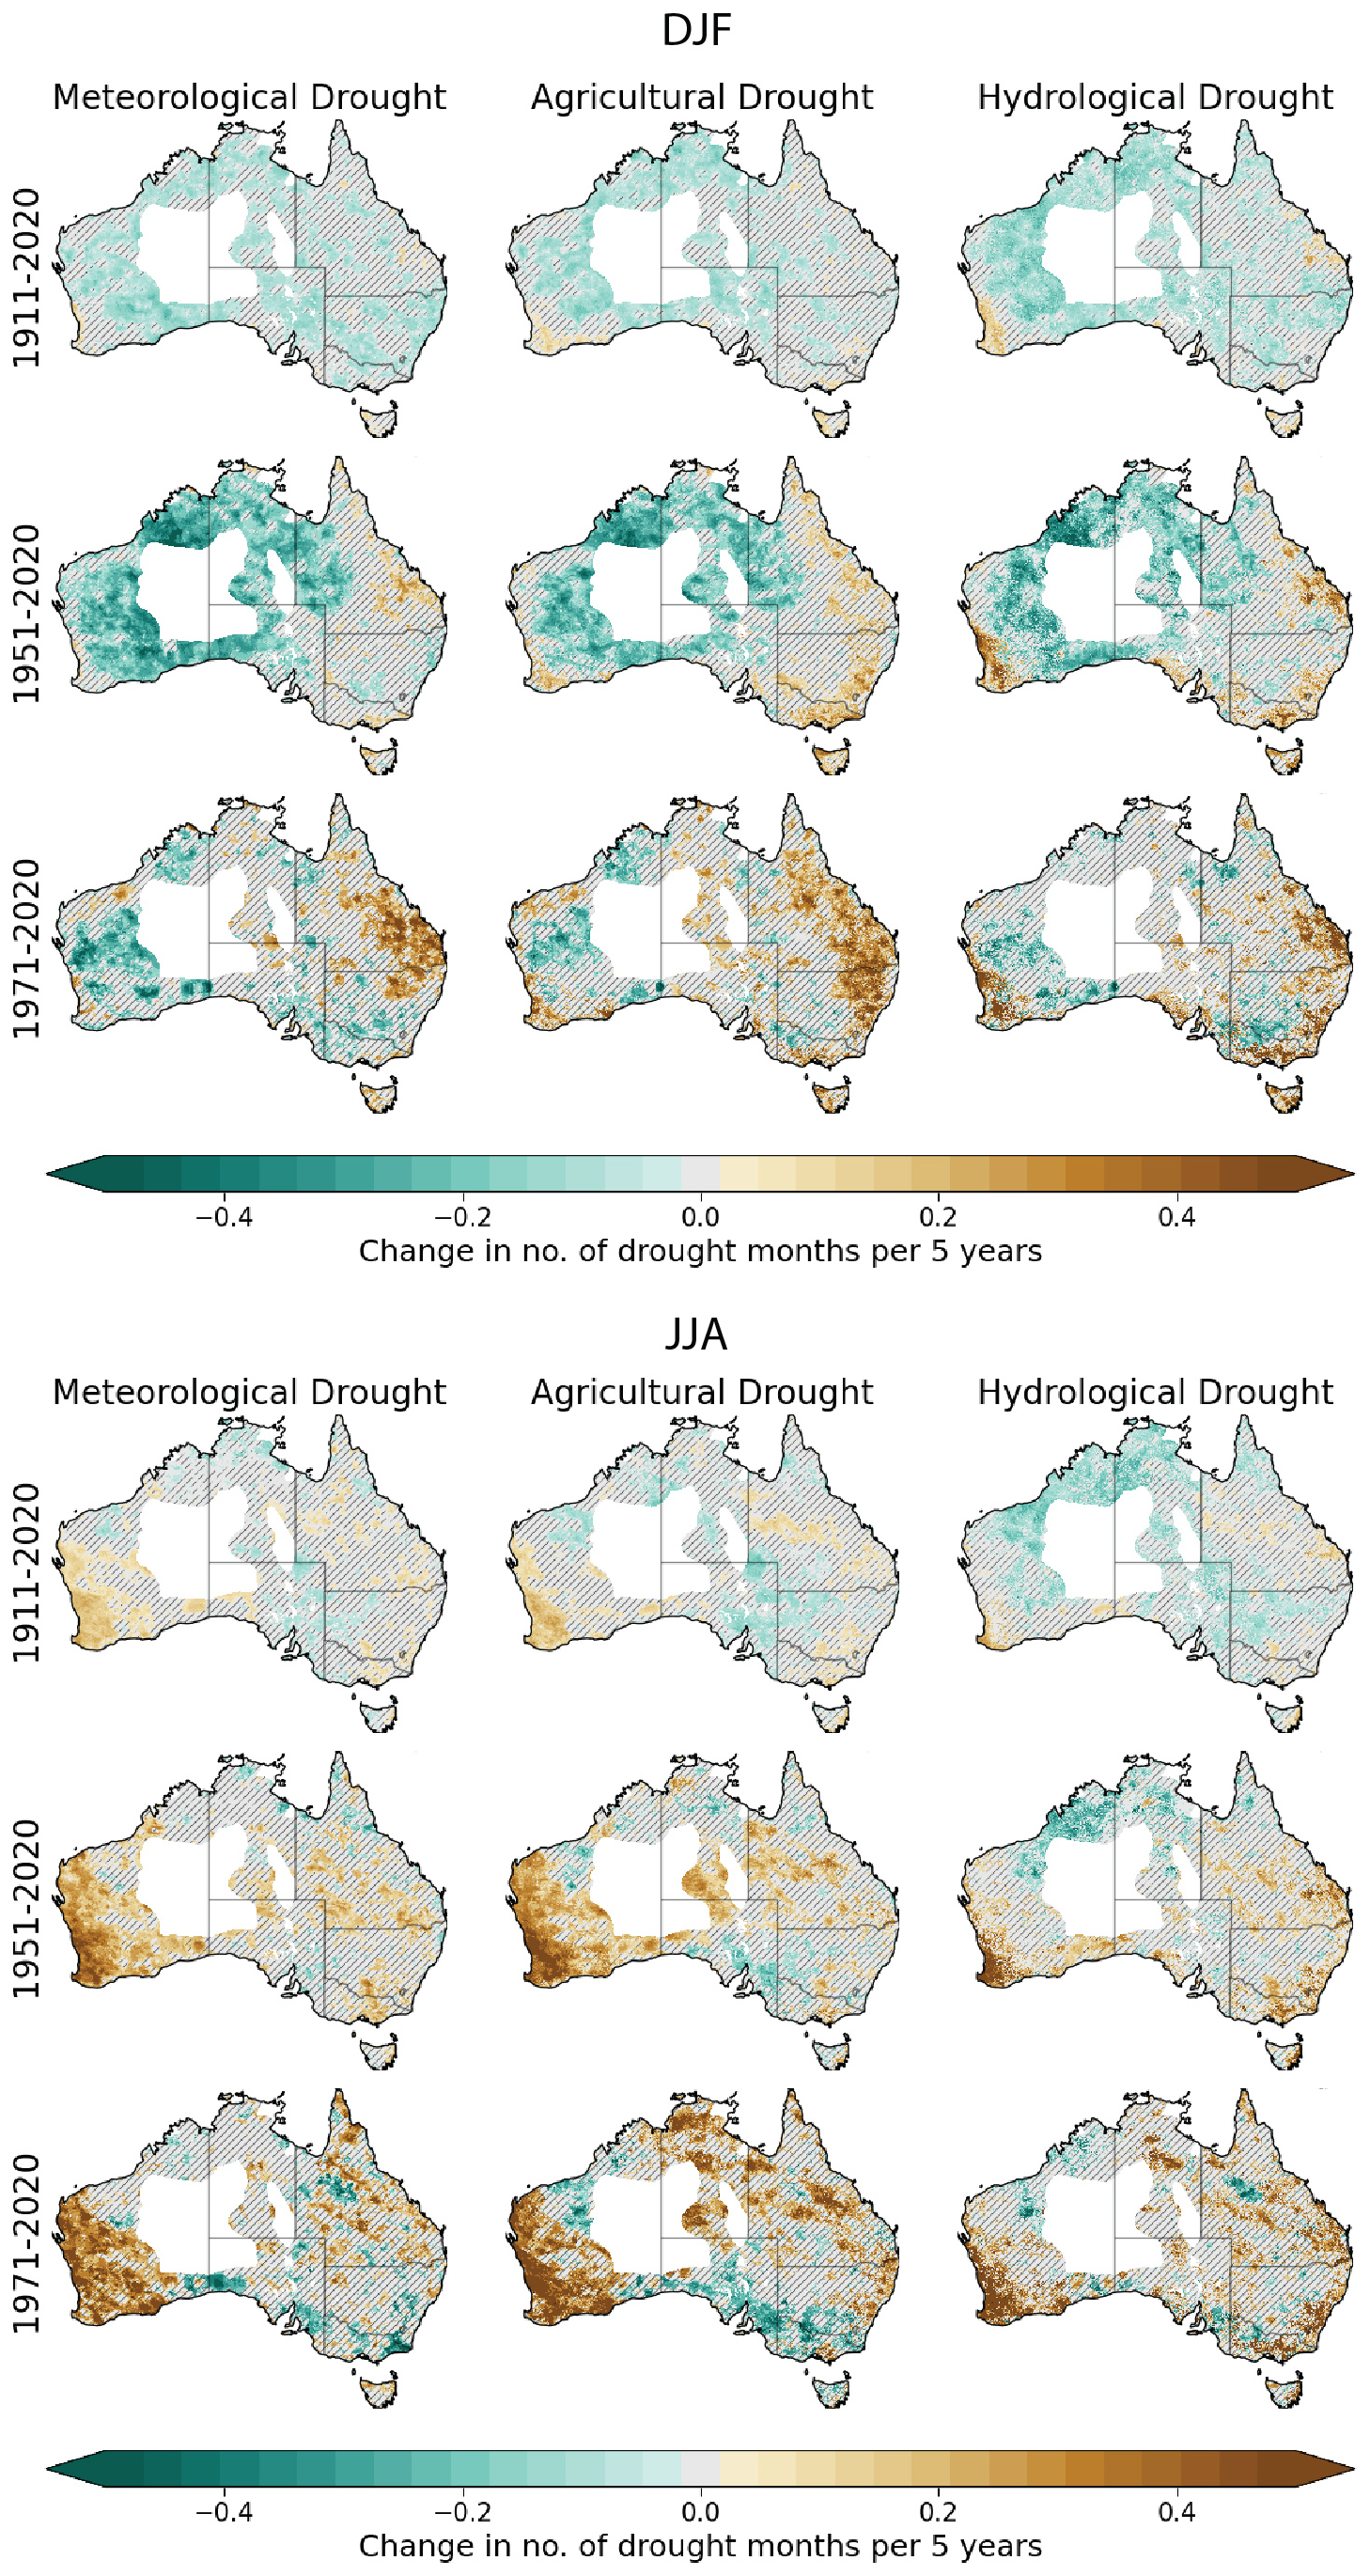
Figure 5Seasonal trends in time under drought for summer (DJF) and winter (JJA). The trend is shown for the three traditional drought types and three time periods as the change in number of drought months per 5 years. The hatching indicates where the trend is not significant (p>0.05). The white spaces indicate the area masked out due to sparse observation network.
3.4 Variability and mean contributions
The trends in the drought metrics can be driven by changes in both the mean and variability of the underlying hydrological variable. We next quantify these respective contributions for each drought metric to better understand the causes of past trends. The contribution from the change in the mean is shown for the three traditional drought metrics (Fig. 6). A contribution of 100 % signifies that the drought trend is fully driven by changes in the mean, and a contribution of 0 % means that the trend is fully driven by changes in the variability. While there is some apparent randomness where the contribution is strongly contrasting, there are large and coherent areas across the continent where the contributions from the mean and the variability are spatially consistent. In 78 %–92 % of the area with a significant trend, depending on drought type and time period, the change in the mean is the dominant cause of the drought trend. However, there are large areas (7 %–19 % of the significant trends) where the change in variability is driving the drought trend. In many of these areas, the mean contribution is 0 %, and the drought trend is being caused solely by the variability changes. In these cases, the trend of the underlying hydrological variable is in the opposite direction to the drought trend. As a result, if a study were to use mean changes as a proxy for drought changes, which is often done (e.g. Dai, 2011; Feng and Zhang, 2015; Yildirim and Rahman, 2022), then the results would show trends in the wrong direction for a substantial portion of the country. This highlights the importance of considering anomalously dry periods when quantifying drought trends, as changes in the mean of hydrological variables may not always capture the trend in the dry extremes correctly.
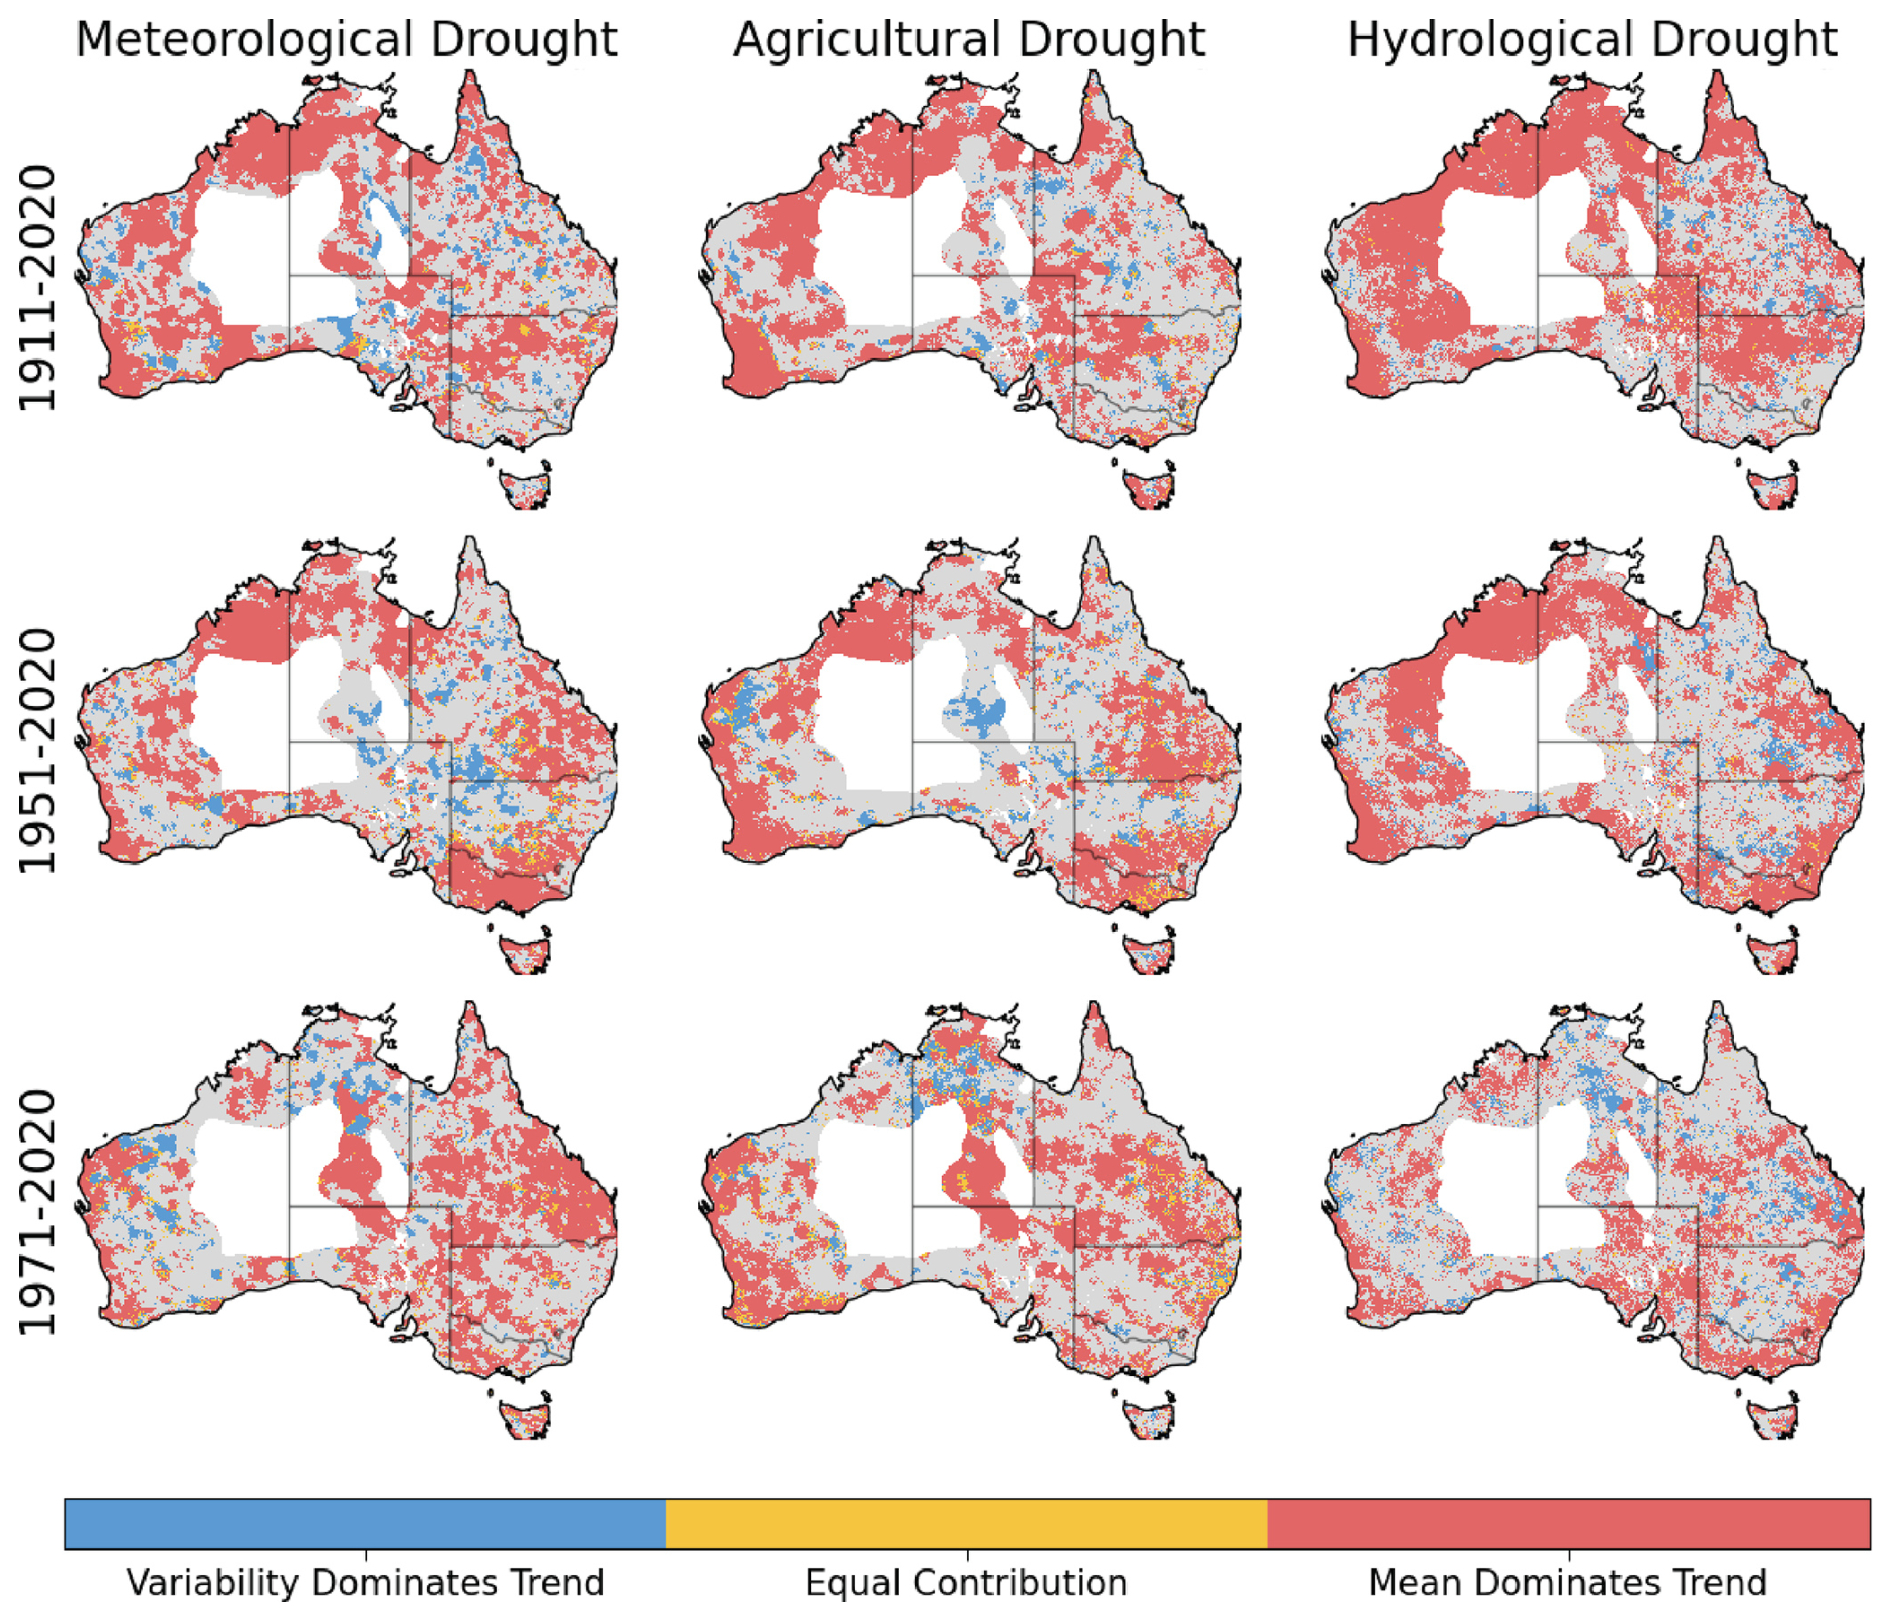
Figure 6The contribution of changes in the mean and variability of the underlying hydrological variable to trends in time under drought. This is shown for each of the three traditional drought types and for the trends over three different time periods. The white spaces indicate the area masked out due to the sparse observation network. Grey indicates areas where the time under drought trend was not significant (p>0.05).
3.5 Contribution of hydrometeorological variables to drought trends
We next quantify the contribution of individual hydrometeorological drivers to drought trends. By relating trends in a number of hydrometeorological variables with the time under drought trends (using an RF as a regression model), we can identify those variables that have the strongest association with the drought trends. Note that the RF method identifies correlation and not necessarily causation. However, we identify variables that have the strongest relationship with drought trends and are plausible drivers of these trends, thereby determining the most probable contributors to drought trends. Here, we focus on agricultural and hydrological drought trends as these can be influenced by multiple aspects of the water cycle. The importance rankings of the hydrometeorological variables for the 1981–2020 trends in time under agricultural (Fig. 7) and hydrological (Fig. 8) drought for each NRM region over each season are presented.
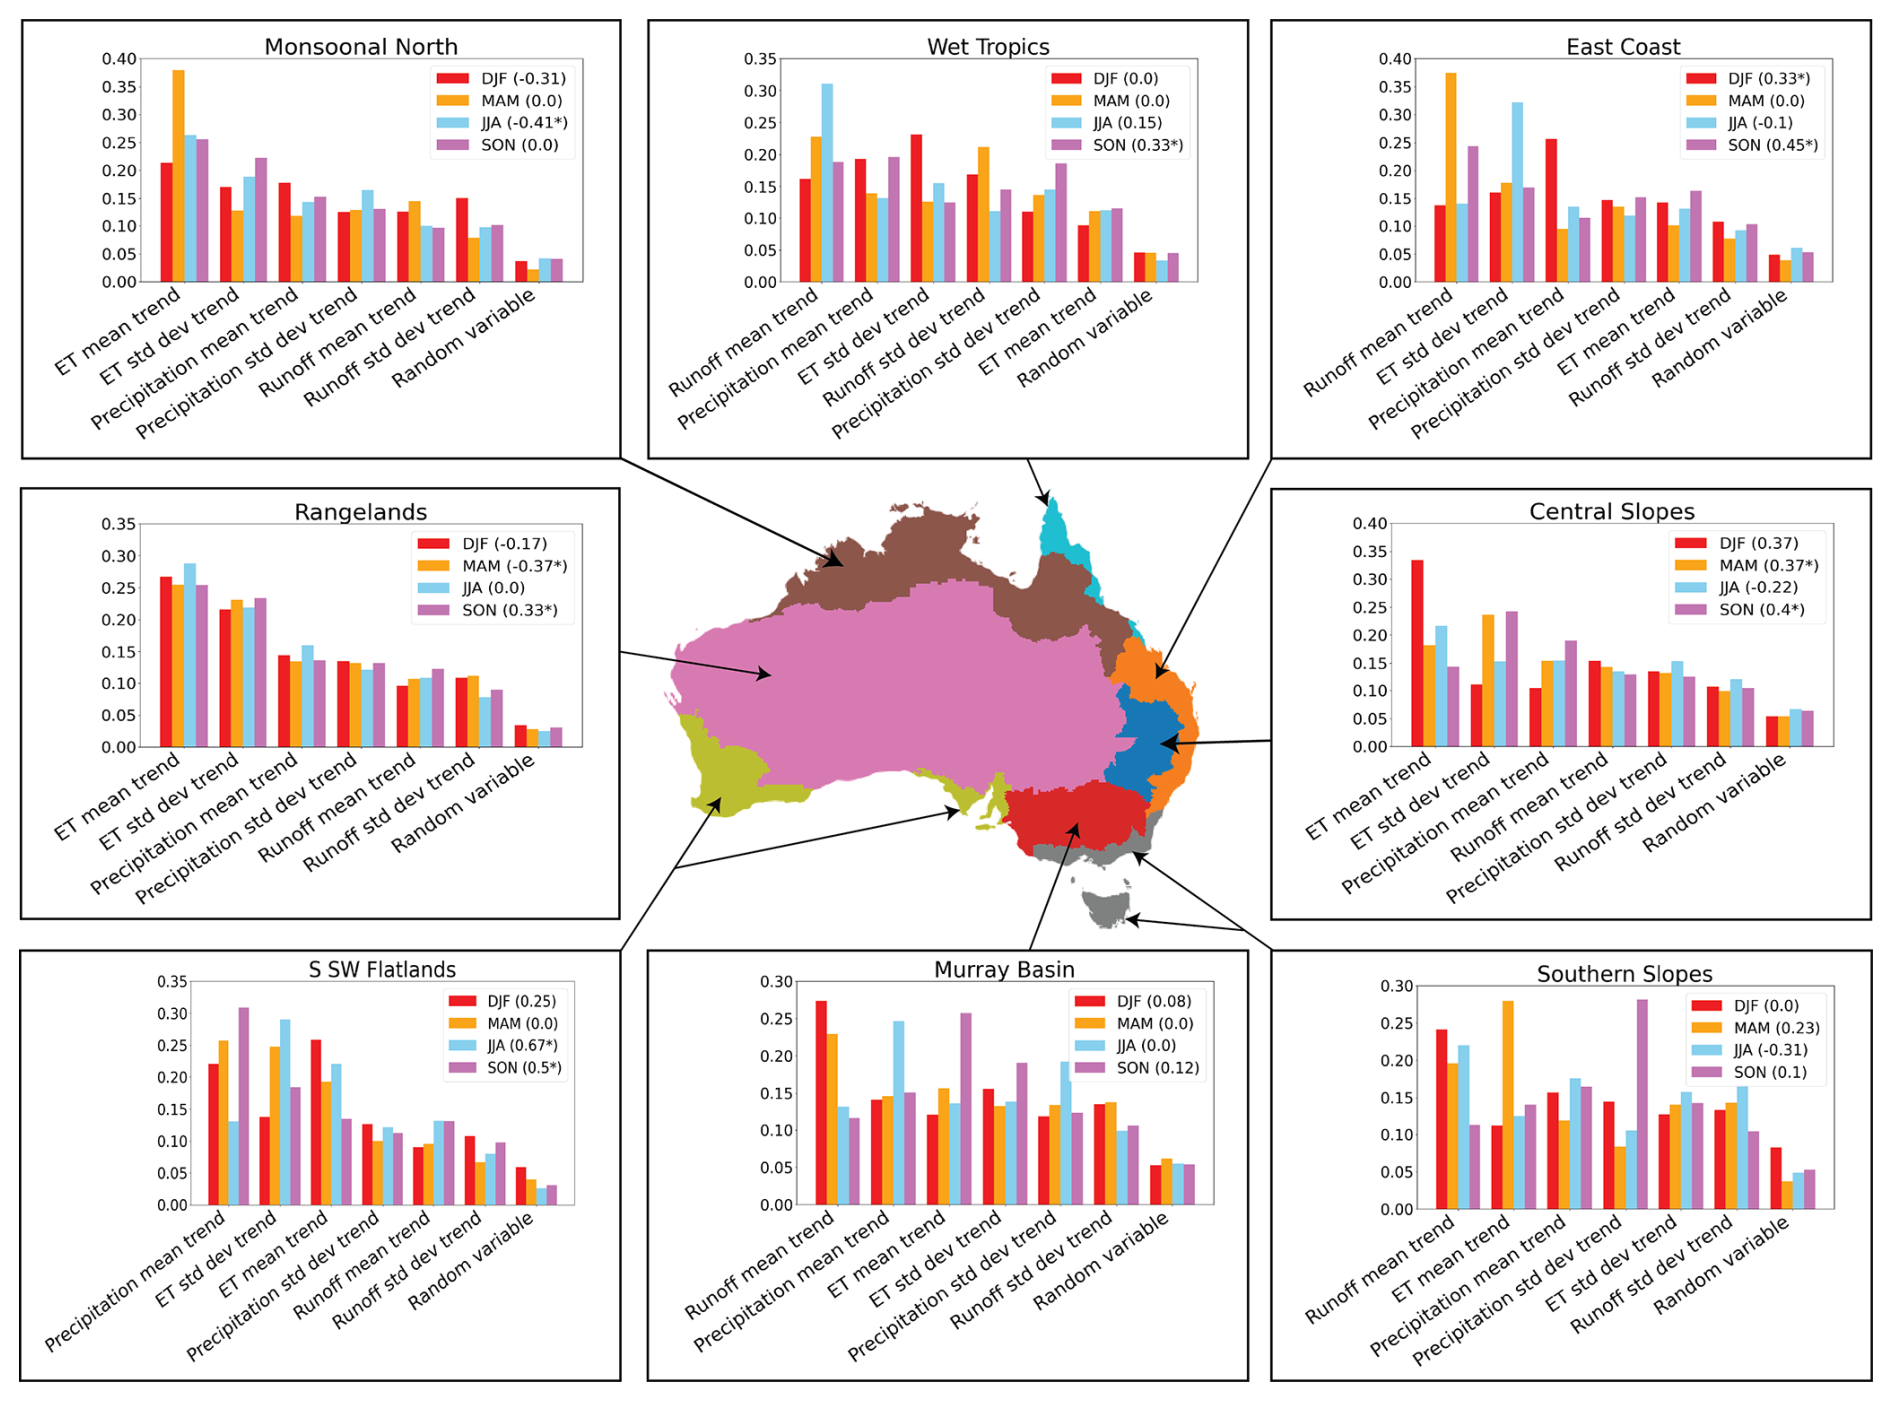
Figure 7The variable importance of changes in key hydrometeorological variables for the 1981–2020 trends in time under agricultural drought. These are shown for each NRM region and each season. The drought trend over the region and season is shown in parentheses in the legend of each plot, with an asterisk indicating a statistically significant trend (p<0.05).
For the agricultural drought trends, we find large variations in the most important predictor variables depending on the region and season. However, for all seasons and regions, every variable ranks higher than the randomly generated one, as all have some influence over the drought trends. The mean trend in ET is the variable most often ranked as the most important across seasons and NRM regions. However, this varies greatly between the different regions; for example, the mean trend in ET consistently ranks as the least important hydrometeorological variable in the Wet Tropics across all the seasons. This is likely due to the year-round wet conditions in this region, leading to smaller variations in ET and thus a limited influence on droughts. Conversely, ET has a larger influence in regions and seasons where it has a high contribution to the water cycle. For example, ET consistently ranks as the most important variable in the precipitation-limited Rangelands region. Regions with more distinct seasons such as the southeastern regions or the Monsoonal North have greater variations in the importance of ET across the seasons. For example, in the Southern Slopes, the most important predictor is the runoff mean trend in DJF and JJA, ET mean trend in MAM, and precipitation standard deviation trend in SON.
For the hydrological drought trends, again all variables are found to have influence over the trend as they rank above the random variable. The soil moisture mean trend is often the highest-ranked variable across seasons and regions. One exception to this is the S/SW Flatlands, where the precipitation mean trend dominates in JJA and SON, while all the variables are ranked relatively evenly in the other seasons.
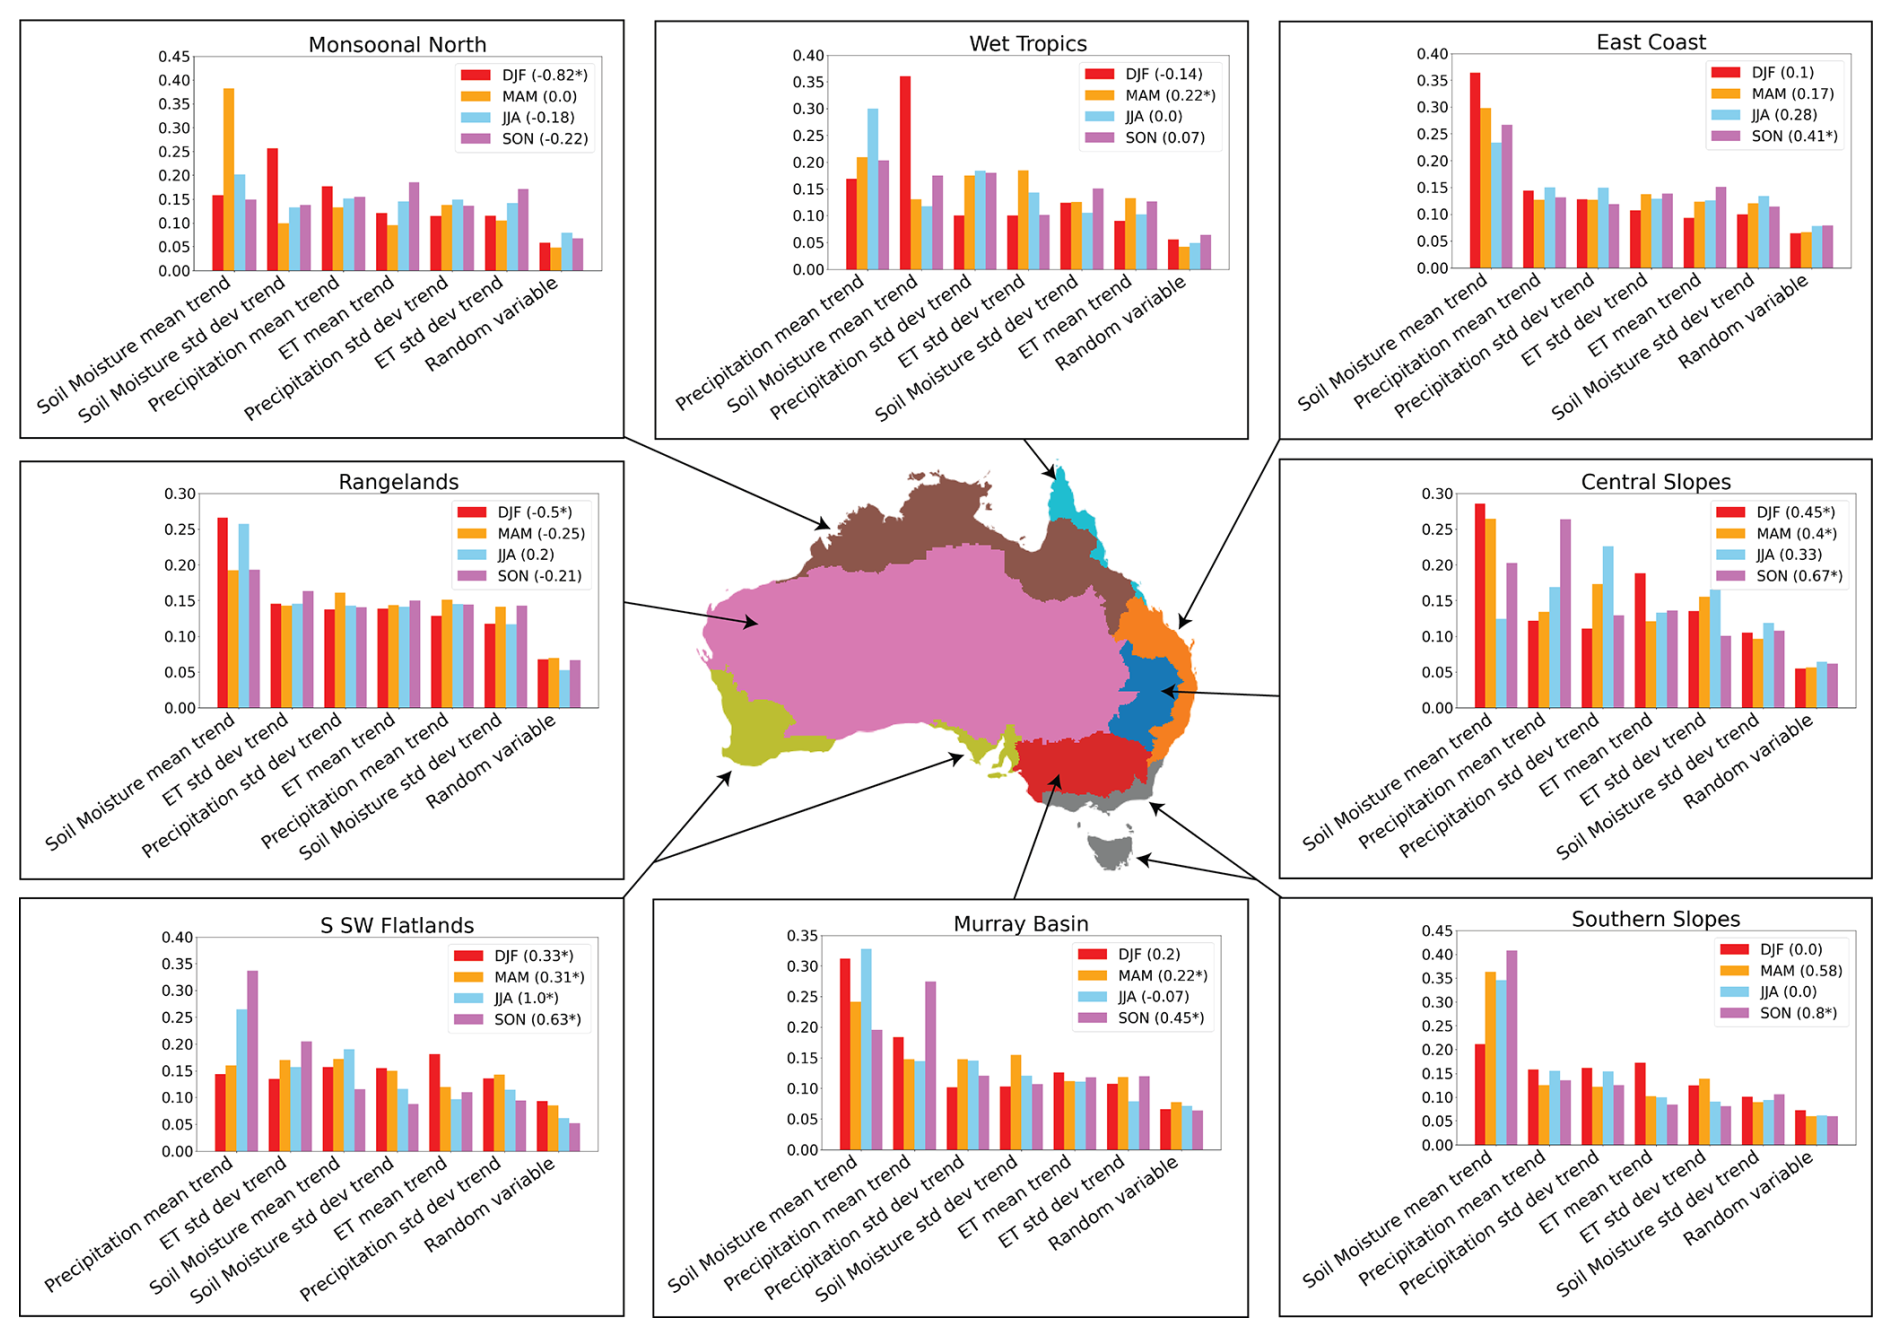
Figure 8The variable importance of changes in key hydrometeorological variables for the 1981–2020 trends in time under hydrological drought. These are shown for each NRM region and in each season. The drought trend over the region and season is shown in parentheses in the legend of each plot, with an asterisk indicating a statistically significant trend (p<0.05).
Although precipitation trends are clearly an important factor in historical drought trends, precipitation only ranks as the most important variable in 16 % and 22 % of regions and seasons for agricultural and hydrological drought trends, respectively. This emphasises the importance of not only using mean changes in precipitation as a proxy for drought. Droughts are often far more nuanced and can be heavily influenced by other land surface and hydrological processes. Agricultural and hydrological droughts are changing, and this is not solely attributable to precipitation changes, so it is imperative that future work considers the multiple factors that influence drought.
3.6 Implications for drought impacts on agriculture and water supply
Across the southeast and southwest of Australia, we found that recent decades have been experiencing widespread increases in time and area under drought. While these changes likely remain within historic variability, they can still cause substantial impacts. Both the southeast and southwest are of particular importance to Australian agriculture, with Australia's Wheatbelt concentrated across the two areas (Vogel et al., 2021). The southeast produces around 40 % of the country's agricultural output (Devanand et al., 2024). The time under drought is showing increasing trends in JJA and SON, which could have implications for winter cropping activities, such as the winter wheat industry. Historically, there have been severe drought impacts on agricultural production, particularly in recent decades. For example, wheat and barley production dropped by 73 % and 43 %, respectively, in 2018, during southeastern Australia's 2017–2019 “Tinderbox Drought” (Devanand et al., 2024). Similarly, dryland wheat production declined by an estimated 18 %–22 % over 2002–2009, during one of southeastern Australia's longest recorded droughts, known as the “Millennium Drought” (van Dijk et al., 2013). Future projections suggest that the recent historical trends could continue across southeastern Australia (Kirono et al., 2020; Ukkola et al., 2024).
In addition to the agricultural impacts, droughts have major impacts on water supply. Over the more recent time periods (1951–2020 and 1971–2020), there have been increasing trends in time and area under hydrological drought for large areas in the southeast and southwest. The majority of the Australian population live in these areas, and therefore increased hydrological drought here could translate to impacts on water supply. Water scarcity has arisen during previous large droughts in these areas. In 2009, the final year of the Millennium Drought, Melbourne's water storage dropped to a quarter of its capacity, the lowest levels on record (Low et al., 2015), and water management practices were implemented to halve the city's water consumption (Grant et al., 2013). Additionally, during the Tinderbox Drought, Sydney's water supply was severely threatened, and many rural southeastern Australian towns came close to running out of water (Devanand et al., 2024). With time under drought in southeastern Australia projected to continue to increase (Kirono et al., 2020; Ukkola et al., 2024), Australia's major cities and rural townships could face further increased water scarcity risks. Our study highlights the importance of considering changes in both the mean and variability of precipitation, soil moisture, and runoff for drought trends. There is considerable uncertainty in the future impacts of climate change on water availability (Fowler et al., 2022; Wasko et al., 2024), and adaptation to changes in both the mean and variability of hydrological variables is critical to ensure sustainable water resource management in the future.
3.7 Limitations
There are limitations stemming from the data used to identify the drought trends. The rainfall data from AGCD is derived from gauge-based observations across the continent (Jones et al., 2009). These gauges are then interpolated to give a smooth surface at a 0.05° resolution across the country. This method works well when the gauges are densely concentrated. However, it can cause issues when the gauges are spread far apart, as is the case in many parts of central Australia (Chua et al., 2022). Even though the AGCD data have been evaluated comprehensively (Jones et al., 2009), the drought trends in data-sparse regions should be interpreted cautiously. These include the sparsely populated inland regions and the mountainous regions of eastern Australia in particular.
Similarly, AWRA-L brings its own uncertainties and errors despite the comprehensive evaluations that have been undertaken to validate the hydrological model (Frost and Wright, 2020). One source of this uncertainty comes from its simplistic representation of the effect that vegetation processes have on the water cycle and consequently evapotranspiration (Ukkola et al., 2024). Given that these vegetation processes have been shown to have a large influence on water scarcity in Australia (Trancoso et al., 2017), this simplistic representation could lead to uncertainty in the model data. Additionally, AWRA-L does not account for the human use of reservoir or aquifer water and is generally not suited to model complex groundwater-to-surface-water interactions. However, regional variation in groundwater availability across Australia could influence drought onset and post-drought recovery, which may not be captured in our study. For example, areas with large groundwater reserves would have a delayed onset of hydrological drought (Mu et al., 2022). At the same time, the influence of groundwater also modulates post-drought recovery, with some regions taking years to fully recover from drought due to delayed groundwater recovery (Fowler et al., 2020, 2022).
These areas of uncertainty in the data will ultimately lead to uncertainties in our results. Our evaluation of AWRA-L showed good agreement with streamflow observations for the direction of hydrological drought trends (Fig. S13). For the 1981–2020 period, AWRA-L runoff captures the correct sign of the trend (negative, positive, or zero) at 76 % of the catchments and 86 % of catchments for the 1951–2020 trends despite lower agreement in the magnitude of trends. We note that the streamflow catchments are mainly concentrated along eastern coast of Australia, with fewer gauges in the west and north of the country. From the information we have in the other areas of Australia, the catchments in the western half of the country show a trend direction agreement of 76 % between the model and observations and 59 % in the northern areas. This suggests that AWRA-L consistently captures the direction of the drought trend across the country but performs slightly worse in the northern areas, where the wetting trends dominate. However, the robustness of this result is harder to evaluate for the western and northern areas due to lower observational data.
A comprehensive understanding of how Australian droughts have been changing has been missing from recent literature. Here, we have shown that, across large areas of the country, the occurrence of seasonal droughts has significantly declined over the past century, with the clear exception of southwestern Australia. However, in more recent decades, the time under drought has significantly increased across many regions, particularly across the east and southwest. We find similar changes in annual-scale droughts. Notably, the decreasing trends over the past century are more apparent in summer (DJF), and the increasing trends in the latter half of the century are more pronounced in winter (JJA) and spring (SON). These changes have potential implications for changes to drought impacts. The steady increase over the second half of the 20th century could bring with it increased drought risk to various industries – such as agriculture and water supply – and the natural environment. However, this increase is following a decline in time under drought and has currently only rebounded to similar levels experienced in the early 20th century. As a result, these recent changes are not unprecedented in the context of the last century, and it is unlikely that these changes extend beyond the historical variability of past droughts.
These drought trends are influenced by both the mean and variability changes in the underlying hydrological variables of each drought type. Even though the mean changes are the primary driver of significant drought trends across most of Australia, there are large areas where the variability changes dominate (7 %–19 %, depending on the drought metric and time period), highlighting the need to consider variability changes when quantifying drought trends. We also show that, in many regions, the trends of agricultural and hydrological droughts are not dominated by changes in precipitation but are strongly influenced by land surface processes including changes in evapotranspiration. These results highlight the fact that simply evaluating changes in mean precipitation is not sufficient for quantifying trends in droughts.
The analysis codes are available at https://github.com/MattGrant1998/AUS_historical_drought_trends (last access: 16 October 2025; DOI: https://doi.org/10.5281/zenodo.17290804, MattGrant1998, 2025).
The sources for all third-party data used for analyses are listed in Table 1. The AGCD observed precipitation data can be obtained at https://doi.org/10.25914/6009600b58196 (Australian Bureau of Meteorology, 2021a). The runoff and soil moisture data from the AWRA-L hydrological model can be obtained at https://doi.org/10.25914/6130680dc5a51 (Australian Bureau of Meteorology, 2021b). The CAMELS-v2 observed streamflow data can be obtained at https://doi.org/10.5281/zenodo.12575680 (Fowler et al., 2024).
The supplement related to this article is available online at https://doi.org/10.5194/hess-29-5555-2025-supplement.
MOG, AMU, and EV conceptualised the study. The specific methodologies were developed by MOG, AMU, EV, SH, and ARB. MOG, AMU, and ARB carried out the analysis and developed the analysis code. All authors contributed to the interpretation of the results. MOG wrote the first draft of the manuscript; all authors contributed to the final paper.
The contact author has declared that none of the authors has any competing interests.
Publisher's note: Copernicus Publications remains neutral with regard to jurisdictional claims made in the text, published maps, institutional affiliations, or any other geographical representation in this paper. While Copernicus Publications makes every effort to include appropriate place names, the final responsibility lies with the authors. Views expressed in the text are those of the authors and do not necessarily reflect the views of the publisher.
This study was funded by the Australian Research Council (ARC) Centre of Excellence for Climate Extremes (grant no. CE170100023). AMU is supported by the ARC Discovery Early Career Research Award (grant no. DE200100086). SH acknowledges the support of the ARC Centre of Excellence for the 21st Century Weather (grant no. CE230100012). This research was undertaken with the assistance of resources from the National Computational Infrastructure (NCI Australia), an NCRIS-enabled capability supported by the Australian Government.
This research has received financial support from the Australian Research Council (ARC) Centre of Excellence for Climate Extremes (grant no. CE170100023), an ARC Discovery Early Career Research Award (grant no. DE200100086), and the ARC Centre of Excellence for the 21st Century Weather (grant no. CE230100012).
This paper was edited by Manuela Irene Brunner and reviewed by Kristen Whitney and one anonymous referee.
Abram, N. J., Henley, B. J., Sen Gupta, A., Lippmann, T. J. R., Clarke, H., Dowdy, A. J., Sharples, J. J., Nolan, R. H., Zhang, T., Wooster, M. J., Wurtzel, J. B., Meissner, K. J., Pitman, A. J., Ukkola, A. M., Murphy, B. P., Tapper, N. J., and Boer, M. M.: Connections of climate change and variability to large and extreme forest fires in southeast Australia, Commun. Earth Environ., 2, 1–17, https://doi.org/10.1038/s43247-020-00065-8, 2021.
Adams, M. A., Shadmanroodposhti, M., and Neumann, M.: Causes and consequences of Eastern Australia's 2019–20 season of mega-fires: A broader perspective, Glob. Change Biol., 26, 3756–3758, https://doi.org/10.1111/gcb.15125, 2020.
Australian Bureau of Meteorology: Australian Gridded Climate Data (AGCD) v1.0.0/Australian Water Availability Project (AWAP), Geonetwork [data set], https://doi.org/10.25914/6009600B58196, 2021a.
Australian Bureau of Meteorology: The Bureau of Meteorology’s National Hydrological Projection data collection on changes to Australia's hydrological water balance, Geonetwork [data set], https://doi.org/10.25914/6130680dc5a51, 2021b.
Bond, N. R., Lake, P. S., and Arthington, A. H.: The impacts of drought on freshwater ecosystems: an Australian perspective, Hydrobiologia, 600, 3–16, https://doi.org/10.1007/s10750-008-9326-z, 2008.
Breiman, L.: Random Forests, Mach. Learn., 45, 5–32, https://doi.org/10.1023/A:1010933404324, 2001.
Bureau of Meterology: Drought statement, http://www.bom.gov.au/climate/drought/, last access: 9 October 2025a.
Bureau of Meteorology: Southern Oscillation Index (SOI), http://www.bom.gov.au/climate/enso/soi/, last access: 9 October 2025b.
Chua, Z.-W., Evans, A., Kuleshov, Y., Watkins, A., Choy, S., and Sun, C.: Enhancing the Australian Gridded Climate Dataset rainfall analysis using satellite data, Sci. Rep., 12, 20691, https://doi.org/10.1038/s41598-022-25255-6, 2022.
Cook, B. I., Mankin, J. S., Marvel, K., Williams, A. P., Smerdon, J. E., and Anchukaitis, K. J.: Twenty-First Century Drought Projections in the CMIP6 Forcing Scenarios, Earths Future, 8, e2019EF001461, https://doi.org/10.1029/2019EF001461, 2020.
Cravens, A. E., McEvoy, J., Zoanni, D., Crausbay, S., Ramirez, A., and Cooper, A. E.: Integrating Ecological Impacts: Perspectives on Drought in the Upper Missouri Headwaters, Montana, United States, Weather Clim. Soc., 13, 363–376, https://doi.org/10.1175/WCAS-D-19-0111.1, 2021.
CSIRO and Bureau of Meteorology: Climate Change in Australia Projections for Australia's Natural Resource Management Regions, Technical Report, 2015.
Dai, A.: Drought under global warming: a review, WIREs Clim. Change, 2, 45–65, https://doi.org/10.1002/wcc.81, 2011.
Deitch, M. J., Sapundjieff, M. J., and Feirer, S. T.: Characterizing Precipitation Variability and Trends in the World's Mediterranean-Climate Areas, Water, 9, 259, https://doi.org/10.3390/w9040259, 2017.
Devanand, A., Falster, G. M., Gillett, Z. E., Hobeichi, S., Holgate, C. M., Jin, C., Mu, M., Parker, T., Rifai, S. W., Rome, K. S., Stojanovic, M., Vogel, E., Abram, N. J., Abramowitz, G., Coats, S., Evans, J. P., Gallant, A. J. E., Pitman, A. J., Power, S. B., Rauniyar, S. P., Taschetto, A. S., and Ukkola, A. M.: Australia's Tinderbox Drought: An extreme natural event likely worsened by human-caused climate change, Sci. Adv., 10, eadj3460, https://doi.org/10.1126/sciadv.adj3460, 2024.
Dey, R., Lewis, S. C., Arblaster, J. M., and Abram, N.: A review of past and projected changes in Australia's rainfall, WIREs Clim. Change, 10, e577, https://doi.org/10.1002/wcc.577, 2019.
Douris, J. and Kim, G.: The Atlas of Mortality and Economic Losses from Weather, Climate and Water Extremes, 1267, https://doi.org/10.1163/9789004322714_cclc_2023-0268-1218, 2021.
Falster, G. M., Wright, N. M., Abram, N. J., Ukkola, A. M., and Henley, B. J.: Potential for historically unprecedented Australian droughts from natural variability and climate change, Hydrol. Earth Syst. Sci., 28, 1383–1401, https://doi.org/10.5194/hess-28-1383-2024, 2024.
Feng, H. and Zhang, M.: Global land moisture trends: drier in dry and wetter in wet over land, Sci. Rep., 5, 18018, https://doi.org/10.1038/srep18018, 2015.
Fowler, K., Knoben, W., Peel, M., Peterson, T., Ryu, D., Saft, M., Seo, K.-W., and Western, A.: Many Commonly Used Rainfall-Runoff Models Lack Long, Slow Dynamics: Implications for Runoff Projections, Water Resour. Res., 56, e2019WR025286, https://doi.org/10.1029/2019WR025286, 2020.
Fowler, K., Peel, M., Saft, M., Nathan, R., Horne, A., Wilby, R., McCutcheon, C., and Peterson, T.: Hydrological Shifts Threaten Water Resources, Water Resour. Res., 58, e2021WR031210, https://doi.org/10.1029/2021WR031210, 2022.
Fowler, K., Zhang, Z., and Hou, X.: CAMELS-AUS v2: updated hydrometeorological timeseries and landscape attributes for an enlarged set of catchments in Australia (2.03), Zenodo [data set], https://doi.org/10.5281/zenodo.14289037, 2024.
Fowler, K. J. A., Zhang, Z., and Hou, X.: CAMELS-AUS v2: updated hydrometeorological time series and landscape attributes for an enlarged set of catchments in Australia, Earth Syst. Sci. Data, 17, 4079–4095, https://doi.org/10.5194/essd-17-4079-2025, 2025.
Frost, A. J. and Wright, D. P.: Evaluation of the Australian Landscape Water Balance model: AWRA-L v6. A comparison of AWRA-L v6 against Observed Hydrological Data and Peer Model. Bureau Technical Report, Bureau of Meteorology, 2018. https://awo.bom.gov.au/assets/notes/publications/AWRALv6_Model_Evaluation_Report.pdf (last access: 16 October 2025), 2018.
Frost, A. J. and Wright, D. P.: The Australian water resource assessment landscape model – AWRA-L: Improved performance and regional calibration, Hydrol. Water Resour. Symp. HWRS 2018 Water Communities, 933–949, https://search.informit.org/doi/10.3316/informit.127604291992740 (last access: 17 October 2025), 2020.
Frost, A. J., Ramchum, A., and Smith, A.: The Australian Landscape Water Balance model (AWRA-L v6), Technical Description of the Australian Water Resources Assessment Landscape model version 6. Bureau Technical Report, Bureau of Meteorology, 2018. https://awo.bom.gov.au/assets/notes/publications/AWRALv6_Model_Description_Report.pdf (last access: 16 October 2025), 2018.
Gallant, A. J. E., Reeder, M. J., Risbey, J. S., and Hennessy, K. J.: The characteristics of seasonal-scale droughts in Australia, 1911–2009, Int. J. Climatol., 33, 1658–1672, https://doi.org/10.1002/joc.3540, 2013.
Grant, S. B., Fletcher, T. D., Feldman, D., Saphores, J.-D., Cook, P. L. M., Stewardson, M., Low, K., Burry, K., and Hamilton, A. J.: Adapting Urban Water Systems to a Changing Climate: Lessons from the Millennium Drought in Southeast Australia, Environ. Sci. Technol., 47, 10727–10734, https://doi.org/10.1021/es400618z, 2013.
Hawkins, E., Frame, D., Harrington, L., Joshi, M., King, A., Rojas, M., and Sutton, R.: Observed Emergence of the Climate Change Signal: From the Familiar to the Unknown, Geophys. Res. Lett., 47, e2019GL086259, https://doi.org/10.1029/2019GL086259, 2020.
Hobeichi, S., Abramowitz, G., Evans, J. P., and Ukkola, A.: Toward a Robust, Impact-Based, Predictive Drought Metric, Water Resour. Res., 58, e2021WR031829, https://doi.org/10.1029/2021WR031829, 2022.
Humphrey, V., Gudmundsson, L., and Seneviratne, S. I.: Assessing Global Water Storage Variability from GRACE: Trends, Seasonal Cycle, Subseasonal Anomalies and Extremes, Surv. Geophys., 37, 357–395, https://doi.org/10.1007/s10712-016-9367-1, 2016.
Hussain, M. M. and Mahmud, I.: pyMannKendall: a python package for non parametric Mann Kendall family of trend tests., J. Open Source Softw., 4, 1556, https://doi.org/10.21105/joss.01556, 2019.
Jones, D., Wang, W., and Fawcett, R.: High-quality spatial climate data-sets for Australia, Aust. Meteorol. Oceanogr. J., 58, 233–248, https://doi.org/10.22499/2.5804.003, 2009.
Jyoteeshkumar reddy, P., Sharples, J. J., Lewis, S. C., and Perkins-Kirkpatrick, S. E.: Modulating influence of drought on the synergy between heatwaves and dead fine fuel moisture content of bushfire fuels in the Southeast Australian region, Weather Clim. Extrem., 31, 100300, https://doi.org/10.1016/j.wace.2020.100300, 2021.
King, A. D., Donat, M. G., Fischer, E. M., Hawkins, E., Alexander, L. V., Karoly, D. J., Dittus, A. J., Lewis, S. C., and Perkins, S. E.: The timing of anthropogenic emergence in simulated climate extremes, Environ. Res. Lett., 10, 094015, https://doi.org/10.1088/1748-9326/10/9/094015, 2015.
King, A. D., Pitman, A. J., Henley, B. J., Ukkola, A. M., and Brown, J. R.: The role of climate variability in Australian drought, Nat. Clim. Change, 10, 177–179, https://doi.org/10.1038/s41558-020-0718-z, 2020.
Kirono, D. G. C., Round, V., Heady, C., Chiew, F. H. S., and Osbrough, S.: Drought projections for Australia: Updated results and analysis of model simulations, Weather Clim. Extrem., 30, 100280, https://doi.org/10.1016/j.wace.2020.100280, 2020.
Kumar, P., Hamlington, B., Cheon, S.-H., Han, W., and Thompson, P.: 20th Century Multivariate Indian Ocean Regional Sea Level Reconstruction, J. Geophys. Res. Oceans, 125, e2020JC016270, https://doi.org/10.1029/2020JC016270, 2020.
Low, K. G., Grant, S. B., Hamilton, A. J., Gan, K., Saphores, J.-D., Arora, M., and Feldman, D. L.: Fighting drought with innovation: Melbourne's response to the Millennium Drought in Southeast Australia, WIREs Water, 2, 315–328, https://doi.org/10.1002/wat2.1087, 2015.
Martens, B., Miralles, D. G., Lievens, H., van der Schalie, R., de Jeu, R. A. M., Fernández-Prieto, D., Beck, H. E., Dorigo, W. A., and Verhoest, N. E. C.: GLEAM v3: satellite-based land evaporation and root-zone soil moisture, Geosci. Model Dev., 10, 1903–1925, https://doi.org/10.5194/gmd-10-1903-2017, 2017.
MattGrant1998: MattGrant1998/AUS_historical_drought_trends: Historical trends of seasonal droughts in Australia – Analysis code (1.0), Zenodo [code], https://doi.org/10.5281/zenodo.17290804, 2025.
Mckee, T. B., Doesken, N. J., and Kleist, J.: The Relationship of Drought Frequency and Duration to Time Scales, 8th Conf. Appl. Climatol., Anaheim, CA, 17–22 January 1993, 179–184, https://climate.colostate.edu/pdfs/relationshipofdroughtfrequency.pdf (last access: 16 October 2025), 1993.
McMahon, T. A., Finlayson, B. L., Haines, A., and Srikanthan, R.: Runoff variability: a global perspective, in: The Influence of Climate Change and Climatic Variability on the Hydrologic Regime and Water Resources, Vancouver Symposium, Vancouver, Canada, August 1987, https://iahs.info/uploads/dms/iahs_168_0003.pdf (last access: 16 October 2025), 1987.
Mu, M., Pitman, A. J., De Kauwe, M. G., Ukkola, A. M., and Ge, J.: How do groundwater dynamics influence heatwaves in southeast Australia?, Weather Clim. Extrem., 37, 100479, https://doi.org/10.1016/j.wace.2022.100479, 2022.
Nicholls, N., Drosdowsky, W., and Lavery, B.: Australian rainfall variability and change, Weather, 52, 66–72, https://doi.org/10.1002/j.1477-8696.1997.tb06274.x, 1997.
NOAA: Monthly time series – Nino3.4 (DS), https://psl.noaa.gov/data/timeseries/month/DS/Nino34/ (last access: 9 October 2025), 2021.
O'Donnell, A. J., McCaw, W. L., Cook, E. R., and Grierson, P. F.: Megadroughts and pluvials in southwest Australia: 1350–2017 CE, Clim. Dynam., 57, 1817–1831, https://doi.org/10.1007/s00382-021-05782-0, 2021.
Peter, J., Vogel, E., Sharples, W., Bende-Michl, U., Wilson, L., Hope, P., Dowdy, A., Kociuba, G., Srikanthan, S., Duong, V. C., Roussis, J., Matic, V., Khan, Z., Oke, A., Turner, M., Baron-Hay, S., Johnson, F., Mehrotra, R., Sharma, A., Thatcher, M., Azarvinand, A., Thomas, S., Boschat, G., Donnelly, C., and Argent, R.: Continental-scale bias-corrected climate and hydrological projections for Australia, Geosci. Model Dev., 17, 2755–2781, https://doi.org/10.5194/gmd-17-2755-2024, 2024.
Peterson, T. J., Saft, M., Peel, M. C., and John, A.: Watersheds may not recover from drought, Science, 372, 745–749, https://doi.org/10.1126/science.abd5085, 2021.
Petrone, K. C., Hughes, J. D., Van Niel, T. G., and Silberstein, R. P.: Streamflow decline in southwestern Australia, 1950–2008, Geophys. Res. Lett., 37, https://doi.org/10.1029/2010GL043102, 2010.
Pickett-Heaps, C. A. and Vogel, E.: Seasonal hydrological ensemble forecasts for Australia using AWRA-L-Hindcast verification report, Bureau Research Report, Bureau of Meteorology, http://www.bom.gov.au/research/publications/researchreports/BRR-065.pdf (last access: 16 October 2025), 2022.
Potter, N. J., Zhang, L., Milly, P. C. D., McMahon, T. A., and Jakeman, A. J.: Effects of rainfall seasonality and soil moisture capacity on mean annual water balance for Australian catchments, Water Resour. Res., 41, https://doi.org/10.1029/2004WR003697, 2005.
Rashid, M. M. and Beecham, S.: Characterization of meteorological droughts across South Australia, Meteorol. Appl., 26, 556–568, https://doi.org/10.1002/met.1783, 2019.
Sen, P. K.: Estimates of the Regression Coefficient Based on Kendall's Tau, J. Am. Stat. Assoc., 63, 1379–1389, https://doi.org/10.1080/01621459.1968.10480934, 1968.
Seneviratne, S. I., Zhang, X., Adnan, M., Badi, W., Dereczynski, C., Di Luca, A., Ghosh, S., Iskander, I., Kossin, J., Lewis, S., Otto, F., Pinto, I., Satoh, M., Vicente-Serrano, S. M., Wehner, M., and Zhou, B.: Chapter 11: Weather and Climate Extreme Events in a Changing Climate, in: Climate Change 2021 – The Physical Science Basis: Working Group I Contribution to the Sixth Assessment Report of the Intergovernmental Panel on Climate Change, Cambridge University Press, Cambridge, United Kingdom and New York, NY, USA, 1513–1766, https://doi.org/10.1017/9781009157896, 2021.
Sun, F., Roderick, M. L., and Farquhar, G. D.: Rainfall statistics, stationarity, and climate change, P. Natl. Acad. Sci. USA, 115, 2305–2310, https://doi.org/10.1073/pnas.1705349115, 2018.
Taschetto, A. S. and England, M. H.: An analysis of late twentieth century trends in Australian rainfall, Int. J. Climatol., 29, 791–807, https://doi.org/10.1002/joc.1736, 2009.
Tian, S., Renzullo, L. J., Pipunic, R. C., Lerat, J., Sharples, W., and Donnelly, C.: Satellite soil moisture data assimilation for improved operational continental water balance prediction, Hydrol. Earth Syst. Sci., 25, 4567–4584, https://doi.org/10.5194/hess-25-4567-2021, 2021.
Trancoso, R., Larsen, J. R., McVicar, T. R., Phinn, S. R., and McAlpine, C. A.: CO2-vegetation feedbacks and other climate changes implicated in reducing base flow, Geophys. Res. Lett., 44, 2310–2318, https://doi.org/10.1002/2017GL072759, 2017.
Ukkola, A. M., Roderick, M. L., Barker, A., and Pitman, A. J.: Exploring the stationarity of Australian temperature, precipitation and pan evaporation records over the last century, Environ. Res. Lett., 14, 124035, https://doi.org/10.1088/1748-9326/ab545c, 2019.
Ukkola, A. M., De Kauwe, M. G., Roderick, M. L., Abramowitz, G., and Pitman, A. J.: Robust Future Changes in Meteorological Drought in CMIP6 Projections Despite Uncertainty in Precipitation, Geophys. Res. Lett., 47, e2020GL087820, https://doi.org/10.1029/2020GL087820, 2020.
Ukkola, A. M., Thomas, S., Vogel, E., Bende-Michl, U., Siems, S., Matic, V., and Sharples, W.: Future changes in seasonal drought in Australia, Earth arXiv [preprint], https://doi.org/10.31223/X56110, 2024.
Vance, T. R., Roberts, J. L., Plummer, C. T., Kiem, A. S., and van Ommen, T. D.: Interdecadal Pacific variability and eastern Australian megadroughts over the last millennium, Geophys. Res. Lett., 42, 129–137, https://doi.org/10.1002/2014GL062447, 2015.
van Dijk, A. I. J. M., Beck, H. E., Crosbie, R. S., de Jeu, R. A. M., Liu, Y. Y., Podger, G. M., Timbal, B., and Viney, N. R.: The Millennium Drought in southeast Australia (2001–2009): Natural and human causes and implications for water resources, ecosystems, economy, and society, Water Resour. Res., 49, 1040–1057, https://doi.org/10.1002/wrcr.20123, 2013.
Vogel, E., Donat, M. G., Alexander, L. V., Meinshausen, M., Ray, D. K., Karoly, D., Meinshausen, N., and Frieler, K.: The effects of climate extremes on global agricultural yields, Environ. Res. Lett., 14, 054010, https://doi.org/10.1088/1748-9326/ab154b, 2019.
Vogel, E., Lerat, J., Pipunic, R., Frost, A. J., Donnelly, C., Griffiths, M., Hudson, D., and Loh, S.: Seasonal ensemble forecasts for soil moisture, evapotranspiration and runoff across Australia, J. Hydrol., 601, 126620, https://doi.org/10.1016/j.jhydrol.2021.126620, 2021.
Wasko, C., Shao, Y., Vogel, E., Wilson, L., Wang, Q. J., Frost, A., and Donnelly, C.: Understanding trends in hydrologic extremes across Australia, J. Hydrol., 593, 125877, https://doi.org/10.1016/j.jhydrol.2020.125877, 2021.
Wasko, C., Stephens, C., Peterson, T. J., Nathan, R., Pepler, A., Hettiarachchi, S., Vogel, E., Johnson, F., and Westra, S.: Understanding the implications of climate change for Australia's surface water resources: Challenges and future directions, J. Hydrol., 645, 132221, https://doi.org/10.1016/j.jhydrol.2024.132221, 2024.
Wilhite, D. A.: Drought as a Natural Hazard: Concepts and definitions, in: Droughts, Routledge, edited by: Wilhite, D. A., Routledge, https://doi.org/10.4324/9781315830896, 2000.
Wilson, L., Bende-Michl, U., Sharples, W., Vogel, E., Peter, J., Srikanthan, S., Khan, Z., Matic, V., Oke, A., Turner, M., Co Duong, V., Loh, S., Baron-Hay, S., Roussis, J., Kociuba, G., Hope, P., Dowdy, A., Donnelly, C., Argent, R., Thomas, S., Kitsios, A., and Bellhouse, J.: A national hydrological projections service for Australia, Clim. Serv., 28, 100331, https://doi.org/10.1016/j.cliser.2022.100331, 2022.
Yildirim, G. and Rahman, A.: Homogeneity and trend analysis of rainfall and droughts over Southeast Australia, Nat. Hazards, 112, 1657–1683, https://doi.org/10.1007/s11069-022-05243-9, 2022.
Yue, S. and Wang, C.: The Mann-Kendall Test Modified by Effective Sample Size to Detect Trend in Serially Correlated Hydrological Series, Water Resour. Manag., 18, 201–218, https://doi.org/10.1023/B:WARM.0000043140.61082.60, 2004.
Yue, S., Pilon, P., Phinney, B., and Cavadias, G.: The influence of autocorrelation on the ability to detect trend in hydrological series, Hydrol. Process., 16, 1807–1829, https://doi.org/10.1002/hyp.1095, 2002.
Zaveri, E. D., Damania, R., and Engle, N. L.: Droughts and Deficits – Summary Evidence of the Global Impact on Economic Growth (English), The World Bank group, http://documents.worldbank.org/curated/en/ (last access: 16 October 2025), 2023.
Zhang, X. S., Amirthanathan, G. E., Bari, M. A., Laugesen, R. M., Shin, D., Kent, D. M., MacDonald, A. M., Turner, M. E., and Tuteja, N. K.: How streamflow has changed across Australia since the 1950s: evidence from the network of hydrologic reference stations, Hydrol. Earth Syst. Sci., 20, 3947–3965, https://doi.org/10.5194/hess-20-3947-2016, 2016.