the Creative Commons Attribution 4.0 License.
the Creative Commons Attribution 4.0 License.
 | 01 Oct 2025
Storyline analytical framework for understanding future severe low-water episodes and their consequences
Gabriel Rondeau-Genesse
Louis-Philippe Caron
Kristelle Audet
Laurent Da Silva
Daniel Tarte
Rachel Parent
Élise Comeau
Dominic Matte
The 2021 drought highlighted the vulnerability of Quebec's water resources and the potential for widespread consequences in a region that is generally perceived as having abundant water. This study uses a storyline approach to explore plausible future drought conditions for an event similar to what occurred in 2021 but under two different warming scenarios corresponding to increases of 2 and 3 °C in global surface temperatures compared to preindustrial levels. The storyline is constructed using a scenario-based approach, where analogues of the 2021 drought are derived from a large ensemble of regional climate simulations and combined with simulations produced by a hydrological model to offer a comprehensive understanding of both climate and hydrological conditions during and leading up to these potential future events. Results indicate a further deterioration in river conditions, particularly if a drought similar to that of 2021 were to be accompanied by a 3 °C rise in global temperature. In the hardest-hit areas of the province, low water levels could persist for a month longer, and river streamflow could drop by an additional 50 %, thus falling short of the threshold required to maintain the health of ecosystems for an extended period of time and resulting in significant impacts on ecosystems and human activities. By linking future river conditions to a real event that affected southern Quebec, storyline approaches have the potential to facilitate discussions on the impacts of climate change on water deficits in the region, particularly in cases where those impact-inducing thresholds are not well understood.
- Article
(10888 KB) - Full-text XML
-
Supplement
(27410 KB) - BibTeX
- EndNote


The province of Quebec in Canada is generally perceived as a region with abundant water since spring snowmelt recharges groundwater and ensures that most streams maintain water flow throughout the year while preventing most multi-year droughts (Dubois et al., 2021; Assani, 2023). However, recent years have shown that the region is not impervious to low-water episodes. For example, Quebec's agricultural areas faced moderate to severe drought conditions in 2001 and 2002 and for 8 of the 12 years between 2010 and 2021, with each event resulting in financial impacts of tens of millions of dollars (Nand and Qi, 2023). A drought in 2012 also severely affected the boreal forest (Houle et al., 2016), while, more recently, the extreme 2023 wildfire season in northern Quebec followed one of the driest and warmest seasons on record (Boulanger et al., 2024).
Hydrological droughts in colder regions are complex phenomena to analyze due to the added interplay of rainfall and snow-driven recharge. The main factors influencing low water levels during summer differ according to the specific characteristics and geographical location of the basin. In Europe, for example, 50 % of droughts are due to a rainfall deficit, while the remaining 50 % (and often the worst) are caused by a series of other phenomena, either in isolation or in combination, such as warm snow seasons that lead to a lack of recharge in spring, rainfall deficits that extend into snowfall deficits, or delayed snowmelt or glacier melt due to cold conditions (Van Loon and Van Lanen, 2012; Van Loon et al., 2015). Even when a single type of drought is examined, such as the lack of snowmelt-induced aquifer recharge, the dominant factors causing them can vary depending on the location. In Austria, for example, snowmelt droughts are primarily caused by warm and dry winter and spring conditions, while, in Norway, this type of drought is mainly controlled by winter precipitation alone (Van Loon et al., 2015). In southern Quebec, the total amount of rainfall after the melting of the snowpack is generally the main predictor of the intensity of low-water conditions in summer, followed by the total amount of evapotranspiration (Kinnard et al., 2022). However, in certain watersheds, other variables, such as the maximum snow water equivalent (SWEmax), the date of onset of melting, and the duration of snowmelt, can explain water scarcity to the same extent as evapotranspiration (Kinnard et al., 2022). This is because, during low-water periods in summer, a considerable portion of streamflow is derived from groundwater flow, and a prolonged and intense spring thaw helps recharge aquifers.
A significant rise in temperature is anticipated in eastern Canada due to human-induced climate change, which is very likely to shorten the duration of snow cover and could decrease SWEmax by 2.5 % to 7.5 % per decade through 2050 in southern Quebec relative to 1981–2015 (Mudryk et al., 2018; Derksen et al., 2019; Lee et al., 2021). Increasing temperatures will result in higher total annual precipitation, but this increase will mainly be constrained to spring and winter, with minimal projected changes in summer and fall (Alberti-Dufort et al., 2022; Lee et al., 2021). This rise in annual precipitation is expected to enhance groundwater recharge on average. However, this will be accompanied by more pronounced seasonal variations, leading to increased recharge rates in winter and decreased rates in summer (Dubois et al., 2021, 2022). Coupled with higher evapotranspiration rates due to rising temperatures, summer water availability in southern Quebec is therefore projected to decline in the future (Bonsal et al., 2019; Alberti-Dufort et al., 2022; Lee et al., 2021). Consequently, the latest studies suggest that a reduction in average summer flow and an increase in the number of extreme low-flow events are likely for watersheds in Quebec (Aygün et al., 2019; Bonsal et al., 2019; Thackeray et al., 2019; Charron et al., 2021; MELCCFP, 2022a; Kinnard et al., 2022).
A decrease in available water during summer months, coupled with a higher demand due to population growth and anthropogenic climate change, could exacerbate scarcity, decrease water quality, and give rise to conflicts over water usage (Mehdi et al., 2015; Furber et al., 2016; Wheaton and Kulshreshtha, 2017; Osman, 2018; Chilima et al., 2021). Despite some advances with regard to this issue in recent years, the implications of acute water shortages in Quebec are not yet well documented or understood, making it difficult to anticipate their consequences, especially for cases of more extreme drought conditions (Charron et al., 2019, 2020; Leveque et al., 2021; Knowles et al., 2023; Nand and Qi, 2023). It is still unclear who will suffer the most from water deficits, which regions are most vulnerable, and to what extent.
Unlike droughts, climate change studies related to flooding can rely on well-defined metrics to evaluate the areas most vulnerable to future floods and help develop adaptation strategies. This is because extreme events such as 20- or 100-year floods are frequently used in urban planning and regulatory frameworks. Infrastructures are designed to withstand specific thresholds, and maps are produced to indicate which neighbourhoods will be affected and damaged when events exceed them. In contrast, droughts emerge slowly over long periods of time, often remaining undetected in water-rich areas until they are already severe enough to significantly impact human activities and ecosystems. Furthermore, although Quebec has regulations regarding water withdrawals, it lacks specific low-water thresholds that would trigger emergency protocols, such as those used in the neighbouring province of Ontario (Ontario Ministry of Natural Resources et al., 2010; Berthot et al., 2020). This situation makes it difficult to predict the impacts of future severe droughts in Quebec and similarly hinders the development of effective climate change adaptation strategies.
Recently, storyline approaches have begun to be explored in climate change research and may provide a robust framework for projecting the impacts of future extreme events in the absence of clear thresholds due to their event-based nature (Shepherd et al., 2018; Shepherd, 2019; Sillmann et al., 2021; Matte et al., 2022; Baulenas et al., 2023; Caviedes-Voullième and Shepherd, 2023). Traditional climate change projections evaluate changes in extreme events by examining the potential shifts in the frequency or intensity of events with a specified magnitude or probability of occurrence, such as a 100-year drought. These projections rely on multi-model ensembles, where results from multiple climate models are combined together to provide a robust climate change signal through ensemble percentiles, as well as a likelihood of increase or decrease using the level of agreement between the climate change signal of the individual models. This statistical framework generally does not try to link indicators (e.g., the 100-year drought) directly to specific past events. In contrast, climate storylines can use climate data to construct plausible future scenarios by modifying real historical events without having to explicitly specify their likelihood. This approach offers a way to simplify complex climate information by projecting how specific events may unfold in the future, thus linking climate information to familiar stakeholder experiences. It also potentially avoids the need to pinpoint specific damage-inducing thresholds by constructing the future scenario based on an event that already caused known damages in the past. Storylines have been applied in both climatological and hydrological research to effectively illustrate future extreme events such as droughts, floods, and storms (Schaller et al., 2020; van der Wiel et al., 2021; Chan et al., 2022; Gessner et al., 2022; Chan et al., 2023; Liao et al., 2024).
Storylines can be constructed using various methodologies (Fossa Riglos et al., 2024). Physical climate storylines (PCSs) involve using a climate or weather forecast model to recreate a singular high-impact event and to explore alternative realities, for example, by modifying the initial conditions or by using a pseudo-global-warming approach (e.g., Hazeleger et al., 2015; Gessner et al., 2022; Matte et al., 2022). Scenario-based approaches (SBAs), on the other hand, do not recreate the event but instead search for adequate analogues within a simulated dataset that includes both historical and future climate conditions (e.g., van der Wiel et al., 2021; Faranda et al., 2023; Liao et al., 2024). This approach thus involves defining the event of interest using metrics that can accurately capture its intensity and main characteristics, while also being flexible and reliable enough to identify comparable events in the simulated data. For example, in their study related to the severe 2018 drought in Europe, van der Wiel et al. (2021) examined three different types of metrics associated with precipitation deficits: the average deficit during the most severe drought months (M1), the regression slope of the deficits in the months preceding the peak deficit (M2), and a temporal regression of the deficit time series (M3). Alternatively, rather than focusing on specific historical events, SBAs may involve searching within large ensembles for unprecedented climate conditions, such as multiple consecutive dry seasons, to identify plausible worst-case scenarios to be used for stress-testing systems (Chan et al., 2023).
The primary objective of this study is to apply a storyline approach to generate plausible, physically coherent projections of the 2021 Quebec drought under future climate conditions. Distinguishing itself from most existing research, the study also incorporates a distributed hydrological model to simulate hydrological conditions during those events at both provincial and local scales. These storylines will form the basis for stakeholder engagement in the project's second phase, designed to foster dialogue on the potential impacts of future water scarcity in southern Quebec and to explore adaptive management strategies. Specifically, we employ a storyline approach similar to that described in van der Wiel et al. (2021) to project the 2021 Quebec drought into future climate conditions corresponding to an increase of 2 and 3 °C in global surface temperatures compared to preindustrial levels. We use an SBA to first identify adequate analogues of the meteorological drought using a large ensemble of regional climate simulations. We then investigate the associated hydrological drought by also making use of a hydrological model to project streamflow data during the drought event, thus also contrasting present and future hydrological conditions. The data used and the experimental framework are described in Sect. 2, while Sect. 3 presents the 2021 drought event used as the reference, as well as its present and future analogues derived from the large ensemble of simulations. Finally, Sect. 4 examines the potential uses of climate storylines as a communication tool for discussing the impacts of future extreme droughts and presents the limitations of our study. Concluding remarks are provided in Sect. 5.
2.1 Stakeholder consultation
Documenting the impacts of previous drought events was essential to better understand the potential outcomes of future events described by the storyline approach. However, there is a known underreporting of water scarcity events in Quebec, in part due to the common belief in an abundant water supply (Nand and Qi, 2023). This is exacerbated when it comes to ecosystems because prevalent monitoring systems primarily focus on human water usage and rarely align with the data-gathering requirements necessary to evaluate the exposure, sensitivity, and adaptive capacity of wildlife and vegetation (Kovach et al., 2019; Berthot et al., 2020). Consequently, impacts on ecosystems are largely unreported unless they affect human activities.
Hence, with the objective of enhancing our understanding of the impacts of previous droughts across the province, a questionnaire was circulated amongst the 40 watershed organizations mandated to assess the current state of the water resources throughout Quebec. It asked the respondent to identify up to 10 recent hydrological droughts, classify their intensity and probable causes, and then list the documented or perceived socioeconomic and environmental consequences. Through this process, a total of 87 water scarcity incidents were reported with varying levels of detail with regard to their impacts on human and environmental usage. To complement this knowledge base, interviews were conducted with select stakeholders to deepen our understanding of past events in specific complex sectors such as the Quebec Metropolitan area or Lake Saint-Jean.
While this consultation is not the primary focus of the study, it provides valuable insights into the consequences of past drought events in the province. Consequently, some of the findings will be discussed to enrich the conversation regarding the potential impacts of future droughts. For more details on the methodology and a detailed breakdown of the results, readers are encouraged to refer to Audet et al. (2024) (available in French only) and to their Appendix D specifically. The questionnaire itself is also included in the Supplement, though it is available only in French.
While several years, including 2001, 2002, 2010, 2012, and 2018, were highlighted by stakeholders, the 2021 low-water event emerged from the consultation as the longest and most severe drought in recent years in southern Quebec. Further analysis of meteorological data, presented in the following sections, confirmed the severity of the 2021 drought, with most of the spring, summer, and fall periods experiencing severe or worse drought conditions. This validated the decision to focus the study on 2021.
2.2 Observational data
Historical precipitation and temperature data were obtained from the ERA5-Land reanalysis (Muñoz Sabater et al., 2021), which is a reconstruction of surface conditions using a 9 km spatial grid mesh derived from the ERA5 reanalysis.
Historical streamflow data were obtained from the Hydroclimatological Atlas of Southern Quebec, which covers the period from 1970 to the present and spans the entire region of southern Quebec, as seen in Fig. 1 (MELCCFP, 2022b). The dataset is a reconstruction of past hydrology combining six simulations from the HYDROTEL hydrological model driven by gridded observational temperature and precipitation data. Furthermore, it incorporates observed streamflow measurements through an optimal interpolation technique to provide the most accurate estimate of past streamflow conditions across gauged and ungauged watersheds, accounting for both model and observational uncertainties (Lachance-Cloutier et al., 2017). Finally, to ensure robustness for ungauged river segments, HYDROTEL is calibrated using a regional calibration technique, identifying optimal parameter sets for each of the six simulations across 70 gauged watersheds.
HYDROTEL itself is a physically based, semi-distributed hydrological model that is operationally employed by the government of Quebec for streamflow forecasting (Fortin et al., 2001). Unlike conceptual models, which fully rely on empirical relationships and simplified assumptions to represent hydrological processes, HYDROTEL employs a more detailed set of physical equations to simulate various aspects of water movement and distribution within a watershed, such as infiltration, runoff, snowmelt, or evapotranspiration. However some components, such as subsurface runoff, are still fairly simple in their representation. The model divides the landscape into computational units called “relatively homogeneous hydrological units” (RHHUs), which are defined based on land use, soil type, and topographical characteristics such as slope and aspect. In the configuration used for the Atlas, the average size of RHHUs is 11 km2, forming a hydrological network comprising 28 035 river segments throughout southern Quebec. Streamflow at each segment is calculated as the sum of upstream contributions and runoff and/or baseflow from neighbouring RHHUs. Results are reported for 9665 river segments, specifically those with watersheds larger than 50 km2 and not subject to significant anthropogenic influences, such as dams with daily or weekly management practices. Comprehensive details on model configuration, calibration procedures, and validation results are provided in MELCCFP (2024).
Although six distinct model versions exist, only the “MG24HQ” configuration of HYDROTEL was selected for the present study due to computational constraints within the experimental framework as it showcased the best performance in simulating summer streamflow (MELCCFP, 2024).
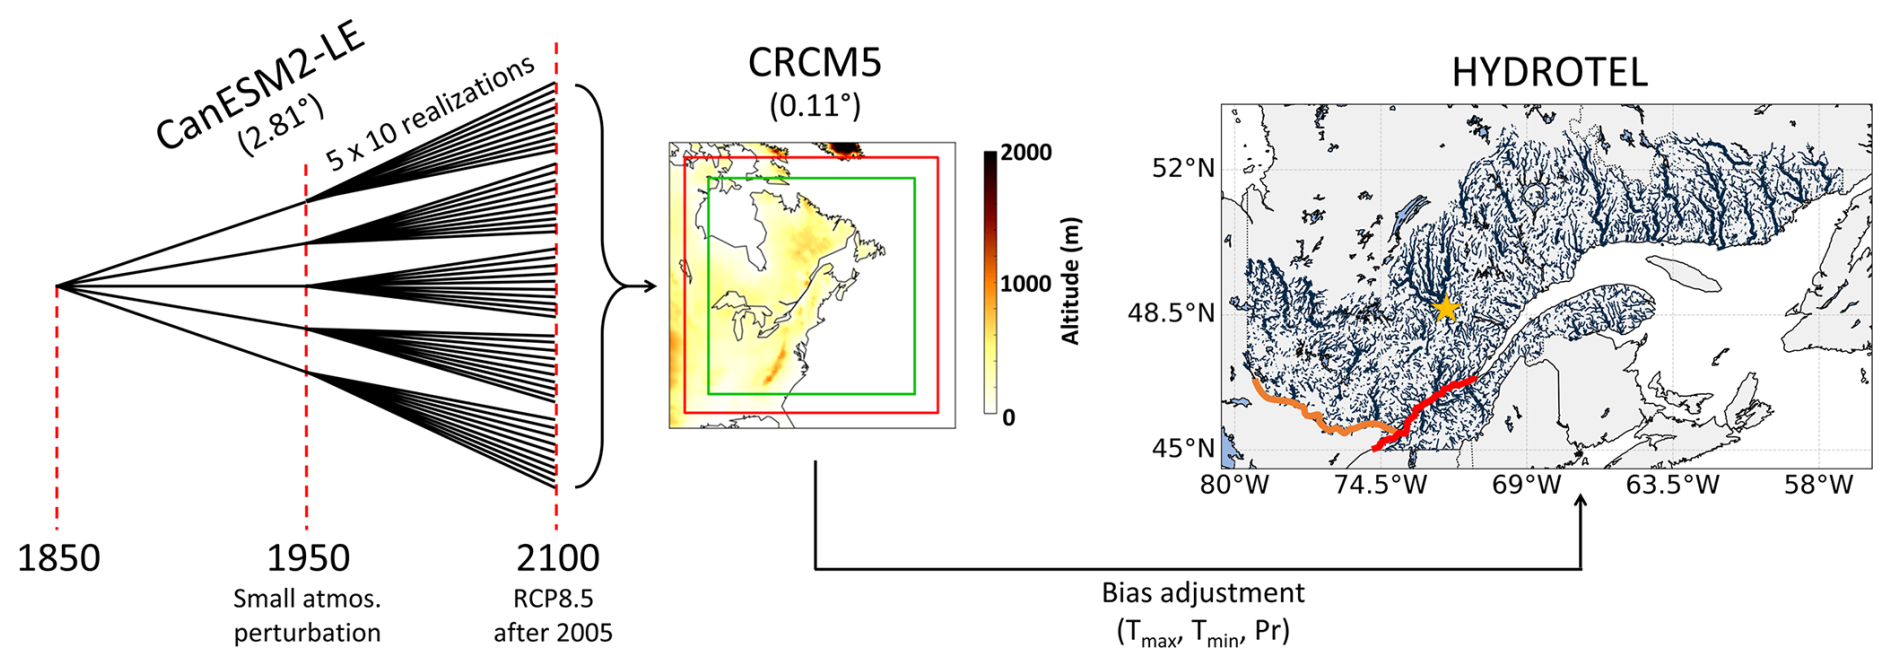
Figure 1Experimental framework for the production of the ClimEx Large Ensemble (atmospheric and hydrological simulations). Fifty realizations from the CanESM2 Large Ensemble are used to drive the CRCM5 regional climate model from 1950 to 2100 using the RCP8.5 emissions scenario. Results are then bias adjusted and used in the HYDROTEL hydrological model to produce streamflow data. The rightmost figure shows the spatial domain and river network of the Hydroclimatological Atlas of Southern Quebec, along with key locations for this paper: the St. Lawrence River and the Ottawa River are outlined in red and orange, respectively, while Lake Saint-Jean is noted with a yellow star. Adapted from Leduc et al. (2019).
2.3 Experimental framework
The experimental framework can be seen in Fig. 1. Storylines constructed using an SBA approach require a large number of climate simulations as an adequately sized sample of simulated counterpart events is required to identify appropriate analogues. The base meteorological data were obtained from the ClimEx Large Ensemble project (http://www.climex-project.org, last access: 15 September 2025; Leduc et al., 2019), which consists of 50 perturbed simulations produced using the fifth-generation Canadian Regional Climate Model (CRCM5; Martynov et al., 2013; Šeparović et al., 2013). The CRCM5 was developed by the ESCER Centre (Centre pour l'Étude et la Simulation du Climat à l'Échelle Régionale) at the Université du Québec à Montréal, in collaboration with Environment and Climate Change Canada.
Temperature, specific humidity, surface pressure, and winds produced by the large initial-condition ensemble (50 realizations) of the second generation of the Canadian Earth System Model (CanESM2-LE; Fyfe et al., 2017) were used to drive the boundaries of the CRCM5 every 6 h for the period 1950–2100 (Fig. 1). It used observed radiative forcings until 2005 and the RCP8.5 emissions scenario afterward (Riahi et al., 2011). For this experiment, the CRCM5 grid mesh was set at a 0.11° horizontal resolution, and winds were spectrally nudged from 500 hPa to the model top. For a more detailed description of the models and the setup of the ClimEx experiment, see Leduc et al. (2019).
HYDROTEL requires daily surface temperature and precipitation data as input. These variables were taken from the CRCM5 and then bias adjusted using a detrended quantile mapping technique (DQM; Gennaretti et al., 2015). DQM is a variant of quantile mapping that first removes the trend in the data, typically through a polynomial fit (in this case, a fourth-degree polynomial), after which a correction is applied to the residuals. Specifically, the residuals are sorted into bins based on their empirical quantiles, and a transfer function is trained on the differences between each bin of the simulated and the reference datasets during a common time period. This transfer function is then used to correct the whole simulation. In this study, DQM was applied to each day of the year and each grid cell individually using a ±15 d window around each day and separating data into 50 bins. The reference dataset used for the correction was the NRCANmet dataset, a spatially interpolated kriging of station data on a 10 km grid that covers all of Canada, produced by Natural Resources Canada (Hutchinson et al., 2009). Since ClimEx is a single-model large ensemble, all 50 simulations were pooled together to construct the transfer function. Finally, for precipitation, the adjustment method was modified to combine DQM with a generalized Pareto distribution in the upper tail of the distribution (Roy et al., 2023). This modification was added in order to improve the correction of the most extreme precipitation events compared to using a standard DQM technique but should not play a role in the results presented here as we focus on dry conditions.
The bias-adjusted temperature and precipitation data were subsequently used as input in HYDROTEL to generate 50 streamflow simulations covering southern Quebec from 1955 to 2100 (MELCCFP, 2024). The configuration and calibration of HYDROTEL for these simulations are identical to those used for the historical reconstruction described in Sect. 2.2, guaranteeing that the simulated streamflow is consistent with the reference product. Figure S1 in the Supplement presents a validation of the streamflow driven by ClimEx during the historical period over a few watersheds.
Two future periods were selected to investigate the effects of human-induced climate change on extreme low-water episodes, specifically targeting global average temperature rises of 2 and 3 °C above preindustrial levels. The specific periods corresponding to the warming levels within each ClimEx realization were determined by using a 30-year centred moving window to compute global 2 m temperature increases compared to the 1850–1900 period within the driving model CanESM2-LE, locating the first instance when the 30-year window crosses these warming thresholds.
2.4 Drought indicators
2.4.1 Meteorological drought indicator
Various metrics have been developed to represent meteorological droughts (Palmer, 1965; McKee et al., 1993; Vicente-Serrano et al., 2010; Staudinger et al., 2014). Of these, the Standardized Precipitation Evapotranspiration Index (SPEI; Vicente-Serrano et al., 2010) is a standardized index that measures the deviation of the water budget (difference between precipitation and evapotranspiration; P-PET) aggregated over a certain number of months (e.g., SPEI-3AUG aggregates the water budget from June to August). It has been used in various studies both internationally and in Canada and Quebec to describe the severity and duration of droughts (Tam et al., 2019, 2023; Solaraju-Murali et al., 2019, 2021). It also notably serves as the main drought indicator on the ClimateData.ca portal, the Canadian web portal that provides national climate change information (Cannon, 2024; Lavoie et al., 2024). Consequently, the SPEI was selected as the drought indicator to represent surface conditions for this analysis. The SPEI is computed by following these steps:
-
Compute the monthly water budget (P-PET).
-
Aggregate the water budget over a given number of months. In this study, aggregations of 3 and 6 months were used.
-
For a given month, aggregation length, and calibration period (e.g., water budgets aggregated from June to August over 1992–2021), fit a statistical model to the empirical distribution of water budgets and get their probability of exceedance. Based on suggestions from multiple studies, a three-parameter log-logistic distribution was employed for this step (Stagge et al., 2015; Tam et al., 2023).
-
Transform the probabilities of exceedance back into a normal distribution. Values below −1, −1.5, and −2 are typically used as thresholds that represent mild, severe, and extreme drought conditions, respectively (McKee et al., 1993; Stagge et al., 2015).
SBA storylines are constructed by identifying analogues of a past high-impact event within a large ensemble of simulated climate data. To facilitate this, it was crucial to ensure that SPEI distributions could be compared across the reference (observed) climate, to ClimEx during the historical period, and to future ClimEx simulations. To address this, the three-parameter log-logistic distribution was calibrated independently for each realization and time period (historical and future), ensuring consistent SPEI value ranges. While preferable for traditional climate change projections, a single calibration of SPEIs during the historical period only would have complicated finding relevant future events as those with similar SPEIs to the past would offer little new insight, an issue also noted by van der Wiel et al. (2021) with the M3 metric, while those with lower SPEIs would be more difficult to relate to the 2021 drought. Using separate calibrations for the past and future enables the identification of events with a similar probability and annual progression as 2021 but relative to their respective climatologies.
Access to potential evapotranspiration (PET) data is required for calculating the water budget needed for the SPEI. As a physically based hydrological model, HYDROTEL computes its own PET based on the provided temperature data. The model configuration used for this study employed the PET definition provided in McGuinness and Bordne (1972), which takes into account both temperature and latitude. Therefore, this definition was also chosen for the computation of SPEIs in order to have a consistent definition between the meteorological and hydrological droughts. It is defined as follows:
where the coefficients a and b represent empirical values, S0 (MJ m−2 d−1) denotes the extraterrestrial solar radiation based on a solar constant of 1367 W m−2, λ stands for the latent heat of vaporization (MJ kg−1), and Ta indicates the air temperature (°C). The values of a=0.0052 and b=0.0875 were adopted, as specified by Tanguy et al. (2018).
Finally, despite the standardization process, it was deemed to be essential to validate that the anomalies in the water budget were similar between the bias-adjusted ClimEx data and ERA5-Land since the observed and simulated SPEIs are calculated as deviations from their respective climatology. Our findings indicate that, with the exception of the winter season, where both datasets are coherent, the water budget in the bias-adjusted ClimEx data is consistently below that of ERA5-Land. However, more importantly, anomalies are similar across both datasets (Fig. S2).
2.4.2 Hydrological drought indicators
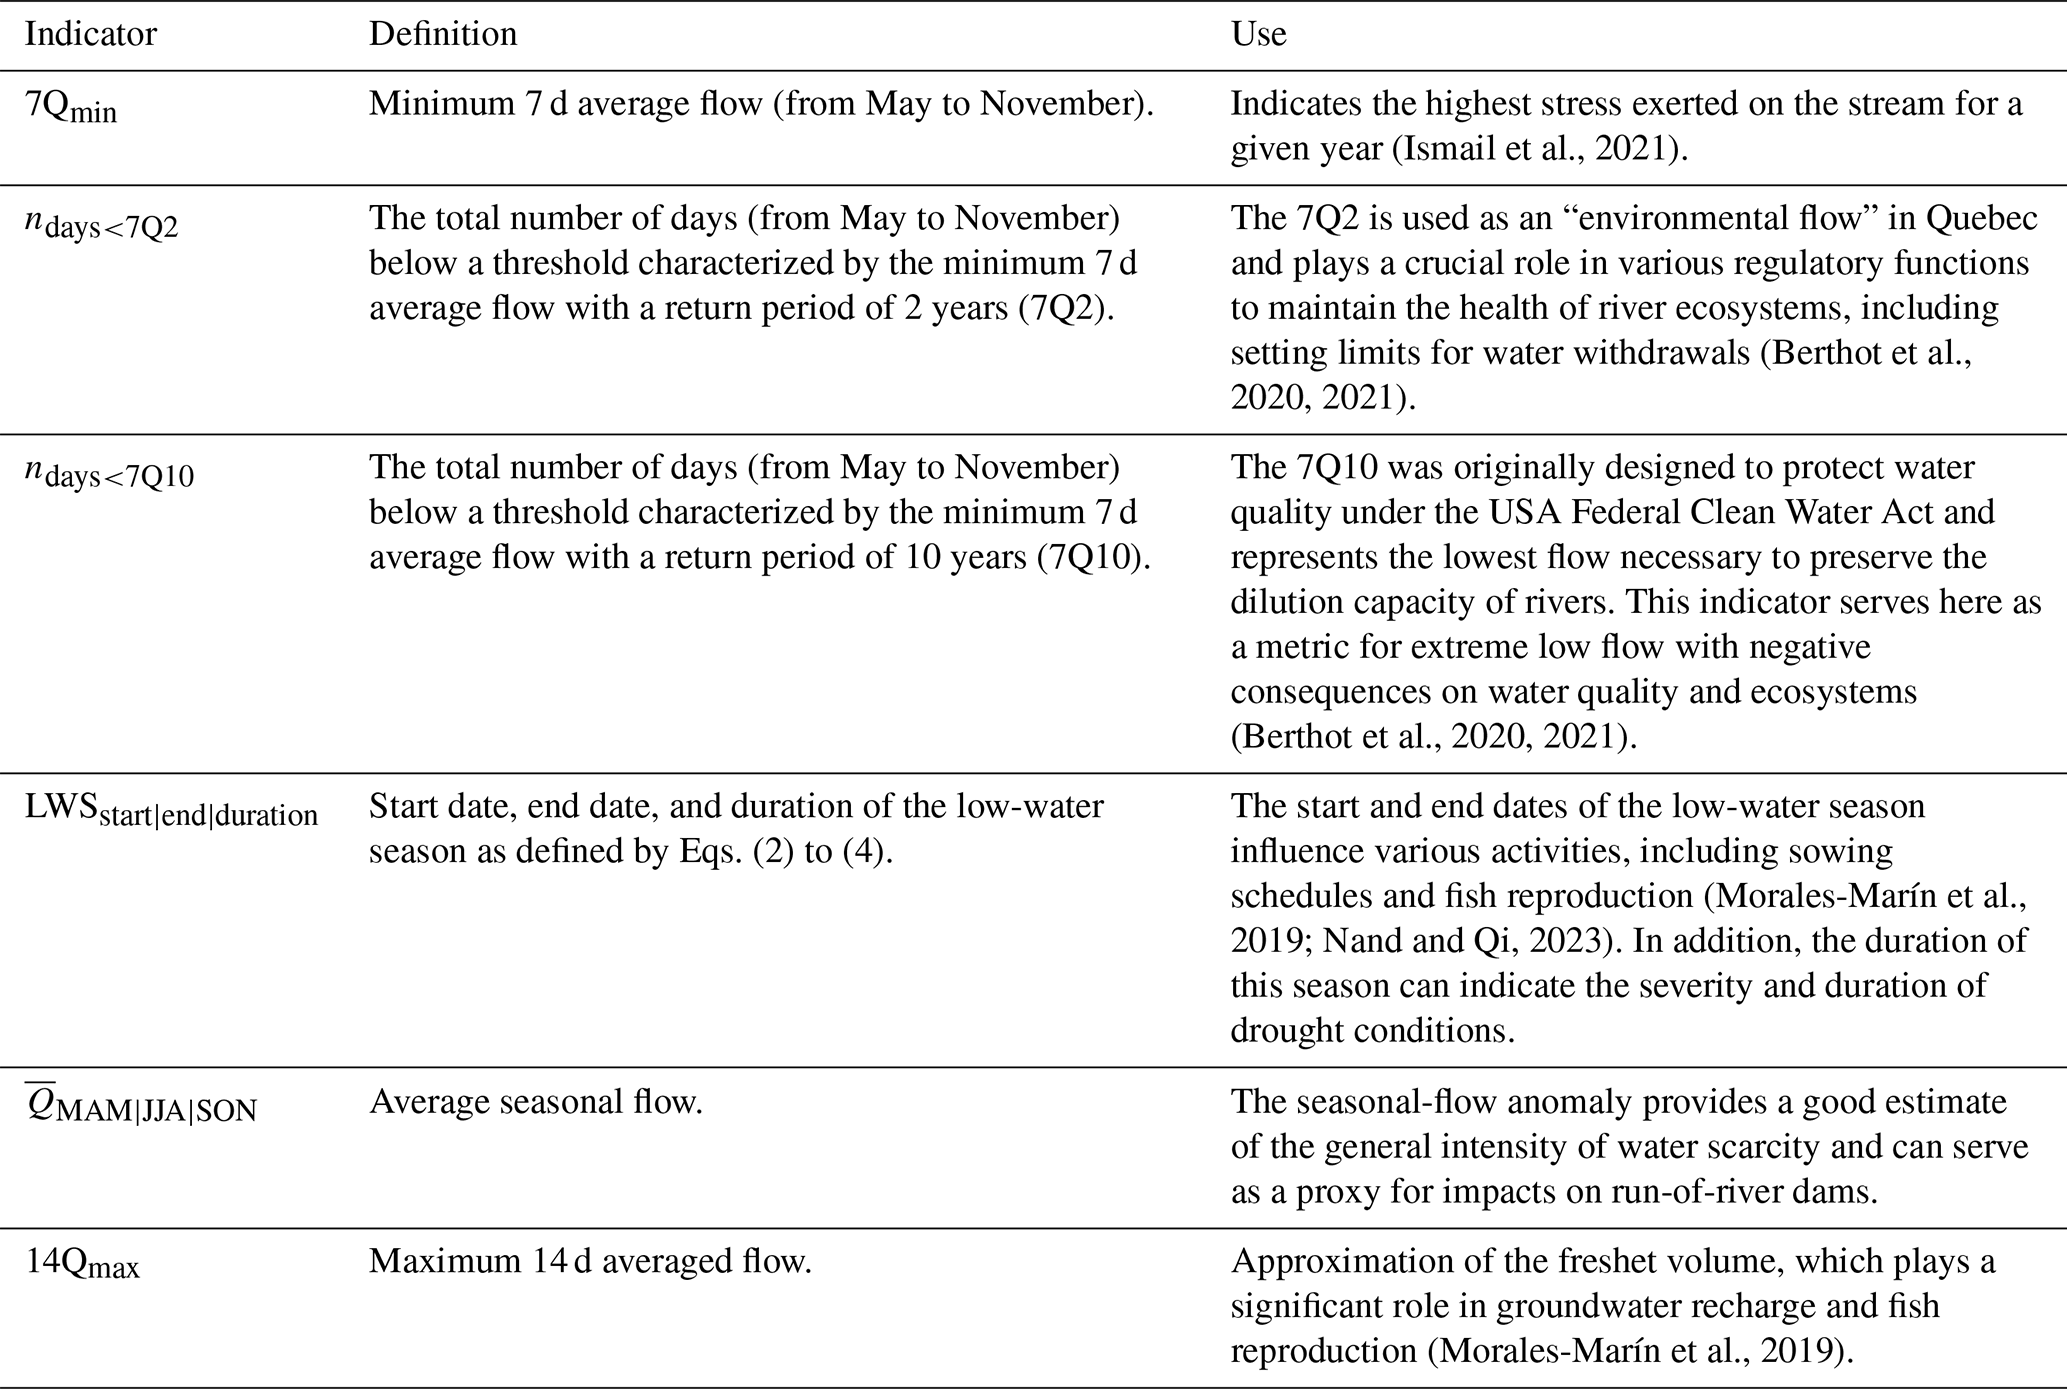
Establishing a direct link between low streamflow values and their on-the-ground consequences is challenging as impact-inducing thresholds are often unknown. Even when such thresholds exist in the literature or in regulations, they are not always well adapted to truly represent local conditions. The 7Q2 metric (2-year minimum of the 7 d average flow), for instance, plays a crucial role in Quebec for setting water withdrawal limits in a way that they maintain the health of river ecosystems. However, that metric has been criticized in recent years and has been deemed to be insufficient to truly represent the needs of ecosystems, with ongoing efforts to replace it with another indicator better suited to representing the geomorphological conditions of rivers and that is more robust in the context of a changing climate (Berthot et al., 2020, 2021). Furthermore, for both ecosystems and human activities, water levels often hold greater relevance than streamflow; however, such data are rarely available, especially not on a broad spatial scale. A storyline approach is valuable here as the 2021 drought is known to have caused multiple negative impacts and surpassed key thresholds (see Sect. 3.1.1 and 3.1.2). Various hydrological indicators were thus used to characterize the exceptional intensity and duration of the 2021 drought (Table 1), as well as the future events, to ensure a consistent framework for assessing and comparing the potential impacts of climate change on hydrological droughts similar to that of 2021. The selected indicators capture key aspects of river conditions, enhancing our understanding of the extreme nature of the 2021 event across different facets of the hydrological cycle, such as the timing of the low-water season and the minimum summer flow.
The low-water season (LWS) described in Table 1 was defined as the period of the year when streamflow remains below Qthresh, defined as follows:
where is the annual average flow, and 7Q2 is the minimum 7 d average flow with a return period of 2 years. The LWS begins when streamflow is below Qthresh for a continuous period of 7 d (after 1 May) and ends when it exceeds the threshold for 7 continuous days, such that
where “doy” is the day of the year.
It should also be noted that, when an indicator in Table 1 is defined using a threshold, such as Qthresh or 7Q2, the threshold is defined using data from the historical period only.
(Ismail et al., 2021)(Berthot et al., 2020, 2021)(Berthot et al., 2020, 2021)(Morales-Marín et al., 2019; Nand and Qi, 2023)(Morales-Marín et al., 2019)Table 1Indicators used to describe the low-water episode and its consequences.
2.5 Construction of the storylines
The specific methodology employed to identify analogues within the single-model large ensemble can have a significant impact on the analogues identified within the simulated dataset (van der Wiel et al., 2021). In our study, appropriate analogues were identified using a technique similar to the M3 method described in van der Wiel et al. (2021), which used temporal correlation but using a series of multiple SPEIs. Indeed, SPEI-3 indices from May through November, along with the SPEI-6 for May and October, were used as targets during the search for analogues within the ClimEx dataset, alongside a weighting mask to assign greater importance to areas experiencing mild to extreme droughts (see below). These weights successfully highlighted the area most affected during the 2021 drought, with a good correlation with the river sections where Q7min exhibited the most extreme (negative) anomalies. This approach also proved to be effective for other years, with significant droughts identified within the 1992–2021 period (Fig. S3).
More precisely, the identification of analogues within ClimEx was carried out through the following steps (Fig. 2):
- 1.
Calculate the SPEI-3 for all months from May to November and the SPEI-6 for May and October using the year 2021 for ERA5-Land and using 1500 candidates over a 30-year span for ClimEx (50 realizations × 30 years).
- 2.
Apply a weighting mask based on the categories specified by McKee et al. (1993) for each SPEI value derived from ERA5-Land to emphasize lower values, namely
- a.
1 if SPEI (extreme drought),
- b.
0.33 if SPEI (mild drought),
- c.
0.1 for all other values.
- a.
- 3.
Calculate a weighted root mean square error (RMSE) for each grid cell within the domain, comparing the SPEI values from ERA5-Land against each of the 1500 ClimEx candidates.
- 4.
Sum the RMSEs for each ClimEx candidate.
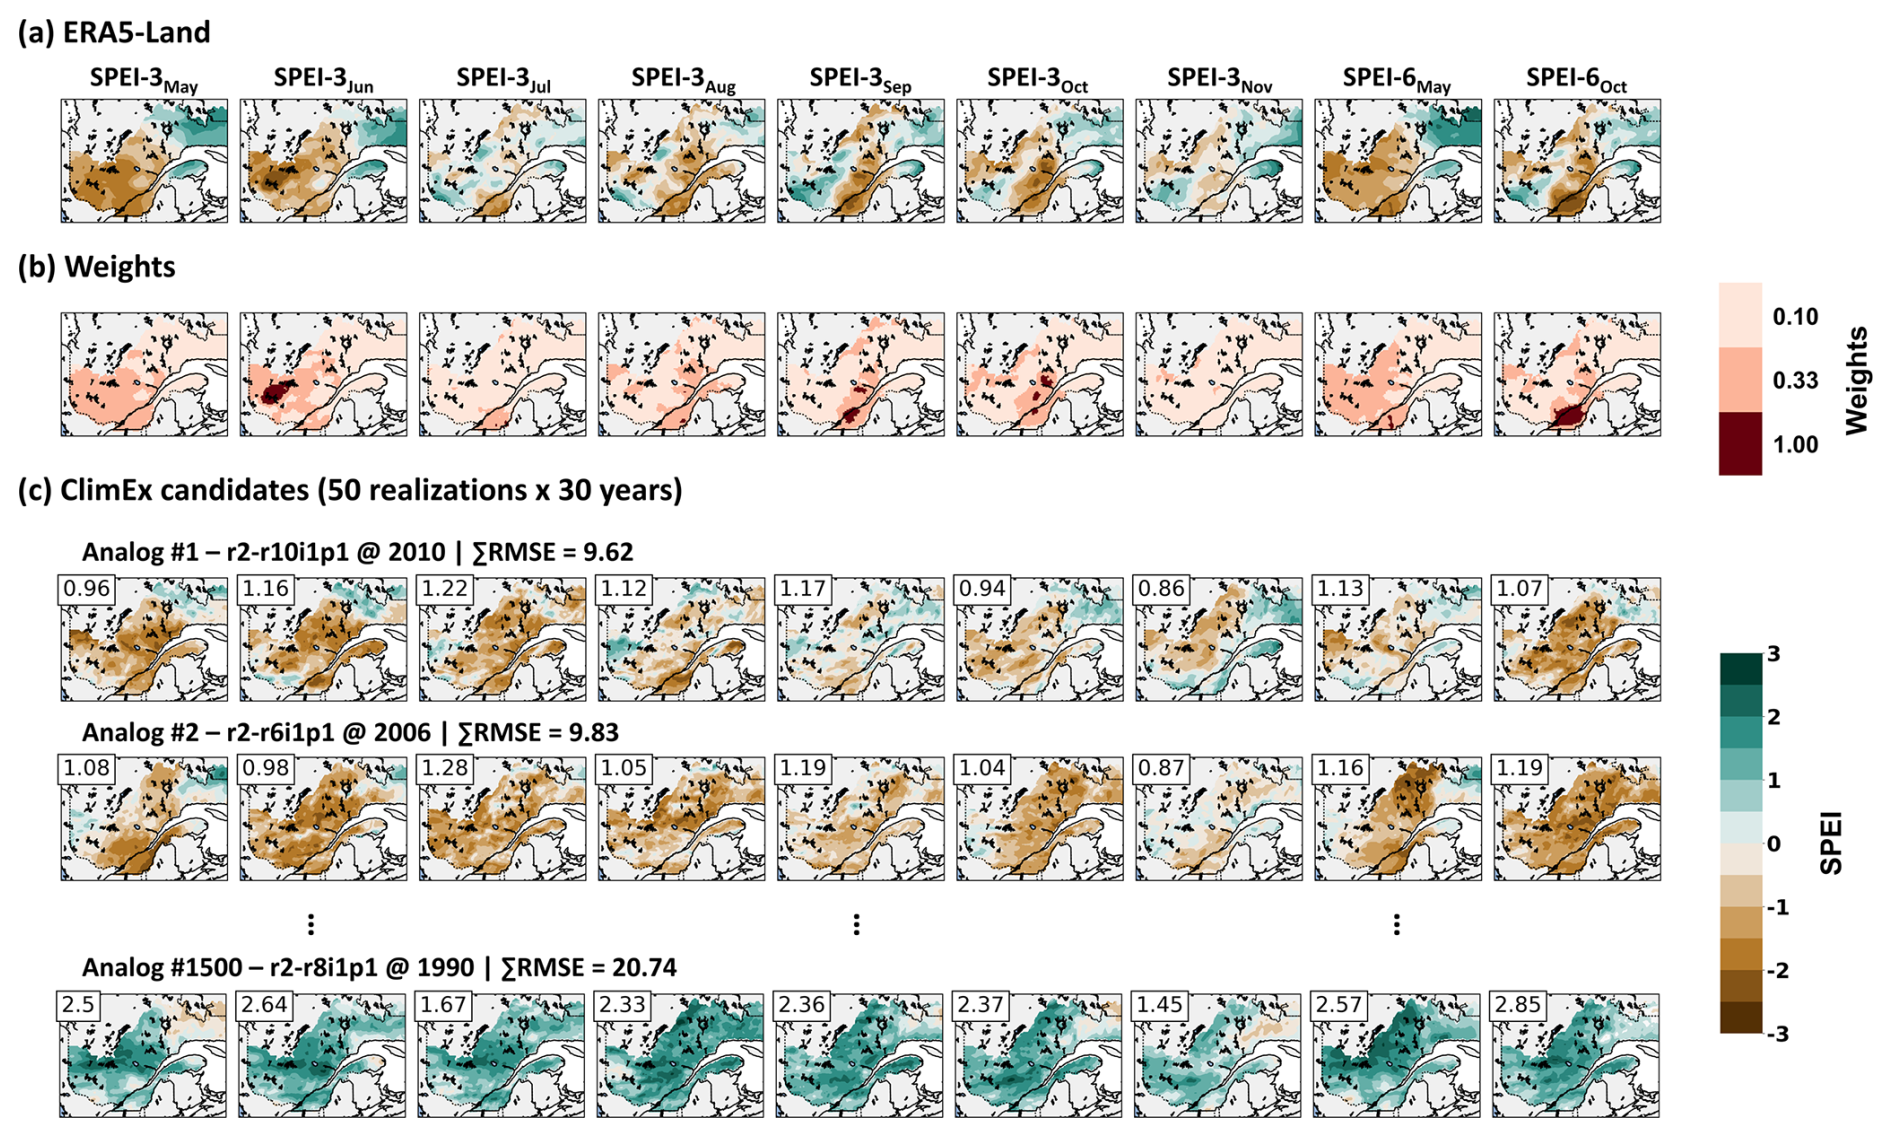
Figure 2The assessment of candidate analogues is performed by comparing various SPEI indicators (columns) between (a) ERA5-Land and (c) 1500 candidates (50 realizations × 30 years) from the ClimEx Large Ensemble. For each candidate (rows in c), a weighted RMSE is calculated for each SPEI (top-left corner of each image) and then aggregated. Weights (b) are allocated based on SPEI values in ERA5-Land.
The 1500 possible candidates within ClimEx for each period (historical, +2 and +3 °C) were then sorted according to their total RMSEs and cumulated over the spatial domain of HYDROTEL, and the nine SPEI metrics were analyzed (Fig. 2). The 10 candidates with the lowest total RMSE were selected as the 10 best analogues to 2021. This step was accomplished separately for the historical and the future periods. Figure S4 presents a validation of the monthly mean anomalies in precipitation, evapotranspiration, and streamflow between the observed 2021 and the average of the 10 best ClimEx analogues for the historical period across a few watersheds.
On the hydrological side, the previously described bias adjustment of ClimEx data does not guarantee that simulated streamflow indicators will not be biased compared to observations since nonlinear effects might come into play in both the hydrological model and the calculation of the hydrological indicators. For the construction of the future indicators, it is therefore preferable to apply a second adjustment step to the indicators themselves (Grenier et al., 2019). For that reason, the future hydrological indicators used in the storyline – the historical event under +2 and +3 °C scenarios – were constructed by first calculating the indicators for the 10 best analogues, averaging them over the future and historical time periods separately, and applying that difference to the observed indicator (Fig. 3). This modification was carried out by applying the relative change as a multiplier for flow-related metrics, whereas an absolute change was applied to metrics measured in days. This methodology is also used for the computation of the future hydrological indicators in the Hydroclimatological Atlas of Southern Quebec (MELCCFP, 2024).
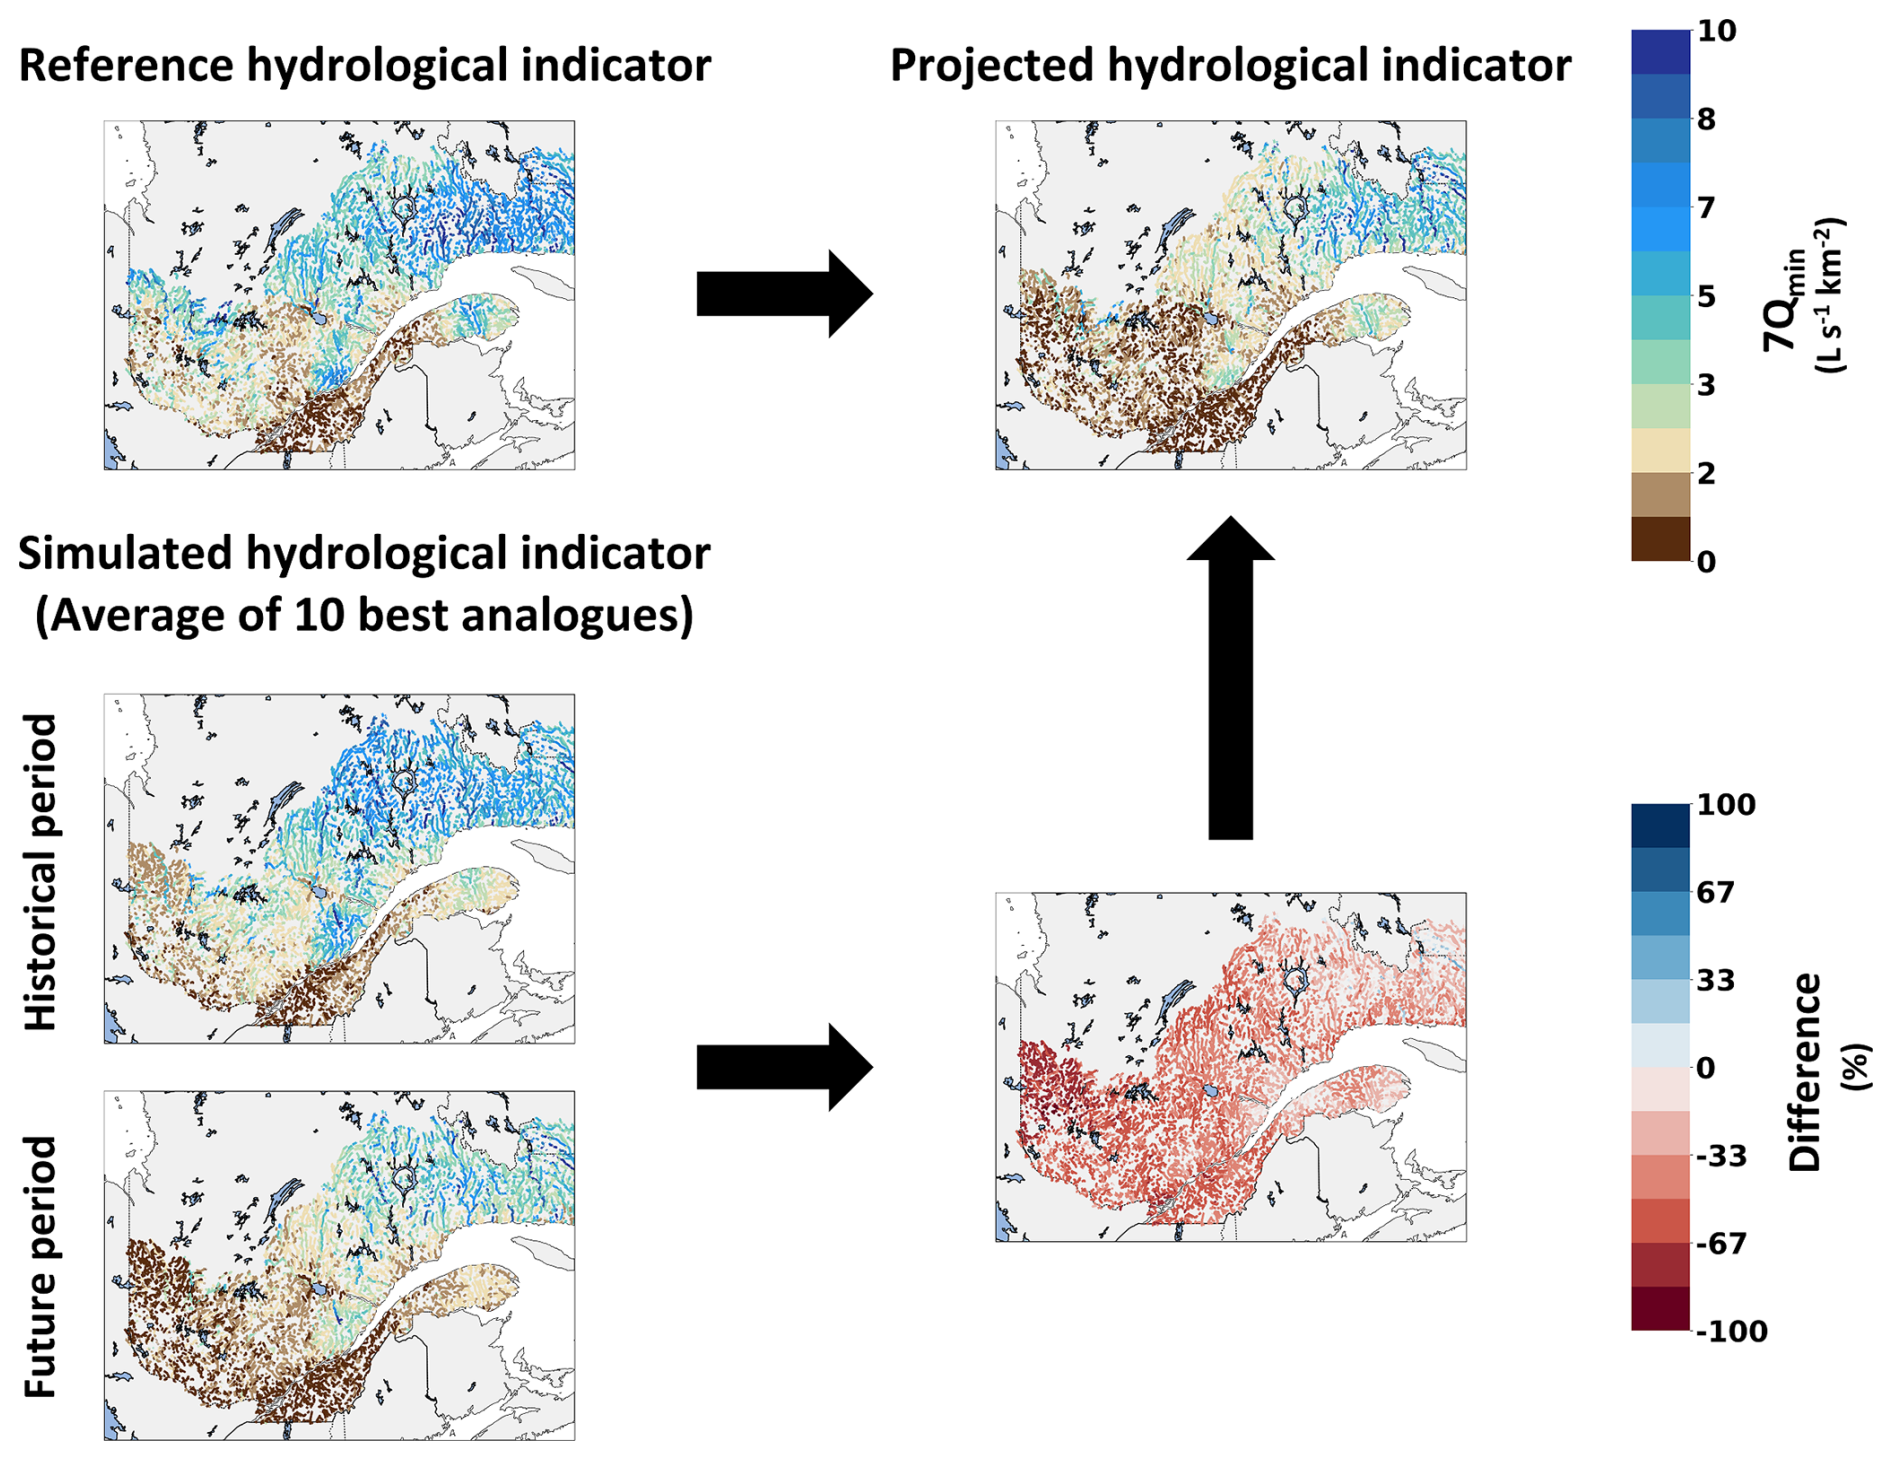
Figure 3Diagram of the building process for the future hydrological indicators. The difference between simulated analogues from future and historical scenarios is combined with the reference hydrological indicator in the future.
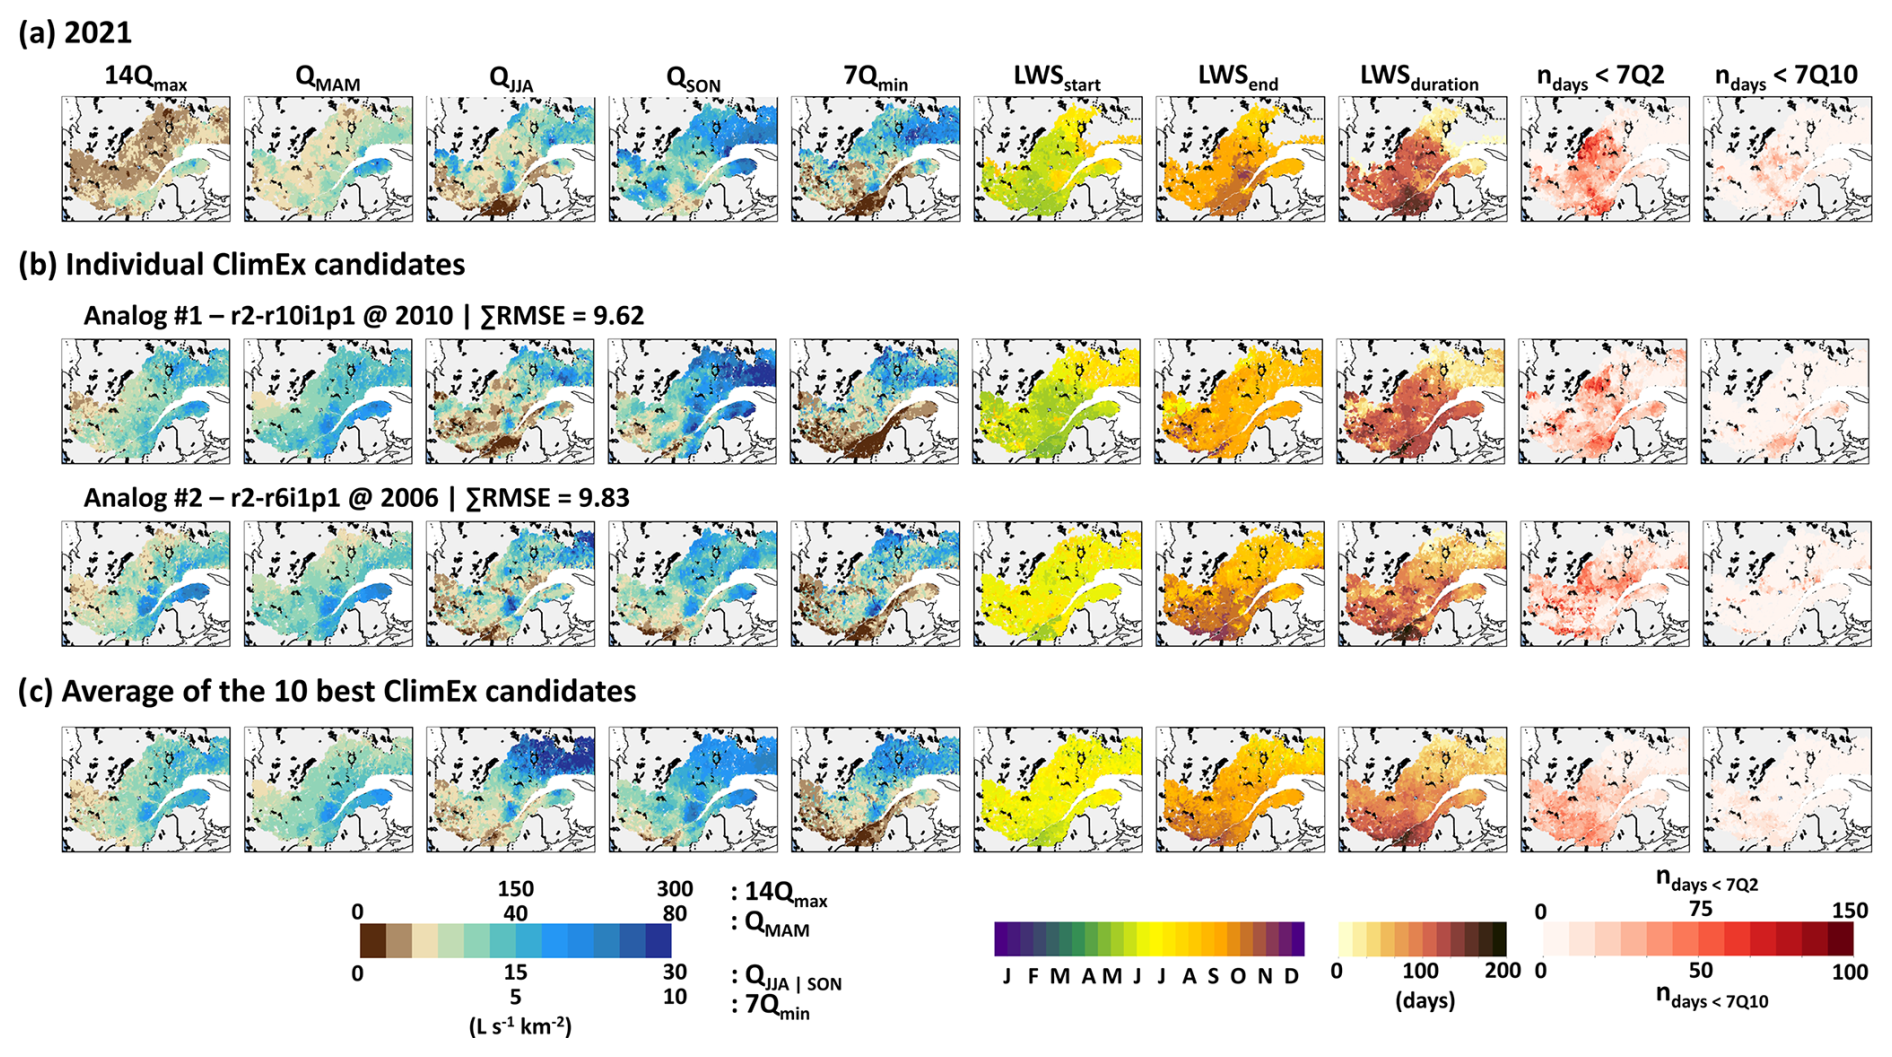
Figure 4Comparison of hydrological indicators between (a) the 2021 low-water episode, (b) the first two best ClimEx candidates within the historical period, and (c) the average of the 10 best ClimEx candidates.
Figure 4 presents a comparison of the hydrological indicators for the 2021 event for the top-two analogues of 2021 in the historical period and for the average of the 10 best analogues. Additional verifications have shown that, while the selection of the best analogues is sensitive to the weighting scheme and while the average of the best n analogues thus becomes unstable when the number is too low, the results were robust and stable with 10 selections (not shown). The average of the 10 best analogues (Fig. 4c) replicates the spatial patterns and intensity of the 2021 drought particularly well for key indicators like 7Qmin or LWSduration, although it overestimates the freshet volume and spring flow. It also adequately reproduces other indicators such as , LWSstart|end, and , though individual members sometimes provide a more accurate match in specific instances. For example, while the best match (r2-r10i1p1 in Fig. 4b) excels in replicating LWSstart, it ends too early for LWSend. The second best match (r2-r8i1p1 in Fig. 4b) exhibits the opposite issue. Therefore, overall, the average of the 10 best analogues performs adequately well and offers a solid representation of the 2021 drought for the chosen hydrological indicators (Fig. 4).
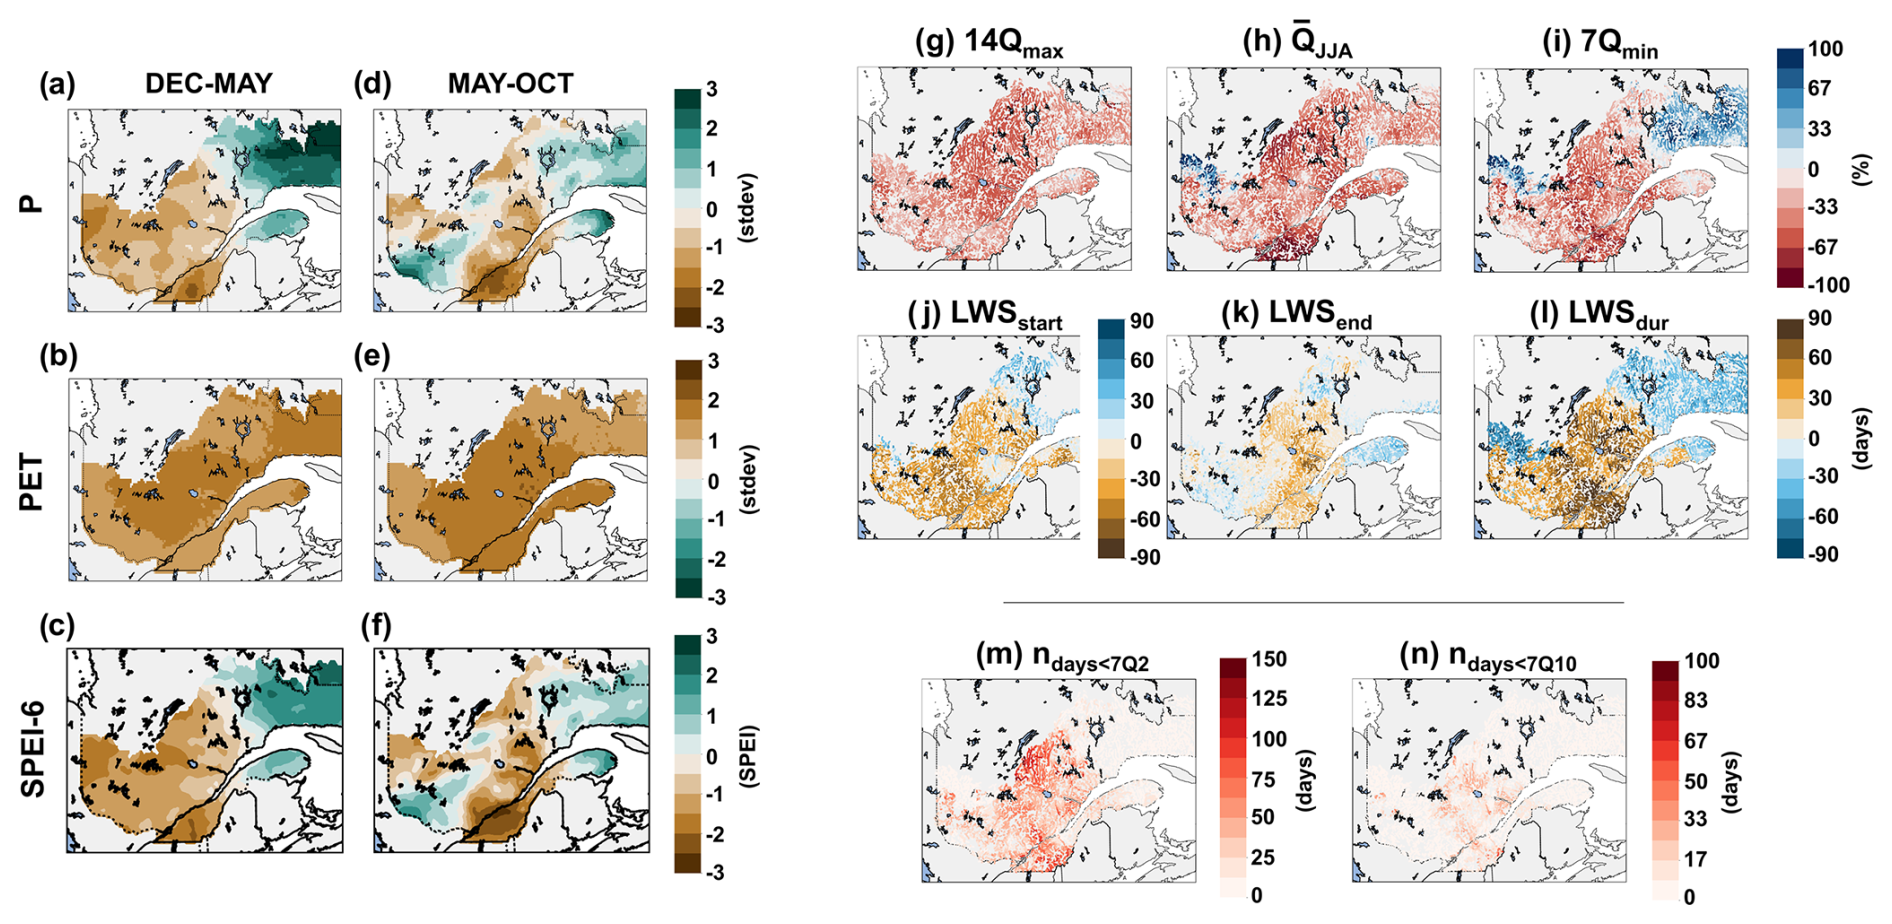
Figure 5Standard deviation anomalies of precipitation (P) and potential evapotranspiration (PET) in 2021 relative to the 1992–2021 average, along with SPEI-6 values, for (a–c) December to May and (d–f) May to October. (g–l) Anomalies in 2021 for the 14Qmax, , 7Qmin, LWSstart, LWSend, and LWSdur hydrological indicators compared to the 1992–2021 average. (m–n) Absolute values reached in 2021 for ndays<7Q2 and ndays<7Q10.
3.1 Analysis of the 2021 drought in southern Quebec
Anomalies of precipitation and evapotranspiration for the year 2021, along with associated SPEI values, are shown in Fig. 5a–c (December–May) and Fig. 5d–f (May–October), whereas Fig. 5g–j depict the differences between 2021 and the 1992–2021 average for key hydrological indicators taken from Table 1. Note that the climatological mean of ndays<7Q2 and ndays<7Q10 would not be meaningful since the threshold is, by definition, exceeded every 2 and 10 years only. Therefore, these two indicators are presented in absolute terms rather than as anomalies.
Severe drought conditions (SPEI ) were already detected in May after an unusually warm and dry winter and spring (Fig. 5c), leading to a reduction in freshet volumes of up to 67 % below average in most of the province (Fig. 5g) and causing the onset of summer-like conditions in rivers 45 to 60 d earlier than usual (Fig. 5j).
Drought conditions did not improve during summer and fall (Fig. 5f), with exceptionally low precipitation, especially in the St. Lawrence River valley, which, combined with high temperatures and evapotranspiration, led to extreme drought conditions (SPEI ) in that region. As pointed out by Kinnard et al. (2022), the lack of summer rainfall and high evapotranspiration led to extremely low streamflow throughout the province, especially south of the St. Lawrence River (Fig. 5h). In that area, which is the most densely populated area of Quebec and contains most of the agricultural land, anomalies in summer flow were as severe as −85 % or more compared to the 1992–2021 average, while the rest of the province still faced streamflow at about 50 % of the normal rate. The 7Qmin, indicative of the maximum stress on a stream within a given year, also reached its lowest point of the 1992–2021 period in many river sections of that region during 2021, with anomalies also ranging between −50 % and −85 % in the most affected areas (Fig. 5i). Furthermore, those affected rivers experienced at least 30 d with flow below the environmental threshold (7Q2), with some segments having over 90 d below this limit (Fig. 5m) and 14 d or more below the 7Q10 (Fig. 5n).
Anomalies for the end of the low-water season (Fig. 5k) match the spatial pattern shown in the May–October precipitation deficit and the SPEI-6OCT very well (Fig. 5e–f). Delays of up to a month can be seen in the driest areas, while substantial rainfall in the eastern and western parts of the province, particularly in September (not depicted), alleviated drought conditions there and helped end the LWS at a date close to the 1992–2021 average. Combined with the early onset of the LWS, the low-water season was extended by more than 2 months beyond the usual duration in the areas most affected by the 2021 drought (Fig. 5h).
The 2021 drought thus resulted in unprecedented hydrological stress in southern Quebec and around the Lake Saint-Jean area, with significant reductions in streamflow and an extended low-water season. Despite some late seasonal precipitation that alleviated drought conditions in some parts of the province, the south shore of the St. Lawrence River remained critically affected, showcasing the vulnerability of this densely populated and agriculturally important area to extreme drought events.
3.1.1 Reported environmental consequences
Despite having access to the survey described in Sect. 2.1, the impacts of 2021 on ecosystems remain mostly local and anecdotal in nature. This is in line with other studies that have noted a lack of consistent data collection before, during, and after drought periods that could help build causal relationships between low-water episodes and their impacts on ecosystems (Kovach et al., 2019). However, multiple stakeholders, especially in the area south of the St. Lawrence River, either directly acknowledged a decline in water quality in 2021 or indirectly highlighted this issue by noting higher treatment costs for municipalities or mass fish mortality events. Furthermore, while only a few watershed organizations reported it, it was noted that the decrease in freshet volume and the early arrival of low-water levels adversely affected submerged plant species to the benefit of invasive alien plant species such as Phragmites australis. This can be problematic since native aquatic plants often provide crucial shelter for numerous species of fish and serve as spawning grounds; thus, their disappearance could lead to reduced fish populations and biodiversity (Boyer et al., 2009; Plourde-Lavoie et al., 2017; Hudon et al., 2016; Mejia et al., 2023). Furthermore, a brief and weak freshet could result in fish being trapped in the floodplain or having no access to spawning areas, elevated juvenile fish mortality rates, and the desiccation of fish eggs (Plourde-Lavoie et al., 2017).
3.1.2 Reported socioeconomic consequences
Recent studies, as well as results from the stakeholder survey, indicate that municipalities and economic sectors in the southernmost parts of Quebec have become increasingly vulnerable to water scarcity in recent years (Charron et al., 2019, 2020; Leveque et al., 2021; Knowles et al., 2023; Nand and Qi, 2023). According to watershed organizations, some cities now face recurrent challenges in providing drinking water during summer months, even under normal conditions. Others have had to limit new developments due to concerns over water availability (Audet et al., 2024). Almost 40 % of Quebec's population relies on surface water from rivers and lakes, excluding the St. Lawrence River, with another 30 % sourced from groundwater (MELCCFP, 2018). Although municipalities sourcing their water directly from the St. Lawrence River did not experience severe water shortages in 2021, the St. Lawrence River valley itself, which is the province's most densely populated area, with extensive agricultural lands, is already under significant stress with regard to both surface and groundwater resources (e.g., Carrier et al., 2013; Larocque et al., 2015). In 2021, municipalities relying on surface water reported difficulties due to reduced availability and quality. Many issued boiled-water advisories, faced increased treatment costs, and imposed non-essential water use restrictions. One municipality set up a new pumping system to draw additional water from the Lake of Two Mountains (the Ottawa River delta at its confluence with the St. Lawrence River). Groundwater-dependent municipalities also faced similar restrictions, while some individuals and farms relying on private wells had to deepen their existing wells or dig new ones (Audet et al., 2024).
In agriculture, over 55 % of water is used for livestock and fish farming, with the remainder allocated to cleaning, washing produce, and irrigation. Notably, 95 % of Quebec's agricultural land is allocated to field crops and hay, with the majority still being rainfed, while irrigation is primarily limited to valuable crops like cranberries and various other fruits and vegetables (Charron et al., 2019, 2020; Nand and Qi, 2023). Thus, the 2021 drought caused significant reductions in crop yields, and, though the full economic impact has not yet been quantified, past droughts have resulted in financial losses in the tens of millions (Nand and Qi, 2023). Some farmers also incurred additional costs, employing water tanker trucks to replenish basins and supply livestock (Nand and Qi, 2023; Audet et al., 2024).
The recreational tourism industry also suffered. Low streamflow throughout the summer led to decreased water levels in rivers and lakes, limiting boating and water-based activities, including canoeing, kayaking, and paddle boarding. Poor water quality further restricted swimming (Audet et al., 2024). While 2021 likely impacted industries such as pulp and paper production and hydroelectric generation, no public data on these specific consequences were available.
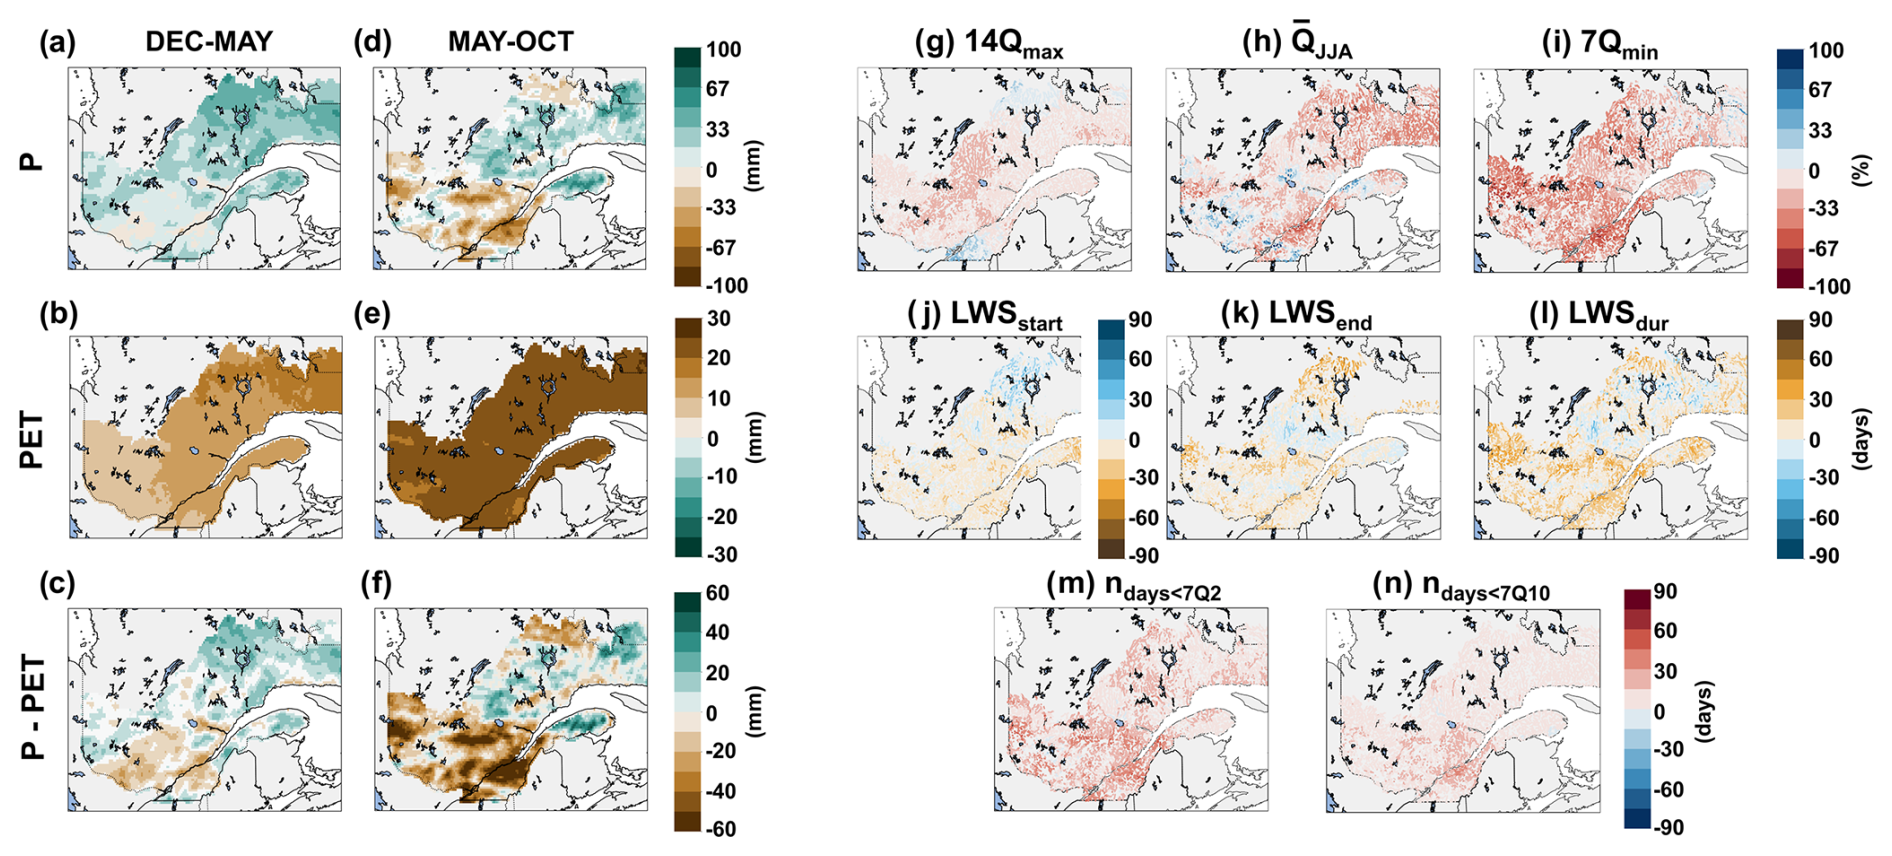
Figure 6Precipitation (P) and potential evapotranspiration (PET) anomalies under the +2 °C scenario with respect to the 2021 conditions, along with the anomalies in the water budget (P-PET) for (a–c) December to May and (d–f) May to October. (g–n) Anomalies for the hydrological indicators in the +2 °C scenario with respect to the 2021 conditions.
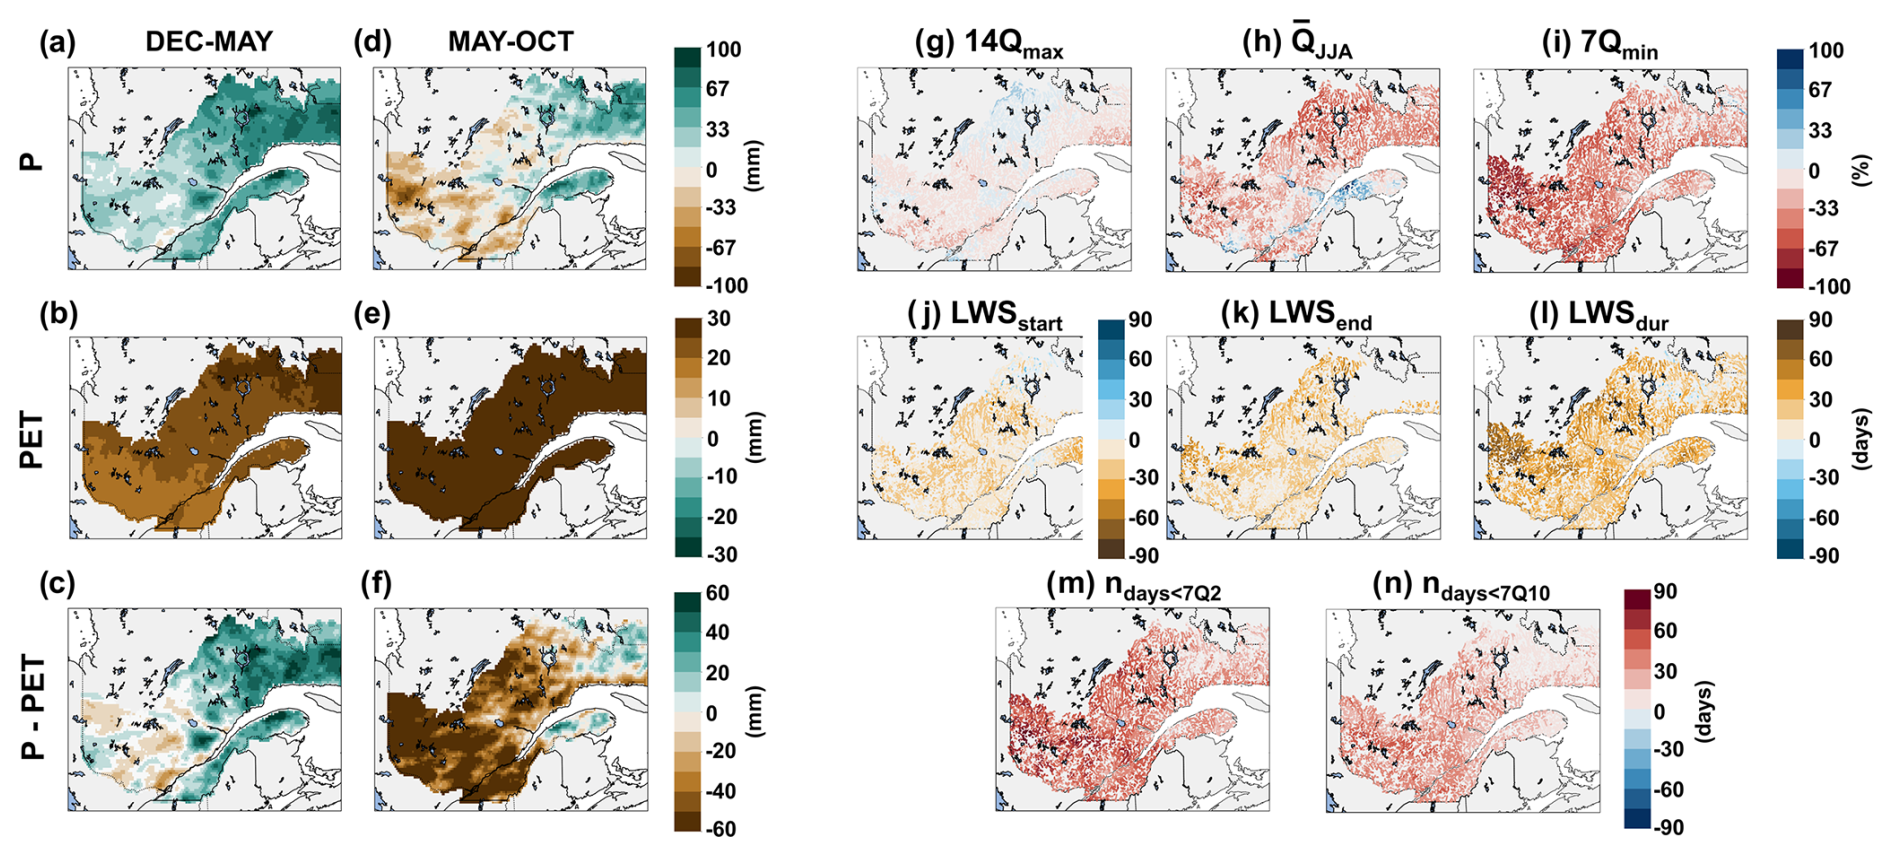
Figure 7Same as Fig. 6 but for the +3 °C scenario.
3.2 Storylines of the 2021 drought under future climate conditions
Storylines of the 2021 drought under +2 and +3 °C warming conditions were constructed by modifying the climatological and hydrological indicators computed for the 2021 drought using the analogues found in the ClimEx dataset, as shown in Fig. 3. Figures 6 and 7 thus resemble Fig. 5 but illustrate the change in the 2021 drought under the +2 and +3 °C warming scenarios relative to the historical event. Additional comparisons are shown in the Supplement for all hydrological indicators (Figs. S6 to S15). Furthermore, Fig. S5 presents monthly mean anomalies in precipitation, evapotranspiration, and streamflow for the average of the 10 best ClimEx analogues during the historical period, under +2 °C, and under +3 °C for a few watersheds.
The 2021 drought under +2 °C warming conditions shows a rise in winter and spring precipitation compared to the historical event (Fig. 6a), particularly in the northern regions, in accordance with IPCC projections (Lee et al., 2021). This increase in precipitation is offset by an increase in PET throughout the province (Fig. 6b), resulting in a slight reduction in the water budget in southern areas and a minor increase in northern regions (Fig. 6c). As a result, spring freshet volumes remain mostly within ±15 % of 2021 levels (Fig. 6g), while the start date of the low-water season also remains similar to that of 2021 (Fig. 6j).
Conditions during summer and fall are generally drier than 2021, especially in the southern and western parts of the province (Fig. 6d), although September still features significant rainfall in both the eastern and western parts of the province (not shown). Due to higher temperatures, the future scenario also features a substantial increase in evapotranspiration that affects the whole province (Fig. 6e). This leads to a net deficit in water balance that affects all areas that have suffered from the 2021 drought but now also reaches the western parts of the province that had been less impacted during the historical event (Fig. 6d). Rainfall in September did contribute to ending the low-water season between late September and mid-October in 2021. As this rainfall episode still occurs in the future scenario, the LWS ends at a similar time of the year (Fig. 6k). Combined with a similar start in the LWS with respect to 2021, this means that the duration of the LWS is either the same as in 2021 or only slightly longer (Fig. 6l).
As a result of the drier conditions, the average streamflow in summer for many river segments shows an additional reduction of up to 33 % compared to 2021, although a small improvement can be noted in the south and west of the province, where precipitation is higher than in 2021 (Fig. 6h). The 7Qmin was already significantly below average in 2021, and the analogues indicate a further decline of this metric across the entire province, with an additional reduction of 15 %–50 % compared to 2021 (Fig. 6i). As a result, under the +2 °C scenario, the total number of days below the environmental flow threshold (ndays<7Q2) increases by 15 to 30 d for numerous river segments (Fig. 6m).
The 2021 event under +3 °C warming conditions is generally in agreement with the +2 °C scenario but shows even stronger reductions in streamflow and water availability across the province due to rising temperatures and evapotranspiration. The only exception is in winter and spring, where a further increase in precipitation leads to a rise in the net water balance for most of the province compared to 2021 (Fig. 7c). However, this does not result in a higher 14Qmax, which remains similar to the historical event (Fig. 7g), potentially due to the increase in precipitation being balanced by more winter thaw and higher winter streamflow. This could also explain why the low-water season for the analogue under a +3 °C scenario begins 2–4 weeks earlier than in 2021 (mid-May compared to early June) for numerous river sections north of the St. Lawrence River (Fig. 7j), especially since precipitation is still well below the historical average despite the future increase.
Precipitation changes in summer and fall under the +3 °C warming conditions closely resemble those in the +2 °C scenario, but PET increases are significantly greater and lead to a net water balance loss of more than 60 mm over most of the southern and western parts of the province (Fig. 7f). This causes a further reduction in the average seasonal streamflow across the province (Fig. 7h) and also negatively affects the 7Qmin metric, which displays a reduction of 33 %–67 % compared to the already low levels of 2021 (Fig. 7i). The rise in ndays<7Q2 is thus very pronounced under the +3 °C scenario, with some segments experiencing an increase of up to 60 d (Fig. 7m). Given the already high number of days recorded in 2021, this implies that many rivers could experience up to 100 d below the environmental flow threshold, with some potentially reaching 150 d. Under that scenario, it is particularly concerning that the more severe low-flow metric (7Q10) is exceeded by most rivers across the province for a duration of 25 to 60 d (Fig. 7n). This would suggest unprecedented impacts on ecosystems, water quality, and human uses.
Finally, as a consequence of both the decrease in precipitation and the significant rise in evapotranspiration, the LWS concludes up to a month later compared to 2021 for many river sections under +3 °C conditions, bringing low-water conditions into early November in the southern parts of the province (Fig. 7k). As a result, from both an earlier onset and a later conclusion of the LWS, there is a total increase of 15 to 45 d in the LWS throughout most of the province compared to 2021 under that scenario (Fig. 7l).
Water availability is a cornerstone of ecological and human systems, and its scarcity progressively impacts both the functioning of ecosystems and the health of populations in cascading effects. For instance, drought conditions diminish critical habitats for plants and animals reliant on water, leading to biodiversity loss and degradation of ecosystem services offered by wetlands, rivers, and other aquatic systems (Parisi et al., 2018; Bond et al., 2019; Mehdi et al., 2015; Furber et al., 2016; Wheaton and Kulshreshtha, 2017; Osman, 2018; Chilima et al., 2021). In turn, the disruption of these ecological functions diminishes the availability of clean water for human consumption and agricultural use, compounding the challenges to community well-being. As water scarcity intensifies, it creates competition among various sectors: municipal water supply systems, agriculture, recreational tourism, ecological needs, and more.
There is no universally accepted indicator or threshold that indicates when water scarcity begins to significantly impact ecosystems, drinking-water systems, and other human uses. Additionally, Quebec currently lacks a formal low-water alert system, such as the one in place in Ontario (Ontario Ministry of Natural Resources et al., 2010), which complicates the assessment of the effects of meteorological and hydrological droughts on human activities. The Ontarian system, which includes regulatory restrictions and actions for each alert level, provides a framework that would help assess the escalating impacts of a drought as it unfolds, as well as the water management strategies necessary to face such events. However, as previously discussed, the 2021 drought had numerous documented adverse effects on southern Quebec. Although the hydrological indicators used in this study must be interpreted qualitatively with regard to their causal relationship with observed impacts, the storyline lens still offers valuable insights into the potential severity of future extreme droughts. Our results indicate that, should a drought comparable to the 2021 event occur in the future, particularly under +3 °C warming conditions, water scarcity would be considerably exacerbated. As noted earlier, with the exception of freshet volumes, all low-flow indicators suggest progressively worsening conditions under the projected climate scenarios. These changes could lead to substantial ecological degradation and a diminished capacity of ecosystems to provide critical services for human activities. Notably, despite the aforementioned criticisms of the 7Q2 as a measure of ecosystem needs (Berthot et al., 2020), the increasing number of days falling below this threshold raises significant concerns. Extended droughts, coupled with rising temperatures, will not only exacerbate water quality and availability issues but could also lead to irreversible changes to aquatic ecosystems, thereby threatening biodiversity and the essential ecosystem services reliant on stable water conditions. This situation could further strain municipal water supplies, agriculture, and other vital sectors, as evidenced by the 2021 drought, which highlighted Quebec's vulnerability to the impacts of droughts.
In light of the risks posed by climate change and increasingly frequent drought events, the storyline approach offers a valuable framework for understanding, communicating, and preparing for future droughts in collaboration with those affected (Caviedes-Voullième and Shepherd, 2023). Indeed, stakeholders possess intimate knowledge of their local water systems and retain memories of the real impacts of past events. Storylines can foster dialogue between local actors and climate scientists by making climate data more accessible and relevant for decision-making, particularly for developing effective response measures. Unlike broad, abstract projections like “Future 100-year droughts will be n d longer”, which can fail to provide concrete insights into the specifics of what a 100-year drought might entail even in the current climate, storylines offer more actionable and tangible scenarios. While the analysis has primarily aimed to enhance the understanding of future severe drought conditions at the provincial scale, HYDROTEL's distributed nature allows for the tailoring of hydrological indicators to address local-scale issues. In preparation for a stakeholder workshop planned for the second phase of the project, additional local data are being gathered from nearly 20 participants representing governmental, municipal, industrial, health, environmental, and recreo-tourism sectors within a watershed north of the St. Lawrence River. By integrating their input with the modelled future events developed in this study, a potential storyline might read as follows: “A drought similar to the one experienced in 2021 but occurring under a +3 °C global temperature increase could persist for up to 26 additional days and lead to a further 30 %–50 % reduction in monthly streamflow. This would have severe environmental and socioeconomic consequences. Streamflow would remain below the environmental flow threshold for over 90 d, more than double the 2021 duration, indicating a potentially catastrophic decline in water quality and biodiversity. Compounding the crisis, between August and October, the nearby city's water demand could consume up to 75 % of the river's flow, not accounting for future consumption increases. Recreational tourism, a key economic activity in the region, would also suffer: kayaking restrictions due to insufficient water levels, which lasted 7 d in 2021, could extend to up to 2 months under such extreme conditions”. This event-based, context-rich approach allows stakeholders to recognize vulnerabilities by anchoring them to a familiar reference point – the 2021 drought – and projecting plausible future impacts. The city mentioned above was not concerned about water shortages in 2021, but understanding that a future event could last a month longer and leave barely enough water to meet even current needs may prompt proactive adaptation planning, such as bolstering water conservation measures, investing in infrastructure improvements, exploring alternative water sourcing strategies, or developing protocols to avoid conflicts between various users. Similarly, confronting certain water-dependent industries in that watershed with the possibility of future acute water shortages, regardless of existing water withdrawal agreements, could prove to be eye-opening and reveal potential vulnerabilities in their profitability or operational resilience.
While stakeholder participation was not carried out in this initial study, we contend that the storyline method supports a more collaborative and informed dialogue between stakeholders, allowing better coordination across sectors such as water management, urban planning, agriculture, and public health by grounding future projections in recent, real-world examples. To further evaluate this potential, the second phase, planned for mid-2025, will investigate how storylines can deliver actionable insights through workshops organized with stakeholders in select watersheds that experienced significant impacts as a result of the 2021 drought.
Limitations
We recognize that there are certain limitations in the current analysis. The use of a single hydrological model, namely HYDROTEL, is one of them. It is well known that using multiple hydrological models provides a better representation of the uncertainty (Castaneda-Gonzalez et al., 2022). Furthermore, HYDROTEL is primarily geared toward surface water dynamics and employs simplified representations of soil and groundwater processes and interactions. Although the methodology used in this study to generate future indicators – which involves applying the climate change signal to the reconstructed streamflow data that leverage observed stream gauges through optimal interpolation – partially mitigates this limitation, HYDROTEL cannot reproduce low-flow conditions as well as fully integrated surface–groundwater models.
Another constraint in simulating future low flows is HYDROTEL's current dependence on a relatively simplistic definition of PET, which relies only on near-surface temperature and latitude (McGuinness and Bordne, 1972). Although other definitions of PET are available in HYDROTEL, they all rely primarily on temperature. Internal testing has shown the climate change signal to be relatively insensitive to the selection of PET among the currently available definitions (not shown), but this conclusion might differ if more physically based formulas that included variables like solar radiation or humidity were available for comparison.
However, it is essential to note that the primary objective of this study was not to achieve exact modelling of future low flows but to produce plausible, physically coherent low-flow indicators reminiscent of the 2021 drought so that they could be used to stimulate conversations with stakeholders about the effects of water scarcity under future climates in southern Quebec. The constructed scenarios can offer valuable insights into potential future conditions and emphasize the importance of preparedness for water shortages. Additionally, as outlined in the previous section, these scenarios lay the groundwork for dialogues regarding the environmental and socioeconomic repercussions of such an event and underscore the necessity of implementing robust water management strategies to ensure the sustainability and resilience of water resources in Quebec.
Although this study mainly examines water availability, it must be noted that future projections occur within a framework of anticipated increased water demand, which, in Quebec, is primarily driven by population growth (Charron et al., 2019, 2020; Da Silva et al., 2020; Achkar, 2023). The province is well-known for its high per capita daily water consumption, and the residential sector alone currently represents 41 % of the province's water usage (Charron et al., 2019). Based on data from Institut de la Statistique du Québec (2022), the population is projected to increase by 6 % by 2030 relative to 2021, reaching +13 % by 2050 and +17 % by 2066. This growth could further strain the already scarce resources during severe droughts. However, several strategies are already being implemented to reduce water consumption and bring it closer to the Canadian average, which might help mitigate part of the increase in demand resulting from population growth in the coming decades (Government of Quebec, 2019).
This study used a storyline approach to reflect on the plausible impacts of future severe drought conditions in Quebec based on the 2021 drought. A series of SPEIs from spring to fall was used to identify analogous events within a large ensemble of climate simulations under both present and future climates, while a hydrological model was employed to assess the impacts of those drought conditions on river streamflow throughout southern Quebec. This model was used to explore the potential consequences of a drought similar to the one that occurred in 2021 but which would occur under global warming scenarios of +2 and +3 °C compared to preindustrial levels. The results indicate a significant deterioration in river conditions, particularly under a +3 °C temperature rise, with both an extended duration of low-water conditions and reduced river flows.
In the absence of clear impact-inducing thresholds but with documented impacts in 2021, these storylines can provide a framework for stakeholders to gain a clearer understanding of future droughts by linking them to an event that they are already familiar with. Similarly, storylines can also help in climate change adaptation planning by building upon the vulnerabilities identified during historical extreme events. However, for this to be fully effective, improved systematic data collection is needed with respect to the impacts of meteorological and hydrological droughts on human activities and, even more so, on ecosystems in Quebec and Canada as these are currently seldom reported or difficult to access. Research is also required on the effects of climate change on groundwater and its recharge, particularly during extreme droughts, as there is currently a scarcity of literature in this area despite the central role of aquifers in the water supply of Quebec. Enhancing the groundwater monitoring network, both spatially and temporally, is essential to address these research deficiencies and to generate the data required to shape effective water management policies.
Lacking a comprehensive understanding of these factors, the implementation of adaptation strategies could become significantly more challenging or may even result in maladaptive outcomes (e.g., increasing the reliance on aquifers without an assessment of how vulnerable they are to extreme droughts). Yet, without measures to improve resilience against water shortages in Quebec, a region typically abundant in water but lacking adequate regulatory systems to manage water usage disputes, it is anticipated that various adverse socioeconomic and environmental consequences will occur. Potential impacts may include a significant reduction in biological diversity and deterioration of ecosystem services, diminished agricultural yields or greater dependence on irrigation, increased expenses for water purification, a halt in residential expansion in areas with scarce water resources, and a rise in disputes over water-related issues.
This work aimed to improve our understanding of future drought conditions at the provincial scale, but the distributed nature of HYDROTEL means that hydrological indicators were nonetheless computed at a local scale. This study thus lays the groundwork for the second phase of the project, which will involve stakeholder workshops in a few key watersheds most affected by the 2021 drought. These workshops aim to further explore how storylines can offer actionable insights into the impacts of acute water shortages and support preparedness for climate change effects on water resources.
The code used in this research can be found on GitHub at https://github.com/Ouranosinc/CASCADES/tree/v1.0.0, https://doi.org/10.5281/zenodo.17153229.
All datasets used in this study are publicly available. The original ERA5-Land dataset used to compute the historical meteorological conditions is available on the Copernicus Climate Change Service (2019). The original ClimEx climate dataset used to compute the simulated historical and future meteorological conditions is available at Ouranos and Centre de Recherche Informatique de Montréal (2023). The original daily time series of HYDROTEL hydrological data are not hosted on a download platform, but can be acquired by contacting the MELCCFP (2022b).
The supplement related to this article is available online at https://doi.org/10.5194/hess-29-4893-2025-supplement.
GRG was the lead author of the paper, aided by LPC. ÉC initially examined the storyline approach with help from GRG, LPC, and DM, which was later advanced by GRG, who also performed the climatological and hydrological analyses. KA managed the stakeholder survey and contributed to the socioeconomic evaluation, which was led by Laurent Da Silva. DT and RP led the environmental impact assessment. All of the authors provided crucial feedback and helped refine the research, analysis, and paper.
The contact author has declared that none of the authors has any competing interests.
Publisher's note: Copernicus Publications remains neutral with regard to jurisdictional claims made in the text, published maps, institutional affiliations, or any other geographical representation in this paper. While Copernicus Publications makes every effort to include appropriate place names, the final responsibility lies with the authors.
This article is part of the special issue “Drought, society, and ecosystems (NHESS/BG/GC/HESS inter-journal SI)”. It is not associated with a conference.
This project was made possible thanks to funding from the Gouvernement du Québec. The authors also want to thank Isabelle Charron, Diego Crespel, Bertrand Montel, Matthieu Paccard, and Jérémie Roques for their help and support throughout the CASCADES project. We acknowledge the scientific monitoring committee of the CASCADES project (Anne Blondlot, Richard Turcotte, Nathalie Bleau, Charlotte Legault-Bélanger, Marie Larocque, Annick Van Campenhout, Sébastien Ouellet-Proulx, and Frédéric Lecomte) for their valuable insights.
ERA5-Land was downloaded from the Copernicus Climate Data Store (CDS). The results contain modified Copernicus Climate Change Service information.
The ClimEx dataset was produced within the ClimEx project by the Bavarian State Ministry for the Environment and Consumer Protection. The CRCM5 was developed by the ESCER centre of Université du Québec à Montréal (UQÀM; http://www.escer.uqam.ca, last access: 15 September 2025) in collaboration with Environment and Climate Change Canada. We acknowledge Environment and Climate Change Canada's Canadian Centre for Climate Modelling and Analysis for executing and making available the CanESM2 Large Ensemble simulations used in this study. Computations with the CRCM5 for the ClimEx project were made on the SuperMUC supercomputer at Leibniz Supercomputing Centre (LRZ) of the Bavarian Academy of Sciences and Humanities. The operation of this supercomputer is supported via the Gauss Centre for Supercomputing (GCS) by the German Federal Ministry of Education and Research and the Bavarian State Ministry of Education, Science and the Arts.
Streamflow data were obtained from the Hydroclimatological Altas of Southern Quebec, which is produced by the ministère de l’Environnement, de la Lutte contre les changements climatiques, de la Faune et des Parcs of Quebec in collaboration with Ouranos. The Hydroclimatic Atlas is produced with the support of numerous collaborators, as well as the Fonds vert as part of the implementation of the Quebec government's Plan d'action 2013–2020 sur les changements climatiques and the Plan pour une économie verte 2030.
Initial proofreading of the paper was assisted by AI technologies through Writefull.
This research has been supported by the Québec Ministère du Développement Durable, de l'Environnement et de la Lutte Contre les Changements Climatiques (Plan pour une Économie Verte (PEV)).
This paper was edited by Markus Hrachowitz and reviewed by Andreja Jonoski, Maurits Ertsen, and one anonymous referee.
Achkar, M.-B.: Développement d'un modèle conceptuel pour l'évaluation de la demande en eau urbaine future: application à une ville québécoise, Master's thesis, Polytechnique Montréal, 2023. a
Alberti-Dufort, A., Bourduas Crouhen, V., Demers-Bouffard, D., Hennigs, R., Legault, S., Cunningham, J., Larrivée, C., and Ouranos: Quebec; Chapter 2 in Canada in a Changing Climate: Regional Perspectives Report, Government report, Government of Canada, Ottawa (ON), Canada, 2022. a, b
Assani, A. A.: Extreme Hydrological Drought in Southern Quebec (Canada): Natural and Anthropogenic Factors Interactions on its Spatio-Temporal Variability, International Journal of Environmental Sciences and Natural Resources, 32, 556348, https://doi.org/10.19080/ijesnr.2023.32.556348, 2023. a
Audet, K., Montel, B., Crespel, D., Tarte, D., Parent, R., Silva, L. D., Paccard, M., Rondeau-Genesse, G., and Roques, J.: Conséquences Attendues Survenant en Contexte d’Aggravation des Déficits d’Eau Sévères au Québec (CASCADES), Tech. rep., Groupe AGÉCO, Nada Conseils, T2 Environnement, Ouranos, Montreal (QC), Canada, 2024. a, b, c, d, e
Aygün, O., Kinnard, C., and Campeau, S.: Impacts of climate change on the hydrology of northern midlatitude cold regions, Prog. Phys. Geogr.-Earth and Environment, 44, 338–375, https://doi.org/10.1177/0309133319878123, 2019. a
Baulenas, E., Versteeg, G., Terrado, M., Mindlin, J., and Bojovic, D.: Assembling the climate story: use of storyline approaches in climate‐related science, Global Challenges, 7, 2200183, https://doi.org/10.1002/gch2.202200183, 2023. a
Berthot, L., St-Hilaire, A., Caissie, D., El-Jabi, N., Kirby, J., and Ouellet-Proulx, S.: Southern Quebec environmental flow assessments: spatial and temporal scales sensitivity, Can. Water Resour. J., 45, 358–371, https://doi.org/10.1080/07011784.2020.1834881, 2020. a, b, c, d, e, f
Berthot, L., St-Hilaire, A., Caissie, D., El-Jabi, N., Kirby, J., and Ouellet-Proulx, S.: Environmental flow assessment in the context of climate change: a case study in Southern Quebec (Canada), J. Water Clim. Change, 12, 3617–3633, https://doi.org/10.2166/wcc.2021.254, 2021. a, b, c
Bond, N. R., Burrows, R. M., Kennard, M. J., and Bunn, S. E.: Water Scarcity as a Driver of Multiple Stressor Effects, 111–129, Elsevier, ISBN 9780128117132, https://doi.org/10.1016/b978-0-12-811713-2.00006-6, 2019. a
Bonsal, B., Peters, D., Seglenieks, F., Rivera, A., and Berg, A.: Changes in freshwater availability across Canada; Chapter 6 in Canada’s Changing Climate Report, Government report, Government of Canada, Ottawa (ON), Canada, 2019. a, b
Boulanger, Y., Arseneault, D., Bélisle, A. C., Bergeron, Y., Boucher, J., Boucher, Y., Danneyrolles, V., Erni, S., Gachon, P., Girardin, M. P., Grant, E., Grondin, P., Jetté, J.-P., Labadie, G., Leblond, M., Leduc, A., Puigdevall, J. P., St-Laurent, M.-H., Tremblay, J., and Waldron, K.: The 2023 wildfire season in Québec: an overview of extreme conditions, impacts, lessons learned and considerations for the future, Can. J. Forest Res., 55, 1–21, https://doi.org/10.1139/cjfr-2023-0298, 2024. a
Boyer, C., Verhaar, P. M., Roy, A. G., Biron, P. M., and Morin, J.: Impacts of environmental changes on the hydrology and sedimentary processes at the confluence of St. Lawrence tributaries: potential effects on fluvial ecosystems, Hydrobiologia, 647, 163–183, https://doi.org/10.1007/s10750-009-9927-1, 2009. a
Cannon, A. J.: The Impact of “Hot Models” on a CMIP6 Ensemble Used by Climate Service Providers in Canada: Do Global Constraints Lead to Appreciable Differences in Regional Projections?, J. Climate, 37, 2141–2154, https://doi.org/10.1175/jcli-d-23-0459.1, 2024. a
Carrier, M., Lefebvre, R., Rivard, C., Parent, M., Ballard, J., Benoit, N., Vigneault, H., Beaudry, C., Malet, X., Laurencelle, M., Gosselin, J., Ladevèze, P., Thériault, R., Beaudin, I., Michaud, A., Pugin, A., Morin, R., Crow, H., Gloaguen, E., Bleser, J., Martin, A., and Lavoie, D.: Portrait des ressources en eau souterraine en Montérégie Est, Government report, Government of Quebec (MELCCFP), Quebec City (QC), Canada, 2013. a
Castaneda-Gonzalez, M., Poulin, A., Romero-Lopez, R., Turcotte, R., and Chaumont, D.: Uncertainty sources in flood projections over contrasting hydrometeorological regimes, Hydrol. Sci. J., 67, 2232–2253, https://doi.org/10.1080/02626667.2022.2137415, 2022. a
Caviedes-Voullième, D. and Shepherd, T. G.: Climate storylines as a way of bridging the gap between information and decision-making in hydrological risk, PLOS Climate, 2, e0000270, https://doi.org/10.1371/journal.pclm.0000270, 2023. a, b
Chan, W. C., Arnell, N. W., Darch, G., Facer-Childs, K., Shepherd, T. G., Tanguy, M., and van der Wiel, K.: Current and future risk of unprecedented hydrological droughts in Great Britain, J. Hydrol., 625, 130074, https://doi.org/10.1016/j.jhydrol.2023.130074, 2023. a, b
Chan, W. C. H., Shepherd, T. G., Facer-Childs, K., Darch, G., and Arnell, N. W.: Storylines of UK drought based on the 2010–2012 event, Hydrol. Earth Syst. Sci., 26, 1755–1777, https://doi.org/10.5194/hess-26-1755-2022, 2022. a
Charron, C., St-Hilaire, A., Ouarda, T. B., and van den Heuvel, M. R.: Water Temperature and Hydrological Modelling in the Context of Environmental Flows and Future Climate Change: Case Study of the Wilmot River (Canada), Water, 13, 2101, https://doi.org/10.3390/w13152101, 2021. a
Charron, I., Beauchemin, A., Blais-Gagnon, A., Delmotte, S., Ducruc, S., Dugré, D., Landry, F., Jego, G., Michaud, A., Morrissette, R., and St-Arnaud, R.-M.: Recherche participative d’alternatives durables pour la gestion de l’eau en milieu agricole dans un contexte de changement climatique (RADEAU1), Government report, MAPAQ, Quebec City (QC), Canada, 2019. a, b, c, d, e
Charron, I., Beauchemin, A., Blais-Gagnon, A., Boivin, C., Delmotte, S., Ducruc, S., Dugré, D., Landry, F., Lefebvre, R., Jego, G., Gosselin, J.-S., Michaud, A., Morrissette, R., Raynauld, M., St-Arnauld, R.-M., Vallée, J., and Valleros, A.: Recherche participative d’alternatives durables pour la gestion de l’eau en milieu agricole dans un contexte de changement climatique (RADEAU2), Government report, MAPAQ, Quebec City (QC), Canada, 2020. a, b, c, d
Chilima, J. S., Blakley, J., Diaz, H. P., and Bharadwaj, L.: Understanding Water Use Conflicts to Advance Collaborative Planning: Lessons Learned from Lake Diefenbaker, Canada, Water, 13, 1756, https://doi.org/10.3390/w13131756, 2021. a, b
Copernicus Climate Change Service (C3S): ERA5-Land hourly data from 1950 to present, Copernicus Climate Change Service (C3S) Climate Data Store (CDS) [data set], https://doi.org/10.24381/cds.e2161bac (last access: 22 December 2022), 2019. a
Da Silva, L., Pineault, K., and Rondeau-Genesse, G.: Vulnérabilité des sources d’approvisionnement en eau potable du territoire de la CMQ face aux changements climatiques, Technical report, Ouranos, Montreal (QC), Canada, 2020. a
Derksen, C., Burgess, D., Duguay, C., Howell, S., Mudryk, L., Smith, S., Thackeray, C., and Kirchmeier-Young, M.: Changes in snow, ice, and permafrost across Canada; Chapter 5 in Canada's Changing Climate Report, Government report, Government of Canada, Ottawa (ON), Canada, 2019. a
Dubois, E., Larocque, M., Gagné, S., and Meyzonnat, G.: Simulation of long-term spatiotemporal variations in regional-scale groundwater recharge: contributions of a water budget approach in cold and humid climates, Hydrol. Earth Syst. Sci., 25, 6567–6589, https://doi.org/10.5194/hess-25-6567-2021, 2021. a, b
Dubois, E., Larocque, M., Gagné, S., and Braun, M.: Climate Change Impacts on Groundwater Recharge in Cold and Humid Climates: Controlling Processes and Thresholds, Climate, 10, 6, https://doi.org/10.3390/cli10010006, 2022. a
Faranda, D., Pascale, S., and Bulut, B.: Persistent anticyclonic conditions and climate change exacerbated the exceptional 2022 European-Mediterranean drought, Environ. Res. Lett., 18, 034030, https://doi.org/10.1088/1748-9326/acbc37, 2023. a
Fortin, J.-P., Turcotte, R., Massicotte, S., Moussa, R., Fitzback, J., and Villeneuve, J.-P.: Distributed Watershed Model Compatible with Remote Sensing and GIS Data. I: Description of Model, J. Hydrol. Eng., 6, 91–99, https://doi.org/10.1061/(ASCE)1084-0699(2001)6:2(91), 2001. a
Fossa Riglos, M. F., Díaz, L. B., Hernández, V., Sörensson, A. A., Osman, M., Rivera, J., Robledo, F., and Prudente, C.: Climate storylines as a tool for interdisciplinary dialogue on risk decision-making: Analyzing a severe drought in southeastern South America, Environ. Sci. Policy, 160, 103848, https://doi.org/10.1016/j.envsci.2024.103848, 2024. a
Furber, A., Medema, W., Adamowski, J., Clamen, M., and Vijay, M.: Conflict Management in Participatory Approaches to Water Management: A Case Study of Lake Ontario and the St. Lawrence River Regulation, Water, 8, 280, https://doi.org/10.3390/w8070280, 2016. a, b
Fyfe, J. C., Derksen, C., Mudryk, L., Flato, G. M., Santer, B. D., Swart, N. C., Molotch, N. P., Zhang, X., Wan, H., Arora, V. K., Scinocca, J., and Jiao, Y.: Large near-term projected snowpack loss over the western United States, Nat. Commun., 8, 14996, https://doi.org/10.1038/ncomms14996, 2017. a
Gennaretti, F., Sangelantoni, L., and Grenier, P.: Toward daily climate scenarios for Canadian Arctic coastal zones with more realistic temperature-precipitation interdependence, J. Geophys. Res.-Atmos., 120, 11862–11877, https://doi.org/10.1002/2015JD023890, 2015. a
Gessner, C., Fischer, E. M., Beyerle, U., and Knutti, R.: Multi-year drought storylines for Europe and North America from an iteratively perturbed global climate model, Weather and Climate Extremes, 38, 100512, https://doi.org/10.1016/j.wace.2022.100512, 2022. a, b
Government of Quebec: Stratégie québécoise d'économie d'eau potable – Horizon 2019-2025, Government report, Government of Quebec, Quebec City (QC), Canada, 2019. a
Grenier, P., Firlej, A., Blondlot, A., Logan, T., and Ricard, M.-P.: The issue of properly ordering climate indices calculation and bias correction before identifying spatial analogs for agricultural applications, Climate Services, 16, 100122, https://doi.org/10.1016/j.cliser.2019.100122, 2019. a
Hazeleger, W., van den Hurk, B., Min, E., van Oldenborgh, G., Petersen, A., Stainforth, D., Vasileiadou, E., and Smith, L.: Tales of future weather, Nat. Clim. Change, 5, 107–113, https://doi.org/10.1038/nclimate2450, 2015. a
Houle, D., Lajoie, G., and Duchesne, L.: Major losses of nutrients following a severe drought in a boreal forest, Nature Plants, 2, 16187, https://doi.org/10.1038/nplants.2016.187, 2016. a
Hudon, C., Gagnon, P., Poirier Larabie, S., Gagnon, C., Lajeunesse, A., Lachapelle, M., and Quilliam, M.: Spatial and temporal variations of a saxitoxin analogue (LWTX-1) in Lyngbya wollei (Cyanobacteria) mats in the St. Lawrence River (Québec, Canada), Harmful Algae, 57, 69–77, https://doi.org/10.1016/j.hal.2016.06.001, 2016. a
Hutchinson, M. F., McKenney, D. W., Lawrence, K., Pedlar, J. H., Hopkinson, R. F., Milewska, E., and Papadopol, P.: Development and Testing of Canada-Wide Interpolated Spatial Models of Daily Minimum–Maximum Temperature and Precipitation for 1961–2003, J. Appl. Meteorol. Climatol., 48, 725–741, https://doi.org/10.1175/2008jamc1979.1, 2009. a
Institut de la Statistique du Québec: Mise à jour 2022 des perspectives démographiques du Québec et de ses régions, 2021-2066, Bulletin sociodémographique, 26, 1–11, 2022. a
Ismail, H., Rowshon, M. K., Shanono, N. J., Nasidi, N. M., and Umar, D. A.: Hydrological Modelling For Evaluating Climate Change Impacts On Streamflow Regime In The Bernam River Basin Malaysia, FUDMA J. Sci., 5, 219–230, https://doi.org/10.33003/fjs-2021-0503-707, 2021. a
Kinnard, C., Bzeouich, G., and Assani, A.: Impacts of summer and winter conditions on summer river low flows in low elevation, snow-affected catchments, J. Hydrol., 605, 127393, https://doi.org/10.1016/j.jhydrol.2021.127393, 2022. a, b, c, d
Knowles, N., Scott, D., and Steiger, R.: Sustainability of snowmaking as climate change (mal)adaptation: an assessment of water, energy, and emissions in Canada’s ski industry, Current Issues in Tourism, 27, 1613–1630, https://doi.org/10.1080/13683500.2023.2214358, 2023. a, b
Kovach, R. P., Dunham, J. B., Al-Chokhachy, R., Snyder, C. D., Letcher, B. H., Young, J. A., Beever, E. A., Pederson, G. T., Lynch, A. J., Hitt, N. P., Konrad, C. P., Jaeger, K. L., Rea, A. H., Sepulveda, A. J., Lambert, P. M., Stoker, J., Giersch, J. J., and Muhlfeld, C. C.: An Integrated Framework for Ecological Drought across Riverscapes of North America, BioScience, 69, 418–431, https://doi.org/10.1093/biosci/biz040, 2019. a, b
Lachance-Cloutier, S., Turcotte, R., and Cyr, J.-F.: Combining streamflow observations and hydrologic simulations for the retrospective estimation of daily streamflow for ungauged rivers in southern Quebec (Canada), J. Hydrol., 550, 294–306, https://doi.org/10.1016/j.jhydrol.2017.05.011, 2017. a
Larocque, M., Meyzonnat, G., Ouellet, M. A., Graveline, M. H., Gagné, S., Barnetche, D., and Dorner, S.: Projet de connaissance des eaux souterraines de la zone de Vaudreuil-Soulanges - Rapport scientifique, Government report, Government of Quebec (MELCCFP), Quebec City (QC), Canada, 2015. a
Lavoie, J., Caron, L.-P., Logan, T., and Barrow, E.: Canadian climate data portals: A comparative analysis from a user perspective, Climate Services, 34, 100471, https://doi.org/10.1016/j.cliser.2024.100471, 2024. a
Leduc, M., Mailhot, A., Frigon, A., Martel, J.-L., Ludwig, R., Brietzke, G. B., Giguère, M., Brissette, F., Turcotte, R., Braun, M., and Scinocca, J.: The ClimEx Project: A 50-Member Ensemble of Climate Change Projections at 12-km Resolution over Europe and Northeastern North America with the Canadian Regional Climate Model (CRCM5), J. Appl. Meteorol. Climatol., 58, 663–693, https://doi.org/10.1175/JAMC-D-18-0021.1, 2019. a, b, c
Lee, J.-Y., Marotzke, J., Bala, G., Cao, L., Corti, S., Dunne, J., Engelbrecht, F., Fischer, E., Fyfe, J., Jones, C., Maycock, A., Mutemi, J., Ndiaye, O., Panickal, S., and Zhou, T.: Future Global Climate: Scenario-Based Projections and Near-Term Information, in: Climate Change 2021: The Physical Science Basis. Contribution of Working Group I to the Sixth Assessment Report of the Intergovernmental Panel on Climate Change, edited by: Masson-Delmotte, V., Zhai, P., Pirani, A., Connors, S. L., Péan, C., Berger, S., Caud, N., Chen, Y., Goldfarb, L., Gomis, M. I., Huang, M., Leitzell, K., Lonnoy, E., Matthews, J. B. R., Maycock, T. K., Waterfield, T., Yelekçi, O., Yu, R., and Zhou, B., 553–672, Cambridge University Press, Cambridge, United Kingdom and New York, NY, USA, https://doi.org/10.1017/9781009157896.006, 2021. a, b, c, d
Leveque, B., Burnet, J.-B., Dorner, S., and Bichai, F.: Impact of climate change on the vulnerability of drinking water intakes in a northern region, Sustain. Cities Soc., 66, 102656, https://doi.org/10.1016/j.scs.2020.102656, 2021. a, b
Liao, Z., An, N., Chen, Y., and Zhai, P.: On the possibility of the 2022-like spatio-temporally compounding event across the Yangtze River Valley, Environ. Res. Lett., 19, 014063, https://doi.org/10.1088/1748-9326/ad178e, 2024. a, b
Martynov, A., Laprise, R., Sushama, L., Winger, K., Šeparović, L., and Dugas, B.: Reanalysis-driven climate simulation over CORDEX North America domain using the Canadian Regional Climate Model, version 5: model performance evaluation, Clim. Dynam., 41, 2973–3005, https://doi.org/10.1007/s00382-013-1778-9, 2013. a
Matte, D., Christensen, J. H., Feddersen, H., Vedel, H., Nielsen, N. W., Pedersen, R. A., and Zeitzen, R. M. K.: On the Potentials and Limitations of Attributing a Small‐Scale Climate Event, Geophys. Res. Lett., 49, e2022GL099481, https://doi.org/10.1029/2022gl099481, 2022. a, b
McGuinness, J. L. and Bordne, E. F.: A comparison of lysimeter-derived potential evapotranspiration with computed values, Government report, Agricultural Research Service and Ohio Agricultural Research and Development Center, 1972. a, b
McKee, T. B., Doesken, N. J., and Kleist, J.: The relationship of drought frequency and duration to time scales, in: Eighth Conference on Applied Climatology, Anaheim, California, 1993. a, b, c
Mehdi, B., Lehner, B., Gombault, C., Michaud, A., Beaudin, I., Sottile, M.-F., and Blondlot, A.: Simulated impacts of climate change and agricultural land use change on surface water quality with and without adaptation management strategies, Agriculture, Ecosystems and Environment, 213, 47–60, https://doi.org/10.1016/j.agee.2015.07.019, 2015. a, b
Mejia, F. H., Ouellet, V., Briggs, M. A., Carlson, S. M., Casas‐Mulet, R., Chapman, M., Collins, M. J., Dugdale, S. J., Ebersole, J. L., Frechette, D. M., Fullerton, A. H., Gillis, C., Johnson, Z. C., Kelleher, C., Kurylyk, B. L., Lave, R., Letcher, B. H., Myrvold, K. M., Nadeau, T., Neville, H., Piégay, H., Smith, K. A., Tonolla, D., and Torgersen, C. E.: Closing the gap between science and management of cold‐water refuges in rivers and streams, Glob. Change Biol., 29, 5482–5508, https://doi.org/10.1111/gcb.16844, 2023. a
MELCCFP: Stratégie québécoise de l’eau 2018-2030, Government report, Government of Quebec, 2018. a
MELCCFP: Guide de l'Atlas hydroclimatique du Québec méridional, Government report, Direction principale de l'expertise hydrique (DPEH), Ministère de l'Environnement, de la Lutte contre les changements climatiques, de la Faune et des Parcs (MELCCFP), Government of Quebec, Quebec City (QC), Canada, 2022a. a
MELCCFP: Hydroclimatic Atlas of Southern Quebec - 2022 Edition [data set], https://www.cehq.gouv.qc.ca/atlas-hydroclimatique/ (last access: 1 February 2025), 2022b. a, b
MELCCFP: Rapport technique de l’Atlas hydroclimatique du Québec méridional, Government report, Direction principale de l'expertise hydrique (DPEH), Ministère de l'Environnement, de la Lutte contre les changements climatiques, de la Faune et des Parcs (MELCCFP), Government of Quebec, Quebec City (QC), Canada, 2024. a, b, c, d
Morales-Marín, L., Rokaya, P., Sanyal, P., Sereda, J., and Lindenschmidt, K.: Changes in streamflow and water temperature affect fish habitat in the Athabasca River basin in the context of climate change, Ecol. Model., 407, 108718, https://doi.org/10.1016/j.ecolmodel.2019.108718, 2019. a, b
Muñoz-Sabater, J., Dutra, E., Agustí-Panareda, A., Albergel, C., Arduini, G., Balsamo, G., Boussetta, S., Choulga, M., Harrigan, S., Hersbach, H., Martens, B., Miralles, D. G., Piles, M., Rodríguez-Fernández, N. J., Zsoter, E., Buontempo, C., and Thépaut, J.-N.: ERA5-Land: a state-of-the-art global reanalysis dataset for land applications, Earth Syst. Sci. Data, 13, 4349–4383, https://doi.org/10.5194/essd-13-4349-2021, 2021. a
Mudryk, L. R., Derksen, C., Howell, S., Laliberté, F., Thackeray, C., Sospedra-Alfonso, R., Vionnet, V., Kushner, P. J., and Brown, R.: Canadian snow and sea ice: historical trends and projections, The Cryosphere, 12, 1157–1176, https://doi.org/10.5194/tc-12-1157-2018, 2018. a
Nand, V. and Qi, Z.: Potential of implementing irrigation in rainfed agriculture in Quebec: A review of climate change‐induced challenges and adaptation strategies, Irrig. Drain., 72, 1165–1187, https://doi.org/10.1002/ird.2840, 2023. a, b, c, d, e, f, g, h
Ontario Ministry of Natural Resources, Ontario Ministry of the Environment, Ontario Ministry of Agriculture, Food and Rural Affairs, Ontario Ministry of Municipal Affairs and Housing, Ontario Ministry of Research and Innovation, Association of Municipalities of Ontario, and Conservation Ontario: Ontario Low Water Response, Tech. rep., Government of Ontario, Toronto (ON), Canada, 2010. a, b
Osman, A.: Water use conflict: A characterization and water quantity study in an agriculturally stressed subcatchment in southwestern Ontario, Master's thesis, University of Guelph, 2018. a, b
Ouranos and Centre de Recherche Informatique de Montréal (CRIM): The ClimEx CRCM5 Large Ensemble, Power Analytics and Visualization for Climate Science (PAVICS) platform [data set], https://pavics.ouranos.ca/datasets.html#a (last access: 23 January 2023), 2023. a
Palmer, W. C.: Meteorological Drought, Government report, Office of Climatology, U.S. Weather Bureau, Washington, D.C., 1965. a
Parisi, A., Monno, V., and Fidelibus, M.: Cascading vulnerability scenarios in the management of groundwater depletion and salinization in semi-arid areas, Int. J. Disast. Risk Re., 30, 292–305, https://doi.org/10.1016/j.ijdrr.2018.03.004, 2018. a
Plourde-Lavoie, P., Archer, M., Gagnon, K., and Sirois, P.: Les variations de niveau du lac Saint-Jean: effets sur la reproduction des poissons dans les habitats en milieux humides riverains, Milieux aquatiques, 142, 66–77, https://doi.org/10.7202/1042015ar, 2017. a, b
Riahi, K., Rao, S., Krey, V., Cho, C., Chirkov, V., Fischer, G., Kindermann, G., Nakicenovic, N., and Rafaj, P.: RCP 8.5 – A scenario of comparatively high greenhouse gas emissions, Clim. Change, 109, 33–57, https://doi.org/10.1007/s10584-011-0149-y, 2011. a
Roy, P., Rondeau-Genesse, G., Jalbert, J., and Élyse Fournier: Climate scenarios of extreme precipitation using a combination of parametric and non-parametric bias correction methods in the province of Québec, Can. Water Resour. J., 49, 23–39, https://doi.org/10.1080/07011784.2023.2220682, 2023. a
Schaller, N., Sillmann, J., Müller, M., Haarsma, R., Hazeleger, W., Hegdahl, T. J., Kelder, T., van den Oord, G., Weerts, A., and Whan, K.: The role of spatial and temporal model resolution in a flood event storyline approach in western Norway, Weather and Climate Extremes, 29, 100259, https://doi.org/10.1016/j.wace.2020.100259, 2020. a
Shepherd, T. G.: Storyline approach to the construction of regional climate change information, P. Roy. Soc. A, 475, 20190013, https://doi.org/10.1098/rspa.2019.0013, 2019. a
Shepherd, T. G., Boyd, E., Calel, R. A., Chapman, S. C., Dessai, S., Dima-West, I. M., Fowler, H. J., James, R., Maraun, D., Martius, O., Senior, C. A., Sobel, A. H., Stainforth, D. A., Tett, S. F. B., Trenberth, K. E., van den Hurk, B. J. J. M., Watkins, N. W., Wilby, R. L., and Zenghelis, D. A.: Storylines: an alternative approach to representing uncertainty in physical aspects of climate change, Clim. Change, 151, 555–571, https://doi.org/10.1007/s10584-018-2317-9, 2018. a
Sillmann, J., Shepherd, T. G., van den Hurk, B., Hazeleger, W., Martius, O., Slingo, J., and Zscheischler, J.: Event‐Based Storylines to Address Climate Risk, Earth’s Future, 9, e2020EF001783, https://doi.org/10.1029/2020ef001783, 2021. a
Solaraju-Murali, B., Caron, L.-P., Gonzalez-Reviriego, N., and Doblas-Reyes, F. J.: Multi-year prediction of European summer drought conditions for the agricultural sector, Environ. Res. Lett., 14, 124014, https://doi.org/10.1088/1748-9326/ab5043, 2019. a
Solaraju-Murali, B., Gonzalez-Reviriego, N., Caron, L.-P., Ceglar, A., Toreti, A., Zampieri, M., Bretonnière, P.-A., Samsó Cabré, M., and Doblas-Reyes, F. J.: Multi-annual prediction of drought and heat stress to support decision making in the wheat sector, npj Climate and Atmospheric Science, 4, 34, https://doi.org/10.1038/s41612-021-00189-4, 2021. a
Stagge, J. H., Tallaksen, L. M., Gudmundsson, L., Van Loon, A. F., and Stahl, K.: Candidate Distributions for Climatological Drought Indices (SPI and SPEI), Int. J. Climatol., 35, 4027–4040, https://doi.org/10.1002/joc.4267, 2015. a, b
Staudinger, M., Stahl, K., and Seibert, J.: A drought index accounting for snow, Water Resour. Res., 50, 7861–7872, https://doi.org/10.1002/2013WR015143, 2014. a
Tam, B. Y., Szeto, K., Bonsal, B., Flato, G., Cannon, A. J., and Rong, R.: CMIP5 drought projections in Canada based on the Standardized Precipitation Evapotranspiration Index, Can. Water Resour. J., 44, 90–107, https://doi.org/10.1080/07011784.2018.1537812, 2019. a
Tam, B. Y., Cannon, A. J., and Bonsal, B. R.: Standardized precipitation evapotranspiration index (SPEI) for Canada: assessment of probability distributions, Can. Water Resour. J., 48, 283–299, https://doi.org/10.1080/07011784.2023.2183143, 2023. a, b
Tanguy, M., Prudhomme, C., Smith, K., and Hannaford, J.: Historical gridded reconstruction of potential evapotranspiration for the UK, Earth Syst. Sci. Data, 10, 951–968, https://doi.org/10.5194/essd-10-951-2018, 2018. a
Thackeray, C. W., Derksen, C., Fletcher, C. G., and Hall, A.: Snow and Climate: Feedbacks, Drivers, and Indices of Change, Current Climate Change Reports, 5, 322–333, https://doi.org/10.1007/s40641-019-00143-w, 2019. a
van der Wiel, K., Lenderink, G., and de Vries, H.: Physical storylines of future European drought events like 2018 based on ensemble climate modelling, Weather and Climate Extremes, 33, 100350, https://doi.org/10.1016/j.wace.2021.100350, 2021. a, b, c, d, e, f, g
Van Loon, A. F. and Van Lanen, H. A. J.: A process-based typology of hydrological drought, Hydrol. Earth Syst. Sci., 16, 1915–1946, https://doi.org/10.5194/hess-16-1915-2012, 2012. a
Van Loon, A. F., Ploum, S. W., Parajka, J., Fleig, A. K., Garnier, E., Laaha, G., and Van Lanen, H. A. J.: Hydrological drought types in cold climates: quantitative analysis of causing factors and qualitative survey of impacts, Hydrol. Earth Syst. Sci., 19, 1993–2016, https://doi.org/10.5194/hess-19-1993-2015, 2015. a, b
Vicente-Serrano, S. M., Beguería, S., and López-Moreno, J. I.: A Multiscalar Drought Index Sensitive to Global Warming: The Standardized Precipitation Evapotranspiration Index, J. Climate, 23, 1696–1718, https://doi.org/10.1175/2009JCLI2909.1, 2010. a, b
Wheaton, E. and Kulshreshtha, S.: Environmental Sustainability of Agriculture Stressed by Changing Extremes of Drought and Excess Moisture: A Conceptual Review, Sustainability, 9, 970, https://doi.org/10.3390/su9060970, 2017. a, b
Šeparović, L., Alexandru, A., Laprise, R., Martynov, A., Sushama, L., Winger, K., Tete, K., and Valin, M.: Present climate and climate change over North America as simulated by the fifth-generation Canadian regional climate model, Clim. Dynam., 41, 3167–3201, https://doi.org/10.1007/s00382-013-1737-5, 2013. a