the Creative Commons Attribution 4.0 License.
the Creative Commons Attribution 4.0 License.
 | 30 Sep 2025
Linking woody plants, climate, and evapotranspiration in a temperate savanna
Bradford P. Wilcox
Sorin C. Popescu
Evapotranspiration is the dominant pathway by which water returns from land surfaces and vegetation to the atmosphere in many semiarid and subhumid regions. In this study, we integrated satellite-based estimates of evapotranspiration with climate, runoff, and woody-vegetation data to evaluate how changes in precipitation, air temperature, and canopy cover jointly influence water loss in a temperate savanna that spans both semiarid and subhumid climates. Our validation at the subbasin scale showed that modeled evapotranspiration agreed moderately well with water-balance estimates (coefficient of determination ≈ 0.65, bias −7 mm per water year, and root mean square error 103 mm per water year). Across the region, annual evapotranspiration totals generally reached about 90 % of precipitation, indicating an ecosystem strongly driven by atmospheric water demand. In dry years, water loss occasionally exceeded rainfall, highlighting a heightened sensitivity to soil moisture shortages and extreme heat. Areas with high woody-canopy cover consistently exhibited higher evapotranspiration and lower net water surplus. Notably, where canopy cover exceeded 80 % in the driest portions of the study area, the soil water surplus turned negative over multiple years. These findings underscore the potential for expanding woody cover to limit groundwater recharge and reduce overall water availability, especially under warming and more variable precipitation regimes. Future work could explore fine-scale, long-term impacts of woody plant density and targeted management strategies that optimize trade-offs among vegetation growth, ecosystem health, and water resources.
- Article
(6474 KB) - Full-text XML
- BibTeX
- EndNote


Evapotranspiration (ET) is the principal flux returning water from the Earth's surface to the atmosphere, with estimates suggesting that 62 000–75 000 km3 of water cycles back annually (Abbott et al., 2019). This process accounts for more than 60 % of global precipitation (Oki and Kanae, 2006). Because the difference between precipitation (P) and ET is commonly used to evaluate water availability at catchment and basin scales (Falkenmark et al., 1989), accurately quantifying ET and identifying its key drivers are critical for effective water resource management and ecosystem protection.
Climatic factors – air temperature (Ta) and precipitation – are typically regarded as the main drivers of ET (Dai et al., 2018). Rising air temperatures have increased atmospheric moisture demand worldwide, manifesting as upward trends in potential evapotranspiration (PET) – the theoretical maximum ET assuming no water limitation (Feng and Fu, 2013; Fu et al., 2022; Scheff and Frierson, 2014; Zhao and Dai, 2015; Dai et al., 2018). Unlike PET, which ignores water constraints, measured ET is closely coupled with P, generally displaying a positive correlation (Stocker et al., 2013). However, the strength of this coupling varies across regions, climates, and timescales. In contrast, Ta and ET exhibit a weaker relationship overall. Although they are more strongly correlated in humid areas, they may decouple and even show negative correlation under arid conditions during extreme heat events (Yuan et al., 2019; Alessi et al., 2022; Berg and Sheffield, 2018).
In addition to climatic factors, ecosystem structure – particularly changes in woody vegetation – can significantly alter ET rates. Numerous studies in the United States document how woody plant encroachment (WPE), defined as the expansion of native trees and shrubs into grass-dominated systems such as grasslands and open-canopy savannas (Acharya et al., 2018), modifies ET. In Texas, Dugas et al. (1998) and Afinowicz et al. (2005) observed ET decreases of 31.9 and 110 mm yr−1, respectively, following the removal of Juniperus ashei. Dugas et al. (1998) further noted that these decreases persisted for only 2 years, after which the effect diminished. By contrast, in Oklahoma, Wang et al. (2018) reported a 45 % increase in mean annual ET in a former grassland region after its conversion to Juniperus spp.-dominated woodlands, and Qiao et al. (2015) showed that average ET rates in Juniperus virginiana woodlands were 100 mm yr−1 higher than those in neighboring grasslands. Similar patterns appear farther west, in a riparian area in Arizona, where Prosopis velutina woodlands exhibited an ET rate of 692 mm yr−1, compared with 548 mm yr−1 for an adjacent grassland (Scott et al., 2014).
The Post Oak Savannah ecoregion of east-central Texas presents a particularly compelling set of conditions for a case study examining how climate and woody vegetation jointly influence ET. Over the past 150 years, anthropogenic reshaping of this landscape has resulted in a mosaic of grasslands, savannas, and densely wooded thickets (Campbell, 1925; Tharp, 1926; McBride, 1933; Parmalee, 1955; Garza and Blackburn, 1985; Midwood et al., 1998; Griffith et al., 2007; Stambaugh et al., 2014). Recent remote sensing studies by Olariu et al. (2024) revealed that between 1996 and 2022, ca. 9.7 % (5338 km2) of the Post Oak Savannah underwent WPE, converting grassland and open-canopy savanna into woodland, while another ca. 6.8 % (4504 km2) experienced “thicketization”, marked by proliferating sub-canopy woody plants in established woodlands. At the same time, some 5.7 % showed the opposite trend, transitioning from woodlands to more open savanna or grasslands. Superimposed on these rapid land-cover changes are pronounced east–west gradients in precipitation (850–1250 mm yr−1) and air temperature (18–22 °C), with drier, hotter conditions in the southwest and cooler, wetter conditions in the northeast (Schmidly, 2002). These dynamic biophysical conditions underscore the importance of studying how changing vegetation structure and climate interact to shape ET across this region.
Shifts in ecology and biodiversity associated with thicketization in oak savanna systems have been thoroughly examined (Brudvig and Asbjornsen, 2009; Brudvig, 2010; Zirbel et al., 2017). However, the hydrological implications of WPE in these water-limited ecosystems remain comparatively understudied. Because ET is generally the dominant component of the water budget (Condon et al., 2020; Reitz et al., 2017; Seager and Vecchi, 2010), an increase in woody cover could substantially alter water cycling. Indeed, a recent study in the Post Oak Savannah by Basant et al. (2023) found that thicketization markedly reduced deep drainage and, in some cases, halted groundwater recharge altogether. Meanwhile, woodlands that had not undergone thicketization still experienced recharge, but at much lower rates than non-thicketized areas. Although these findings strongly suggest that ET increases in response to woody plant proliferation, this hypothesis remains unquantified – creating a clear knowledge gap regarding how WPE affects water resources in oak savanna ecosystems.
To address this knowledge gap, the present study integrates remote sensing and hydrological modeling approaches to characterize ET dynamics across the Post Oak Savannah between 2008 and 2023. We employ MOD16A2GF C6.1, hereafter referred to as MOD16 – the gap-filled, 8 d net ET dataset – along with water-balance estimates to validate and refine ET measurements at multiple temporal scales. By combining these satellite-derived products with spatially explicit woody plant metrics and climate data, we aim to determine how variations in vegetation structure and environmental conditions influence ET. Accordingly, this study pursues four primary objectives: (1) evaluate MOD16 in the Post Oak Savannah by comparing satellite-derived ET data against water-balance estimates, thereby establishing the accuracy of MOD16 for regional-scale analyses; (2) examine monthly and seasonal variations in ET, gaining insight into short-term and interannual changes; (3) analyze the relationship between woody plant metrics (canopy cover and canopy height), climatic factors (precipitation and air temperature), and ET at the water-year (wyr) scale – using both linear regression and generalized additive models (GAM) – to quantify how shifts in vegetation composition and climatic drivers affect ET rates; and (4) evaluate evapotranspiration–precipitation ratios (ET P) and calculate excess water (precipitation minus evapotranspiration, P–ET) across the region at the water-year scale to provide a broader assessment of water availability under varying woody cover and climatic conditions. By integrating a robust remote sensing framework with field-based validation and detailed ecological data, this study aims to enhance our understanding of how climate and WPE jointly influence water cycling in the Post Oak Savannah.
2.1 Study site
The Post Oak Savannah ecoregion in east-central Texas covers over 55 000 km2 and spans 31 counties, with its western boundary encompassing much of the Carrizo–Wilcox Aquifer (Fig. 1A). Historically, this region supported an open-canopy savanna characterized by diverse grasses and forbs interspersed with stands of post oak (Quercus stellata) and blackjack oak (Quercus marilandica) (Wasowski and Wasowski, 1988). Positioned between the East Texas Piney Woods – dominated by dense evergreen forests – and the Central Texas Blackland Prairie – characterized by black, calcareous, alkaline, clay-rich soils – this landscape functions as an ecological transition zone (Diggs et al., 1999; Schmidly, 2002).
During the study period (2008–2023), both precipitation and air temperature displayed pronounced spatial variability, with annual precipitation ranging from approximately 1400 mm in the northeastern portion of the ecoregion to about 600 mm in the southwest (Fig. 1b). Mean annual air temperature exhibited a similar gradient, decreasing from roughly 22 °C in the northeast to 17 °C in the southwest (Fig. 1d). Canopy cover over this interval showed substantial fragmentation, with densely wooded stands interspersed among open, grass-dominated areas (Fig. 1e). In contrast, the southern portion exhibited a more continuous mosaic of cover types, with less abrupt transitions between wooded and non-wooded patches (Fig. 1e).
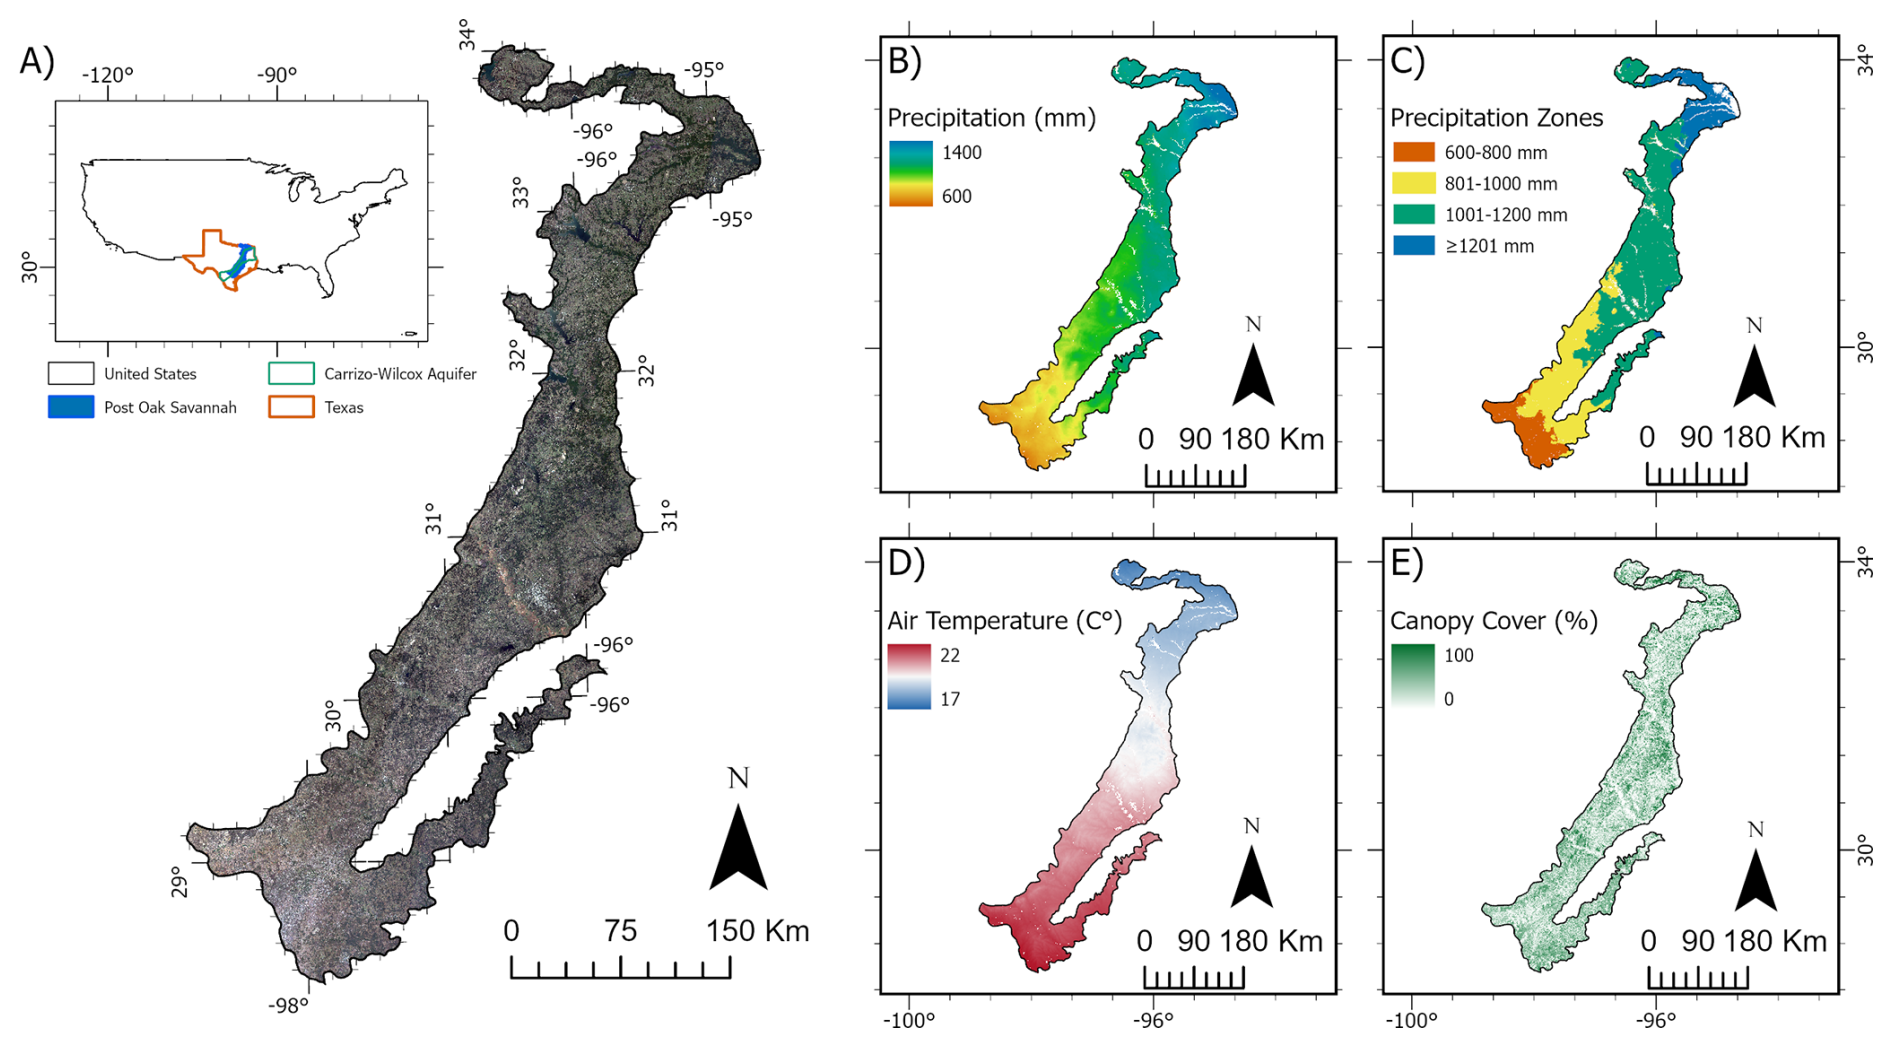
Figure 1Overview of the Post Oak Savannah ecoregion in east-central Texas. Panel (a) places the ecoregion within the conterminous United States, highlights Texas and the Carrizo–Wilcox Aquifer, and overlays a 2023 true-color Landsat 8 OLI mosaic. Panels (b) and (c) draw on the 2008–2023 Daymet V4 daily precipitation record: panel (b) maps mean annual precipitation (MAP, mm yr−1), calculated as the multi-year average of the annual sums of daily totals, and panel (c) reclassifies that MAP surface into four precipitation zones (600–800, 801–1000, 1001–1200, and ≥ 1201 mm). Panel (d) depicts mean annual air temperature (MAT, °C) for the same period, derived from Daymet V4 by averaging daily maximum and minimum air temperatures [] and then averaging those daily means across 2008–2023. Panel (e) presents fractional canopy cover (%) at 30 m resolution from the Rangeland Analysis Platform V4, averaged over the identical 2008–2023 window. Specifying these data sources, periods, and processing steps allows the caption to be interpreted independently of the main text.
2.2 Data and preprocessing
2.2.1 Evapotranspiration data
In this study, we used the MOD16 Collection 6.1 terrestrial ecosystem ET dataset (Running et al., 2021), which is based on a modified Penman–Monteith formulation (Mu et al., 2007; Mu et al., 2011). It provides 8 d cumulative ET estimates for the global land surface at a 500 m spatial resolution (units: mm). This ET product has been widely employed in global ET modeling (Kim et al., 2012; Ershadi et al., 2015; Ramoelo et al., 2014; Trambauer et al., 2014; Velpuri et al., 2013), showing variable performance upon validation but generally stronger accuracy in North America (Velpuri et al., 2013; Zhang et al., 2019). Developed using meteorological data from NASA's Global Modeling and Assimilation Office (GMAO) and various MODIS-based inputs (e.g., LAI, FPAR, albedo) (Mu et al., 2011), Version 6.1 offers notable improvements in areas affected by clouds and/or aerosol contamination. Specifically, it employs a year-end gap-filling technique in which 8 d intervals lacking reliable FPAR/LAI data are replaced with the average of the best available FPAR/LAI for that vegetation pixel over the preceding 5 years.
A quality control workflow was implemented to exclude bad pixels from the analysis. Pixels produced solely by the MOD16 backup algorithm were masked and removed. Additionally, because MODIS employs its own confidence quality score assessment, only pixels with scores of 0 and 1 – indicating good and usable data – were retained, while all others were discarded. Finally, we used the MCD12Q1.061 MODIS Land Cover Type Yearly Global 500 m Land Cover Type 1: Annual IGBP classification system to mask pixels classified as Water Bodies, Barren, Cropland, or Cropland/Natural Vegetation Mosaic. These were excluded from the analysis because of the lack of natural vegetation and the influence of artificial watering on the results.
2.2.2 Air temperature and precipitation data
The air temperature and precipitation products used in this study were obtained from the Daymet V4 model, developed by Oak Ridge National Laboratory and supported by NASA through the Earth Science Data and Information System (Thornton et al., 2022a). Daymet provides long-term, continuous, gridded estimates of daily climate variables at a 1 km resolution by interpolating and extrapolating ground-based observations via statistical modeling techniques. It has been widely utilized in ecological, hydrological, and agricultural studies (Akinsanola et al., 2024; Dey et al., 2024; Bhat et al., 2024; Zahura et al., 2024; Bennemann et al., 2023). Because Daymet provides daily minimum and maximum air temperatures, we calculated the simple mean for each day to derive the average daily air temperature.
2.2.3 Woody plant metric data
Two primary metrics were used to characterize woody vegetation in this study: canopy cover and canopy height. The canopy cover data originated from Version 3 of the Rangeland Analysis Platform (RAP) (Allred et al., 2020), developed by the University of Montana in partnership with the U.S. Department of Agriculture (USDA). This dataset combines tree and shrub cover to capture the full spectrum of woody plants influencing ET (Allred et al., 2021). The RAP cover estimates integrate information from 75 000 field plots and the historical Landsat record. Through cloud computing and temporal convolutional networks, annual predictions are generated at a 30 m resolution across the United States. Validation against approximately 7500 field plots yielded mean absolute errors (MAEs) of ± 6.2 % and ± 2.6 % for shrubs and trees, respectively, and root mean square errors (RMSEs) of ± 8.8 % and ± 6.7 % for shrubs and trees, respectively. While RAP has primarily been applied in agricultural contexts (Hudson et al., 2021; Morford et al., 2022; Subhashree et al., 2023; Retallack et al., 2023), it has also demonstrated utility in ecological studies (Olariu et al., 2024).
Canopy height data were drawn from two sources: Potapov et al. (2021a), which provides 2019 estimates, and Malambo and Popescu (2024a), which supplies 2020 estimates. Potapov et al. (2021a) produced a 30 m canopy height model (CHM) by extrapolating canopy height measurements from Global Ecosystem Dynamics Investigation (GEDI) footprints to analysis-ready Landsat data, using a bagged regression tree ensemble method (Breiman, 2001). When validated against airborne lidar, the CHM displayed an RMSE of 9.07 m, an MAE of 6.36 m, and an R2 of 0.61, performing particularly well for taller trees (≥ 10 m). This dataset has largely been employed to quantify stocking rates and biomass for ecological research (Ali and Rahman, 2025; Potapov et al., 2021a; Hawker et al., 2022). In contrast, Malambo and Popescu (2024a) integrated ICESat-2 (Ice, Cloud, and Land Elevation Satellite-2) with ancillary Landsat, LANDFIRE, and topographic variables to produce a 30 m canopy height product. Validation against airborne lidar (R2 = 0.72, MAE = 3.9 m) revealed higher accuracy in densely forested environments – such as mangroves, coniferous forests, or mixed broadleaf forests – than in sparsely vegetated regions like deserts and chaparral. Although relatively new, this product has already been applied to hurricane-impact studies in mangrove ecosystems (Roy et al., 2025) and other remote sensing research (Guo et al., 2024; Guenther et al., 2024).
2.2.4 Runoff data
The runoff data used for the water-balance ET (WBET) calculations were obtained from USGS WaterWatch (http://waterwatch.usgs.gov, last access: 12 February 2025; U.S. Geological Survey, 2025), a platform that provides streamgage-based maps for over 3000 long-term (30 years or more) USGS streamgages. Runoff was calculated at the water-year scale for each HUC8 subbasin by dividing the average daily flow for the water year by the drainage basin area, and it was assumed to be uniform across the entire basin.
2.2.5 Stacking and aggregation
All projection, resampling, and aggregation for this study were performed on the Google Earth Engine (GEE) platform (Gorelick et al., 2017). To align the various datasets, each was projected to the EPSG:3857 (Spherical/Web Mercator) coordinate system, clipped to the Post Oak Savannah boundary (US EPA Level-3 ecoregion), and resampled using the 500 m MOD16 grid (Omernik and Griffith, 2014).
To maintain consistency with the ET product, both canopy-cover and canopy-height datasets were resampled from 30 to 500 m via mean resampling, which preserved the continuous nature of the data (Blan and Butler, 1999). By contrast, Daymet data were resampled from 1 km to 500 m using the nearest-neighbor method to retain the original values (Brandsma and Können, 2006).
Once aligned and resampled, the datasets were aggregated to monthly scales, water-year scales (1 October to 30 September), and overall averages for the entire study period. For instance, Water 2009 encompasses data from 1 October 2008 through 30 September 2009. This water-year approach was chosen in lieu of the standard calendar year (1 January to 31 December) to better capture the lagged effects of the region's precipitation patterns – rainier fall and spring seasons and drier summers – on vegetation and water balance (Null and Viers, 2013; He et al., 2021; Papacharalampous and Tyralis, 2020). Specifically, the 8 d, 500 m MOD16 ET product was aggregated to monthly (January 2008–December 2023) and water-year (2009–2023) scales. Pixels that had been masked during any portion of a particular month or water year were given a null value and excluded from analysis. The daily, 500 m Daymet V4 precipitation dataset was aggregated to both monthly and water-year intervals, whereas air temperature was aggregated only to the water-year scale. Precipitation data were further averaged across the entire study period and then grouped into 200 mm precipitation zones (600–800, 801–1000, 1001–1200, and ≥ 1201 mm) to assess the influence of varying aridity (Fig. 1c). To align the annual canopy cover and canopy height metrics with the ET data, each year's canopy values were matched to the corresponding water year's ET (e.g., canopy cover for 2012 was compared with ET from water year 2012), ensuring that 9 of the 12 months overlapped. Lastly, the canopy cover dataset was also aggregated into an overall average spanning the study period for use in monthly analyses and the excess water analysis.
Finally, to enhance our understanding of water use and cycling in areas of increasing woody vegetation density, canopy cover was stratified into six classes: 0 %–10 %, 11 %–20 %, 21 %–40 %, 41 %–60 %, 61 %–80 %, and ≥ 81 %. These distinctions were informed by an extensive literature review encompassing a wide range of ecological and hydrological considerations. Numerous studies identify 10 % canopy cover as the upper threshold for grasslands in temperate climates (Dixon et al., 2014; Plappert et al., 2024; Hu, 2024). By contrast, savanna systems typically exhibit between 10 % and 60 % canopy cover (Loewensteiner et al., 2021; Anchang et al., 2020), with higher percentages generally characterizing tropical savannas, where woodlands are denser than in temperate zones. Accordingly, the 10 %–60 % range was subdivided into three strata: 10 %–20 % cover, representing transitional grassland–open-canopy savannas; 21 %–40 % cover, representing open-canopy savannas; and 41 %–60 % cover, representing savanna–woodland transition zones. The 41 %–60 % range is more prevalent in the northern Post Oak Savannah, where higher precipitation supports greater woody density. The highest cover categories (61 %–80 % cover and ≥ 81 %) were then designated as woodlands and thicketized woodlands, respectively.
2.3 Major steps
Consistent with the four objectives of this study, we (1) validate the MOD16 ET product against water-balance estimates (WBET) at the subbasin (HUC8) scale; (2) analyze monthly and seasonal ET differences as they relate to canopy cover; (3) use linear regression to examine the coupling and decoupling of woody plant metrics (canopy cover and canopy height), climatic factors (precipitation and air temperature), and ET within different precipitation zones; and (4) evaluate excess water (P–ET) at the water-year scale – including an ET P analysis – to assess broader trends in water availability over the study period (Fig. 2).
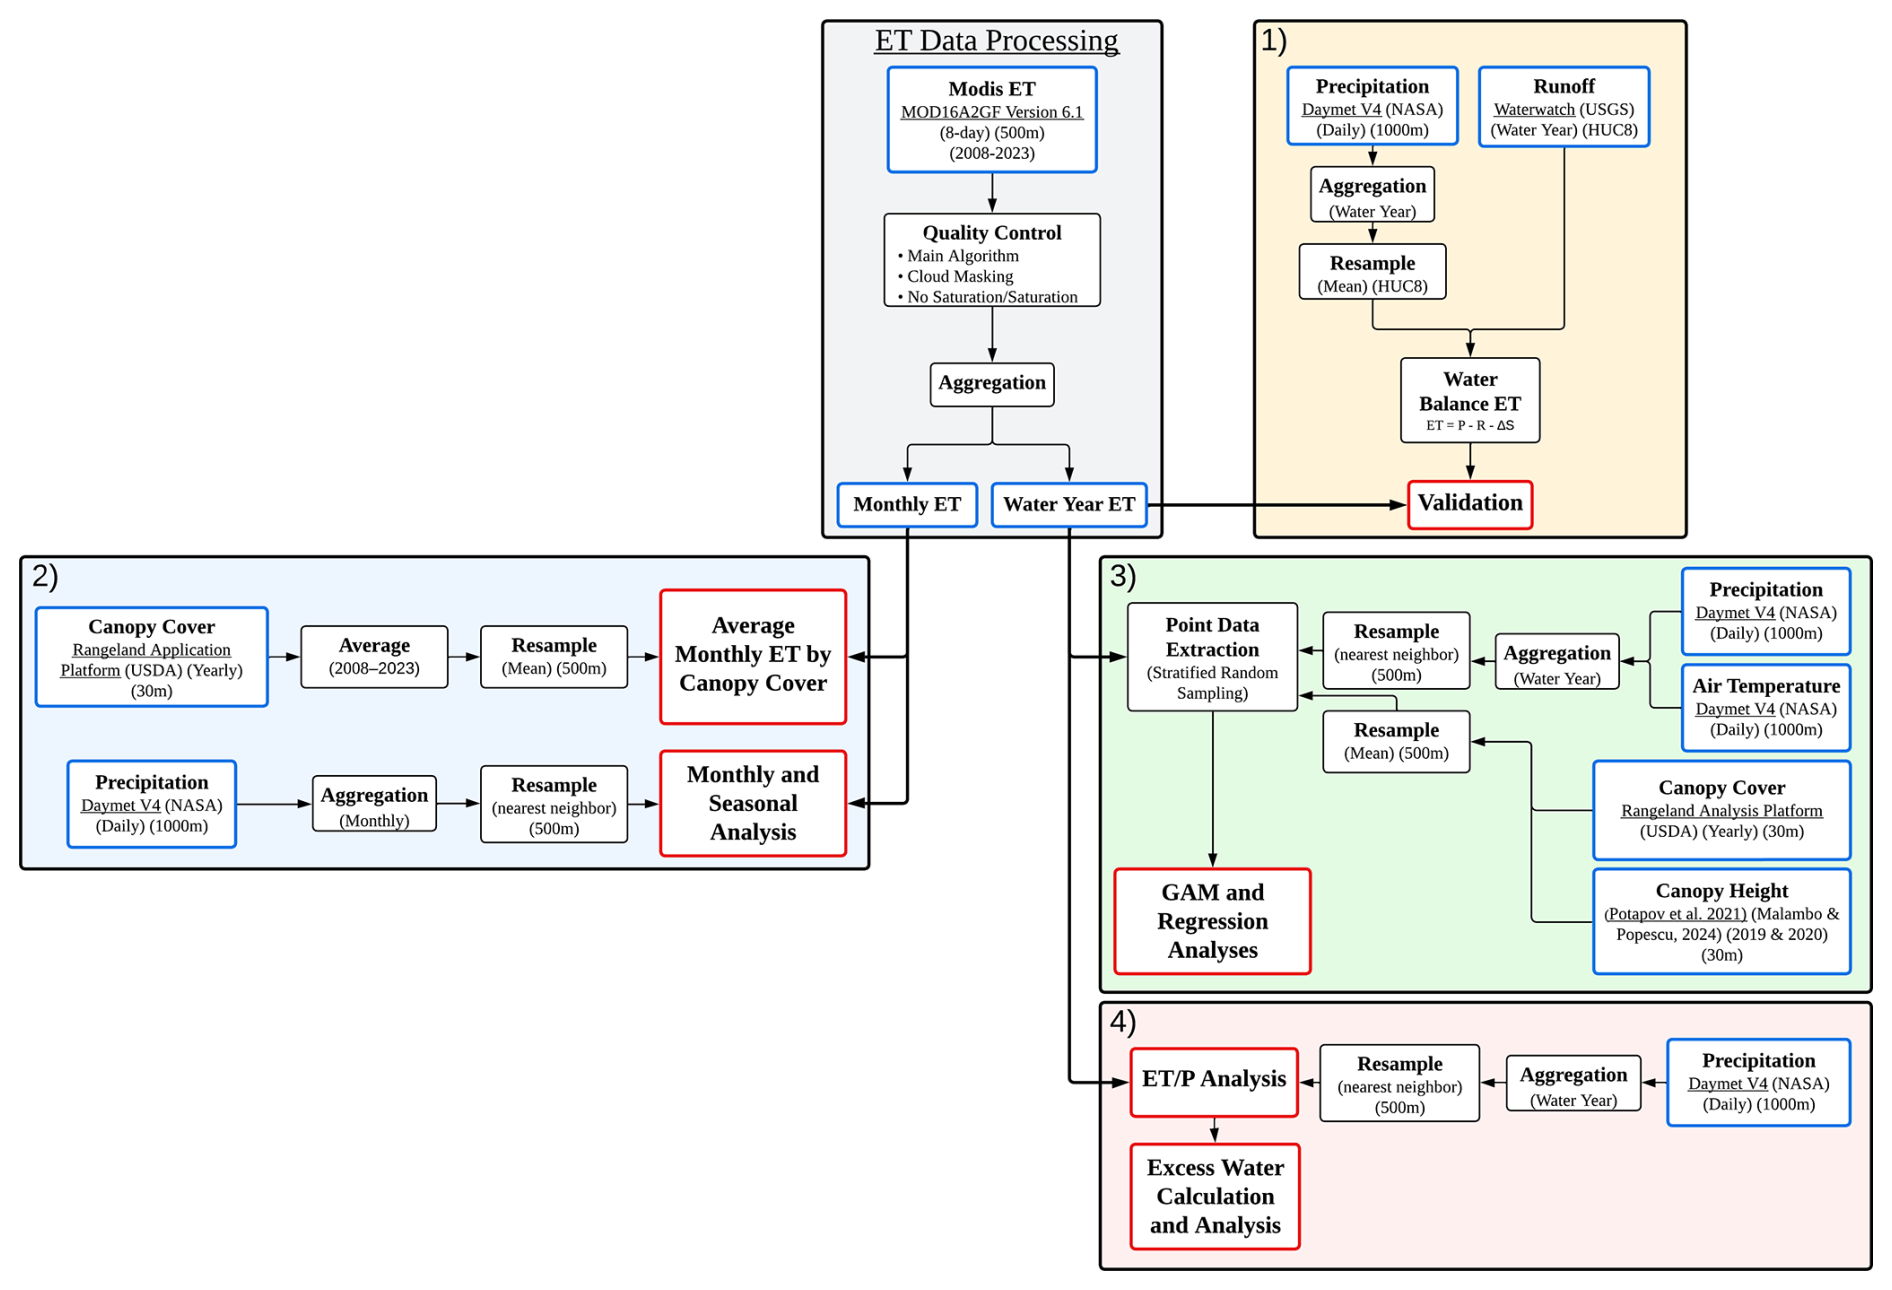
Figure 2Overview of the data processing and analysis workflow used in this study. The gray panel outlines how monthly and water-year ET from the MOD16 product is derived via quality control, cloud masking, and aggregation. The yellow panel (1) illustrates validation of the MODIS-based ET product by deriving water-balance ET (WBET = P–R–ΔS) from precipitation (Daymet V4) and runoff (USGS WaterWatch) at the subbasin scale. The blue panel (2) shows the analysis of monthly and seasonal ET in relation to canopy cover from the Rangeland Analysis Platform and precipitation from Daymet V4. The green panel (3) shows the application of GAM and regression analyses on precipitation, air temperature, canopy cover, and canopy height to assess how woody plant metrics and climate factors influence ET across different precipitation zones. The pink panel (4) illustrates the evaluation of overall water availability by comparing ET with precipitation (ET P) and calculating excess water (P–ET) at the water-year scale.
2.3.1 MOD16 ET evaluation
At the water-year scale, WBET for the HUC8 subbasins was compared with MOD16 ET. The water-year WBET for these HUC8 subbasins was computed as follows:
where P, R, and ΔS are water-year precipitation, runoff, and storage changes at the HUC8 subbasins, respectively.
The independent WBET dataset we used to compare against the MOD16 ET estimates was generated via a water-balance approach at the HUC8 scale. The conterminous United States is partitioned into hierarchical hydrologic units, each assigned a unique hydrologic unit code (HUC) consisting of two to eight digits (Seaber et al., 1987). The largest unit is a region (HUC2), followed by a sub-region (HUC4), a basin (HUC6), and ultimately a subbasin (HUC8).
Following established methods in the literature, we applied several filters to exclude HUC8 subbasins where the water balance was unlikely to close (i.e., WBET ). First, we removed any HUC8s having a runoff-to-precipitation ratio () exceeding 0.40 to mitigate the influence of regional groundwater flow (Velpuri et al., 2013; Senay et al., 2016). We also excluded HUC8s having a WBET greater than PET and those having less than 60 % of their area located within the Post Oak Savannah. These criteria resulted in 11 HUC8s being retained (Fig. 3). Among them, the percentage of area within the Post Oak Savannah ranged from 61 % to 99 %, with an average of 76 %. In total, 154 pairwise comparisons (11 HUC8s × 14 water years) were available, as the WaterWatch data extended only to the 2022 water year.
All 154 paired points were plotted, and the R2, bias, and RMSE values were calculated. Furthermore, R2, bias, and RMSE were calculated for each HUC8, as well as each water year.
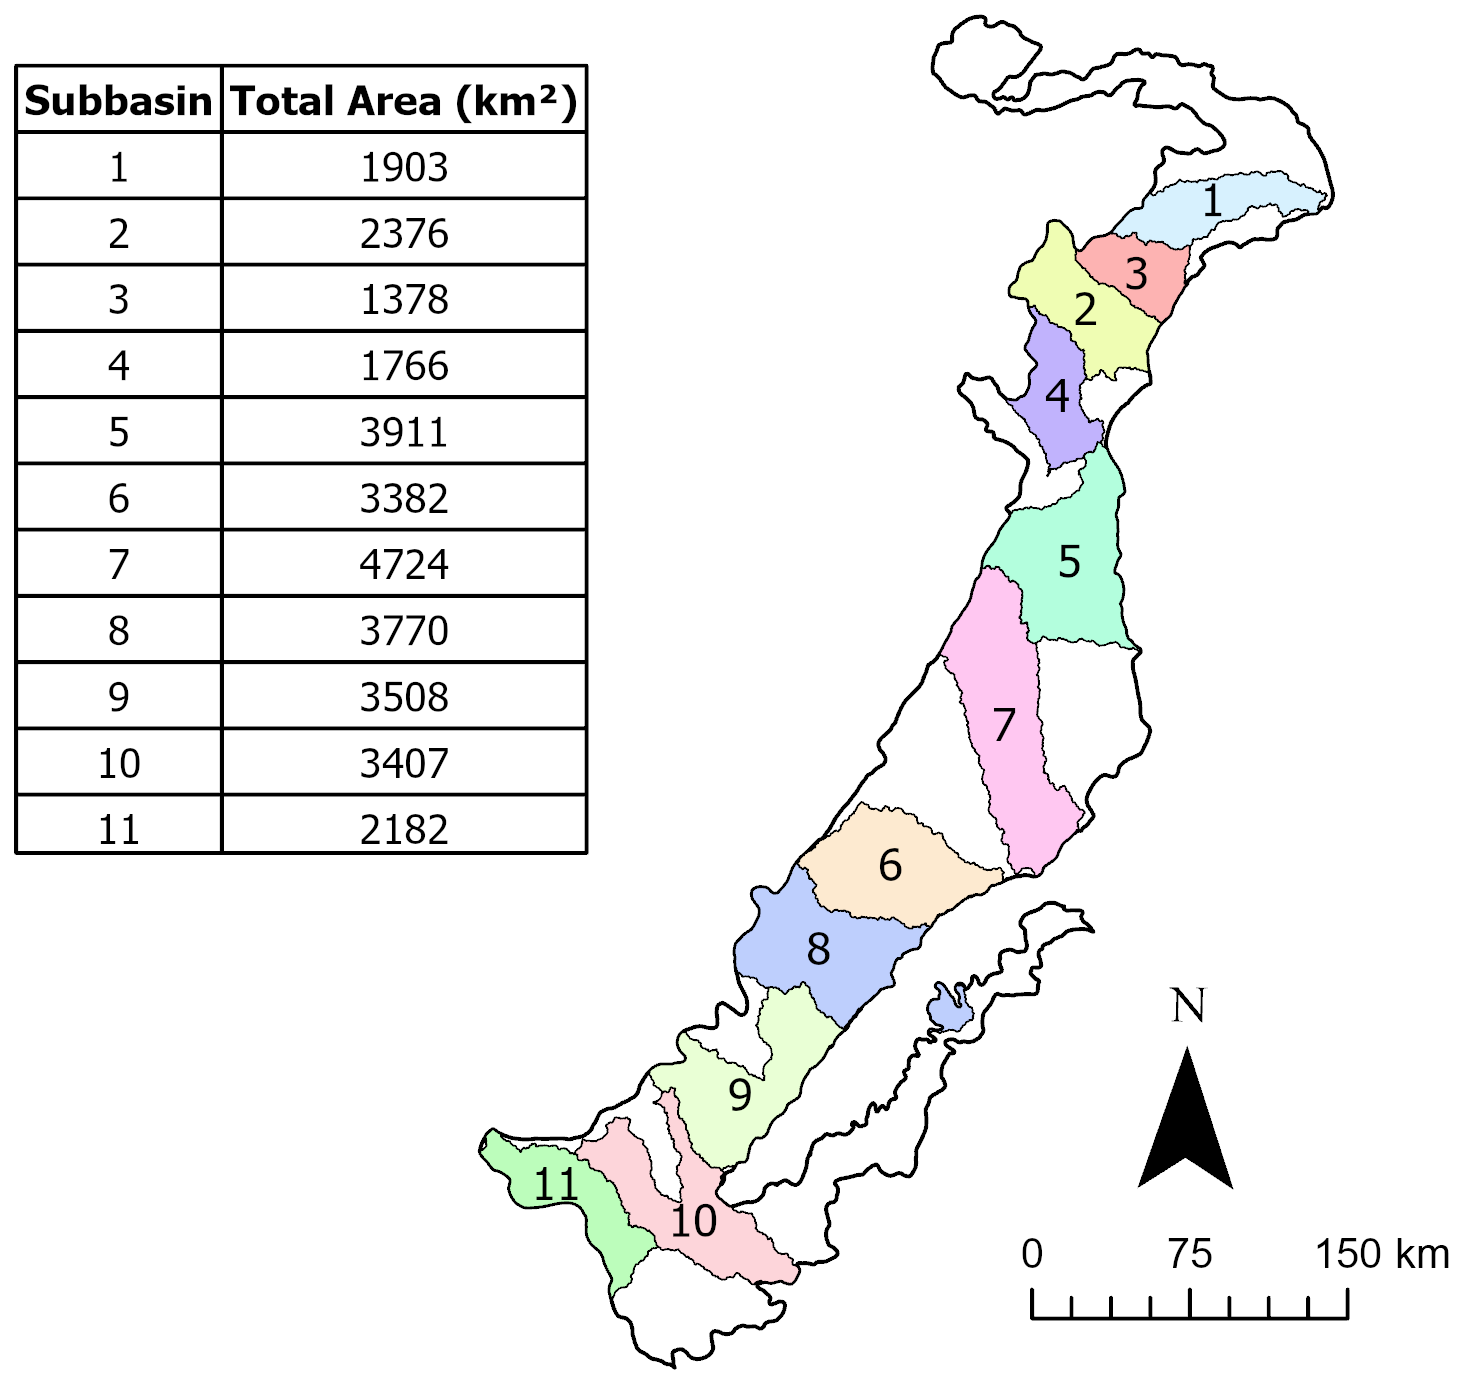
Figure 3Map of the 11 retained HUC8 subbasins within the Post Oak Savannah, color-coded by subbasin ID. The table lists the total area (km2) of each subbasin within the ecoregion.
2.3.2 Monthly and seasonal analysis
Monthly MOD16 ET was averaged across the entire study period (2008–2023) to obtain monthly mean values. These monthly means were then extracted for each cover class and precipitation zone. Finally, the 12 monthly means for each class and zone were summed to calculate annual averages and standard deviations.
2.3.3 Point data extraction and modeling
The 500 m water-year products, spanning 15 water years, were compiled for each variable, with ET designated as the response variable and precipitation, air temperature, canopy cover, and canopy height serving as predictors. Next, a random stratified sampling approach was implemented to extract 1000 points per precipitation zone, yielding a total of 4000 points containing ET, precipitation, air temperature, canopy cover, and canopy height for each water year. Points with missing values for any product in any water year were excluded from further analysis, resulting in 3550 points for modeling.
Each predictor was then paired with its corresponding ET value from the same water year (e.g., 2009 Canopy Cover with 2009 ET) and plotted. For every precipitation zone, we fitted ordinary least-squares regressions to obtain zone-specific slopes and R2 values. We then repeated the regression on the pooled data and reported the aggregated equation and R2. To capture non-linear patterns that linear models might miss, we additionally fitted a GAM with a cubic-spline smooth to the full dataset and reported its pseudo-R2 values.
2.3.4 ET P and excess water analysis
Over the entire study period, total ET and P values were aggregated across the Post Oak Savannah. The ratio of ET to P (ET P) was then computed to facilitate further analysis of the fraction of precipitation lost to the atmosphere. Next, the total ET was subtracted from the total P to quantify the volume of excess water retained in the terrestrial system. Finally, these excess water values were averaged within each cover class and precipitation zone.
3.1 MOD16 ET validation
Comparisons of the MOD16 product with WBET estimates yielded an R2 of 0.65, a bias of −7 mm wyr−1 (−0.8 %), and an RMSE of 103 mm wyr−1 (11.6 %) (Fig. 4). Among individual HUC8s, R2 ranged from 0.11 to 0.70, bias spanned −79 to 85 mm wyr−1, and RMSE varied between 63 and 104 mm wyr−1. Examined by water year, R2 ranged from 0.04 to 0.80, bias extended from −125 to 117 mm wyr−1, and RMSE ranged from 57 to 127 mm wyr−1 (Fig. 4).
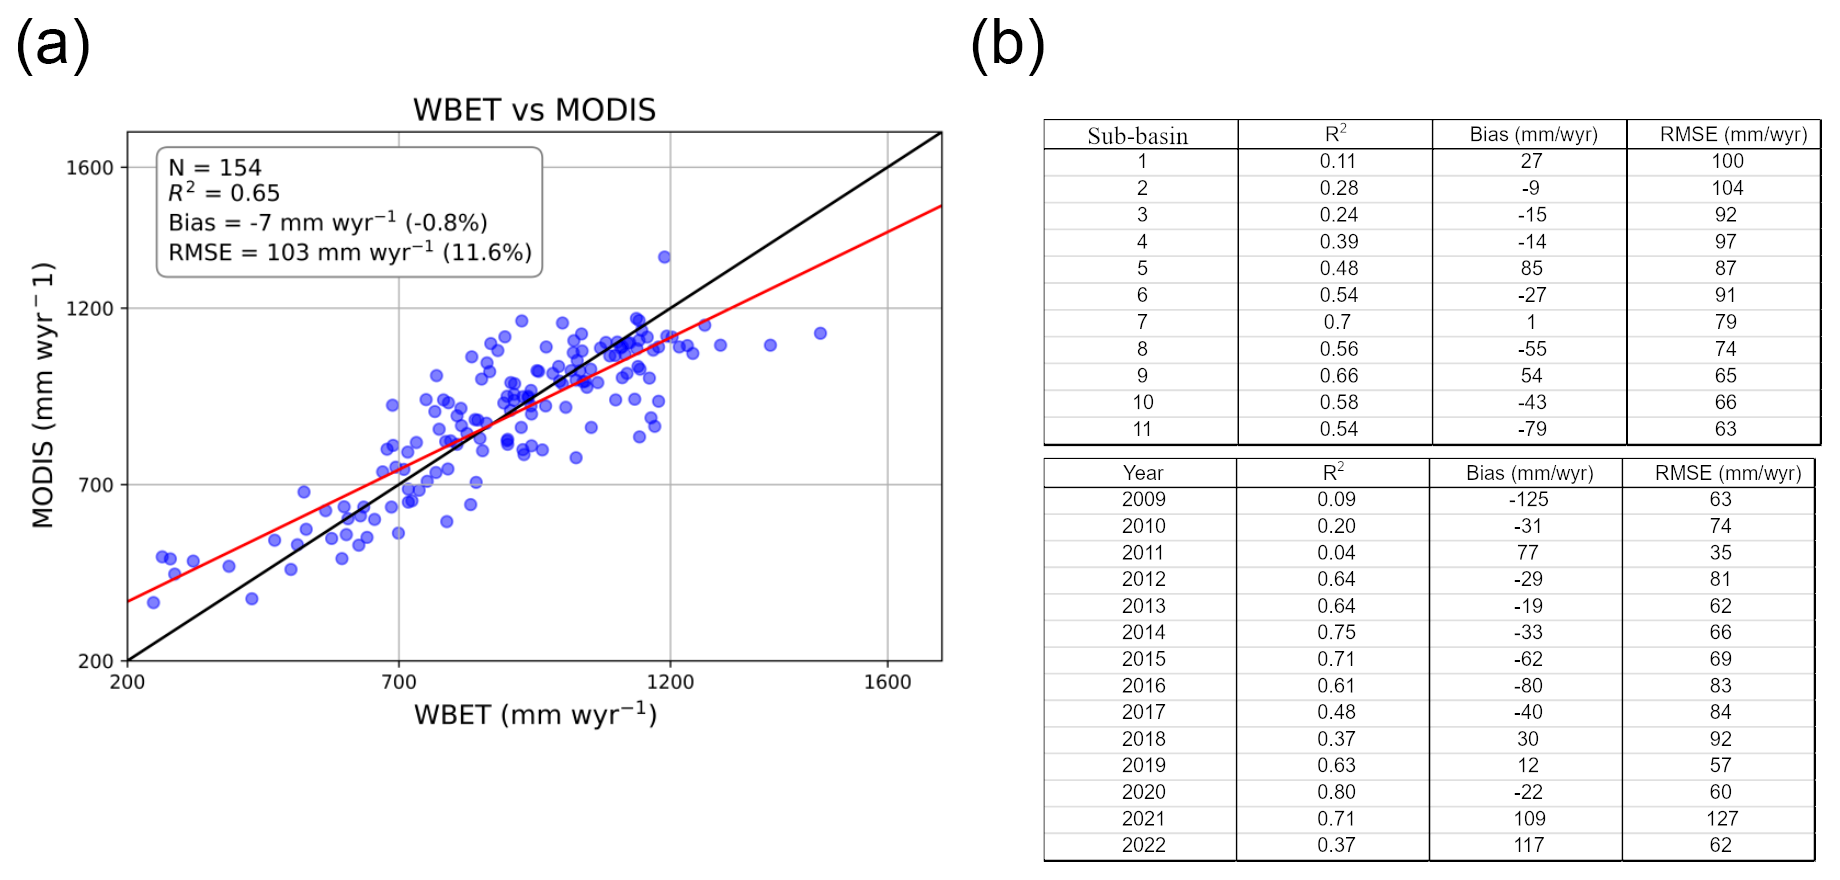
Figure 4Comparison of water-balance evapotranspiration (WBET) and MOD16 ET at the HUC8 subbasin and annual scales (2009–2022). (a) Scatterplot of WBET (x axis) versus MODIS-estimated ET (y axis); the solid black line represents the 1:1 line, and the red line is the linear regression fit. The inset box summarizes the sample size (N), coefficient of determination (R2), bias (mm wyr−1 and %), and root mean square error (RMSE in mm wyr−1 and %). (b) Tables showing R2, bias, and RMSE for each HUC8 subbasin (top) and each water year (bottom).
3.2 Monthly and seasonal analysis
Monthly ET increases from January to June, peaking at 133.6 mm (averaged across all canopy classes), before dropping to 32.2 mm in December (Fig. 5). The highest single ET value, 168.0 mm, occurs in June within the ≥ 81 % canopy cover class, while the lowest single value, 30.5 mm, is observed in December within the 0 %–10 % cover class. The ≥ 81 % cover class exhibits the highest ET values for 6 months (April–September), whereas the 61 %–80 % cover class dominates in the remaining months (Fig. 5).
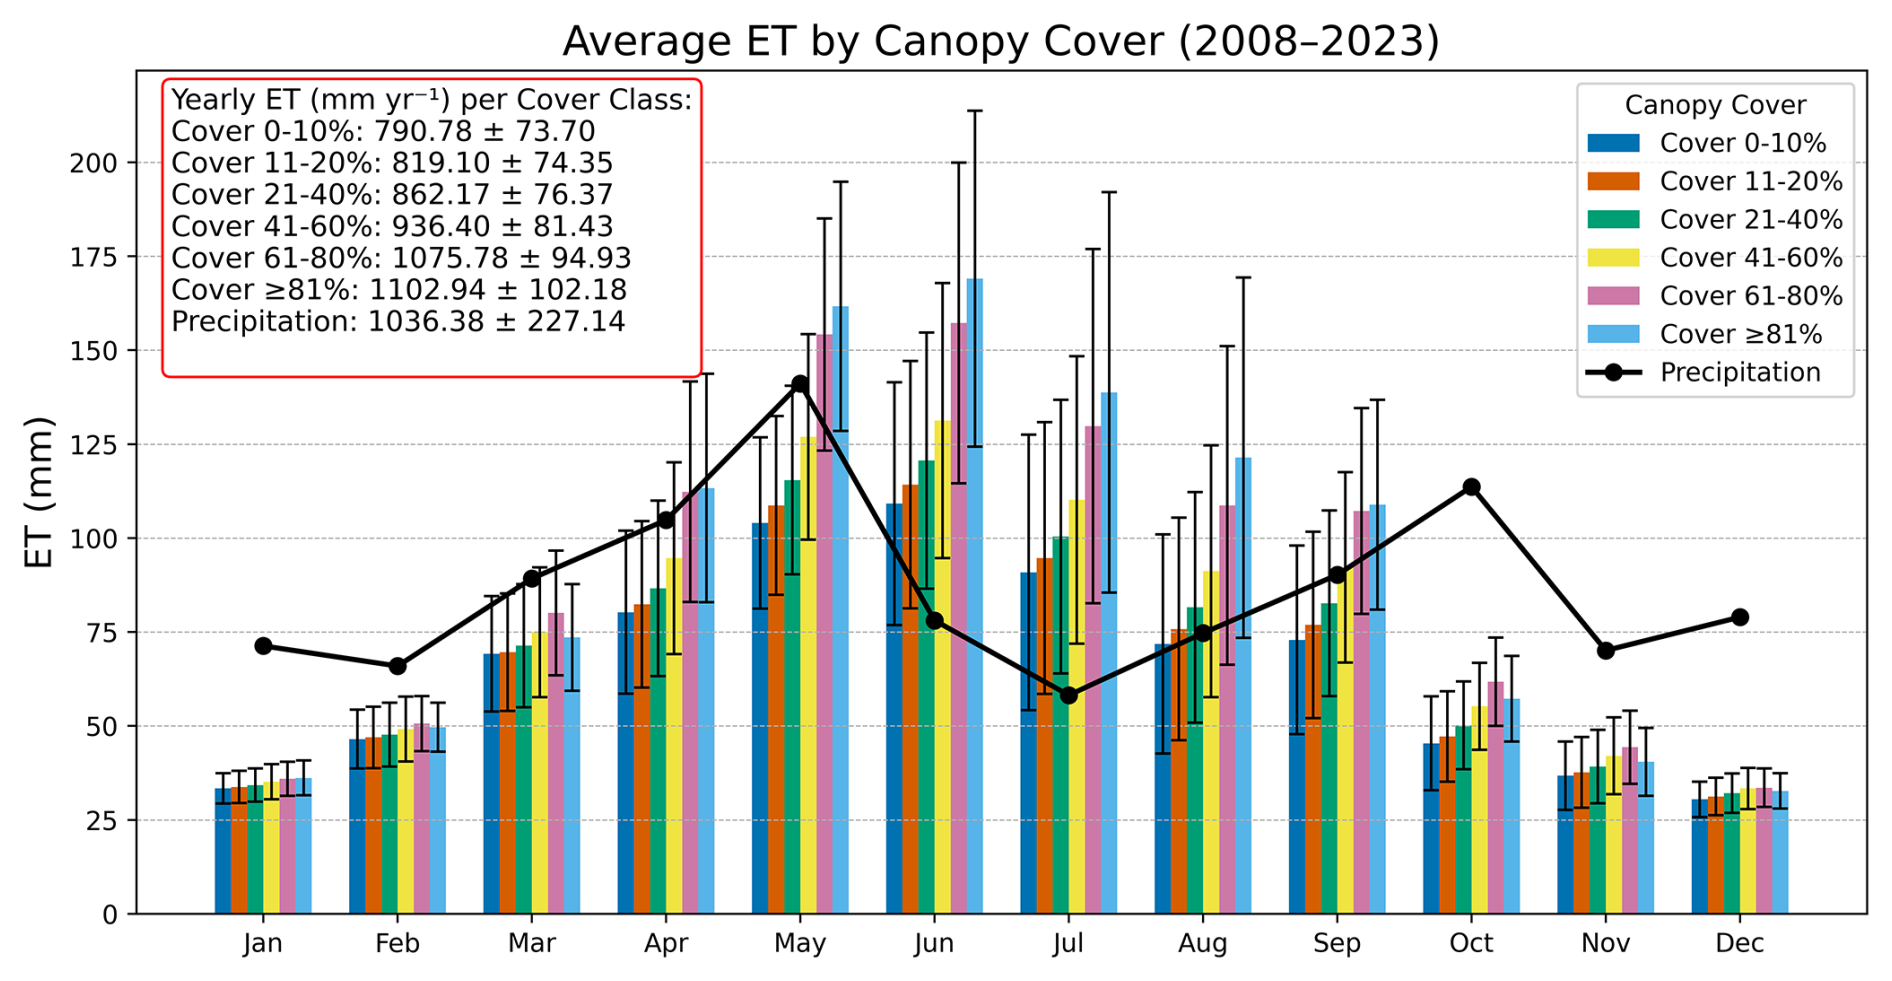
Figure 5Monthly average ET and corresponding precipitation by canopy-cover class (2008–2023).
ET exhibited a seasonal cycle, with average lows of 38.5 mm in winter (December–February), moderate levels of 98.7 mm in spring (March–May), and peak levels of 112.1 mm in summer (June–August), before declining to 61.0 mm in fall (September–November) (Fig. 6). Notably, the drought year 2011 showed substantially lower ET values relative to other years – averaging 78.7 mm in spring, 42.6 mm in summer, and 36.1 mm in fall – coinciding with the low precipitation totals. Conversely, higher precipitation levels led to greater distinction between seasonal ET averages (Fig. 6).
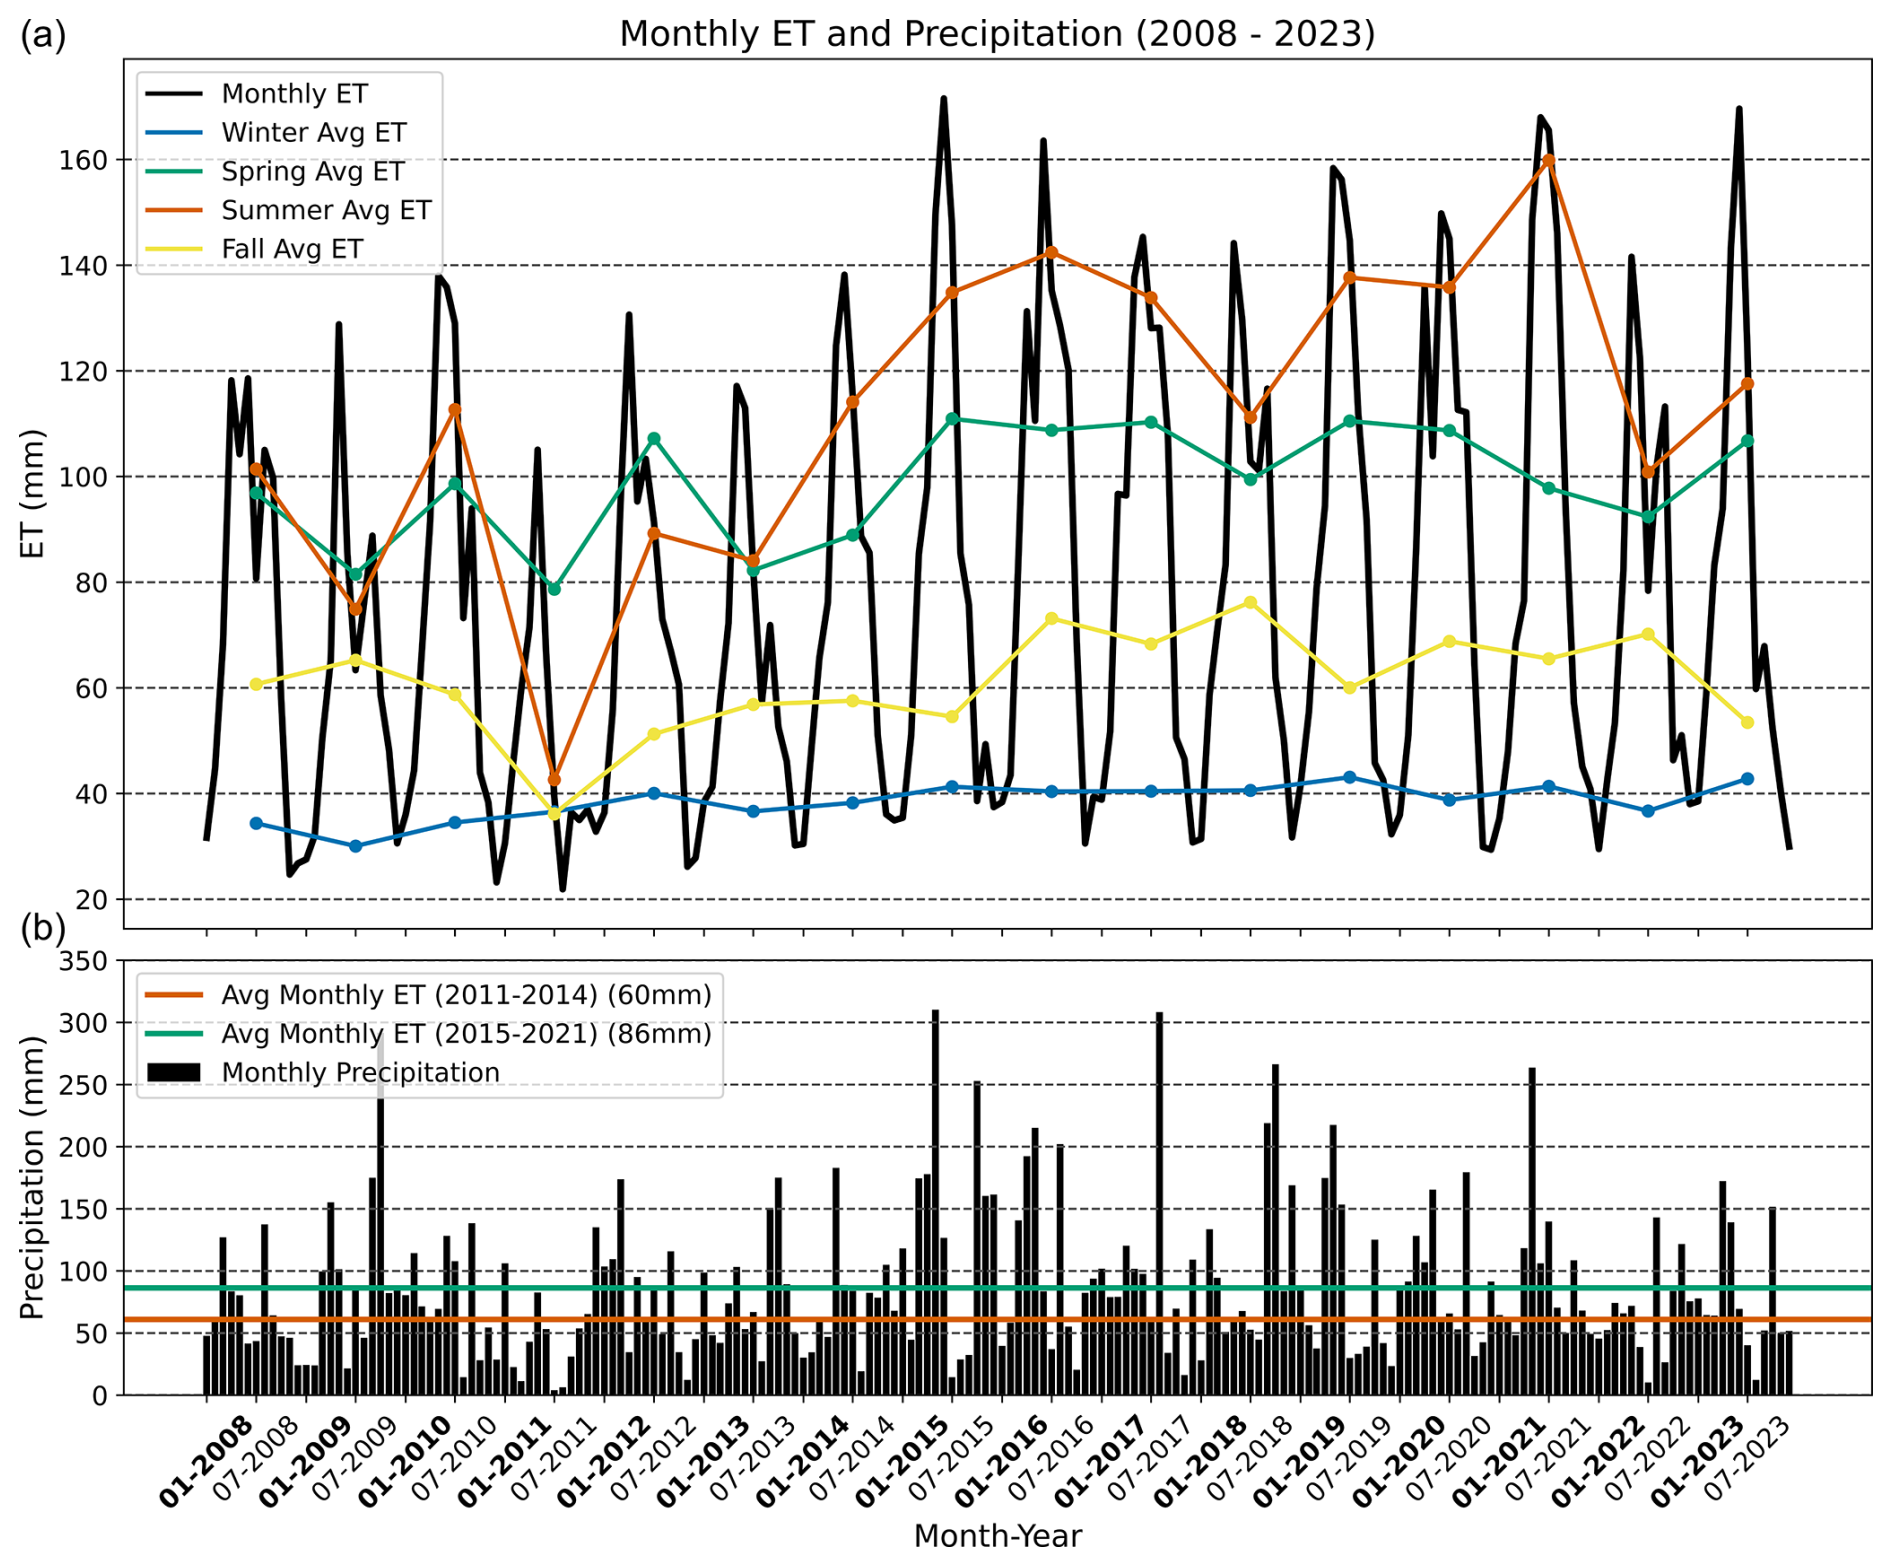
Figure 6Time series of monthly ET and precipitation from 2008–2023. Panel (a) shows monthly ET (black line) alongside seasonal average lines. Panel (b) displays monthly precipitation (black bars), with the two horizontal lines indicating overall average monthly ET for 2010–2014 and 2015–2021.
3.3 Regression and GAM analyses
The two climatic variables P and Ta exhibited notably different relationships with ET. Precipitation showed a moderate positive correlation, with R2 values ranging from 0.23 (1001–1200 mm) to 0.61 (600–800 mm) and slopes from 0.29 (1001–1200 mm) to 0.55 (≥ 1201 mm) (Fig. 7). By contrast, air temperature demonstrated a weak negative relationship with ET, with R2 values varying from 0.09 (801–1000 mm) to 0.27 (600–800 mm) and slopes between −82.02 (600–800 mm) and −45.72 (801–1000 mm) (Fig. 7).
In comparison, the two woody-vegetation metrics showed more consistent positive relationships with ET than the climatic variables. Canopy height exhibited a moderate positive correlation, with R2 values between 0.48 (600–800 mm and ≥ 1201 mm) and 0.54 (801–1000 mm) and slopes ranging from 35.05 (1001–1200 mm) to 38.66 (801–1000 mm) (Fig. 7). Similarly, canopy cover displayed a weaker but still positive association, with R2 values ranging from 0.12 (600–800 mm) to 0.20 (1001–1200 mm) and slopes between 3.61 (600–800 mm) and 4.32 (1001–1200 mm) (Fig. 7).
The generalized additive model (GAM) results – shown by the magenta curves in Fig. 7 – largely confirmed the linear patterns but captured subtle non-linearities, especially at the extremes of the predictor ranges. GAM pseudo-R2 values were highest for canopy height (0.51) and precipitation (0.49), modestly exceeding the corresponding aggregated linear R2 values (0.50 and 0.43, respectively). For canopy cover and air temperature, the pseudo-R2 values were low (0.15 and 0.13), mirroring the weak to moderate linear associations.
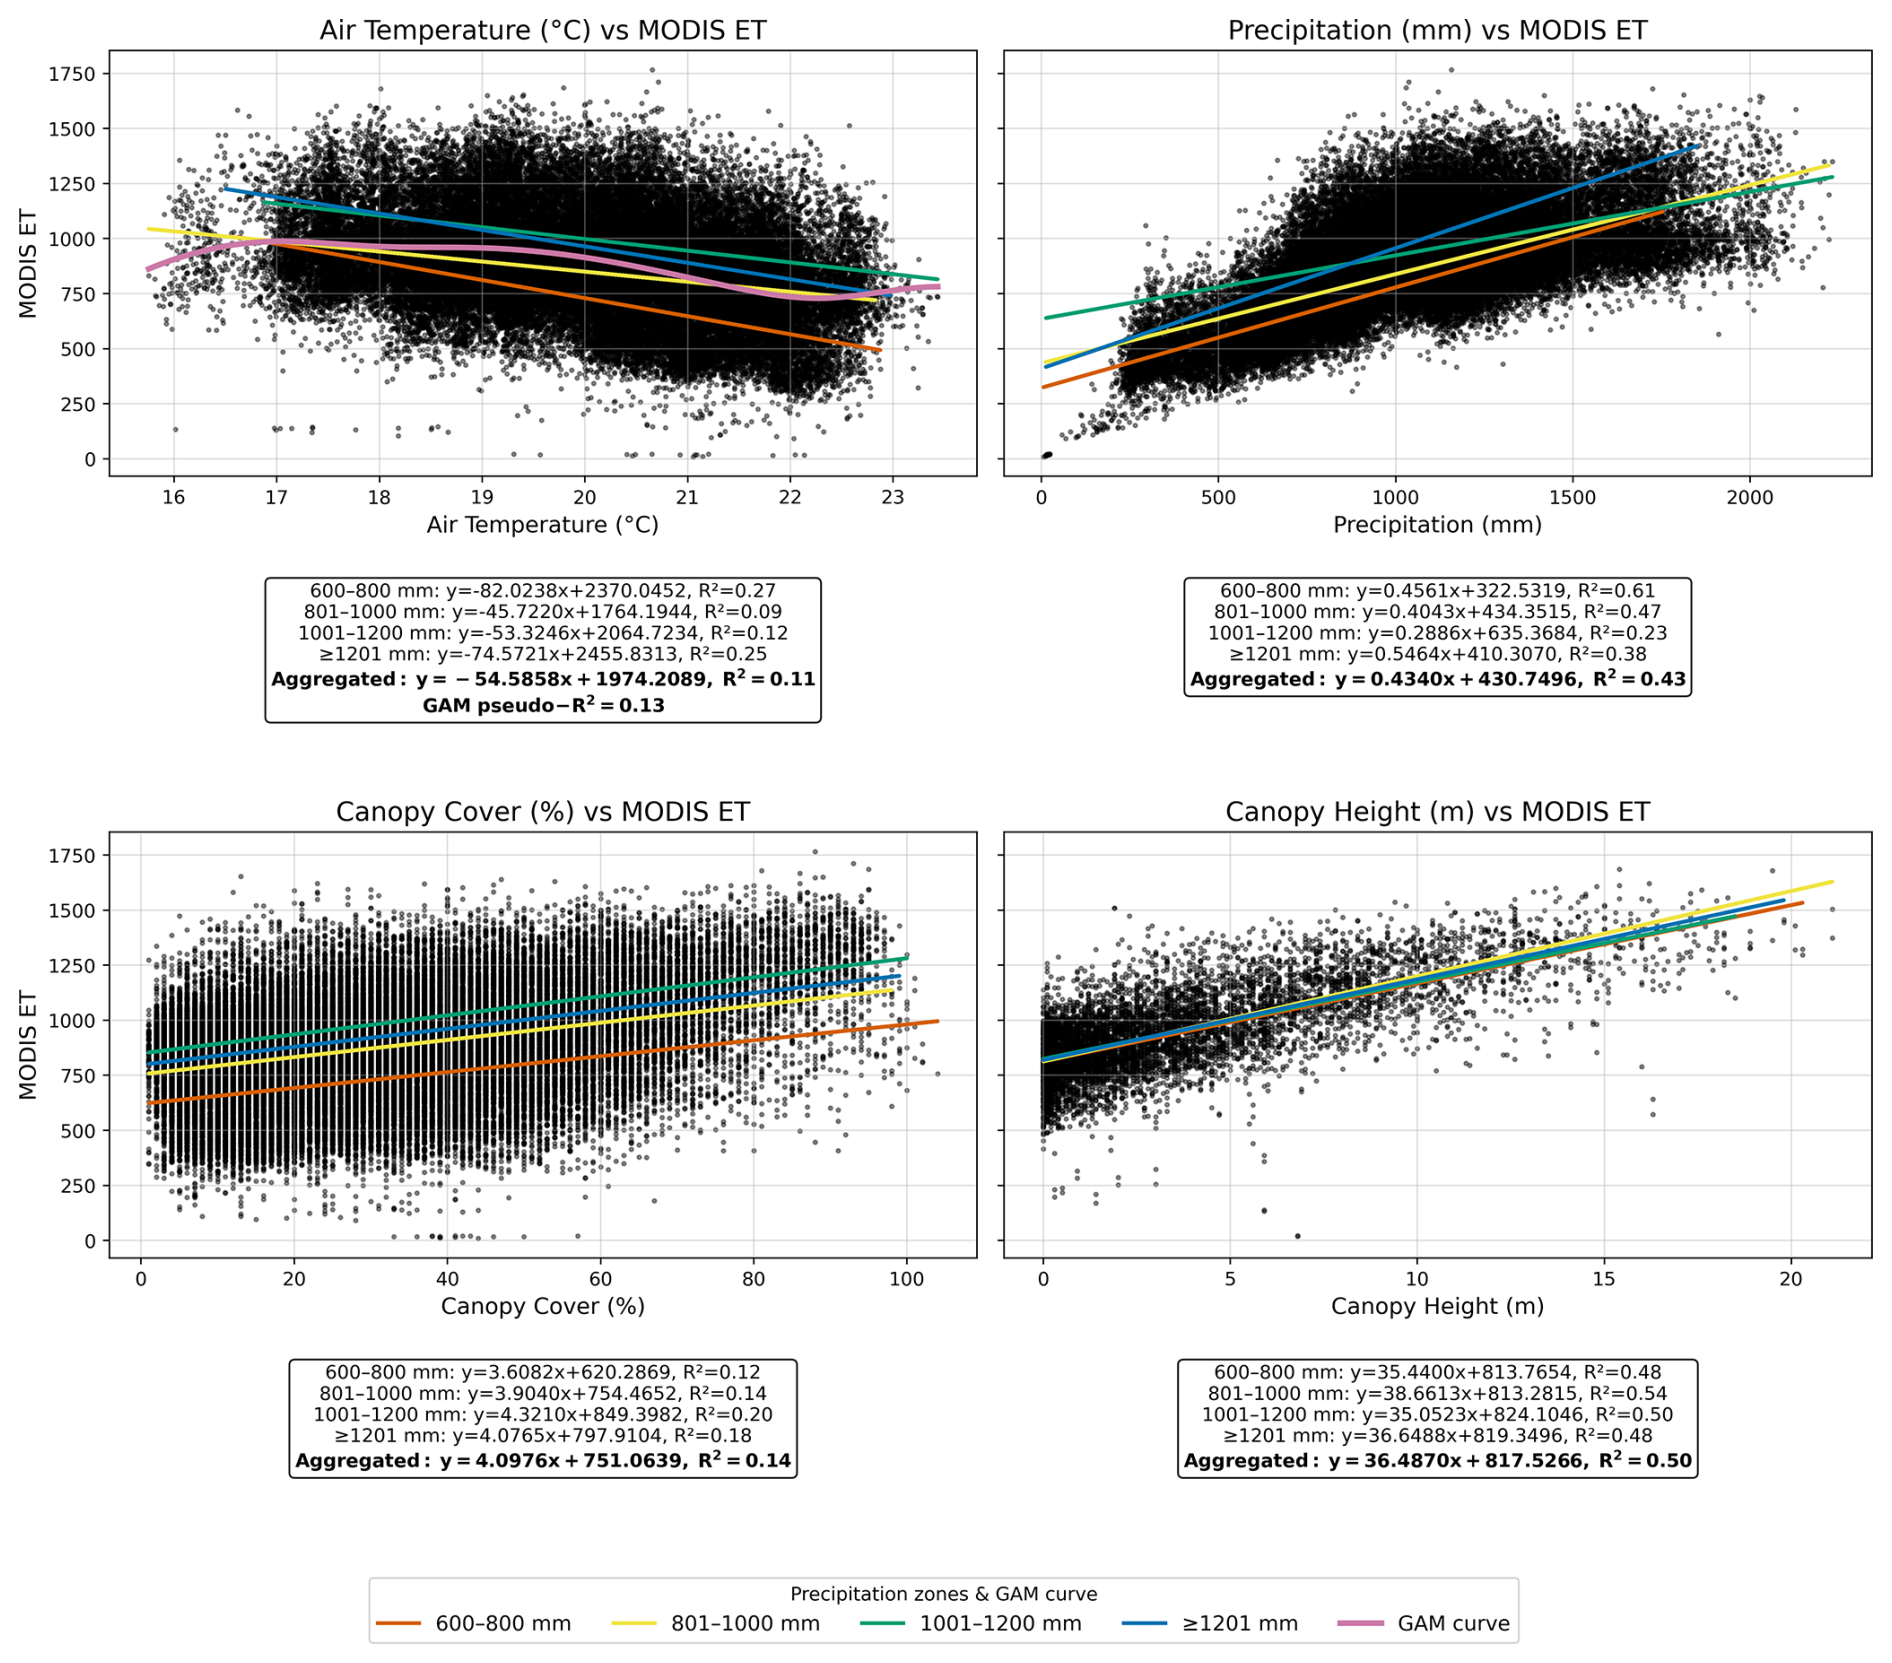
Figure 7Scatterplots illustrating the linear relationships between MODIS ET (y axis) and four predictors – precipitation, air temperature, canopy cover and canopy height (x axes) – for different precipitation zones (600–800, 801–1000, 1001–1200, and ≥ 1201 mm). The four precipitation zones are represented by color-coded lines showing the best fit regression for each, and the corresponding slope, intercept, and R2 values are shown in the insets. Canopy height data were available only for 2019 and 2020.
3.4 ET P ratios and excess water analysis
The ratio of ET to P (ET P) was generally stable, averaging 90 % and falling between 70 % and 100 % in most years (Fig. 8); the only exceptions were the drought years 2011 and 2022, when ET P rose slightly above 100 %. Both years were characterized by above-average air temperatures and below-average precipitation (Fig. 8).
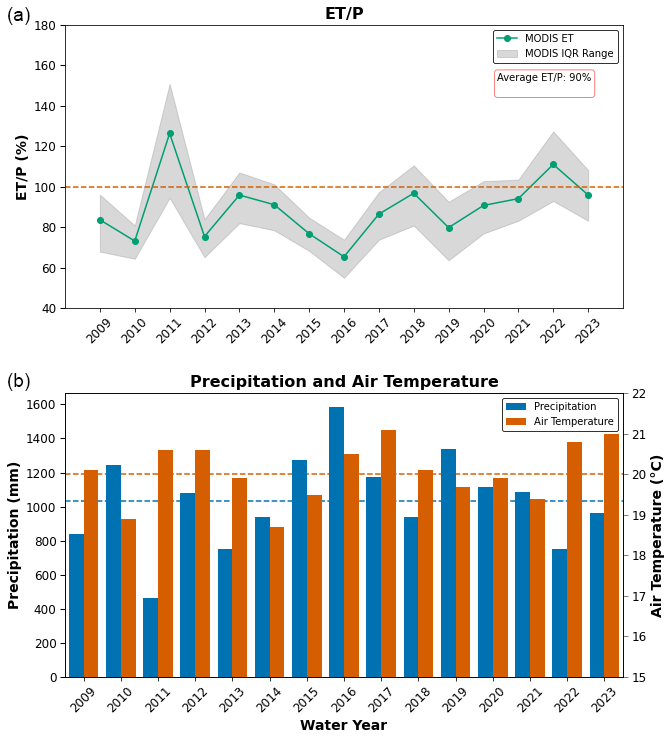
Figure 8(a) Annual ET P ratios derived from MODIS ET estimates, with the interquartile range (IQR) shown in gray and the overall mean ratio (90 %) by the dashed red line. (b) Corresponding water-year precipitation and air temperature, with dashed lines denoting average precipitation and air temperature over the study period.
Areas exhibiting ET P ratios above 100 % in the Post Oak Savannah predominantly coincided with low-elevation, forested river basins and their tributaries (Fig. 9). Notable examples include the Sabine, Trinity, Navasota, Guadalupe, and San Antonio River basins, where forested riparian zones consistently displayed ET P values exceeding 100 % (Fig. 9).
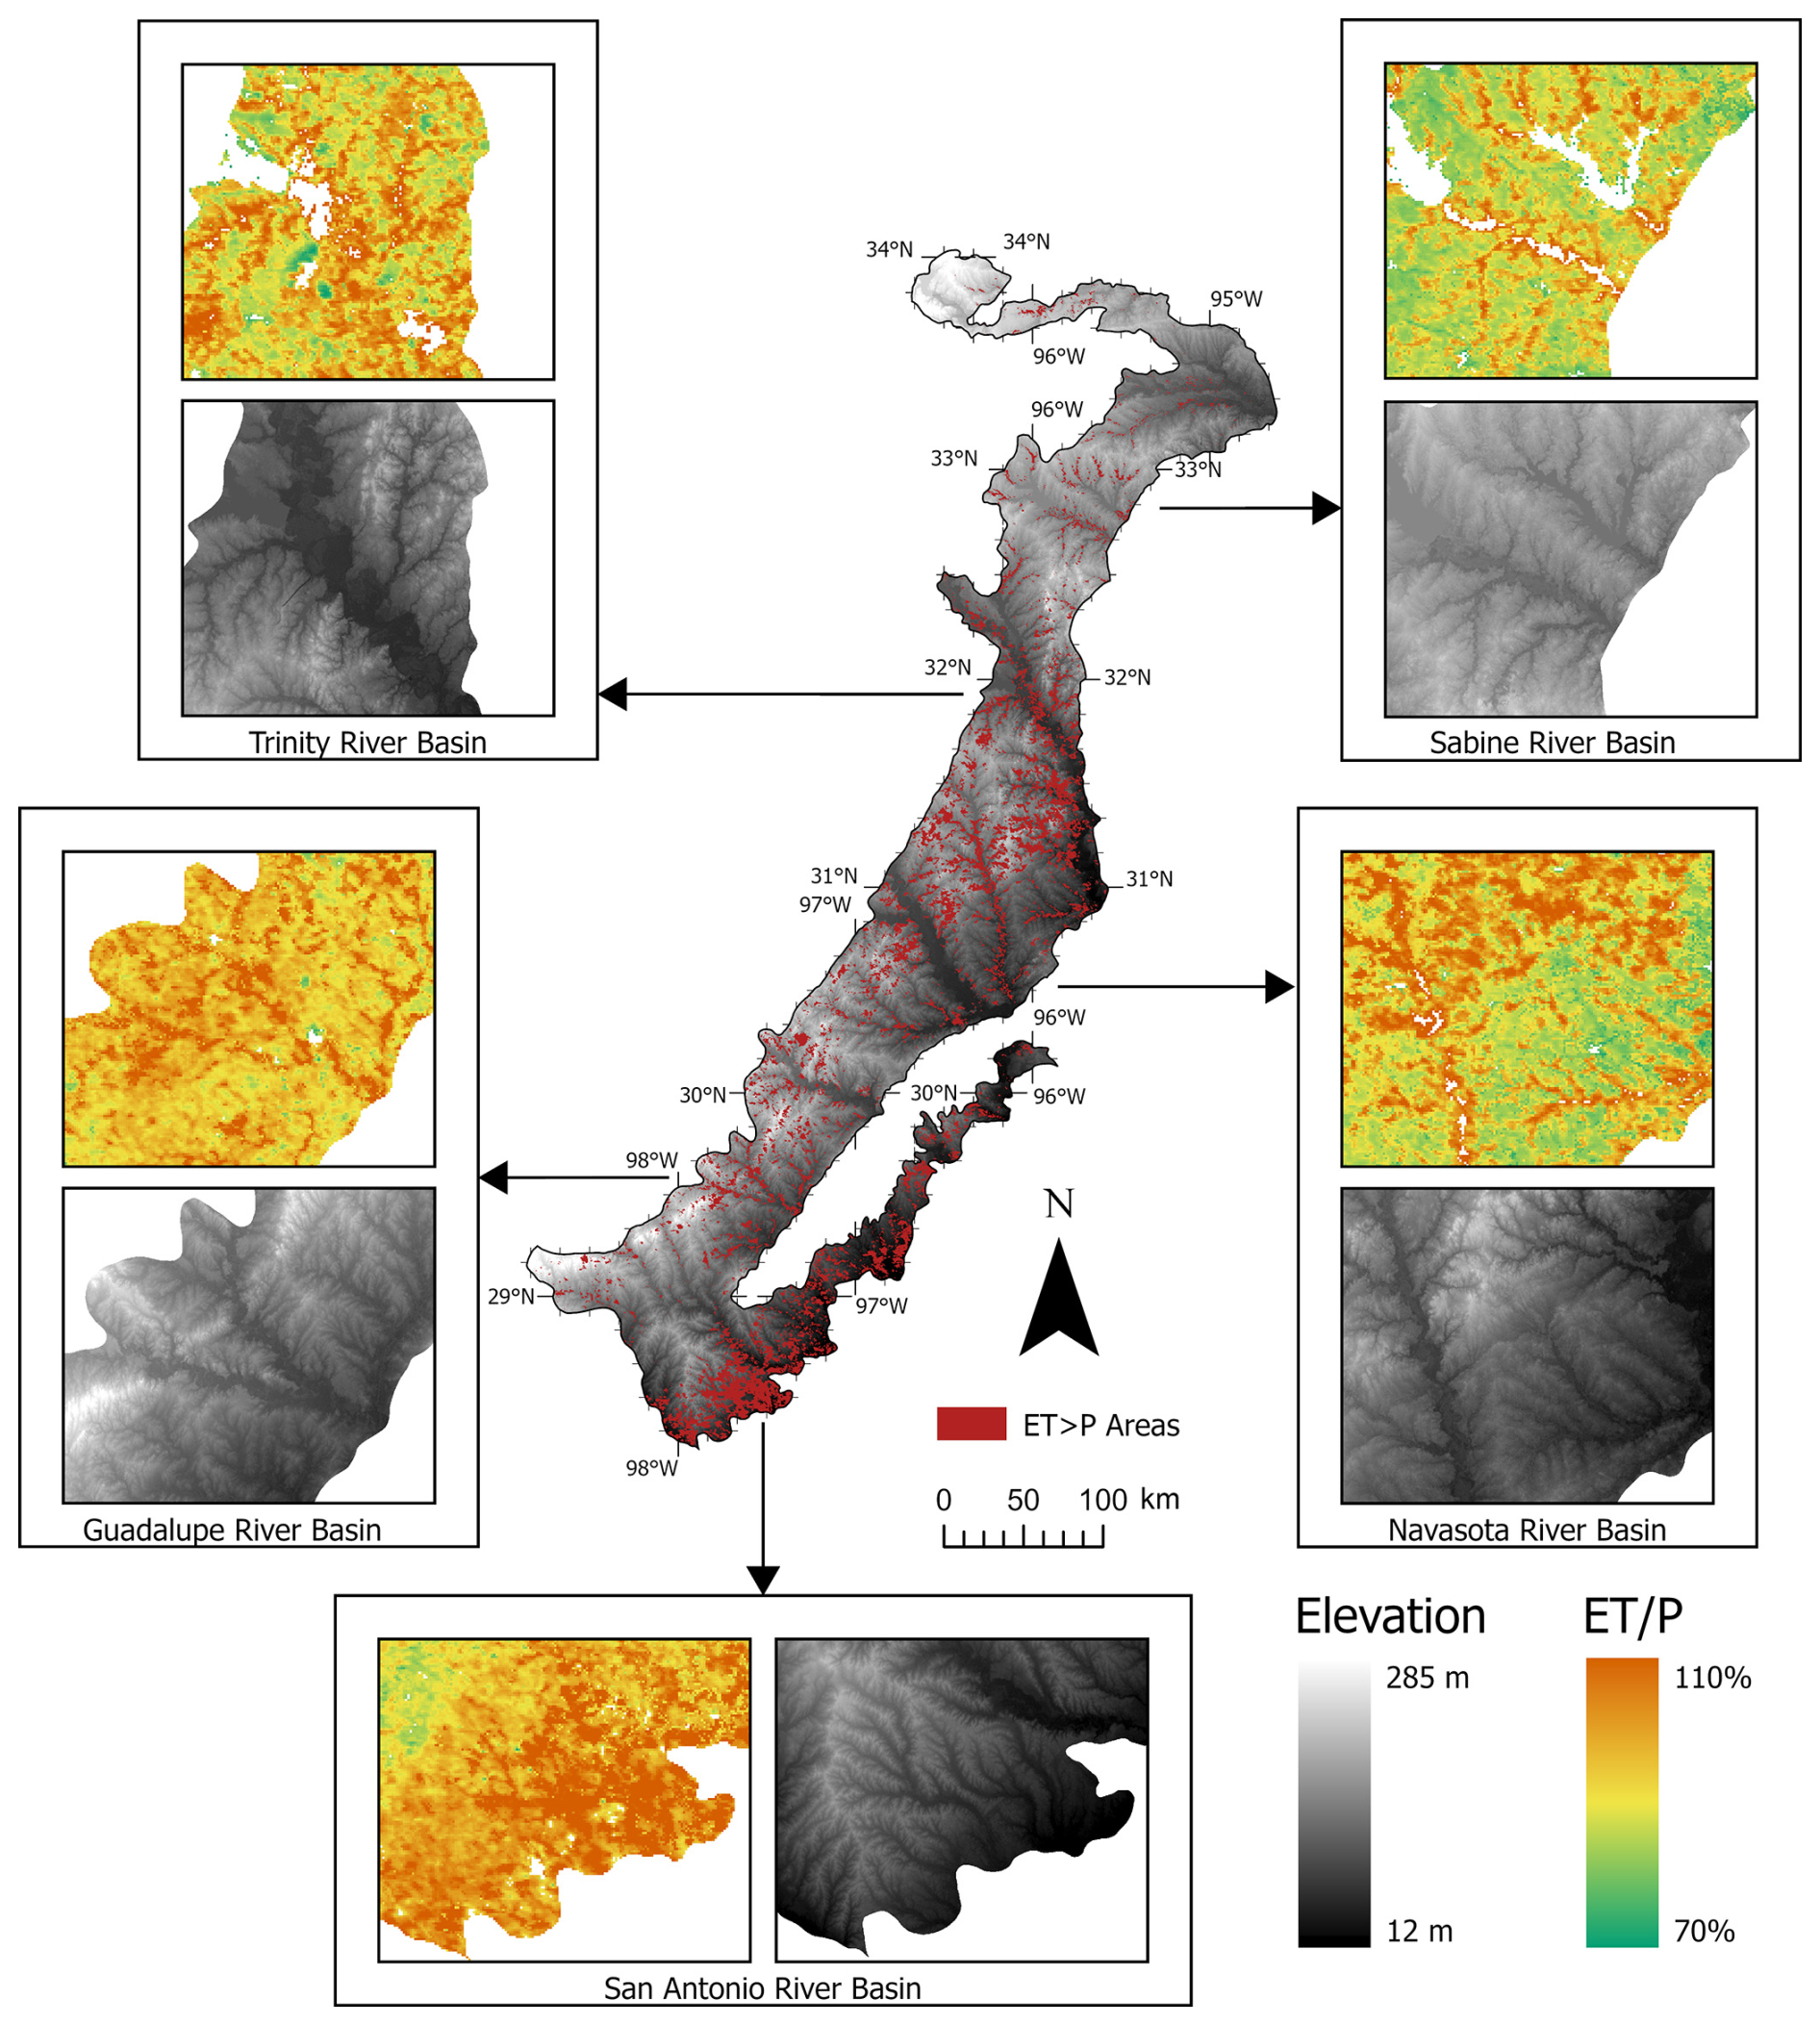
Figure 9Spatial distribution of ET P ratios and elevation across the Post Oak Savannah ecoregion. Areas with ET P>100 % are highlighted in red, while grayscale shading indicates elevation. Insets show detailed views of selected river basins, illustrating the prevalence of high ET P in forested, low-elevation regions (NASA, SRTM).
Total excess water varied substantially across the Post Oak Savannah ecoregion, with most values ranging from −5000 to 7500 mm (Fig. 10a). Over the entire study period (2009–2023), the mean excess water was 2422 mm, or 161 mm yr−1 (Fig. 10b). Temporally, excess water ranged from a low of −22 394 455 mm in 2022 to a high of 167 853 812 mm in 2016 (Fig. 10c). On average, the ecoregion totaled 47 971 635 mm of excess water per year. Only two years exhibited negative excess water: 2011 (−21 968 413 mm) and 2022 (−22 394 455 mm) (Fig. 10c).
These contrasting totals reflect different hydrometeorological conditions. In 2011, precipitation was relatively low at 137 953 517 mm, whereas in 2022, it reached 221 613 882 mm (Fig. 10c). Conversely, evapotranspiration (ET) in 2011 was also low, returning only 158 624 385 mm of water to the atmosphere compared with 242 295 663 mm in 2022 (Fig. 10c).
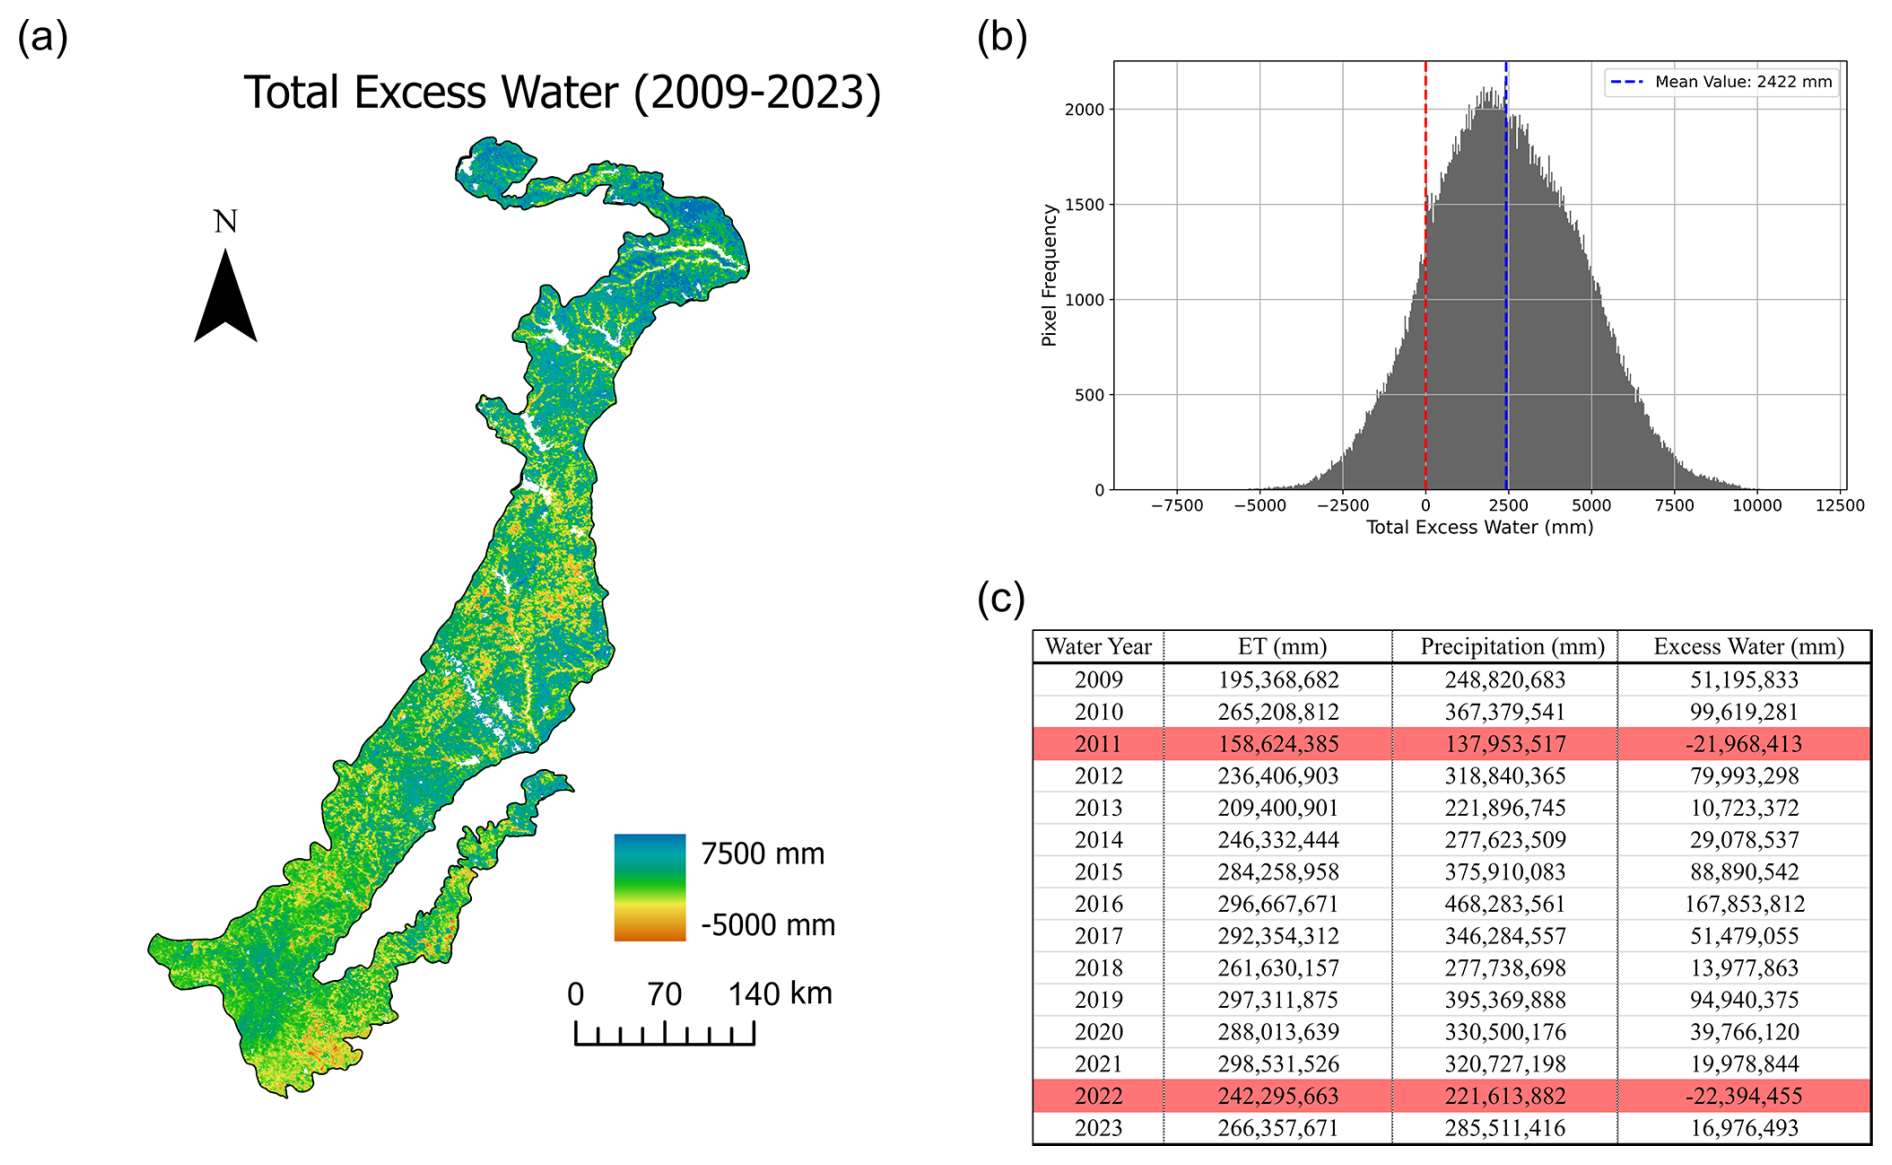
Figure 10(a) Spatial distribution of total excess water (mm) across the Post Oak Savannah ecoregion from 2009 to 2023. The amounts range from −5000 to 7500 mm. (b) Frequency distribution of total excess water across the ecoregion, with red and blue dashed lines indicating 0 total excess water and the mean, respectively. (c) Annual summary of ET, P, and resulting excess water (mm). Negative values in the table (highlighted) indicate water years having net water deficits.
When integrating both woody vegetation cover and overall aridity into the analysis, increases in woody cover consistently reduced excess water totals across every precipitation zone (Fig. 11). The highest annual excess water (414.87 mm) occurs in areas with 0 %–10 % woody cover that receive ≥ 1200 mm of precipitation (Fig. 11). In contrast, the lowest annual excess water (−122.87 mm) occurs in areas with ≥ 80 % woody cover in the 600–800 mm precipitation zone (Fig. 11). Notably, none of the 0 %–10 %, 11 %–20 %, 21 %–40 %, or 41 %–60 % woody cover classes exhibited negative excess water values (Fig. 11). Conversely, in the 61 %–80 % and ≥ 80 % woody cover categories, all precipitation zones had negative values except the ≥ 1200 mm zone, which remained positive (Fig. 11).
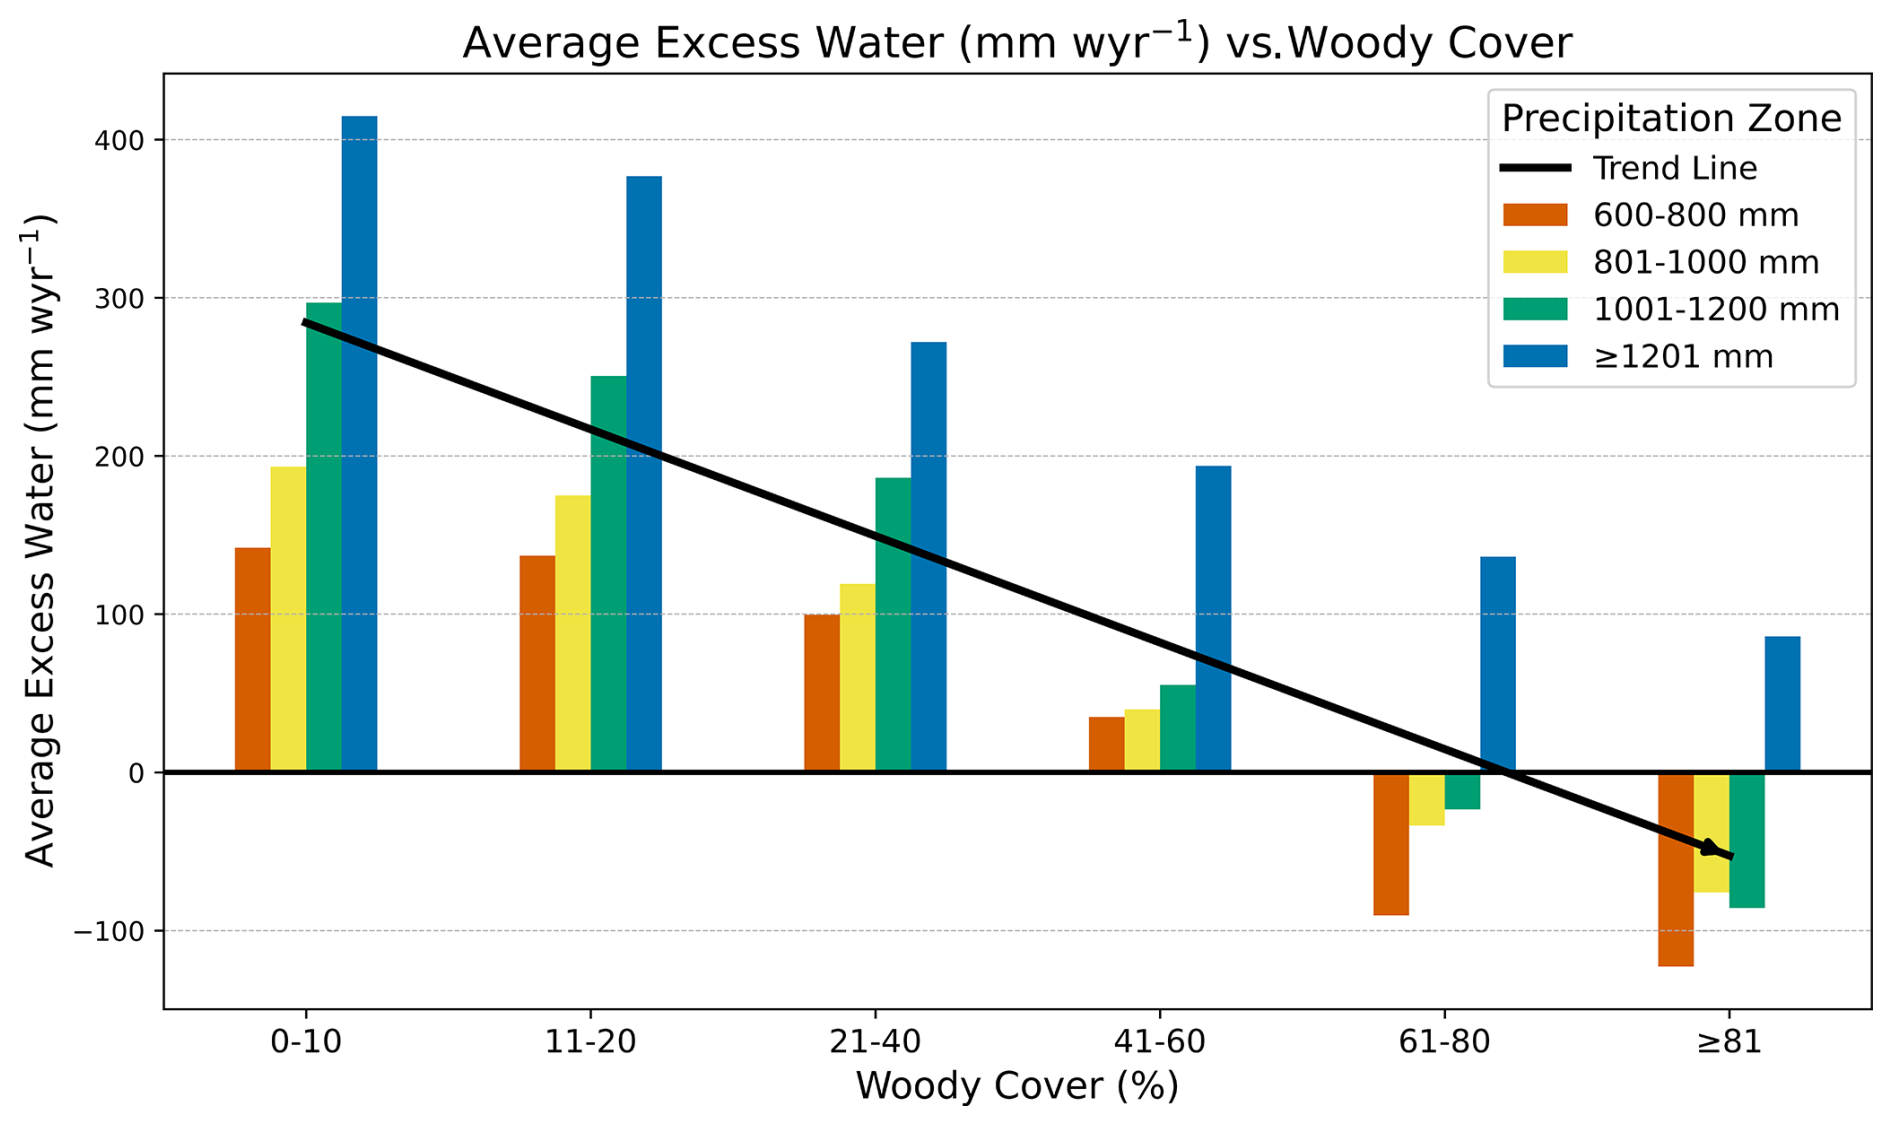
Figure 11Mean annual excess water (mm m−2) as a function of woody cover (%) and precipitation zone. The black trend line indicates the overall decrease in excess water with rising woody cover. Positive values represent net surpluses, whereas negative values denote net deficits.
4.1 MOD16 accuracy
The MOD16 ET model used in this study showed moderate-to-strong agreement with WBET measurements at the HUC8 scale, with an overall RMSE of 103 mm wyr−1 and an R2 of 0.65 (Fig. 4). The bias of −7 mm wyr−1 indicates that the model generally neither overestimates nor underestimates ET. These findings align with other validations of the MOD16 ET product, performing better in some cases and worse in others (Aguilar et al., 2018; Nadzri and Hashim, 2014; Du and Song, 2018; Ruhoff et al., 2013; Miranda et al., 2017). Because the WBET evaluation itself contains error, we note four key sources of uncertainty: (1) gauge-based precipitation grids can be biased by under-catch and sparse station density; (2) not all of the subbasins were within the Post Oak Savannah's boundary, so lateral inflows/outflows can distort basin averages, (3) long-term soil- and groundwater-storage changes are assumed negligible, yet seasonal drought–recharge cycles can shift storage by several cm; and (4) small reservoirs and irrigation withdrawals remain the streamflow record, potentially inflating inferred ET during dry years.
Performance varied markedly among years. In 2009–2010, annual rainfall totals were near the long-term mean, but precipitation was concentrated in northern catchments and deficient in the south, creating north–south gradients that the basin-wide WBET captured but MOD16 ET did not, thereby showing increased RMSE values. During the extreme droughts of 2011 and 2022, MOD16 overestimated by 77 and 117 mm (Fig. 4), respectively, exposing a known weakness in the algorithm in representing soil-moisture stress when stomatal conductance is modeled from meteorology alone (Hu et al., 2015; Miralles et al., 2016; Majozi et al., 2017). Therefore, although our semiarid basins showed comparatively higher values, the literature shows that MOD16 often struggles in arid and semiarid environments because it lacks an explicit soil-moisture constraint – making overprediction likely when soils are critically dry even within otherwise well-performing regions. By contrast, biases in wetter years – such as 2015 and 2016 (−62 and −80 mm, respectively; Fig. 4) – were modest but still larger than those in average-precipitation years. These residual errors may reflect reduced available energy under persistent cloud cover and/or enhanced flood-plain evaporation that raised actual ET beyond what MOD16 captured.
Spatial patterns echoed these temporal contrasts. The humid northeastern basins (HUC8s 1–4) exhibited the lowest accuracy (R2 = 0.11–0.39; RMSE = 92–104 mm; Fig. 4) because a dense matrix of small wetlands and ponds leaves many 500 m MODIS pixels as mixed water–vegetation surfaces – even after masking open-water and wetland pixels – thereby inflating MOD16 ET relative to WBET. Conversely, the semiarid central and southwestern basins (HUC8s 7–11) showed the best agreement (R2 = 0.54–0.70; RMSE = 63–79 mm; Fig. 4), consistent with earlier findings that MOD16 may perform relatively well where soils are thin and vegetation sparse (Du and Song, 2018; Velpuri et al., 2013) – provided soil moisture is not fully depleted.
Finally, our aggregated statistics (RMSE = 103 mm yr−1; R2 = 0.65; Fig. 4) fall between the high accuracy reported for Brazil's Caatinga (≈ 59 mm yr−1; R2 = 0.82; Miranda et al., 2017) and the lower accuracy in the Brazilian Cerrado (RMSE = 168 mm yr−1; bias 19 %; Ruhoff et al., 2013). Results from northwest Mexico (R2 = 0.46–0.86; RMSE = 142–168 mm; Aguilar et al., 2018) bracket our values and underscore a consistent limitation: MOD16 normalizes extremes – overestimating ET when soils are parched and underestimating in complex, water-rich mosaics – highlighting the need for soil-moisture constraints in future versions.
4.2 Monthly and seasonal trends
We observed peak precipitation in May and October, which aligns with the expected wet (spring and fall) and dry (summer) seasons characteristic of a humid subtropical climate (Fig. 5). Correspondingly, each canopy cover class showed its highest ET rates in June (Fig. 5). This peak likely results from a combination of actively growing vegetation, abundant soil moisture following increased May rainfall, and warm air temperatures that raise the vapor pressure deficit (VPD) and therefore the atmosphere's capacity to hold water vapor (Liu et al., 2017; Sun et al., 2023). In addition, because our study area lies in the Northern Hemisphere, the summer solstice occurs in June, providing heightened solar radiation, which further increases PET (Aschonitis et al., 2017).
Despite July and August being the warmest months, ET declines substantially during this period (Fig. 5). We attribute this decrease to reduced soil moisture storage, which is rapidly depleted via high-VPD-induced transpiration and evaporation (Mondal et al., 2024; Yang et al., 2023; Anav et al., 2018). This trend persists into the cooler months, when air temperatures begin to drop and rainfall increases, such that ET begins to rise again only in February as air temperatures rebound.
Interestingly, the ≥ 81 % canopy cover class does not exhibit the highest ET in every month but only from April to September (Fig. 5). One explanation is that heavily thicketized (≥ 81 %) woodlands may have a more complex vertical structure – comprising both deciduous and evergreen species – such that the overlapping foliage layers produce a more closed canopy during the warmer months (Whitehurst et al., 2013; Arumäe and Lang, 2018; Scott et al., 2014; Jucker et al., 2015). Many thicketized Post Oak Savannah stands consist of oak overstory combined with an understory of evergreen species such as Juniperus virginiana and Ilex vomitoria (Olariu et al., 2024; Basant et al., 2023). In contrast, woodlands with 61 %–80 % canopy cover are generally dominated by evergreen species (Pourrahmati et al., 2023; Arumäe and Lang, 2018; Stephens et al., 2015), which remain active during cooler months – potentially explaining their higher ET from October through March. For instance, extensive Pinus taeda stands are found in the eastern Post Oak Savannah, adjacent to the Piney Woods ecoregion. Owing to their needle-shaped leaves, Pinus taeda woodlands typically range from 60 %–80 % canopy cover, the higher percentages associated with mid-aged stands that include a mix of younger and older trees, eventually forming gaps in older stands (Song et al., 2009; Zeide and Stephens, 2010; Johnson et al., 2021).
Seasonal ET trends closely followed seasonal precipitation (Fig. 6). From 2011 to 2014, monthly precipitation averaged 60 mm, resulting in minimal seasonal variation in ET. Between 2015 and 2021, however, monthly precipitation rose to an average of 86 mm – a 26 mm increase – which widened the seasonal stratification in ET. This increased stratification is attributable to higher transpiration rates during spring and summer, driven by the ample water supply that maintained elevated soil moisture (Fu et al., 2022; Koehler et al., 2023).
Notably, the severe drought of 2011 (Nielsen-Gammon, 2012; Chen et al., 2021) caused summer and fall ET to drop to winter-like levels (Fig. 6). Although spring ET remained near average, this was likely a residual effect of the relatively wet conditions in 2009 and the average precipitation in 2010. The 2011 drought caused an estimated mortality of 65.6 (± 7.3) million trees in East Texas alone – encompassing common Post Oak Savannah species such as Quercus stellata, Quercus falcata, Ulmus alata, and Pinus taeda (Klockow et al., 2018). Additionally, the difference between precipitation and PET in 2011 reached −1206 mm (Schwantes et al., 2017). Widespread wildfires consumed nearly 4 million acres across Texas – 31 453 individual fires – representing 47.3 % of all acreage burned by wildfire in the United States that year (Nielsen-Gammon, 2012; Texas A&M Forest Service, 2011).
4.3 Bioclimatic–ET coupling
Evapotranspiration in the Post Oak Savannah showed a moderate positive relationship with precipitation and a weak negative relationship with air temperature (Fig. 7). This P–ET coupling is consistent with global research findings, which highlight the tight linkage between these two fluxes across diverse ecosystems (Mondal and Mishra, 2024; Mondal et al., 2024; Xi et al., 2023; Zeng et al., 2010). The GAM analysis supports this pattern: precipitation explained nearly half of the variance in ET (pseudo-R2 ≈ 0.49) and followed a gently saturating curve, reinforcing the strength of the linear fit. Notably, the correlation was stronger in the more arid regions of the Post Oak Savannah (600–1000 mm vs. ≥ 1001 mm), where limited water availability acts as the primary constraint instead of energy inputs (e.g., radiation and air temperature) (Nagler et al., 2007; Yu et al., 2021). Consequently, in these drier areas, ET begins soon after precipitation events: soils rapidly absorb incoming rainfall, vegetation responds by increasing transpiration, and overall ET rises (Nielsen-Gammon, 2012).
In contrast, the negative relationship between ET and air temperature may appear counterintuitive. However, many plants operate within an optimal air temperature window for photosynthesis and transpiration (commonly 20–30 °C) (Yamasaki et al., 2002; McGowan et al., 2020; Crous et al., 2022). In the Post Oak Savannah, severe summer heat and lower precipitation often drive plants to close their stomata, thereby reducing transpiration despite high VPD. This negative relationship is particularly strong in the most arid (600–800 mm) and most humid (≥ 1200 mm) areas, whereas it is weaker in the intermediate (801–1200 mm) zone. In the arid region, limited soil moisture readily explains stomatal closure and reduced transpiration. In more humid areas, factors such as persistent cloud cover or higher relative humidity may restrict the vertical movement of water vapor from plant surfaces to the atmosphere (Wang et al., 2018; Dai et al., 1999).
GAM fits (magenta curves in Fig. 7) revealed a non-linear, dome-shaped response of annual ET to mean air temperature. ET climbed steadily to a peak at ≈ 22–24 °C, plateaued, and then declined above ∼ 25 °C; the GAM pseudo-R2 was 0.13, only marginally higher than the aggregated linear R2 (0.11), but it captured the threshold beyond which stomatal regulation suppresses transpiration. This pattern is consistent with the divergent thermal strategies of the region's dominant woody species. The evergreen loblolly pine (Pinus taeda) begins to reduce stomatal conductance at leaf temperatures near 32 °C, whereas drought-deciduous post oak (Quercus stellata) and blackjack oak (Q. marilandica) maintain higher conductance until ≈ 35 °C before closing their stomata (Oren et al., 1999; Novick et al., 2016). Because summer days in the Post Oak Savannah frequently exceed these thresholds, particularly during drought years, elevated mean annual temperatures integrate numerous midday periods of stomatal closure, driving down yearly ET despite higher vapor-pressure deficits.
Both canopy cover and canopy height displayed positive relationships with ET, but canopy height was the stronger predictor (Fig. 7). The GAM analysis confirms this contrast: canopy height achieved the highest pseudo-R2 (0.51), whereas canopy cover accounted for far less variance (pseudo-R2 = 0.15). The canopy-height GAM curve is nearly linear across the sampled range, indicating that taller stands consistently increase ET. By contrast, the canopy cover GAM rises sharply up to ∼ 80 % cover and then plateaus, suggesting diminishing returns once the overstory approaches complete closure. Because height integrates above-ground biomass, LAI, and vertical leaf stratification – all key determinants of transpiration (Bonan, 2008; Baldocchi, 2003) – these relationships remain stable across precipitation zones. Taller canopy structures also increase surface roughness, reducing aerodynamic resistance and enhancing turbulent exchange, thereby promoting more efficient transfer of water vapor from the canopy to the atmosphere. Furthermore, taller trees also develop deeper, more extensive root systems that tap subsurface water during droughts, which are common in the summer in the Post Oak Savannah, sustaining transpiration when upper soil layers are dry. Hydraulic lift, where deep-rooted trees redistribute moisture upward (Norton and Hart, 1998), and the complex root architecture of tall individuals (Jackson et al., 2020) together help maintain a dense canopy and elevated ET.
4.4 ET P and excess water
Over the study period, the average ET P ratio in the Post Oak Savannah was 90 % (Fig. 8). Globally, the mean ET P ratio over land surfaces is approximately 65 %, varying by continent. For instance, North America averages around 70 %, whereas Australia – which more closely resembles the Post Oak Savannah's overall conditions – exhibits a higher ratio of 87 % (Reitz et al., 2017; McDonald, 1961). An ET P ratio of 90 % is therefore plausible when compared with other semiarid or arid regions, where studies have reported ratios between 80 % and 93 % (Fleischmann et al., 2023; Irmak, 2017). Moreover, Althoff and Destouni (2023) suggest that ET P will continue to rise as agricultural and forestry activities expand, increasing the prevalence of trees – a pattern already observed in the Post Oak Savannah (Olariu et al., 2024). This high ratio also indicates an ET-driven system, with evapotranspiration as the dominant water-budget component (Condon et al., 2020; Reitz et al., 2017), confirming the assumption made by Basant et al. (2023).
The ET P ratios exceeding 100 % in 2011 and 2022 likely reflect severe drought conditions that forced the ecosystem to draw on limited soil-moisture reserves and, in riparian areas, groundwater. Fleischmann et al. (2023) documented similar behavior in South American riparian zones, consistent with our Post Oak Savannah observations (Fig. 9). Ratios above 100 % may also stem from uncertainties in the MOD16 product, which does not adequately represent plant water stress; under the extreme stress of 2011 and 2022, MOD 16 likely overestimated ET, producing values higher than precipitation.
Excess water (P–ET) exhibited substantial spatial variability, ranging from −5000 mm to over 7500 mm, with an average of ∼ 2500 mm across the entire study period (Fig. 10). However, 2011 and 2022 both showed net negative excess water, explained by the same conditions that led to ET P ratios exceeding 100 %.
Of note, Fig. 11 illustrates a steep decline in excess water with increasing woody cover. As tree and shrub cover expands, transpiration intensifies, lowering the net water surplus. These findings align with those of Basant et al. (2023), who found that understory shrub thicketization in the Post Oak Savannah substantially reduces groundwater recharge. Consequently, under continued WPE, the Post Oak Savannah will likely experience greater reductions in excess water – especially in its more arid regions, where soil moisture is already limited. Such changes may alter local water availability, affect aquifer recharge, and shift ecosystem functioning, as woody plants increasingly outcompete herbaceous vegetation for scarce moisture.
This study demonstrates that ET in the Post Oak Savannah is intricately linked to both climatic drivers and vegetation structure. Our analysis revealed a moderate positive relationship between precipitation and ET, confirming that water availability is a primary driver in this region. Conversely, air temperature exhibited a weak negative relationship with ET – a finding that, while initially counterintuitive, can be explained by plant physiological responses such as stomatal closure during periods of extreme heat. In the context of global warming, rising air temperatures coupled with increasingly sporadic precipitation are likely to exacerbate these dynamics. Higher air temperatures not only elevate the atmospheric demand for water but also promote rapid soil moisture depletion, leading to more pronounced instances of water stress. This decoupling of energy and water fluxes ultimately underlines the importance of understanding the nuanced interplay between climate and hydrology in sustaining regional water resources.
Quantifying how variations in canopy cover affect water use and, thereby, regional hydrological processes is vital for evaluating the impacts of WPE and thicketization on sustainable water management. Our findings indicate that as woody cover increases, excess water decreases – especially in arid regions – owing to enhanced transpiration. This reduction in net water surplus has significant implications for groundwater recharge and ecosystem functioning, as increasing woody vegetation competes with herbaceous species for limited moisture. Consequently, these shifts in vegetation structure demand adaptive management strategies to preserve water availability under future climate scenarios.
While our study employs robust remote sensing and hydrological modeling techniques, several limitations must be acknowledged. First, the absence of eddy covariance towers precludes direct, in situ validation of the MOD16 ET product. However, evaluation at the HUC8 scale via water-balance estimates remains acceptable for a large-scale analysis. Second, the coarser spatial resolution of MOD16 (500 m) may mask fine-scale hydrological processes, particularly in irrigated agricultural areas. Future research employing higher-resolution ET datasets could improve the accuracy of these assessments. Future work can also explore ET products that incorporate thermal-infrared land surface temperature data – such as Sentinel- fusion or two-/three-source energy-balance models – which better diagnose plant water stress in semiarid savannas (Guzinski et al., 2020; González-Dugo et al., 2021; Burchard-Levine et al., 2022; Anderson et al., 2024). Lastly, although the 15-year study period captures critical periods of drought and high rainfall, even longer-term observations would further enhance our understanding of how continued global warming influences the interplay between air temperature, precipitation, and ET.
Overall, these results provide a critical foundation for understanding how climatic changes and woody vegetation dynamics jointly shape regional water cycles. By quantifying the effects of canopy cover on ET and excess water across different precipitation zones, this study informs land managers and policymakers facing the challenges of sustaining water resources under ongoing global warming and WPE – not only in the Post Oak Savannah but also in similar ecosystems worldwide.
Woody coverage code: https://code.earthengine.google.com/08f4a2fdce7672cb261f48fc658850e2 (Olariu, 2025a). Subbasin ET and P code: https://code.earthengine.google.com/c77b2aeb8fc4687677b33c1c141d16bc (Olariu, 2025b). ET P and excess water analysis code: https://code.earthengine.google.com/80ef181f4002d7314a10ae391800189d (Olariu, 2025c). Water year aggregation code: https://code.earthengine.google.com/8b4ee77f99b3e067bae38c8386e150ff (Olariu, 2025d). Pointwise sampling code: https://code.earthengine.google.com/1957d01209128479a368e655b5b75064 (Olariu, 2025e). Monthly MODIS ET code: https://code.earthengine.google.com/2c21005c469551d5646b1ee86812cfe9 (Olariu, 2025f). Monthly P and Ta code: https://code.earthengine.google.com/23bc61414ed99bb58892ea682a965b5e (Olariu, 2025g).
MODIS ET product: https://lpdaac.usgs.gov/products/mod16a2gfv061/ (last access: 25 January 2025) (https://doi.org/10.5067/MODIS/MOD16A2GF.061, Running et al., 2021). Daymet V4 temperature product: https://daac.ornl.gov/cgi-bin/dataset_lister.pl?p=32 (last access: 25 January 2025) (https://doi.org/10.3334/ORNLDAAC/1840, Thornton et al., 2022b). Canopy cover product: https://rangelands.app/rap/?biomass_t=herbaceous&ll=36.5526,-101.3460&z=4&landcover_t=tre (last access: 25 January 2025) (Allred et al., 2020). Canopy height products: https://lasers.tamu.edu/ice-cloudand-land-elevation-satellite-icesat-2-applications/ (Malambo and Popescu, 2024b) and https://glad.umd.edu/dataset/gedi (last access: 25 January 2025) (Potapov et al., 2021b). Runoff products: https://waterwatch.usgs.gov/index.php?id=romap3&sid= w_download (last access: 25 January 2025) (U.S. Geological Survey, 2025).
HGO and BPW conceptualized the research goals and aims. HGO curated the data, performed the formal analysis, conducted the investigation, designed the methodology, prepared the data visualizations, and drafted the initial manuscript. BPW secured the project funding. SCP and BPW supervised the project and contributed to paper review.
The contact author has declared that none of the authors has any competing interests.
Publisher's note: Copernicus Publications remains neutral with regard to jurisdictional claims made in the text, published maps, institutional affiliations, or any other geographical representation in this paper. While Copernicus Publications makes every effort to include appropriate place names, the final responsibility lies with the authors.
This research was supported by funding from the USDA National Institute of Food and Agriculture (NIFA). The authors also gratefully acknowledge the infrastructure and resources provided by Texas A&M University, as well as the advanced remote sensing facilities offered by the LASERS lab, which were instrumental in conducting the data analysis and ensuring the success of this study.
This research was supported by the National Institute of Food and Agriculture (NIFA) under the project “THICKETIZATION OF OAK SAVANNAS: CAN RESTORATION LEAD TO GREATER REGIONAL GROUNDWATER RECHARGE?” (accession no. 1027794, grant no. 2022-67019-36267, proposal no. 2021-09129).
This paper was edited by Mariano Moreno de las Heras and reviewed by two anonymous referees.
Abbott, B. W., Bishop, K., Zarnetske, J. P., Minaudo, C., Chapin, F. S., Krause, S., Hannah, D. M., Conner, L., Ellison, D., Godsey, S. E., Plont, S., Marçais, J., Kolbe, T., Huebner, A., Frei, R. J., Hampton, T., Gu, S., Buhman, M., Sara Sayedi, S., Ursache, O., Chapin, M., Henderson, K. D., and Pinay, G.: Human domination of the global water cycle absent from depictions and perceptions, Nat. Geosci., 12, 533–540, https://doi.org/10.1038/s41561-019-0374-y, 2019.
Acharya, B. S., Kharel, G., Zou, C. B., Wilcox, B. P., and Halihan, T.: Woody Plant Encroachment Impacts on Groundwater Recharge: A Review, Water, 10, 1466, https://doi.org/10.3390/W10101466, 2018.
Afinowicz, J. D., Munster, C. L., and Wilcox, B. P.: Modeling Effects of Brush Management on the Rangeland Water Budget: Edwards Plateau, Texas, JAWRA J. Am. Water Resour. Assoc., 41, 181–193, https://doi.org/10.1111/J.1752-1688.2005.TB03727.X, 2005.
Aguilar, A. L., Flores, H., Crespo, G., Marín, M. I., Campos, I., and Calera, A.: Performance Assessment of MOD16 in Evapotranspiration Evaluation in Northwestern Mexico, Water, 10, 901, https://doi.org/10.3390/W10070901, 2018.
Akinsanola, A. A., Chen, Z., Kooperman, G. J., and Bobde, V.: Robust future intensification of winter precipitation over the United States, npj clim. Atmos. Sci., 7, 212, https://doi.org/10.1038/s41612-024-00761-8, 2024.
Alessi, M. J., Herrera, D. A., Evans, C. P., DeGaetano, A. T., and Ault, T. R.: Soil Moisture Conditions Determine Land-Atmosphere Coupling and Drought Risk in the Northeastern United States, J. Geophys. Res.-Atmos., 127, e2021JD034740, https://doi.org/10.1029/2021JD034740, 2022.
Ali, Y. and Rahman, M. M.: Quantifying forest stocking changes in Sundarbans mangrove using remote sensing data, Sci. Remote Sens., 11, 100181, https://doi.org/10.1016/J.SRS.2024.100181, 2025.
Allred, B. W., Jones, M. O., Naugle, D. E., and Twidwell, D.: Rangeland Analysis Platform (RAP) Canopy Cover Product [data set], https://rangelands.app/rap (last access: 25 January 2025), 2020.
Allred, B. W., Bestelmeyer, B. T., Boyd, C. S., Brown, C., Davies, K. W., Duniway, M. C., Ellsworth, L. M., Erickson, T. A., Fuhlendorf, S. D., Griffiths, T. V., Jansen, V., Jones, M. O., Karl, J., Knight, A., Maestas, J. D., Maynard, J. J., McCord, S. E., Naugle, D. E., Starns, H. D., Twidwell, D., and Uden, D. R.: Improving Landsat predictions of rangeland fractional cover with multitask learning and uncertainty, Method. Ecol. Evol., 12, 841–849, https://doi.org/10.1111/2041-210X.13564, 2021.
Althoff, D. and Destouni, G.: The global freshwater system: Patterns and predictability of green-blue water flux partitioning, arXiv, https://doi.org/10.48550/arXiv.2302.11245, 2023.
Anav, A., Proietti, C., Menut, L., Carnicelli, S., De Marco, A., and Paoletti, E.: Sensitivity of stomatal conductance to soil moisture: Implications for tropospheric ozone, Atmos. Chem. Phys., 18, 5747–5763, https://doi.org/10.5194/ACP-18-5747-2018, 2018.
Anchang, J. Y., Prihodko, L., Ji, W., Kumar, S. S., Ross, C. W., Yu, Q., Lind, B., Sarr, M. A., Diouf, A. A., and Hanan, N. P.: Toward operational mapping of woody canopy cover in tropical savannas using google earth engine, Front. Environ. Sci., 8, 4, https://doi.org/10.3389/fenvs.2020.00004, 2020.
Anderson, M. C., Kustas, W. P., Norman, J. M., Diak, G. T., Hain, C. R., Gao, F., Yang, Y., Knipper, K. R., Xue, J., Yang, Y., Crow, W. T., Holmes, T. R. H., Nieto, H., Guzinski, R., Otkin, J. A., Mecikalski, J. R., Cammalleri, C., Torres-Rua, A. T., Zhan, X., Fang,L., and Agam, N.: A brief history of the thermal IR-based Two-Source Energy Balance (TSEB) model – diagnosing evapotranspiration from plant to global scales, Agr. Forest Meteorol., 350, 109951. https://doi.org/10.1016/j.agrformet.2024.109951, 2024.
Arumäe, T. and Lang, M.: Estimation of canopy cover in dense mixed-species forests using airborne lidar data, Eur. J. Remote Sens., 51, 132–141, https://doi.org/10.1080/22797254.2017.1411169, 2018.
Aschonitis, V. G., Papamichail, D., Demertzi, K., Colombani, N., Mastrocicco, M., Ghirardini, A., Castaldelli, G., and Fano, E. A.: High-resolution global grids of revised Priestley-Taylor and Hargreaves-Samani coefficients for assessing ASCE-standardized reference crop evapotranspiration and solar radiation, Earth Syst. Sci. Data, 9, 615–638, https://doi.org/10.5194/ESSD-9-615-2017, 2017.
Baldocchi, D. D.: Assessing the eddy covariance technique for evaluating carbon dioxide exchange rates of ecosystems: Past, present and future, Glob. Change Biol., 9, 479–492, https://doi.org/10.1046/J.1365-2486.2003.00629.X, 2003.
Basant, S., Wilcox, B. P., Wyatt, B. Newman, B. and Parada, C.: Thicketized oak woodlands reduce groundwater recharge, Sci. Total Environ., 862, 160811, https://doi.org/10.1016/j.scitotenv.2022.160811, 2023.
Bennemann, C., Labelle, E. R., and Lussier, J. M.: Influence of Tree, Stand, and Site Attributes on Hardwood Product Yield: Insights into the Acadian Forests, Forests, 14, 182, https://doi.org/10.3390/f14020182, 2023.
Berg, A. and Sheffield, J.: Soil Moisture–Evapotranspiration Coupling in CMIP5 Models: Relationship with Simulated Climate and Projections, J. Clim., 31, 4865–4878, https://doi.org/10.1175/JCLI-D-17-0757.1, 2018.
Bhat, S. A., Qadri, S. A. A., Dubbey, V., Sofi, I. B., and Huang, N. F.: Impact of crop management practices on maize yield: Insights from farming in tropical regions and predictive modeling using machine learning, J. Agric. Food Res., 18, 101392, https://doi.org/10.1016/J.JAFR.2024.101392, 2024.
Blan, L. and Butler, R.: Comparing Effects of Aggregation Methods on Statistical and Spatial Properties of Simulated Spatial Data, Photogramm. Eng. Remote Sens., 65, 73–84, 1999.
Bonan, G. B.: Forests and climate change: Forcings, feedbacks, and the climate benefits of forests, Science, 320, 1444–1449, 2008.
Brandsma, T. and Können, G. P.: Application of nearest-neighbor resampling for homogenizing temperature records on a daily to sub-daily level, Int. J. Climatol., 26, 75–89, https://doi.org/10.1002/JOC.1236, 2006.
Breiman, L.: Random Forests, Mach. Learn., 45, 5–32, https://doi.org/10.1023/A:1010933404324, 2001.
Brudvig, L. A. and Asbjornsen, H.: The removal of woody encroachment restores biophysical gradients in Midwestern oak savannas, J. Appl. Ecol., 46, 231–240, https://doi.org/10.1111/j.1365-2664.2008.01590.x, 2009.
Brudvig, L. A.: Woody encroachment removal from Midwestern oak savannas alters understory diversity across space and time, Restor. Ecol., 18, 74–84, https://doi.org/10.1111/j.1526-100X.2008.00431.x, 2010.
Burchard-Levine, V., Nieto, H., Riaño, D., Kustas, W. P., Migliavacca, M., El-Madany, T. S., Nelson, J. A., Andreu, A., Carrara, A., Beringer, J., Baldocchi, D., and Martín, M. P.: A remote sensing-based three-source energy balance model to improve global estimations of evapotranspiration in semi-arid tree-grass ecosystems, Glob. Change Biol., 28, 1493–1515, https://doi.org/10.1111/gcb.16002, 2022
Campbell, E. G.: Plant relations in Brazos County, Texas with special reference to eastern and western types, Ecology, 6, 163–170, 1925.
Chen, W., Huang, C., and Yang, Z. L.: More severe drought detected by the assimilation of brightness temperature and terrestrial water storage anomalies in Texas during 2010–2013, J. Hydrol., 603, 126802, https://doi.org/10.1016/j.jhydrol.2021.126802, 2021.
Condon, L. E., Atchley, A. L., and Maxwell, R. M.: Evapotranspiration depletes groundwater under warming over the contiguous United States, Nat. Commun. 11, 1–8, https://doi.org/10.1038/s41467-020-14688-0, 2020.
Crous, K. Y., Uddling, J., and De Kauwe, M. G.: Temperature responses of photosynthesis and respiration in evergreen trees from boreal to tropical latitudes, New Phytol., 234, 353–374, https://doi.org/10.1111/NPH.17951, 2022.
Dai, A., Trenberth, K. E., and Karl, T. R.: Effects of Clouds, Soil Moisture, Precipitation, and Water Vapor on Diurnal Temperature Range, J. Clim., 12, 2451–2473, https://doi.org/10.1175/1520-0442(1999)012<2451:EOCSMP>2.0.CO;2, 1999.
Dai, A., Zhao, T., and Chen, J.: Climate Change and Drought: a Precipitation and Evaporation Perspective, Curr. Clim. Change Rep., 4, 301–312, 2018.
Dey, P., Roy, S., Bathi, J. R., and Mishra, A.: Evaluation of Uncertainty in Stream Flow Prediction Using Monte Carlo Simulation for Watershed-Scale Hydrological Modeling, J. Hydrol. Eng., 29, 05023026, https://doi.org/10.1061/JHYEFF.HEENG-6008, 2024.
Diggs, G. M., Lipscomb, B. L., and O'Kennon, R. J.: Illustrated flora of North Central Texas, Botanical Research Institute of Texas, Fort Worth, ISBN 978-1889878010, Texas, 1999.
Dixon, A. P., Faber-Langendoen, D., Josse, C., Morrison, J., and Loucks, C. J.: Distribution mapping of world grassland types, J. Biogeogr., 41, 2003–2019, https://doi.org/10.1111/JBI.12381, 2014.
Du, J. and Song, K.: Validation of Global Evapotranspiration Product (MOD16) Using Flux Tower Data from Panjin Coastal Wetland, Northeast China, Chin. Geogr. Sci., 28, 420–429, 2018.
Dugas, W. A., Hicks, R. A., and Wright, P.: Effect of removal of Juniperus ashei on evapotranspiration and runoff in the Seco Creek Watershed, Water Resour. Res., 34, 1499–1506, https://doi.org/10.1029/98WR00556, 1998.
Ershadi, A., McCabe, M. F., Evans, J. P., and Wood, E. F.: Impact of model structure and parameterization on Penman–Monteith type evaporation models, J. Hydrol., 525, 521–535, https://doi.org/10.1016/J.JHYDROL.2015.04.008, 2015.
Falkenmark, M., Lundqvist, J., and Widstrand, C.: Macro-scale water scarcity requires micro-scale approaches, Nat. Resour. Forum, 13, 258–267, https://doi.org/10.1111/J.1477-8947.1989.TB00348.X, 1989.
Feng, S. and Fu, Q.: Expansion of global drylands under a warming climate, Atmos. Chem. Phys., 13, 10081–10094, https://doi.org/10.5194/acp-13-10081-2013, 2013.
Fleischmann, A. S., Laipelt, L., Papa, F., Paiva, R. C. D. de, de Andrade, B. C., Collischonn, W., Biudes, M. S., Kayser, R., Prigent, C., Cosio, E., Machado, N. G., and Ruhoff, A.: Patterns and drivers of evapotranspiration in South American wetlands, Nat. Commun., 14, 6656, https://doi.org/10.1038/S41467-023-42467-0, 2023.
Fu, Z., Ciais, P., Feldman, A. F., Gentine, P., Makowski, D., Prentice, I. C., Stoy, P. C., Bastos, A., and Wigneron, J. P.: Critical soil moisture thresholds of plant water stress in terrestrial ecosystems, Sci. Adv., 8, 7827, https://doi.org/10.1126/sciadv.abq7827, 2022.
Garza, N. E. and Blackburn, W. H.: The Effect of Early Winter or Spring Burning on Runoff, Sediment, and Vegetation in the Post Oak Savannah of Texas, J. Range Manag., 38, 283–287, 1985.
González-Dugo, M. P., Chen, X., Andreu, A., Carpintero, E., Gómez-Giraldez, P. J., Carrara, A., and Su, Z.: Long-term water stress and drought assessment of Mediterranean oak savanna vegetation using thermal remote sensing, Hydrol. Earth Syst. Sci., 25, 755–768, https://doi.org/10.5194/hess-25-755-2021, 2021.
Gorelick, N., Hancher, M., Dixon, M., Ilyushchenko, S., Thau, D., and Moore, R.: Google Earth Engine: Planetary-scale geospatial analysis for everyone, Remote Sens. Environ., 202, 18–27, https://doi.org/10.1016/J.RSE.2017.06.031, 2017.
Griffith, G. E., Bryce, S. B., and Omernik, J. M.: Ecoregions of Texas, U.S. Geological Survey, Austin, TX, https://dmap-prod-oms-edc.s3.us-east-1.amazonaws.com/ORD/Ecoregions/tx/TXeco_Jan08_v8_Cmprsd.pdf (last access: 29 September 2025), 2007.
Guenther, E., Magruder, L., Neuenschwander, A., Maze-England, D., and Dietrich, J.: Examining CNN terrain model for TanDEM-X DEMs using ICESat-2 data in Southeastern United States, Remote Sens. Environ., 311, 114293, https://doi.org/10.1016/j.rse.2024.114293, 2024.
Guo, L., Zhang, Y., Xu, M., Yan, J., Zhang, H., Zou, Y., and Gao, J.: A Novel Workflow for Mapping Forest Canopy Height by Synergizing ICESat-2 and Multi-Sensor Data, Forests, 15, 2139, https://doi.org/10.3390/f15122139, 2024.
Guzinski, R., Nieto, H., Sandholt, I., and Karamitilios, G.: Modelling High-Resolution Actual Evapotranspiration through Sentinel-2 and Sentinel-3 Data Fusion, Remote Sens., 12, 9, 1433, https://doi.org/10.3390/rs12091433, 2020
Hawker, L., Uhe, P., Paulo, L., Sosa, J., Savage, J., Sampson, C., and Neal, J.: A 30 m global map of elevation with forests and buildings removed, Environ. Res. Lett., 17, 024016, https://doi.org/10.1088/1748-9326/AC4D4F, 2022.
He, M., Anderson, J., Lynn, E., and Arnold, W.: Projected Changes in Water Year Types and Hydrological Drought in California's Central Valley in the 21st Century, Climate, 9, 26, https://doi.org/10.3390/CLI9020026, 2021.
Hu, T., Cao, M., Zhao, X., Liu, Z., Liu, L., Huang, S., Tang, Z., Liu, M., Kelly, M., Fang, J., and Su, Y.: High-resolution mapping of grassland canopy cover in China through the integration of extensive drone imagery and satellite data, ISPRS J. Photogramm. Remote Sens., 218, 69– 83, https://doi.org/10.1016/j.isprsjprs.2024.09.004, 2024.
Hu, G., Jia, L., and Menenti, M.: Comparison of MOD16 and LSA-SAF MSG evapotranspiration products over Europe for 2011, Remote Sens. Environ., 156, 510–526, https://doi.org/10.1016/j.rse.2014.10.017, 2015.
Hudson, T. D., Reeves, M. C., Hall, S. A., Yorgey, G. G., and Neibergs, J. S.: Big landscapes meet big data: Informing grazing management in a variable and changing world, Rangelands, 43, 17–28, https://doi.org/10.1016/J.RALA.2020.10.006, 2021.
Irmak, S.: Estimating Crop Evapotranspiration from Reference Evapotranspiration and Crop Coefficients (NebGuide G1994), Nebraska Extension, University of Nebraska–Lincoln, Lincoln, NE, 9, https://extensionpubs.unl.edu/publication/g1994/na/html/view (last access: 29 September 2025), 2017.
Jackson, R. B., Pockman, W. T., Hoffmann, W. A., Bleby, T. M., and Armas, C.: Structure and Function of Root Systems, in: Functional Plant Ecology, 2nd Edn., CRC Press, Boca Raton, 24 pp., https://doi.org/10.1201/9781420007626-5, 2007.
Johnson, D. J., Magee, L., Pandit, K., Bourdon, J., Broadbent, E. N., Glenn, K., Kaddoura, Y., Machado, S., Nieves, J., Wilkinson, B. E., Almeyda Zambrano, A. M., and Bohlman, S. A.: Canopy tree density and species influence tree regeneration patterns and woody species diversity in a longleaf pine forest, Forest Ecol. Manag., 490, 119082, https://doi.org/10.1016/J.FORECO.2021.119082, 2021.
Jucker, T., Bouriaud, O., and Coomes, D. A.: Crown plasticity enables trees to optimize canopy packing in mixed-species forests, Funct. Ecol., 29, 1078–1086, https://doi.org/10.1111/1365-2435.12428, 2015.
Kim, H. W., Hwang, K., Mu, Q., Lee, S. O., and Choi, M.: Validation of MODIS 16 global terrestrial evapotranspiration products in various climates and land cover types in Asia, KSCE J. Civil Eng., 16, 229–238, 2012.
Klockow, P. A., Vogel, J. G., Edgar, C. B., and Moore, G. W.: Lagged mortality among tree species four years after an exceptional drought in east Texas, Ecosphere, 9, e02455, https://doi.org/10.1002/ECS2.2455, 2018.
Koehler, T., Wankmüller, F. J. P., Sadok, W., and Carminati, A.: Transpiration response to soil drying versus increasing vapor pressure deficit in crops: physical and physiological mechanisms and key plant traits, J. Exp. Bot., 74, 4789, https://doi.org/10.1093/JXB/ERAD221, 2023.
Liu, C., Sun, G., McNulty, S. G., Noormets, A., and Fang, Y.: Environmental controls on seasonal ecosystem evapotranspiration/potential evapotranspiration ratio as determined by the global eddy flux measurements, Hydrol. Earth Syst. Sci., 21, 311–322, https://doi.org/10.5194/hess-21-311-2017, 2017.
Loewensteiner, D. A., Bartolo, R. E., Whiteside, T. G., Esparon, A. J., and Humphrey, C. L.: Measuring savanna woody cover at scale to inform ecosystem restoration, Ecosphere, 12, e03437, https://doi.org/10.1002/ECS2.3437, 2021.
Majozi, N. P., Mannaerts, C. M., Ramoelo, A., Mathieu, R., Mudau, A. E., and Verhoef, W.: An intercomparison of satellite-based daily evapotranspiration estimates under different eco-climatic regions in South Africa, Remote Sens., 9, 307, https://doi.org/10.3390/rs9040307, 2017.
Malambo, L. and Popescu, S.: Mapping vegetation canopy height across the contiguous United States using ICESat-2 and ancillary datasets, Remote Sens. Environ., 309, 114226, https://doi.org/10.1016/J.RSE.2024.114226, 2024a.
Malambo, L. and Popescu, S.: ICESat-2 Canopy Height Products, Texas A&M University [data set], https://lasers.tamu.edu/ice-cloudand-land-elevation-satellite-icesat-2-applications/ (last access: 25 January 2025), 2024b.
McBride, J. B.: The vegetation and habitat factors of the Carrizo sands, Ecol. Monogr., 3, 247–297, 1933.
McDonald, J. E.: On the Ratio of Evaporation to Precipitation, Bull. Am. Meteorol. Soc., 42, 185–189, https://doi.org/10.1175/1520-0477-42.3.185, 1961.
McGowan, H. A., Lowry, A. L., and Gray, M. A.: Identification of Optimum Temperatures for Photosynthetic Production in Subtropical Coastal Ecosystems: Implications for CO2 Sequestration in a Warming World, J. Geophys. Res.-Biogeo., 125, e2020JG005678, https://doi.org/10.1029/2020JG005678, 2020.
Midwood, A. J., Boutton, T. W., Archer, S. R., and Watts, S. E.: Water use by woody plants on contrasting soils in a savanna parkland: Assessment with δ2H and δ18O, Plant Soil, 205, 13–24, https://doi.org/10.1023/A:1004355423241, 1998.
Miralles, D. G., Jiménez, C., Jung, M., Michel, D., Ershadi, A., McCabe, M. F., Hirschi, M., Martens, B., Dolman, A. J., Fisher, J. B., Mu, Q., Seneviratne, S. I., Wood, E. F., and Fernández-Prieto, D.: The WACMOS-ET project – Part 2: Evaluation of global terrestrial evaporation data sets, Hydrol. Earth Syst. Sci., 20, 823–842, https://doi.org/10.5194/hess-20-823-2016, 2016.
Miranda, R. D. Q., Galvíncio, J. D., Moura, M. S. B. De, Jones, C. A., and Srinivasan, R.: Reliability of MODIS Evapotranspiration Products for Heterogeneous Dry Forest: A Study Case of Caatinga, Adv. Meteorol., 2017, 9314801, https://doi.org/10.1155/2017/9314801, 2017.
Mondal, S. and Mishra, A.: Quantifying the Precipitation, Evapotranspiration, and Soil Moisture Network's Interaction Over Global Land Surface Hydrological Cycle, Water Resour. Res., 60, e2023WR034861, https://doi.org/10.1029/2023WR034861, 2024.
Mondal, S. K., An, S. Il, Min, S. K., Jiang, T., and Su, B.: Enhanced soil moisture–temperature coupling could exacerbate drought under net-negative emissions, Clim. Atmos. Sci., 7, 1–12, https://doi.org/10.1038/s41612-024-00820-0, 2024.
Morford, S. L., Allred, B. W., Twidwell, D., Jones, M. O., Maestas, J. D., Roberts, C. P., and Naugle, D. E.: Herbaceous production lost to tree encroachment in United States rangelands, J. Appl. Ecol., 59, 2971–2982, https://doi.org/10.1111/1365-2664.14288, 2022.
Mu, Q., Heinsch, F. A., Zhao, M., and Running, S. W.: Development of a global evapotranspiration algorithm based on MODIS and global meteorology data, Remote Sens. Environ., 111, 519–536, https://doi.org/10.1016/J.RSE.2007.04.015, 2007.
Mu, Q., Zhao, M., and Running, S. W.: Improvements to a MODIS global terrestrial evapotranspiration algorithm, Remote Sens. Environ., 115, 1781–1800, https://doi.org/10.1016/J.RSE.2011.02.019, 2011.
Nadzri, M. I. and Hashim, M.: Validation of MODIS Data for localized spatio-temporal evapotranspiration mapping, in: IOP Conference Series: Earth and Environmental Science, 012183, https://doi.org/10.1088/1755-1315/18/1/012183, 2014.
Nagler, P. L., Glenn, E. P., Kim, H., Emmerich, W., Scott, R. L., Huxman, T. E., and Huete, A. R.: Relationship between evapotranspiration and precipitation pulses in a semiarid rangeland estimated by moisture flux towers and MODIS vegetation indices, J. Arid Environ., 70, 443–462, https://doi.org/10.1016/J.JARIDENV.2006.12.026, 2007.
Nielsen-Gammon, J. W.: The 2011 Texas Drought, Texas Water J., 3, 59–95, https://doi.org/10.21423/TWJ.V3I1.6463, 2012.
Nielsen-Gammon, J., Banner, J., Cook, B., Tremaine, D., Wong, C., Mace, R., Gao, H., Yang, Z., Gonzalez, M., Hoffpauir, R., Gooch, T., and Kloesel, K.: Unprecedented drought challenges for Texas water resources in a changing climate: What do researchers and stakeholders need to know?, Earths Future, 8, 001552, https://doi.org/10.1029/2020EF001552, 2020.
Norton, J. L. and Hart, S. C.: Hydraulic lift: A potentially important ecosystem process, Trends Ecol. Evol., 13, 232–235, https://doi.org/10.1016/S0169-5347(98)01328-7, 1998.
Novick, K. A., Ficklin, D. L., Stoy, P. C., Williams, C. A., Bohrer, G., Oishi, A. C., Papuga, S. A., Blanken, P. D., Noormets, A., Sulman, B. N., Scott, R. L., Wang, L., and Phillips, R. P.: The increasing importance of atmospheric demand for ecosystem water and carbon fluxes, Nat. Clim. Change, 6, 1023–1027, https://doi.org/10.1038/nclimate3114, 2016.
Null, S. E. and Viers, J. H.: In bad waters: Water year classification in nonstationary climates, Water Resour. Res., 49, 1137–1148, https://doi.org/10.1002/WRCR.20097, 2013.
Oki, T. and Kanae, S.: Global hydrological cycles and world water resources, Science, 313, 1068–1072, 2006.
Olariu, H. G.: TS34 Woody coverage code, Google Earth Engine [code], https://code.earthengine.google.com/08f4a2fdce7672cb261f48fc658850e2 (last access: 25 January 2025), 2025a.
Olariu, H. G.: Subbasin ET and Precipitation code, Google Earth Engine [code], https://code.earthengine.google.com/c77b2aeb8fc4687677b33c1c141d16bc (last access: 25 January 2025), 2025b.
Olariu, H. G.: ET, Precipitation, and excess water analysis code, Google Earth Engine [code], https://code.earthengine.google.com/80ef181f4002d7314a10ae391800189d (last access: 25 January 2025), 2025c.
Olariu, H. G.: Water year aggregation code, Google Earth Engine [code], https://code.earthengine.google.com/8b4ee77f99b3e067bae38c8386e150ff (last access: 25 January 2025), 2025d.
Olariu, H. G.: Pointwise sampling code, Google Earth Engine [code], https://code.earthengine.google.com/1957d01209128479a368e655b5b75064 (last access: 25 January 2025), 2025e.
Olariu, H. G.: Monthly MODIS ET code, Google Earth Engine [code], https://code.earthengine.google.com/2c21005c469551d5646b1ee86812cfe9 (last access: 25 January 2025), 2025f.
Olariu, H. G.: Monthly Precipitation and Temperature code, Google Earth Engine [code], https://code.earthengine.google.com/23bc61414ed99bb58892ea682a965b5e (last access: 25 January 2025), 2025g.
Olariu, H. G., Wilcox, B. P., and Popescu, S. C.: Examining changes in woody vegetation cover in a human-modified temperate savanna in Central Texas between 1996 and 2022 using remote sensing, Front. Forest. Glob. Change, 7, 1396999, https://doi.org/10.3389/ffgc.2024.1396999, 2024.
Omernik, J. M. and Griffith, G. E.: Ecoregions of the conterminous United States: evolution of a hierarchical spatial framework, Environ. Manag., 54, 1249–1266, https://doi.org/10.1007/S00267-014-0364-1, 2014.
Oren, R., Sperry, J. S., Katul, G. G., Pataki, D. E., Ewers, B. E., Philips, N., and Shäfer, K. V. R.: Survey and synthesis of intra- and interspecific variation in stomatal sensitivity to vapour pressure deficit, Plant Cell Environ., 22, 1515–1526, https://doi.org/10.1046/j.1365-3040.1999.00513.x, 1999.
Papacharalampous, G. and Hristos, T.: Hydrological time series forecasting using simple combinations: Big data testing and investigations on one-year ahead river flow predictability, J. Hydrol., 590, 125205, https://doi.org/10.1016/j.jhydrol.2020.125205, 2020.
Parmalee, P.: Some factors affecting nesting success of the Bob-white Quail in east-central Texas, Am. Midl. Nat., 53, 45–55, 1955.
Plappert, J. L., Veech, J. A., Martina, J. P., and Giocomo, J. J.: Canopy cover as the primary factor affecting habitat use by grassland-shrubland bird species in central Texas, USA, J. Field Ornithol., 95, art10, https://doi.org/10.5751/JFO-00518-950310, 2024.
Potapov, P., Li, X., Hernandez-Serna, A., Tyukavina, A., Hansen, M. C., Kommareddy, A., Pickens, A., Turubanova, S., Tang, H., Silva, C. E., Armston, J., Dubayah, R., Blair, J. B., and Hofton, M.: Mapping global forest canopy height through integration of GEDI and Landsat data, Remote Sens. Environ., 253, 112165, https://doi.org/10.1016/J.RSE.2020.112165, 2021a.
Potapov, P., Li, X., Hernandez-Serna, A., Tyukavina, A., Hansen, M. C., and Kommareddy, I.: GEDI Canopy Height Dataset, University of Maryland [data set], https://glad.umd.edu/dataset/gedi (last access: 25 January 2025), 2021b.
Pourrahmati, M. R., Baghdadi, N., and Fayad, I.: Comparison of GEDI LiDAR Data Capability for Forest Canopy Height Es- 100 timation over Broadleaf and Needleleaf Forests, Remote Sens., 15, 1522, https://doi.org/10.3390/RS15061522, 2023.
Qiao, L., Zou, C. B., Will, R. E., and Stebler, E.: Calibration of SWAT model for woody plant encroachment using paired experimental watershed data, J. Hydrol., 523, 231–239, https://doi.org/10.1016/J.JHYDROL.2015.01.056, 2015.
Ramoelo, A., Majozi, N., Mathieu, R., Jovanovic, N., Nickless, A., and Dzikiti, S.: Validation of Global Evapotranspiration Product (MOD16) using Flux Tower Data in the African Savanna, South Africa, Remote Sens., 6, 7406–7423, https://doi.org/10.3390/RS6087406, 2014.
Reitz, M., Senay, G. B., and Sanford, W. E.: Combining Remote Sensing and Water-Balance Evapotranspiration Estimates for the Conterminous United States, Remote Sens., 9, 1181, https://doi.org/10.3390/RS9121181, 2017.
Retallack, A., Finlayson, G., Ostendorf, B., Clarke, K., and Lewis, M.: Remote sensing for monitoring rangeland condition: Current status and development of methods, Environ. Sustain. Indic., 19, 100285, https://doi.org/10.1016/J.INDIC.2023.100285, 2023.
Roy, A. D., Mohan, M., Hendy, I., AlMealla, R., Watt, M. S., Burt, J. A., Torres-Florez, J. P., Almansoori, A., Alzahlawi, N., Abdullah, M., Ali, T., Nithyanandan, M., Aboobacker, V. A., and de-Miguel, A.: Optimizing mangrove afforestation site selection in gulf cooperation council nations using remote sensing and machine learning, Sci. Total Environ., 988, 179805, https://doi.org/10.1016/j.scitotenv.2025.179805, 2025.
Ruhoff, A. L., Paz, A. R., Aragao, L. E. O. C., Mu, Q., Malhi, Y., Collischonn, W., Rocha, H. R., and Running, S. W.: Assessment of the MODIS global evapotranspiration algorithm using eddy covariance measurements and hydrological modelling in the Rio Grande basin, Hydrol. Sci. J., 58, 1658–1676, https://doi.org/10.1080/02626667.2013.837578, 2013.
Running, S. W., Mu, Q., Zhao, M., and Moreno, A.: MOD16A2GF MODIS/Terra Net Evapotranspiration Gap-Filled 8-Day L4 Global 500m SIN Grid, Version 6.1, NASA EOSDIS Land Processes DAAC [data set], https://doi.org/10.5067/MODIS/MOD16A2GF.061, 2021.
Scheff, J. and Frierson, D. M. W.: Scaling Potential Evapotranspiration with Greenhouse Warming, J. Clim., 27, 1539–1558, https://doi.org/10.1175/JCLI-D-13-00233.1, 2014.
Schmidly, D. J.: Texas natural history: a century of change, J. Mammal., 84, 329–331, https://doi.org/10.1644/1545-1542(2003)084<0329:R>2.0.CO;2, 2002.
Schwantes, A. M., Swenson, J. J., González-Roglich, M., Johnson, D. M., Domec, J. C., and Jackson, R. B.: Measuring canopy loss and climatic thresholds from an extreme drought along a fivefold precipitation gradient across Texas, Glob. Chang Biol., 23, 5120–5135, https://doi.org/10.1111/GCB.13775, 2017.
Scott, R. L., Huxman, T. E., Barron-Gafford, G. A., Darrel Jenerette, G., Young, J. M., and Hamerlynck, E. P.: When vegetation change alters ecosystem water availability, Glob. Chang Biol., 20, 2198–2210, https://doi.org/10.1111/GCB.12511, 2014.
Seaber, P. R., Kapinos, F. P., and Knapp, G. L.: Hydrologic Unit Maps, U.S. Geological Survey, 2294 pp., https://doi.org/10.3133/wsp2294, 1987.
Seager, R. and Vecchi, G. A.: Greenhouse warming and the 21st century hydroclimate of southwestern North America, Proc. Natl. Acad. Sci. U. S. A., 107, 21277–21282, https://doi.org/10.1073/pnas.0910856107, 2010.
Senay, G. B., Friedrichs, M., Singh, R. K., and Velpuri, N. M.: Evaluating Landsat 8 evapotranspiration for water use mapping in the Colorado River Basin, Remote Sens. Environ., 185, 171–185, https://doi.org/10.1016/J.RSE.2015.12.043, 2016.
Song, C., Katul, G., Oren, R., Band, L. E., Tague, C. L., Stoy, P. C., and McCarthy, H. R.: Energy, water, and carbon fluxes in a loblolly pine stand: Results from uniform and gappy canopy models with comparisons to eddy flux data, J. Geophys. Res.-Biogeo., 114, G04021, https://doi.org/10.1029/2009JG000951, 2009.
Stephens, S. L., Lydersen, J. M., Collins, B. M., Fry, D. L., and Meyer, M. D.: Historical and current landscape-scale ponderosa pine and mixed conifer forest structure in the southern Sierra Nevada, Ecosphere, 6, 1–63, https://doi.org/10.1890/ES14-00379.1, 2015.
Stocker, T. F., Qin, D., Plattner, G. K., Tignor, M., Allen, S. K., Boschung, J., Nauels, A., Xia, Y., Bex, V., and Midgley, P. M.: Long-term climate change: projections, commitments and irreversibility, Cambridge, United Kingdom and New York, USA, Cambridge University Press, https://doi.org/10.1017/CBO9781107415324.024, 2013.
Stambaugh, M. C., Marschall, J. M., and Guyette, R. P.: Linking fire history to successional changes of xeric oak woodlands, For. Ecol. Manage., 320, 83–95, https://doi.org/10.1016/j.foreco.2014.02.022, 2014.
Subhashree, S. N., Igathinathane, C., Akyuz, A., Borhan, M., Hendrickson, J., Archer, D., Liebig, M., Toledo, D., Sedivec, K., Kronberg, S., and Halvorson, J.: Tools for Predicting Forage Growth in Rangelands and Economic Analyses – A Systematic Review, Agriculture, 13, 455, https://doi.org/10.3390/AGRICULTURE13020455, 2023.
Sun, S., Bi, Z., Xiao, J., Liu, Y., Sun, G., Ju, W., Liu, C., Mu, M., Li, J., Zhou, Y., Li, X., Liu, Y., and Chen, H.: A global 5km monthly potential evapotranspiration dataset (1982–2015) estimated by the Shuttleworth-Wallace model, Earth Syst. Sci. Data, 15, 4849–4876, https://doi.org/10.5194/essd-15-4849-2023, 2023.
Texas A&M Forest Service: 2011 Texas Wildfires: Common Denominators of Home Destruction, Texas A&M Forest Service [Technical report], https://tfsweb.tamu.edu/elibrary-item/2011-texas-wildfires-commondenominators- of-home-destruction (last access: 25 January 2025), 2011.
Tharp, B.: Structure of Texas vegetation east of the 98th meridian, University of Texas Bulletin, 2606, 45–54, 1926.
Thornton, M. M., Shrestha, R., Wei, Y., Thornton, P. E., and Kao, S. C.: Daymet: Daily Surface Weather Data on a 1-km Grid for North America, Version 4 R1, https://doi.org/10.3334/ORNLDAAC/2129, 2022a.
Thornton, M. M., Shrestha, R., Wei, Y., Thornton, P. E., and Wilson, B. E.: Daymet: Daily Surface Weather Data on a 1-km Grid for North America, Version 4, Oak Ridge National Laboratory Distributed Active Archive Center (ORNL DAAC) [data set], https://doi.org/10.3334/ORNLDAAC/1840, 2022b.
Trambauer, P., Dutra, E., Maskey, S., Werner, M., Pappenberger, F., Van Beek, L. P. H., and Uhlenbrook, S.: Comparison of different evaporation estimates over the African continent, Hydrol. Earth Syst. Sci., 18, 193–212, https://doi.org/10.5194/hess-18-193-2014, 2014.
U.S. Geological Survey (USGS): WaterWatch Runoff Product, USGS [data set], https://waterwatch.usgs.gov/index.php?id=romap3&sid= w_download, last access: 25 January 2025.
Velpuri, N. M., Senay, G. B., Singh, R. K., Bohms, S., and Verdin, J. P.: A comprehensive evaluation of two MODIS evapotranspiration products over the conterminous United States: Using point and gridded FLUXNET and water balance ET, Remote Sens. Environ., 139, 35–49, https://doi.org/10.1016/J.RSE.2013.07.013, 2013.
Wang, J., Xiao, X., Zhang, Y., Qin, Y., Doughty, R. B., Wu, X., Bajgain, R., and Du, L.: Enhanced gross primary production and evapotranspiration in juniper-encroached grasslands, Glob. Change Biol., 24, 5655–5667, https://doi.org/10.1111/GCB.14441, 2018.
Wasowski, S. and Wasowki, A.: Native Texas Plants: Landscaping Region by Region, Lone Star Books, Austin, Texas, 1–138, Taylor Trade Publishing, ISBN 978- 0891230779, 1988.
Whitehurst, A. S., Swatantran, A., Blair, J. B., Hofton, M. A., and Dubayah, R.: Characterization of Canopy Layering in Forested Ecosystems Using Full Waveform Lidar, Remote Sens., 5, 2014–2036, https://doi.org/10.3390/RS5042014, 2013.
Xi, X., Zhuang, Q., Kim, S., and Gentine, P.: Evaluating the Effects of Precipitation and Evapotranspiration on Soil Moisture Variability Within CMIP5 Using SMAP and ERA5 Data, Water Resour. Res., 59, e2022WR034225, https://doi.org/10.1029/2022WR034225, 2023.
Yamasaki, T., Yamakawa, T., Yamane, Y., Koike, H., Satoh, K., and Katoh, S.: Temperature Acclimation of Photosynthesis and Related Changes in Photosystem II Electron Transport in Winter Wheat, Plant Physiol., 128, 1087, https://doi.org/10.1104/PP.010919, 2002.
Yang, Z., Jiang, Y., Qiu, R., Gong, X., Agathokleous, E., Hu, W., and Clothier, B.: Heat stress decreased transpiration but increased evapotranspiration in gerbera, Front Plant Sci., 14, 1119076, https://doi.org/10.3389/fpls.2023.1119076, 2023.
Yu, Y., Zhou, Y., Xiao, W., Ruan, B., Lu, F., Hou, B., Wang, Y., and Cui, H.: Impacts of climate and vegetation on actual evapotranspiration in typical arid mountainous regions using a Budyko-based framework, Hydrol. Res., 52, 212–228, https://doi.org/10.2166/NH.2020.051, 2021.
Yuan, Q., Wang, G., Zhu, C., Lou, D., Hagan, D. F. T., Ma, X., and Zhan, M.: Coupling of Soil Moisture and Air Temperature from Multiyear Data During 1980–2013 over China, Atmosphere, 11, 25, https://doi.org/10.3390/ATMOS11010025, 2019.
Zahura, F. T., Bisht, G., Li, Z., McKnight, S., and Chen, X.: Impact of topography and climate on post-fire vegetation recovery across different burn severity and land cover types through random forest, Ecol. Inform., 82, 102757, https://doi.org/10.1016/J.ECOINF.2024.102757, 2024.
Zeide, B. and Stephens, J.: The densest loblolly pine stand and its silvicultural implications, edited by: Stanturf, J. A., Edn. 2010, in: Proceedings of the 14th biennial southern silvicultural research conference, Gen. Tech. Rep. SRS–121, Asheville, NC, U.S. Department of Agriculture, Forest Service, Southern Research Station, U.S. Department of Agriculture, 339–342, https://doi.org/10.2737/SRS-GTR-121, 2010.
Zeng, X., Barlage, M., Castro, C., and Fling, K.: Comparison of Land–Precipitation Coupling Strength Using Observations and Models, J. Hydrometeorol., 11, 979–994, https://doi.org/10.1175/2010JHM1226.1, 2010.
Zhang, K., Zhu, G., Ma, J., Yang, Y., Shang, S., and Gu, C.: Parameter Analysis and Estimates for the MODIS Evapotranspiration Algorithm and Multiscale Verification, Water Resour. Res., 55, 2211–2231, https://doi.org/10.1029/2018WR023485, 2019.
Zhao, T. and Dai, A.: The Magnitude and Causes of Global Drought Changes in the Twenty-First Century under a Low–Moderate Emissions Scenario, J. Clim., 28, 4490–4512, https://doi.org/10.1175/JCLI-D-14-00363.1, 2015.
Zirbel, C. R., Bassett, T., Grman, E., and Brudvig, L. A.: Plant Functional traits and environmental conditions shape community assembly and ecosystem functioning during restoration, J. Appl. Ecol., 54, 1070–1079, https://doi.org/10.1111/1365-2664.12885, 2017.