the Creative Commons Attribution 4.0 License.
the Creative Commons Attribution 4.0 License.
 | 23 Sep 2025
Assessment of source regions of the Zambezi River: implications for regional water security
Mauro Lourenco
Rutledge S. Boyes
Fenton P. D. Cotterill
Tyrel Flügel
Frank C. Nyoni
Goabaone J. Ramatlapeng
Rainer von Brandis
The Wilderness Project, in collaboration with the National Geographic Okavango Wilderness Project and the Wild Bird Trust, conducted the first known scientific on-river expeditions along the entire length of the Zambezi River, from its traditional source in Zambia and its most distal source in the Angolan Highlands Water Tower, all the way to the Indian Ocean. By combining ground measurement and high-resolution earth observation data, this study describes the overlooked contribution of Angolan Highlands Water Tower to the Zambezi River. Although preliminary, our results represent the first comprehensive assessment from integrated multiple lines of evidence. Our findings show: (1) The Zambezi River length, measured from the Lungwebungu River, is 342 km longer (total length of 3421 km to the Indian Ocean) than the traditional source, (2) Our estimates suggest that, during the late wet-season between March and May 2023, the Angolan portion of the Upper Zambezi and Lungwebungu sub-basins contributed approximately 73 % of the flow measured upstream of the Barotse Floodplain, (3) The Lungwebungu and Upper Zambezi sub-basins show evidence of reducing elevated conductivity, salinity, and TDS, likely introduced by mining activities in the Kabompo sub-basin, and (4) The Upper Zambezi sub-basin contains the highest proportion of wetland coverage, with 95 % (19 184 km2) located in Angola. Specifically, this coverage is concentrated over the Kameia and Luena wetlands, which are important for supporting overall river health. This study highlights the important role Angola plays in hosting the most distant source, and contributing a significant portion of the primary aquifer system of the Zambezi River; this hydrological contribution warrants greater recognition. Additionally, it underscores the need for improved monitoring and analysis of hydrological flows of the Zambezi Basin, particularly its Angolan tributaries. The Zambezi River Basin, the largest in southern Africa, faces ongoing challenges from climate change, development, and human water use. Collaborative efforts among basin countries are crucial to balance development with environmental needs, safeguarding ecosystem services and the natural dynamics that sustain the Upper Zambezi's ecological integrity.
- Article
(12772 KB) - Full-text XML
-
Supplement
(2641 KB) - BibTeX
- EndNote


Inherently dynamic landforms, rivers rank among the most renewable and sustainable sources of freshwater (Hanna et al., 2018). They provide a range of ecosystem services, including drinking water, sanitation, transportation, electricity generation, flood protection, and habitats for diverse species (Collins et al., 2024). Transboundary river basins are dynamic and complex, featuring diverse landscapes and extensive temporal and spatial variability of resources (Lautze et al., 2017). The Zambezi River, the fourth longest in Africa, has a basin of approximately 1 370 000 km2 that spans eight southern African countries: Angola, Botswana, Malawi, Mozambique, Namibia, Tanzania, Zambia and Zimbabwe (Moore et al., 2022). Recognised as one of Africa's most important river basins, the Zambezi is the focus of ongoing contested development, including water for hydropower, agriculture, and the environment (Meier et al., 2011; Beilfuss, 2012; Arias et al., 2022). While it possesses immense economic opportunity, particularly for hydropower, demand continues to increase for greater resource extraction and economic growth (Beilfuss, 2012; Arias et al., 2022). Climate change projections indicate a likely decline in water availability across the basin (Arias et al., 2022), alongside increasing risks to ecosystems and the livelihoods of populations, particularly rural communities, dependent on them (Lautze et al., 2017).
The Zambezi, meaning “Great River” in ChiTonga, rises in a small spring near Kalene Hill in northwestern Zambia and initially flows northward, then westward into Angola, before turning south and eventually eastward. This southward stretch of the river traverses diverse ecological zones, ranging from mesic savanna, with fringing gallery forests, under a tropical climate to semi-arid savannah, before continuing east to the Indian Ocean, spanning a total length of approximately 3400 km (Moore et al., 2022). The Zambezi Basin can be divided into three major segments: the Upper, Middle, and Lower Zambezi, each with distinct geomorphological characteristics (Wellington, 1955). The Upper Zambezi segment extends from the headwaters to Victoria Falls. The Middle Zambezi segment extends from below Victoria Falls and flows through the Gwembe and Mana Rift Grabens, delimited by the deep, narrow gorges at Batoka, Kariba, Mupata and Cahora Bassa (Moore et al., 2009). The Lower Zambezi flows across the Mozambique coastal plain, extending from below Cahora Bassa Gorge to the Indian Ocean where its delta preserves a continuous, deep sedimentary record dating back to the Jurassic period (Moore et al., 2022). The river's structure reflects repeated episodes of intracontinental rifting that have reshaped its drainage, yet remarkably, its primary channel and catchments have evolved from recognisable ancient precursors. The modern Zambezi flows across ancient landforms inherited directly from a Proto-Zambezi river on the Gondwana Supercontinent, and despite tectonic changes, this network has persisted since the end of the Dwyka glaciation in the Permian (Moore et al., 2012; 2022). Thus, the Zambezi is arguably the world's oldest river (Key et al., 2015; Moore et al., 2022).
The archaeological record preserved within the Zambezi Basin, particularly across the Zambian plateau and in the alluvial sediments above the Victoria Falls, attests to the importance of its wetland resources to human ancestors for at least the past 1 million years (Moore et al., 2022). This long history of recorded human settlement reflects the rich heritage and culture of Khoi-San and Bantu peoples, the influence of Portuguese and British colonial rule, and more recent changes brought about by the construction of dams and bridges (Newitt, 2022). Two of Africa’s largest hydroelectric projects, the Kariba and Cahora Bassa Reservoirs, have flooded vast rift valleys along the Zambezi. An estimated 47 million people live in the basin, with 75 % relying on subsistence agriculture and fisheries (Cervigni et al., 2015). However, some regions in the basin remain sparsely populated, preserving some of the world's last major remaining wilderness areas (Moore et al., 2022).
The Zambezi basin dominates Africa's Southern Savanna biome in the extent of its biotic habitats, particularly within the Zambezian phytochorion, mainland Africa's largest floristic region, as mapped by White (1983). Regional fauna, Lepidoptera, Odonata and vertebrates, for example, exhibit a high congruence in diversity and endemism with the Zambezian vegetation (Frost et al., 2002; Timberlake and Chidumayo, 2011; Timberlake et al., 2018; Huntley et al., 2019). The river's catchments and valleys support structurally diverse vegetation, ranging from grassland dambos, floodplains and swamps (collectively mapped as the Zambezian Grasslands biome), to dry forests and thickets, and savanna woodlands. The Zambezian grasslands are the most widespread vegetation type in the region, dominating most catchments (White, 1983; Cotterill, 2005). In particular, the distinctiveness of the diversity, endemism, and ecology of the Upper Zambezian fish fauna reflects the unique aquatic habitats of the Zambezi Okavango Miombo and Upper Zambezi Floodplain Ecoregions, redefined by Skelton (2024) as an update to the Freshwater Ecoregions of Africa mapped by Thieme et al. (2005).
Identifying and mapping a river's origin, particularly transboundary rivers, is important for water resource and river management, conservation, hydrological modelling and forecasting, water quality and pollution control, as well as policy, legal and political considerations. Compared to the well documented Zambian source regions of the Zambezi Basin (Meier et al., 2011; Beilfuss, 2012; Lautze et al., 2017; Hughes and Farinosi, 2020; Arias et al., 2022; Moore et al., 2022), the source waters originating in Angola are very understudied. The lack of field data from Angola is largely attributed to widespread minefields, a legacy of the Angolan Civil War (1975–2002), which restricts access to remote locations (Conradie et al., 2016; Midgley and Engelbrecht, 2019), particularly in the headwaters of the Angolan Highlands Water Tower (AHWT: Lourenco and Woodborne, 2023). Moreover, hydrological assessments have primarily focused on the Middle and Lower Zambezi segments (Beilfuss, 2012; Lautze et al., 2017), while most long-term assessments rely on measurements along Zambian rivers (Moore et al., 2022; Zambezi River Authority, 2024). Due to the lack of documentation regarding all the Zambezi River's sources, the provenance of this regionally critical river has not been quantified meaningfully.
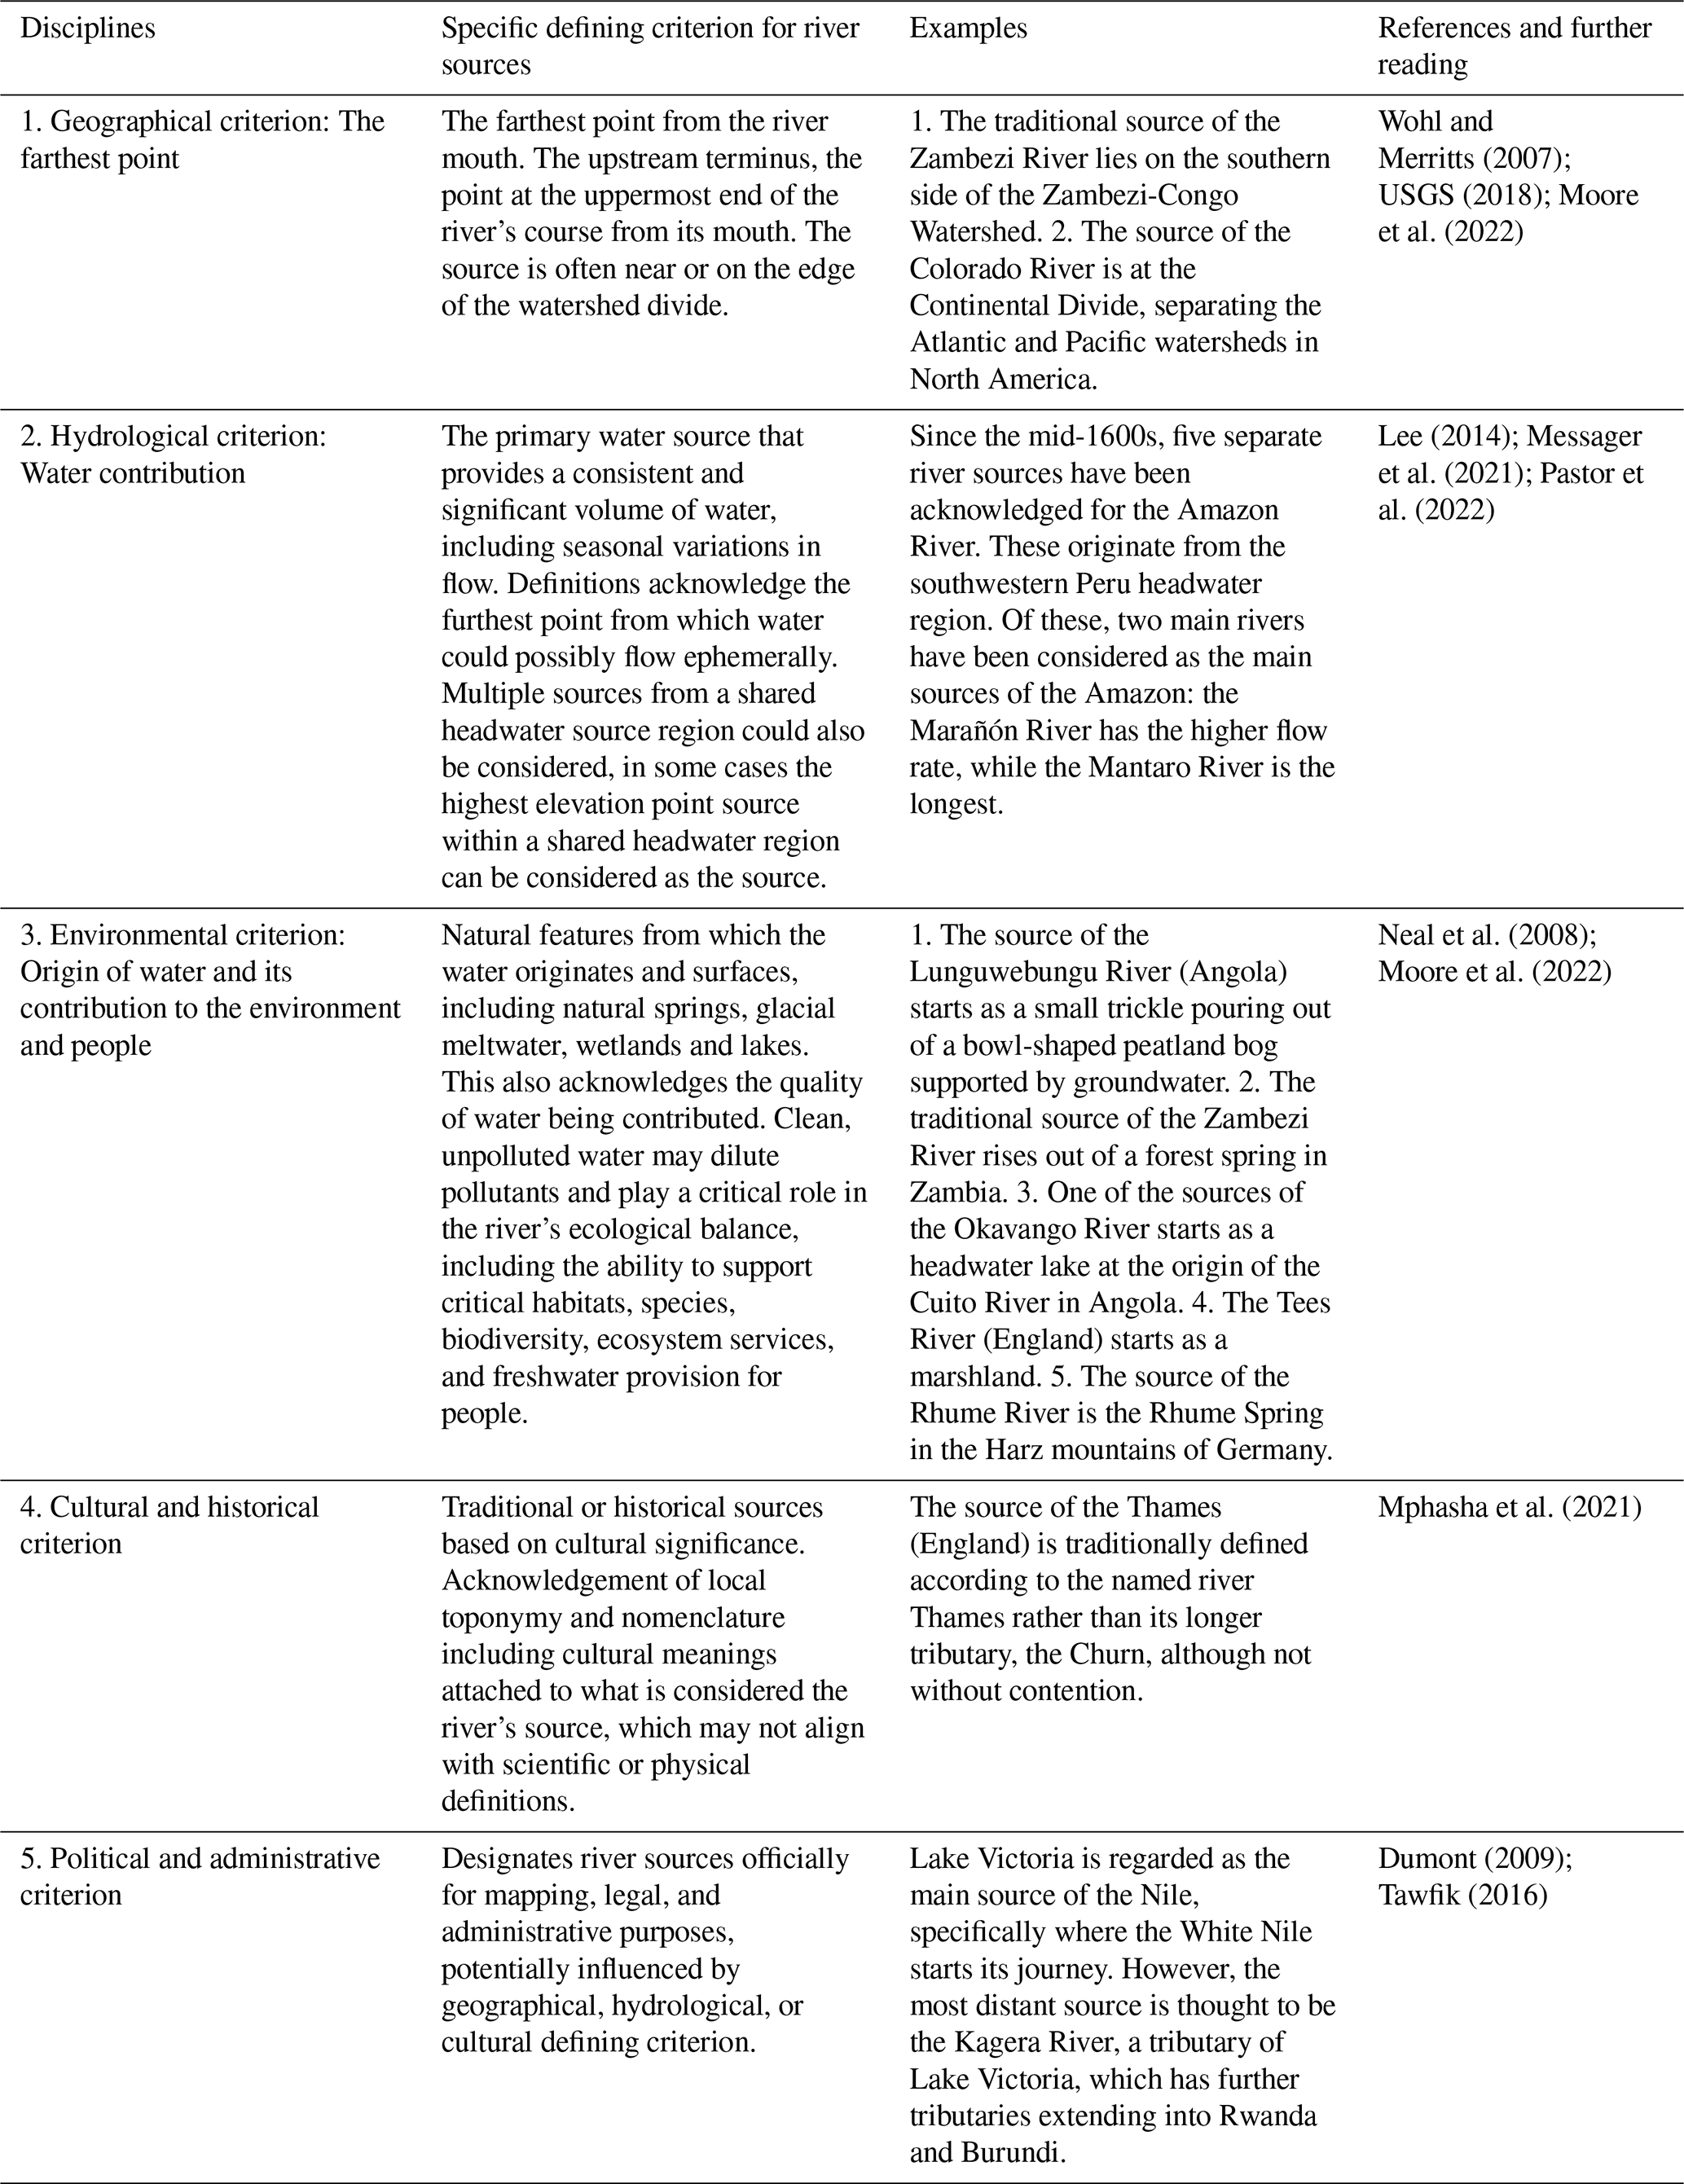
Defining river sources, multidisciplinary perspectives
River sources are increasingly recognised in environmental policy through various legal mechanisms, which underscore their roles in water resource management, environmental protection, and transboundary cooperation (Giri, 2021). The United Nations (UN) Watercourses Convention (1997) recognises the importance of managing watercourses from source to mouth (McCaffrey and Sinjela, 1998). In Southern Africa, the Southern African Development Community (SADC) Protocol on Shared Watercourses provides a legal framework for the cooperative management of transboundary water resources (SADC, 2000). Established in 2004, the Zambezi Watercourse Commission (ZAMCOM) Agreement adopts both the UN Watercourses Convention and the SADC Protocol on Shared Watercourses (ZAMCOM, 2004). ZAMCOM aims to promote equitable utilisation and sustainable development of the Zambezi's water resources among member states (ZAMCOM, 2004).
Formal geomorphological definitions of a river's source vary, and headwater streams are inconsistently defined (Golden et al., 2025); inconsistencies that reflect on the dynamic nature of rivers, and challenge unequivocal identification of their precise origin(s). Commonly, the headwater of a river is considered the farthest point on each of its tributaries, upstream of its mouth (Kammerer, 1987; Montgomery and Dietrich, 1988). The headwater is where surface runoff, meltwater, and/or groundwater begins accumulating into a concentrated and consistent flow, forming a first-order tributary (Alexander et al., 2007). The tributary with the longest course downstream of the headwaters is the main stem (Kammerer, 1987). The United States Geological Survey (USGS) defines a river's length as either the distance from the mouth to the most distant headwater source (irrespective of stream name), or from the mouth to the headwaters of the source stream (USGS, 2018). In practice, the longest tributary or stem is typically regarded as the source, regardless of its local name or usage (USGS, 2018).
A river source may be defined as the most distant point from which water runs year-round (perennially: Messager et al., 2021), or the furthest point from which water could flow ephemerally (Pastor et al., 2022). The latter definition includes seasonally-dry channels and suggests that the river's source waters could change monthly or yearly, depending on factors such as season, precipitation, climate cycles, or groundwater levels (Messager et al., 2021). Under these definitions, neither a lake (except those with no inflows) nor river confluences are considered to be a true river source, though they both often serve as the starting point of a single named river (USGS, 2018). Nonetheless, the definition of a seasonal or perennial river is contingent on the prevailing climatic regime, such that a seasonal river can contribute significant inflows in magnified pulses during periods of high rainfall. Moreover, when in flood, seasonal rivers not only deliver substantial water flow but also transport material fluxes that influence water chemistry. Importantly, a flowing seasonal river serves as a dynamic temporal resource for aquatic biodiversity, providing crucial spawning habitats for fishes and other aquatic biota (Minshull, 2008, 2011). In the Upper Zambezi, seasonally dry floodplains exemplify the importance of seasonal headwaters, as they experience large annual variations characteristic of tropical savanna climates (Beilfuss, 2012). Similar seasonal tributaries, particularly those on the south bank of the Middle Zambezi, contribute significant net inflows into the Kariba and Cahora Bassa reservoirs (Lautze et al., 2017; Arias et al., 2022).
In addition to water supply, water chemistry is a vital component of both river health and origin. Source waters strongly influence water quality, flow conditions, and biodiversity, making them essential to water resource management (Alexander et al., 2007). They provide unique habitats, support specialised species (Richardson, 2019), and play a critical role in maintaining overall river health and ecosystem services, particularly in populous basins such as the Zambezi (Arias et al., 2022). Long-term sustainability of water quality is important for both human and environmental use. The definition of a river's source should not only consider river distance, but also topographical and hydrological contributions to river function. Adopting multiple definitions allows for a more accurate assessment of the stream's contribution to the ecological integrity of the river system.
River toponymy reflects the languages, cultures, and histories of the regions through which rivers flow (Mphasha et al., 2021). Naming systems not only serve as geographical identifiers, they also encapsulate the socio-cultural narratives and ancestral heritage of local communities (Neethling, 2012). This naming diversity introduces challenges in defining a named river source due to several key factors: cultural and linguistic diversity, colonial influence and renaming, geopolitical tensions, historical and mythological significance, lack of documentation and standardisation, and the effects of modernisation and urbanisation (Neethling, 2012; Mphasha et al., 2021). Recognising these complexities is essential for effective environmental governance and preserving people's connection to their surroundings. This study acknowledges five distinct disciplines and their criteria for defining river sources (Table 1).
The impending developments within the Zambezi basin highlight the importance of evidence-based decision-making, particularly regarding the river's headwaters, which are a critical component to understanding and raising awareness of likely consequences. Sustainable development in this basin is crucial, as irreversible hydrological changes could occur in the coming decades (Lautze et al., 2017). To meet demands for reliable information, comprehensive scientific research is needed to better understand the river's sources and its hydrological and ecological dynamics. In this context, The Wilderness Project (TWP), in collaboration with the National Geographic Okavango Wilderness Project (NGOWP) and the Wild Bird Trust (WBT), completed the first on-river scientific research expeditions along the entire length of the Zambezi River. These river expeditions focused on both the traditional source of the Zambezi River in Zambia and the most distal source in the AHWT. Data collected include river topology (channel width and length), water chemistry, and discharge along the Zambezi River and its key tributaries. Biodiversity (macroinvertebrate and fish assessments) and photographic surveys were also collected, but are not presented here.
Due to limited long-term monitoring infrastructure in the Upper Zambezi segment, particularly the Angolan portion, we supplement our empirical ground-measured data with several earth observation (EO) datasets to reevaluate the sources of the Zambezi River. Topographical and hydrological characteristics are critical in maintaining natural river flows, ensuring ecosystem function, and can be considered when defining river sources. We describe and quantify river distances, precipitation, flow accumulation, historical and empirical river discharge, seasonal flows, water quality, wetland inventories, and surface water dynamics. The lack of documentation on all of the Zambezi River sources, particularly those originating in Angola and the AHWT, is a key focus of this research. We include additional datasets that have implications for transboundary river management in the basin.
Accurate and comprehensive maps of river sources are increasingly essential for informing policy, including providing more inclusive and accurate geographical representations that honour both historical and contemporary geographical reconstructions. To ensure Africa's water security, further exploration into quantifying African river sources in an empirical context is critical.
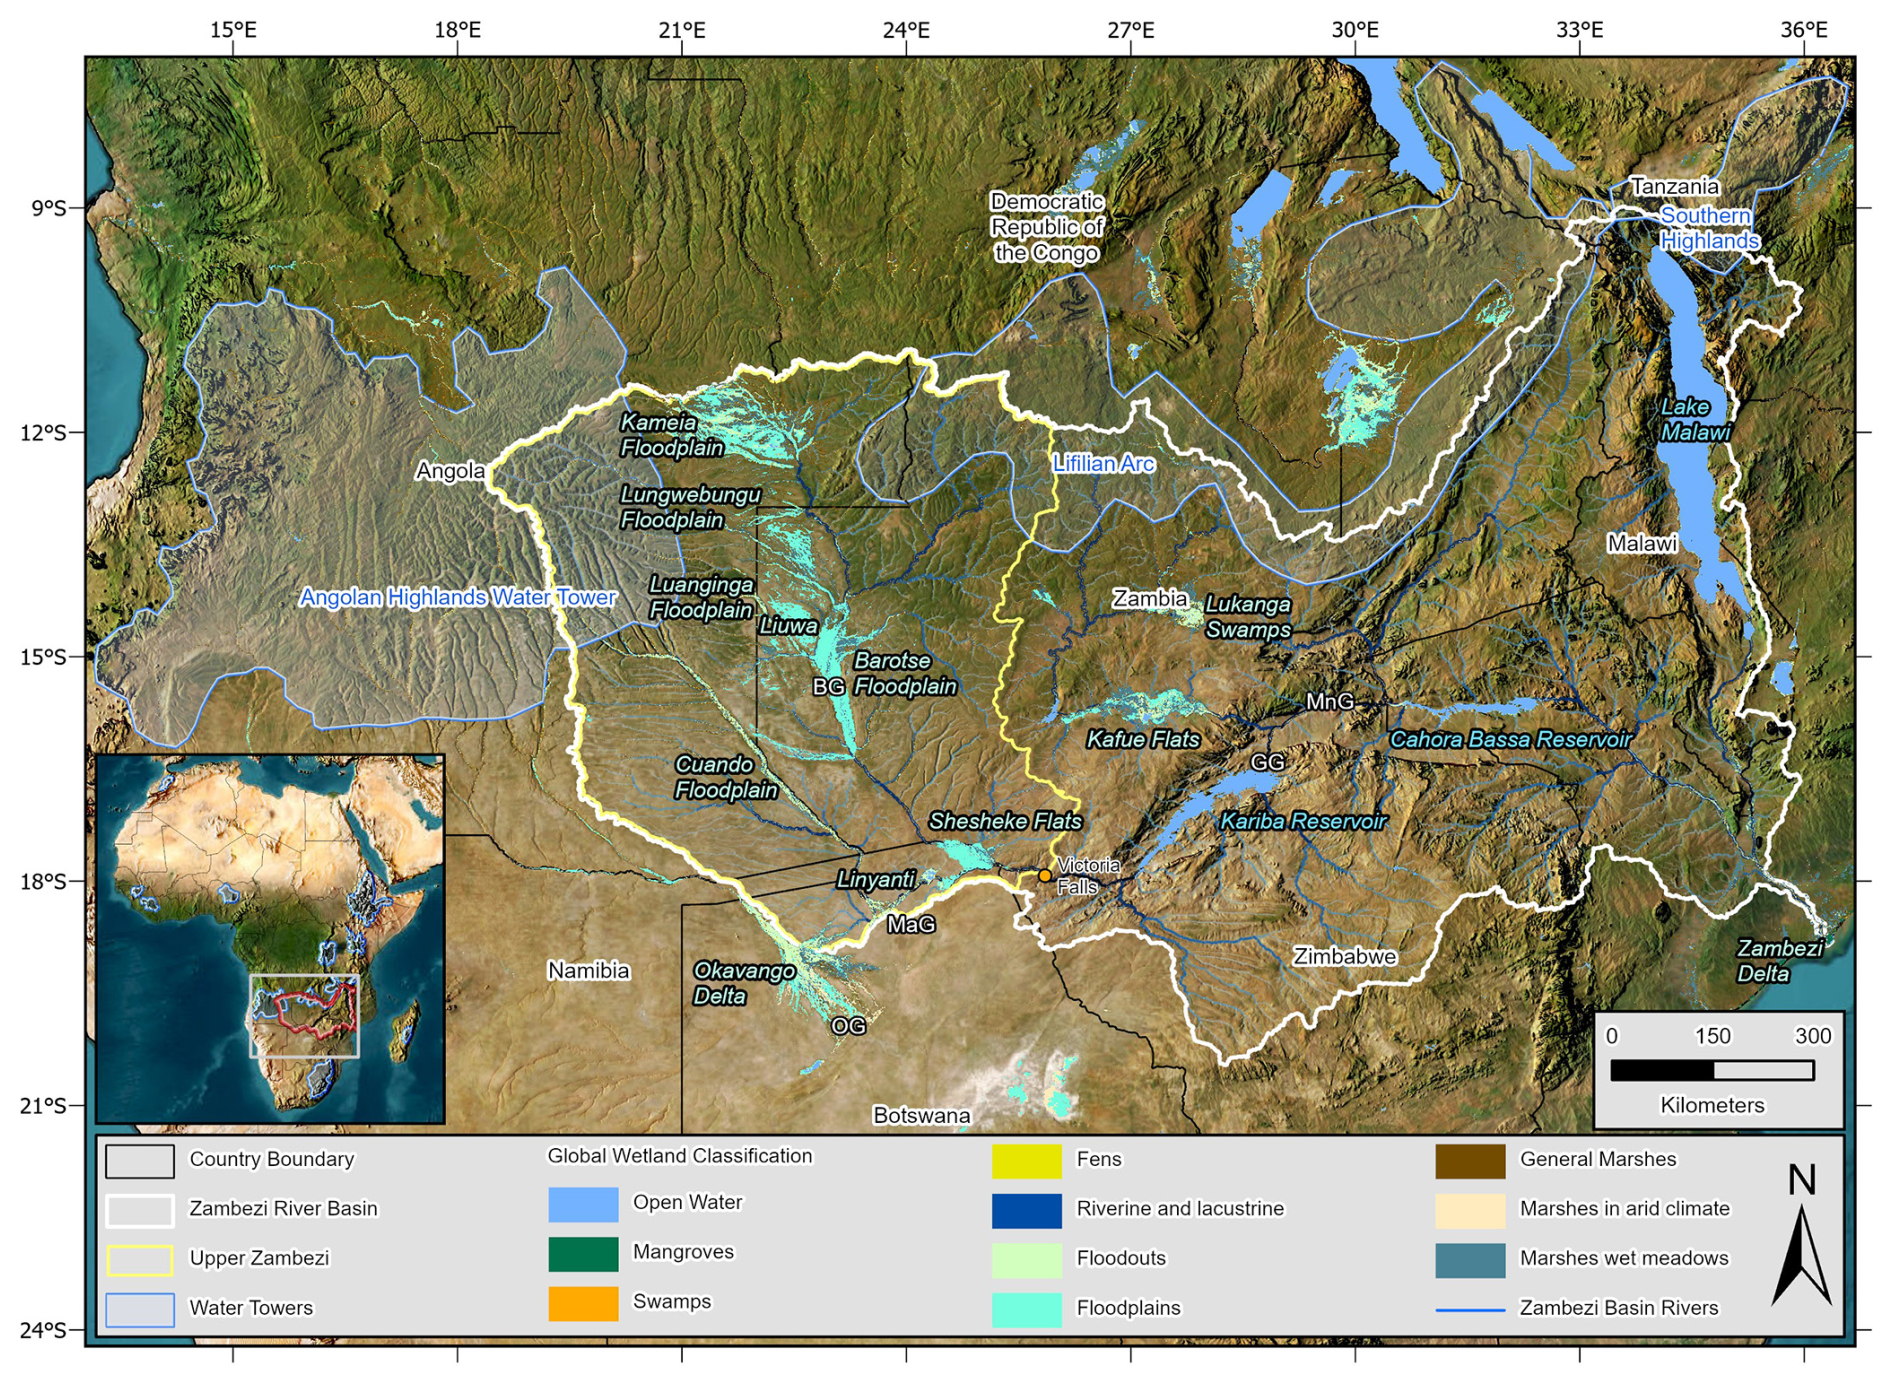
Figure 1The Zambezi River Basin, including the Upper Zambezi segment, water towers, Bulozi Graben (BG), Okavango Graben (OG), Machili Graben (MaG), Gwembe Graben (GG), Mana Rift Graben (MnG), and the CIFOR Tropical and Subtropical Wetlands dataset from Gumbricht et al. (2017). Note “Lufilian Arc” Water Tower is used to ensure comparability with other studies, however as Lufilan Arc is sensu stricto refers to a system of orogenic belts.
2.1 Study Area
The Upper Zambezi segment (515 008 km2) of the Zambezi Basin includes two of Africa's critical water towers: the AHWT and the Eastern Congo-Zambezi (labelled the Lufilian Arc in UNEP, 2010; Lourenco and Woodborne, 2023; Fig. 1). As mapped by UNEP (2010), the still loosely defined Eastern Congo-Zambezi encompasses the watersheds between the Congo and Zambezi Basins, extending east to the East African Rift. The western half of this water tower mantles the Lufilian Arc (a PanAfrican orogenic belt, Key et al., 2001). Subterranean vadosic formations of the deeply weathered dolomite formations of this landscape support a network of aquifers, which are assumed to be hydrologically significant (Chenov, 1978). This watershed gives rise to the traditional source of the Zambezi River, with headwater tributaries flowing southwards from the watershed divide (Moore et al., 2022). The western portion of the Upper Zambezi segment forms part of the AHWT, an important source region for major transboundary rivers: the Zambezi, Cunene, Okavango, and Congo Rivers, including Angola's most economically significant river, the Cuanza (Jackson, 1986; Lourenco and Woodborne, 2023). The basin's climate is largely controlled by the movement of the Inter-Tropical Convergence Zone (ITCZ), with rainfall occurring predominantly during the November-to-March summer months, while the April-to-October winter months are usually dry (Beilfuss, 2012). The natural flow regime of the Zambezi River reflects these rainfall patterns and is characterised by high seasonal and annual variability (Moore et al., 2022).
These landscapes mantle the neotectonically active zone of the East African Rift Extension (Key et al., 2015; Moore et al., 2022), centred on the Bulozi and Okavango-Machili Grabens (Pastier et al., 2017). Late Cenozoic uplift and subtle rifting have reshaped the topology of the major tributaries, resulting in widespread drainage impedance. Structured by gentle relief, dambos (seasonally inundated grasslands along drainage lines) characterise these densely vegetated tributaries and cover much of the African erosion surface. Across the Angola headwater tributaries, this region is classified as the Zambezi Okavango Miombo freshwater Ecoregion (Skelton, 2024). Their network extends across the deep Kalahari sediments that cover much of the Upper Zambezi segment, forming an archipelago of dambo wetlands and floodplains that impede runoff. Described as reservoir rivers by Jackson (1986), the wetlands formed across this regional landscape include the Kameia, Lungwebungu, Luanginga, and Cuando (Angola); the Liuwa and Barotse (Zambia); Linyanti (Botswana and Namibia); and Shesheke Flats (Namibia and Zambia: Moore et al., 2012; 2022). The unique biodiversity of these landscapes sustains important ecosystem services and hold a keystone function in the ecology and hydrology of the regional landscape.
2.2 Data
Our empirical field-data collected within the Upper Zambezi segment includes discharge measurements at 47 sites, water chemistry at 427 sites, with over 4500 km of river surveyed from both Zambian and Angolan sources to the Indian Ocean. Due to the lack of long-term hydrological and meteorological monitoring infrastructure, particularly within the Angolan portion of the Upper Zambezi segment, and large-scale mapping requirement, we utilised several EO datasets to supplement available empirical ground-based data to reevaluate the sources of the Zambezi River. We describe and quantify river distance, precipitation, flow accumulation, historical discharge, seasonal flows, wetland inventories and surface water dynamics using robust methodologies and long-term EO data (Table 2).
Table 2Datasets, data, sources and descriptions used in this study.
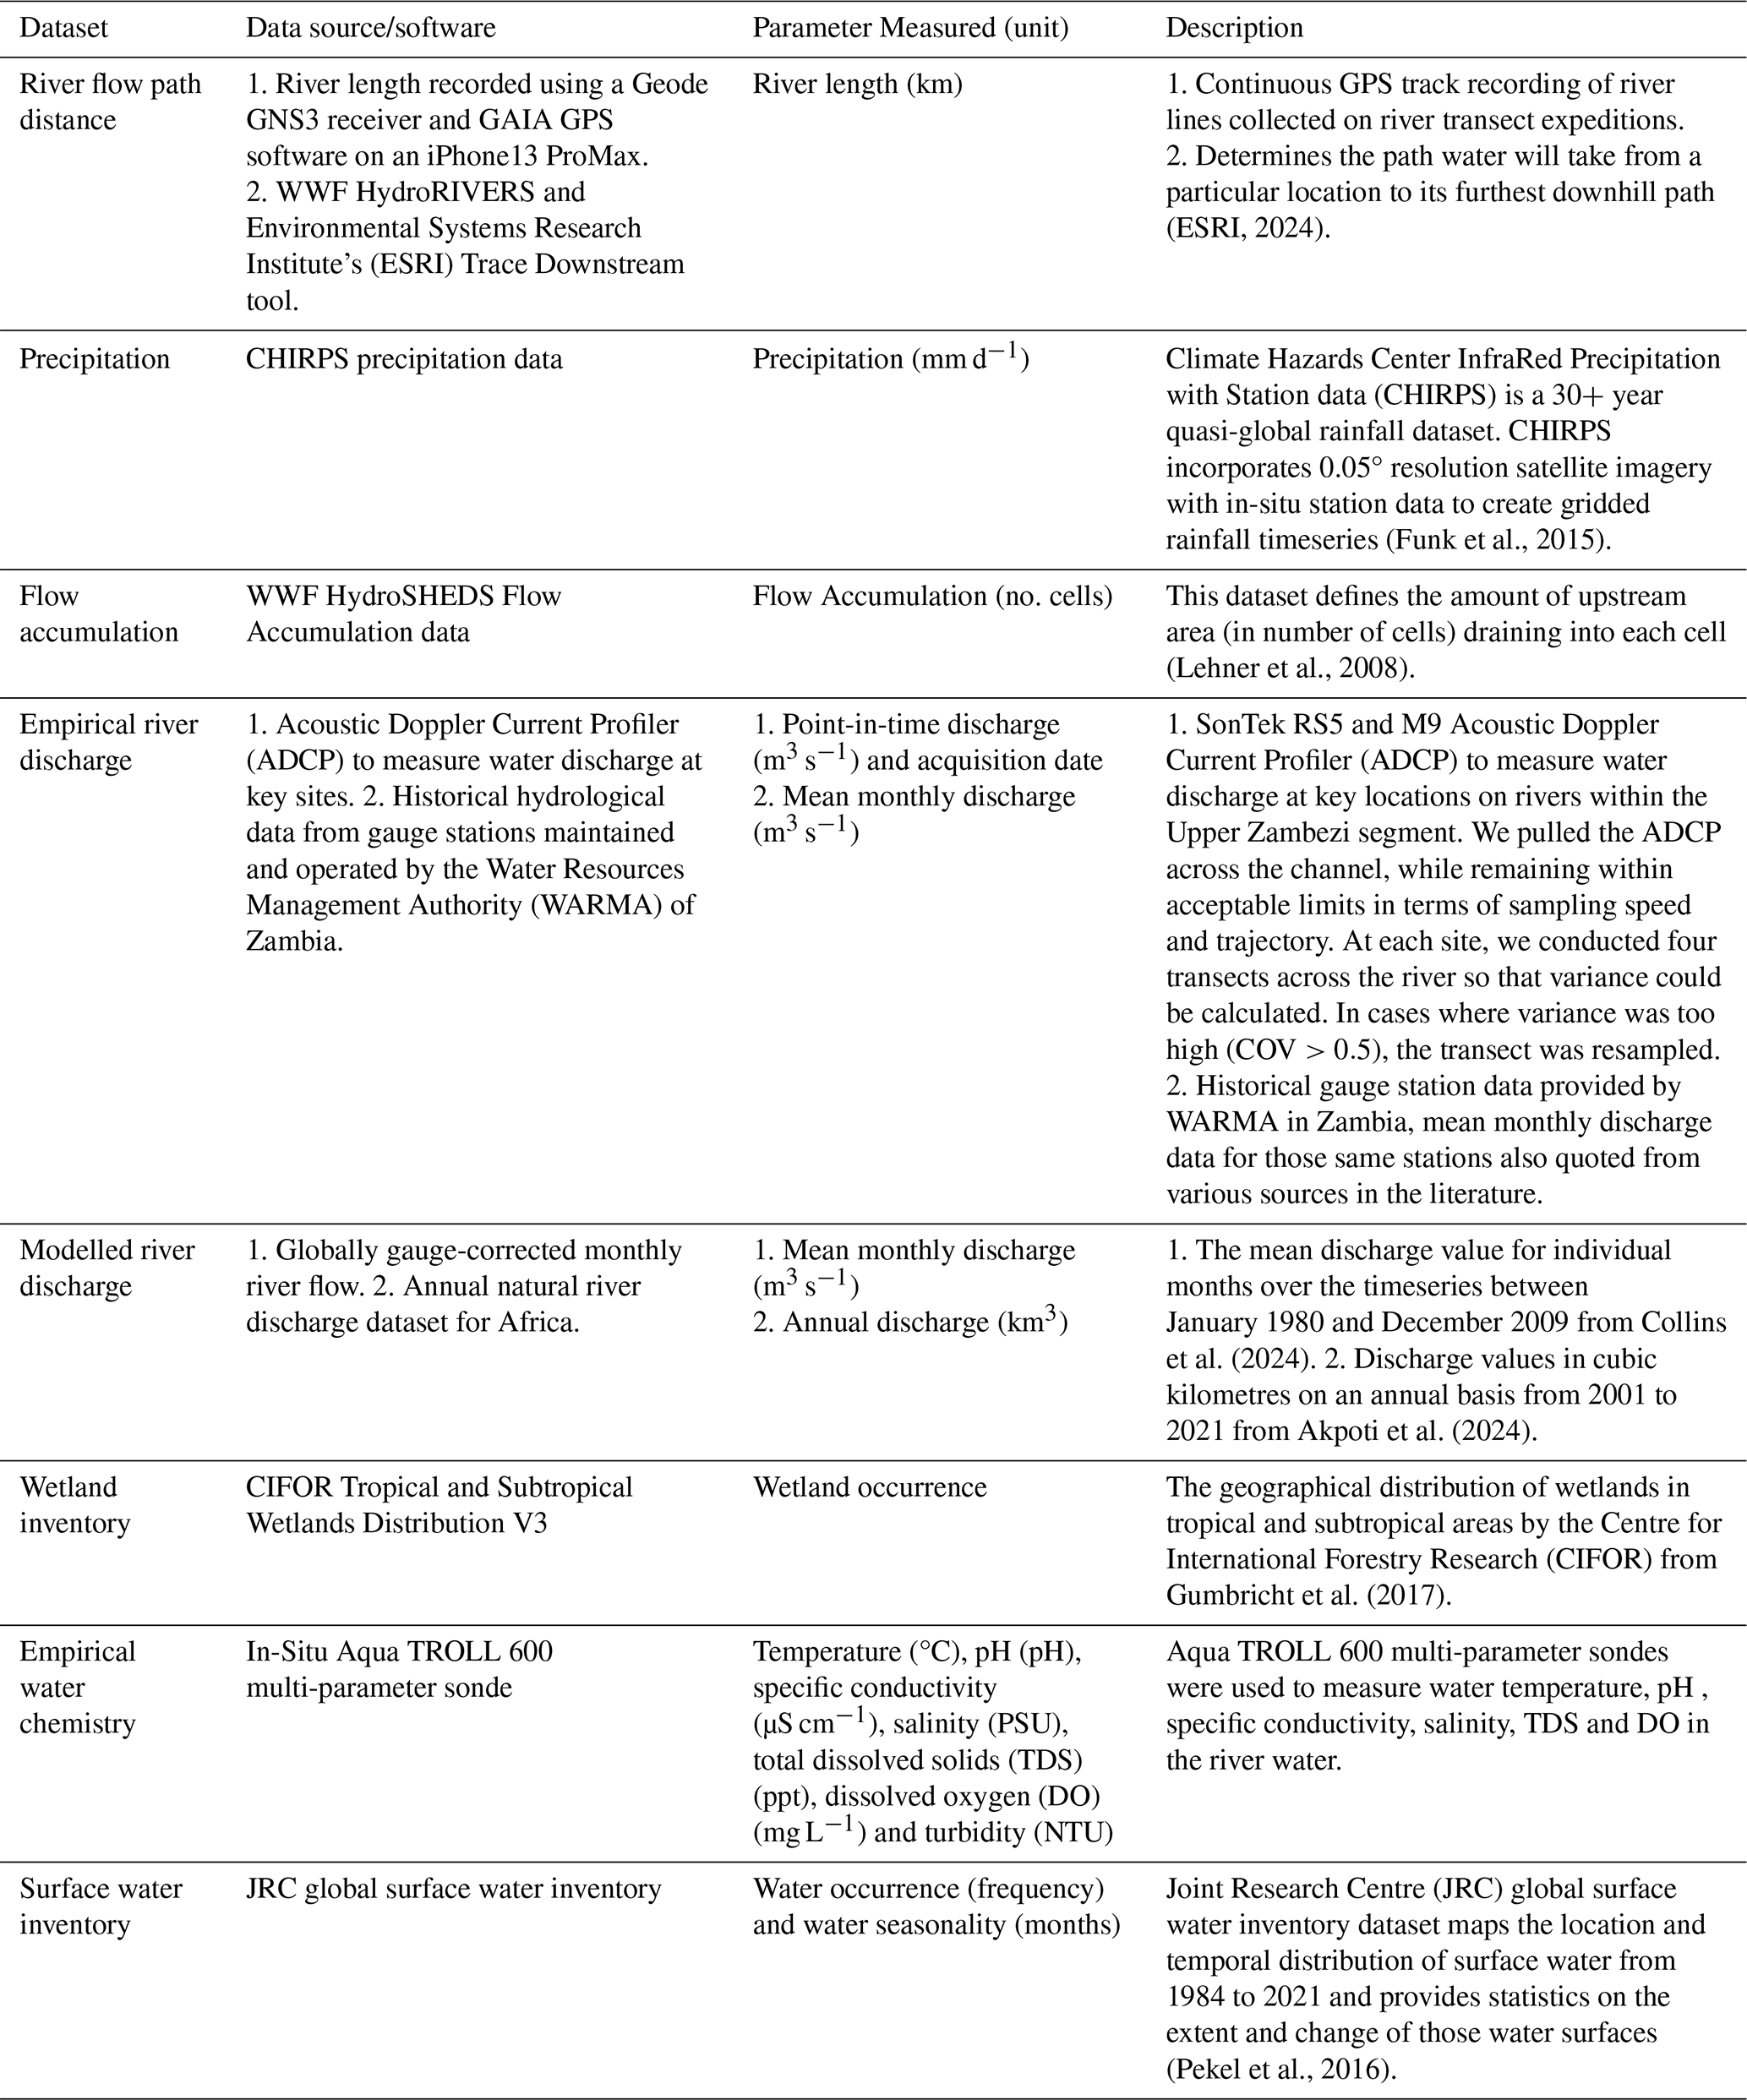
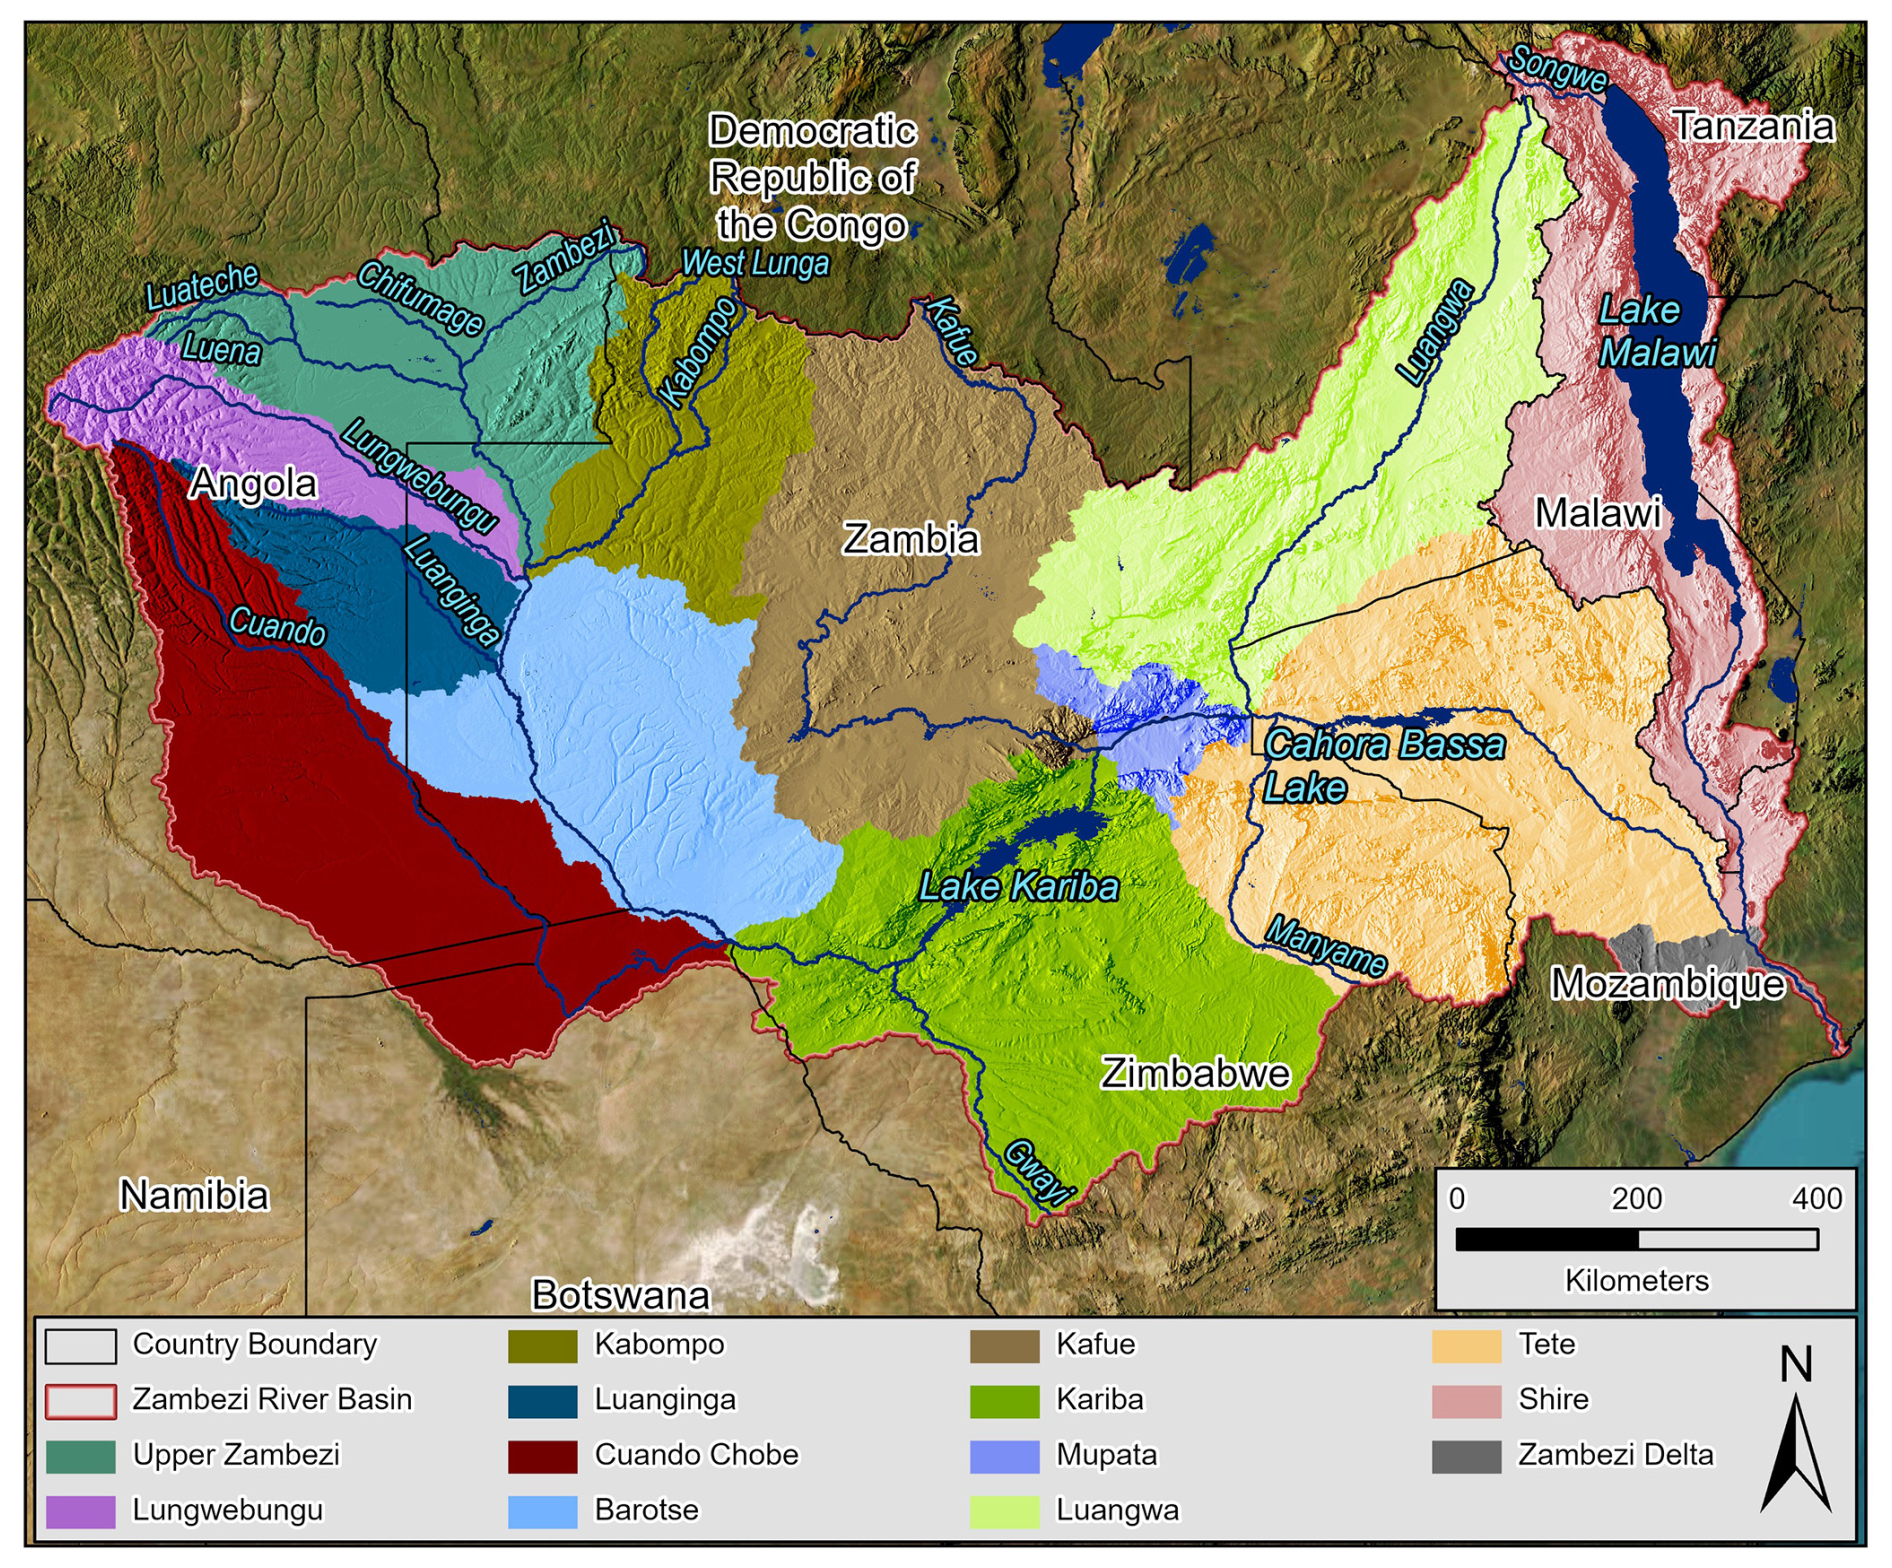
Figure 2The river names and flow paths within each HydroSHEDS level 04 sub-basin of the Zambezi Basin were measured using ESRI's Trace Downstream Tool. Note the distinction between the Upper Zambezi segment (which divides the Zambezi River Basin into Upper, Middle, and Lower segments) and the Upper Zambezi sub-basin, the sub-basin where the traditional source of the Zambezi River begins.
2.3 Distance of tributaries
The traditional source of the Zambezi River begins in northwest Zambia from a small spring on the Congo-Zambezi watershed (Moore et al., 2022). For approximately 30 km, the Zambezi headwaters flow north toward the Congo Basin before changing course to the southwest, a direction it maintains for a further 200 km into Angola. The river then turns south-eastwards toward the Indian Ocean (Moore et al., 2022). However, additional tributaries exist within separate major sub-basins (Fig. 2).
A complete GNSS track of the traditional source of the Zambezi River and the most distal source in Angola were recorded along the physical river channel during individual TWP river expeditions using a Geode GNS3 receiver and GAIA GPS software on an iPhone13 Pro Max. These measurements were taken from the sources of these two rivers to their confluence near the town of Lukulu (14.4076° S, 23.2588° E) in Zambia, upstream of the Barotse Floodplain. Following the completion of the TWP river expeditions, which traversed the entire length of the Zambezi River to the Indian Ocean, the full river length was calculated from the expedition track data. Note, for both Kariba and Cahora Bassa Reservoirs, the centre-line navigable length across the lakes was used, although the expedition teams surveyed the southern shorelines.
The Environmental Systems Research Institute (ESRI) Trace Downstream Tool (ESRI, 2024) was used to calculate the lengths of the additional major tributaries within the Zambezi basin, using the 90 m HydroSHEDS DEM (Lehner et al., 2008; ESRI, 2024). The source of each river tributary was identified using high-resolution satellite imagery combined with the African HydroRIVERS data (Lehner and Grill, 2013). Fourteen river lengths were measured, including the highest stream order tributary/tributaries according to the HydroRIVERS dataset within each HydroSHEDS level 04 sub-basin (Linke et al., 2019) (except for the Zambezi Delta sub-basin) to the river mouth. Elevation from NASA's Shuttle Radar Topography Mission (SRTM) 30 m DEM was extracted at 10 km intervals along each river line in ArcGIS Pro. Given the 90 m DEM input, the ESRI Trace Downstream Tool likely underestimates river length, as not all river meanders are captured. To address this limitation, the longest flow path line (Lungwebungu) identified by the tool and the traditional Zambezi source were digitised manually along the river's centre using high-resolution satellite imagery in Google Earth Engine (GEE). The river lengths measured include: (1) recorded track length (TL), (2) ESRI Trace Downstream length (EL) and (3) digitised length (DL). The straight-line distance (l), EL error percentage, and river sinuosity were also calculated. The EL error percentage is the relative difference in length between the EL and the TL for the river sections we surveyed.
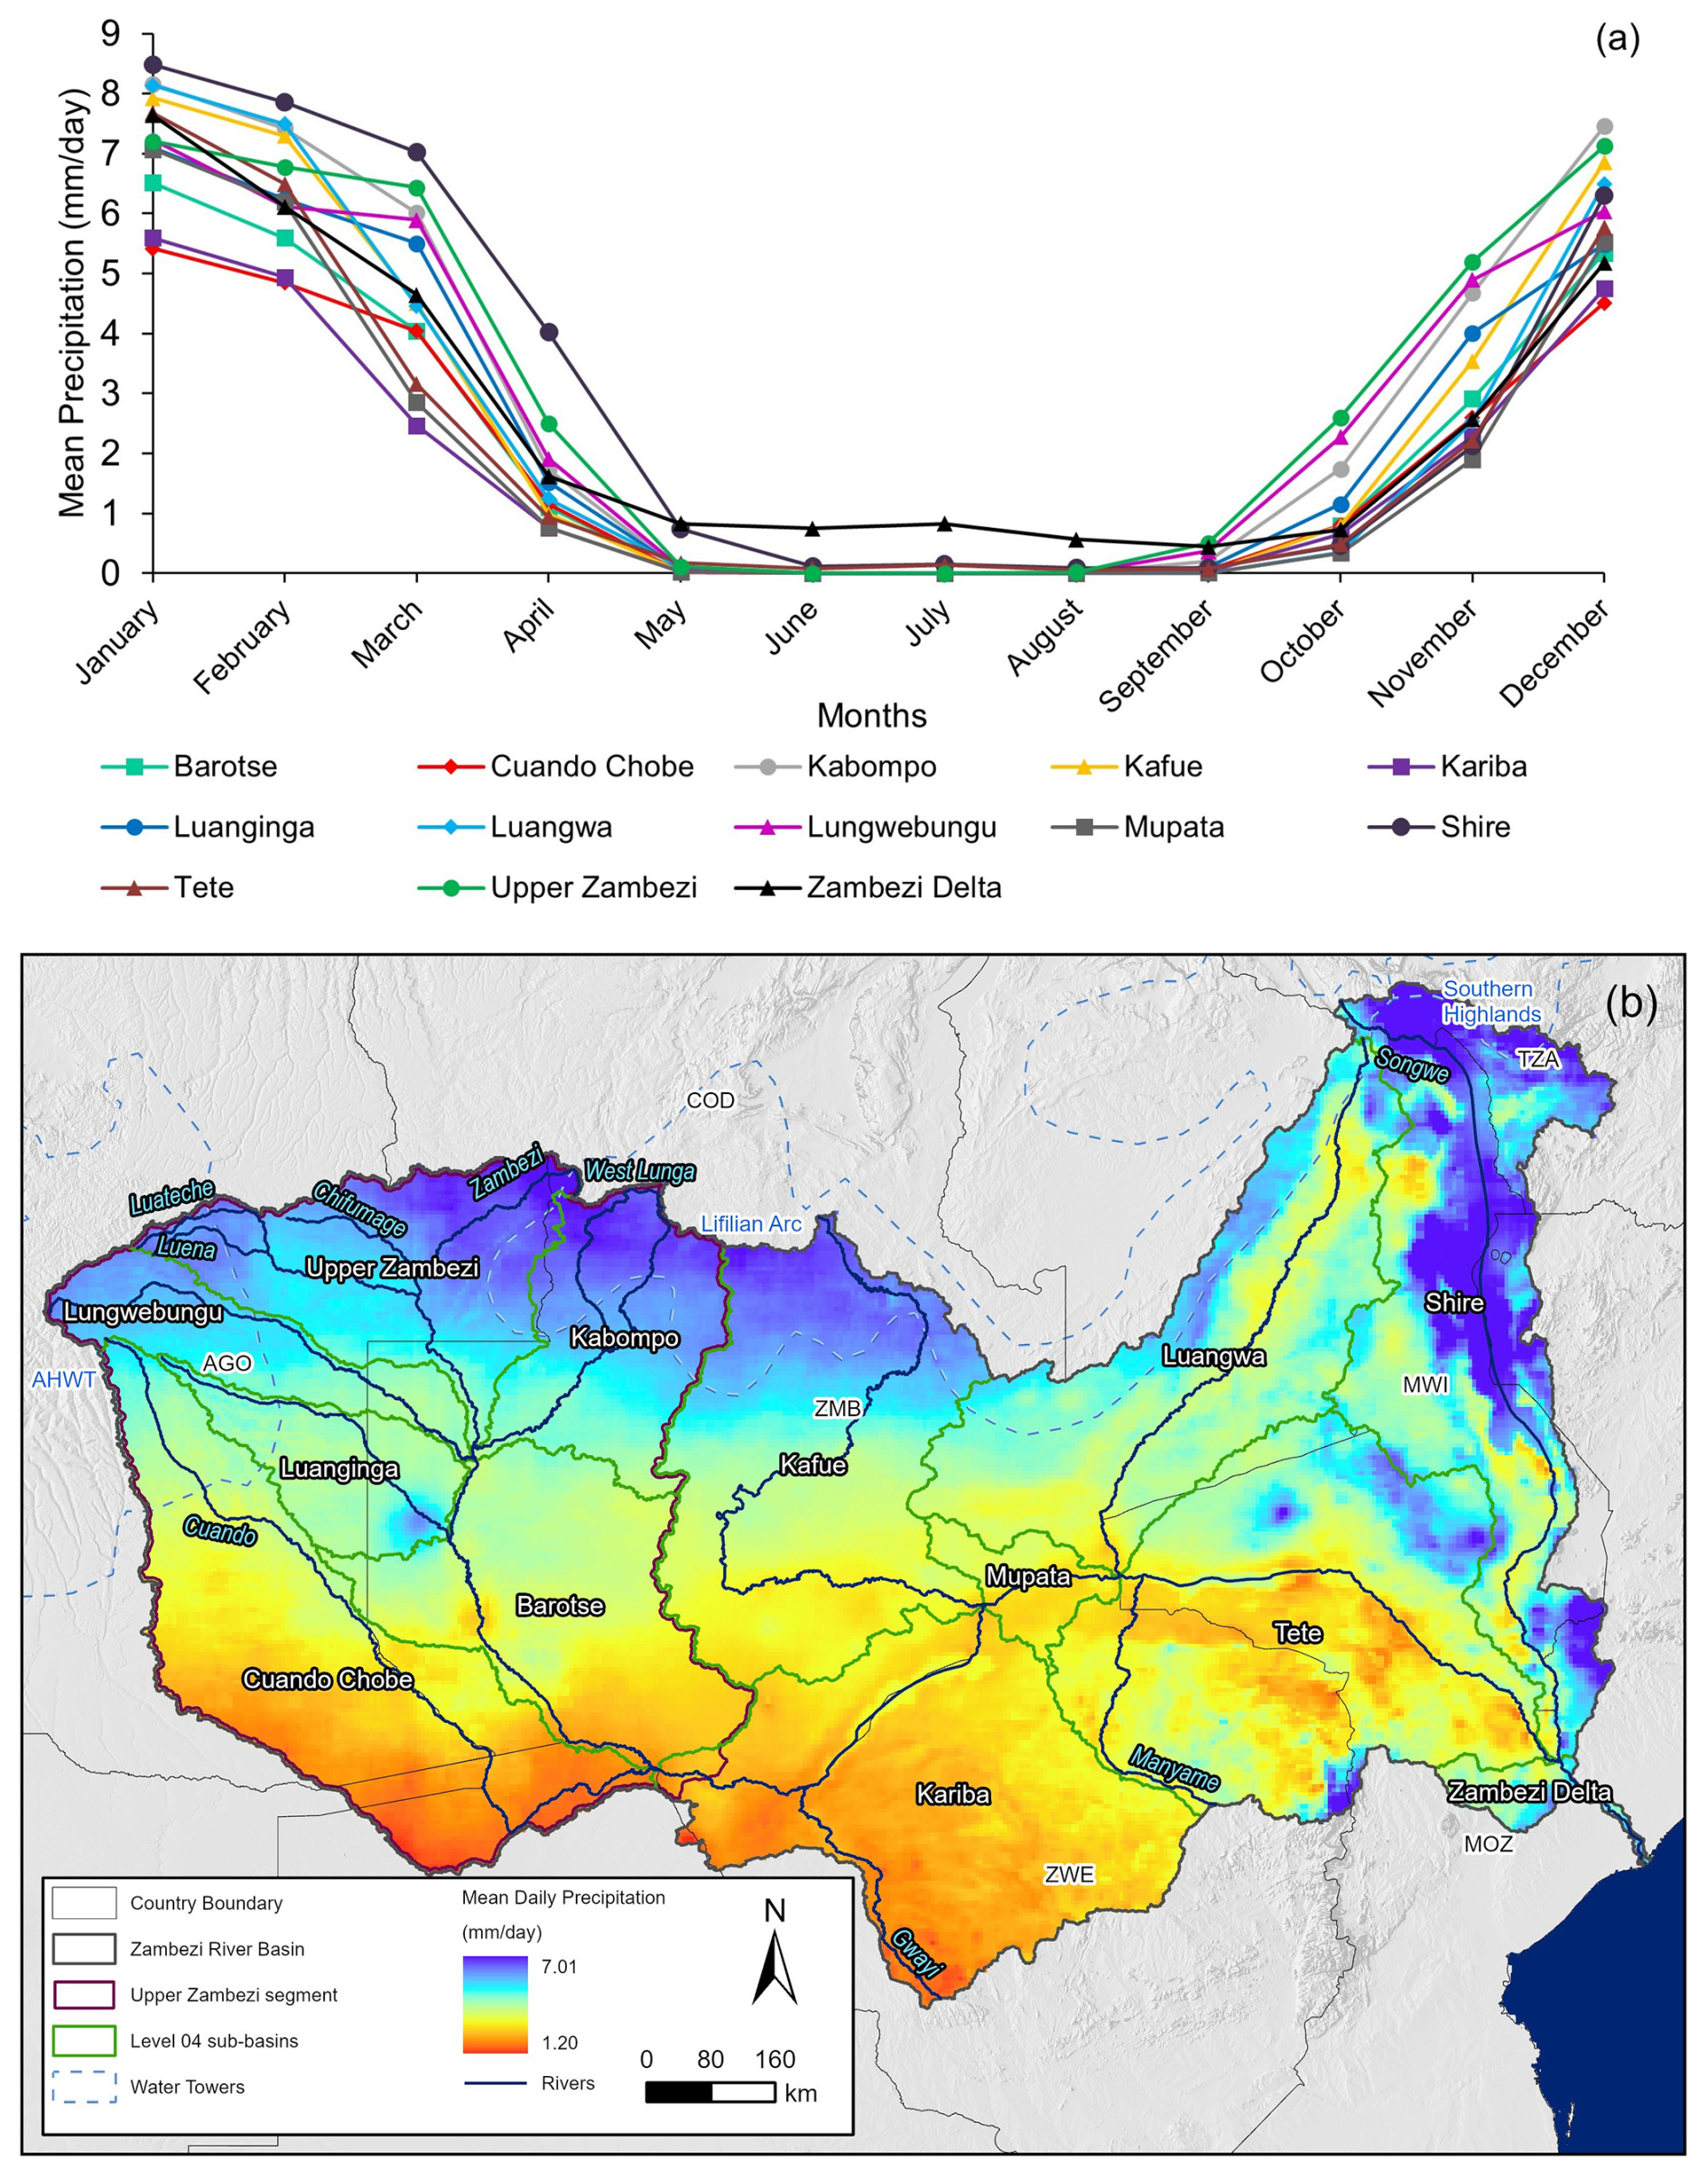
Figure 3(a) The mean daily precipitation per month for each HydroSHEDS level 04 sub-basin. (b) The mean daily CHIRPS precipitation (Funk et al., 2015) across the Zambezi Basin indicating that the northern basin has a higher daily precipitation compared to the south.
2.4 Precipitation
A large portion of the inhabitants of the Zambezi River Basin depend on its water resources (Fant et al., 2015). However, the basin frequently experiences extreme floods and droughts, which are expected to worsen with climate change (Hughes and Farinosi, 2020; Dube and Nhamo, 2023). Due to the lack of a robust meteorological network, precipitation data for this study were obtained from the Climate Hazards Center InfraRed Precipitation with Station data (CHIRPS) dataset (Funk et al., 2015). CHIRPS synthesises 0.05° resolution (∼ 5 km) satellite imagery with in situ station data to create a gridded rainfall time series (Funk et al., 2015). These summarised data describe the seasonal and spatial distribution of precipitation over the basin, but they are not utilised to derive higher-order climatic trend analyses.
The mean precipitation (mm d−1) for each month across the 43-year time series from 1 January 1981 to 31 December 2023 was calculated for each individual HydroSHEDS level 04 sub-basin at 5 km resolution (Fig. 3a) in GEE. The CHIRPS data indicate strong seasonality in precipitation across the Zambezi Basin. Mean values per day were calculated to avoid bias in months with fewer days. According to the CHIRPS data, rainfall begins in September each year, peaking in January (mean across all sub-basins =7.24 mm d−1). The wet season lasts through to April, followed by an almost entirely dry season from May to August, with August being the driest month (mean across all sub-basins =0.06 mm d−1). The Zambezi Delta sub-basin in the southeast remains the wettest during the dry season.
Mean daily precipitation across the Zambezi Basin is characterised by a latitudinal gradient, with higher daily means in the northern sub-basins (especially over the three water towers and in the east nearer the Indian Ocean), while the southwest remains comparatively dry (Fig. 3b). Although the traditional source of the Zambezi begins in the northwestern corner of Zambia, the river enters Angola approximately 89 km (from recorded track data) downriver. The majority (87 %) of the Upper Zambezi sub-basin lies within Angola, where much of the precipitation occurs and where the Luena, Luateche, and Chifumage Rivers originate.
2.5 River discharge and flow accumulation
On river expeditions, we used a SonTek RS5 and M9 Acoustic Doppler Current Profiler (ADCP) to measure water discharge along the main stem of the Zambezi River and at major confluences. Discharge was recorded by pulling the ADCP across the river channel, while remaining within acceptable limits in terms of sampling speed and trajectory. At each site, we conducted four transect measurements to calculate variance. If the coefficient of variation was too high (COV >0.05), resampling was undertaken. As ADCP data represent a single point-in-time discharge measurement, we report the discharge values with corresponding dates to reflect seasonal variation. As these data cannot be used to determine higher-order discharge trends or analyses, we combined our empirical ADCP discharge measurements with historical gauge station data. We also supplement this data using Earth Observation datasets including the WWF HydroSHEDS Flow Accumulation dataset, and global and regional modelled river discharge datasets. These datasets help to infer relative hydrological behaviour across tributaries and contextualise our discharge estimates, and are not used to correct or substitute them. This approach enables comparison of river flows within each HydroSHEDS level 04 sub-basin and is used to determine which rivers contribute the most to overall flow within the Upper Zambezi segment.
The Victoria Falls hydrological station lies at the base of the unregulated Upper Zambezi segment, and it has been measuring river discharge since 1907 (Moore et al., 2022). Presently, the Zambezi River Authority monitors daily river flows at thirteen stations, with data from four stations publicly available, albeit this access is restricted to the last two weeks only (Zambezi River Authority, 2024). We obtained historical gauge station data for some of these stations through the Zambian Water Resources Management Authority (WARMA) and various references in the literature. Notably, there are no hydrological monitoring stations on the Angolan rivers within the Upper Zambezi segment (Schleiss and Matos, 2016). To fill this data gap, EO datasets are used to infer both flow accumulation and modelled river discharge. We use the flow accumulation dataset derived from HydroSHEDS, which defines the amount of upstream area (in number of cells) draining into each cell. The number of accumulated cells serves as a measure of the upstream catchment area, topographic highs (river sources) have a value of 1, whereas mouths of very large rivers have values exceeding millions (Lehner et al., 2008). We calculated the number of accumulated cells (converting them into km2) within each HydroSHEDS level 04 sub-basin to estimate the proportion of flow accumulation across the Zambezi Basin.
Several studies have modelled hydrological flow regimes and discharge of specific sections within the Upper Zambezi segment (Meier et al., 2011; Zimba et al., 2018; Hughes and Farinosi, 2020; Hughes et al., 2023). Modelled river discharge data are commonly subjected to inherent uncertainties, which are further compounded by the large wetlands, underlying Kalahari sands, and the relatively poor understanding of water exchange dynamics between the river channels and wetland storage areas of the Upper Zambezi segment (Hughes and Farinosi, 2020). To address these challenges, we compare historical gauge station data to two external datasets: the globally gauge-corrected monthly river flow and storage dataset from Collins et al. (2024) and the annual natural river discharge dataset for Africa from Akpoti et al. (2024). Collins et al. (2024) provides mean discharge values in cubic meters per second (m3 s−1) for individual months over the time series from January 1980 to December 2009, these were averaged across all months to calculate an average discharge per month over a calendar year. Akpoti et al. (2024) provides discharge values in km3 on an annual basis from 2001 to 2021; these values were converted to mean annual discharge values in m3 s−1.
2.6 Water chemistry
Source waters strongly influence river water quality and are an essential component of water resource management and overall river health (Alexander et al., 2007). Water chemistry data within the Upper Zambezi segment are largely unavailable, and where available, the data are insufficiently sampled over extended periods to identify contamination sources, conduct trend analyses, or establish correlations. While water chemistry measurements were conducted during TWP expeditions within the Upper Zambezi segment, these measurements are limited to single data points sampled along major tributaries and cannot yet enable comprehensive analysis without repeated measurement and consideration of seasonal variations. The Upper Zambezi segment is characterised by numerous streams and extensive wetlands and floodplains, in contrast to the more hydrologically regulated Middle and Lower Zambezi segments, which feature large-scale reservoirs and lakes (Beilfuss, 2012; Schleiss and Matos, 2016). Hydropower development and land-use changes have been evaluated for their influence on surface water chemistry in the Middle Zambezi segment (Winton et al., 2021), but no study has focused on water chemistry across the entire basin. Given the limited availability of comprehensive water chemistry data across the Zambezi Basin, we have incorporated a wetland and surface water inventory for each HydroSHEDS Level 04 sub-basin to complement existing data and serve as a supporting proxy indicator of overall river and ecosystem health (i.e. intact wetland systems are considered to inherently increase ecosystem health).
Water chemistry parameters were measured along different tributaries of the Upper Zambezi segment using an In-Situ Aqua TROLL 600 multi-parameter sonde. The parameters include river temperature (°C), pH (pH), specific conductivity (µS cm−1), salinity (PSU), total dissolved solids (TDS) (ppt), dissolved oxygen (DO) (mg L−1), and turbidity (NTU). The rivers and tributaries measured include the Cuando (first half in 2018, second half in 2023), Kembo (May–June 2018), Lungwebungu (Angolan section in 2022, Zambian section in 2023), and the traditional source of the Zambezi (2023) along the main river stem to Livingstone, near Victoria Falls. A total of 427 sites were sampled at 10 km intervals along the river. At each site, the sonde was submerged for at least 30 s to ensure stable readings, thereafter data were recorded for 100 s, with one reading every 2 s, and the stabilised median value for each parameter was reported. Sonde sensors were calibrated and replaced according to the manufacturer's recommended frequency to maintain accuracy (In-Situ Inc, 2024), and site locations were mapped using ArcGIS Pro.
2.7 Wetland and surface water inventory
There are multiple studies describing the individual major wetlands within the Zambezi Basin (Timberlake, 2000; Seyam et al., 2001; Beilfuss, 2012; Schleiss and Matos, 2016; Moore et al., 2022); however, with the partial exception of White (1983), there is no documented quantification and classification of wetland extent across the entire Zambezi Basin. We use the Centre for International Forestry Research (CIFOR) Tropical and Subtropical Wetlands Distribution V3 dataset from Gumbricht et al. (2017), with a mapped resolution of 231 m. The CIFOR dataset employed a hydrological model combined with an annual time series of satellite-derived estimations of soil moisture and geomorphological data to provide an extensive and accurate representation of wetland ecosystems, see Gumbricht et al. (2017) for detailed methodology. This wetland raster dataset was clipped to the individual HydroSHEDS level 04 sub-basins within the Zambezi Basin, and the total extent of each wetland class, along with the percentage cover was quantified by summing each CIFOR wetland class, excluding the Open Water class.
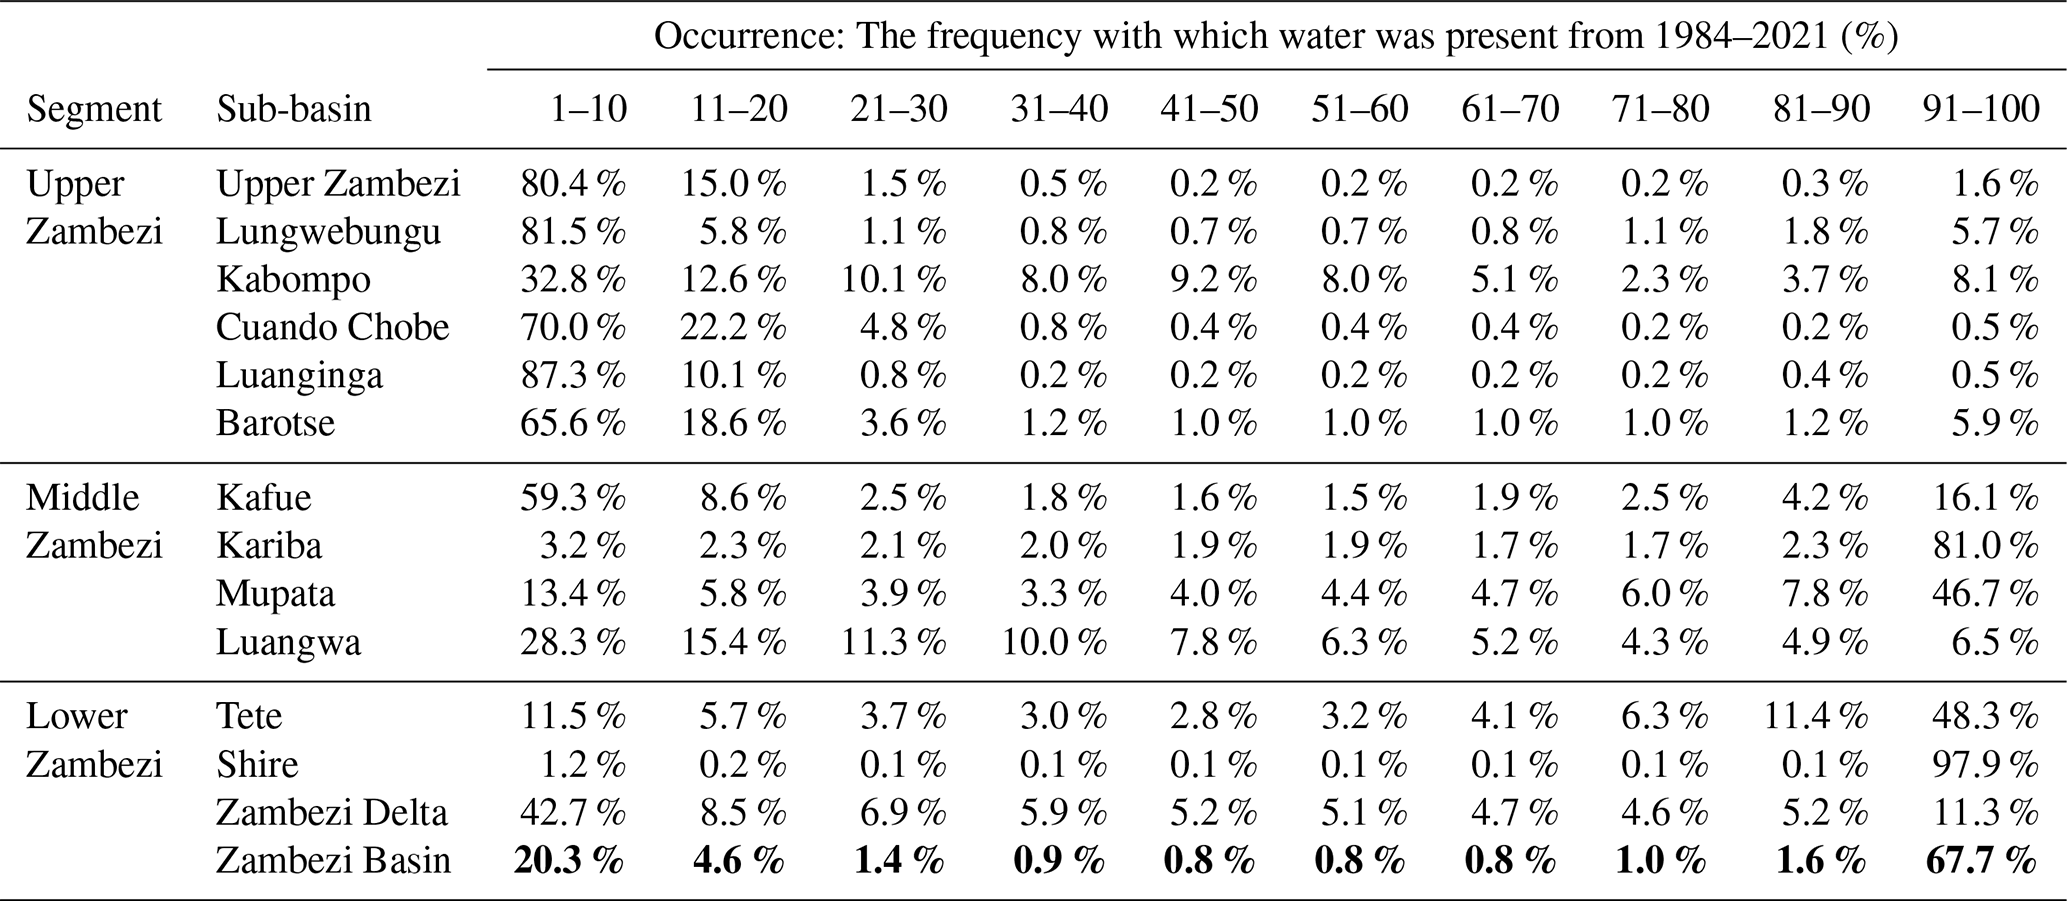
The Joint Research Centre (JRC) global surface water inventory (Pekel et al., 2016) was used to quantify water occurrence and seasonality across each HydroSHEDS level 04 sub-basin within the Zambezi River Basin. This dataset contains the location and temporal distribution of surface water from 1984 to 2021, and provides statistics on the extent and change of those water surfaces (Pekel et al., 2016). The water occurrence (frequency with which water was present from: 0= never present to 100= permanently present) and seasonality (mean number of months water is present within a calendar year) were extracted for the entire 38-year image acquisition period (Pekel et al., 2016). Within each sub-basin, the percentage of individual pixels that indicated the presence of water were placed within distribution tables for the occurrence band (1–100: frequency) and seasonality band (1–12: number of months). All maps presented were produced using ArcGIS Pro software.
3.1 Distance of tributaries
Following the completion of the TWP Zambezi River expeditions, the length of the entire Zambezi River to the Indian Ocean was calculated using expedition track data (Table 3). The total length from the Lungwebungu source (see Supplement Fig. S1) to the Indian Ocean is 3421 km, whereas the total length from the traditional Zambezi source (see Fig. S2) to the Indian Ocean is 3079 km. Notably, the lengths across the two major reservoirs included the straight-line navigable routes across the water bodies; the TL were not used as they followed the lake's southern shorelines, which would overestimate the river's true length.
Table 3River and straight-line lengths of the traditional Zambezi source and Lungwebungu River.
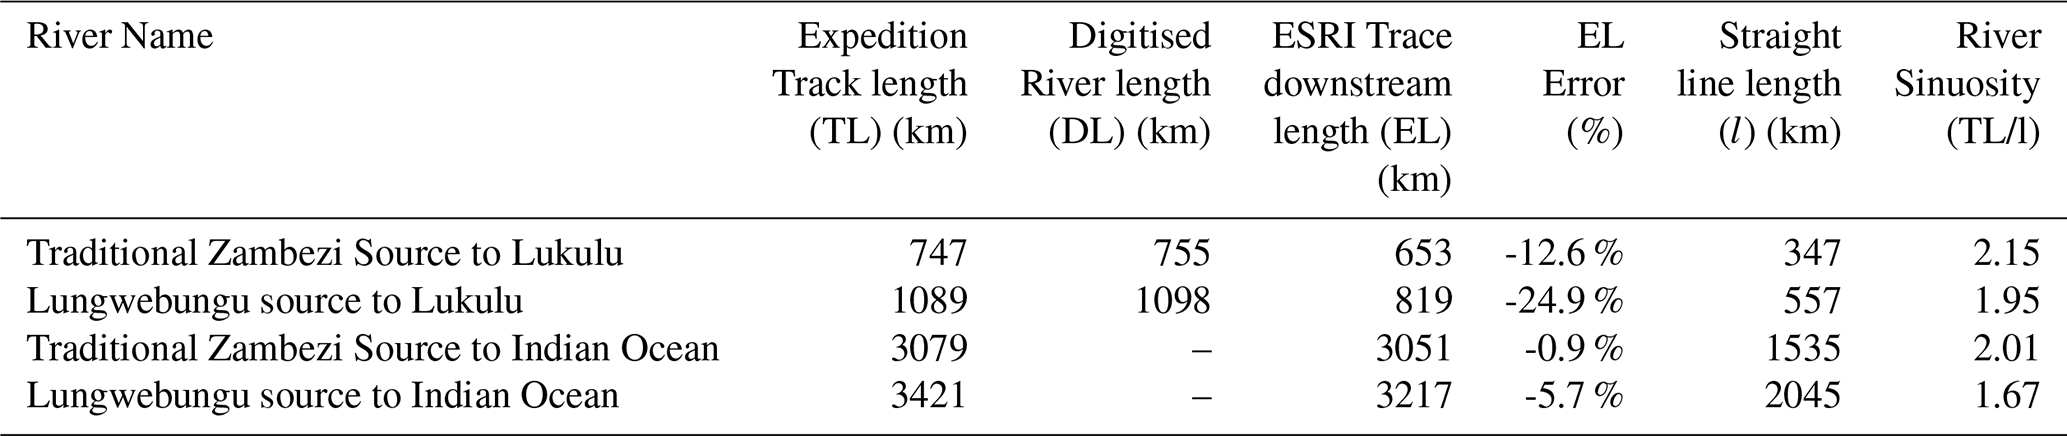
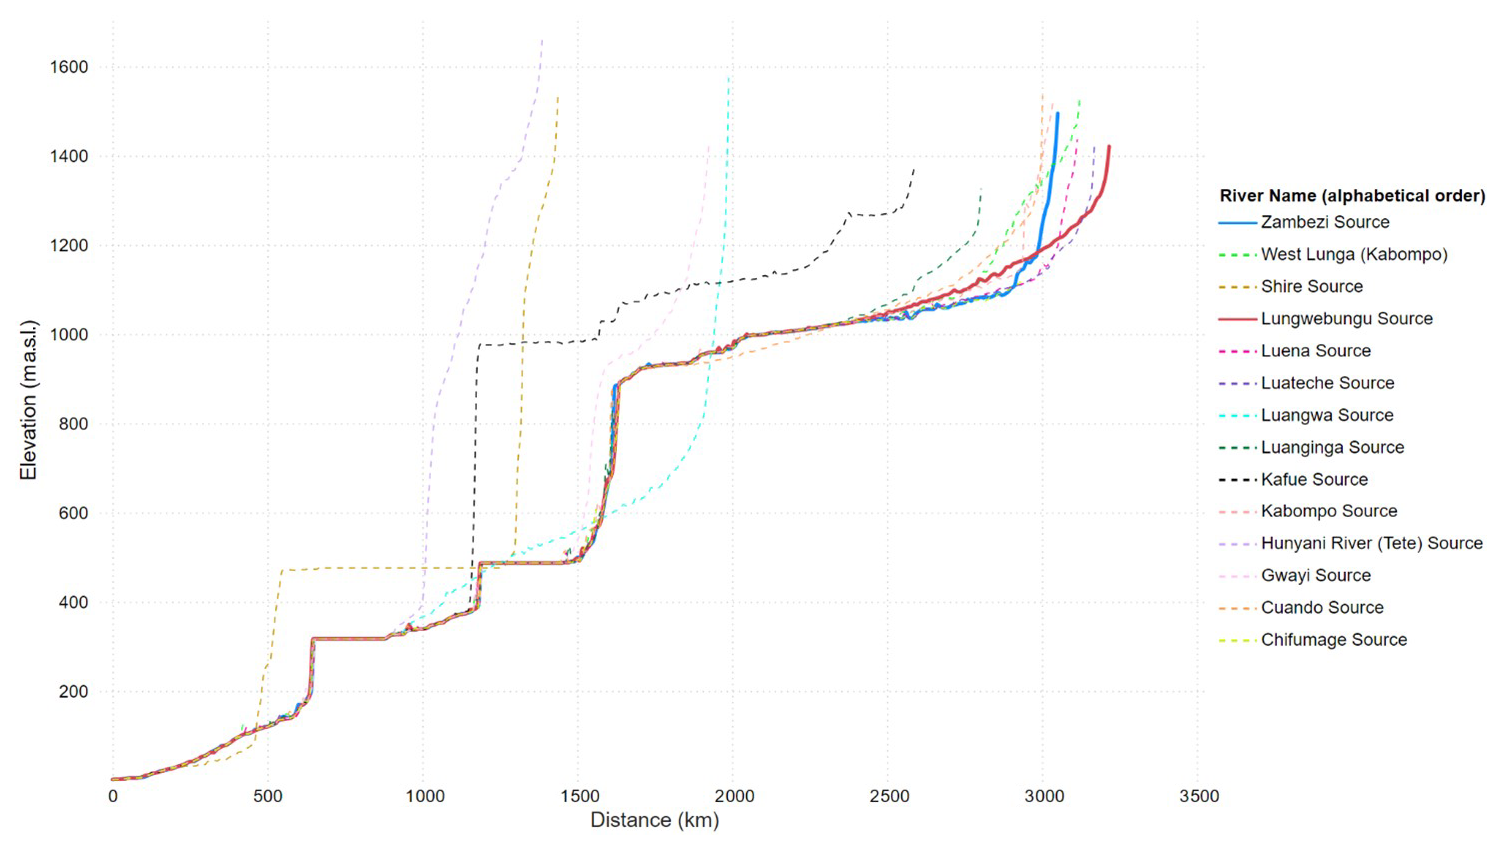
Figure 4Longitudinal profiles of Zambezi River Basin tributaries to the river mouth, derived using ESRI's Trace Downstream Tool. Steep vertical drops indicate large waterfalls, gorges and reservoir dam walls, while flat horizontal lines indicate large lakes or reservoirs.
Of the 14 calculated river lengths using the ESRI Trace Downstream Tool, the three longest are: (1) Lungwebungu (3217 km), (2) Luateche (3169 km), and (3) West Lunga (3122 km) (Fig. 4). The traditional source of the Zambezi ranks 5th with a length of 3051 km, 166 km shorter than the Lungwebungu River according to this tool. Of the five longest river lines, three originate in Angola (Lungwebungu, Luateche and Luena: 3114 km) while two originate in Zambia (West Lunga and Zambezi). Notably the Manyame River (1387 km), originating in Zimbabwe, starts at the highest elevation (1660 m a.s.l.) but its source lies within a separate headwater region.
Comparing the TL and DL indicates that the Lungwebungu is approximately 342 km longer than the traditional source of the Zambezi. However, the river sinuosity is higher for the traditional Zambezi River source (2.15) compared to the Lungwebungu River (1.95) up to the confluence at Lukulu (Table 3). In addition, the TL show a −12.6 % error for the traditional Zambezi source and a −24.8 % error for the Lungwebungu River compared to the EL up to Lukulu. This tool should be used with caution for rivers with high sinuosity.
3.2 Flow accumulation and river discharge
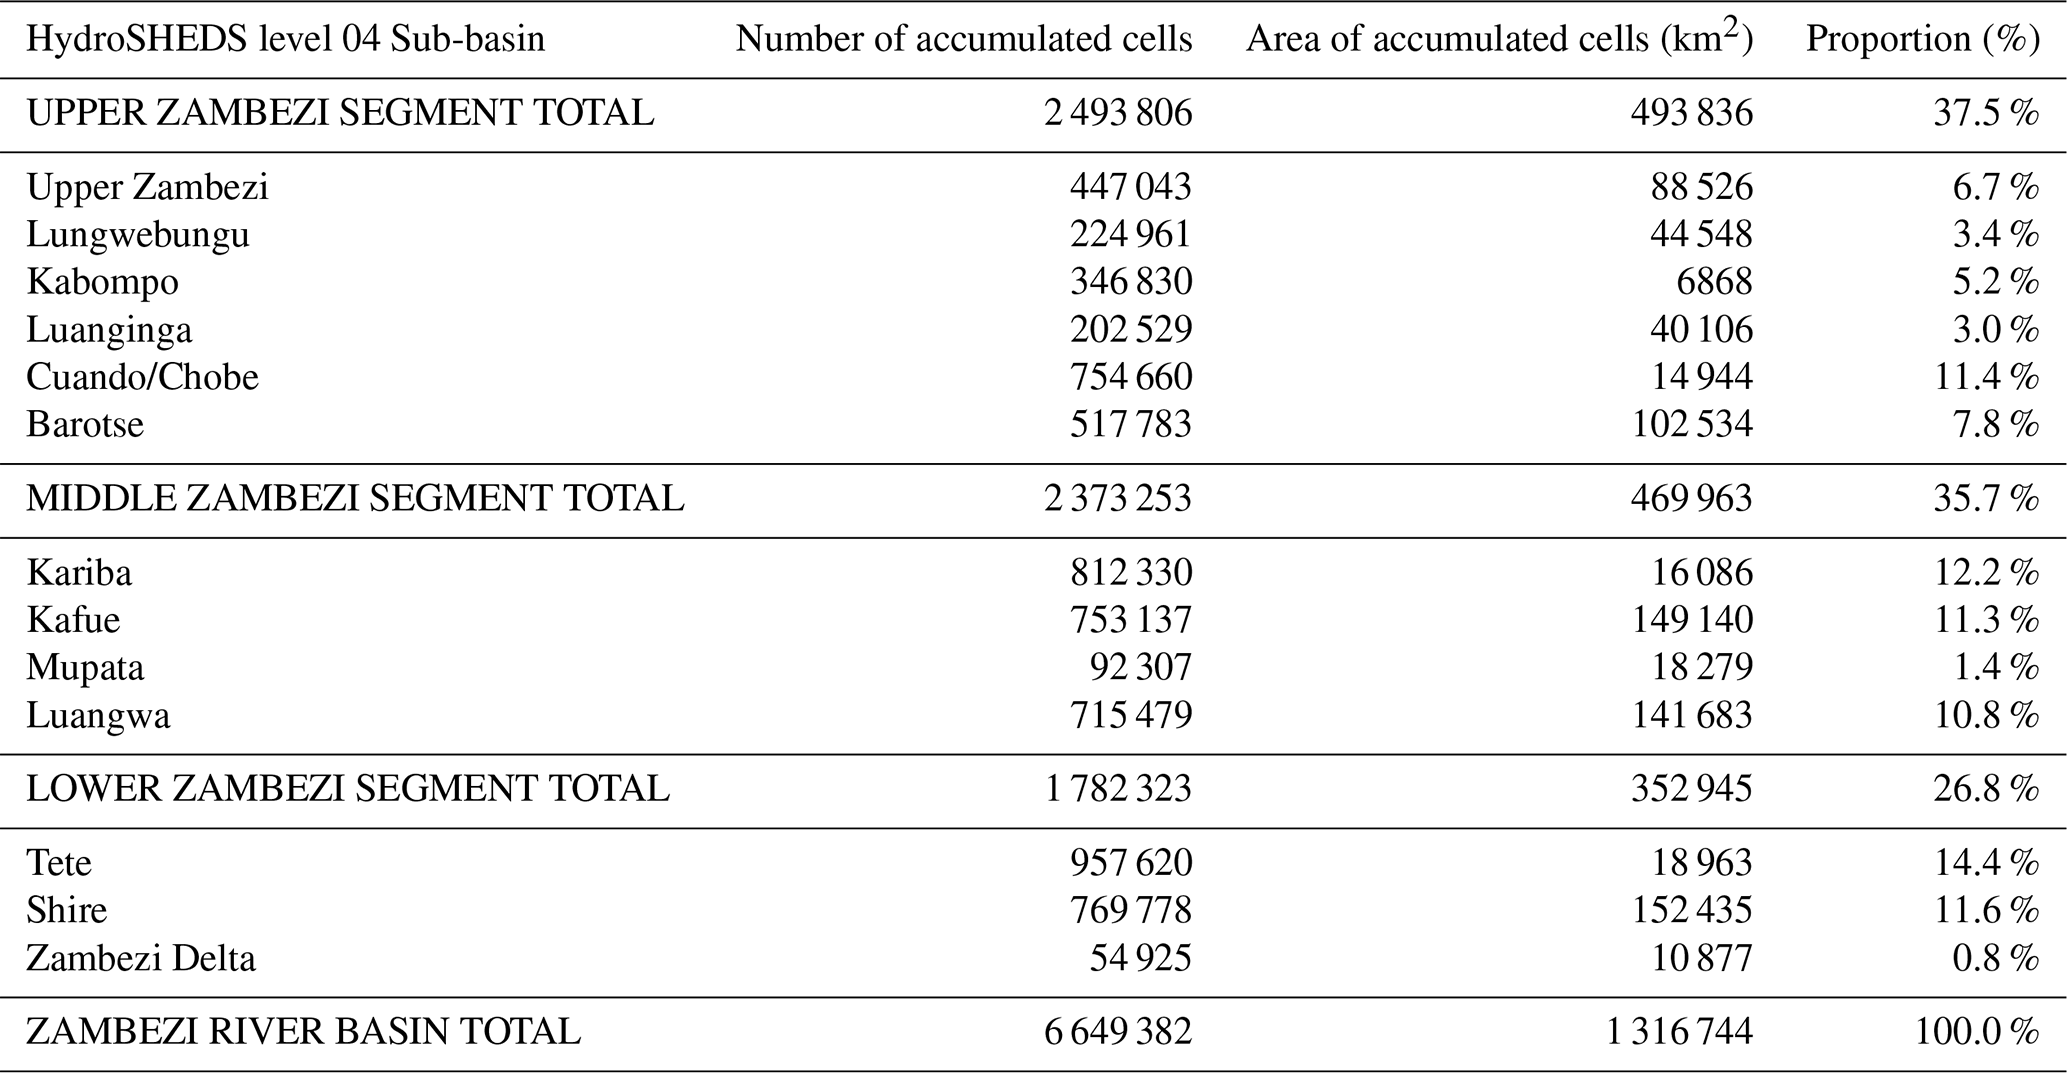
The Upper Zambezi segment has the highest percentage (37.5 %) of accumulated cells compared to the middle and lower segments (Table 4). Within the Upper Zambezi, the Cuando/Chobe sub-basin provides 11.4 % of the total number of accumulated cells as a measure of the upstream catchment area. The Barotse sub-basin contributes 7.8 % of accumulated cells; however, this basin begins below several other source basins, including the Upper Zambezi, Lungwebungu, Kabompo, and Luanginga. The Tete sub-basin in the Lower Zambezi segment has the highest flow accumulation contribution (14.4 %) and spans across parts of Mozambique, Zimbabwe, and Zambia.
Table 4The WWF HydroSHEDS Flow Accumulation for each HydroSHEDS level 04 sub-basin within the Zambezi River Basin.
Within the Upper Zambezi Segment, historical discharge data were obtained from eight separate gauge stations and these were compared to two modelled datasets from Collins et al. (2024) and Akpoti et al. (2024). The locations of each station were mapped (see Fig. S3). It is evident that both the Collins et al. (2024) and Akpoti et al. (2024) datasets diverge greatly from the historical gauged station data within this geographical setting. The Collins et al. (2024) dataset diverges the most for the station along the Cuando River (at the Kongola gauge station), where discharge is inflated (modelled peak flow of 1845 m3 s−1 vs gauged flow of 37 m3 s−1) and shown to occur from June to August, not in February. The Akpoti et al. (2024) dataset also diverges greatly at the Kongola gauge station (modelled annual flow of 237 m3 s−1 vs gauged flow of 33 m3 s−1). See Fig. S4, which includes the monthly mean flows for each of the eight historical gauge stations. Considering that direct extraction of discharge flows for each major tributary from Collins et al. (2024) and Akpoti et al. (2024) would not reveal any meaningful results with certainty, we do not use them for detailed discharge analysis. Instead, we make use of the historical gauge data, the WWF HydroSHEDS Flow Accumulation data and our empirical ADCP discharge to determine which of these rivers have the highest mean monthly discharge and overall flow within the Upper Zambezi segment.
Table 5Mean monthly measured and modelled flows (m3 s−1) for historical gauge station locations within the Upper Zambezi segment.
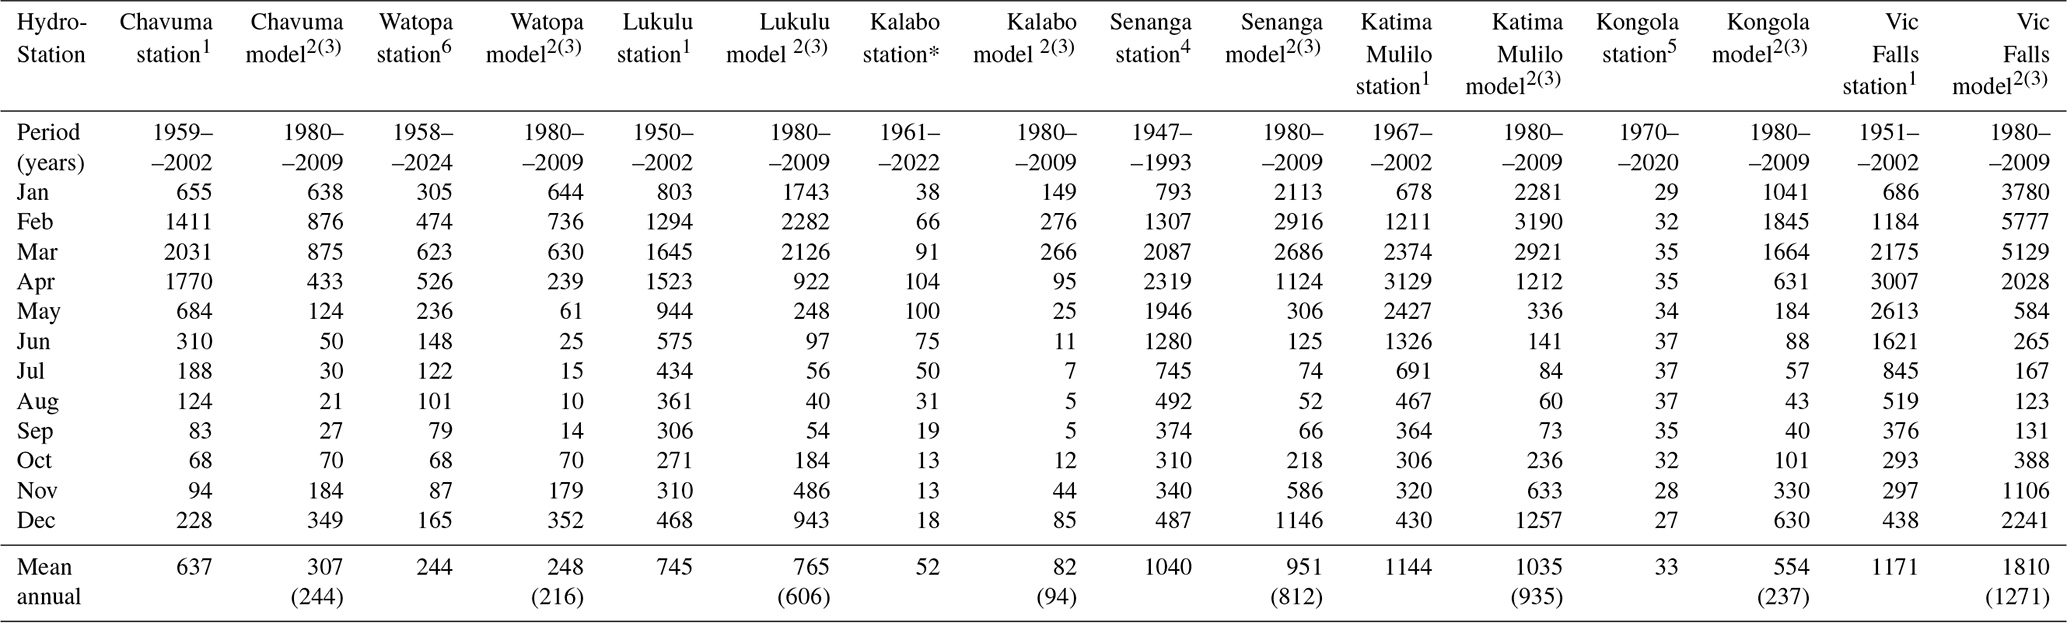
1 Moore et al. (2022). 2 Collins et al. (2024). 3 Akpoti et al. (2024). 4 Hughes and Farinosi (2020), 5 Pallett et al. (2022). The Akpoti et al. (2024) dataset includes only the mean annual discharge for each station location over the period 2001–2021. 6 The Watopa Pontoon and Kalabo station data was provided by WARMA.
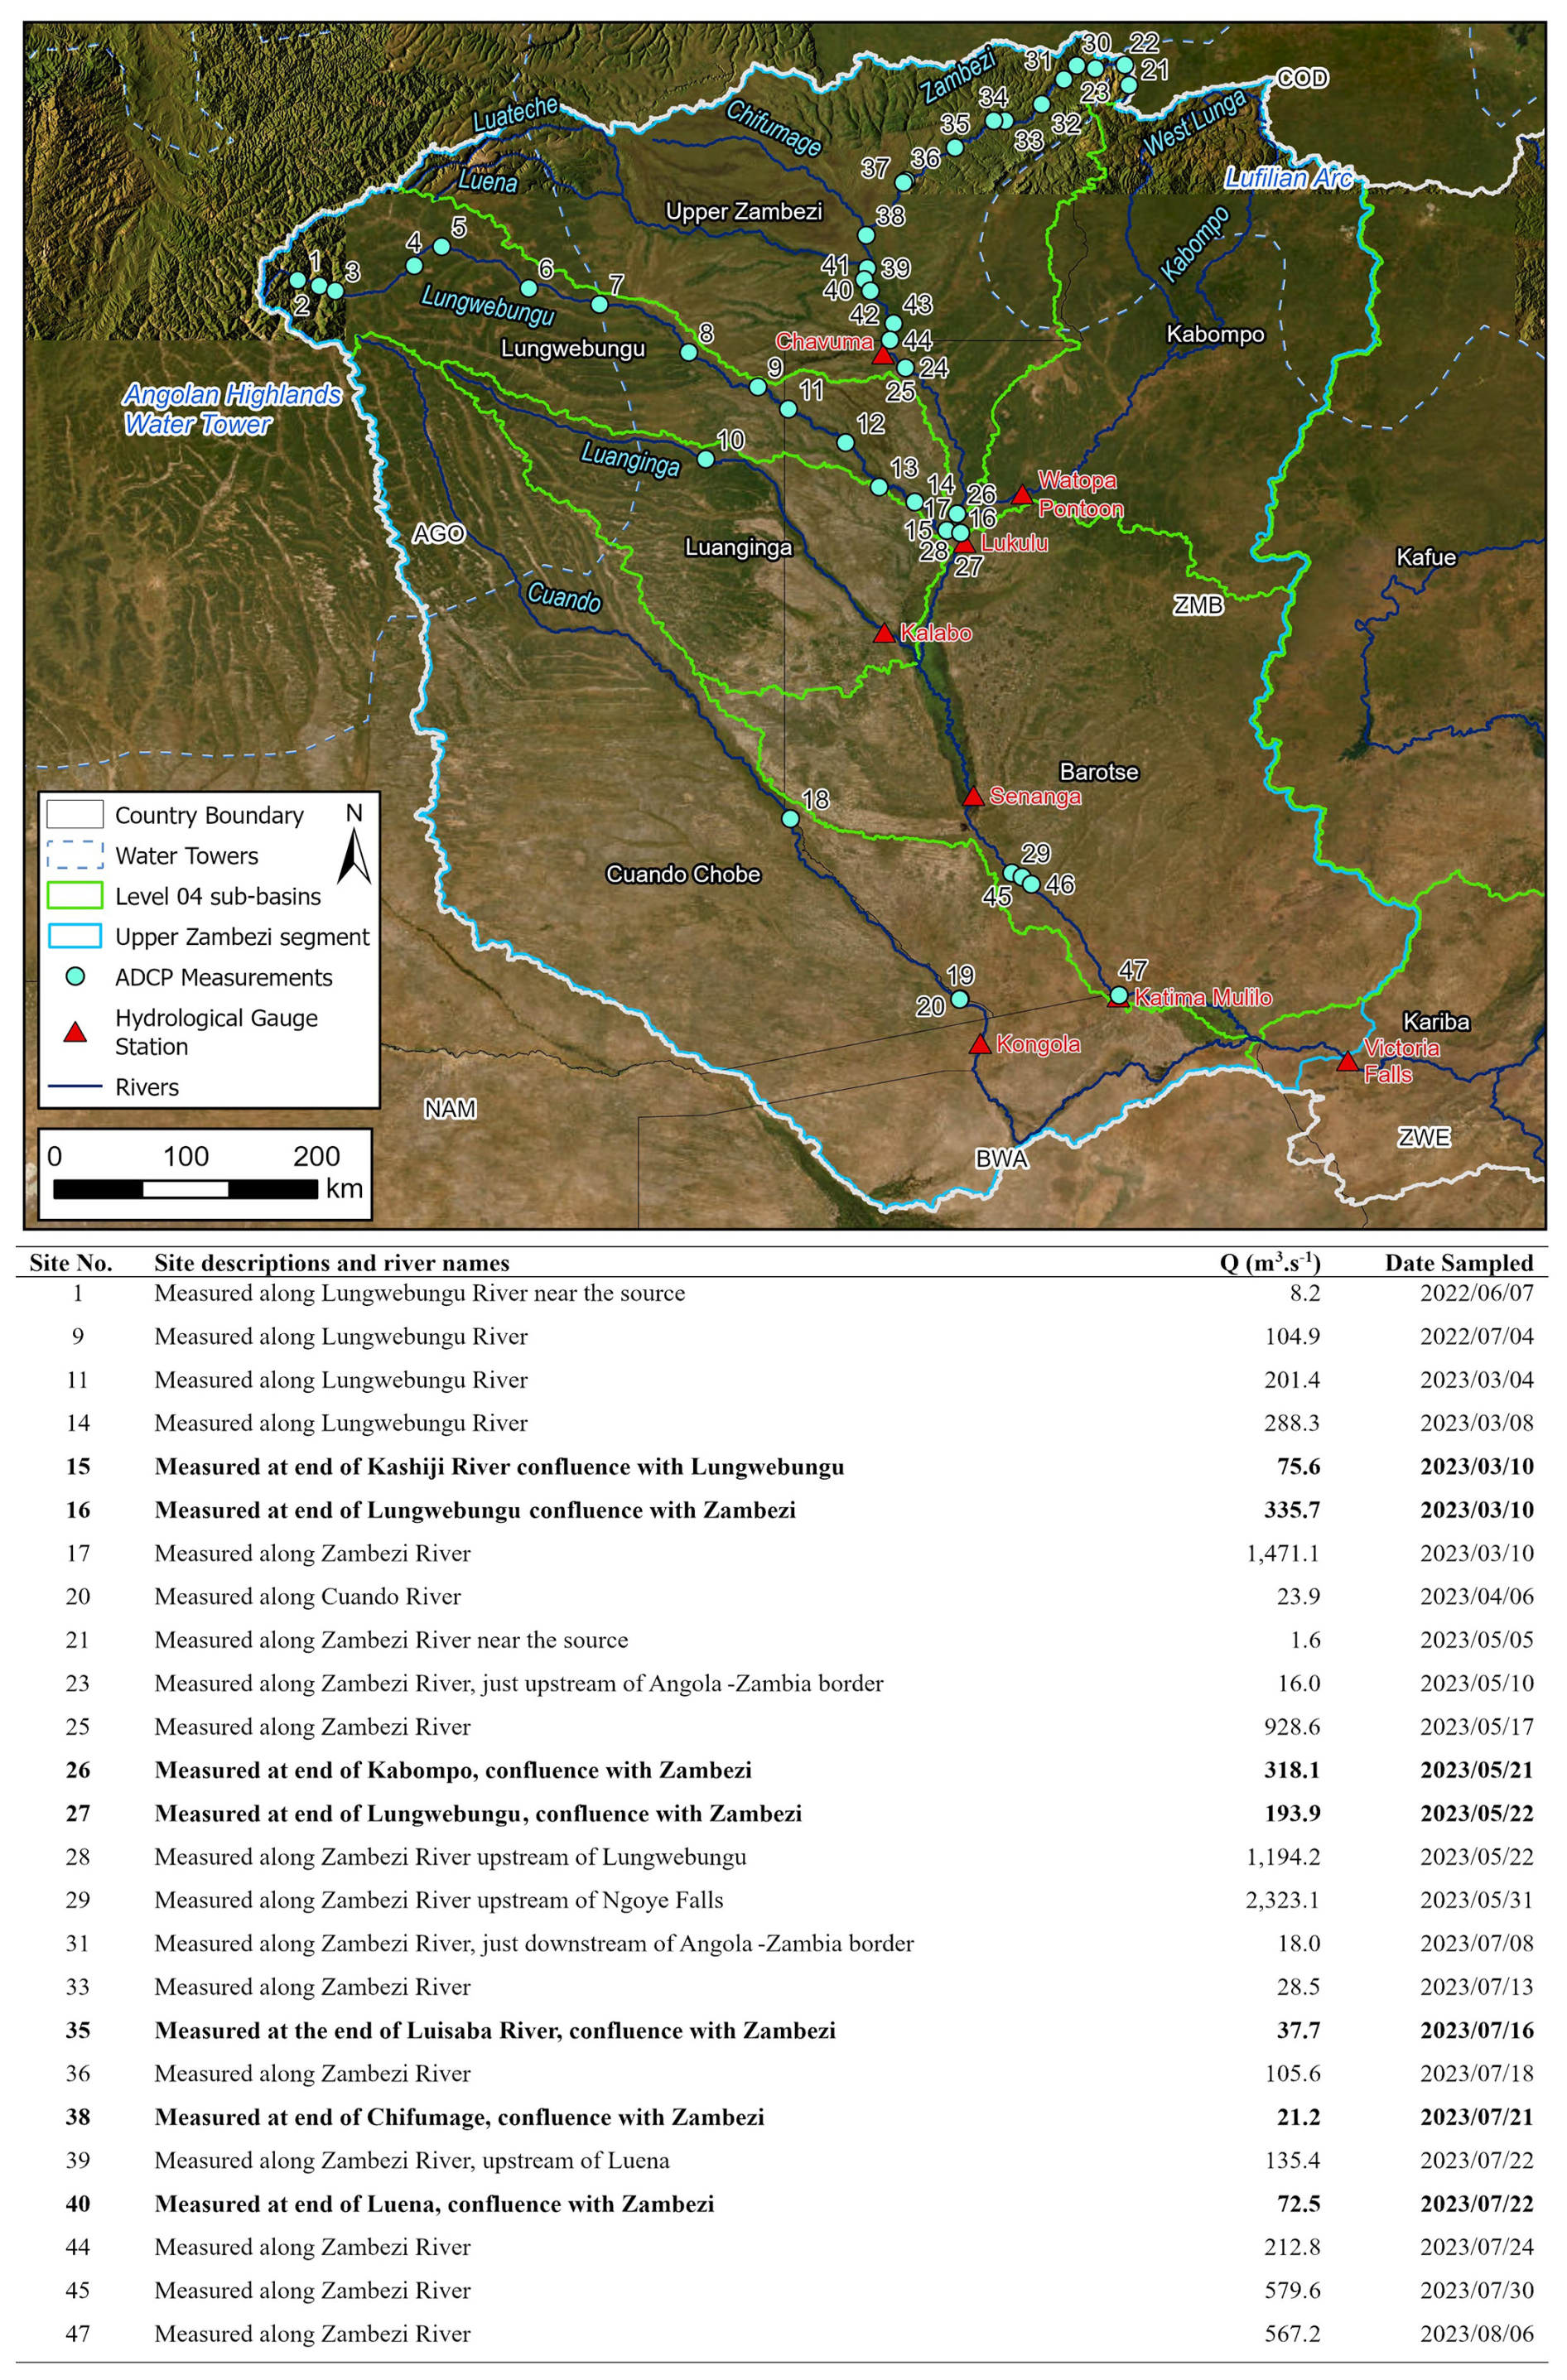
Figure 5Selected empirical discharge measurements conducted along the Upper Zambezi segment, with confluence measurements in bold. See Supplement Table S1, for all ADCP discharge measurements listed in chronological order.
The Chavuma station (Fig. 5) in Zambia has a drainage area of 75 570.7 km2, 85.4 % of the Upper Zambezi sub-basin, and has a mean annual discharge of 637 m3 s−1. Further downstream, the Watopa Pontoon station includes two major tributaries: the Kabompo and West Lunga, with a drainage area of 63 118.2 km2, representing 91.9 % of the Kabompo sub-basin, and a mean annual discharge of 244 m3 s−1. The Lukulu station (Fig. 5), just upstream of the Barotse Floodplain has a drainage basin of 201 774.5 km2, originating from a combination of the Upper Zambezi, Lungwebungu, and Kabompo sub-basins. Despite these two additional tributaries, the mean annual flow is 745 m3 s−1, only 108 m3 s−1 more than at Chavuma. Historical station data show that during the peak flow months (February, March and April), Chavuma has a higher mean monthly discharge than Lukulu, whereas the drier months of May to October show the opposite. Senanga station, located near the southern end of the Barotse Floodplain, has a drainage area of 274 438.2 km2, incorporating flows from the Luanginga sub-basin. Kalabo station drains 31 538 km2, representing 78.64 % of the Luanginga sub-basin, the mean annual flow is 52 m3 s−1. Although the flow regime is similar between Senanga and Lukulu, the mean annual flow at Senanga is 1040 m3 s−1, 295 m3 s−1 greater than at Lukulu, due primarily to additional inputs from the Barotse, Liuwa Plains, and Luanginga wetlands and tributaries.
At Katima Mulilo, drainage area 319 062.9 km2, mean annual flows are 1144 m3 s−1, 104 m3 s−1 greater than at Senanga, due to inputs from tributaries within the eastern section of the Barotse sub-basin. Mean annual flows at the base of the Upper Zambezi segment at Victoria Falls increase to just 1171 m3 s−1, despite contributions from the Cuando Chobe sub-basin. The Cuando River flows measured at Kongola, drainage area 112 340.4 km2, indicates a mean annual flow of just 33 m3 s−1 despite being the sub-basin with the greatest drainage area. The Upper Zambezi is the largest contributing sub-basin in terms of mean annual river discharge, among the longest tributaries, according to selected locations with sufficient historical gauge data. The flow accumulation dataset helps to approximate contributions from each, with the drainage area in descending order: Luena and Luateche (22 718.2 km2); Traditional Zambezi Source (21 058.6 km2); and Chifumage (17 798 km2).
Selected empirical ADCP discharge measurements at 47 separate locations within the Upper Zambezi segment are listed in their chronological order (Fig. 5). Notable measured discharge estimates include: the Lungwebungu River (site 16: 335.7 m3 s−1 on 10 March 2023), contributing approximately 23 % of the 1471.1 m3 s−1 measured along the Zambezi at site 17 on the same day. Discharge measured at the Zambezi River (site 25, just downstream of Chavuma) was 928.6 m3 s−1 on 17 May 2023, which is comparable to the average discharge at the hydrological station between April (1770 m3 s−1) and May (684 m3 s−1). In summary, discharge measured at the end of the Kabompo River (site 26: 318.1 m3 s−1 on 21 May 2023) and Lungwebungu River (site 27: 193.9 m3 s−1), along with measurements on the Zambezi River upstream of the Lungwebungu River (site 28: 1194.2 m3 s−1 on 22 May 2023), indicates that the Kabompo and Lungwebungu Rivers were contributing approximately 23 % and 14 %, respectively, at the time of measurement between March and May 2023.
Discharge measured along the Zambezi River at site 33 was 28.5 m3 s−1 on 13 July 2023. This increased downstream due to several inflows and tributaries, including the Luisaba River (site 35: 37.7 m3 s−1 on 16 July 2023), reaching 106.0 m3 s−1 at site 36 on 18 July 2023. The outflow of the Chifumage River (site 38: 21.2 m3 s−1 on 21 July 2023) increased the flow to 135.4 m3 s−1 on 22 July 2023, measured upstream of the Luena River tributary. The Luena River (site 39: 72.5 m3 s−1 on 22 July 2023) further contributed to discharge along the Zambezi, with the flow measured at site 44 reaching 212.8 m3 s−1 on 27 July 2023. The highest ADCP discharge was measured at site 29 along the Zambezi River, upstream of Ngoye Falls, with a reading of 2323.1 m3 s−1 on 31 May 2023. Just two months later, a measurement downstream of the falls at site 45 had decreased to 579.6 m3 s−1 on 30 July 2023. The final discharge measurement at site 47 (567.2 m3 s−1 on 6 August 2023) is comparable to average flows at Katima Mulilo during July (691 m3 s−1) and August (467 m3 s−1).
Notwithstanding the limited repeated ADCP measurements and the lack of historical gauge station data within Angola, we estimate the flow contributions from Angola and Zambia at the Lukulu confluence, just upstream of the Barotse Floodplain. Below the Lukulu confluence, several attempts have been made to model flows within the Barotse Floodplain and surrounding areas. However, these efforts are complicated by several factors (see Hughes and Farinosi, 2020; Hughes et al., 2023) so we limit our estimates to the upstream section at the Lukulu confluence. Consequently, we interpret our estimates as reflecting only the uppermost headwater sections of the Zambezi River Basin. The Lukulu confluence represents a mix of flows from the Upper Zambezi, Lungwebungu, and Kabompo sub-basins. Within the Lukulu catchment area, the country split by basin area is: Angola =57 % and Zambia =43 %. ADCP measurements at sites 16 and 17 on 10 March 2023 indicate that the Lungwebungu River contributed 22.8 % of the total flow in the Zambezi. However, despite its origins in Angola, the Lungwebungu cannot be considered solely an Angolan river, as a large tributary,the Kasiji River, (located within Zambia) contributed 75.6 m3 s−1 (measured at site 15), or 22.5 %, of the Lungwebungu flow (335.7 m3 s−1) on the same day.
ADCP measurements were conducted to estimate the contributions of flows from Angola and Zambia. On 10 May 2023, site 23, located just upstream of the Angolan border with Zambia, recorded a flow of 16.0 m3 s−1. By 17 May 2023, at site 24 just below the Chavuma station in Zambia, the flow increased to 923.4 m3 s−1. With no significant tributaries between this site and the Angolan-Zambian border, we estimate that potentially 98.3 % of the flow at site 24 originated from Angolan sources. During a separate sampling period, measurements at site 31 (18.0 m3 s−1) just downstream of the Angolan-Zambian border on 8 July 2023 and at site 44 (212.8 m3 s−1) just upstream of the border on 27 July 2023 suggest a 91.5 % contribution from Angolan rivers within the Upper Zambezi segment. At Lukulu, the total estimated flow downstream of the Lungwebungu confluence was 1388.0 m3 s−1 on 22 May 2023, calculated by summing flows from site 27 (193.9 m3 s−1, Lungwebungu tributary) and site 28 (1194.2 m3 s−1, upstream of Lungwebungu). The Zambian contributions to this flow include (1) 318.0 m3 s−1 from the Kabompo tributary (site 26, with 97.8 % of the Kabompo catchment in Zambia). Coincidentally, the Watopa Gauge Station along the Kabompo recorded an average flow of 316.4 m3 s−1 for the same date as our ADCP measurement (21 May 2023), supporting the validity of our result; (2) 16.0 m3 s−1 from site 23 (upstream of the Angolan border), and (3) an estimated 43.7 m3 s−1 from the Kasiji River which accounts for approximately 22.5 % of the Lungwebungu flow of 193.9 m3 s−1, measured previously at site 15. These data suggest a combined Zambian flow contribution of approximately 377.7 m3 s−1, or 27.2 % of the flow at Lukulu, with the remaining 72.8 % attributed to Angolan contributions during this late wet-season measurement period between March and May 2023. These estimates, which are based on discrete time points and subject to temporal variability, local inflows, and hydrological uncertainty, should be interpreted cautiously. However, they represent the very first empirical assessment of Angolan and Zambian flow contributions and provide an initial attempt at quantifying the major contributors of flow within this headwater region of the Zambezi.
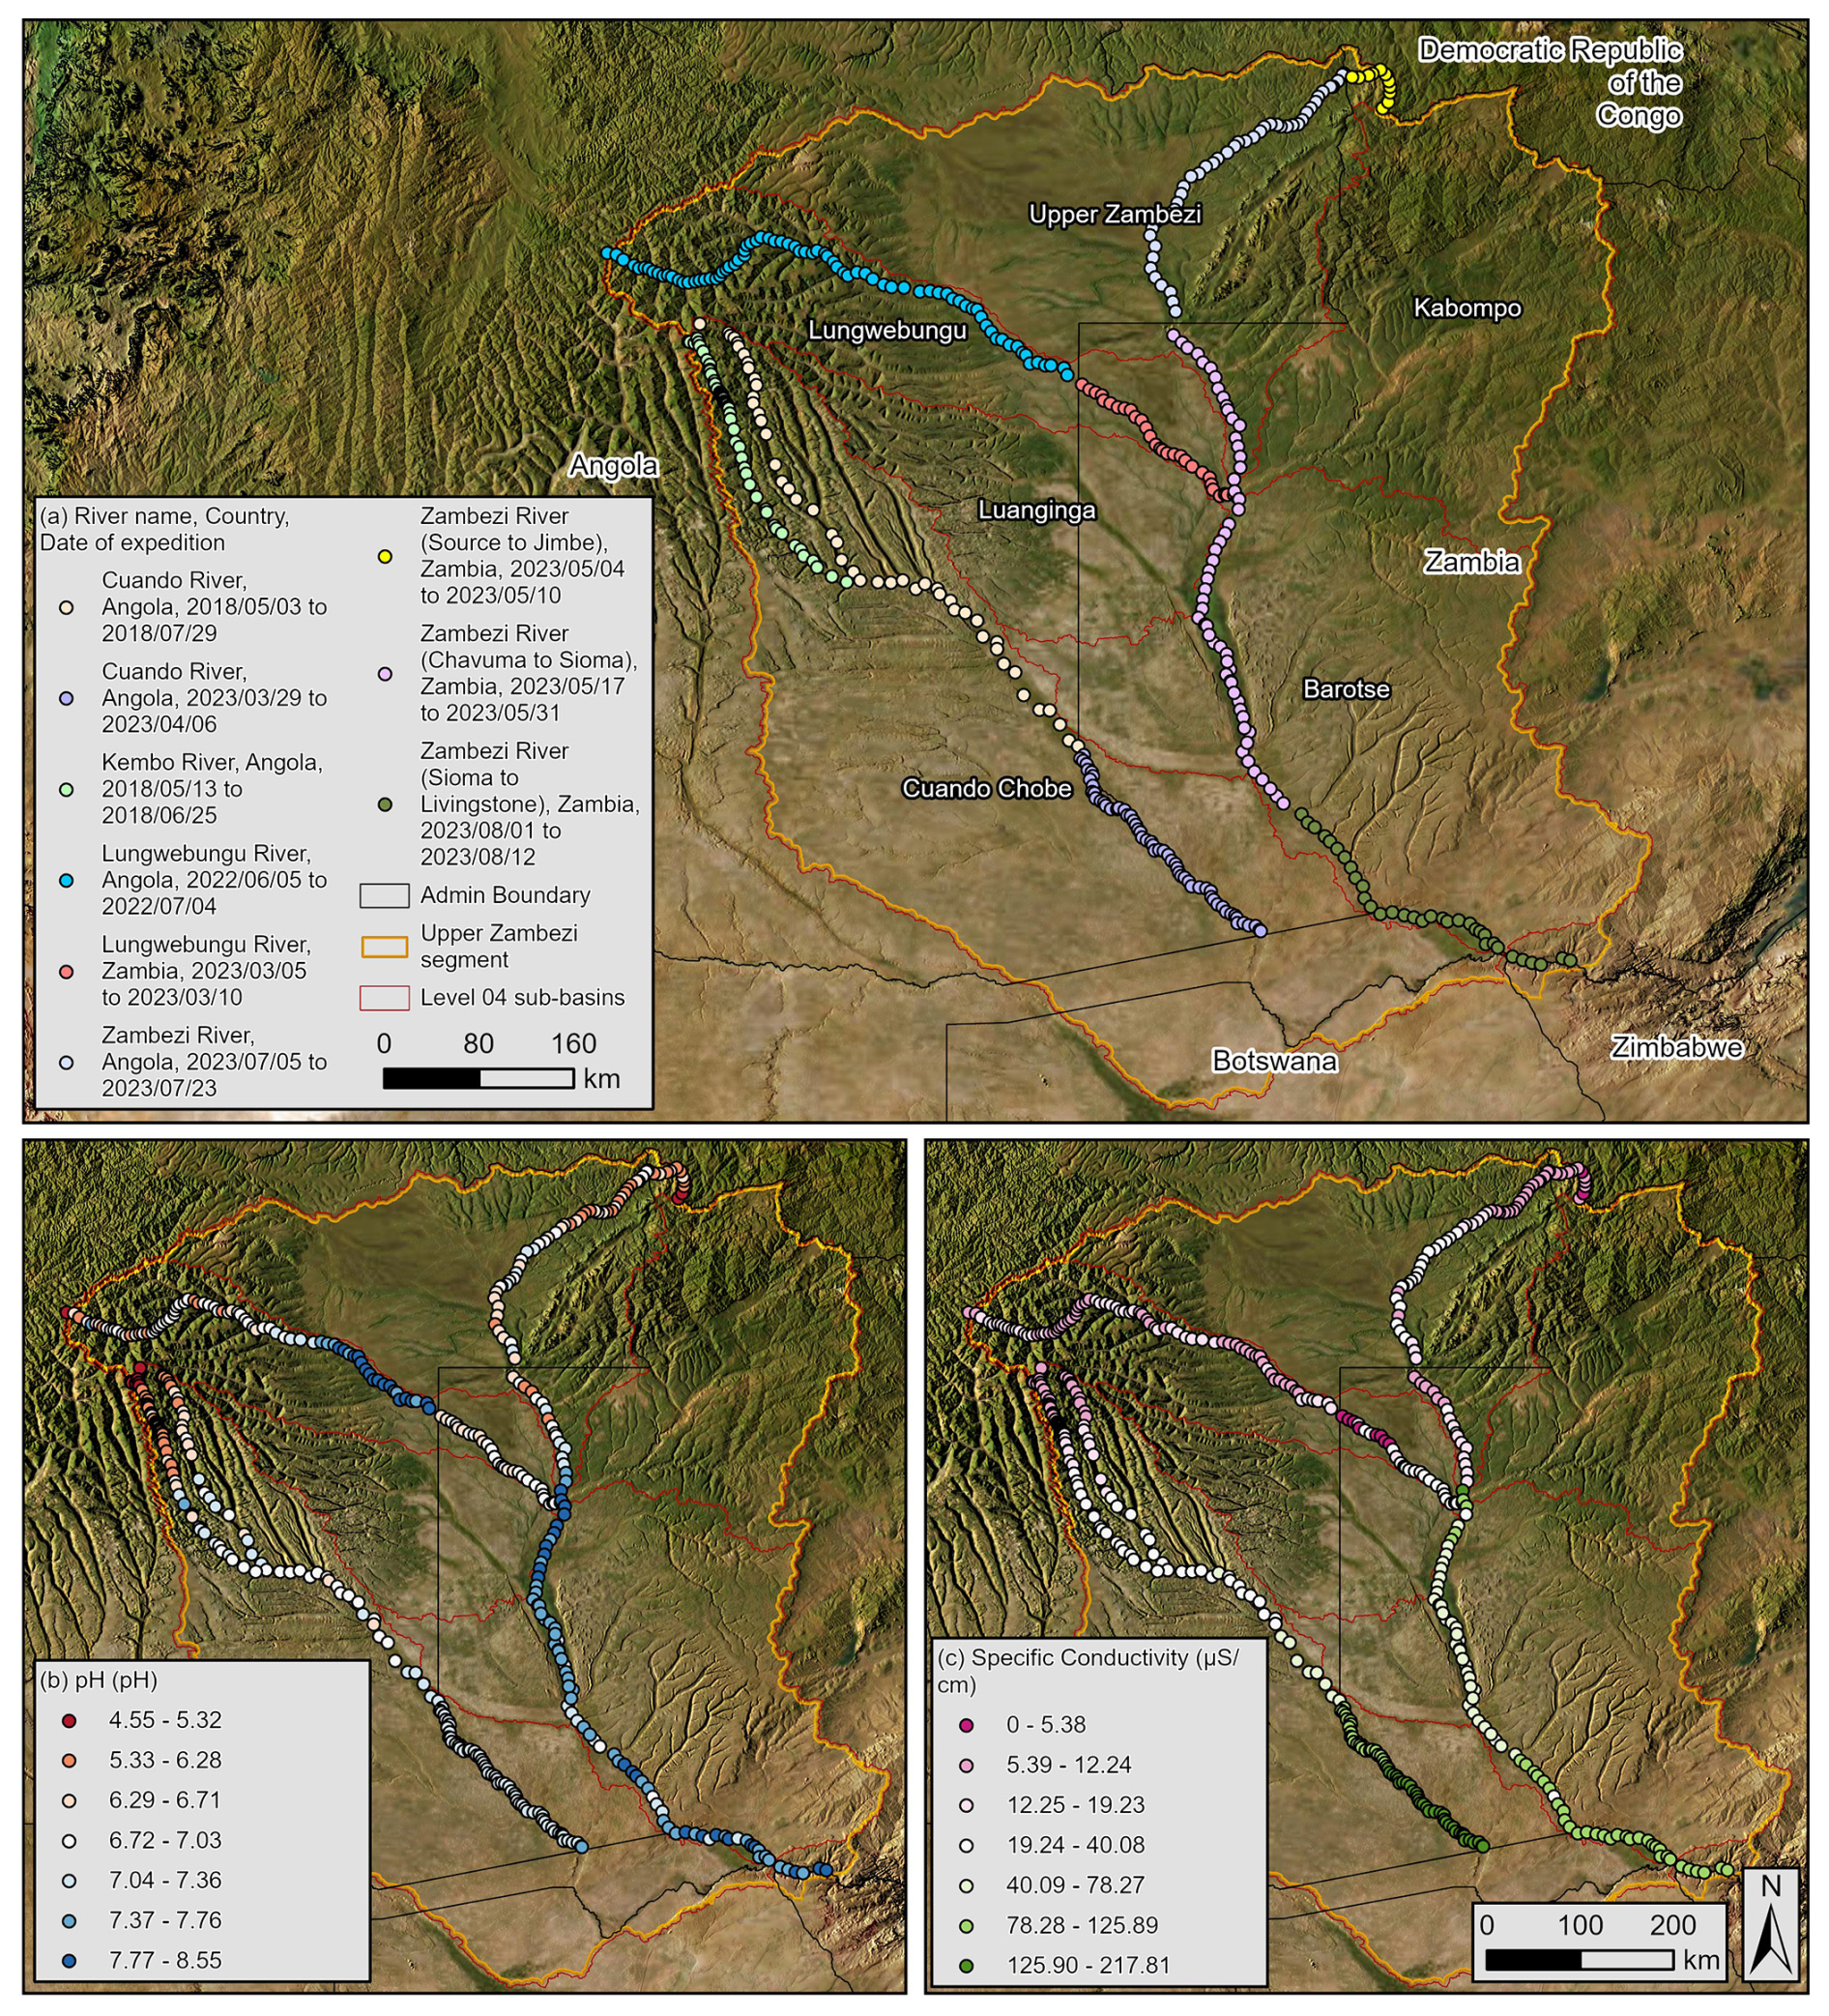
Figure 6(a) Water chemistry sampling locations and date of sampling conducted along various rivers in the Upper Zambezi segment; (b) pH measurements; and (c) specific conductivity measurements.
3.3 Water chemistry
Nine TWP river expeditions were conducted within the Upper Zambezi segment between May 2018 and August 2023 (Fig. 6a). Although water chemistry measurements were affected by seasonal differences in sampling periods, distinct patterns still emerged. pH levels in the source water regions were generally more acidic, ranging from 4.55 to 5.32, and tended to become more alkaline further downstream (Fig. 6b). This trend was observed along the Lungwebungu River transect in Angola. However, pH levels in the Zambian portion of the Lungwebungu transect were lower, likely due to seasonal differences. Before entering the Zambezi, the final pH value of the Lungwebungu River was 6.84 (10 March 2023), while the Kabompo River had a pH of 8.43 (21 May 2023). Along the Zambezi, 10 km upstream of the Kabompo River confluence, the pH was measured at 7.42, increasing to 7.98 below the Kabompo confluence and further to 8.09 below the Lungwebungu confluence, suggesting some mixing but near-neutral conditions during the sampling period. Overall, the rivers tended towards neutral pH levels downstream, with seasonal variation influencing local measurements.
Elevated specific conductivity was observed at three locations (Fig. 6c). Along the Zambezi, 10 km upstream of the Kabompo River confluence, specific conductivity was measured at 13.78 µS cm−1, while the Kabompo River itself recorded 217.81 µS cm−1 (21 May 2023), a fifteen-fold increase and the highest specific conductivity concentration measurement across the TWP (Upper Zambezi segment) expeditions. Downstream of the Kabompo confluence, specific conductivity decreased to 89.32 µS cm−1 and further to 78.27 µS cm−1 below the Lungwebungu River confluence. The final measurement along the Lungwebungu was 23.60 µS cm−1 (10 March 2023), nine times lower than the Kabompo. Despite differences in sampling periods and seasonal influences, a significant increase in specific conductivity is likely attributable to the Kabompo River. This pattern is consistent for both salinity and TDS, with the highest measurements recorded at the Kabompo River Tributary (0.10 PSU and 0.14 ppt, respectively). Concentrations sixteen and twenty-one times higher, respectively, than those at the sampling location 10 km upstream along the Zambezi River, and nine and eleven times higher, respectively, than those of the Lungwebungu River.
Elevated specific conductivity was observed during the second Cuando River expedition, conducted at the end of the rainfall season. The final measurement in 2018 was 59.99 µS cm−1, increasing to 101.47 µS cm−1 at the start of the 2022 expedition and increased steadily downstream to 163.23 µS cm−1. A similar increase was noted downstream of Ngonye (Sioma) Falls, likely reflecting seasonal influences and differences in sampling times. Specific conductivity, salinity, and TDS exhibited similar trends throughout. Both water temperature and DO displayed patterns linked to seasonality. Notable turbidity perturbations exceeding the World Health Organisation (WHO) limit of 5 NTU (Edition, 2011) were observed in some sections, particularly along the Lungwebungu River. However, turbidity levels decreased to below the 5 NTU limit at the Lungwebungu-Zambezi confluence. Downstream of Ngonye (Sioma) Falls, turbidity increased sharply, reaching 157.69 NTU near Victoria Falls. See Fig. S5 for additional water chemistry parameters including TDS, salinity, DO, temperature and turbidity.
3.4 Wetland and surface water inventory
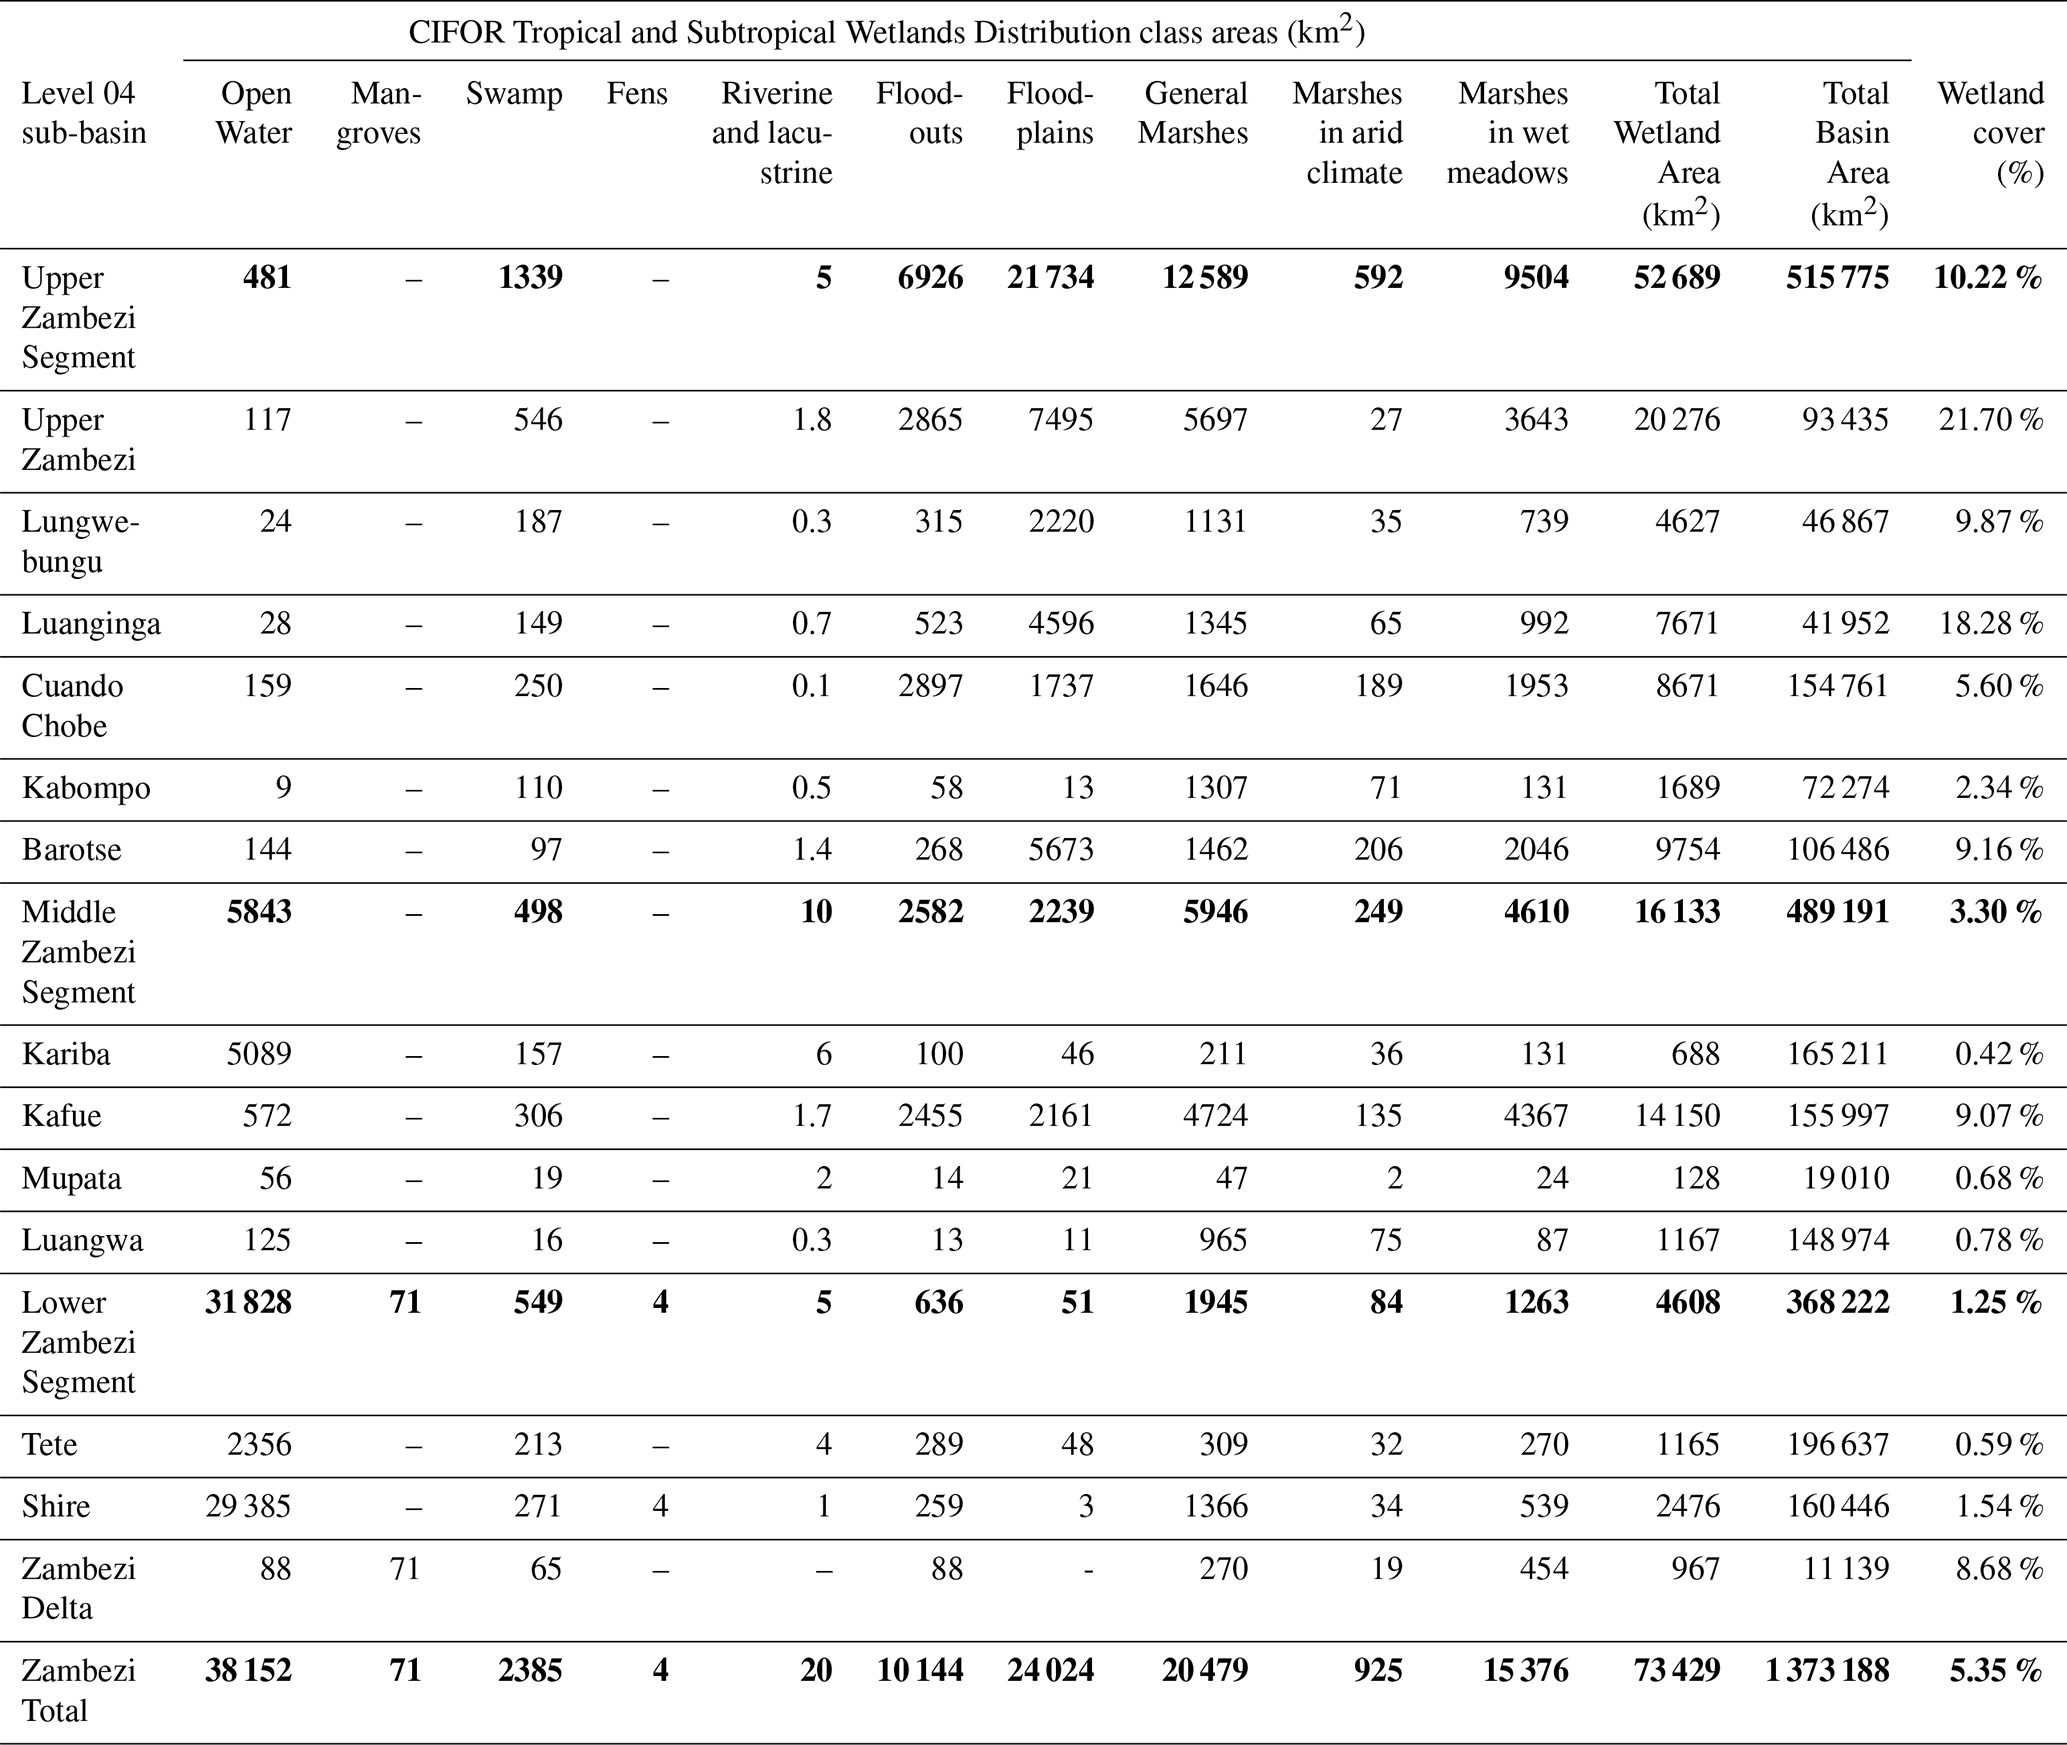
The CIFOR Wetlands Distribution V3 dataset from Gumbricht et al. (2017) was used to assess the total extent and percentage cover of wetlands within each HydroSHEDS level 04 sub-basin (Table 6). According to this product, the Upper Zambezi segment contains 52 589 km2 of wetland area in comparison to the Middle (16 133 km2) and Lower Zambezi segments (4608 km2). The Kameia wetland (described mainly as Floodplains) located in Angola, is formed by the Luena, Luateche and Chifumage Rivers, contains 20 276 km2 of wetlands, covering 21.7 % of the total sub-basin area (see Fig. S6). Notably, other sub-basins originating in Angola including the Lungwebungu (9.87 %), Luanginga (18.28 %) and Cuando Chobe (5.60 %) have extensive wetland coverage, while the Kabompo basin has the lowest wetland coverage (2.34 %) within the Upper Zambezi segment. Wetlands cover 9.16 % of the Barotse sub-basin and are described mainly as Floodplains.
Table 6The CIFOR Wetlands inventory from Gumbricht et al. (2017) for each HydroSHEDS level 04 sub-basin within the Zambezi River Basin. Bold font indicates the total wetland areas for the Upper, Middle, and Lower Zambezi segments, as well as for the entire Zambezi basin.
The spatial distribution of wetlands is mapped in Fig. 1.
The Upper Zambezi segment wetland extent is more than three and ten times larger than that of the Middle and Lower Zambezi segments, respectively, but its Open Water extent is lower. The Middle Zambezi segment contains Kariba Reservoir, Itezhi-Tezhi Reservoir, and Lake Manyeke along the Kafue River, while the Lower Zambezi segment contains Cahora Bassa Reservoir and Lake Malawi (Fig. 2). Of the Level 04 sub-basins in the Middle and Lower Zambezi segments, only the Kafue and Zambezi Delta sub-basins have significant wetland areas, at 9.1 % and 8.7 %, of their total basin area respectively.
The JRC global surface water inventory was used to quantify the water occurrence (Table 7) and seasonality (Table 8) of each HydroSHEDS level 04 sub-basin between 1984–2021. All sub-basins within the Upper Zambezi segment have >65 % surface water presence within the 1 %–10 % frequency, except for the Kabompo (32.5 %), where several recent large-scale mine dumps and pits have filled with water, influencing the surface water dynamics. The remaining Upper Zambezi segment sub-basins show the highest proportion of water occurrence within the 1 %–10 % and 11 %–20 % frequency ranges, with the 91 %–100 % frequency signifying permanent water in rivers and small lakes. The Lungwebungu and Barotse sub-basins have particularly high percentages (5.7 % and 5.9 %, respectively) within the 91 %–100 % range.
Table 7The JRC occurrence of surface water for each HydroSHEDS level 04 sub-basin within the Zambezi River Basin. Bold font indicates the percentage occurrence of surface water for the entire Zambezi Basin.
Seasonality percentages, representing the average number of months water is present in a calendar year (1984–2021), reveal distinct patterns for individual sub-basins (Table 8). In the Upper Zambezi segment sub-basins, most surface water is present for 1–4 months of the year, except in the Kabompo Catchment, where 45.9 % of inundated pixels are present year-round. In contrast, most surface water in the Middle and Lower Zambezi segments persists year-round.
Table 8The JRC surface water occurrence for each HydroSHEDS level 04 sub-basin in the Zambezi River Basin. Bold font indicates the seasonal surface water inundation for the entire Zambezi basin.
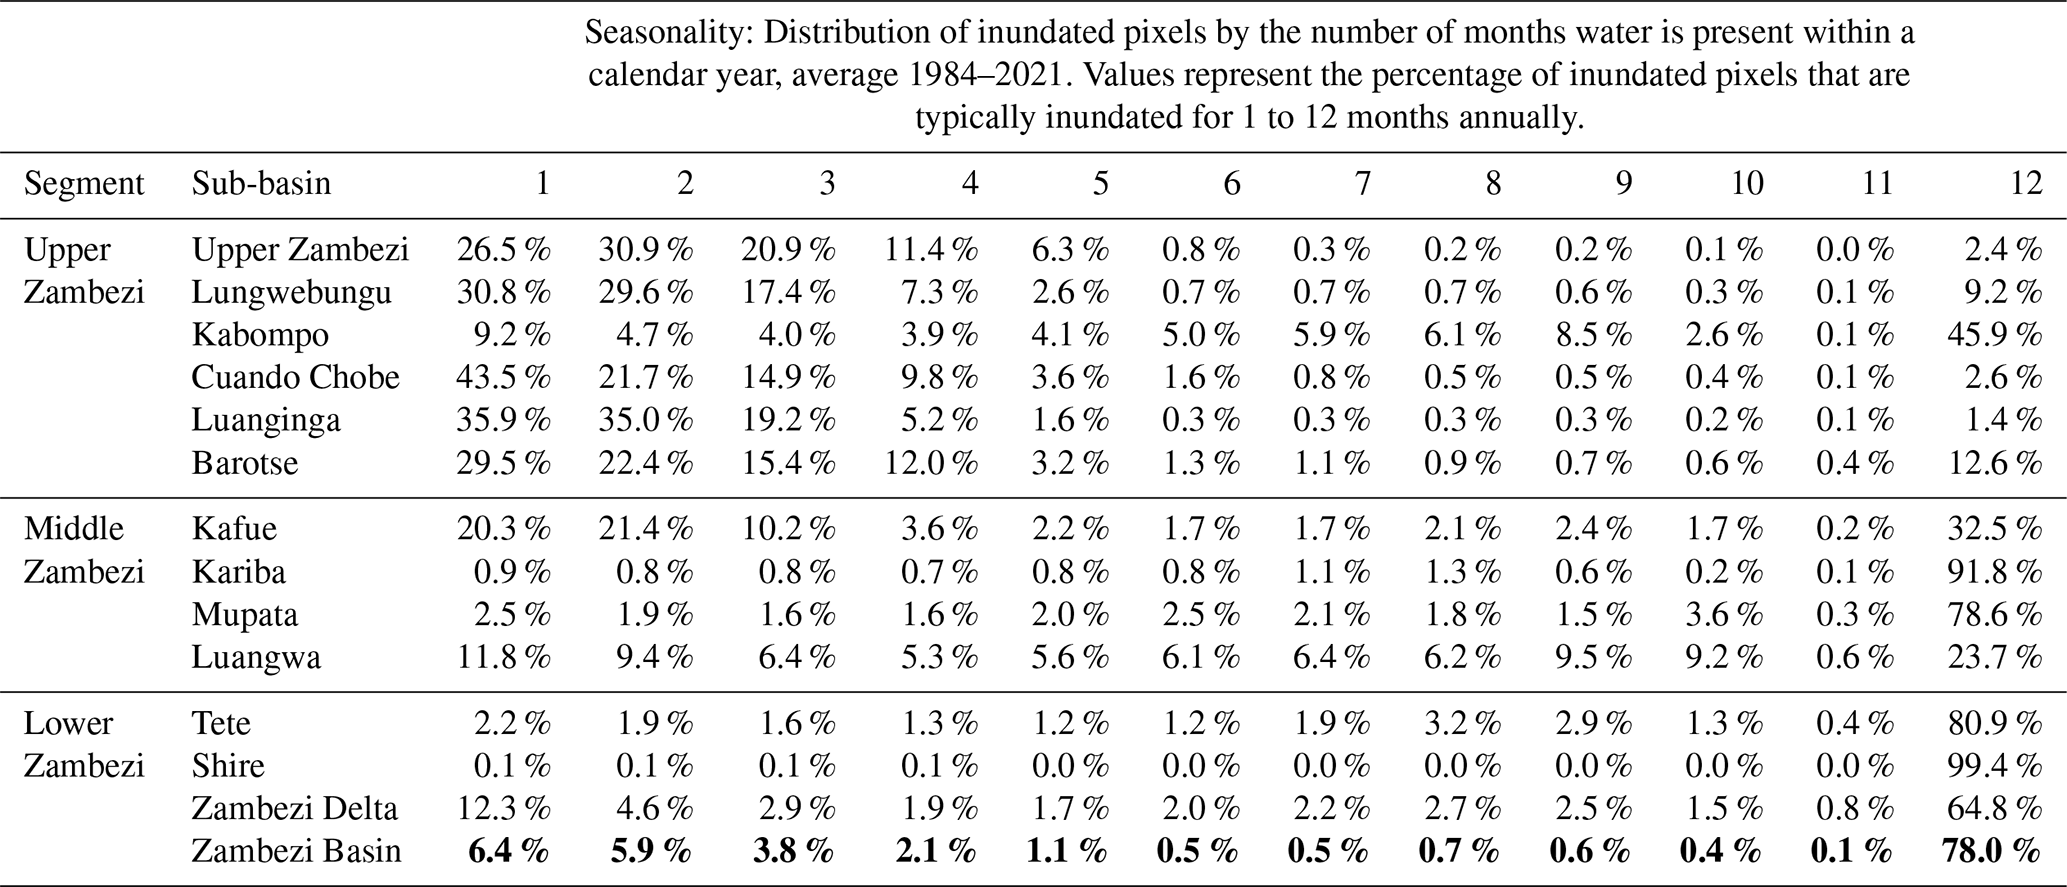
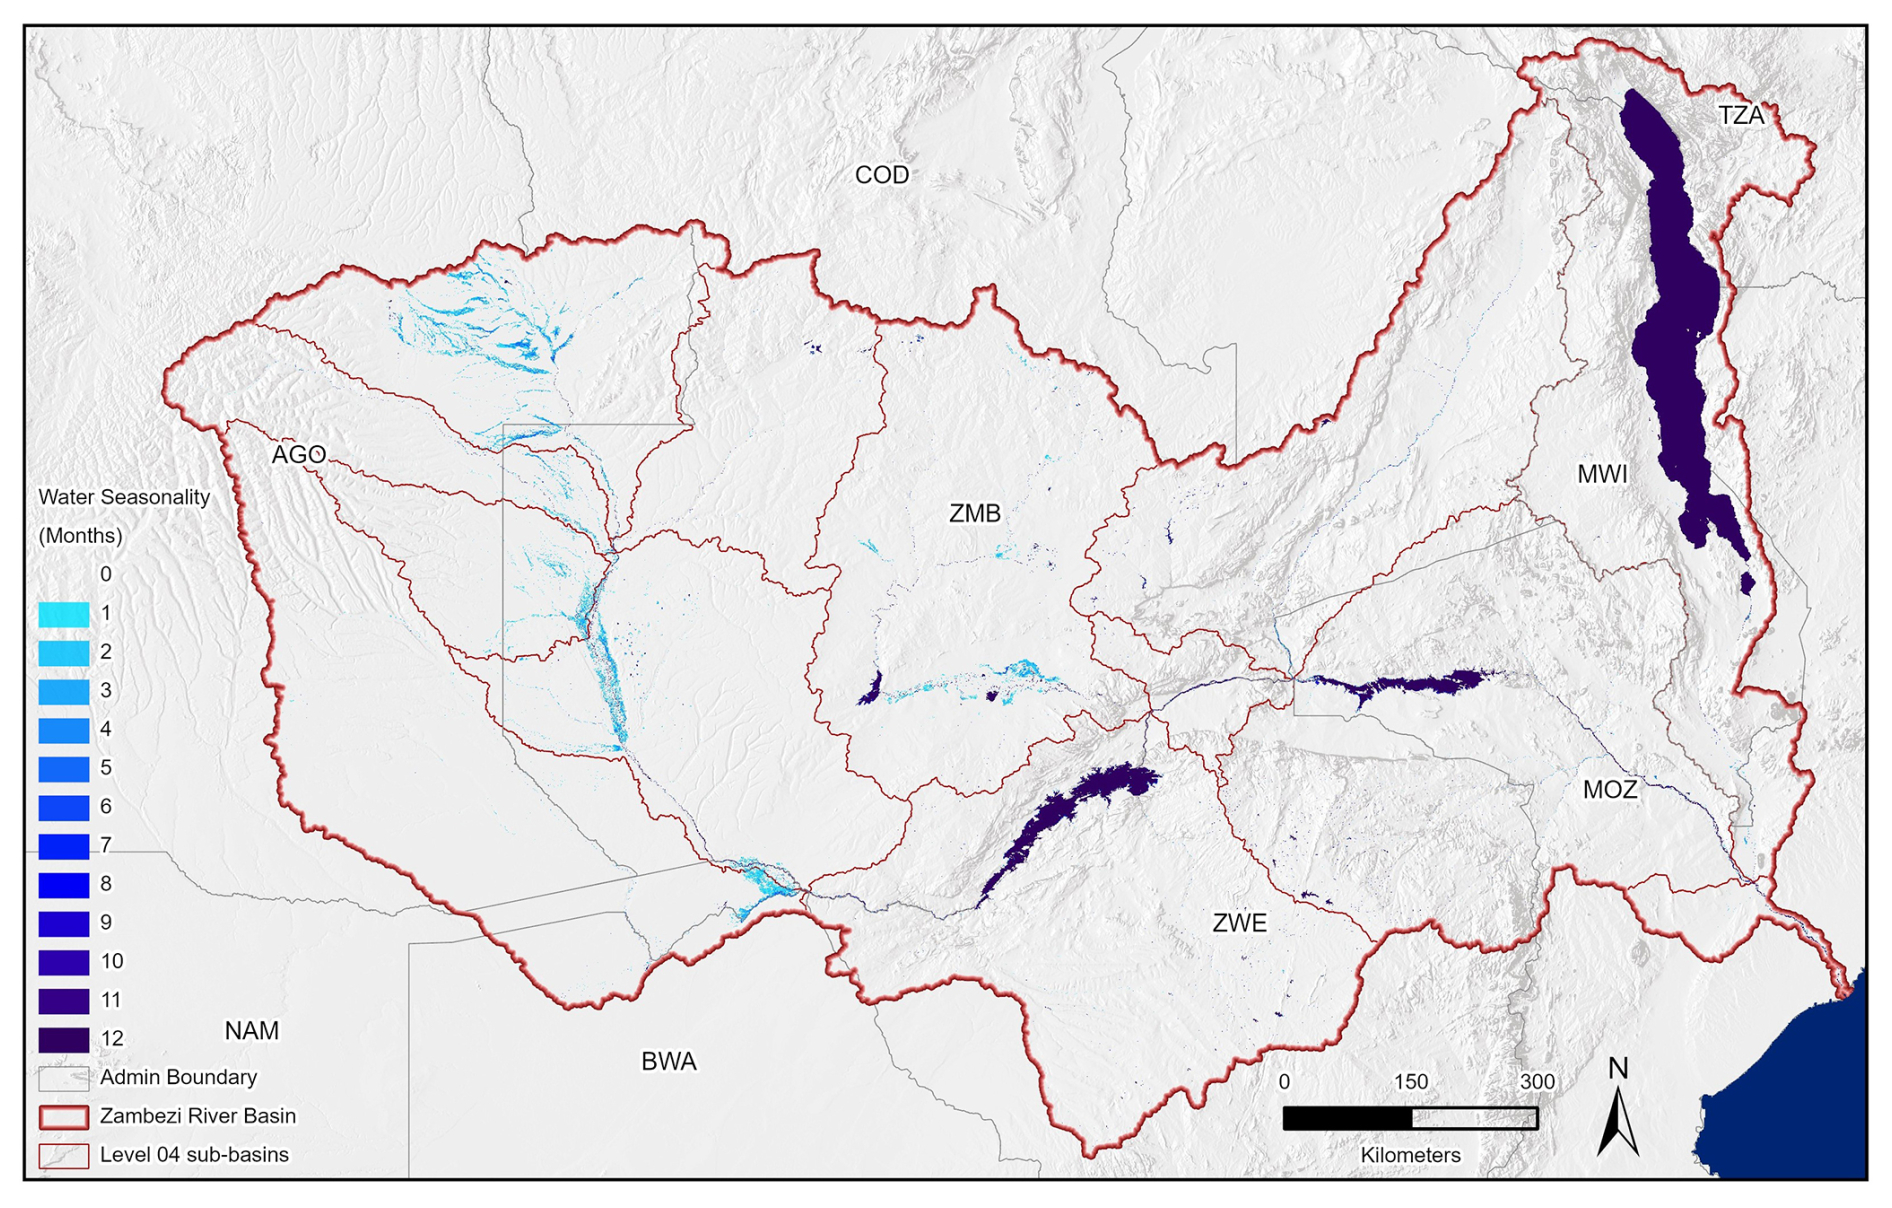
Figure 7JRC average surface water seasonality (number of months water is present within a year) from Pekel et al. (2016) for the Zambezi basin from 1984–2021.
Surface water seasonality was mapped for the Zambezi Basin (Fig. 7), reflecting the distribution of wetlands and open water across the basin, as shown in Fig. 1. The Kameia, Lungwebungu, Luanginga (Angola); Chobe (Namibia); Barotse, and Kafue wetlands (Zambia); have lower seasonality scores due to annual and seasonal surface water dynamics. In contrast, major lakes and reservoirs are inundated year-round on average.
4.1 Assessment of source regions of the Zambezi River
This study combined ground observation data with several high-resolution, robust EO datasets to quantify and compare the source regions of the Zambezi River. The use of EO datasets has enabled geospatial assessments of this vast area (Zambezi basin: 1 370 000 km2) which lacks systematically distributed, long-term hydrological and meteorological monitoring data across the basin. Our combined estimates of river length, flow accumulation, precipitation, historical and empirical discharge, seasonal flows, water chemistry, wetland inventories and surface water dynamics reveal five significant contributions from rivers originating within Angola that have been overlooked:
-
The Lungwebungu River is the longest tributary of the Zambezi River according to empirical expedition track data.
-
Although confined to discrete measurements collected between March and May 2023, preliminary ADCP data suggest that Angolan tributaries contribute the majority of river discharge in the Upper Zambezi headwaters. These data provide the first empirical estimate of contributions in this part of the basin from the Angolan catchments.
-
The outflows of the Lungwebungu and Upper Zambezi sub-basins of Angola are shown to improve overall water quality, reducing elevated specific conductivity, salinity and TDS levels, which are attributed to inputs from the Kabompo sub-basin of Zambia.
-
The Upper Zambezi sub-basin has the highest proportion of source wetlands, including floodplains, originating from rivers and drainage lines within Angola.
-
This empirical confirmation highlights the pioneering assessments of White (1983), Jackson (1986) and others regarding the significance, pertinently the biodiversity and ecosystem services, of the Zambezian Grasslands biome, centred on the reservoir rivers of the Upper Zambezi Floodplains Ecoregion (Skelton, 2024).
Collectively, these observations present complementary lines of evidence which together support a more integrated, transboundary understanding of how the headwaters shape water quantity, quality, and ecosystem resilience downstream.
Complementary definitions of the river source concept consider river length together with characteristics of individual tributaries, which represent respective hydrological attributes of the river system. In this respect, we provide evidence that the currently recognised source of the Zambezi River is not the longest tributary, ranking 5th in length. Empirical comparisons of river length track data and high-resolution digitisation reveal the Lungwebungu River is approximately 342 km longer than the traditionally recognised source. Originating in Angola, this river is the source of the Zambezi according to the criterion of river distance (Fig. 2). In comparison, although the 1387 km Manyame River in Zimbabwe starts at the highest elevation (1660 m a.s.l.), it originates from a separate headwater region, distinct from the most distal source water regions: the Eastern Congo-Zambezi (or Lufilian Arc) and the AHWT. Historical gauge station data indicate that each of the major tributaries in the Upper Zambezi Segment is perennial, and therefore, no alternative ephemeral water sources were identified within our analysis at this scale.
ADCP measurements conducted along the Zambezi River indicate that the Angolan contribution to the Upper Zambezi sub-basin (Fig. 2) was 98.3 % in May 2023 and 91.5 % in July 2023. The measurements show that in July 2023, the Luena River tributary was the highest contributor, providing approximately 34 % of the discharge during that period. ADCP measurements were conducted to estimate the flow contributions from Angola and Zambia at the Lukulu confluence, located downstream of the Upper Zambezi, Lungwebungu and Kabompo sub-basins, and upstream of the Barotse Floodplain (Fig. 2). Estimates show that in May 2023, 27.2 % of the flow at Lukulu could be attributed to Zambia, with 72.8 % attributed to Angola. The Lukulu catchment, comprising Upper Zambezi, Lungwebungu and Kabompo sub-basins, is divided by area: Angola =57 % and Zambia =43 %. Although the Angolan portion covers only 14 % more area, it contributed approximately 45.6 % more flow at the Lukulu confluence than the Zambian portion during this measurement period. Despite being a first-pass estimate, these data provide the first empirical assessment of national flow contributions in the Upper Zambezi headwater region during the late wet season (March–May 2023), offering a valuable baseline for future hydrological studies. Developments or impacts on the Angolan portion of the Lukulu catchment are therefore likely to disproportionately affect the rest of the Zambezi River system. Further flow measurements over extended periods are necessary to account for seasonal and interannual variation.
The water chemistry parameters (water temperature, specific conductivity, TDS, salinity, pH and DO) of the Cuando, Kembo and Lungwebungu and Zambezi Rivers fall within WHO potable water limits (Edition, 2011). This highlights the natural high water quality conditions of these source rivers, with minimal impacts on their upstream water quality (Huntley et al., 2019). While our point-in-time measurements are preliminary, they offer an initial yet meaningful indication of water chemistry contrasts and broader upstream–downstream differences. The Kabompo River has elevated specific conductivity, salinity and TDS levels. Inflows from the Upper Zambezi and Lungwebungu sub-basins reduce these elevated levels, with the Kabompo showing levels more than nine times higher than those in the upstream Zambezi and Lungwebungu Rivers for each of these three parameters, a policy-relevant finding. The Kabompo catchment in Zambia hosts several mining operations, particularly for copper, cobalt, and zinc (Steven, 2000; Mukube and Syampungani, 2025). These activities can release contaminants such as sulphates and heavy metals, increasing dissolved substance concentrations (Edition, 2011). However, further sampling during different seasons is still required to confirm these trends.
4.2 Hydrology
The Zambezi River Basin, has a cumulative mean annual flow of approximately 97 km3 yr−1 from its main river and tributaries (Moore et al., 2022). The northern tributaries contribute the most to runoff (Meier et al., 2011), while water abstractions account for only 3 % and reservoir evaporation just over 5 % of the Zambezi's total flow (Moore et al., 2022). McCarthy et al. (2000) state that the Zambezi's annual flows follow an 80-year cycle of alternating wet and dry periods, a long-term pattern also observed in the Okavango River. Historical records of flooding in the Okavango Delta show average to above-average outflows from 1849 to 1900, followed by reduced outflows with some favourable years from 1900 to 1951. During the 1960s and 1970s, outflows were above normal, whereas the 1980s and early 1990s experienced below-normal outflows (McCarthy et al., 2000). Records of water level from the hydrological station at Victoria Falls, collected since 1907 indicate a similar pattern: below normal from 1907–1946, above normal from 1947–1981, and again below normal from 1982–1997 (Moore et al., 2022). Significantly, the Okavango and Zambezi Basins share the same headwater region: the AHWT (Lourenco and Woodborne, 2023) for which the evidence shows that fluctuations in precipitation in their shared headwaters (water tower) has significant and widespread effects across both river systems.
Several investigations into modelling the hydrological flow regimes and discharge of the Zambezi River Basin have been conducted (Meier et al., 2011; Zimba et al., 2018; Hughes and Farinosi, 2020; Hughes et al., 2023). Despite the inherent uncertainties in river discharge modelling, the Upper Zambezi segment presents significant challenges due to its extensive wetlands, emplaced across deep Kalahari sediments, for which an understanding of the water exchange dynamics between river channels and wetland storage areas is basically non-existent (Hughes and Farinosi, 2020). A comparison of long-term gauge station data with datasets from Collins et al. (2024) and Akpoti et al. (2024) highlights these uncertainties. Hydrological modelling remains particularly difficult in data-scarce conditions (Meier et al., 2011), and the absence of hydrological monitoring stations on Angolan rivers further exacerbates data scarcity in the region. Given these uncertainties, we focused our empirical discharge interpretation on areas upstream of the Barotse Floodplain, where river flows are more clearly defined, and we interpret our estimates with caution. Historical discharge data from the Zambian sections of the Upper Zambezi segment indicate that the Upper Zambezi sub-basin contributes the highest flow, particularly during the wet season, measured at Chavuma (mean annual discharge 637 m3 s−1). The Lungwebungu and Kabompo sub-basins provide further inputs, particularly during the dry season, measured at Lukulu (mean annual discharge: 745 m3 s−1: Moore et al., 2022). The contributions of the Barotse and Luanginga provide increased flows measured at Senanga (mean annual discharge: 1040 m3 s−1: Hughes and Farinosi, 2020), whereas the Cuando Chobe basin has a smaller influence (mean annual discharge: 33 m3 s−1 Schleiss and Matos, 2016; Pallett et al., 2022). Mean annual discharge at the Victoria Falls hydrological station increases to 1,171 m3 s−1, indicating that most of the flow originates upstream of the Barotse Floodplain, with little additional water reaching Victoria Falls after the Barotse and Luanginga sub-basins.
Despite its largest drainage area, the Cuando Chobe River sub-basin has a limited impact on the Zambezi's average yearly runoff (Schleiss and Matos, 2016). In models, discharge of large dryland catchments are often over-estimated, with our study showing actual flow data of the Cuando-Chobe does not significantly contribute to the hydrology of Zambezi under present climatic conditions (Schleiss and Matos, 2016; Pallett et al., 2022); Cuando River flow measured at Kongola (17.8123° S, 23.3846° E), Namibia since 1969 remains relatively constant, having significant peaks during intensive rainfall (Pallet et al., 2022). The Collins et al. (2024) discharge data for the Cuando River are (1) inflated and (2) indicate peak flows out of season. This discrepancy reflects the relatively slower water passage through the Cuando River's vast 5 to 15 km-wide floodplains covering approximately 3450 km2 over 500 km (Pallett et al., 2022; Mendelsohn, 2022). The marshy floodplain is covered in tall grasses, phragmites reeds and papyrus causes evaporative losses, seepage and delays in flow. In addition, the elevated specific conductivity, salinity and TDS measured along the Cuando can be attributed to the high rates of evaporation. Consequently, the Collins et al. (2024) (global) and Akpoti et al. (2024) (Africa) datasets have limited relevance in this region, as neither accounts for the region's evaporative processes, infiltration, and residence time due to the scarcity of existing data on these variables.
4.3 Implications for transboundary river management
Since 2004, ZAMCOM has worked towards the equitable and reasonable utilisation of water resources through efficient management and sustainable development. However, due to its remote inaccessibility and other more prominent considerations, limited attention has been paid to the AHWT. Although Angola is often referred to as the “water tower” of southern and south-central Africa (Huntley, 2019), the broader significance and the geopolitical importance of the AHWT is still emerging, particularly in publications and discussions about the management and protection of the Zambezi River. Apart from a few ephemeral rivers and local rainfall, the Zambezi River receives no significant inputs between the Barotse floodplain and Victoria Falls (with the minor exceptions of the Cuando and Luanginga rivers, both of which originate in AHWT). Based on point-in-time measurands conducted during the late rainfall season between March and May 2023, we estimate that approximately 70 % of the water entering the Kariba Reservoir, below Victoria Falls, originates in the AHWT. While preliminary, these initial findings suggest a potentially substantial Angolan contribution to downstream flows, with important but previously underappreciated implications for transboundary river management and policy. This evidence extends to transboundary systems supported by the AHWT, an estimated 95 % of the Okavango Delta's inflow originates from precipitation in Angola (Folwell et al., 2006). The Upper Zambezi and Okavango basins are key dry-season water sources for the Kavango-Zambezi Transfrontier Conservation Area (KAZA-TFCA), the world's largest TFCA, which protects keystone regional wildlife populations (KAZA-TFCA, 2019). Pioneering assessments by White (1983), Jackson (1986), and others highlight the significance of the Zambezian Grasslands biome and the Upper Zambezi tributaries as some of Africa's reservoir rivers, which exhibit minimal fluctuation in water levels due to the slow release of water. They provide vital hydrological functions (Jackson, 1986), supporting regional water security.
The Water tower concept encapsulates how the integral earth surface processes of water supply and storage on mountainous landscapes function to support and sustain environmental and human water demands downstream. In particular, water towers are recognised for their buffering capacity, where glaciers, lakes, and groundwater sustain a steady water supply to downstream areas (Immerzeel et al., 2020). In contrast to the permanent snow and ice formation sustaining cryospheric water towers, unique buffering mechanisms maintain the functioning of the AHWT and other African water towers (Lourenco and Woodborne, 2023). These ecosystem services in tropical highlands are sustained by the extensive Kalahari sediment aquifer, which is mantled by extensive miombo woodlands, and particularly the groundwater-fed peatlands of the dambo floodplains of the Zambezian Grasslands biome. These natural sponges absorb, filter, and store water through the hot, wet season, to gradually release it into the river system over the dry season (Lourenco et al., 2022). Radiocarbon dating shows these peatlands have functioned for at least 7100 cal. yr BP (Lourenco et al., 2022), after the onset of the African Humid Period during the early Holocene (Shanahan et al., 2015), a testament to the long-term climate resilience of the AHWT. The AHWT maintains a vital buffer against the ecological and socio-economic impacts of the El Niño Southern Oscillation (ENSO) across south-central Africa (Timmermann et al., 2018; Cai et al., 2021). However, mining, deforestation and erosion would destabilise the natural buffering mechanisms and hydrology of the AHWT.
Future development in the Zambezi River Basin is inevitable, but it must be carefully managed to balance the conflicting demands of humans and environmental conservation. Our findings highlight the stark contrast between surface water dynamics in impounded versus free-flowing rivers. In the Upper Zambezi, floodplains with dense vegetation and gentle slopes act as natural sediment traps, limiting downstream transport and supporting vital wetlands for fish, birds, and mammals (Schleiss and Matos, 2016; Moore et al., 2022). These tributaries also provide a reliable perennial water source, sustaining human settlement and agriculture (Pallett et al., 2022). The construction of several major reservoirs downstream of Victoria Falls, including Kariba, Cahora Bassa, Itezhi-Tezhi, and Kafue Gorge, significantly changed the ecology, economic significance, and use in the basin (Moore et al., 2022). Considering the ongoing development plans, future water demand is set to increase, with consequent pressure on authorities in the region to meet it. For instance, development projects in key headwater regions, such as Lungwebungu and the Upper Zambezi sub-basins, will likely destabilise water security across the wider region. Angola is developing rapidly, with expanding road and rail infrastructure providing access to the AHWT. Given its relatively low population density (Lourenco and Woodborne, 2023), special attention must be paid to sustainable development that maintains current water flows and chemistry in the Upper Zambezi. Water availability and contamination are transboundary challenges. Their importance demands high-priority, coordinated action to safeguard the basin's future.
Where they impound large river, reservoirs have become crucial for regional hydroelectric power, and have also boosted local economies through tourism (Khan et al., 2014; Arias et al., 2022). However, these economic benefits have significant human and ecological costs, the construction of Kariba and Cahora Bassa reservoirs displaced thousands of people and caused lasting social impacts. Ecologically, the reservoirs have disrupted the annual flow regime of the Zambezi, and impacted on floodplains by reducing water and sediment flow, with adverse changes to wetlands and biodiversity (Moore et al., 2022). Sediment reduction from Cahora Bassa has led to erosion and loss of soil fertility in the Zambezi Delta, impacting agriculture and wildlife (Ronco et al., 2010; Khan et al., 2014). This degradation illustrates how water abstraction and/or a reservoir upstream of the Barotse Floodplain would negatively impact a system dependent on a seasonal flood pulse (Hughes and Farinosi, 2020; Hughes et al., 2023). Reduced seasonal water flow and sediment supply will alter wetland processes, decreasing wetland extent, channel width, and drought resilience. Increased reservoir evaporation will raise salinity, promote harmful algal blooms, and disrupt water chemistry, affecting pH and oxygen levels. Furthermore, migration pathways of aquatic species will be broken, with potential basin-wide consequences, as headwater and wetland regions serve as a biological reserve, providing breeding and recruitment sites. A secondary consequence will be increased wetland loss as drying vegetation becomes more prone to fires and conversion to agriculture.
Climate change is expected to reduce water availability in the Zambezi Basin, which, already prone to extreme floods and droughts, will face even more challenging conditions due to its distinct wet and dry seasons and reliance on hydropower (Fant et al., 2015; Schlosser and Strzepek, 2015; Arias et al., 2022). This is particularly critical in Africa, where burgeoning climate extremes threaten limited water infrastructure (Cervigni et al., 2015). The current natural water chemistry and flows of the Angolan tributaries enhance the Zambezi Basin's resilience to climate shocks and provides critical ecosystem services to the basin at large. The Angolan tributaries are described as some of Africa's least affected by socio-economic development and remain relatively underdeveloped due to the historical impact of war, which slowed social and economic progress (OKACOM, 2023). The conservation of this area will ensure these ecosystem services continue; however, given the realities of growing demand for economic development in the region, it will be challenging for Angola to bear the full economic cost for the basin alone. Greater recognition of these Angolan source waters is needed, because they are essential to regional water security. The governments of the Zambezi Basin must collaborate across departments and sectors to holistically manage the basin's waters and ensure the region's water future.
By combining in-field data with EO datasets, this study highlights that the Angolan contribution of southern Africa's largest river has been overlooked in the hydrological budget of the Zambezi basin. The Angolan Lungwebungu River is the Zambezi's longest tributary. It is significantly longer (342 km) than the currently recognised source near Mwinilunga, Zambia. The Lungwebungu and Upper Zambezi sub-basins of Angola are shown to improve water quality, reducing elevated specific conductivity, salinity and TDS levels likely attributed by inputs from the Kabompo sub-basin of Zambia. The Upper Zambezi sub-basin, particularly its Angolan component, contains the highest proportion of floodplains, and contributed the most to river discharge during our measurement period; such that we estimate approximately 70 % of the water entering the Kariba Reservoir, below Victoria Falls, originates in the AHWT. These wetlands, including the Kameia wetlands and Luena flats, support significant ecological functions and local fisheries. While our results are exploratory, they represent the first combined assessment using multiple lines of evidence: greater river length, higher discharge, water quality and wetland coverage; collectively, these attributes position the Angolan rivers as the more significant source of the Zambezi River. This study highlights the need for improved monitoring and analyses of flows across the Upper Zambezi, particularly the Angolan tributaries. In addition, Angola plays an important role as the host of the most distant source and a significant portion of the aquifers of the Zambezi River. Given that the natural flow patterns sustain essential ecological processes, which are vital for sustaining aquatic and terrestrial life, any developments, including dam construction, wetland transformation, or water diversion projects, must carefully assess their impacts on natural flow patterns and ecosystem services.
The code and data supporting the findings of this study are available upon reasonable request from the corresponding author. Please contact Rainer von Brandis (rainer@wildbirdtrust.com) for further details.
The supplement related to this article is available online at https://doi.org/10.5194/hess-29-4557-2025-supplement.
RvB and RSB conceptualised the study and designed the research methodology. ML, FPDC and TF conducted the formal analysis. ML produced all the figures and tables. RvB and RSB carried out the investigation and fieldwork. ML, FPDC, TF, FCN and GJR contributed to the data validation and data curation. ML was responsible for writing the original draft. RvB supervised the research. All authors reviewed, edited and approved the final version of the manuscript.
The contact author has declared that none of the authors has any competing interests.
Publisher's note: Copernicus Publications remains neutral with regard to jurisdictional claims made in the text, published maps, institutional affiliations, or any other geographical representation in this paper. While Copernicus Publications makes every effort to include appropriate place names, the final responsibility lies with the authors. Also, please note that this paper has not received English language copy-editing.
The Wilderness Project, National Geographic Okavango Wilderness Project, and Wild Bird Trust expedition teams are acknowledged for their sample collection conducted during the Zambezi River expeditions. David Garret and Joe Cutler are acknowledged for their discussions and feedback throughout the writing process. The Zambian Water Resources Management Authority is acknowledged for sharing the historical gauge station data used in this research.
This paper was edited by Hubert H.G. Savenije and reviewed by two anonymous referees.
Akpoti, K., Velpuri, N. M., Mizukami, N., Kagone, S., Leh, M., Mekonnen, K., Owusu, A., Tinonetsana, P., Phiri, M., Madushanka, L., and Perera, T.: Advancing water security in Africa with new high-resolution discharge data, Sci. Data, 11, 1195, https://doi.org/10.1038/s41597-024-04034-0, 2024.
Alexander, R. B., Boyer, E. W., Smith, R. A., Schwarz, G. E., and Moore, R. B.: The role of headwater streams in downstream water quality 1, J. Am. Water Resour. Assoc., 43, 41–59, https://doi.org/10.1111/j.1752-1688.2007.00005.x, 2007.
Arias, M. E., Farinosi, F., and Hughes, D. A.: Future hydropower operations in the Zambezi River basin: Climate impacts and adaptation capacity, River Res. Appl., 38, 926–938, https://doi.org/10.1002/rra.3958, 2022.
Beilfuss, R.: A risky climate for southern African hydro: assessing hydrological risks and consequences for Zambezi River Basin dams, International Rivers, USA, 60 pp., https://doi.org/10.13140/RG.2.2.30193.48486, 2012.
Cai, W., Santoso, A., Collins, M., Dewitte, B., Karamperidou, C., Kug, J. S., Lengaigne, M., McPhaden, M. J., Stuecker, M. F., Taschetto, A. S., and Timmermann, A.: Changing El Niño–Southern oscillation in a warming climate, Nat. Rev. Earth Environ., 2, 628–644, https://doi.org/10.1038/s43017-021-00199-z, 2021.
Cervigni, R., Liden, R., Neumann, J. E., and Strzepek, K. M. (Eds.): Enhancing the Climate Resilience of Africa's Infrastructure: The Power and Water Sectors, World Bank Publications, Washington, D.C., USA, 181 pp., https://doi.org/10.1596/978-1-4648-0466-3, 2015.
Chenov, C.: Groundwater Resources inventory of Zambia, UNESCO/NORAD Water Resources Research Project, National Council for Scientific Research, Lusaka, Zambia, https://unesdoc.unesco.org/ark:/48223/pf0000061836 (last access: 16 September 2025), 1978.
Collins, E. L., David, C. H., Riggs, R., Allen, G. H., Pavelsky, T. M., Lin, P., Pan, M., Yamazaki, D., Meentemeyer, R. K., and Sanchez, G. M.: Global patterns in river water storage dependent on residence time, Nat. Geosci., 17, 433–439, https://doi.org/10.1038/s41561-024-01421-5, 2024.
Conradie, W., Bills, R., and Branch, W. R.: The herpetofauna of the Cubango, Cuito, and lower Cuando river catchments of south-eastern Angola, Amphib. Reptile Conserv., 10, 6–36, 2016.
Cotterill, F. P. D.: The Upemba lechwe: an antelope new to science emphasizes the conservation importance of Katanga, Democratic Republic of Congo, J. Zool., 265, 113–132, https://doi.org/10.1017/S0952836904006193, 2005.
Dube, K. and Nhamo, G.: Evaluating climate change's impact on hydroelectricity in the Zambezi River Basin, Heliyon, 9, e23235, https://doi.org/10.1016/j.heliyon.2023.e23235, 2023.
Dumont, H. J. (Ed.): The Nile: origin, environments, limnology and human use, 89, Springer Science & Business Media, Dordrecht, https://doi.org/10.1007/978-1-4020-9726-3, 2009.
Edition, F.: Guidelines for drinking-water quality, WHO Chron., 38, 104–108, 2011.
ESRI: ESRI Trace Downstream Tool, https://doc.arcgis.com/en/arcgis-online/analyze/trace-downstream-mv.htm (last access: 12 August 2024), 2024.
Fant, C., Gebretsadik, Y., McCluskey, A., and Strzepek, K.: An uncertainty approach to assessment of climate change impacts on the Zambezi River Basin, Climatic Change, 130, 35–48, https://doi.org/10.1007/s10584-014-1314-x, 2015.
Folwell, S., Farqhuarson, F., Demuth, S., Gustard, A., Planos, E., Seatena, F., and Servat, E.: The impacts of climate change on water resources in the Okavango basin, IAHS Publ., 308, 382–388, 2006.
Frost, P. H., Timberlake, J. R., and Chidumayo, E.: Miombo mopane woodlands and grasslands. In: Wilderness: Earth's Last Wild Places, edited by: Robles Gil, P., Cemex Conservation International, Washington, DC, 182–204, 2002.
Funk, C., Peterson, P., Landsfeld, M., Pedreros, D., Verdin, J., Shukla, S., Husak, G., Rowland, J., Harrison, L., Hoell, A., and Michaelsen, J.: The climate hazards infrared precipitation with stations–a new environmental record for monitoring extremes, Sci. Data, 2, 150066, https://doi.org/10.1038/sdata.2015.66, 2015.
Giri, S.: Water quality prospective in Twenty First Century: Status of water quality in major river basins, contemporary strategies and impediments: A review, Environ. Pollut., 271, 116332, https://doi.org/10.1016/j.envpol.2020.116332, 2021.
Golden, H. E., Christensen, J. R., McMillan, H. K., Kelleher, C. A., Lane, C. R., Husic, A., Li, L., Ward, A. S., Hammond, J., Seybold, E. C., Jaeger, K. L., Zimmer, M., Sando, R., Jones, C. N., Segura, C., Mahoney, D. T., Price, A. N., and Cheng, F.: Advancing the science of headwater streamflow for global water protection, Nat. Water, 3, 16–26, https://doi.org/10.1038/s44221-024-00351-1, 2025.
Gumbricht, T., Roman-Cuesta, R. M., Verchot, L., Herold, M., Wittmann, F., Householder, E., Herold, N., and Murdiyarso, D.: An expert system model for mapping tropical wetlands and peatlands reveals South America as the largest contributor, Glob. Change Biol., 23, 3581–3599, https://doi.org/10.1111/gcb.13689, 2017.
Hanna, D. E., Tomscha, S. A., Ouellet Dallaire, C., and Bennett, E. M.: A review of riverine ecosystem service quantification: Research gaps and recommendations, J. Appl. Ecol., 55, 1299–1311, https://doi.org/10.1111/1365-2664.13045, 2018.
Hughes, D. A. and Farinosi, F.: Assessing development and climate variability impacts on water resources in the Zambezi River basin. Simulating future scenarios of climate and development, J. Hydrol. Reg. Stud., 32, 100763, https://doi.org/10.1016/j.ejrh.2020.100763, 2020.
Hughes, D. A., Read, L., Jeuland, M., Kapangaziwiri, E., Elkurdy, M., Lambl, D., Hale, E., and Opperman, J. J.: Insights from a comparison of two hydrological modelling approaches in the Kwando (Cuando) River and the western tributaries of the Zambezi River basin, J. Hydrol. Reg. Stud., 48, 101482, https://doi.org/10.1016/j.ejrh.2023.101482, 2023.
Huntley, B. J.: Angola in outline: physiography, climate and patterns of biodiversity, in: Biodiversity of Angola. Science & Conservation: A Modern Synthesis, edited by: Huntley, B. J., Russo, V., Lages, F., and Ferrand, N., Springer Nature, Cham, Switzerland, 25–30, https://doi.org/10.1007/978-3-030-03083-4_2, 2019.
Huntley, B. J., Russo, V., Lages, F., and Ferrand, N.: Biodiversity of Angola: Science & Conservation: A Modern Synthesis, Springer Nature, 489 pp., https://doi.org/10.1007/978-3-030-03083-4, 2019.
In-Situ Inc: Aqua TROLL 600 Operators Manual, 81 pp., https://in-situ.com/us/pub/media/support/documents/Aqua-TROLL-600-Manual.pdf?srsltid=AfmBOooeGl4gApijdRJmY_f2ocN7iLt4viyg36Vvex2o3nheltTysmEE (last access: 6 July 2024), 2024.
Immerzeel, W. W., Lutz, A. F., Andrade, M., Bahl, A., Biemans, H., Bolch, T., Hyde, S., Brumby, S., Davies, B. J., Elmore, A. C., and Emmer, A.: Importance and vulnerability of the world's water towers, Nature, 577, 364–369, https://doi.org/10.1038/s41586-019-1822-y, 2020.
Jackson, P. N. B.: Fish of the Zambezi system, in: Ecology of River Systems, edited by: Davies, B. R. and Walker, K. F., Dr W. Junk Publishers, Dordrecht, the Netherlands, 269–288, https://link.springer.com/book/10.1007/978-94-017-3290-1 (last access: 16 September 2025), 1986.
Kammerer, J. C.: Largest Rivers in the United States, U.S. Geological Survey Open-File Report 87-242, rev. 1990, https://doi.org/10.3133/ofr87242, 1987.
KAZA-TFCA: The Kavango-Zambezi Transfrontier Conservation Area, https://www.kavangozambezi.org/ (last access: 14 February 2024), 2019.
Key, R. M., Liyungu, A. K., Njamu, F. M., Somwe, V., Banda, J., Mosley, P. N., and Armstrong, R. A.: The western arm of the Lufilian Arc in NW Zambia and its potential for copper mineralization, Journal of African Earth Sciences, 33, 503–528, https://doi.org/10.1016/S0899-5362(01)00098-7, 2001.
Key, R. M., Cotterill, F. P. D., and Moore, A. E.: The Zambezi River: an archive of tectonic events linked to the amalgamation and disruption of Gondwana and subsequent evolution of the African plate, S. Afr. J. Geol., 118, 425–438, https://doi.org/10.2113/gssajg.118.4.425, 2015.
Khan, O., Mwelwa-Mutekenya, E., Crosato, A., and Zhou, Y.: Effects of dam operation on downstream river morphology: the case of the middle Zambezi River, Proc. Inst. Civ. Eng. – Water Manage., 167, 585–600, https://doi.org/10.1680/wama.13.00122, 2014.
Lautze, J., Phiri, Z., Smakhtin, V., and Saruchera, D.: The Zambezi River Basin: pathways for sustainable development, Routledge, New York, https://doi.org/10.4324/9781315282053, 2017.
Lee, J.: Where Does the Amazon River Begin?. https://www.nationalgeographic.com/adventure/article/140213-amazon-river-length-source-maps-science, (last access: 4 June 2024), 2014.
Lehner, B. and Grill, G.: Global river hydrography and network routing: baseline data and new approaches to study the world's large river systems, Hydrol. Process., 27, 2171–2186, https://doi.org/10.1002/hyp.9740, 2013.
Lehner, B., Verdin, K., and Jarvis, A.: New global hydrography derived from spaceborne elevation data, Eos Trans. AGU, 89, 93–94, https://doi.org/10.1029/2008EO100001, 2008.
Linke, S., Lehner, B., Ouellet Dallaire, C., Ariwi, J., Grill, G., Anand, M., Beames, P., Burchard-Levine, V., Maxwell, S., Moidu, H., Tan, F., and Thieme, M.: Global hydro-environmental sub-basin and river reach characteristics at high spatial resolution, Sci. Data, 6, 283, https://doi.org/10.1038/s41597-019-0300-6, 2019.
Lourenco, M. and Woodborne, S.: Defining the Angolan Highlands Water Tower, a 40 plus-year precipitation budget of the headwater catchments of the Okavango Delta, Environ. Monit. Assess., 195, 859, https://doi.org/10.1007/s10661-023-11448-7, 2023.
Lourenco, M., Fitchett, J. M., and Woodborne, S.: Angolan highlands peatlands: Extent, age and growth dynamics, Sci. Total Environ., 810, 152315, https://doi.org/10.1016/j.scitotenv.2021.152315, 2022.
McCaffrey, S. C. and Sinjela, M.: The 1997 United Nations convention on international watercourses, Am. J. Int. Law, 92, 97–107, https://doi.org/10.2307/2998069, 1998.
McCarthy, T. S., Cooper, G. J. R., Tyson, P. D., and Ellery, W. N.: Seasonal flooding in the Okavango Delta, Botswana-recent history and future prospects, S. Afr. J. Sci., 96, 25–33, https://hdl.handle.net/10520/AJA00382353_7717, 2000.
Meier, P., Frömelt, A., and Kinzelbach, W.: Hydrological real-time modelling in the Zambezi river basin using satellite-based soil moisture and rainfall data, Hydrol. Earth Syst. Sci., 15, 999–1008, https://doi.org/10.5194/hess-15-999-2011, 2011.
Mendelsohn, J.: The Angolan catchments of northern Botswana's major rivers: the Cubango, Cuito, Cuando and Zambezi rivers, in: Landscapes and Landforms of Botswana, edited by: Eckardt, F. D., World Geomorphological Landscapes, Springer, Cham, Switzerland, 15–36, https://doi.org/10.1007/978-3-030-86102-5_2, 2022.
Messager, M. L., Lehner, B., Cockburn, C., Lamouroux, N., Pella, H., Snelder, T., Tockner, K., Trautmann, T., Watt, C., and Datry, T.: Global prevalence of non-perennial rivers and streams, Nature, 594, 391–397, https://doi.org/10.1038/s41586-021-03565-5, 2021.
Midgley, J. M. and Engelbrecht, I.: New collection records for Theraphosidae (Araneae, Mygalomorphae) in Angola, with the description of a remarkable new species of Ceratogyrus, Afr. Invertebr., 60, 1–13, https://doi. org/10.3897/AfrInvertebr.60.32141, 2019.
Minshull, J. L.: Dry season fish survival in isolated pools and within sand-beds in the Mzingwane River, Zimbabwe, Afr. J. Aquat. Sci., 33, 95–98, https://doi.org/10.2989/AJAS.2007.33.1.13.397, 2008.
Minshull, J. L.: Fishes of the Matetsi and Deka River catchments, Zimbabwe, Afr. J. Aquat. Sci., 36, 217–220, https://doi.org/10.2989/16085914.2011.559931, 2011.
Montgomery, D. R. and Dietrich, W. E.: Where do channels begin?, Nature, 336, 232–234, https://doi.org/10.1038/336232a0, 1988.
Moore, A. E., Cotterill, F. P. D., Broderick, T. G., and Plowes, D.: Landscape evolution in Zimbabwe from the Permian to present, with implications for kimberlite prospecting, S. Afr. J. Geol., 112, 65–86, https://doi.org/10.2113/gssajg.112.1.65, 2009.
Moore, A. E., Cotterill, F. P. D., and Eckardt, F. D.: The evolution and ages of Makgadikgadi palaeo-lakes: consilient evidence from Kalahari drainage evolution, South-Central Africa, S. Afr. J. Geol., 115, 385–413, https://doi.org/10.2113/gssajg.115.3.385, 2012.
Moore, A. E., Cotterill, F. P., Main, M. P., and Williams, H. B.: The Zambezi: origins and legacies of Earth's oldest river system, in: Large Rivers: Geomorphology and Management, 2nd edn., edited by: Gupta, A., Wiley-Blackwell, Hoboken, NJ, USA, 457–487, https://doi.org/10.1002/9781119412632.ch16, 2022.
Mphasha, L., Mphela, K., and Mogoboya, M.: Examining the significance of names of rivers in South Africa: a Northern Sotho perspective, PalArch J. Archaeol. Egypt/Egyptol., 18, 741–748, 2021.
Mukube, P. and Syampungani, S.: Mine wastelands and abandoned mines in Zambia, in: Derelict Mines, CRC Press, 284–298, https://doi.org/10.1201/9781315141855-16, 2025.
Neal, C., Jarvie, H. P., Love, A., Neal, M., Wickham, H., and Harman, S.: Water quality along a river continuum subject to point and diffuse sources, J. Hydrol., 350, 154–165, https://doi.org/10.1016/j.jhydrol.2007.10.034, 2008.
Neethling, N.: Naming in the Muslim and Xhosa communities: a comparative analysis, S. Afr. J. Afr. Lang., 32, 161–166, https://doi.org/10.2989/SAJAL.2012.32.2.7.1144, 2012.
Newitt, M.: The Zambezi: a history, Hurst Publishers, London, ISBN 1787387003, ISBN 9781787387003, 2022.
OKACOM: Cubango Okavango River Basin (CORB), https://www.okacom.org/permanent-okavango-river-basin-water-commission-okacom (last access: 24 January 2024), 2023.
Pallett, J., Mukumbuta-Guillemin, I., and Mendelsohn, J.: Cuando State of the Basin Report, Namibia Nature Foundation, Windhoek, and WWF Zambia, Lusaka, 96 pp., https://files.worldwildlife.org/wwfcmsprod/files/Publication/file/1qx1b89cok_CUANDO_State_of_the_basin_report_print.pdf (last access: 16 September 2025), 2022.
Pastier, A. M., Dauteuil, O., Murray-Hudson, M., Moreau, F., Walpersdorf, A., and Makati, K.: Is the Okavango Delta the terminus of the East African Rift System? Towards a new geodynamic model: geodetic study and geophysical review, Tectonophysics, 712–713, 469–481, https://doi.org/10.1016/j.tecto.2017.05.035, 2017.
Pastor, A. V., Tzoraki, O., Bruno, D., Kaletová, T., Mendoza-Lera, C., Alamanos, A., Brummer, M., Datry, T., De Girolamo, A. M., Jakubínský, J., and Logar, I.: Rethinking ecosystem service indicators for their application to intermittent rivers, Ecol. Indic., 137, 108693, https://doi.org/10.1016/j.ecolind.2022.108693, 2022.
Pekel, J. F., Cottam, A., Gorelick, N., and Belward, A. S.: High-resolution mapping of global surface water and its long-term changes, Nature, 540, 418–422, https://doi.org/10.1038/nature20584, 2016.
Richardson, J. S.: Biological diversity in headwater streams, Water, 11, 366, https://doi.org/10.3390/w11020366, 2019.
Ronco, P., Fasolato, G., Nones, M., and Di Silvio, G.: Morphological effects of damming on lower Zambezi River, Geomorphology, 115, 43–55, https://doi.org/10.1016/j.geomorph.2009.09.029, 2010.
SADC: The Southern African Development Community Protocol on Shared Watercourses, https://www.sadc.int/sites/default/files/2021-08/Revised_Protocol_on_Shared_Watercourses_-_2000_-_English.pdf, (last access: 6 July 2024), 2000.
Schleiss, A. J. and Matos, J. P.: Zambezi River Basin, in: Chow's Handbook of Applied Hydrology, edited by: Singh, V. P., McGraw-Hill Education - Europe, New York, USA, Chapter 98, https://core.ac.uk/download/148026643.pdf (last access: 15 September 2025), 2016.
Schlosser, C. A. and Strzepek, K.: Regional climate change of the greater Zambezi River basin: a hybrid assessment, Clim. Change, 130, 9–19, https://doi.org/10.1007/s10584-014-1230-0, 2015.
Seyam, I. M., Hoekstra, A. Y., Ngabirano, G. S., and Savenije, H. H. G.: The value of freshwater wetlands in the Zambezi basin, in: AWRA/IWLRI–University of Dundee International Specialty Conference, Dundee, https://iwlearn.net/files/pdfs/Seyam%20et%20al%202001_The%20value%20of%20freshwater%20wetlands%20in%20the%20Zambezi%20basin.pdf (last access: 16 September 2025), 2001.
Shanahan, T. M., McKay, N. P., Hughen, K. A., Overpeck, J. T., Otto-Bliesner, B., Heil, C. W., King, J., Scholz, C. A., and Peck, J.: The time-transgressive termination of the African Humid Period, Nat. Geosci., 8, 140–144, https://doi.org/10.1038/ngeo2329, 2015.
Skelton, P.: Freshwater Fishes of Southern Africa – a Complete Guide, Penguin Random House, Cape Town, ISBN 9781775845317, 2024.
Steven, N. M.: A Shaba-type Cu-Co (-Ni) deposit at Luamata, west of the Kabompo Dome, northwestern Zambia, Explor. Min. Geol., 9, 277–287, https://doi.org/10.2113/0090277, 2000.
Tawfik, R.: Changing hydropolitical relations in the Nile basin: a protracted transition, Int. Spectator, 51, 67–81, https://doi.org/10.1080/03932729.2016.1197496, 2016.
Thieme, M. L., Abell, R., Stiassny, M. L. J., Lehner, B., Skelton, P., Teugels, G., Dinerstein, E., Kamdem Toha, A., Burgess, B., and Olson, D.: Freshwater ecoregions of Africa and Madagascar: a conservation assessment, Island Press, Washington, DC, ISBN 1-55963-365-4, 2005.
Timberlake, J.: Biodiversity of the Zambezi basin, Biodiversity Foundation for Africa, Bulawayo, Zimbabwe, 23 pp., https://biodiversityfoundation.org/wp-content/uploads/BFA-No.9_Zambezi-Basin-Biodiversity.pdf (last access: 16 September 2025), 2000.
Timberlake, J. and Chidumayo, E.: Miombo ecoregion vision report, Occas. Publ. Biodivers., 20, Biodiversity Foundation for Africa, Bulawayo, Zimbabwe, https://library.wur.nl/ojs/index.php/Botswana_documents/article/view/15975/15448 (last access: 15 September 2025), 2011.
Timberlake, J. R., Cotterill, F. P. D., Mundy, P. J., Broadley, D. G., Marshall, B., Gardiner, A. J., and Fitzpatrick, M.: The Miombo Ecoregion: areas of biological importance, Occas. Publ. Biodivers., 21, Biodiversity Foundation for Africa, Bulawayo, https://biodiversityfoundation.org/wp-content/uploads/BFA-No.21_Miombo-ER-Areas-of-Biological-Interest.pdf (last access: 15 September 2025), 2018.
Timmermann, A., An, S. I., Kug, J. S., Jin, F. F., Cai, W., Capotondi, A., Cobb, K. M., Lengaigne, M., McPhaden, M. J., Stuecker, M. F., and Stein, K.: El Niño–Southern Oscillation complexity, Nature, 559, 535–545, https://doi.org/10.1038/s41586-018-0252-6, 2018.
UNEP: Africa Water Atlas, Division of Early Warning and Assessment (DEWA), United Nations Environment Programme (UNEP), Nairobi, Kenya, 326 pp., ISBN 978-92-807-3110-1, 2010.
United States Geological Survey (USGS): Rivers of the World: World's Longest Rivers, https://www.usgs.gov/special-topics/water-science-school/science/rivers-world-worlds-longest-rivers (last access: 4 June 2024), 2018.
Wohl, E. and Merritts, D. J.: What is a natural river?, Geography Compass, 1, 871–900, https://doi.org/10.1111/j.1749-8198.2007.00049.x, 2007.
Wellington, J. H.: Southern Africa – a geographic study. Volume 1, Physical geography, Cambridge University Press, Cambridge, 528 pp., https://www.cabidigitallibrary.org/doi/full/10.5555/19571701682 (last access: 16 September 2025), 1955.
White, F.: The Vegetation of Africa. A Descriptive Memoir to Accompany the UNESCO/AETFAT/UNSO Vegetation Map of Africa. Natural Resources Research No. 20, UNESCO, Paris, 356 pp., https://doi.org/10.5281/zenodo.293797, 1983.
Winton, R. S., Teodoru, C. R., Calamita, E., Kleinschroth, F., Banda, K., Nyambe, I., and Wehrli, B.: Anthropogenic influences on Zambian water quality: hydropower and land-use change, Environ. Sci. Processes Impacts, 23, 981–994, https://doi.org/10.1039/D1EM00006C, 2021.
ZAMCOM: Agreement on the Establishment of the Zambezi Watercourse Commission, https://www.zambezicommission.org/sites/default/files/clusters_pdfs/ZAMCOM agreement.pdf (last access: 6 July 2024), 2004.
Zambezi River Authority: The Zambezi River Authority Webpage, https://www.zambezira.org/hydrology/river-flows (last access: 6 July 2024), 2024.
Zimba, H., Kawawa, B., Chabala, A., Phiri, W., Selsam, P., Meinhardt, M., and Nyambe, I.: Assessment of trends in inundation extent in the Barotse Floodplain, upper Zambezi River Basin: a remote sensing-based approach, J. Hydrol. Reg. Stud., 15, 149–170, https://doi.org/10.1016/j.ejrh.2018.01.002, 2018.