the Creative Commons Attribution 4.0 License.
the Creative Commons Attribution 4.0 License.
 | 16 Sep 2025
Have river flow droughts become more severe? A review of the evidence from the UK – a data-rich, temperate environment
Stephen Turner
Amulya Chevuturi
Wilson Chan
Lucy J. Barker
Maliko Tanguy
Simon Parry
Stuart Allen
When extreme hydrological events (floods and droughts) occur, there is inevitably speculation that such events are a manifestation of anthropogenic global warming. The UK is generally held to be a wet country, but recent drought events in the UK have led to growing concerns around droughts becoming more severe – for sound scientific reasons, given physical reasoning and projections for the future. In this extended review, we ask whether such claims are reasonable for hydrological droughts in the UK using a combination of literature review and extended analysis. The UK has a well-established monitoring programme and a very dense body of research to call on and, hence, provides the basis for a good international case study for addressing this question. We firstly assess the evidence for changes in the well-gauged post-1960 period before considering centennial-scale changes using published reconstructions. We then seek to provide a synthesis of the state of the art in our understanding of the drivers of change, both climatic and in terms of direct human disturbances to river catchments (e.g. changing patterns of water withdrawals, impoundments, land use changes). These latter impacts confound the identification of climate-driven changes, and yet, human influences are themselves being increasingly recognised as potential agents of changing drought regimes. We find little evidence of compelling changes towards worsening drought, apparently at odds with climate projections for the relatively near future and with widely held assumptions regarding the role of human disturbances in intensifying droughts. Scientifically, this is perhaps unsurprising (given uncertainties in future projections; the challenge of identifying signals in short, noisy records; and a lack of datasets to quantify human impacts), but it presents challenges to water managers and policymakers. We dissect some of the reasons for this apparent discrepancy and set out recommendations for guiding research and policy alike. While our focus is the UK, we envisage that the themes within this study will resonate with the international community, and we conclude with ways in which our findings are relevant more broadly, as well as how the UK can learn from the global community.
- Article
(7614 KB) - Full-text XML
-
Supplement
(1397 KB) - BibTeX
- EndNote


Throughout much of 2022, the UK experienced one of the most severe droughts in recent decades (Barker et al., 2024). This episode followed a major drought in 2018–2019 (Turner et al., 2021), and this succession of events has naturally led to claims that such droughts are a manifestation of human-induced global warming and that droughts have become more severe over time (e.g. Rivers Trust, 2023). Such claims are entirely reasonable in that climate projections suggest that droughts will become more severe in a warming world (e.g. in the latest eFLaG projections; Parry et al., 2024; for a more general summary, see the review of Lane and Kay, 2023). These recent droughts have demonstrated the continuing vulnerability of the UK to drought and underlined the need to understand whether and how drought risk is changing and how it is likely to evolve in future.
A key aspect of understanding the changing risk of hydrological extremes is in characterising past variability in order to detect emerging trends and to provide a baseline against which future changes can be quantified. In the UK, as elsewhere, the scientific community has mobilised in response to this challenge, and there is a substantial body of literature aimed at quantifying the change and variability in hydrological characteristics over time. However, until recently, there has been no widely available synthesis of this material in relation to drought. In this extended review, we set out to capture the state of the art in the evidence for past variability in hydrological drought in the UK through a synthesis of the scientific literature complemented with additional new analyses to fill in several current gaps (the methodology for the extended analyses is provided in the Appendix to this paper). This extended review is based on an earlier review conducted for the Environment Agency (Hannaford et al., 2023), compiled as part of a set of essays on the state of our knowledge on drought in the UK: Review of the research and scientific understanding of drought: summary report – GOV.UK (http://www.gov.uk, last access: 18 August 2018). We also refer to several other companion essays from this collection throughout this paper.
What do we mean by hydrological drought? Drought is widely written about as a complex, multi-faceted phenomenon that defies straightforward definition. Since the study of Wilhite and Glantz (1985), drought has commonly been categorised into various types, often differentiating between meteorological, hydrological and agricultural droughts, alongside various others. This review focuses on hydrological drought (e.g. van Loon, 2015). More specifically, this review considers only river flow drought and does not cover groundwater, lakes, reservoirs and so on. However, for convenience and brevity, we use the term hydrological drought throughout.
The focus of our review is on investigating variability in river flow characteristics relevant for drought (e.g. seasonal river flows, low flows), as well as indicators that are designed specifically to characterise drought. There is a substantial literature on the subject of drought indicators and drought indices (e.g. WMO and GWP, 2016; Bachmair et al., 2016). We review studies that use a range of drought indices that have been applied in the UK (e.g. the threshold level method, Rudd et al., 2017; the Standardised Streamflow Index (SSI), e.g. Barker et al., 2016), and we apply these indicators in the extended analysis presented here. For context, Fig. 1 illustrates how drought indicators can be used to identify discrete drought events and to quantify their characteristics (in terms of intensity, duration and accumulated deficit).
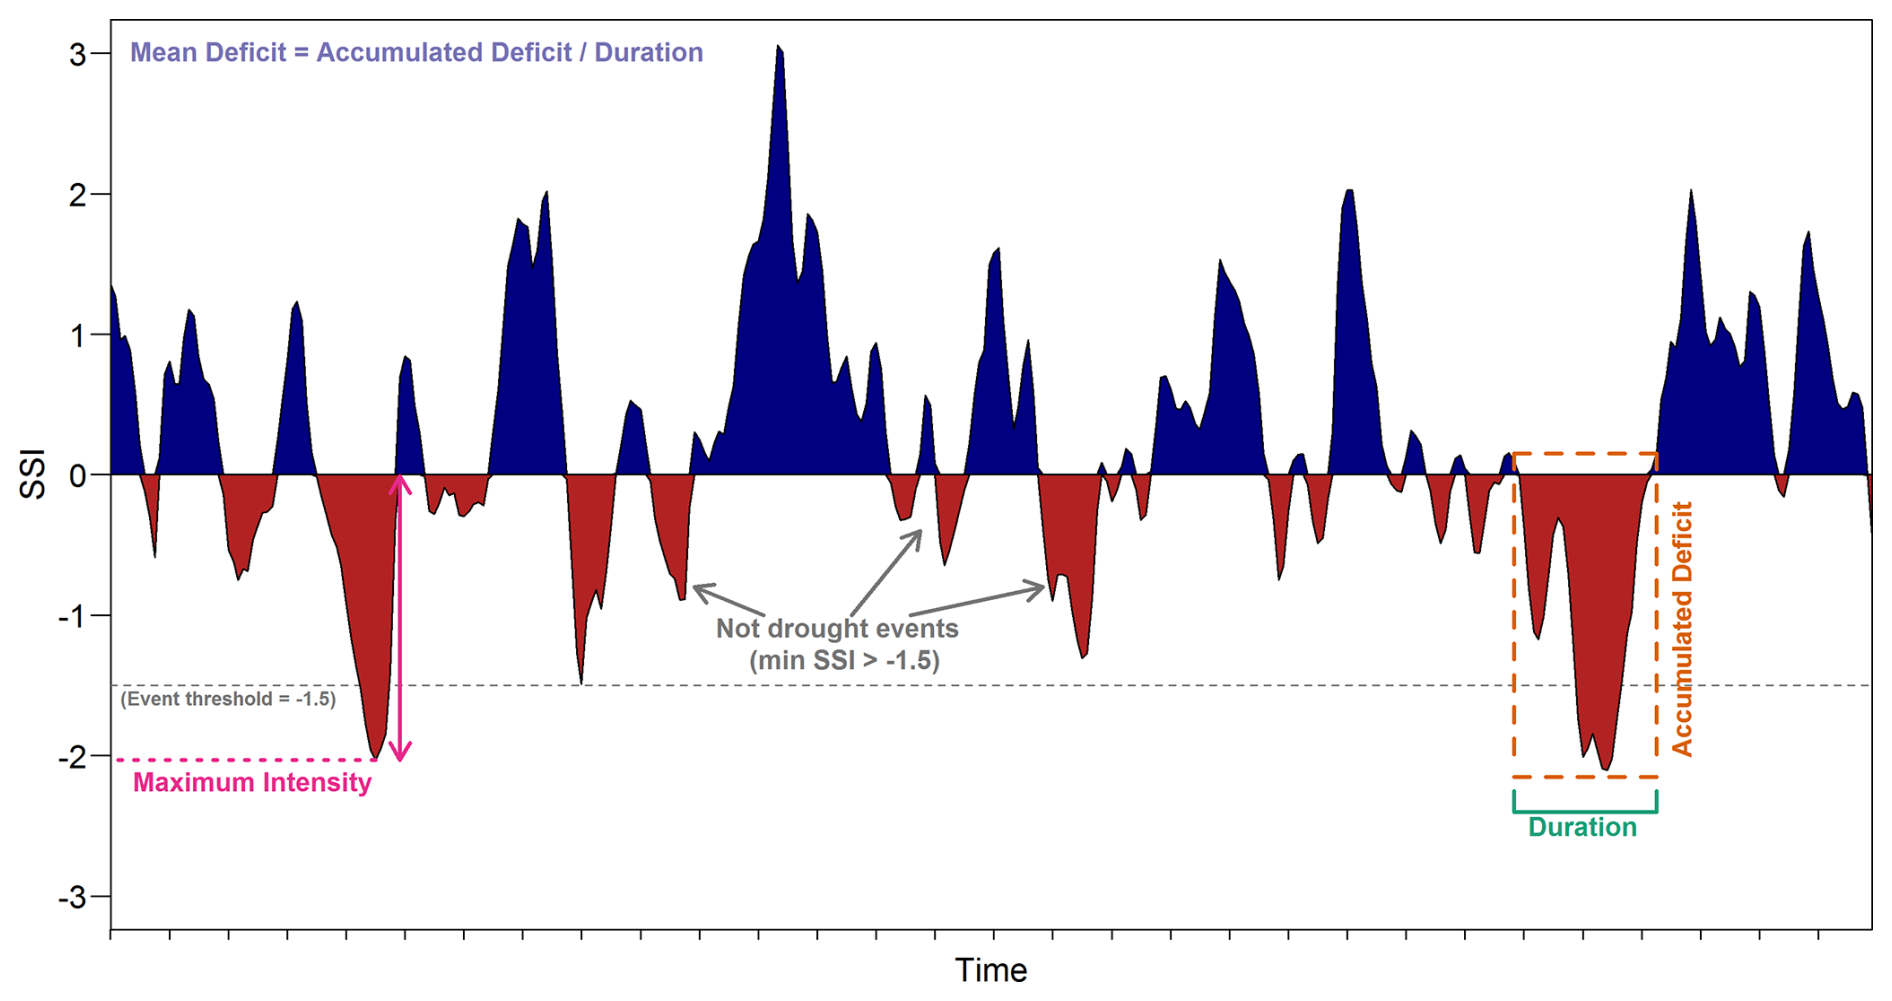
Figure 1Conceptual diagram showing drought event characteristics when applied to droughts extracted using a drought indicator (in this case, the Standardised Streamflow Index, SSI) applied to a river flow time series. The SSI is a monthly time series, and droughts are defined as all events when the SSI is consecutively negative, with at least 1 month reaching a particular threshold (in this case, −1.5). The characteristics of the drought are then based on the start (from when the SSI goes below zero) and end (when it returns to be above zero).
Why are we interested in river flows? The simple answer is that river flows are one of the primary ways in which climate extremes (like droughts) have an impact on society and the environment and through which climate change is likely to bring about some of its most catastrophic consequences. Adequate river flows (of acceptable quantity and quality) are of fundamental importance in public water supply; abstractions for industry, energy and agriculture; hydropower generation; and a host of other purposes, including navigation and recreation. Moreover, river flows are vital for maintaining healthy aquatic ecosystems and the many ecosystem services they support. Shortfalls in river flows during hydrological droughts can have impacts on many economic sectors and cause increased competition between them, as well as between human demands and the environment – with subsequent impacts on water, food and energy security in the long term.
Additionally, river flows integrate across a range of processes occurring in a catchment. While many meteorological measurements (notably, rain gauges) sample only points in space, river flows represent the combined balance of hydrological fluxes across large areas of the upstream land surface. River flows are, therefore, a key broad-scale indicator of water availability, and long-term measurements of river flow enable us to track hydro-climatic variability on a range of timescales. Nevertheless, due to the complicated processes and timescales of drought propagation, from meteorological deficits to hydrological drought (van Loon et al., 2015; or Barker et al., 2016, for UK-specific context), it is necessary to quantify trends in river flows in themselves rather than to infer hydrological drought from precipitation or other climate variables.
Why is this review needed now? This review is timely given the growing recognition of drought as an important hazard in the UK. While the UK is often thought of as a wet country, droughts are a recurrent feature (as in all climate zones), and, moreover, some parts of southern and eastern England are dry even by comparison with much of Europe (with many areas of eastern England receiving less than 700 mm annually, for example; Met Office, 2025). These areas are already water stressed given significant socioeconomic demands (e.g. Folland et al., 2015), and, in recent years, there has been growing concern about a future “jaws of death” situation (Bevan, 2022), where demand outstrips supply. Such fears have prompted major changes in water resource management, with water suppliers being challenged to ensure resilience in relation to very extreme (1:200, 1:500 year) droughts, which has necessitated significant innovations in planning techniques, alongside a growing trend towards regional- and national-scale rather than local-scale drought and water resource planning (Counsell and Durant, 2023). Among the many challenges of assessing resilience to such rare extremes, the matter of non-stationarity of hydro-climate variables like precipitation and river flows is an especially vexing one.
What is the wider international significance? While this review is focused on the UK, many of the issues covered are of international import and will resonate in other hydro-climatic settings and governance frameworks. As this review will demonstrate, there is a very dense body of literature on hydrological variability in the UK, and it provides an important example for appraising changing drought risk in a temperate setting where drought has historically been seen as a relatively modest threat in comparison to floods (e.g. Bryan et al., 2019; McEwen et al., 2021). We anticipate that an accessible extended review will be of value for international comparisons and policymaking syntheses. Despite countless publications on trends in drought or water resource variables, the evidence for consistent trends in hydrological drought in international syntheses (including successive IPCC Reports) is comparatively weak compared to that for other climate variables, largely due to deficiencies in available datasets (e.g. IPCC, 2023; see also the review of Vicente-Serrano et al., 2022). The present review seeks to set out a comprehensive statement regarding evidence in a data- and research-rich environment. We cannot possibly provide a comprehensive review of the international literature on hydrological drought trends, but, in this discussion, we consider where our findings resonate with international studies and also what the UK can learn from the international arena.
The review is structured as follows. First, we review the position of our knowledge of how droughts have changed by considering past trends and variability in various river flow indicators relevant to water resources and drought (Sect. 2). This focuses on the last 5 decades, the period containing most UK river flow observations. We then take a longer view, looking at river flow reconstructions over many decades, back to the late 19th century (Sect. 3). Importantly, we will also consider the mechanisms (or drivers) behind variability in river flow drought. We address climatic drivers (Sect. 4) and catchment drivers (Sect. 5), with the latter encompassing changes in direct human interventions: abstractions, discharges, reservoir management, land cover changes and so on. We finish in Sect. 6 with a synthesis and recommendations, with consideration of the international context throughout.
In addressing the literature on past changes in drought, it is first important to highlight the very rich information base on which assessments of past changes in hydrological drought are based. The UK has a very dense hydrometric network in international terms and is fortunate to have a centralised archive of accessible, quality-controlled hydrological data, the National River Flow Archive (NRFA; Dixon et al., 2013, https://nrfa.ceh.ac.uk, last access: 18 August 2025). This resource is the primary basis of most of the studies that have looked at past hydrological variability highlighted in this section.
That said, there are inherent challenges in analysing long-term variability in river flows – as described in Hannaford (2015), Wilby et al. (2017) and Slater et al. (2021). In particular, hydrological records are often impacted by anthropogenic disturbances and constraints of poor data quality – particularly for extreme low flows, which are inherently challenging to monitor. This is especially important if trying to discern climate-driven changes in river flow. In catchments with strong (or changing) levels of human disturbance, trends and variations may not reflect climate variability. To this end, many countries have declared “Reference Hydrometric Networks” (RHNs) of near-natural catchments (Burn et al., 2012). The UK was an early leader in this area, with the designation of the UK Benchmark Network (Bradford and Marsh, 2003; updated to the UKBN2 by Harrigan et al., 2018). In the following sections, we contrast between some studies that use the Benchmark Network and those that apply to a wider range of observations from the NRFA.
A good starting point for any assessment of changing hydrological droughts is a series of previous report card reviews that addressed evidence for changes in river flows more generally (Hannaford et al., 2013; Hannaford, 2015; Watts et al., 2015; see also update by Garner at el., 2017). These reviewed evidence for observed changes in river flow across the UK (including both droughts and floods). These reviews summarised many studies that analysed changes in variables such as annual flows, seasonal flows and low flows, with a very mixed picture emerging as far as water resources and drought are concerned – at least compared to high flows or floods, for which a more consistent picture emerged. Many studies are now quite old and covered data periods ending in the 2010s. In general, there was limited evidence for any clear trend in annual low flows (e.g. Hannaford et al., 2006, based on data up to 2002). Low-flow magnitude had typically increased (put another way, this indicates less severe low river flows or droughts), particularly in the north and west. Seasonal flows showed increases in winter and autumn, decreases in spring, and a very mixed picture in summer (e.g. Hannaford and Buys, 2012, based on data up to 2008). The report cards showed that there was little published evidence based around changes in drought per se, using drought indices like threshold methods or standardised indicators, as opposed to general flow regime indicators.
Since the publication of the report cards, there have been few additions to the literature on drought and/or water resource trends. Harrigan et al. (2018) updated the UK Benchmark Network and undertook an analysis of seasonal trends and low flows up to 2016 and found a very similar picture to previous assessments. Both median (Q50) and low (Q95) flows showed increases in northern and western areas, but these were rarely significant; decreases were observed across much of England, but these were typically non-significant, and there was substantial regional variation. Seasonal flows were consistent with past studies.
While there has been a recent update of flood trends (Hannaford et al., 2021), there has been no published update of low flows or drought trends in parallel. For the purposes of this extended review, we have undertaken a preliminary update of trends in low flows and seasonal flows, comparable with Harrigan et al. (2018) but updated to September 2022 (the latest available data from the NRFA). This was done using the same methodology outlined in Harrigan et al. (2018) and Hannaford et al. (2021) – see Appendix A. As with Hannaford et al. (2021), we have deliberately compared the UK Benchmark Network (UKBN2) with the wider whole NRFA network. The time series end in September 2022 with the latest quality-controlled NRFA data and therefore do include the bulk and, for most areas, the “peak” of the 2022 drought (Barker et al., 2024), despite this continuing into October and beyond in some areas. While ending in a drought year could affect trends, a previous version of this analysis excluding 2022 shows similar patterns (Hannaford et al., 2023).
For all of the low-flow indicators (Fig. 2, Tables S1 and S3 in the Supplement), the same general pattern of increasing flows in northern and western Britain emerges, with a mixed pattern in the English lowlands. However, for the UKBN2, there is a more recognisable tendency towards downward trends. For Q50 and Q70, there are few significant downward trends, but more of the trends in northern Britain are increasing. For Q95, there are some significant downward trends. Seasonal patterns (Fig. 3, Tables S2 and S3) are similar to previous studies – generally, consistent increases in autumn and winter, decreases in spring, and a contrast for summer between increases in the north and west and a mixed pattern but with some significant decreases in the south. For spring and summer, the patterns are similar between the full network and UKBN2 sites, with spring showing decreases across the UK and summer showing increases in the north and west and decreases in the south and east. For autumn and winter, patterns in the UKBN2 are more mixed, with both increases and decreases in England, although relatively few are significant; in Scotland, however, all of the UKBN2 sites show increases.
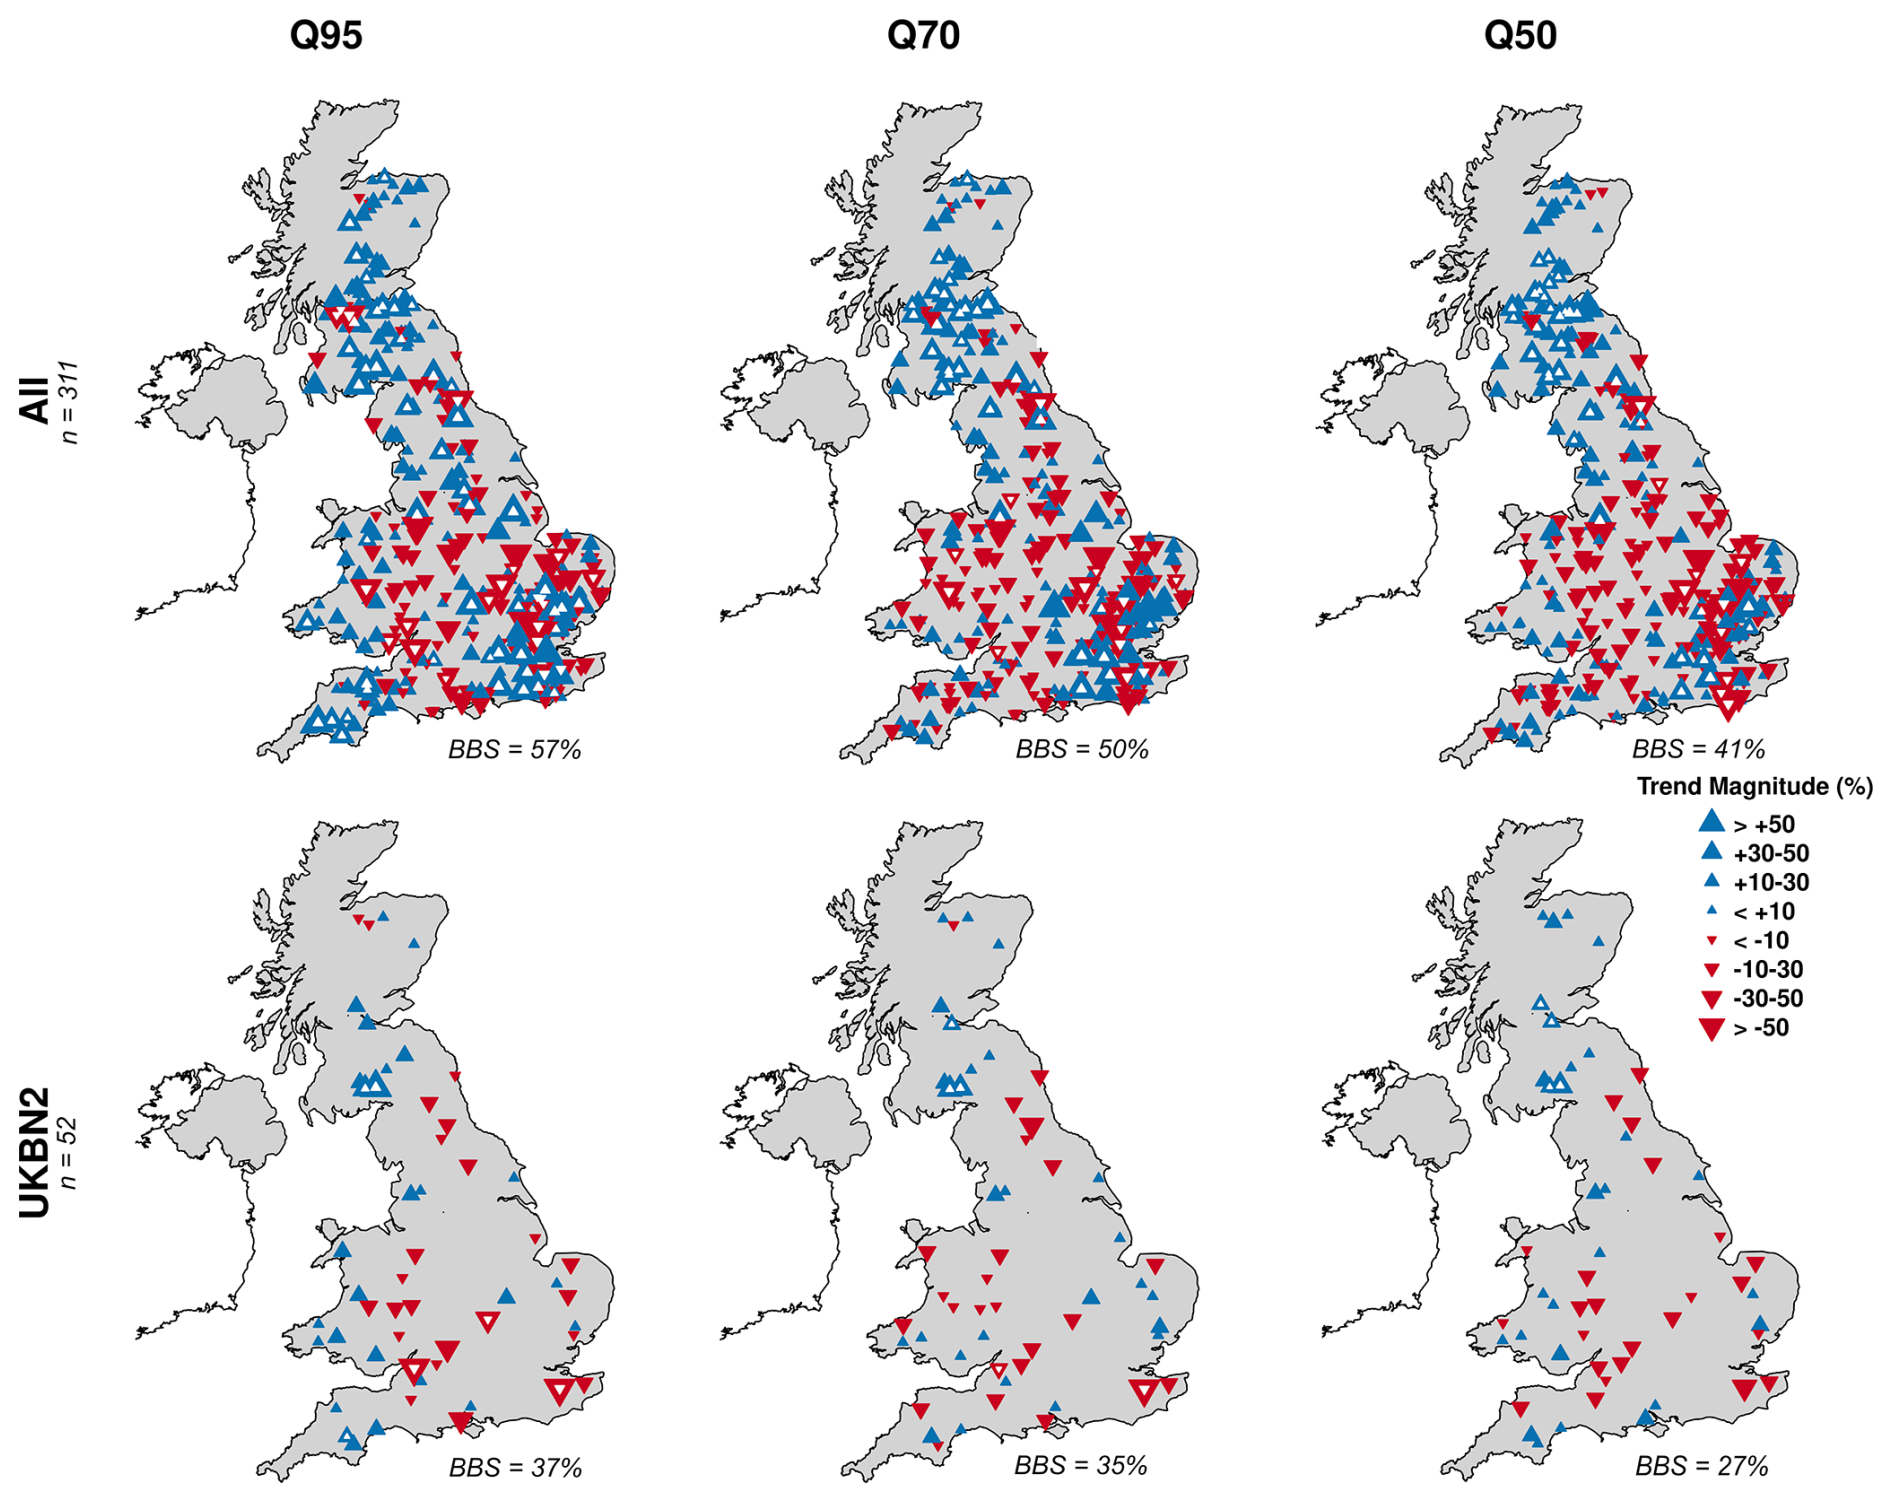
Figure 2Trend analysis of river flow indicators relevant for water resources and/or drought (Q95, Q70, and Q50) for the period 1965–2022. The top row shows all NRFA catchments with available data (over this period). The bottom row shows the UKBN2 catchments suitable for low-flow analysis. Trend magnitude is shown according to the key as a percentage change. White colouration of triangles denotes a significant trend using the Mann–Kendall test (5 % level), accounting for serial correlation where present. These are based on current NRFA data (relating to end of water year 2021–2022). The label n denotes the number of catchments, and BBS denotes the percentage for which a block bootstrap was used to account for serial correlation (see Sect. A1 in the Appendix).
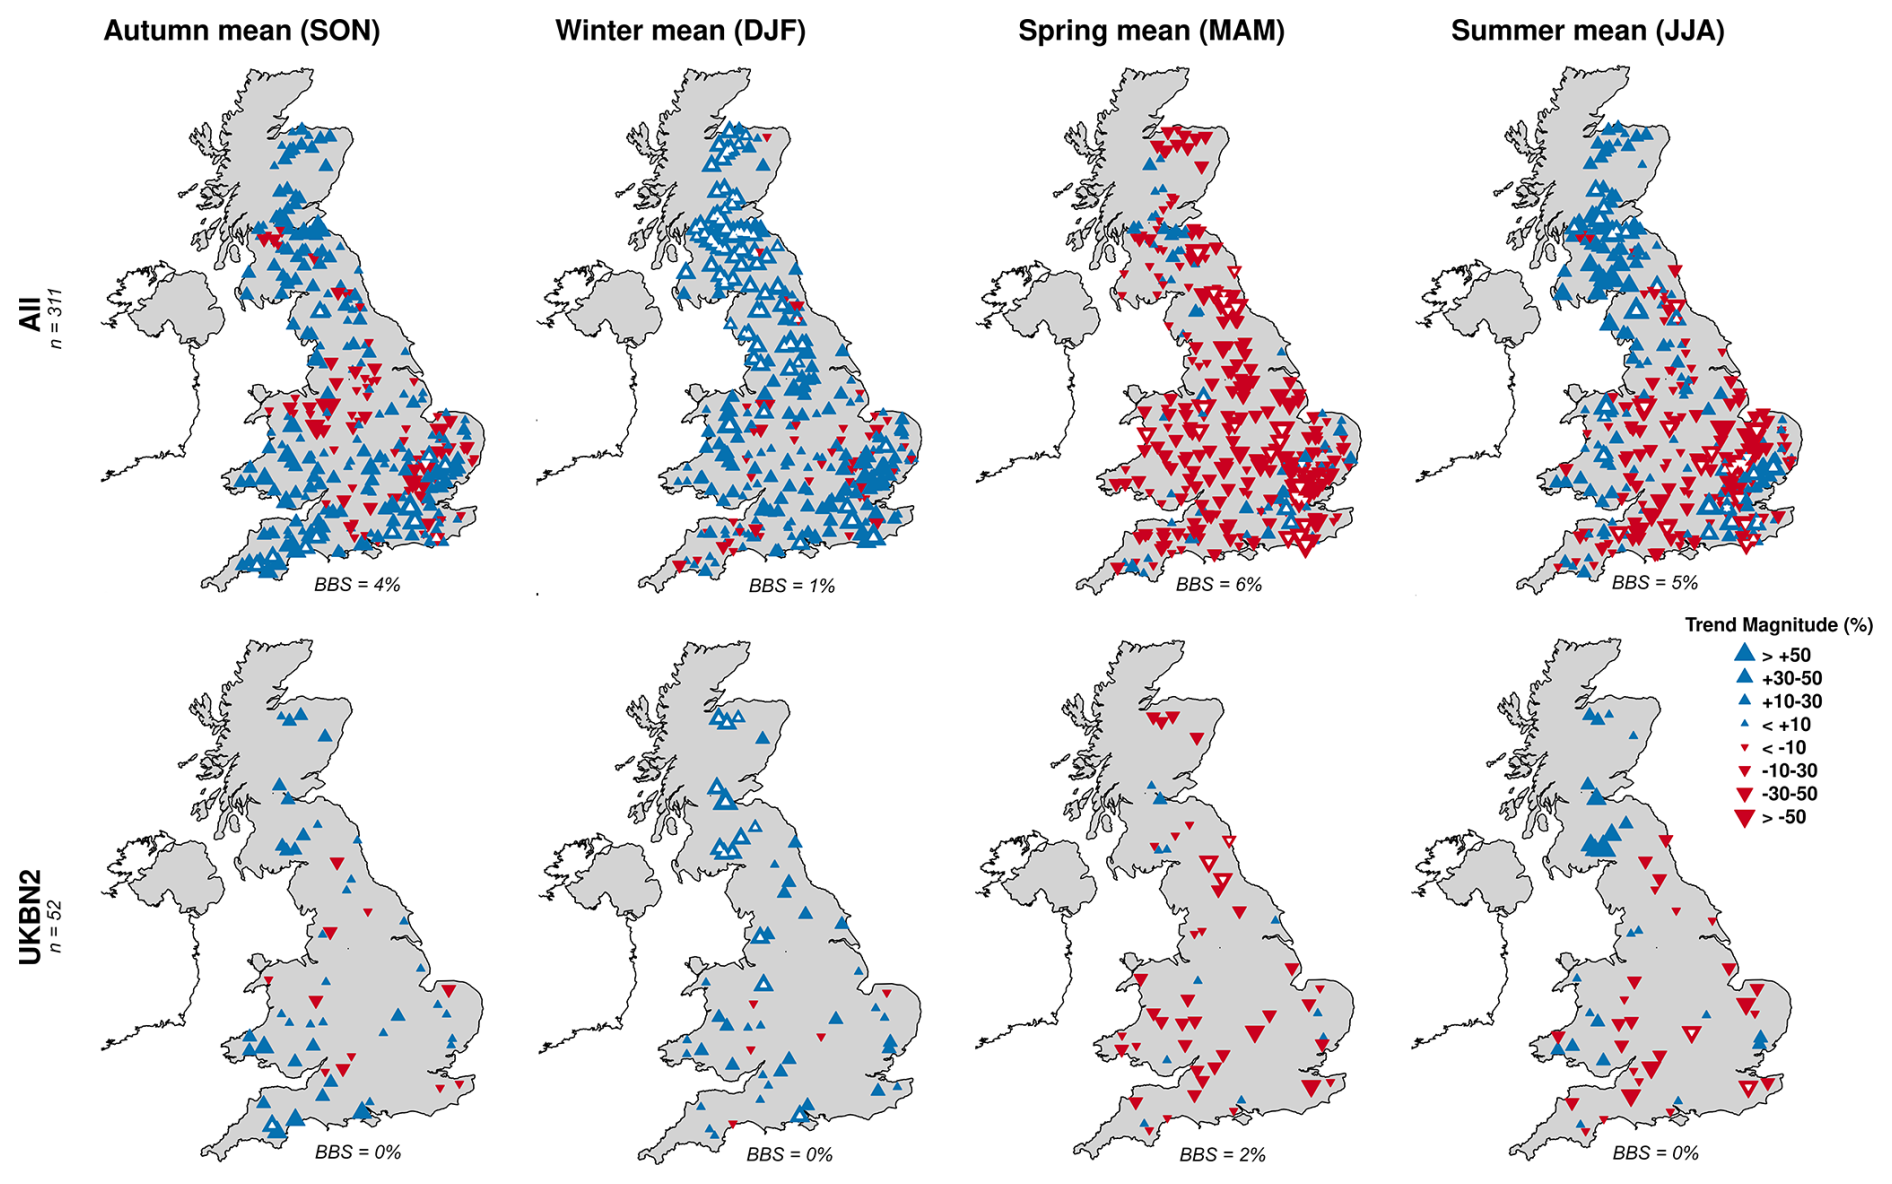
Figure 3Trend analysis of seasonal mean river flows for the period 1965–2022 (see the Fig. 2 caption for further explanation).
It should of course be noted that past studies and the new analysis presented above are of broad indicators of “drought-relevant” seasonal and low flows rather than analyses of droughts per se, using the kind of indicators highlighted in the Introduction. Such studies have not previously been published in detail at the UK scale, although Peña-Angulo et al. (2022) analysed hydrological drought trends between 1962 and 2017 using the SSI at a European scale and included 474 UK catchments in their study, embracing a range of both natural and influenced catchments. They found largely negative trends in drought frequency, duration and severity (i.e. towards fewer, shorter and less severe droughts) for the UK, albeit also with very mixed patterns. Significant trends towards an amelioration of drought severity were more prevalent in northern and western catchments.
Here, we have conducted a similar analysis for the UKBN2 (using those catchments suitable for low flows based on the Low-Flow Benchmark Network, LFBN; Harrigan et al., 2018) using droughts extracted using drought indicators (Fig. 4, Table S4). We show results for a 3-month accumulation of the SSI (SSI-3). Very similar results to those of Peña-Angulo et al. (2022) are found, with trends towards decreasing drought severity in the north and west and a mixed pattern in the southeast, although with some spatially coherent (but rarely statistically significant) trends towards worsening drought.
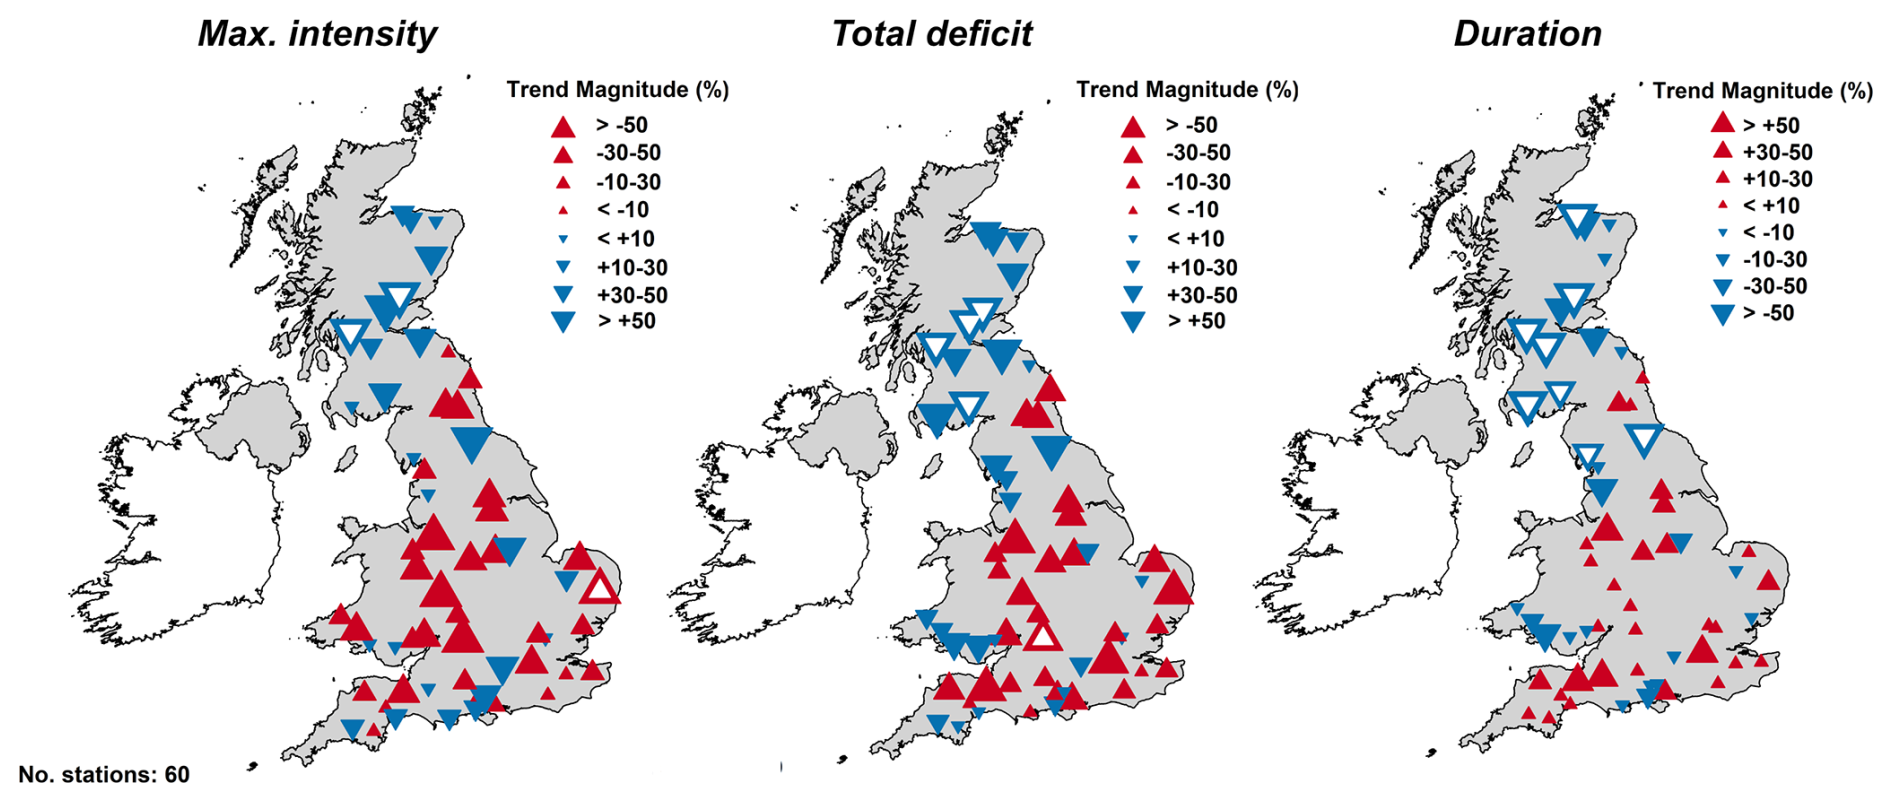
Figure 4Trend analysis of extracted hydrological drought characteristics using the 3-month Standardised Streamflow Index (SSI-3) for the Low-Flow Benchmark Network (LFBN) for the period of 1965–2021 (see Fig. 2 caption for further explanation). Note the different scales used for each: for intensity and deficit, positive trends mean decreasing drought, whereas, for duration, positive trends mean increasing severity. Hence, for ease of interpretation, in all cases, red signifies worsening drought, and blue signifies the amelioration of drought.
It is important to underscore that observed trends are very sensitive to the period of analysis. The new results presented here in Figs. 2–4 and Tables S1–S4, alongside those of previous studies, typically analyse linear, monotonic trends in a fixed period. Other studies adopted a “multi-temporal analysis” to look at the sensitivity of trends to start and end points and found that varying the start or end by even a few years can radically change the outcomes, with changes in significance and even in the direction of change. Hannaford et al. (2021) demonstrate this for flood trends for the UK, but a similar comprehensive analysis of sensitivity to low-flow or drought trends is lacking in the published literature. Wilby (2006) and Hannaford and Buys (2012) showed how varying start years influenced annual, seasonal and low-flow trends. In general, trends over the typical “observational” period (post-1960s) are often somewhat different to those seen in longer hydrological records. The increases in summer and low flows seen in many published studies partly reflect the fact that the late 1960s to mid-1970s were notably dry and that the late 1990s to the late 2000s were generally much wetter. Murphy et al. (2013) highlight how positive trends are consequently “locked in” by the coverage of typical gauged records in Ireland, and the UK picture is very similar. This underscores the importance of taking a longer view than the typical gauging station record length, as discussed in Sect. 3, where we extend the window of analysis and examine multi-temporal trends in drought.
Recent droughts have inevitably invited comparisons with past drought events (e.g. Turner et al., 2021; Barker et al., 2024), and these have shown that 2022 and 2018 droughts rank among some of the most significant hydrological droughts of the last 50 years in terms of low flows. Previous drought events of the 2000s and 1990s were also extensively documented at the time (e.g. 2010–2012, Kendon et al., 2013; 2004–2006, Marsh et al., 2007), and, again, these events were found to be significant in the context of the typical gauged record – that is, from the 1960s–1970s, when the majority of UK gauging stations were installed.
Despite the half-century coverage of many gauging stations, which is impressive in an international context, the “instrumental” record only contains a handful of major drought events. To appraise drought risk more fully, many authors have highlighted the need to examine droughts over much longer timescales. This is important for water resource management, particularly in the context of the deep uncertainty regarding future climate projections. While the past may not so readily be a guide to the future in a warming world, at the same time, observed historical droughts represent an important benchmark of drought risk, given that these events have actually unfolded – they also offer the opportunity to learn from past experiences in drought management. Historical droughts have, therefore, always formed a cornerstone of water resource planning. While recent developments have moved away from a single “drought of record”, i.e. the worst drought used as a stress test, to considering droughts more severe than the observed envelope (using stochastic methods and other approaches) (e.g. Counsell and Durant, 2023), these methods are ultimately still dependent on past observations. A fuller understanding of historical hydrological droughts is therefore of critical importance to practitioners.
The influential study of Marsh et al. (2007) identified major droughts in England and Wales back to 1800. This study highlighted the prevalence of major drought events in the pre-1960 era and underlined the importance of events such as those of the 1920s and 1930s and the “long-drought” period covering the turn of the 20th century, as well as some droughts in the 1800s which are relatively poorly understood. Marsh et al. (2007) considered drought primarily from a meteorological perspective, given the abundance of long rainfall records, although these authors did gather hydrological evidence, where available, and, moreover, documented evidence of the impact of past drought episodes. From a hydrological viewpoint, such comparisons are challenging given that very few gauging stations captured the droughts of the 1920s–1940s or earlier.
To fill this gap, there have been several efforts to extend hydrological records through reconstruction, primarily using rainfall–runoff models to estimate past river flows given the long meteorological records available as input. The earliest work of Jones (1984) was updated by Jones and Lister. (1998) and Jones et al. (2006) and delivered monthly reconstructions (hereafter, Climatic Research Unit (CRU) reconstructions) back to 1860 for 15 catchments in England and Wales using a simple statistical water balance model driven by long rain gauge series. Jones and Lister. (1998) used a “Drought Severity Index” (DSI) to identify major droughts in these records and highlighted that in no cases were the contemporary droughts of the 1970s–1990s the most severe droughts in the longer-term records.
More recently, as part of the “Historic Droughts” project, Smith et al. (2019) delivered a dataset of reconstructed river flows for 303 UK catchments (Historic Droughts reconstructions) using the GR4J hydrological model, driven by a newly updated high-resolution daily gridded precipitation dataset and potential evaporation (PE) reconstructed from gridded temperature (using the approach of Tanguy et al., 2018). Barker et al. (2019) then used these reconstructions to conduct an analysis of historical hydrological droughts and their relative duration and severity using the SSI for 108 benchmark catchments (Figs. 5 and S2; locations of the relevant regions are shown in Fig. S1). In common with previous studies, these authors showed that, while recent droughts in the well-gauged era (post-1960) rank highly, there are many historical episodes that are longer or more severe than those of the recent past. A separate reconstruction was conducted for the “MaRIUS” project by Rudd et al. (2017) using a distributed model, Grid2Grid, also driven by gridded meteorological inputs and with droughts extracted using a fixed-threshold approach. Barker et al. (2019) and Rudd et al. (2017) found, unsurprisingly, good agreement with the droughts identified by Marsh et al. (2007). However, these studies highlight important departures, e.g. the importance of droughts in the 1940s, which are not well attested to in impact terms due to wartime reporting (Dayrell et al., 2022), and in the late 1960s and early 1970s, the impacts of which were eclipsed by the 1976 event. Importantly, both Rudd et al. (2017) and Barker et al. (2019) concluded that there were no obvious, discernible trends in hydrological drought (see Fig. 5) in these centennial-scale reconstructions. However, no formal trend tests were carried out.
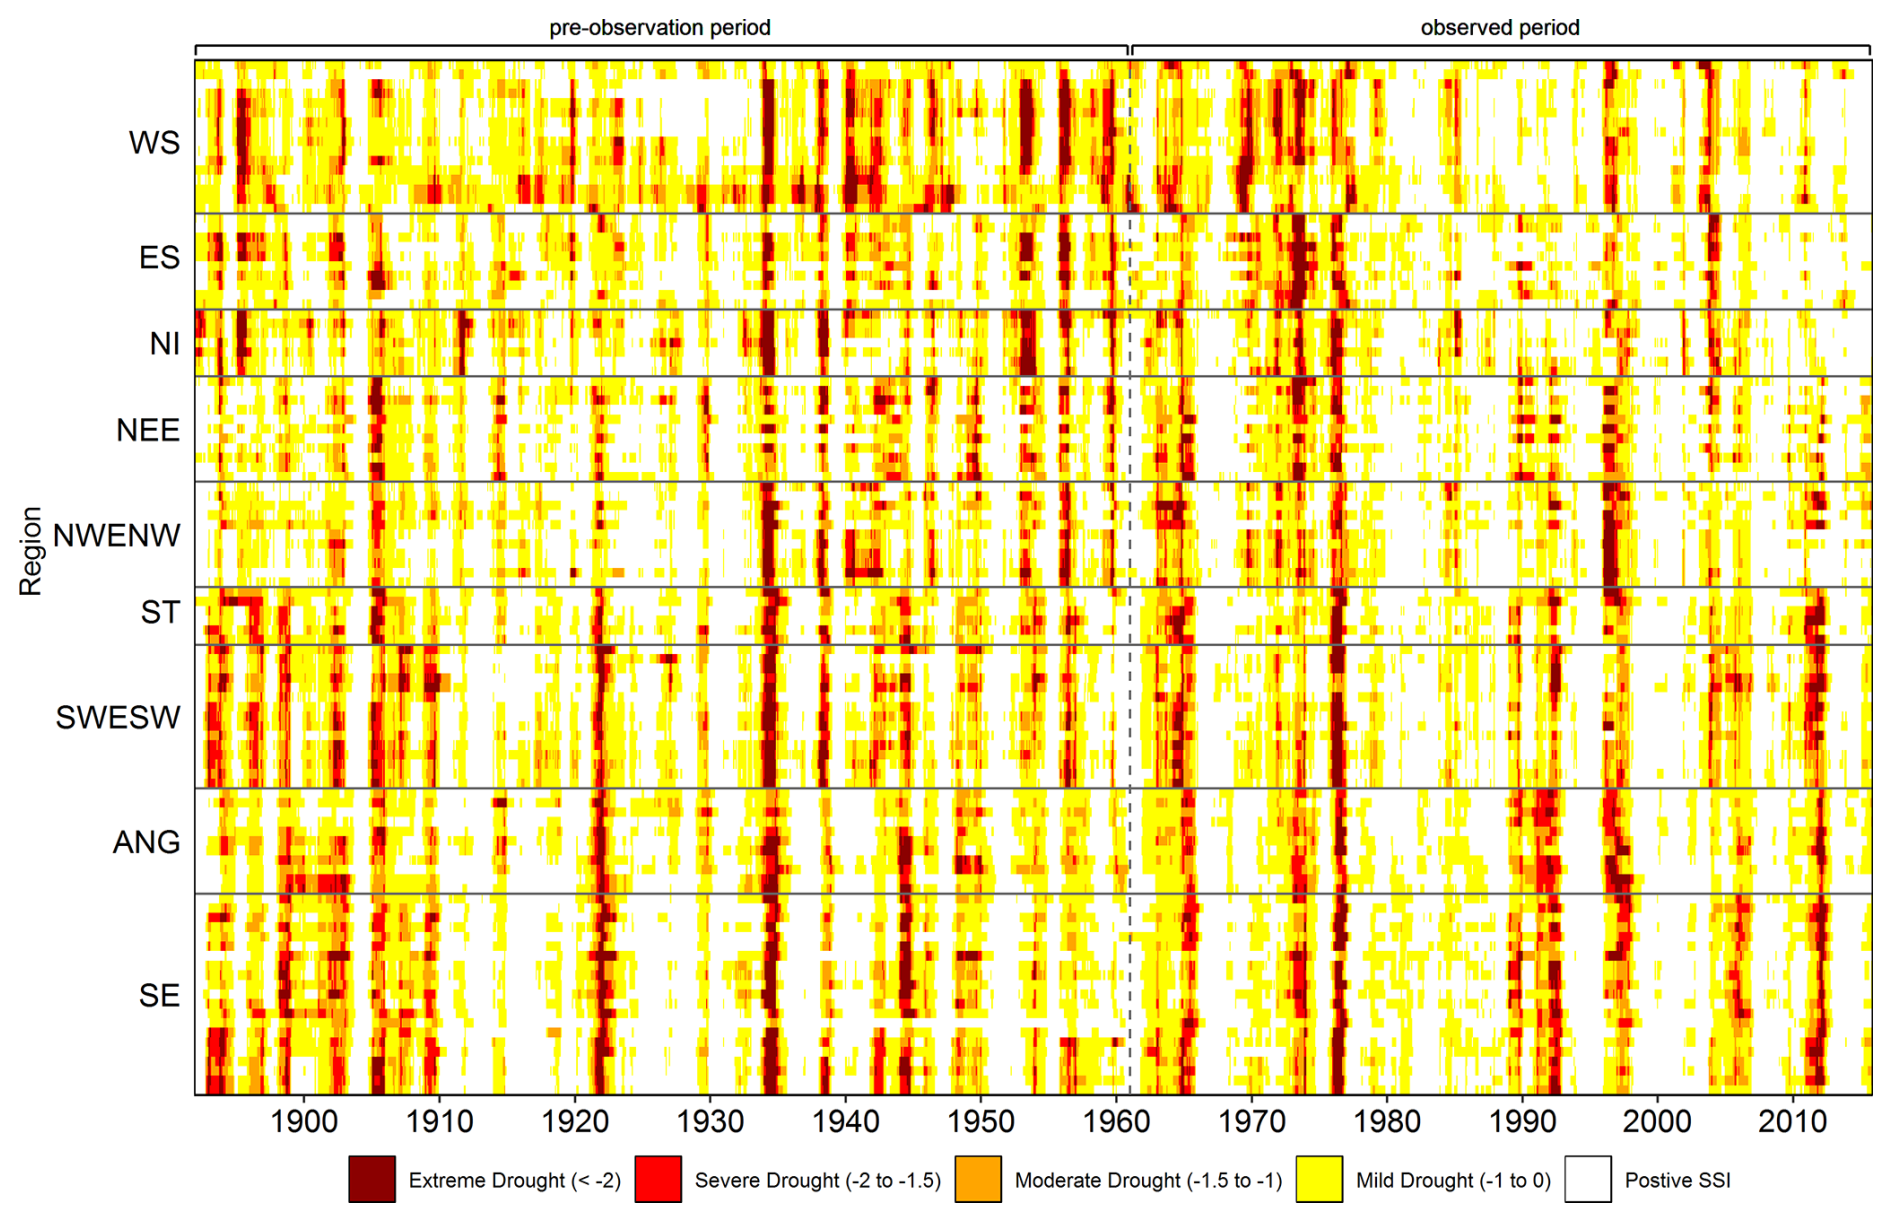
Figure 5Heatmap of 12-month Standardised Streamflow Index (SSI-12) for Low-Flow Benchmark Network (LFBN) catchments from 1891 to 2015 (catchments arranged roughly from north to south on the y axis, with one row per catchment and with hydro-climatic regions marked for clarity), with colours according to SSI-12 category, shown in the key. “Observed period” highlights the typical maximum record coverage of most gauging stations. “Pre-observation” denotes the period with the most added value from the reconstructions. Reproduced with permission from Barker et al. (2019). For equivalent results with the SSI-3, see Fig. S2.
Here, we augment previous work by examining drought trends using multi-temporal analyses (after Hannaford et al., 2013, 2021; see the Appendix) applied to the reconstructions of Barker et al. (2019) for a selection of catchments (the same nine appearing in that paper, with three extra added, giving a good geographical spread across the UK). The results (Figs. 6 and S3) show very strong sensitivity to the period of analysis. In the north and west (Cree, Allan Water, Ellen), there is generally a decreasing drought severity when analyses start from the mid-20th century and end in the present, whereas earlier start periods show trends towards increasing severity. Very few periods show statistical significance. In other parts of the country, there are more mixed variations. The Lud and Lambourn show a greater propensity towards increasing severity, with the Lud showing more recent start dates and the Lambourn showing the reverse. For the Lambourn, interestingly, positive trends emerge when analyses begin pre-1910 (the “long drought” was especially significant in groundwater catchments in the southeast). Overall, however, while interesting contrasts can be drawn, statistically significant trends are rare – these selected reconstructions confirm the assertion of Barker et al. (2019) that there is little evidence for consistent patterns towards worsening drought over the long term.
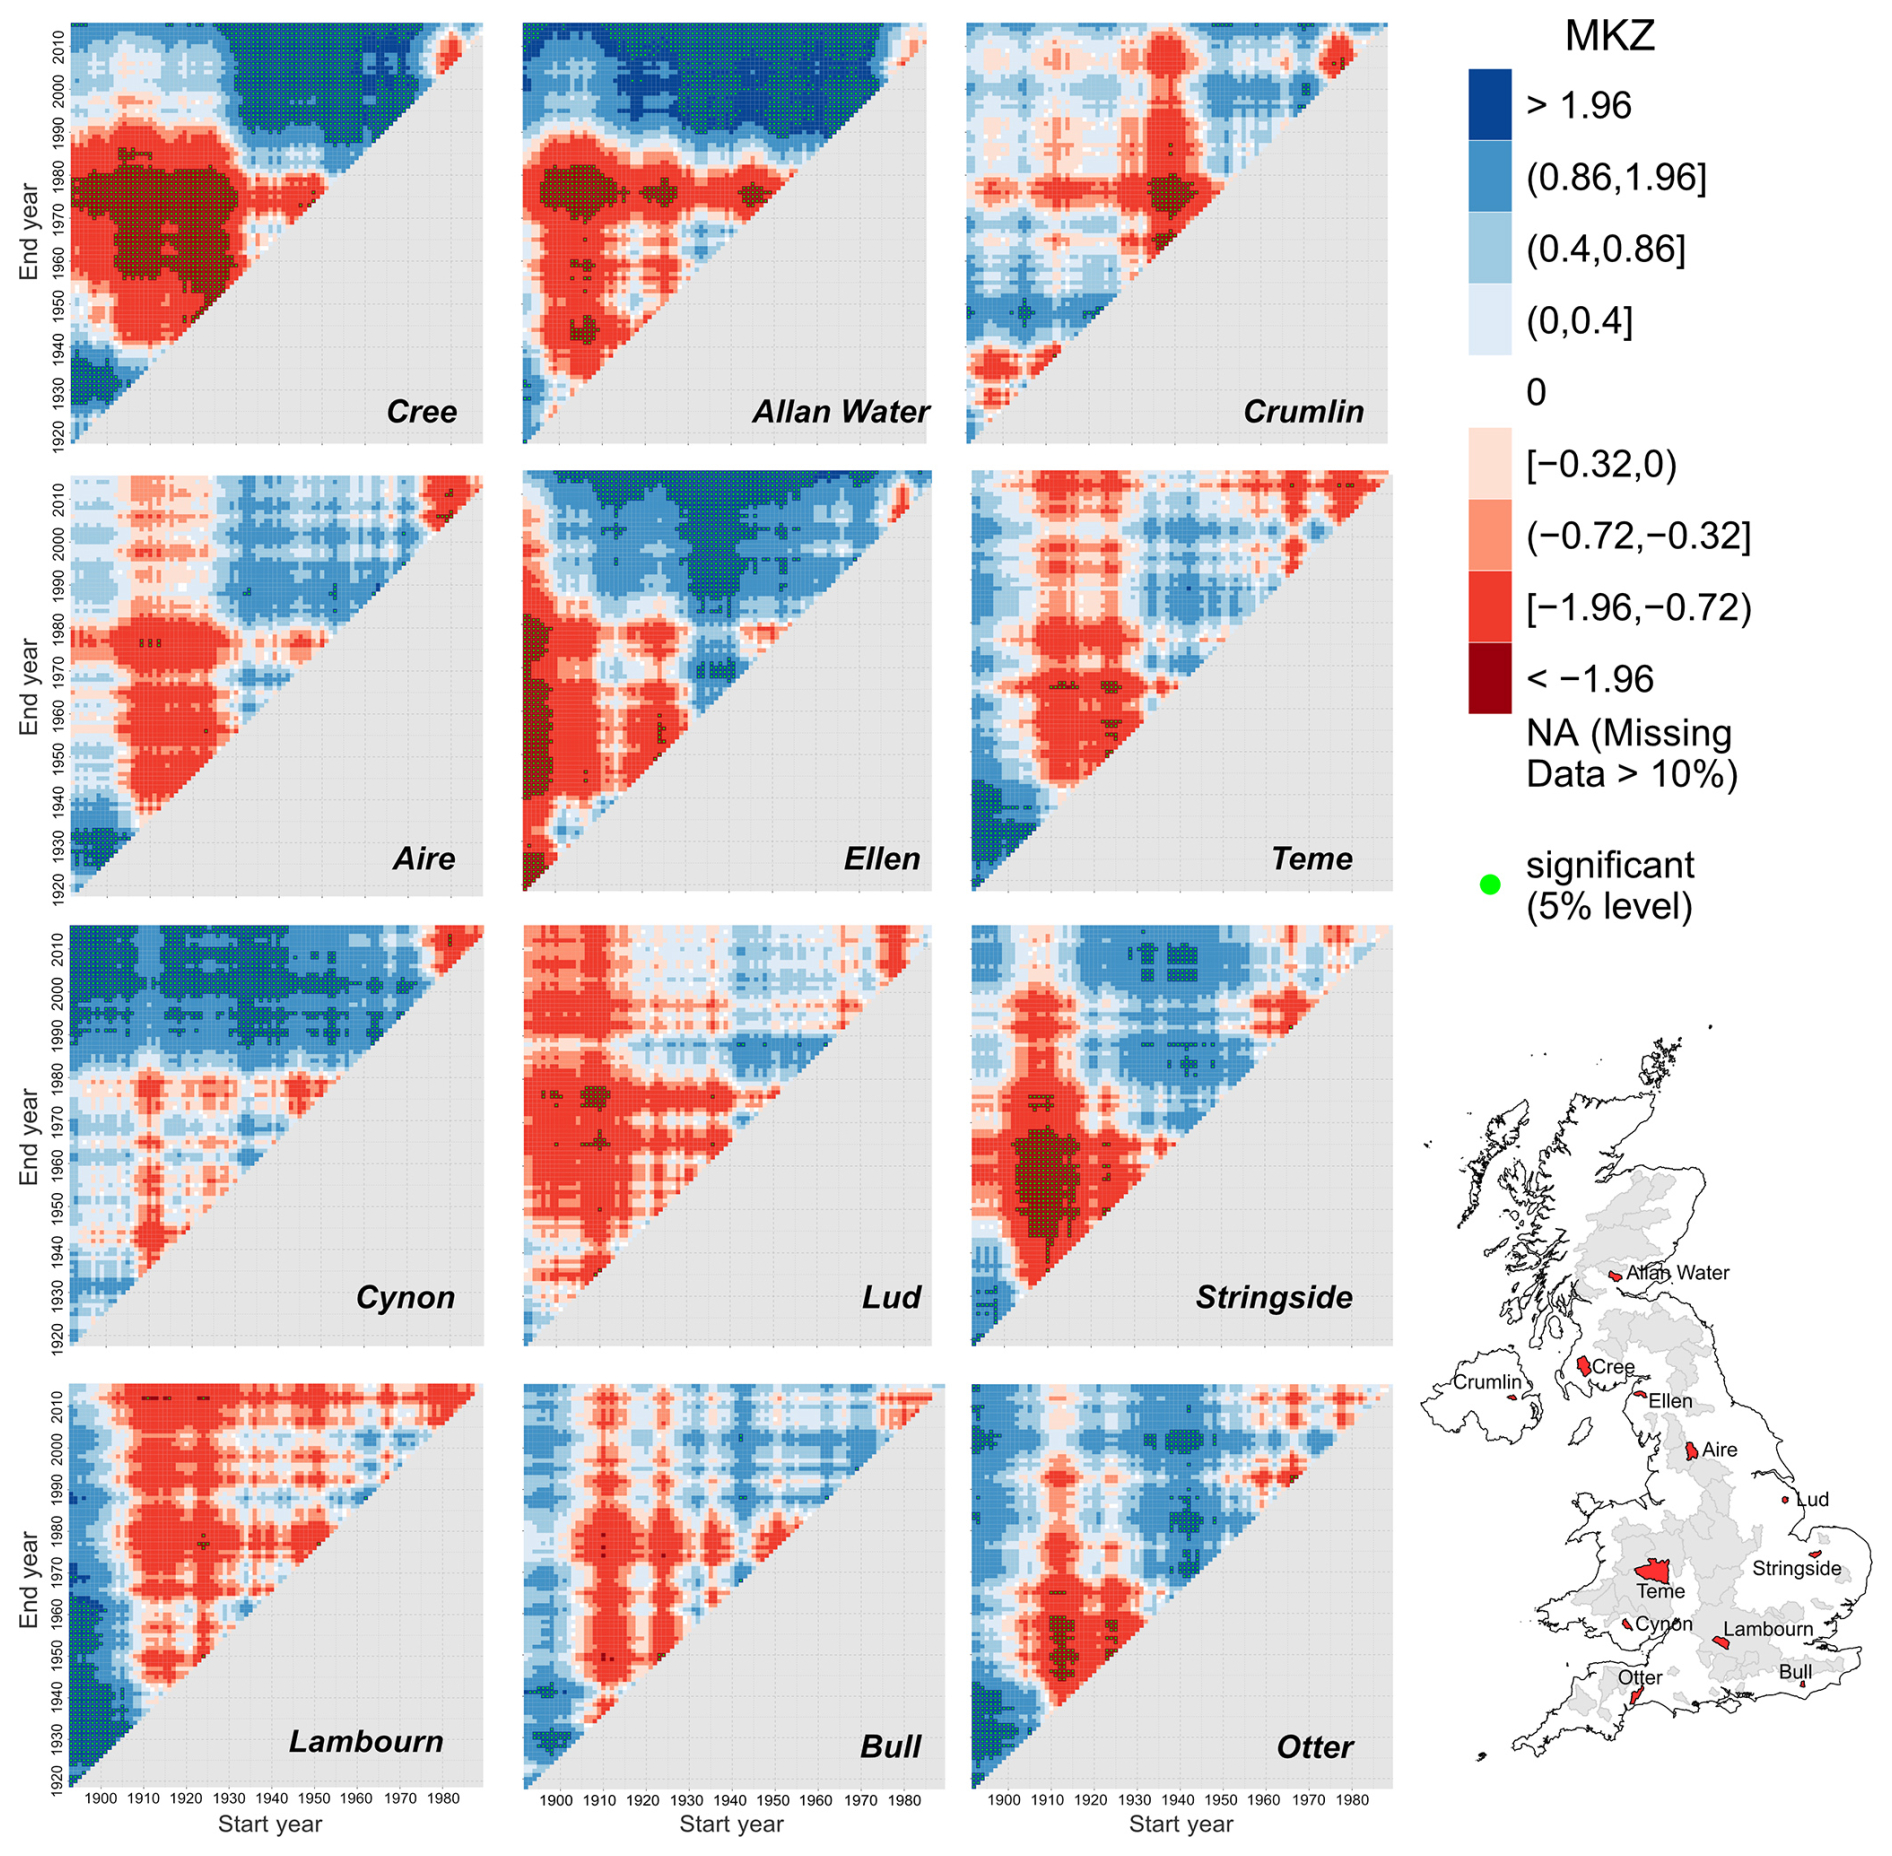
Figure 6Multi-temporal trend analysis applied to time series of accumulated drought deficits using the SSI-12 for nine selected long reconstructed records from Barker et al. (2019) and three additional catchments (Stringside, Bull and Otter). The colour ramp denotes values of the Mann–Kendall Z statistic (blue denotes positive, and red denotes negative), with green dots denoting significant cases. As with previous figures, blue shows ameliorating drought, while red shows worsening drought. For equivalent results for the SSI-3, see Fig. S3.
Following on from this theme of identifying “droughts of record” for water resource planning, several other noteworthy studies have reconstructed hydrological droughts on a regional basis and then fed these into water supply system models, e.g. for eastern England (Spraggs et al., 2015) and the Midlands (Lennard et al., 2015). Interestingly, in both cases, it was found that an extended reconstruction of droughts into the 19th century made little difference to water supply yields – that is, the additional 19th-century droughts did not test water supply systems more than those in the available long rainfall records (generally, back to the 1920s). However, these conclusions are regional and system-specific, and so further research is needed to see if the Historic Droughts/MaRIUS-reconstructed hydrological droughts make a significant difference in other parts of the country.
Trends and past variations in river flows such as those described in Sects. 2 and 3 can be driven by either climate or non-climate (catchment) factors. Some effort to isolate the climate-driven signal has been made through the identification of benchmark catchments. However, having established a “control” network for detecting climate-driven changes, the question remains regarding what mechanism is behind the observed river flow change. Most pertinently, the question is whether observed changes are attributable to anthropogenic warming or due to variability in the wide range of natural, internally forced modes of ocean–atmosphere variability. More realistically, given the extent to which these factors are intrinsically linked, the answer is “some combination of both”, and the question is whether the relative roles can be disentangled and quantified. This is not an abstract question as the time evolution of future trends will depend on the balance between “thermodynamic” anthropogenic warming, which is unidirectional for all intents and purposes, and circulation-driven changes, which could amplify, moderate or even counter such trends.
In this section, we briefly review the literature on the hydro-climatology of UK droughts, i.e. on climate–river flow associations, to understand what climate factors have been linked to variations in UK river flows. Knowledge of this topic is central to the climate detection and attribution debate and yet is also of practical importance for the development of monitoring and seasonal forecasting systems.
Firstly, we can compare river flow trends with published studies of basic meteorological variables relevant to the water balance (precipitation, evapotranspiration). River flow trends are consistent with observed climate trends – notably, significant trends towards wetter winters and, to a lesser extent, autumns and a pronounced spring drying in the recent past (Kendon et al., 2022). Other studies have also found significant increases in evapotranspiration in spring (Blyth et al., 2019) in addition to spring drying. Summers have, in general, become wetter over the same period as that featured in most river flow studies, but there has been a period of generally wetter summers since approximately 2007 and drier summers in the 20–30 years before that (Kendon et al., 2022). In general, though, river flow trends (Figs. 2–4), like meteorological analyses, show little compelling evidence (beyond a few catchments with significant downward trends) for any pronounced decreases in summer or for low river flows – i.e. the kind of water availability indicators most relevant for drought. This is somewhat at odds with future projections which consistently suggest substantial decreases in summer rainfall and river flow, annual low flows, and associated increases in drought severity (e.g. as summarised in Lane and Kay, 2023) for the relatively near future. We return to this in our discussion below.
Next, we consider the most extensively studied climate–hydrology associations – those connections, or teleconnections, between river flows and larger-scale, lower-frequency modes of variability – and atmospheric circulation indices such as the North Atlantic Oscillation (NAO). The NAO is the leading mode of variability in the Euro-Atlantic sector and, as such, is an obvious candidate for linking with river flows. The NAO, through its strong control of the location of the storm track and, thus, moisture delivery to the British Isles, has long been shown to strongly influence UK rainfall, especially in the winter months, and it follows that river flow patterns can also be linked to NAO variability. There is a large body of literature on this topic, which we will not cover comprehensively here beyond key exemplar studies, which are cited below. This literature is consistent in showing very similar patterns, namely a strong positive association between the NAO Index (NAOI) and river flow in the winter months, especially in the northern and western areas (e.g. Laize and Hannah, 2010; West et al., 2022a, b). However, relationships are complex, especially in non-winter months and especially in the lowlands of southern and eastern England, where the effect of the NAO is modest and, again, strongly catchment-controlled (e.g. Laize and Hannah, 2010; West et al., 2022b). The NAO is not the only relevant pattern, and other studies have shown a prominent role of other modes of variability (notably the East Atlantic (EA) pattern and the Scandinavia pattern (SCA), e.g. Hannaford et al., 2011; West et al., 2022a). West et al. (2022a) linked the NAO and EA patterns to the SPI and SSI and highlighted the interaction of these modes of variability throughout the year and noted how their relative role varies around the country, as well as seasonally, along with the role of propagation from the SPI to SSI. While the NAO dominates in winter in the north and west, it has far less explanatory power in the south and east in summer, when the EA plays a key role in modulating the NAO influence.
The upshot of the strong control of the NAO, EA and other modes of variability is that the time evolution of river flows – and of drought indicators, to an extent – can be seen to be controlled by the variability and interplay of these patterns. The NAO has been associated with trends towards wetter winters (and higher river flows) in the northern and western UK (e.g. Hannaford et al., 2015, and references therein) over the 1960s to the late 1990s, especially when the NAO was primarily positive. However, since then, the NAOI has been more variable, yet trends towards higher winter flows have been unabated. The picture is a very complex one, and recent studies have shown strong non-stationarity in the relationship between the NAO and UK rainfall and river flows (as well as groundwater levels) over long timescales (e.g. Rust et al., 2022).
While the dipole-based NAO, EA, SCA and synoptic-scale drivers can explain some of the variability of hydrological drought occurrence, there is arguably even greater benefit from zooming out further still to consider the role of larger-scale, slowly varying ocean–atmosphere drivers – notably (quasi-)cyclical patterns of sea surface temperature variations such as the El Niño–Southern Oscillation (ENSO) or the Atlantic Multidecadal Oscillation (AMO), which themselves influence the state of the NAO. Such patterns have a reasonable degree of predictability, and so uncovering robust links between them and river flow could have profound implications for efforts to forecast and project water availability. Folland et al. (2015) reviewed the state of the knowledge on such links at the time and demonstrated links between ENSO and a range of other predictors and UK (specifically, lowland England) rainfall – most notably with La Niña events (links which have been long established; see references therein). They also showed the impacts of La Niña on river flows and groundwater, including drought indicators like the SPI and SSI for the Thames region. While links between La Niña events and English-lowland winter half-year droughts were uncovered, such relationships are weak and highly non-linear.
More recently, Svensson and Hannaford (2019) also adopted a global-scale approach to explore links between UK regional rainfall and river flows on the one hand and sea surface temperature (SST) patterns in both the Atlantic and Pacific oceans on the other. These authors confirmed an impact of Pacific Ocean variability (the Pacific Decadal Oscillation, strongly linked to ENSO) but found that it was highly modulated by the state of the North Atlantic (Fig. 7). Such relationships were present not just for the winter but also in summer months, previously considered to be much less promising for forecasting and yet of the most importance for drought management. The implication is that, to understand UK river flow variability and hydrological drought, it is necessary to look well beyond dipole-like circulation indices and zoom out to take a global view of atmosphere–ocean dynamics.
To identify regions significantly influencing UK droughts beyond the North Atlantic, we applied methodologies similar to those used by Svensson and Hannaford (2019). The impact of remote climate drivers was analysed across three distinct UK regions with varying SSI catchment characteristics: the northwest, a transition zone, and the southeast (Fig. 7a). We performed regressions of the area-averaged regional SSI time series for these regions against the global SST dataset at each grid point, both concurrently (Fig. 7b–d) and with a 6-month lag (Fig. 7e–g). See Sect. A3 in Appendix A for more details on the data and methods used.
As expected, our results highlight the North Atlantic as a significant driver for all three regions of the UK (Fig. 7b–d). Additionally, the equatorial Pacific Ocean has strong correlations with the SSI in all three regions of the UK concurrently and with a lag of 6 months. The Indian Ocean shows significant correlations concurrently with all UK SSI values (Fig. 7b–d), but, at a lag of 6 months, the Indian Ocean influence is associated with only the southeastern UK (Fig. 7g). Similarly, the southern Atlantic Ocean only has strong correlations with the southeastern UK (Fig. 7d, g).
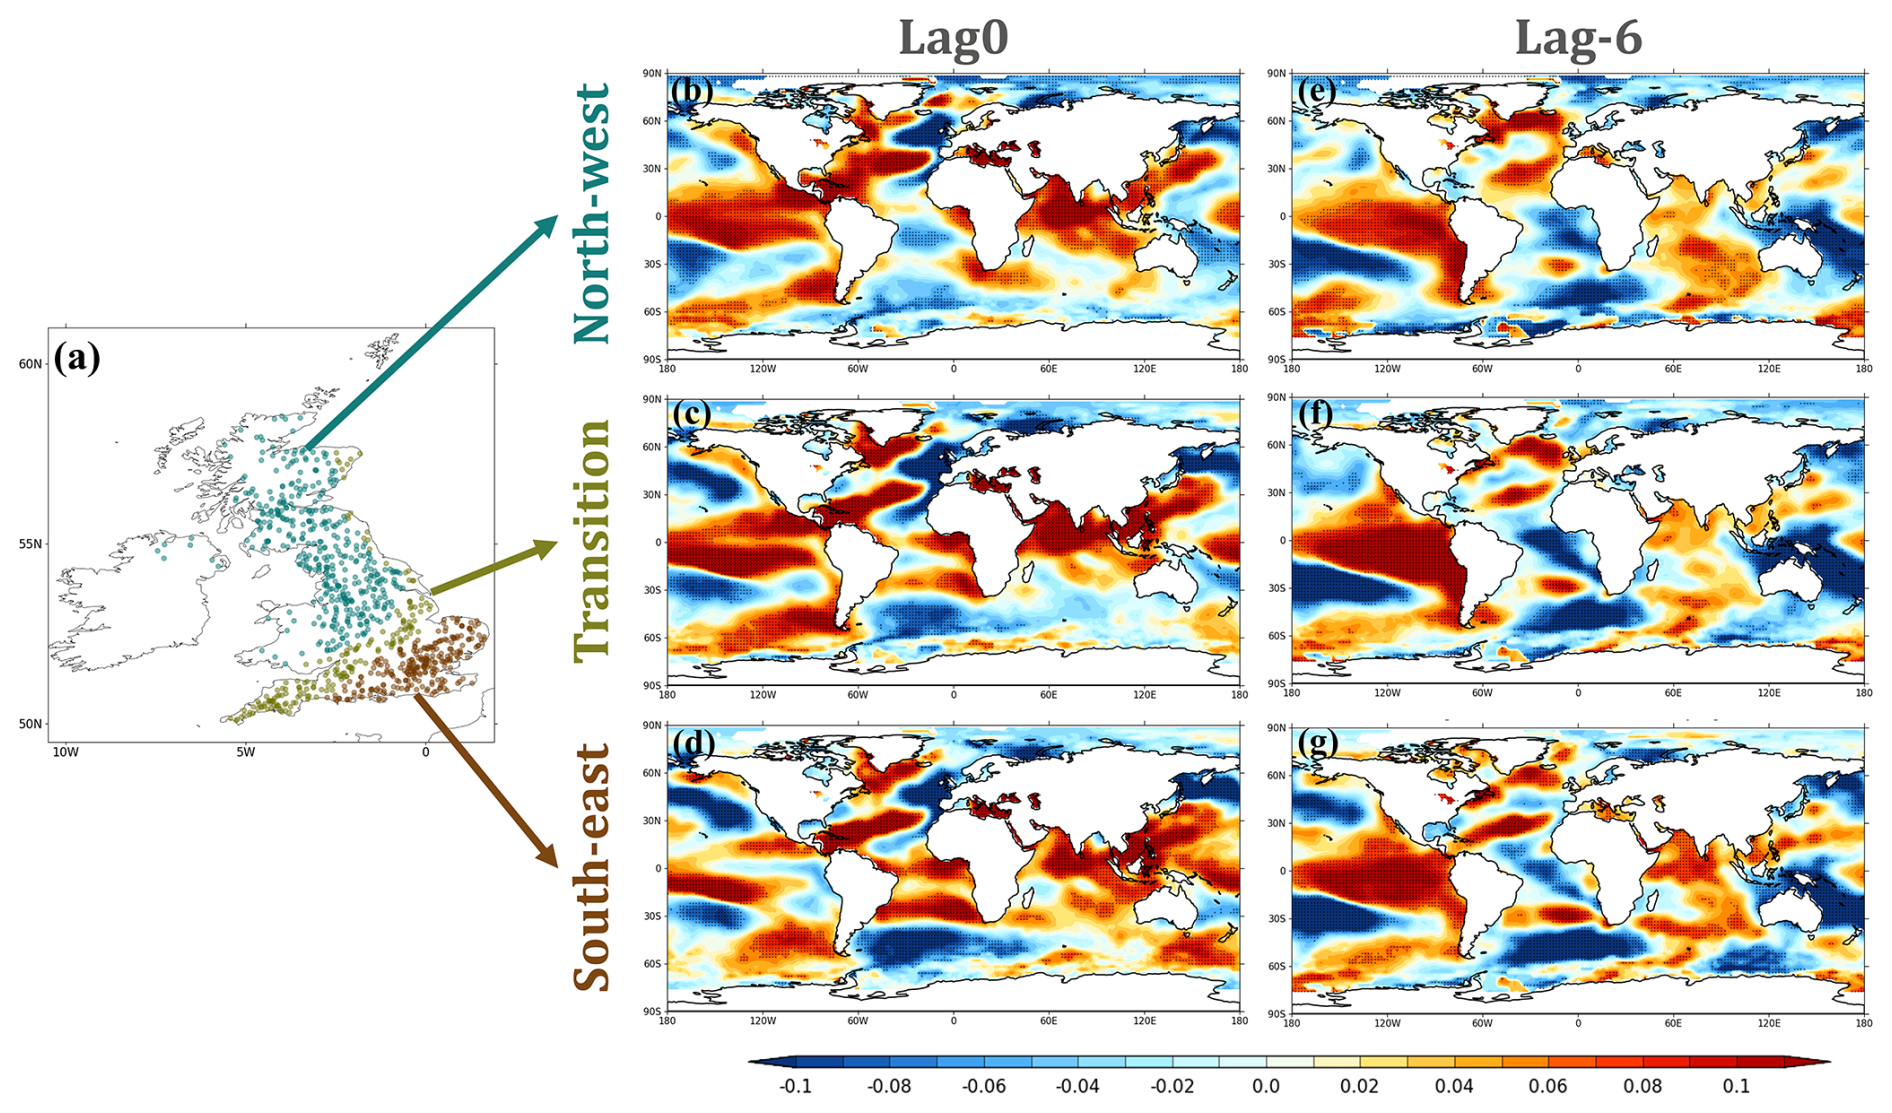
Figure 7(a) Three distinct regional clusters for catchments based on Standardised Streamflow Index (SSI) (northwest, blue; transition, green; southeast, brown) identified using the 3-month accumulation of SSI (SSI-3) time series for 1960–2020 using k-means clustering. Regression (shaded) between each grid point of SST and SSI for (b) the northwestern UK at lag0, (c) the transition region of the UK at lag0 and (d) the southeastern UK at lag 0, with regions' significant 0.05 levels demarcated with stippling. (e)–(g) Same as panels (b)–(d) but with a lag of 6 months (i.e. SST lagging by 6 months in relation to the SSI).
Despite the strong linear relationships between the Pacific, Atlantic and Indian oceans and the UK climate, these teleconnections might not be direct, linear or even stationary (e.g. as noted for Pacific influences by Lee et al., 2019). Multiple pathways have been proposed for these teleconnections, linking distant regional SSTs to the North Atlantic, which will ultimately influence UK hydrology. The tropical Pacific's influence on the North Atlantic–European region has been identified through (i) the stratospheric pathway leading to sudden stratospheric warming via the polar vortex (e.g. Trascasa-Castro et al., 2019), (ii) the shifted Pacific jet associated with transient eddies entering the Atlantic region (Li and Lau, 2012) and (iii) the Rossby wave train affecting the Pacific–North America sector (Mezzina et al., 2020). In the context of droughts, tropical Pacific variability may shift the North Atlantic jet (e.g. Madonna et al., 2019) or cause blocking high pressures over the European region (e.g. Cassou et al., 2004), leading to severe droughts and heatwaves across Europe. Studies have also found that warming in the tropical Indian Ocean leads to changes in the North Atlantic through a positive NAO-like response, which explains the development of the North Atlantic “warming hole” (Hu and Fedorov, 2020), or through the strengthening of the Atlantic meridional overturning circulation (Hu and Fedorov, 2019). Additionally, there are pathways that combine the influences of the Indian Ocean Dipole and the El Niño–Southern Oscillation (ENSO) on the North Atlantic Oscillation (Abid et al., 2023).
In general, there have been some advances in explaining the drivers of hydrological drought through relating various climate and ocean indices to river flow indicators. Fewer studies, however, have linked to drought indicators specifically. In addition, while such relationships have been used to explain observed river flow variability and trends, most have been what may be termed “soft attribution” through associations and correlation. There have been few “hard-attribution” studies (Merz et al., 2012), that is, studies that have demonstrated conclusively a causal chain between climate variations and trends in river flow (proof of consistency, Merz et al., 2012) and also ruled out other factors (proof of inconsistency) – e.g. catchment changes, as discussed in Sect. 5.
A second aspect of attribution is separating any signal of anthropogenic warming from internally forced variations such as ENSO and AMO, as discussed above. Formal climate detection and attribution studies have been undertaken for UK flood events (e.g. for the 2013–2014 floods; Schaller et al., 2016). Attribution studies for drought are less common, at least those that focus on the UK specifically, but the role of human-induced warming has been shown for the wider European 2022 meteorological drought (e.g. Faranda et al., 2023). More generally, detection and attribution studies have been undertaken for meteorological drought globally (e.g. Chiang et al., 2021), but they have not been applied for hydrological indicators. A majority are also event based rather than being focused on long-term trends. Gudmundsson et al. (2021) claimed that global trends in mean and low river flows could be attributed to climate warming, but, ideally, such studies need replicating at the finer scales relevant for UK water management policymaking and practice.
As shown in Sect. 4, there is a substantial and growing body of literature on the links between climate drivers and hydrological drought, motivated by the need to understand the factors controlling large-scale water availability. In many UK catchments (in common with many other domains, globally), however, river flows patterns often deviate markedly from climate variability due to pervasive artificial influences on river flow regimes. While RHNs enable climate signals to be discerned, many RHN sites are small headwater catchments in the uplands and are often some distance away from major population centres. Arguably, the most important locations are those in the heavily populated, intensively managed lower reaches, where understanding climate and human controls on hydrological drought is much more challenging.
Hence, while RHNs seek to filter out artificial influences as a “control”, these influences are worthy of study in and of themselves. This has been the spirit of the International Association of Hydrological Sciences (IAHS) “Panta Rhei” decade (https://iahs.info/Commissions--W-Groups/Working-Groups/Panta-Rhei, last access: 18 August 2025), which has sought to understand and quantify human influences on flow regimes and has spawned a “drought in the Anthropocene” initiative (van Loon et al., 2016). Internationally, many studies have attempted to quantify the impact of influences such as reservoirs, abstractions, discharges, water transfers and other regulation on flow regimes and, hence, on drought characteristics (for example, see the overview of van Loon et al., 2022). Similarly, many studies have aimed to quantify the role of land use and land cover (LULC) changes on flow regimes. Such surveys highlight the many challenges in discerning the impact of any particular human influence because multiple impacts occur in parallel, are difficult to disentangle, and may offset or compensate for one another. Nevertheless, in spite of these challenges, these are not just academic debates but topics of huge societal import: in the UK, there is a long-standing and sometimes polarised and contentious debate on the role of abstractions in hydrological drought and low flows, especially for chalk streams, that has attained particular prominence in recent years (e.g. CaBa, 2021).
Despite this growing interest in both academia and the public eye, there have been relatively few UK studies in the scientific literature that have conclusively linked artificial influences (or, commonly, a change in artificial influences) with hydrological drought responses. Partly, this reflects the challenges in obtaining suitable datasets of artificial influences – an issue shared by many if not most countries. Until very recently, there have been no readily available quantitative datasets of abstractions or discharges for the UK. These are held by the UK regulatory authorities (Environment Agency, Scottish Environment Protection Agency, Natural Resources Wales, Northern Ireland Department of Agriculture Environment and Rural Affairs) and are used for operational abstraction licensing and discharge permitting but are not made available for privacy and security reasons. Hence, while there are undoubtedly studies of the impacts of abstractions in individual catchments, these are largely inaccessible. Similarly, while datasets of reservoir locations and dimensions are available (e.g. Durant and Counsell, 2018), information on reservoir operations is lacking. Finally, while there is a long-standing history of land cover mapping (e.g. Marston et al., 2023), datasets of land use changes over time have, generally, been less readily available.
In the absence of directly available quantitative datasets of influences, researchers have resorted to indirect techniques. Tijdeman et al. (2018a) took a “large-sample” approach to compare the drought regimes of catchments classified according to the presence or absence of certain influences using the NRFA's categorical Factors Affecting Runoff (FAR) codes (NRFA, 2025). While the study suggested that deviations in drought regime (i.e. expected response to precipitation) could be linked to influences (notably, extended drought durations linked to the presence of groundwater abstractions in chalk catchments; Fig. 8), in practice, the method was primarily a screening approach, and no quantitative proof could be offered in the absence of dynamic data on these impacts.
Bloomfield et al. (2021) also took a large-sample approach, using the CAMELS-GB dataset, which does incorporate some limited artificial-influence data within, based on the Environment Agency's National Abstraction Licensing Database (NALD) and the reservoir information of Durant and Counsell et al. (2018). Bloomfield et al. (2021) developed statistical models to assess the impact of abstractions, discharges and reservoir operations on baseflow in 429 catchments. The inclusion of such water management interventions improved the statistical models in some cases – especially for groundwater abstractions, suggesting a detectable impact, in common with Tijdeman et al. (2018a). These authors note that more detailed information on water management than is currently available in CAMELS-GB would be needed to fully constrain the specific effects of individual water management interventions on the Baseflow Index (BFI). While such studies have typically looked at the impact of increasing abstractions, the reverse may also apply when abstraction decreases. Clayton et al. (2008) noted an increase in river flows since the cessation of a major groundwater abstraction in the river Ver as part of a scheme of alleviation of low flow (ALF), but, again, it was noted that this could not be confidently attributed to that cause alone. Similarly, Tijdeman et al. (2018a) show a similar example for the Darent, a river with an ALF scheme, although they also conclude that such relationships need further work to be fully elucidated.
More recently, Coxon et al. (2024) applied machine learning approaches to CAMELS-GB and highlighted the role of wastewater discharges in dominating low-flow signals in urban catchments. This study was not able to show changes in discharge inputs influencing changing low flow or drought properties over time given the static nature of the information on human impacts – but, given the pervasive nature of such impacts, as demonstrated, it is easy to see how catchments experiencing changes in abstractions, discharges or the balance between them could see changing drought or low-flow regimes.
Salwey et al. (2023) adopted a large-sample approach to detect reservoir impacts on river flows using hydrological signatures, including low-flow metrics. They compared signatures from 111 benchmark catchments with 186 catchments modified by reservoirs (again, largely based on Durant and Counsell, 2018). They found that reservoirs create deficits in the water balance and alter seasonal flow patterns, while low-flow variability was dampened by reservoir operations. This approach of comparing signatures between benchmark and impacted datasets enabled the identification of thresholds above which the reservoir “signal” could be isolated from wider hydro-climate variability and holds promise for discerning the effect of other human impacts.
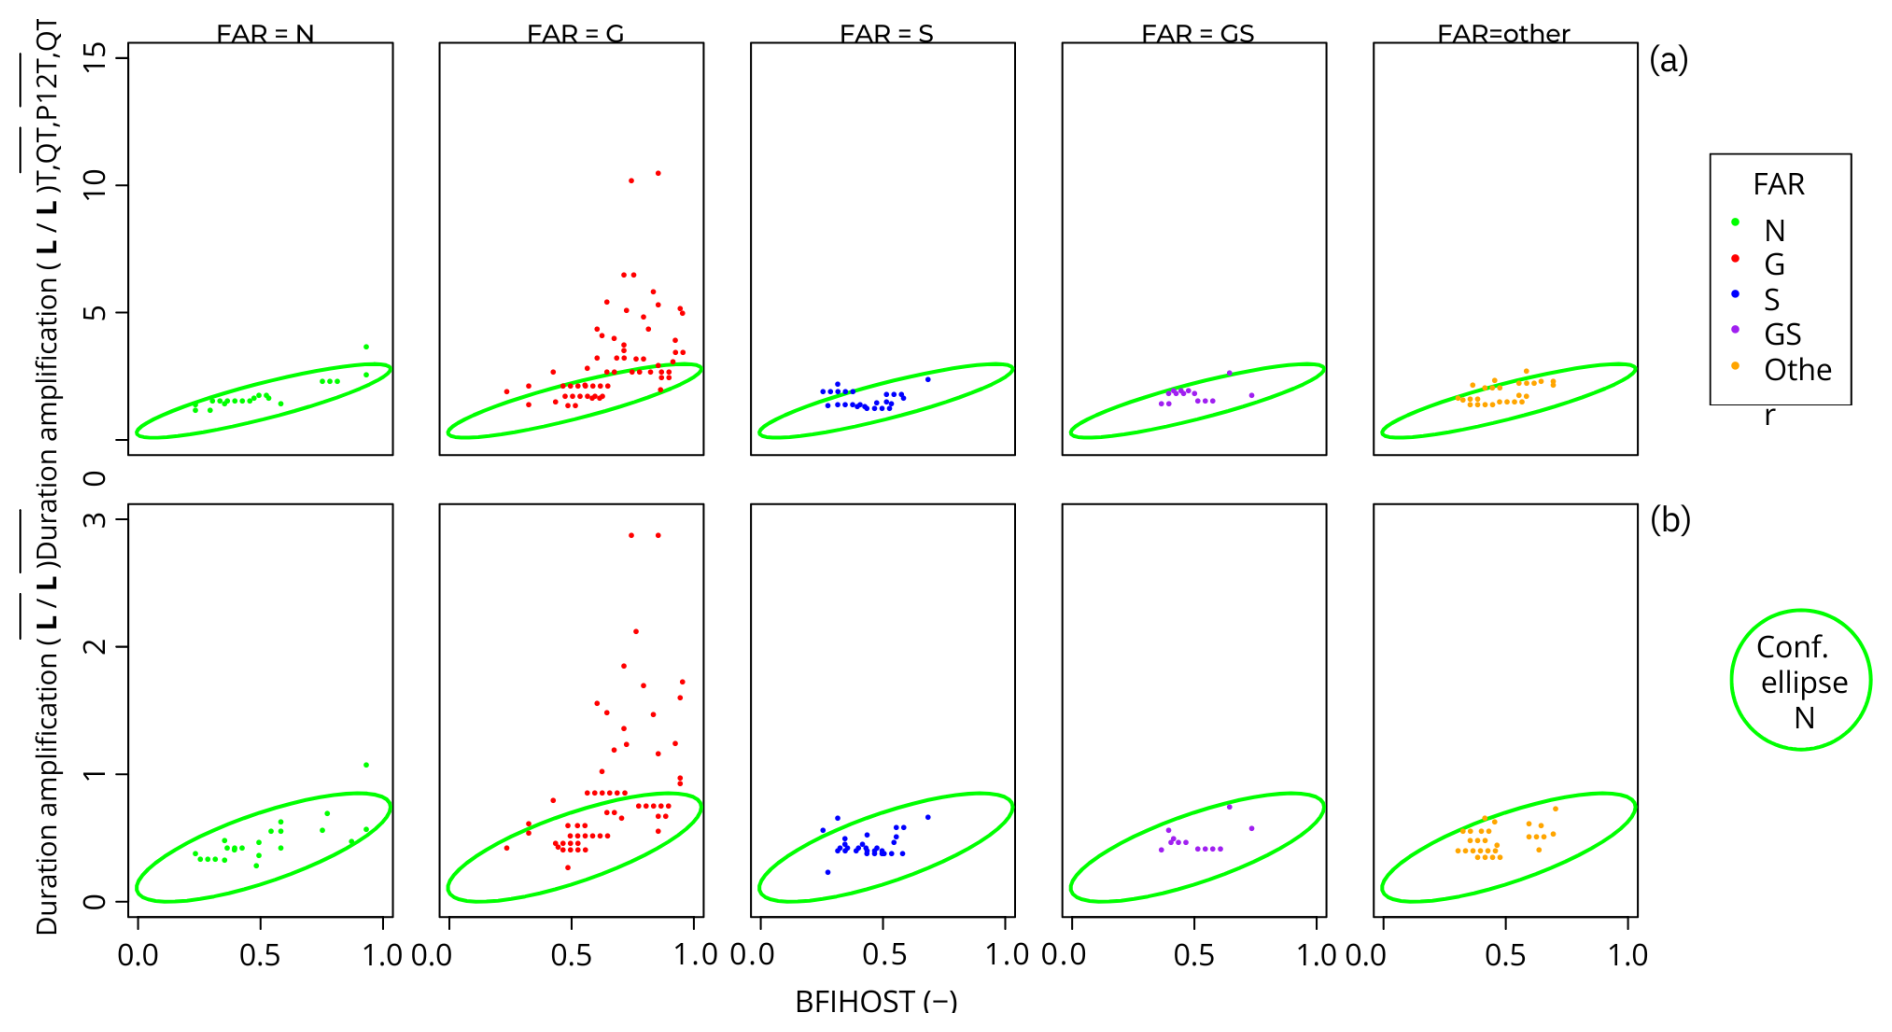
Figure 8Amplification of average monthly streamflow drought duration over average monthly precipitation drought duration: (a) 1-month precipitation and (b) 12-month precipitation versus BFIHOST (Base Flow Index estimated from Hydrology of Soil Types classification; NRFA, 2025), a measure of catchment storage in soils and groundwater. For catchments labelled with different “Factors Affecting Runoff” codes (colours) (NRFA, 2025): N denotes natural, G denotes groundwater abstraction, S denotes storage or impounding reservoir, and GS denotes combination of both. Ellipse reflects the 95 % confidence ellipse for catchments with near-natural flow records (FAR – N). FAR – G (groundwater abstraction) shows that many catchments have longer droughts than expected based on precipitation. Reproduced with permission from Tijdeman et al. (2018a).
Other studies have adopted paired-catchment analyses – e.g. Van Loon et al. (2019), who compared droughts in two “hydrologically similar” catchments in eastern England, with one catchment being impacted by a water transfer scheme and another being sensibly natural. Coxon et al. (2024) also used paired catchments to demonstrate the role of wastewater discharges on flow regimes. While differences can be observed in drought characteristics, once again, there is limited or no time-varying information on the human influences (abstractions, discharges) to prove the effect conclusively (“weak attribution” in the parlance of Merz et al., 2012). Moreover, there are always challenges when using paired catchments: inherent dissimilarities in flow regimes can exist between catchments despite superficial similarities in, for example, catchment attributes, and these can easily be misinterpreted and attributed to human interventions.
While the literature on artificial-influence impacts on drought is relatively sparse, the situation is even more acute for the influences of land use or land cover (LULC) change despite this being a long-standing topic in UK (and global) hydrology. This is certainly the case for low-flow and drought indicators that have, arguably, been neglected in comparison to floods, for which there have been many studies. Nevertheless, reviews and meta-analyses show that there is very limited consensus on the extent to which flood indicators are conclusively influenced by rural land management (e.g. O'Connell et al., 2007), afforestation (Stratford et al., 2017), or natural flood management (Dadson et al., 2017). For water resources or drought indicators, there have been no major efforts to synthesise the literature in a comparable way.
At the catchment scale, LULC changes have been very comprehensively investigated for isolated catchments – with the most notable example being the paired-catchment studies at Plynlimon in mid Wales (see the review of Robinson et al., 2013). The Plynlimon experiment did not investigate drought responses per se but showed the impact of afforestation on catchment evaporative losses and, hence, river regimes, including low flows. While there has been growing interest in quantifying the effect of afforestation on flood regimes as a potential mitigation strategy, there have been few studies looking at drought or low flows at the larger scale. Recently, Buechel et al. (2022) used (land cover) scenarios of potential afforestation applied to a land surface model (JULES) to quantify the effect of afforestation in 12 diverse (and generally large) UK catchments. Surprisingly, given vigorous debates on the topic, these authors found little impact on flooding but much larger impacts at median and low flows. It must be noted that this was a scenario-based (“what if” scenarios) rather than an observational study.
Urbanisation has a major potential impact on streamflow regimes, but, again, the focus has largely been on investigating the effect of urbanisation on flood frequency (e.g. Prosdocimi et al., 2017). Few studies have investigated wider streamflow regimes more generally. However, in an interesting development, a recent study by Han et al. (2022) investigated non-stationarity in observed river flow regimes in 12 urbanising catchments (using time-varying datasets of changing urban cover based on satellite retrievals) and found that the strongest signals to emerge were for low flows rather than for high flows. While increases in urbanisation tended to increase the magnitude of flows across the whole regime, the rate of increase was much higher for low flows (1.9 %±2.8 % (1 SD) for every 1 % of urban cover) than for high flows (0.5 %±2.2 (1 SD)).
In summary, the impact of human interventions on hydrological drought rests on a very limited evidence base. As noted, one major limitation has been the availability of impact datasets. There have been significant advances in developing datasets of impacts of abstractions and discharges for England based on the Environment Agency's National Abstraction Licensing Database (NALD) data holdings – notably CAMELS-GB (Coxon et al., 2020, 2024), which has supported several of the studies mentioned here. More recently, a gridded dataset of abstractions and discharges was developed and made available by Rameshwaran et al. (2021; Bell et al., 2023; Rameshwaran et al., 2025). So far, this has mainly been used to improve hydrological modelling (Rameshwaran et al., 2021; Bell et al., 2023) and support future projections (Tanguy et al., 2023). The latter study shows how future projections are sensitive to changing abstraction patterns, depending on various socioeconomic demand scenarios. The dataset will also be crucial in future efforts to discern human-driven changes on drought regimes in the here and now. While barriers remain with regard to accessing underlying abstractions and discharges, these derived products are important community assets, and further studies using them will no doubt emerge.
When there are major drought events, it is often said that droughts are becoming more severe due to anthropogenic warming. While the evidence for human warming is unequivocal, it cannot be said so readily that there is compelling evidence for changes in hydrological drought in the UK – certainly, there is not (yet) strong evidence for droughts becoming more severe despite the occurrence of two major hydrological droughts in the last half-decade. In contrast, there are sound scientific reasons as to why we should expect changes in hydrological drought in a warming world, and future projections indicate that we will (Lane and Kay, 2023). Clearly, reconciling past observations and future projections remains as big a scientific challenge as ever, echoing past reviews (Hannaford, 2015; Watts et al., 2015).
This lack of congruency between historical observations and future projections has been called a “conceptual controversy” in the past by Wilby et al. (2008). That study referred to floods, and, arguably, the gap between projections and observations has narrowed significantly in the recent past for floods – but, while there is increasing confidence in studies detecting fluvial flood trends, this is not the case for hydrological drought.
However, as argued in the original paper (Wilby et al., 2008), it is important not to see “controversy” as a reason for inaction. There are good reasons as to why the disparity emerges: projections inevitably cover a large range of uncertainty; with observations, signals are weak and obscured by natural variability, as well as by the impact of direct human disturbances. The lack of compelling trends in drought or low flows can be seen by the sensitivity to study period and how readily the strength or directionality of trends changes with small shifts in perspective. This arises because of strong interannual and interdecadal variability due to a range of large-scale atmospheric and/or oceanic circulation patterns (see Sect. 4). Wilby (2006) highlighted that it can take very long “detection times” of many decades for a signal of anthropogenic warming to be detectable above the noise of interannual and interdecadal variability. In this context, it is unsurprising that “detectable” (i.e. statistically significant) trends may not have emerged yet, even if there is an underlying anthropogenic component. Wilby (2006) argues that trends may be practically significant for water managers way before they become statistically significant.
In the Introduction, we argued that a synthesis of research from the UK could provide a useful contribution to the international debate on whether droughts have become more severe. However, the story is complicated, and there is no “smoking gun” in terms of the influence of climate change on drought trends for the UK, nor is there any conclusive evidence for worsening hydrological drought due to human activities. In fact, the key finding is that there is limited evidence to suggest any evidence of worsening hydrological drought or low flows in the UK, alongside other studies that suggest a similar picture across northern Europe. In general, the patterns of increasing river flow and decreasing hydrological drought we find for much of the UK can be seen to be a part of an established pattern of increasing flows – and decreasing drought severity – across much of northern and western Europe over the last 40–60 years (e.g. Stahl et al., 2010, 2012; Vicente-Serrano et al., 2019; Masseroni et al., 2021; Peña-Angulo et al., 2022), which contrasts with decreasing flows and worsening hydrological drought in southern and central Europe. While there are few global observational analyses, those that exist typically also find a complicated picture and a lack of compelling low-flow trends in most temperate environments (e.g. Hodgkins et al., 2024).
And yet, importantly, the picture of apparent discrepancies between observed trends and near-future projections is also shared elsewhere (e.g. for river flows in central Europe: for example, Piniewski et al., 2022; more generally, Shaw et al. (2024) highlight several examples in Africa and Asia, where recent climate trends are inconsistent with projections). The challenge of providing straightforward assessments of observational change for regional- to national-scale water managers, as well as for global policy assessments like the IPCC, remains. Nevertheless, our findings (and recommendations) resonate with experiences and insights from other settings, specifically that there is much the UK can learn from the international community and vice versa, and we address some of these international perspectives in our recommendations below.
Looking across this synthesis, we can conclude that, while there are some gaps, a comprehensive body of work exists on past variability in UK drought. Given this fact, a conclusion that highlights relatively little evidence for change, contrarily to near-future expectations, may seem surprising. Our question was “have hydrological droughts changed?” – and a lack of any clear answer is little relief to water resource planners who are already frustrated by the challenges of handling very large ensembles of future projections (i.e. deep uncertainty). They may also question the finding of a lack of trends, given experiences with very extreme recent events that, anecdotally, feel like “something different” – 2018 and 2022 certainly are the kind of drought events we expect to see more of in the future, associated with high temperatures, as well as rainfall deficits in the summer half-year.
How, then, should researchers, policymakers and water managers move forward? Here, we highlight some brief (and necessarily selective) recommendations for future research aimed at “bridging the gap” between observations and projections.
-
Drought characterisation and “types of drought”. Numerous authors have drawn distinctions between types of UK drought, contrasting between within-year summer droughts and long multiannual droughts. Future studies should examine variability in different droughts as, in a warming world, we may expect differences between multiannual droughts (driven by successive dry winters) and short-duration droughts associated with increased evapotranspiration due to high temperatures. Given the extreme aridity of recent droughts, analysis of “flash” droughts assumes increasing importance. While there are wide uncertainties in future projections of multiannual droughts (e.g. Watts et al., 2015), future increases in summer half-year aridity are one of the more confident projections for the UK. Noguera et al. (2025) found localised, season-specific evidence of increasing flash drought tendencies in meteorological indices, but further analysis of the impact of recent flash droughts on hydrological systems and how this may change in future warrants consideration alongside multiannual droughts. Looking more widely, different types of hydrological drought are routinely being acknowledged in the international literature, and taxonomies have been produced (e.g. van Loon, 2015). More pertinently in relation to the question of trends, various regional- to global-scale analyses of drought and low-flow studies emphasise that trends should ideally be computed for different flow regime types to avoid mixing different low-flow and/or drought generation processes (e.g. Hodgkins et al., 2024, who found differences in extreme low-flow trends between “cold, warm and transitional” regime types even in the same geographical regions). While cold-season processes are rare in the UK, there are significant differences in catchment responsiveness, leading to different drought propagation processes and lag times (e.g. Barker et al., 2016) that should be accounted for in future studies of trends, especially the more mixed patterns seen in southern and eastern England, where catchment storage is most variable due to the complex variations in hydrogeological settings. Sensitivity to drought and/or low-flow definitions is another key issue – Hammond et al. (2022) undertook a national-scale analysis of low flow and drought across the USA and found some important contrasts in trend patterns using different low-flow metrics and drought definitions (contrasting fixed- and variable-threshold approaches to drought identification).
-
An even longer view of historical droughts. Although reconstructions have enriched our understanding of past hydrological droughts, they still extend only to 1865 (CRU reconstructions) or 1890 (Historic Droughts and MaRIUS reconstructions). Reconstructions have not been attempted yet for earlier periods. This is an opportunity given recent advances in extending meteorological datasets further into the 19th century (Hawkins et al., 2022). Monthly river flow reconstructions in Ireland have been developed from 1766 (O'Connor et al., 2021), suggesting that credible hydrological drought reconstructions can be made over these very long time horizons. More widely, there have been numerous efforts beyond the UK and Ireland to reconstruct river flows and hydrological droughts over past centuries using hydrological models (e.g. in France, Devers et al., 2024), suggesting that the pooling of approaches across borders could be advantageous. A longer view would enable hydrological comparisons with a growing body of knowledge on past meteorological droughts and their impacts using either documentary sources (e.g. Pribyl and Cornes, 2020) or increasingly reliable palaeoclimatic reconstructions using dendrochronology (e.g. Loader et al., 2020). In the US, successful reconstructions of river flow have been achieved using dendrochronological sources (e.g. Stagge et al., 2018).
-
Improved understanding of climate drivers – going beyond the NAO. In our review, we highlighted the barriers in using simple dipole-like atmospheric indices and recognised the emergence of process-based studies looking at ocean–atmosphere dynamics on a hemispheric or global scale. Continued improvement in our understanding of the drivers of drought on interannual to interdecadal timescales can only help in our efforts to attribute emerging patterns of variability to anthropogenic or internally driven factors, as well as to anticipate drought on seasonal to decadal timescales. While Sect. 4 summarised the state of the art in tracking drivers of UK hydrological drought globally, a comprehensive understanding of these long-distance influences on the North Atlantic is lacking, highlighting the need for a coordinated effort to integrate research findings and to form a complete picture of the teleconnections of droughts. Greater integration between climate modelling simulations and statistical hydrology will be pivotal, and there is a role for new techniques, such as using causal inference approaches to quantify the teleconnection pathways (e.g. Kretschmer et al., 2021) or using machine learning methods to the ascertain the impacts of the large-scale variability on water resources (e.g. Kalu et al., 2023).
-
Better discerning of the human factor in drought. The role of human interventions in river flows in general and in hydrological drought in particular is a hot topic academically but also one that invites “hot takes” – especially in the media and public narrative. Yet, there is little evidence for a widespread footprint of human influences in changing hydrological drought patterns despite the prevalence of demonstrable human impacts on river flow regimes. Improved attribution requires identification of both climate-driven and anthropogenic catchment changes and quantification of their relative roles. This will require integration of field observation and climate and hydrological modelling, as well as further statistical and large-sample hydrological approaches. All these activities critically depend on observational datasets. While there have been efforts to improve the observational evidence base (e.g. the UK Benchmark Network), major barriers remain – not least regarding information on artificial influences and LULC change. Initiatives are underway to overcome these barriers, which will provide improved foundations for future studies. Improved datasets of human interventions and LULC open up the potential for large-sample analyses based on AI methods that can isolate the role of climate factors and catchment factors, as demonstrated recently for flood trends by Slater et al. (2024). Internationally, the subject of disentangling human and climate drivers has been the focus of dozens of papers (e.g. van Loon et al., 2022). There have been some efforts to compare drought and low-flow trends from RHNs with trends from disturbed catchments, with some US studies suggesting little overall difference (Ficklin et al., 2018), while others suggest more pronounced differences between natural and regulated basins (Tijdeman et al., 2018b; Dudley et al., 2020). Our study reveals that, while the overall percentage of catchments with positive or negative trends is similar across indicators (Q95, Q70, Q50, etc.) and across the full network and UKBN2, a larger proportion of catchments in the full network exhibit statistically significant trends compared to in the UKBN2 (Table S3). It may be premature to attribute this to human influences, but this clearly warrants further investigation. With regard to LULC, the international literature is broad, but, at a European scale, studies suggest that decreasing flows in the Mediterranean may partly reflect revegetation and irrigation expansion (Vicente-Serrano et al., 2019), whereas, in northern Europe, trends are more consistent with purely meteorological drivers – however, this is at the large-scale, and, undoubtedly, LULC impacts could be influential for individual catchments. This remains an important topic for future research in the UK, especially given the growing need for information to underpin planning of LULC interventions for Net Zero. There is limited specific observational evidence on the impacts of afforestation on low flows or drought in the UK, but a recent international review by van Meerveld and Seibert (2025) highlights that the effects of forests on low flows are very site-specific and depend on many factors: climatic and hydrogeological, as well as the forest characteristics themselves.
-
Bringing it all together – better reconciliation of observations and models as a basis for decision-making. Studies of observational trends have been calling for this since the mid-2000s (e.g. Hannaford and Marsh, 2006; Wilby, 2006; Wilby et al., 2008). The question is “how?” – because this is easier said than done given the relative brevity of hydrological drought records and the aforementioned deep uncertainty of future projections. Increasingly, large ensembles of climate model or seasonal forecast model outputs are emerging as a powerful tool for contextualising flood and drought events (e.g. using the UNSEEN approach, recently applied to UK fluvial flood and hydrological drought events by Kay et al., 2024, and Chan et al., 2023). Such approaches allow us to look at “worlds that might have been” – that is, seeing the observational time series as just one realisation of the past and using large-ensemble approaches to explore a much wider range of internal variability. In this context, some of the discrepancies seen between past trends and future projections (e.g. for the summer season) can be explained to a degree by random internal variability, and recent decades could have unfolded very differently. Deser and Phillips (2023) analysed climate trends using Single Model Initial condition Large Ensembles or SMILES. Chan et al. (2025) have recently applied similar approaches to hydrological drought variability in the UK to quantify signal-to-noise ratios and the time of emergence of drought trends.
Emerging analyses using such large-ensemble and storyline approaches are a flexible, modular approach that can be a unifying framework that enables decision-makers to explore each of these themes. Recent review and perspective articles provide a much broader perspective on how such emerging approaches can be used to help contextualise past extremes and to plan for more severe events in future (Shaw et al., 2024; Kelder et al., 2025). They allow for exploration of past variability (including reconstructed droughts from centuries ago) and future projections consistently, and one can explore risks and vulnerabilities to particular types of drought, including extreme events that have not been sampled in observational records. Physically based storyline approaches have been used to explore the role of climate drivers in generating hydrological droughts (e.g. Chan et al., 2023, 2024) and, in principle, could also be used to help discern climate and catchment drivers – a conceptually similar approach to disentangle climate and LULC trends was applied in Ireland by Harrigan et al. (2014). These approaches will be a cornerstone of future efforts to quantify variability in hydrological drought. Seeing the past as only one realisation of many potential outcomes is an important shift in perspective – one that poses important questions of whether the observations of the recent past could create a false sense of security. Future years and decades could, worryingly, see better agreement between observations and projections.
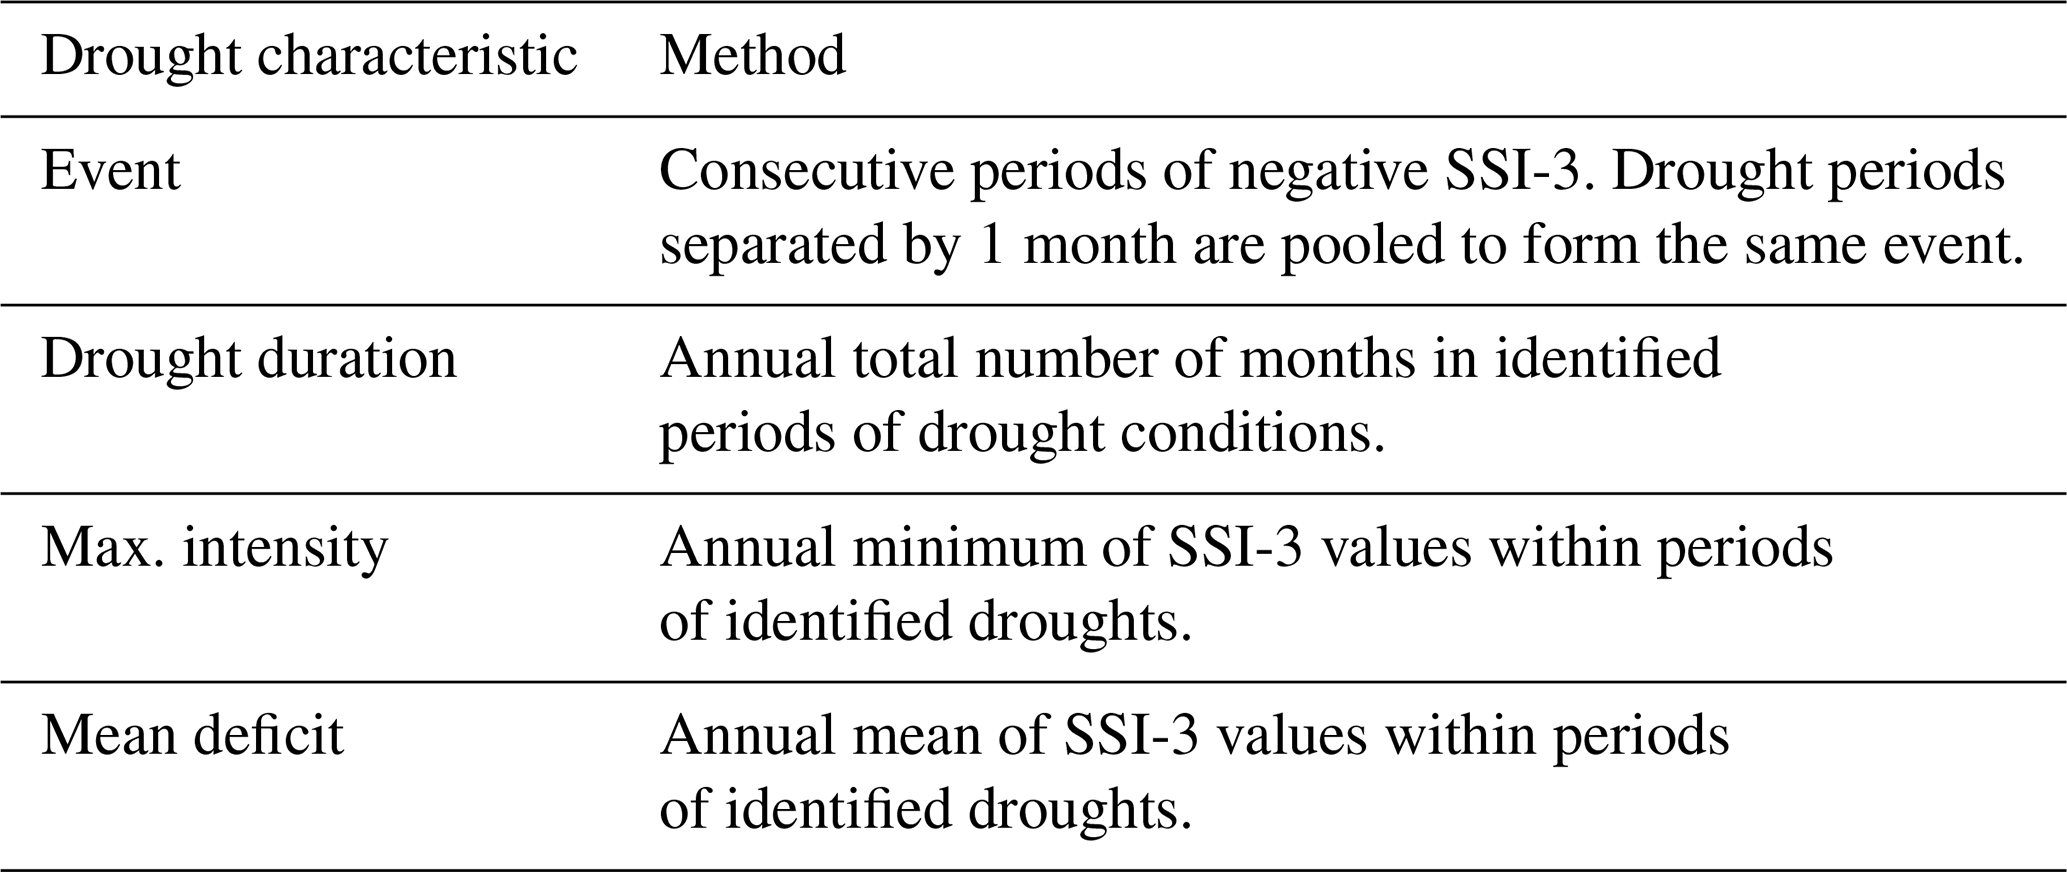
Table A1Drought characteristics calculated from the SSI-3 for trend analysis.
This section briefly describes the methods used in the extended analysis featured in this paper.
A1 Trend analysis
Annual values for all variables (Q50; Q70; Q90; and the four seasons of spring (March–May), summer (June–August), autumn (September–November), and winter (December–February)) were firstly extracted for all NRFA stations meeting the record length criteria and for all Low-Flow Benchmark Network stations (Harrigan et al., 2018). The Qx variables are the exceedance flows that are very commonly used as flow regime metrics: Q50 is the river flow that is exceeded 50 % of the time, Q70 is the river flow that is exceeded 70 % of the time, and so on.
The Standardised Streamflow Index accumulated over 3 months (SSI-3) was calculated by fitting the Tweedie distribution to observed river flows of catchments in the LFBN. Comparing different probability distribution functions to fit river flow data for the purpose of calculating SSI, Svensson et al. (2019) concluded that the Tweedie distribution is most suitable for UK catchments. The SSI fitted using the Tweedie distribution has previously been used for historical hydrological drought analyses in Barker et al. (2016, 2019). Hydrological drought characteristics were extracted from SSI-3 following the method outlined in Table A1. The SSI calculated for observed river flows for the Low-Flow Benchmark Network and most NRFA catchments can be extracted from the UK Water Resources Portal (https://eip.ceh.ac.uk/hydrology/water-resources/, last access: 18 August 2025).
The method for trend analysis was the standardised NRFA trend analysis toolkit described in Harrigan et al. (2018), which was based on established methods within hydrological literature. Monotonic trends were assessed using the Mann–Kendall (MK) test, a non-parametric rank-based approach that is widely supported for use in streamflow analysis (e.g. Hannaford and Marsh, 2023; Murphy et al., 2013). The magnitude of trends was estimated using the robust Theil–Sen approach, with trend magnitude expressed as a percentage change compared to the long-term mean (the Theil–Sen average, TSA; Harrigan et al., 2018).
The standardised MK test statistic (MK Z) follows the standard normal distribution, with a mean of 0 and a variance of 1. A positive (or negative) value of the MK Z indicates an increasing (or decreasing) trend. The probability of type-1 errors set at the 5 % significance level allowed for the evaluation of statistical significance. A two-tailed MK test was chosen; hence, the null hypothesis of “no trend present” (increasing or decreasing) is rejected when the MK Z is outside ±1.96 using traditional statistical testing.
The MK test requires data to be independent (i.e. free from serial correlation or temporal autocorrelation) as positive serial correlation increases the likelihood of type-1 errors or incorrect rejection of a true null hypothesis. All indicators were checked for positive lag-1 serial correlation at the 5 % level using the autocorrelation function (ACF) on detrended series. The linear trend used to detrend the original time series was estimated using the robust Theil–Sen estimator also used for characterising trend magnitude.
Block bootstrapping (BBS) was used to overcome the presence of serial correlation and involves application of the MK Z statistic to block resampled series that preserve any short-term autocorrelation structure. Following guidance from Önöz and Bayazit (2012) regarding the optimal block length given the sample size and magnitude of the temporal autocorrelation coefficient, a block length of 4 years was chosen and applied only when a series had statistically significant serial correlation – this occurred for 7055 of the 231 245 single-station series analysed. In these cases, a robust estimate of the significance of the MK Z statistic was generated from a distribution of 10 000 resamples where the null hypothesis of no trend is rejected when the MK Z values calculated from original data are higher than the 9750th largest (statistically significant increasing trend) or lower than the 250th smallest (statistically significant decreasing trend) MK Z value from the resampled distribution under a two-tailed test at the 5 % level (Murphy et al., 2013).
A2 Multi-temporal analysis
In addition to the fixed-period trend analysis using a dense network of observed river flows in all NRFA catchments, a multi-temporal trend analysis was also conducted following the methods set out in Hannaford et al. (2013) using historical river flow and SSI reconstructions since 1891 (Barker et al., 2019) for nine example catchments. Multi-temporal trend analyses are useful in providing additional context for the consistency of trends over long multi-decadal timescales and help place short-term, fixed-period trends in a wider context. The SSI for the river flow reconstructions was calculated by fitting the river flow reconstructions using the Tweedie distribution as described above. Hydrological drought characteristics were extracted from the SSI-3 time series for each catchment using the same approach as outlined in Table A1. The MK Z statistic was calculated for each hydrological drought indicator and for every possible combination of start and end years over the entire river flow reconstruction period (1891–2015). A minimum window length of 27 years was chosen given the focus on interdecadal variability and the recognition that trend analyses are less robust and reliable for short time windows. The SSI calculated from river flow reconstructions across the UK is available from the EIDC (https://doi.org/10.5285/58ef13a9-539f-46e5-88ad-c89274191ff9, Barker et al., 2018).
A3 Analysis of climate–streamflow relationships
To identify remote teleconnections from large-scale climate drivers influencing UK droughts, we assess both concurrent and lagged relationships between the UK Standardised Streamflow Index (SSI) and global sea surface temperatures (SSTs). This approach accounts for long-term climate variability and helps establish robust relationships, aligning with the methodologies of Svensson and Hannaford (2019). This analysis is used to identify remote climate drivers beyond the North Atlantic that significantly influence UK droughts.
Our analysis utilises observed catchment-scale SSIs at 3-month accumulations from 850 catchments across the UK (Barker et al., 2022) and NOAA's Extended Reconstructed SSTs, version 5 (Huang et al., 2017).
Streamflow catchment characteristics in the UK vary regionally, and so we applied k-means clustering on 3-monthly accumulated SSI data to identify regions with similar streamflow patterns. Our analysis revealed three distinct regional clusters: the northwestern UK, a transition zone, and the southeastern UK (Fig. 7a). This regional differentiation in terms of SSI aligns with the streamflow clusters identified by Svensson and Hannaford (2019), where the northwestern catchments are characterised by a fast response to rainfall, while the southeastern catchments are groundwater-dominated, with delayed responses to rainfall.
We performed regressions of the area-averaged regional SSI time series for each of the three identified regions against the global SST dataset over the period of 1960 to 2020, evaluating both concurrent relationships (Fig. 7b–d) and those with a 6-month lag (Fig. 7e–g) at each grid point.
All observed river flow data used in this study are freely available in the UK National River Flow Archive (NRFA, 2025). The UK Benchmark Network is described in Harrigan et al. (2018), and a list is available at https://nrfa.ceh.ac.uk/benchmark-network (last access: 10 September 2025). The SSI calculated for observed river flows for the Low-Flow Benchmark Network and most NRFA catchments can be extracted from the UK Water Resources Portal (https://eip.ceh.ac.uk/hydrology/water-resources/ (last access: 10 September 2025).
The reconstructed river flow data created by Smith et al. (2019) are available in Smith et al. (2018): https://doi.org/10.5285/f710bed1-e564-47bf-b82c-4c2a2fe2810e. The Standardised Streamflow Indices based on the reconstructions are available in Barker et al. (2018): https://doi.org/10.5285/58ef13a9-539f-46e5-88ad-c89274191ff9.
NOAA's Extended Reconstructed SSTs, version 5 (https://doi.org/10.7289/V5T72FNM, Huang et al., 2017; https://psl.noaa.gov/data/gridded/data.noaa.ersst.v5.html, NOAA, 2025).
The codes used in the extended analysis are available from the authors on request. The codes for the trend analysis conducted here are available in the ROBIN library on GitHub: https://github.com/NERC-CEH/ROBIN_pipeline (https://doi.org/10.5281/zenodo.16900796, Griffin et al., 2025).
The supplement related to this article is available online at https://doi.org/10.5194/hess-29-4371-2025-supplement.
JH secured the funding, led the study and prepared the paper. ST, AC and WC carried out the extended analysis and created the figures. SA commissioned the original review. All of the authors shaped the direction of the review and contributed to the paper.
The contact author has declared that none of the authors has any competing interests.
Publisher’s note: Copernicus Publications remains neutral with regard to jurisdictional claims made in the text, published maps, institutional affiliations, or any other geographical representation in this paper. While Copernicus Publications makes every effort to include appropriate place names, the final responsibility lies with the authors.
This article is part of the special issue “Drought, society, and ecosystems (NHESS/BG/GC/HESS inter-journal SI)”. It is not associated with a conference.
We acknowledge the Environment Agency for stimulating the original review, commissioned as part of a series of studies reviewing the state of our knowledge on UK drought: https://www.gov.uk/government/publications/review-of-the-research-and-scientific-understanding-of-drought (last access: 18 August 2025).
We thank the authors of other chapters, who provided feedback on earlier versions of the review, particularly Rob Wilby and Gemma Coxon.
The original version of this review was commissioned by the Environment Agency under award no. SC220020. Additional funding to support the extended research and writing-up of this review was provided by (1) the UK National Hydrological Monitoring Programme (supported by NERC through the UKCEH National Capability for UK Challenges Programme under grant no. NE/Y006208/1), (2) CANARI (grant no. NE/W004984/1) and (3) the Co-Centre for Climate + Biodiversity + Water Programme (grant no. 22/CC/11103) managed by Science Foundation Ireland (SFI), Northern Ireland's Department of Agriculture, Environment and Rural Affairs (DAERA) and UK Research and Innovation (UKRI; grant no. NE/Y006496/1).
This paper was edited by Elena Toth and reviewed by Samuel Jonson Sutanto and one anonymous referee.
Abid, M. A., Kucharski, F., Molteni, F., and Almazroui, M.: Predictability of Indian Ocean precipitation and its North Atlantic teleconnections during early winter, npj Clim. Atmos. Sci., 6, 17, https://doi.org/10.1038/s41612-023-00328-z, 2023.
Bachmair, S., Stahl, K., Collins, K., Hannaford, J., Acreman, M., Svoboda, M., Knutson, C., Smith, K. H., Wall, N., Fuchs, B., Crossman, N. D., and Overton, I. C.: Drought indicators revisited: the need for a wider consideration of environment and society, WIREs Water, 3, 516–536, https://doi.org/10.1002/wat2.1154, 2016.
Barker, L. J., Hannaford, J., Chiverton, A., and Svensson, C.: From meteorological to hydrological drought using standardised indicators, Hydrol. Earth Syst. Sci., 20, 2483–2505, https://doi.org/10.5194/hess-20-2483-2016, 2016.
Barker, L. J., Smith, K. A., Svensson, C., Tanguy, M., and Hannaford, J.: Historic Standardised Streamflow Index (SSI) using Tweedie distribution with standard period 1961–2010 for 303 UK catchments (1891–2015), NERC Environmental Information Data Centre [data set], https://doi.org/10.5285/58ef13a9-539f-46e5-88ad-c89274191ff9, 2018.
Barker, L. J., Hannaford, J., Parry, S., Smith, K. A., Tanguy, M., and Prudhomme, C.: Historic hydrological droughts 1891–2015: systematic characterisation for a diverse set of catchments across the UK, Hydrol. Earth Syst. Sci., 23, 4583–4602, https://doi.org/10.5194/hess-23-4583-2019, 2019.
Barker, L. J., Fry, M., Hannaford, J., Nash, G., Tanguy, M., and Swain, O.: Dynamic High Resolution Hydrological Status Monitoring in Real-Time: The UK Water Resources Portal, Front. Environ. Sci., 10, https://doi.org/10.3389/fenvs.2022.752201, 2022.
Barker, L. J., Hannaford, J., Magee, E., Turner, S., Sefton, C., Parry, S., Evans, J., Szczykulska, M., and Haxton, T.: An appraisal of the severity of the 2022 drought and its impacts, Weather, 79, 208–219, https://doi.org/10.1002/wea.4531, 2024.
Bell, V., Rameshwaran, P., Davies, H., Baron, H., Keller, V., and Hannaford, J.: Hydrological modelling and artificial influences: performance assessment and future scenarios, Climate Services for a Net Zero Resilient World (CS-N0W) report, UKCEH, https://environment.data.gov.uk/future-water/portal/modelling (last access: 18 August 2025), 2023.
Bevan, J.: Drought risk in the Anthropocene: from the jaws of death to the waters of life, Philos. T. Roy. Soc. A, 380, 20220003, https://doi.org/10.1098/rsta.2022.0003, 2022.
Bloomfield, J. P., Gong, M., Marchant, B. P., Coxon, G., and Addor, N.: How is Baseflow Index (BFI) impacted by water resource management practices?, Hydrol. Earth Syst. Sci., 25, 5355–5379, https://doi.org/10.5194/hess-25-5355-2021, 2021.
Blyth, E. M., Martínez-de la Torre, A., and Robinson, E. L.: Trends in evapotranspiration and its drivers in Great Britain: 1961 to 2015, Prog. Phys. Geog., 43, 666–693, https://doi.org/10.1177/0309133319841891, 2019.
Bradford, R. B. and Marsh, T. J.: Defining a network of benchmark catchments for the UK, P. I. Civil Eng.-Water, 156, 109–116, https://doi.org/10.1680/wame.2003.156.2.109, 2003.
Bryan, K., Ward, S., Barr, S., and Butler, D.: Coping with drought: perceptions, intentions and decision-stages of South West England Households, Water Resour. Manag., 33, 1185–1202, https://doi.org/10.1007/s11269-018-2175-2, 2019.
Burn, D. H., Hannaford, J., Hodgkins, G. A., Whitfield, P. H., Thorne, R., and Marsh, T.: Reference hydrologic networks II. Using reference hydrologic networks to assess climate-driven changes in streamflow, Hydrolog. Sci. J, 57, 1580–1593, https://doi.org/10.1080/02626667.2012.728705, 2012.
Buechel, M., Slater, L., and Dadson, S.: Hydrological impact of widespread afforestation in Great Britain using a large ensemble of modelled scenarios, Commun. Earth Environ., 3, 6, https://doi.org/10.1038/s43247-021-00334-0, 2022.
CaBa (Catchment-Based Approach) partnership: Chalk Stream restoration strategy 2021, https://catchmentbasedapproach.org/learn/chalk-stream-strategy/ (last access: 18 August 2025), 2021.
Cassou, C., Terray, L., Hurrell, J. W., and Deser, C.: North Atlantic Winter Climate Regimes: Spatial Asymmetry, Stationarity with Time, and Oceanic Forcing, J. Climate, 17, 1055–1068, https://doi.org/10.1175/1520-0442(2004)017<1055:NAWCRS>2.0.CO;2, 2004.
Chan, W. C. H., Arnell, N. W., Darch, G., Facer-Childs, K., Shepherd, T. G., Tanguy, M., and van der Wiel, K.: Current and future risk of unprecedented hydrological droughts in Great Britain, J. Hydrol., 625, 130074, https://doi.org/10.1016/j.jhydrol.2023.130074, 2023.
Chan, W. C. H., Arnell, N. W., Darch, G., Facer-Childs, K., Shepherd, T. G., and Tanguy, M.: Added value of seasonal hindcasts to create UK hydrological drought storylines, Nat. Hazards Earth Syst. Sci., 24, 1065–1078, https://doi.org/10.5194/nhess-24-1065-2024, 2024.
Chan, W., Tanguy, M., Chevuturi, A., and Hannaford, J.: Climate variability conceals emerging hydrological trends across Great Britain, J. Hydrol., 660, 133414, https://doi.org/10.1016/j.jhydrol.2025.133414, 2025.
Chiang, F., Mazdiyasni, O., and AghaKouchak, A.: Evidence of anthropogenic impacts on global drought frequency, duration, and intensity, Nat. Commun., 12, 2754, https://doi.org/10.1038/s41467-021-22314-w, 2021.
Clayton, H. J., Morris, S. E., McIntyre, N. R., and Greaves, M.: The hydrological impact of low-flow alleviation measures, P. I. Civil Eng.-Water, 161, 171–180, https://doi.org/10.1680/wama.2008.161.4.171, 2008.
Counsell, C. and Durant, M.: Water supply – observed and projected, in: Environment Agency, 2023, Review of the research and scientific understanding of drought, Annex, Environment Agency, Bristol, 669 pp., https://www.gov.uk/government/publications/review-of-the-research-and-scientific-understanding-of-drought (last access: 18 August 2025), 2023.
Coxon, G., Addor, N., Bloomfield, J. P., Freer, J., Fry, M., Hannaford, J., Howden, N. J. K., Lane, R., Lewis, M., Robinson, E. L., Wagener, T., and Woods, R.: CAMELS-GB: hydrometeorological time series and landscape attributes for 671 catchments in Great Britain, Earth Syst. Sci. Data, 12, 2459–2483, https://doi.org/10.5194/essd-12-2459-2020, 2020.
Coxon, G., MacMillan, H., Bloomfield, J., Bolotin, L., Dean, J.F., Kelleher, C., Slater, L., and Zheng, Y.: Wastewater discharges and urban land cover dominate urban hydrology signals across England and Wales, Environ. Res. Lett., 19, 084016, https://doi.org/10.1088/1748-9326/ad5bf2, 2024.
Dadson, S. J., Hall, J. W., Murgatroyd, A., Acreman, M., Bates, P., Beven, K., Heathwaite, L., Holden, J., Holman, I. P., Lane, S. N., O'Connell, E., Penning-Rowsell, E., Reynard, N., Sear, D., Thorne, C., and Wilby, R.: A restatement of the natural science evidence concerning catchment-based “natural” flood management in the UK, P. Roy. Soc. A, 473, 20160706, https://doi.org/10.1098/rspa.2016.0706, 2017.
Dayrell, C., Svensson, C., Hannaford, J., McEnery, T., Barker, L. J., Baker, H., and Tanguy, M.: Representation of drought events in the UK: contrasting 200 years of news texts and rainfall records, Front. Environ. Sci., 10, 760147, https://doi.org/10.3389/fenvs.2022.760147, 2022.
Deser, C. and Phillips, A. S.: A range of outcomes: the combined effects of internal variability and anthropogenic forcing on regional climate trends over Europe, Nonlin. Processes Geophys., 30, 63–84, https://doi.org/10.5194/npg-30-63-2023, 2023.
Devers, A., Vidal, J.-P., Lauvernet, C., Vannier, O., and Caillouet, L.: 140-year daily ensemble streamflow reconstructions over 661 catchments in France, Hydrol. Earth Syst. Sci., 28, 3457–3474, https://doi.org/10.5194/hess-28-3457-2024, 2024.
Dixon, H., Hannaford, J., and Fry, M. J.: The effective management of national hydrometric data: experiences from the United Kingdom, Hydrolog. Sci. J., 58, 1383–1399, https://doi.org/10.1080/02626667.2013.787486, 2013.
Dudley, R. W., Hirsch, R. M., Archfield, S. A., Blum, A. G., and Renard, B.: Low streamflow trends at human-impacted and reference basins in the United States, J. Hydrol., 580, 124254, https://doi.org/10.1016/j.jhydrol.2019.124254, 2020.
Durant, M. J. and Counsell, C. J.: Inventory of reservoirs amounting to 90% of total UK storage, NERC Environmental Information Data Centre, https://doi.org/10.5285/f5a7d56c-cea0-4f00-b159-c3788a3b2b38, 2018.
Faranda, D., Pascale, S., and Bulut, B.: Persistent anticyclonic conditions and climate change exacerbated the exceptional 2022 European-Mediterranean drought, Environ. Res. Lett., 18, 034030, https://doi.org/10.1088/1748-9326/acbc37, 2023.
Ficklin, D. L., Abatzoglou, J. T., Robeson, S. M., Null, S. E., and Knouft, J. H.: Natural and managed watersheds show similar responses to recent climate change, P. Natl. Acad. Sci. USA, 115, 8553–8557, https://doi.org/10.1073/pnas.1801026115, 2018.
Folland, C. K., Hannaford, J., Bloomfield, J. P., Kendon, M., Svensson, C., Marchant, B. P., Prior, J., and Wallace, E.: Multi-annual droughts in the English Lowlands: a review of their characteristics and climate drivers in the winter half-year, Hydrol. Earth Syst. Sci., 19, 2353–2375, https://doi.org/10.5194/hess-19-2353-2015, 2015.
Garner, G., Hannah, D., and Watts, G: Climate change and water in the UK: Recent scientific evidence for past and future change, Prog. Phys. Geog., 41, 2, 154–170, https://doi.org/10.1177/0309133316679082, 2017.
Griffin, A., Hannaford, J., and Turner, S.: NERC-CEH/ROBIN_pipeline: ROBIN hydrometric data processing v1.0, Zenodo [code], https://doi.org/10.5281/zenodo.16900796, 2025.
Gudmundsson, L., Boulange, J., Do, H. X., Gosling, S. N., Grillakis, M. G., Koutroulis, A. G., Leonard, M., Liu, J., Müller Schmied, H., Papadimitriou, L., Pokhrel, Y., Seneviratne, S. I., Satoh, Y., Thiery, W., Westra, S., Zhang, X., and Zhao, F.: Globally observed trends in mean and extreme river flow attributed to climate change, Science, 371, 1159–1162, https://doi.org/10.1126/science.aba3996, 2021.
Hammond, J. C., Simeone, C., Hecht,J. S., Hodgkins, G. A., Lombard, M., McCabe, G., Wolock, D., Wieczorek, M., Olson, C., Caldwell, T., Dudley, R., and Price, A. N.: Going beyond low flows: Streamflow drought deficit and duration illuminate distinct spatiotemporal drought patterns and trends in the U.S. during the last century, Water Resour. Res., 58, e2022WR031930, https://doi.org/10.1029/2022WR031930, 2022.
Han, S., Slater, L., Wilby, R. L., and Faulkner, D.: Contribution of urbanisation to non-stationary river flow in the UK, J. Hydrol., 613, 128417, https://doi.org/10.1016/j.jhydrol.2022.128417, 2022.
Hannaford, J.: Climate-driven changes in UK river flows: A review of the evidence, Prog. Phys. Geog., 39, 29–48, https://doi.org/10.1177/0309133314536755, 2015.
Hannaford, J. and Buys, G.: Trends in seasonal river flow regimes in the UK, J. Hydrol., 475, 158–174, https://doi.org/10.1016/j.jhydrol.2012.09.044, 2012.
Hannaford, J. and Marsh, T.: An assessment of trends in UK runoff and low flows using a network of undisturbed catchments, Int. J. Climatol., 26, 1237–1253, https://doi.org/10.1002/joc.1303, 2006.
Hannaford, J., Lloyd-Hughes, B., Keef, C., Parry, S., and Prudhomme, C.: Examining the large-scale spatial coherence of European drought using regional indicators of precipitation and streamflow deficit, Hydrol. Process., 25, 1146–1162, https://doi.org/10.1002/hyp.7725, 2011.
Hannaford, J., Buys, G., Stahl, K., and Tallaksen, L. M.: The influence of decadal-scale variability on trends in long European streamflow records, Hydrol. Earth Syst. Sci., 17, 2717–2733, https://doi.org/10.5194/hess-17-2717-2013, 2013.
Hannaford, J., Mastrantonas, N., Vesuviano, G., and Turner, S.: An updated national-scale assessment of trends in UK peak river flow data: how robust are observed increases in flooding?, Hydrol. Res., 52, 699–718, https://doi.org/10.2166/nh.2021.156, 2021.
Hannaford, J., Barker, L. J., Turner, S., Tanguy, M., Chevuturi, A., and Parry, S.: River flow (hydrological) drought, in: Review of the research and scientific understanding of drought, Annex, Environment Agency, Bristol, 669 pp., https://www.gov.uk/government/publications/review-of-the-research-and-scientific-understanding-of-drought (last access: 18 August 2025), 2023.
Harrigan, S., Murphy, C., Hall, J., Wilby, R. L., and Sweeney, J.: Attribution of detected changes in streamflow using multiple working hypotheses, Hydrol. Earth Syst. Sci., 18, 1935–1952, https://doi.org/10.5194/hess-18-1935-2014, 2014.
Harrigan, S., Hannaford, J., Muchan, K., and Marsh, T. J.: Designation and trend analysis of the updated UK Benchmark Network of river flow stations: the UKBN2 dataset, Hydrol. Res., 49, 552–567, https://doi.org/10.2166/nh.2017.058, 2018.
Hawkins, E., Burt, S., McCarthy, M., Murphy, C., Ross, C., Baldock, M., Brazier, J., Hersee, G., Huntley, J., Meats, R., O'Grady, J., Scrimgeour, I., and Silk, T.: Millions of historical monthly rainfall observations taken in the UK and Ireland rescued by citizen scientists, Geosci. Data J., 10, 246–261, https://doi.org/10.1002/gdj3.157, 2022.
Hodgkins, G. A., Renard, B., Whitfield, P. H., Laaha, G., Stahl, K., Hannaford, J., Burn, D. H., Westra, S., Fleig, A. K., Araujo Lopes, W. T., Murphy, C., Mediero, L., and Hanel, M.: Climate driven trends in historical extreme low streamflows on four continents, Water Resour. Res., 60, e2022WR034326, https://doi.org/10.1029/2022WR034326, 2024.
Hu, S. and Fedorov, A. V.: Indian Ocean warming can strengthen the Atlantic meridional overturning circulation, Nat. Clim. Change, 9, 747–751, https://doi.org/10.1038/s41558-019-0566-x, 2019.
Hu, S. and Fedorov, A. V.: Indian Ocean warming as a driver of the North Atlantic warming hole, Nat. Commun., 11, 4785, https://doi.org/10.1038/s41467-020-18522-5, 2020.
Huang, B., Thorne, P. W., Banzon, V. F., Boyer, T., Chepurin, G., Lawrimore, J. H., Menne, M. J., Smith, T. M., Vose, R. S., and Zhang, H. M.: NOAA Extended Reconstructed Sea Surface Temperature (ERSST), Version 5, NOAA National Centers for Environmental Information, https://doi.org/10.7289/V5T72FNM, 2017.
IPCC: Climate Change 2023: Synthesis Report, Contribution of Working Groups I, II and III to the Sixth Assessment Report of the Intergovernmental Panel on Climate Change, edited by: Core Writing Team, Lee, H., and Romero, J., IPCC, Geneva, Switzerland, 35–115, https://doi.org/10.59327/IPCC/AR6-9789291691647, 2023.
Jones, P. D.: Riverflow reconstruction from precipitation data, J. Climatol., 4, 171–186, https://doi.org/10.1002/joc.3370040206, 1984.
Jones, P. D. and Lister, D. H.: Riverflow reconstructions for 15 catchments over England and Wales and an assessment of hydrologic drought since 1865, Int. J. Climatol., 18, 999–1013, https://doi.org/10.1002/(SICI)1097-0088(199807)18:9<999::AID-JOC300>3.0.CO;2-8, 1998.
Jones, P. D., Lister, D. H., Wilby, R. L., and Kostopoulou, E.: Extended riverflow reconstructions for England and Wales, 1865-2002, Int. J. Climatol., 26, 219–231, https://doi.org/10.1002/joc.1252, 2006.
Kalu, I., Ndehedehe, C., Okwuashi, O., Eyoh, A., and Ferriera, V.: Identifying impacts of global climate teleconnection patterns on land water storage using machine learning, J. Hydrol. Reg. Stud. 46, 101346, https://doi.org/10.1016/j.ejrh.2023.101346, 2023.
Kay, A. L., Dunstone, N., Kay, G., Bell, V. A., and Hannaford, J.: Demonstrating the use of UNSEEN climate data for hydrological applications: case studies for extreme floods and droughts in England, Nat. Hazards Earth Syst. Sci., 24, 2953–2970, https://doi.org/10.5194/nhess-24-2953-2024, 2024.
Kelder, T., Heinrich, D., Klok, L., Thompson, V., Goulart, H. M. D., Hawkins, E., Slater, L. J., Suarez-Gutierrez, L., Wilby, R. L., Coughlan de Perez, E., Stephens, E. M., Burt, S., van den Hurk, B., de Vries, H., van der Wiel, K., Schipper, E. L. F., Baez, A. C., van Bueren, E., and Fischer, E. M.: How to stop being surprised by unprecedented weather, Nat. Commun. 16, 2382, https://doi.org/10.1038/s41467-025-57450-0, 2025.
Kendon, M., Marsh, T., and Parry, S.: The 2010–2012 drought in England and Wales, Weather, 68, 88–95, https://doi.org/10.1002/wea.2101, 2013.
Kendon, M., McCarthy, M., Jevrejeva, S., Matthews, A., Sparks, T., and Garforth, J.: State of the UK Climate 2021, Int. J. Climatol., 41, 1–76, https://doi.org/10.1002/joc.7787, 2022.
Kretschmer, M., Adams, S., Arribas, A., Prudden, R., Robinson, N., Saggioro, E. and Shepherd, T.: Quantifying causal pathways of teleconnections, B. Am. Meteoror. Soc., 102, E2247–E2263, https://doi.org/10.1175/BAMS-D-20-0117.1, 2021.
Laizé, C. L. R. and Hannah, D. M.: Modification of climate–river flow associations by basin properties, J. Hydrol., 389, 186–204, https://doi.org/10.1016/j.jhydrol.2010.05.048, 2010.
Lane, R. and Kay, A.: Modelling climate change impacts on UK hydrological drought: a review, in: Environment Agency, 2023, Review of the research and scientific understanding of drought, Annex, Environment Agency, Bristol, 669 pp., https://www.gov.uk/government/publications/review-of-the-research-and-scientific-understanding-of-drought (last access: 18 August 2025), 2023.
Lee, R. W., Woolnough, S. J., Charlton-Perez, A. J., and Vitart, F.: ENSO Modulation of MJO Teleconnections to the North Atlantic and Europe, Geophys. Res. Lett., 46, 13535–13545, https://doi.org/10.1029/2019GL084683, 2019.
Lennard, A. T., Macdonald, N., Clark, S., and Hooke, J. M.: The application of a drought reconstruction in water resource management, Hydrol. Res. 47, 646–659, https://doi.org/10.2166/nh.2015.090, 2015.
Li, Y. and Lau, N. C.: Impact of ENSO on the Atmospheric Variability over the North Atlantic in Late Winter – Role of Transient Eddies, J. Climate, 25, 320–342, https://doi.org/10.1175/JCLI-D-11-00037.1, 2012.
Loader, N. J., Young, G. H, F., McCarroll, D., Davies, D., Miles, D., and Bronk-Ramsey, C.: Summer precipitation for the England and Wales region, 1201–2000 CE from stable oxygen isotopes in oak tree rings, J. Quarternary Sci., 36, 731–736, https://doi.org/10.1002/jqs.3226, 2020.
Madonna, E., Li, C., and Wettstein, J. J.: Suppressed eddy driving during southward excursions of the North Atlantic jet on synoptic to seasonal time scales, Atmos. Sci. Lett., 20, e937, https://doi.org/10.1002/asl.937, 2019.
Marsh, T., Cole, G., and Wilby, R.: Major droughts in England and Wales, 1800–2006, Weather, 62, 87–93, https://doi.org/10.1002/wea.67, 2007.
Marston, C. G., O'Neil, A. W., Morton, R. D., Wood, C. M., and Rowland, C. S.: LCM2021 – the UK Land Cover Map 2021, Earth Syst. Sci. Data, 15, 4631–4649, https://doi.org/10.5194/essd-15-4631-2023, 2023.
Masseroni, D., Camici, S., Cislaghi, A., Vacchiano, G., Massari, C., and Brocca, L.: The 63-year changes in annual streamflow volumes across Europe with a focus on the Mediterranean basin, Hydrol. Earth Syst. Sci., 25, 5589–5601, https://doi.org/10.5194/hess-25-5589-2021, 2021.
McEwen, L., Bryan, K., Black., A., Blake, J., and Afzal, M.: Science-Narrative Explorations of “Drought Thresholds” in the Maritime Eden Catchment, Scotland: Implications for Local Drought Risk Management, Front. Environ. Sci., 9, 589980, https://doi.org/10.3389/fenvs.2021.589980, 2021.
Merz, B., Vorogushyn, S., Uhlemann, S., Delgado, J., and Hundecha, Y.: HESS Opinions ”More efforts and scientific rigour are needed to attribute trends in flood time series”, Hydrol. Earth Syst. Sci., 16, 1379–1387, https://doi.org/10.5194/hess-16-1379-2012, 2012.
Met Office: UK Regional Climates, https://www.metoffice.gov.uk/research/climate/maps-and-data/regional-climates/index, last access: 23 April 2025.
Mezzina, B., Garcia-Serrano, J., Blade, I., and Kucharski, F.: Dynamics of the ENSO Teleconnection and NAO Variability in the North Atlantic–European Late Winter, J. Climate, 33, 907–923, https://doi.org/10.1175/JCLI-D-19-0192.1, 2020.
Murphy, C., Harrigan, S., Hall, J., and Wilby, R.: Climate-driven trends in mean and high flows from a network of reference stations in Ireland, Hydrolog. Sci. J., 58, 755–772, https://doi.org/10.1080/02626667.2013.782407, 2013.
Noguera, I., Hannaford, J., and Tanguy, M.: Distribution, trends, and drivers of flash droughts in the United Kingdom, Hydrol. Earth Syst. Sci., 29, 1295–1317, https://doi.org/10.5194/hess-29-1295-2025, 2025.
NOAA: NOAA Extended Reconstructed SST V5, NOAA [data set], https://psl.noaa.gov/data/gridded/data.noaa.ersst.v5.html, last access: 18 August 2025.
NRFA: National River Flow Archive [data set], https://nrfa.ceh.ac.uk/, last access: 18 August 2025.
O’Connell, P. E., Ewen, J., O’Donnell, G., and Quinn, P.: Is there a link between agricultural land-use management and flooding?, Hydrol. Earth Syst. Sci., 11, 96–107, https://doi.org/10.5194/hess-11-96-2007, 2007.
O'Connor, P., Murphy, C., Matthews, T., and Wilby, R. L.: Reconstructed monthly river flows for Irish catchments 1766-2016, Geosci. Data J., 8, 34–54, https://doi.org/10.1002/gdj3.107, 2021.
Önöz, B. and Bayazit, M.: Block bootstrap for Mann-Kendall trend test of serially independent data, Hydrol. Process., 26, 3552–3560, 2012.
Parry, S., Mackay, J. D., Chitson, T., Hannaford, J., Magee, E., Tanguy, M., Bell, V. A., Facer-Childs, K., Kay, A., Lane, R., Moore, R. J., Turner, S., and Wallbank, J.: Divergent future drought projections in UK river flows and groundwater levels, Hydrol. Earth Syst. Sci., 28, 417–440, https://doi.org/10.5194/hess-28-417-2024, 2024.
Peña-Angulo, D., Vicente-Serrano, S. M., Domínguez-Castro, F., Lorenzo-Lacruz, J., Murphy, C., Hannaford, J., Allan, R. P., Tramblay, Y., Reig-Gracia, F., and el Kenawy, A.: The Complex and Spatially Diverse Patterns of Hydrological Droughts Across Europe, Water Resour. Res., 58, e2022WR031976, https://doi.org/10.1029/2022WR031976, 2022.
Piniewski, M., Eini, M. R., Chattopadhyay, S., Okruszko, T., and Kundzewicz, Z. W.: Is there a coherence in observed and projected changes in riverine low flow indices across Central Europe?, Earth Sci. Rev., 233, 104187, https://doi.org/10.1016/j.earscirev.2022.104187, 2022.
Pribyl, K. and Cornes, R. C.: Droughts in medieval and early modern England, part 1: The evidence, Weather, 75, 168–172, https://doi.org/10.1002/wea.3599, 2020.
Prosdocimi, I., Stewart, E. J., and Vesuviano, G.: A depth–duration–frequency analysis for short-duration rainfall events in England and Wales, Hydrol. Res., 48, 1624–1638, https://doi.org/10.2166/nh.2017.140, 2017.
Rameshwaran, P., Bell, V., Brown, M. J., Davies, H., Kay, A. L., Rudd, A. C., and Sefton, C.: Use of Abstraction and Discharge Data to Improve the Performance of a National-Scale Hydrological Model, Water Resour. Res., 58, e2021WR029787, https://doi.org/10.1029/2021WR029787, 2021.
Rameshwaran, P., Bell, V. A., Davies, H. N., Sadler, P., Beverton, A., Thornton, R., and Rhodes-Smith, M.: Gridded actual groundwater, surface water and tidal water abstraction, discharge and Hands-off Flow datasets for England (1999 to 2014), NERC EDS Centre for Environmental Data Analysis, https://doi.org/10.5285/18886f95ba84447f997efac96df456ad, 2025.
Rivers Trust: Drought and water scarcity are getting worse, https://theriverstrust.org/key-issues/drought (last access: 18 August 2025), 2023.
Robinson, M., Rodda, J. C., and Sutcliffe, J.: Long-term environmental monitoring in the UK: origins and achievements of the Plynlimon catchment study, T. I. Brit. Geogr., 38, 451–463, https://doi.org/10.1111/j.1475-5661.2012.00534.x, 2013.
Rudd, A. C., Bell, V. A., and Kay, A. L.: National-scale analysis of simulated hydrological droughts (1891–2015), J. Hydrol., 550, 368–385, https://doi.org/10.1016/j.jhydrol.2017.05.018, 2017.
Rust, W., Bloomfield, J. P., Cuthbert, M., Corstanje, R., and Holman, I.: The importance of non-stationary multiannual periodicities in the North Atlantic Oscillation index for forecasting water resource drought, Hydrol. Earth Syst. Sci., 26, 2449–2467, https://doi.org/10.5194/hess-26-2449-2022, 2022.
Salwey, S., Coxon, G., Pianosi, F., Singer, M. B., and Hutton, C.: National-scale detection of reservoir impacts through hydrological signatures, Water Resour. Res., 59, e2022WR033893, https://doi.org/10.1029/2022WR033893, 2023.
Schaller, N., Kay, A. L., Lamb, R., Massey, N. R., van Oldenborgh, G. J., Otto, F. E. L., Sparrow, S. N., Vautard, R., Yiou, P., Ashpole, I., Bowery, A., Crooks, S. M., Haustein, K., Huntingford, C., Ingram, W. J., Jones, R. G., Legg, T., Miller, J., Skeggs, J., Wallom, D., Weisheimer, A., Wilson, S., Stoff, P. A., and Allen, M. R.: Human influence on climate in the 2014 southern England winter floods and their impacts, Nat. Clim. Change, 6, 627–634, https://doi.org/10.1038/nclimate2927, 2016.
Shaw, T. A., Arias, P. A., Collins, M., Coumou, D., Diedhiou, A., Garfinkel, C. I., Jain, S., Roxy, M. K., Kretschmer, M., Leung, L. R., Narsey, S., Martius, O., Seager, R., Shepherd, T. G., Sörensson, A. A., Stephenson, T., Taylor, M., and Wang, L.: Regional climate change: consensus, discrepancies, and ways forward, Front. Clim., 6, https://doi.org/10.3389/fclim.2024.1391634, 2024.
Slater, L., Coxon, G., Brunner, M., McMillan, H., Yu. L, Zhang, Y., Khouakhi. A., Moulds, S., and Berghuijs, W.: Spatial sensitivity of river flooding to changes in climate and land cover through explainable AI, Earths Future, 12, 2023EF004035, https://doi.org/10.1029/2023EF004035, 2024.
Slater, L. J., Anderson, B., Buechel, M., Dadson, S., Han, S., Harrigan, S., Kelder, T., Kowal, K., Lees, T., Matthews, T., Murphy, C., and Wilby, R. L.: Nonstationary weather and water extremes: a review of methods for their detection, attribution, and management, Hydrol. Earth Syst. Sci., 25, 3897–3935, https://doi.org/10.5194/hess-25-3897-2021, 2021.
Smith, K. A., Tanguy, M., Hannaford, J., and Prudhomme, C.: Historic reconstructions of daily river flow for 303 UK catchments (1891–2015), NERC Environmental Information Data Centre [data set], https://doi.org/10.5285/f710bed1-e564-47bf-b82c-4c2a2fe2810e, 2018.
Smith, K. A., Barker, L. J., Tanguy, M., Parry, S., Harrigan, S., Legg, T. P., Prudhomme, C., and Hannaford, J.: A multi-objective ensemble approach to hydrological modelling in the UK: an application to historic drought reconstruction, Hydrol. Earth Syst. Sci., 23, 3247–3268, https://doi.org/10.5194/hess-23-3247-2019, 2019.
Spraggs, G., Peaver, L., Jones, P., and Ede, P.: Re-construction of historic drought in the Anglian Region (UK) over the period 1798–2010 and the implications for water resources and drought management, J. Hydrol., 526, 231–252, https://doi.org/10.1016/j.jhydrol.2015.01.015, 2015.
Stagge, J. H., Rosenberg, D. E., DeRose, R. J., and Rittenour, T. M: Monthly paleostreamflow reconstruction from annual tree-ring chronologies, J. Hydrol., 557, 791–804, https://doi.org/10.1016/j.jhydrol.2017.12.057, 2018.
Stahl, K., Hisdal, H., Hannaford, J., Tallaksen, L. M., van Lanen, H. A. J., Sauquet, E., Demuth, S., Fendekova, M., and Jódar, J.: Streamflow trends in Europe: evidence from a dataset of near-natural catchments, Hydrol. Earth Syst. Sci., 14, 2367–2382, https://doi.org/10.5194/hess-14-2367-2010, 2010.
Stahl, K., Tallaksen, L. M., Hannaford, J., and van Lanen, H. A. J.: Filling the white space on maps of European runoff trends: estimates from a multi-model ensemble, Hydrol. Earth Syst. Sci., 16, 2035–2047, https://doi.org/10.5194/hess-16-2035-2012, 2012.
Stratford, C., Miller, J., House, A., Old, G., Acreman, M., Duenas-Lopez, M. A., Nisbet, T., Burgess-Gamble, L., Chappell, N., and Clarke, S.: Do trees in UK-relevant river catchments influence fluvial flood peaks?: a systematic review, Centre for Ecology and Hydrology, Wallingford, UK, https://nora.nerc.ac.uk/id/eprint/517804/ (last access: last access: 18 August 2025), 2017.
Svensson, C. and Hannaford, J.: Oceanic conditions associated with Euro-Atlantic high pressure and UK drought, Environ. Res. Commun., 1, 101001, https://doi.org/10.1088/2515-7620/ab42f7, 2019.
Svensson, C., Hannaford, J., and Prosdocimi, I.: Statistical distributions for monthly aggregations of precipitation and river flow in drought indicator applications, Water Resour. Res., 53, 999–1018, 2019.
Tanguy, M., Prudhomme, C., Smith, K., and Hannaford, J.: Historical gridded reconstruction of potential evapotranspiration for the UK, Earth Syst. Sci. Data, 10, 951–968, https://doi.org/10.5194/essd-10-951-2018, 2018.
Tanguy, M., Magee, E., Hannaford, J., Bell, V., Rameshwaran, P., Baron, H., Keller, V., and Barker, L.: Analysis on future scenarios – D2: Future water availability for water intensive energy infrastructure, Climate Services for a Net Zero Resilient World (CS-N0W) report, UKCEH, https://www.gov.uk/government/publications/future-water-resources (last access: 18 August 2025), 2023.
Tijdeman, E., Hannaford, J., and Stahl, K.: Human influences on streamflow drought characteristics in England and Wales, Hydrol. Earth Syst. Sci., 22, 1051–1064, https://doi.org/10.5194/hess-22-1051-2018, 2018a.
Tijdeman, E., Barker, L. J., Svoboda, M. D., and Stahl, K.: Natural and human influences on the link between meteorological and hydrological drought indices for a large set of catchments in the contiguous United States, Water Resour. Res., 54, 6005–6023, https://doi.org/10.1029/2017WR022412, 2018b.
Trascasa-Castro, P., Maycock, A. C., Yiu, Y. Y. S., and Fletcher, J.: On the Linearity of the Stratospheric and Euro-Atlantic Sector Response to ENSO, J. Climate, 32, 6607–6626, https://doi.org/10.1175/JCLI-D-18-0746.1, 2019.
Turner, S., Barker, L. J., Hannaford, J., Muchan, K., Parry, S., and Sefton, C.: The 2018/2019 drought in the UK: a hydrological appraisal, Weather, 76, 248–253, https://doi.org/10.1002/WEA.4003, 2021.
van Loon, A. F.: Hydrological drought explained, WIREs Water, 2, 359–392, https://doi.org/10.1002/wat2.1085, 2015.
van Loon, A. F., Gleeson, T., Clark, J., van Dijk, A. I. J. M., Stahl, K., Hannaford, J., di Baldassarre, G., Teuling, A. J., Tallaksen, L. M., Uijlenhoet, R., Hannah, D. M., Sheffield, J., Svoboda, M., Verbeiren, B., Wagener, T., Rangecroft, S., Wanders, N., and van Lanen, H. A. J.: Drought in the Anthropocene, Nat. Geosci., 9, 89–91, https://doi.org/10.1038/ngeo2646, 2016.
Van Loon, A. F., Rangecroft, S., Coxon, G., Breña Naranjo, J. A., Van Ogtrop, F., and Van Lanen, H. A. J.: Using paired catchments to quantify the human influence on hydrological droughts, Hydrol. Earth Syst. Sci., 23, 1725–1739, https://doi.org/10.5194/hess-23-1725-2019, 2019.
van Loon, A. F., Rangecroft, S., Coxon, G., Werner, M., Wanders, N., di Baldassarre, G., Tijdeman, E., Bosman, M., Gleeson, T., Nauditt, A., Aghakouchak, A., Breña-Naranjo, J. A., Cenobio-Cruz, O., Costa, A. C., Fendekova, M., Jewitt, G., Kingston, D. G., Loft, J., Mager, S. M., Mallakpour, I., Masih, I., Maureira-Cortés, H., Toth, E., Van Oel, P., Van Ogtrop, F., Verbist, K., Vidal, J-P., Wen, L., Yu, M., Yuan, X., Zhang M., and van Lanen, H. A. J.: Streamflow droughts aggravated by human activities despite management, Environ. Res. Lett., 17, 044059, https://doi.org/10.1088/1748-9326/ac5def, 2022.
Van Meerveld, I. and Seibert, J.: Reforestation effects on low flows: Review of public perceptions and scientific evidence, WIRES Water, 12, e1760, https://doi.org/10.1002/wat2.1760, 2025.
Vicente-Serrano, S., Pena-Angulo, Beguaria, S., Dominguez-Castro, F., Tomas-Burgeura. M., Noguera, I., Gimeo-Sotelo, L., and el Kenawy, A.: Global drought trends and future projections, Philos. T. Roy. Soc. A, 380, 20210285, https://doi.org/10.1098/rsta.2021.0285, 2022.
Vicente-Serrano, S. M., Peña-Gallardo, M., Hannaford, J., Murphy, C., Lorenzo-Lacruz, J., Dominguez-Castro, F., López-Moreno, J. I., Beguería, S., Noguera-Corral, I., Harrigan, S., and Vidal, J. P.: Climate, irrigation and land-cover change explain streamflow trends in Western Europe, Geophys. Res. Lett., 46, 10821–10833, https://doi.org/10.1029/2019GL084084, 2019.
Watts, G., Battarbee, R. W., Bloomfield, J. P., Crossman, J., Daccache, A., Durance, I., Elliott, J. A., Garner, G., Hannaford, J., Hannah, D. M., Hess, T., Jackson, C. R., Kay, A. L., Kernan, M., Knox, J., Mackay, J., Monteith, D. T., Ormerod, S. J., Rance, J., Stuart, M. E., Wade, A. J., Wade, S. J., Weatherhead, K., Whitehead, P. G., and Wilby, R. L.: Climate change and water in the UK – past changes and future prospects. Prog. Phys. Geog., 39, 6–28, https://doi.org/10.1177/0309133314542957, 2015.
West, H., Quinn, N., and Horswell, M.: The influence of the North Atlantic oscillation and East Atlantic pattern on drought in British catchments, Front. Environ. Sci., 10, 754597, https://doi.org/10.3389/fenvs.2022.754597, 2022a.
West, H., Quinn, N., and Horswell, M.: Spatio-temporal propagation of North Atlantic Oscillation (NAO) rainfall deviations to streamflow in British catchments, Hydrol. Sci. J., 67, 676–688, https://doi.org/10.1080/02626667.2022.2038791, 2022b.
Wilby, R. L.: When and where might climate change be detectable in UK river flows?, Geophys. Res. Lett., 33, L19407, https://doi.org/10.1029/2006GL027552, 2006.
Wilby, R. L., Beven, K. J., and Reynard, N. S.: Climate change and fluvial flood risk in the UK: more of the same?, Hydrol. Process., 22, 2511–2523, https://doi.org/10.1002/hyp.6847, 2008.
Wilby, R. L., Clifford, N. J., de Luca, P., Harrigan, S., Hillier, J. K., Hodgkins, R., Johnson, M. F., Matthews, T. K. R., Murphy, C., Noone, S. J., Parry, S., Prudhomme, C., Rice, S. P., Slater, L. J., Smith, K. A., and Wood, P. J.: The “dirty dozen” of freshwater science: detecting then reconciling hydrological data biases and errors, WIREs Water, 4, e1209, https://doi.org/10.1002/wat2.1209, 2017.
Wilhite, D. A. and Glantz, M. H.: Understanding: the drought phenomenon: the role of definitions, Water Int., 10, 111–120, https://doi.org/10.1080/02508068508686328, 1985.
World Meteorological Organization (WMO) and Global Water Partnership (GWP): Integrated Drought Management Programme Handbook of Drought Indicators and Indices, edited by: Svoboda, M. and Fuchs, B. A., Integrated Drought Management Programme, http://www.droughtmanagement.info (last access: 18 August 2025), 2016.
- Abstract
- Introduction
- Have hydrological droughts become more severe in observational records?
- Historical hydrological droughts – a long view using reconstructions
- Drivers of change in hydrological drought – climate factors
- Drivers of change in hydrological drought – human factors
- Discussion and recommendations for future directions
- Appendix A: Methodology for extended analyses
- Code and data availability
- Author contributions
- Competing interests
- Disclaimer
- Special issue statement
- Acknowledgements
- Financial support
- Review statement
- References
- Supplement