the Creative Commons Attribution 4.0 License.
the Creative Commons Attribution 4.0 License.
 | 15 Sep 2025
Global assessment of socio-economic drought events at the subnational scale: a comparative analysis of combined versus single drought indicators
Sneha Kulkarni
Yohei Sawada
Yared Bayissa
Brian Wardlow
The accurate assessment of the propagation of drought hazards to socio-economic impacts poses a significant challenge and is still less explored. To address this, we analysed a subnational disaster dataset called Geocoded Disaster (GDIS) and evaluated the skills of multiple drought indices to pinpoint global drought areas identified by GDIS. For the comparative analysis, a widely used standardised precipitation index (SPI), normalised difference vegetation index (NDVI), standardised soil moisture index (SSMI), and standardised temperature index (STI) were globally computed at the subnational level for the period 2001–2021. Out of 1641 drought events recorded in GDIS, NDVI identified 1541 (93.9 %), SPI 1458 (88.8 %), STI 1439 (87.7 %), and SSMI 1376 (83.9 %). NDVI showed better performance in highly vegetated areas due to its sensitivity to precipitation and soil moisture and its inverse relationship with temperature.
Recognising the limitations of single-input drought indices in capturing the complex propagation of droughts, we also introduced a novel combined drought indicator (CDI), which integrates meteorological (rainfall and temperature) and agricultural (NDVI and soil moisture) anomalies using a weighted approach to identify droughts and plays a key role in minimising inaccuracies in drought assessment. CDI successfully identified 1550 (94.5 %) of the GDIS documented drought events, outperforming all individual indices. Based on CDI, the highest frequency of severe droughts (greater than seven events) was observed in sub-Saharan Africa and South Asia. It also captured persistent droughts in Argentina, Brazil, the Horn of Africa, western India, and North China – areas that are highly vulnerable to socio-economic droughts. Our findings highlight the importance of using CDI for improved identification of socio-economic drought events and for prioritising regions at greater risk.
- Article
(17321 KB) - Full-text XML
- BibTeX
- EndNote


Droughts are a complex phenomenon and have profound, long-lasting impacts on various sectors, including agriculture, water resources, industry, energy, and socio-economic conditions. For instance, in August 2021, a severe drought event affected 52 % of crop yields in the western United States, and in June 2019, Chennai, India, declared “day zero” due to almost no water remaining in all main reservoirs (Hossain et al., 2022). Climate projections indicate a future trend of increased frequency and severity in drought occurrences worldwide, amplifying their impacts on various sectors (Vicente-Serrano et al., 2022). These examples emphasise the urgent need for enhanced drought preparedness mechanisms and accurate drought impact assessment techniques in the coming years. When addressing drought assessment, one of the major challenges is understanding the exact propagation of drought hazard (meteorological/agricultural or hydrological) to its socio-economic repercussions.
Droughts do not have a specific, universally accepted definition. They are defined based on their association with different sectors and unique characteristics. Based on drought types and sectors, a number of drought assessment techniques and indices have been used worldwide to quantify and monitor drought conditions. To assess meteorological droughts, several indices such as the standardised precipitation index (SPI) (McKee et al., 1993), standardised precipitation evaporation index (SPEI) (Vicente-Serrano et al., 2010), and temperature condition index (TCI) (Kogan, 1995) have been extensively used. The World Meteorological Organization (WMO) recommends (Svoboda et al., 2012) SPI, which is widely used in many regions. For example, SPI has been used to assess droughts in Greece, the United Kingdom, Iran, India, and China by Bhunia et al. (2020), Blain et al. (2022), Kazemzadeh et al. (2022), Livada and Assimakopoulos (2007), and Zhang et al. (2012), respectively. SPEI has been incorporated in drought projection studies across the United Kingdom (Reyniers et al., 2023), the United States (Costanza et al., 2023), and globally (Vicente-Serrano et al., 2022), indicating an increase in severe drought events in these areas in the upcoming years. To assess agricultural droughts, the standardised soil moisture index (SSMI), vegetation condition index (VCI), normalised difference vegetation index (NDVI), and vegetation health index (VHI) have been widely recognised as effective indicators. Ding et al. (2022), Sandeep et al. (2021), and Tao et al. (2021) used the NDVI-based drought indices to perform detailed assessments of vegetation health and vigour in Australia, India, and China, respectively. Grillakis (2019) applied SSMI to reveal a significant rise in drought severity across Europe in recent years. Liu et al. (2022) investigated soil moisture dynamics in East Africa using a space-time perspective to identify the underlying causes of drought. Through a novel ecohydrological reanalysis, Sawada (2018) quantified the drought propagation from soil moisture to vegetation across the globe, highlighting that deeper soil layers exhibit delayed recovery from stressful conditions compared to shallow layers. To assess hydrological droughts and their impact on water resources and ecosystems, commonly used metrics include the standardised streamflow index (SSI), reservoir storage index (RSI), and standardised runoff index (SRI). To understand surface water security, Mishra (2020) examined long-term trends in hydrological droughts across India using SRI. Forootan et al. (2019) conducted a global assessment of hydrological droughts, highlighting the strong regional impact of the North Atlantic Oscillation and Indian Ocean Dipole.
The studies mentioned above provided drought indicators that were based primarily on a single input variable or were sector-specific (either meteorological, agricultural, or hydrological). However, some works suggested that drought is a much more complex and multiphase phenomenon, resulting from various factors rather than just a single variable (Jiao et al., 2019; Kulkarni and Gedam, 2018; Sepulcre-Canto et al., 2012). Hence, to understand droughts more accurately, the integration of multiple variables is needed, and it has a higher potential than single-variable-based traditional drought indices. This integrated approach can provide a more comprehensive understanding of droughts, considering the relationships between various contributing factors and the resulting impacts across different sectors. Recognising the significance of combining multiple variables in drought monitoring, Svoboda et al. (2002) developed a drought monitoring system (U.S. Drought Monitor) for the United States, which has been extensively used for regular practices in the United States. More recently, the near-real-time vegetation drought response index (VegDRI) was developed and implemented in South Korea (Nam et al., 2018) and the United States (Brown et al., 2008), demonstrating more detailed and improved spatial drought patterns compared to multi-variable-based drought indicators. This VegDRI was developed by integrating eight climatic and biophysical datasets (SPI, NDVI Palmer drought severity index, performance of average seasonal greenness, start of seasonal anomalies, soil availability water capacity, irrigated agriculture, and ecological regions). In 2023, Guillory et al. (2023) developed the Australian Drought Monitor, integrating SPI, NDVI, soil moisture, and evapotranspiration, which has become a valuable tool in Queensland's official drought declaration process. Bayissa et al. (2019), Huang et al. (2019), Kulkarni et al. (2020), and Sepulcre-Canto et al. (2012) have developed and tested combined drought indicators (CDIs), demonstrating higher accuracy over Ethiopia, India, China, and Europe, respectively.
Droughts have significant socio-economic impacts, including crop losses, food insecurity, income reduction, water shortages, and displacement. The severity of these effects varies by region, depending on development level, infrastructure, and adaptive capacity. In high-income areas, systems like irrigation and insurance help reduce impacts, while in low-income regions, even moderate droughts can trigger crises (Brooks et al., 2005; Pak-Uthai and Faysse, 2018). Recent studies (Kulkarni et al., 2023; Panwar and Sen, 2020; Udmale et al., 2014) highlight the importance of incorporating socio-economic vulnerability into drought assessments. However, the direct link between drought hazards and their socio-economic repercussions remains underexplored, partly due to the limited availability of reliable global impact data. Earlier efforts, such as the U.S. Drought Impact Reporter (National Drought Mitigation Centre, 2025), the European Drought Impact Report Inventory (European Drought Centre, 2025), which monitors drought impacts, and the European Drought Observatory (European Environment Agency, 2025), which monitors agricultural drought conditions, provides region-specific insights, but does not extend to global coverage.
Recently, the Geocoded Disaster (GDIS) dataset was developed based on EM-DAT, offering geocoded disaster locations at a subnational level (Rosvold and Buhaug, 2021), along with detailed data on affected populations, fatalities, and economic losses. By addressing the limitations of EM-DAT, the GDIS dataset provides detailed information on socio-economically affected areas and administrative units in GIS polygon format. This spatially explicit dataset enables analysis of drought impacts across diverse socio-economic contexts. In this paper, we used this newly developed GDIS dataset and show that it enables us to explore the less-understood link between drought hazards and their socio-economic repercussions more accurately and comprehensively.
Despite many works on single-variable and multi-variable drought indicators, very few have investigated how useful these indices are in globally exploring the links between drought hazards and their socio-economic repercussions. In this study, we globally apply four commonly used drought indicators, i.e. SPI, standardised temperature index (STI), NDVI, and SSMI, and compare these four traditional indices with GDIS to evaluate how well they represent the socio-economic impacts of droughts. Then, inspired by the successful regional examples of a combined drought indicator (CDI), we also develop a new CDI on a global scale using two meteorological (rainfall and temperature) and two agricultural (soil moisture and NDVI) variables. To the best of our knowledge, very few studies (Hao et al., 2014a; Sánchez et al., 2018; Wang and Sun, 2023) have considered a global scale for their combined drought indicators, and none have compared and demonstrated the superior capability of such indicators over single-parameter-based traditional indices in global drought assessment. In addition, no studies have assessed the skill of drought indicators in identifying subnational socio-economic impacts globally, although the subnational disaster dataset (i.e. GDIS) recently made it possible. In the present paper, we address the following key points.
-
Understanding the link between global drought hazards and their socio-economic impacts at the subnational scale using GDIS data.
-
Developing a new global combined drought indicator to enhance the precision and reliability of drought assessment (agro-climatological as well as socio-economic) and assessing its performance in detecting GDIS drought events.
-
Checking the performance of the commonly used traditional drought indicators (SPI, STI, NDVI, and SSMI) in identifying subnational socio-economic impacts of droughts (i.e. their association with GDIS).
To achieve the stated objectives, our study is structured into three main components. Initially, we conduct an analysis of global GDIS data to identify and select drought events at the subnational level. Later, a new global CDI is developed, and its performance in identifying GDIS events is assessed. Following this, we evaluate the effectiveness of four single-variable-based traditional indicators (SPI, SSMI, STI, and NDVI) in detecting the GDIS events compared to CDI. As a result, our research produces a comprehensive global framework for assessing drought impact, integrating agro-climatology hazard data with socio-economic impacts. This framework offers potential benefits for drought-prone regions worldwide, facilitating improved drought management strategies and informed policy and decision-making processes.
We used global observation and simulation data of rainfall, temperature, soil moisture, and NDVI to provide various drought indicators. These datasets were sourced from a combination of satellites and models and cover the time span from 2001 to 2021 on a monthly temporal scale. All the datasets had varying spatial resolutions. To address this disparity, we applied an inverse distance weighted (IDW) method and rescaled all the datasets to a consistent resolution of 0.10° × 0.10°. All datasets were selected based on factors such as long-term data availability, accessibility, reliability, high spatial resolution, and overall data accessibility. To explore the linkage between drought indicators and socio-economic impacts, we used subnational disaster data. The subsequent paragraphs provide a detailed description of each dataset used in the study, and Table 1 outlines the respective sources of acquisition.
2.1 Rainfall
The monthly rainfall data were obtained from the Climate Hazards Group Infrared Precipitation with Station (CHIRPS) data, developed by the U.S. Geological Survey (Climate Hazards Center – U.C. Santa Barbara, 2023). We chose CHIRPS due to its high accuracy with station data, fine spatial resolution (0.05° × 0.05°), and extensive temporal coverage from 1981 to the present.
2.2 Temperature
To understand the contribution of temperature to drought, the ERA5-Land temperature dataset (European Centre for Medium-Range Weather Forecasts, 2023) was used in this study. The average monthly gridded dataset was downloaded from the Copernicus Climate Data Store for the study period 2001 to 2021. The original spatial resolution was 0.1 × 0.1°.
2.3 Soil moisture
We used the ERA5-Land soil moisture dataset (European Centre for Medium-Range Weather Forecasts, 2023) acquired from the Copernicus Climate Data Store for the study period from 2001 to 2021. The monthly data products, with a spatial resolution of 0.1 × 0.1°, were used for the study. The soil moisture datasets were available for different soil depth levels: first (0–7 cm), second (7–28 cm), third (28–100 cm), and fourth (100–289 cm). For our analysis, we used the first three layers (0–100 cm) to represent root-zone soil moisture, which is widely recognised in the literature (Bolten et al., 2010; Sawada, 2018; Sehgal et al., 2017) as critical for agricultural drought monitoring. To obtain a single representative value for soil moisture in the top 1 m, we employed a weighted averaging method using the respective thicknesses of the first three layers. The resulting weighted root-zone soil moisture layer was then standardised (e.g. using z scores) and integrated into the CDI framework along with other drought-relevant indicators.
2.4 NDVI
NDVI serves as a significant indicator of vegetation stress levels. We used monthly NDVI data products from the Moderate Resolution Imaging Spectroradiometer (MODIS) (Didan and Huete, 2023) spanning from 2001 to 2021. These data were obtained at a spatial resolution of 1 km, which we resampled to 0.1 × 0.1° to align with other data sources for a comprehensive assessment. The MODIS NDVI dataset was used due to its global coverage and high temporal resolution, making it essential for monitoring vegetation health, facilitating timely detection, and assessing drought conditions worldwide.
2.5 GDIS/EM-DAT
The Geocoded Disaster (GDIS) dataset is a global geocoded dataset distributed by SEDAC (NASA) that links disaster events to specific administrative boundaries (Rosvold and Buhaug, 2021). It builds upon the EM-DAT database by adding spatial GIS information, providing polygons for subnational regions affected by specific disaster events. Each event is tagged with the type of hazard (e.g. drought, flood, cyclone), the time period, and the affected regions at the subnational level. In this study, only drought events were extracted from GDIS for the years 2001 to 2021. The EM-DAT records a natural disaster when it meets any of the following conditions: involves 10 or more fatalities, impacts 100 or more individuals, or prompts a declaration of a state of emergency along with a request for international aid.
The use of GDIS, instead of relying solely on EM-DAT, adds spatial specificity and improves the ability to evaluate drought impacts in different regions, especially in developing countries where vulnerability is high. However, it is worth noting that GDIS coverage is not globally uniform and may be affected by underreporting in certain regions.
To identify any drought events from EM-DAT datasets, their event identifier (disaster number) information was extracted. In EM-DAT, disaster events are uniquely distinguished by the combination of an eight-digit disaster code and a three-digit country code, whereas GDIS employs only the eight-digit disaster code. Considering this common ground, GDIS drought events were short-listed. In our study period, from 2001 to 2021, a total of 2142 GDIS-based drought events were identified. Because GDIS lacks drought start and end information, the exact yearly start and end information was acquired from EM-DAT. In some cases (143 events out of 2142, ∼ 6.7 %), due to the unavailability of monthly details in EM-DAT, we assumed January as the starting month and December as the end month of the respective event, and further analysis was carried out.
Table 1Details of the datasets used for this study.
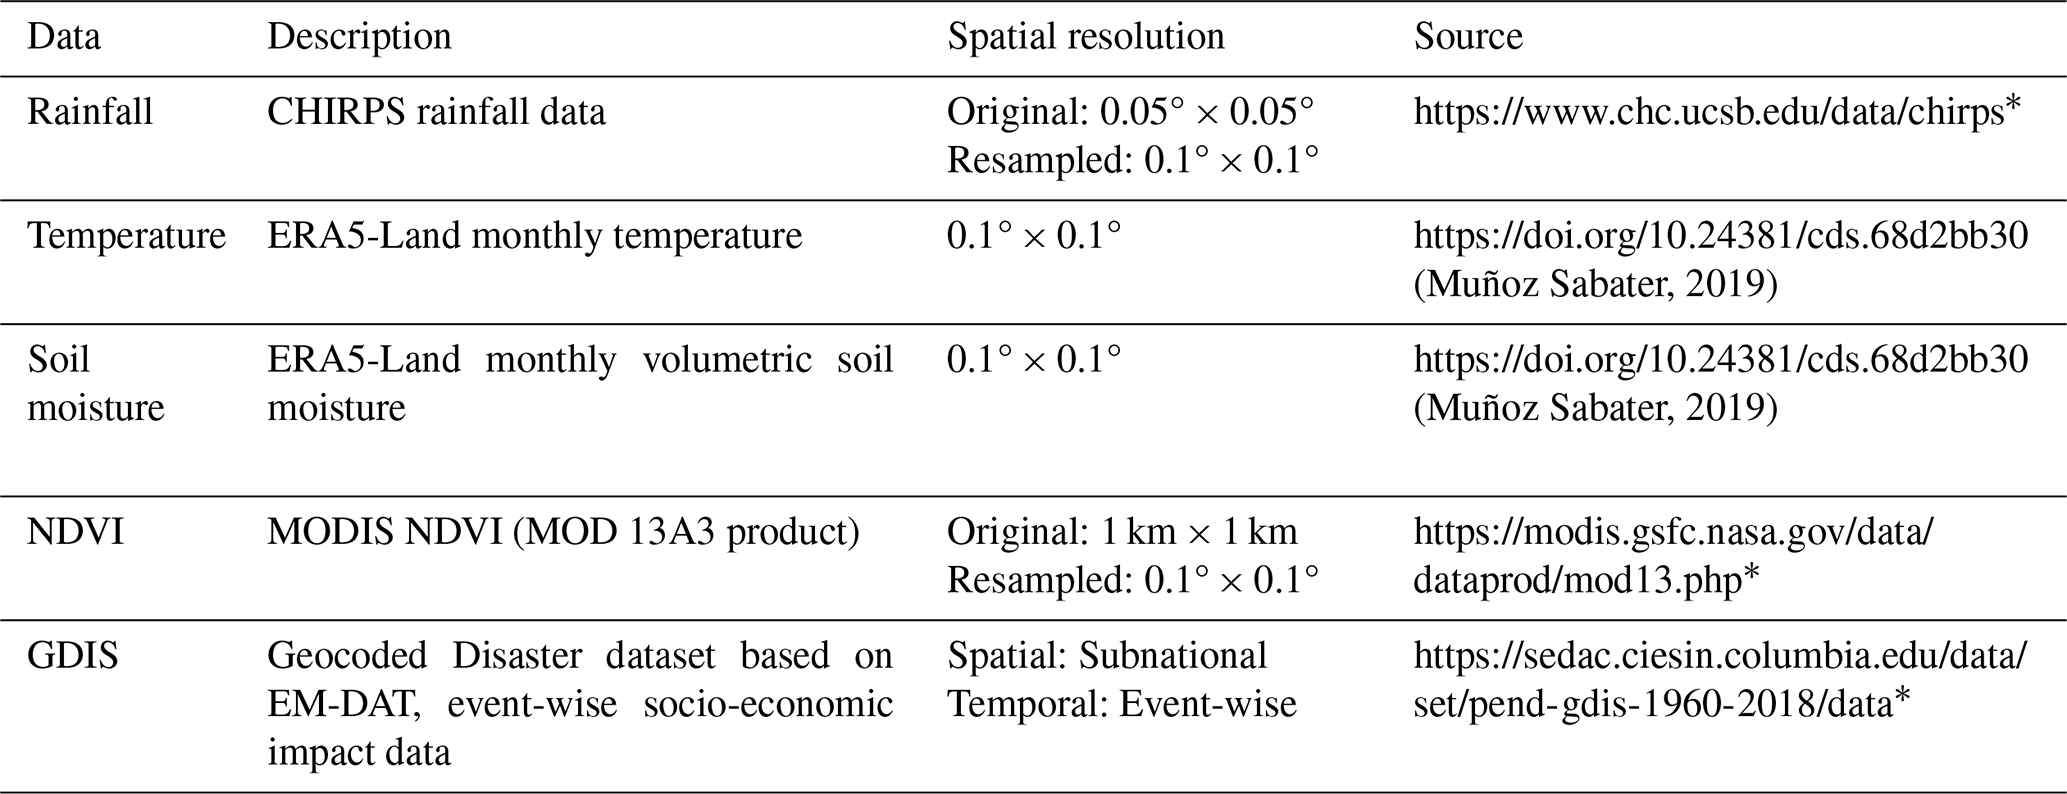
* Last access: 11 September 2025
3.1 Conventional single-variable-based drought indices
To understand the performance of drought indices in identifying GDIS drought events, we first employed four commonly used individual variable-based traditional drought indices. These included the rainfall-based SPI (computed using “SPEI” and “raster” packages from R statistical software), temperature-based STI, soil moisture-SSMI, and vegetation-stress-related NDVI. Drought assessments were conducted for all these indices on a monthly scale for the period from 2001 to 2021. Here, we incorporated the standardisation method (z-score statistics) during index computation of SSMI, STI, and NDVI to facilitate comparative analysis and noted similarities and differences between the results in identifying GDIS events. z-score values were computed using the following method:
where X= a specific value of a parameter within the set, μ= the long-term mean, and σ= the long-term standard deviation.
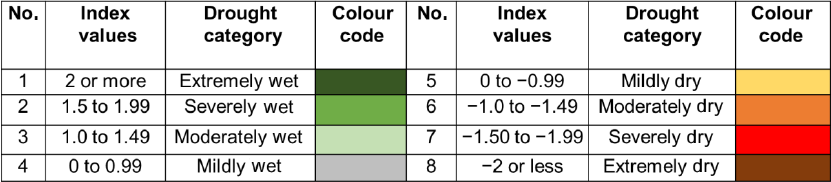
Further, the results for all four indices were classified and categorised, as shown in Table 2. The drought categories applied in this study follow the widely used SPI classification, originally developed by McKee et al. (1993). Values ranging from 0 to −2 or less (negative anomalies) indicate drought conditions, representing mildly dry to extremely dry situations. Conversely, values ranging from 0 to 2 or greater (positive anomalies) depict mildly wet to extremely wet conditions, respectively. In this study, a 1-month accumulation period was used for SPI, STI, and SSMI to capture short-term drought dynamics. This timescale is sensitive to rapid changes in agro-climatic conditions and supports early-stage drought detection. It also aligns with the monthly resolution of GDIS data, enabling accurate event-level analysis. The choice enhances consistency between drought indicators and the event database.
Table 2Drought categories and specific class values used to evaluate the drought indices.
3.2 Combined drought indicator
Various studies have suggested that drought results from variations in multiple agro-climatological settings rather than just a single variable. The socio-economic repercussions of drought could occur due to combinations of multiple factors rather than a single one. Hence, in this study, we developed a new combined drought indicator to assess droughts by considering multiple agricultural and climatological variables. We then checked and compared its association with GDIS events in the method described in Sect. 3.3. The CDI was developed using two agricultural variables (soil moisture, NDVI) and two climatological variables (rainfall, temperature). The CDI was generated as the weighted average of four independent drought indices, as shown in Sect. 3.1. The principal component analysis (PCA) technique was used to assign weights to all four input indices. PCA has been widely used in atmospheric and hydrological studies to describe dominant patterns in multivariate data (Anon, 2002; Hannachi et al., 2007; Jackson, 1993). The PCA method was selected for constructing the CDI due to its ability to extract dominant patterns of variability across multiple input indices without requiring a dependent variable. This makes it particularly suitable for integrative assessments across diverse drought types and geographic regions. Compared to other commonly used weighting methods, such as the analytic hierarchy process (AHP), which relies on expert judgement (Saaty, 1980), or entropy weighting, which uses the diversity of information in data (Tang et al., 2023), PCA offers an objective, data-driven approach that reduces subjectivity. While regression-based methods have also been explored to link drought indicators with socio-economic impacts (Hao et al., 2014b), they typically require clearly defined response variables and may introduce model-based biases. In contrast, PCA generates uncorrelated components and assigns weights based on explained variance, enhancing reproducibility and generalisability in global-scale assessments.
In this study, the PCA technique was used to assign monthly weights to the four input indices: SPI, STI, SSMI, and NDVI. PCA is commonly used in environmental and climate studies to extract dominant patterns in multivariate datasets without requiring a dependent variable. In this study, PCA was conducted separately for each calendar month using time series data from 2001 to 2021, resulting in 21 observations per variable. Although the number of observations is relatively modest, it satisfies the commonly accepted subject-to-variable ratio of at least 5:1 for PCA (Jolliffe, 2002; Gorsuch, 2014), especially when the number of variables is low and the objective is dimensionality reduction. Through PCA, new orthogonal (independent of each other) variables, i.e. PCs, were constructed using linear combinations of the original indices without significant loss of information. The first principal component (PC1), which captures the highest variability in the input data, was selected for further analysis. In PCA, principal components are calculated to maximise the variance explained, and the total of the squared loadings (eigenvectors) equals 1. These squared loadings indicate each variable's contribution and were used to derive monthly weights for each input index. Using this approach, we generated 48 spatially weighted maps (12 months × 4 variables). The percentage weights obtained from PCA were then used to compute the CDI as follows:
where WtSPI, WtSTI, WtSSMI, and WtNDVI represent the weights for the ith month (January to December) for their respective parameters. These weights were multiplied by the individual index values for the jth year and ith month, and then all the values were added to obtain the CDI results for the ith month and jth year. Finally, all the CDI results were normalised for comparative analysis. This normalisation process was carried out using the following formula:
where CDI(i,j) represents the combined drought anomaly for the ith month and jth year and δ(i) denotes the standard deviation for the ith month across all years (2001 to 2021). The CDI results were shown using the same colour scheme and drought categories, as depicted in Table 2. Figure 1 illustrates the schematic flowchart outlining the process for computing PCA-based CDI.
In the later stage, the same process as that for individual indices (SPI, STI, SSMI, NDVI) outlined in Sect. 3.1 was followed to assess the association between CDI results and GDIS drought events. Similarities and differences observed by CDI in identifying GDIS events compared to SPI, STI, SSMI, and NDVI across various temporal scales and with different criteria were examined. Detailed explanations of these results are provided in the following section.
3.3 Evaluation of the drought indices by GDIS
We assessed the number of events among the short-listed GDIS drought events (see Sect. 2.5) that were detectable by each drought index. This analysis suggests how well each index detects socio-economic stress during droughts. This analysis was performed using ArcMap 10.8. The GDIS polygons were overlaid onto the gridded drought index (SPI, STI, SSMI, NDVI, and CDI) layers separately to extract spatial and temporal raster-based information for each drought event. A total of 2142 events recorded between 2001 and 2021 were analysed. Event-specific details such as location and start and end dates were obtained from the GDIS and EM-DAT databases. For each drought event, index values were extracted from the respective raster datasets based on the spatial extent (polygon) and duration of the event. For example, if a GDIS event occurred in Bihar, India, from March to December 2012, the relevant monthly raster values for SPI, STI, SSMI, NDVI, and CDI within the Bihar polygon during that period were extracted.
To align the gridded drought indices with the spatial scale of the GDIS events, we computed the monthly spatial average of each drought index over all grid cells within the corresponding event polygon. This process produced a single time series per index for each event. The resulting geodatabase tables were then analysed to assess whether the index values were consistent with the GDIS records. Following previous literature (McKee et al., 1993; Bayissa et al., 2019; Kulkarni et al., 2020), a threshold of was used to define moderate to extreme drought conditions (Table 2). A drought index was considered consistent with a GDIS event if the average value of the index within the event polygon was in any month during the event's duration. For instance, if the average STI value within the Bihar polygon fell below −1 in any month between March and December 2012, STI would be considered consistent with that GDIS event. To evaluate sensitivity, a secondary analysis was also conducted using a threshold of <0. In this case, if any monthly average value of an index was below 0 during the event, it was also marked as consistent. This two-threshold approach allowed for both conservative and more inclusive assessments of drought index performance against GDIS events. For clarity, a stepwise procedure of thresholding and spatial averaging is presented in Appendix A.
The occurrence of GDIS events (socio-economic repercussions) may not solely originate from conditions in a particular month but could also reflect agro-climatological stress conditions from the preceding 1, 2, or 3 months. Hence, we also analysed the GDIS events and their association with all five indices by adjusting the duration of event occurrences. We conducted additional analysis by extending the data extraction time frame for all five indices. For example, in Bihar, India, for the GDIS drought event from March to December 2012, we not only extracted index data for March to December 2012 but also for 1 month before the event (February), 2 months prior (January), and 3 months prior (December 2011) for SPI, STI, SSMI, NDVI, and CDI and checked if the index anomalies are consistent with GDIS or not in any of these durations.
Research suggests that the shorter-duration dry periods have significant importance for various socio-economic applications, such as water availability and energy sources in adjacent months (Christian et al., 2021, 2024; Mukherjee and Mishra, 2022). Hence, during the short-listing process of the 2142 GDIS drought events from the entire natural disaster dataset, the initial criteria were to consider all the events, including short droughts (droughts lasting more than 1 month or up to 2 months). Consequently, in the later stage of this research, to comprehend the importance and differences in the selection of timescales, the initial criteria were slightly adjusted. Instead of considering all events, only events lasting more than or equal to 2 months were examined. This criterion was established to mitigate the impact of short-term changes and biases in results caused by short droughts or smaller dry periods. After the implementation of these criteria, we got 1641 GDIS drought events.
To summarise, a comparative analysis of GDIS with all the conventional indices (SPI, STI, SSMI, and NDVI) and CDI was carried out based on (1) two types of drought events, i.e. those lasting greater than or equal to 2 months and all events, including those with shorter durations (i.e. less than 2 months). (2) During this process, four temporal data scales were considered: the actual event period, data from 1 month prior to the event, data from 2 months prior to the event, and data from 3 months prior to the event. (3) For all the indices, events were classified as drought if the values were below 0 (in the first case) and below −1 (in the second case); the remaining events were marked as non-drought events.
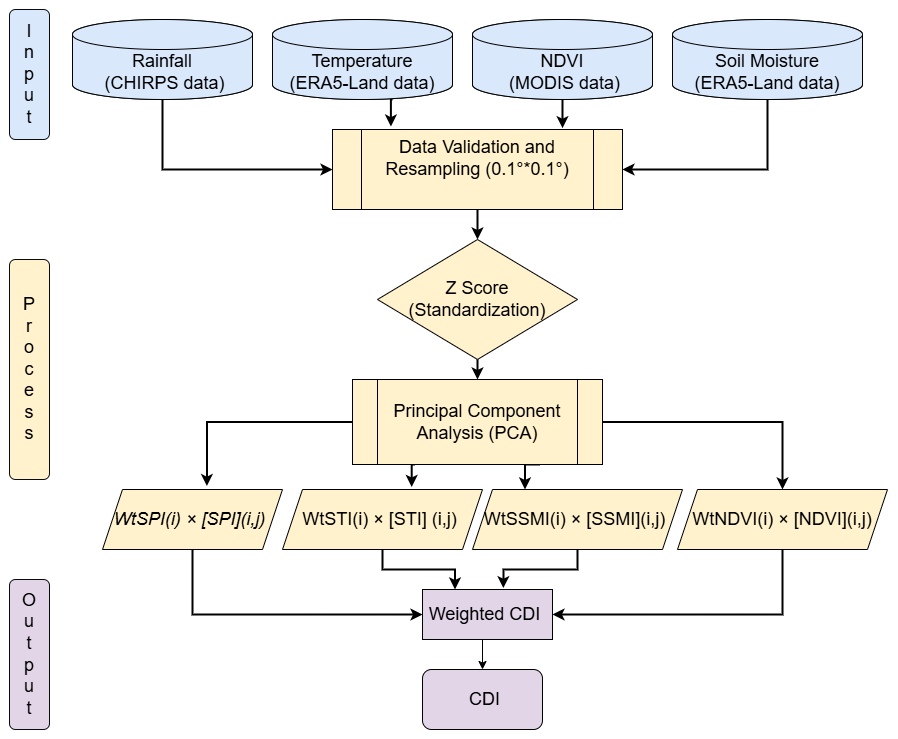
Figure 1The general flow of the method followed to compute CDI-based droughts. Here, i represents the month from January to December, and j indicates the years from 2001 to 2021.
4.1 Global drought frequency analysis by GDIS events
The GDIS dataset contains location data for 39 953 events globally, including various natural disasters such as extreme temperatures, floods, mass movements, storms, droughts, and earthquakes. Among these, 2142 events were explicitly identified and classified as drought events. Figure 2a illustrates the global spatial distribution of drought frequencies of all 2142 GDIS drought events. The highest numbers of these drought events were recorded in Africa (779; 36.37 %) and Asia (710; 33.15 %), followed by the Americas (477; 22.26 %), Europe (106; 4.95 %), and Oceania (70; 3.27 %). Analysing drought frequencies at a finer scale, Djibouti in Africa reported the highest frequency of GDIS drought events (eight occurrences), followed by Ethiopia and Kenya (seven occurrences each) and Somalia (six occurrences) (Fig. 2b). In the Americas, Bolivia recorded the highest number of GDIS drought events in South America, while Honduras had the highest frequency in Central America (seven occurrences). In North America, Kansas County in the United States documented the highest number of GDIS drought events (four occurrences), followed by California, Arizona, and Illinois, with three occurrences each (Fig. 2c). In Asia, the Nei Mongol administrative unit in China documented the highest frequency of GDIS drought events (seven occurrences). This is followed by several administrative units in Thailand, including Chaiyaphum, Loei, Nan, and Kalasin, which each recorded a high frequency of GDIS drought events (six occurrences), indicating a significant vulnerability to drought in these regions. Additional regions in China (such as Yunnan, Shanxi, and Hebei), India (Maharashtra and Andhra Pradesh), and Cambodia (Pursat and Kampong Speu) documented moderate GDIS drought frequencies (three to five occurrences) (Fig. 2d).
On the temporal scale, parts of Africa and South America experienced the highest extended drought events. The drought over Burundi, Africa, lasted continuously for 2 years from 2004 to 2006, whereas the drought in South America, over Honduras, lasted for around a year in 2009. Some of these events were very harshly socio-economically devastating. EM-DAT data showed that, in a major event in Africa, nearly 2 million people were affected, whereas in Thailand, around 3 million people faced the impacts of drought.
It is also noteworthy that areas with low population density, like western Australia or central and western Russia, did not experience any GDIS events. In contrast, higher population areas were more prone to GDIS events, making population density a key factor in socio-economic stress. Additionally, it was observed that areas with smaller spatial scales are less likely to experience GDIS events compared to larger areas.
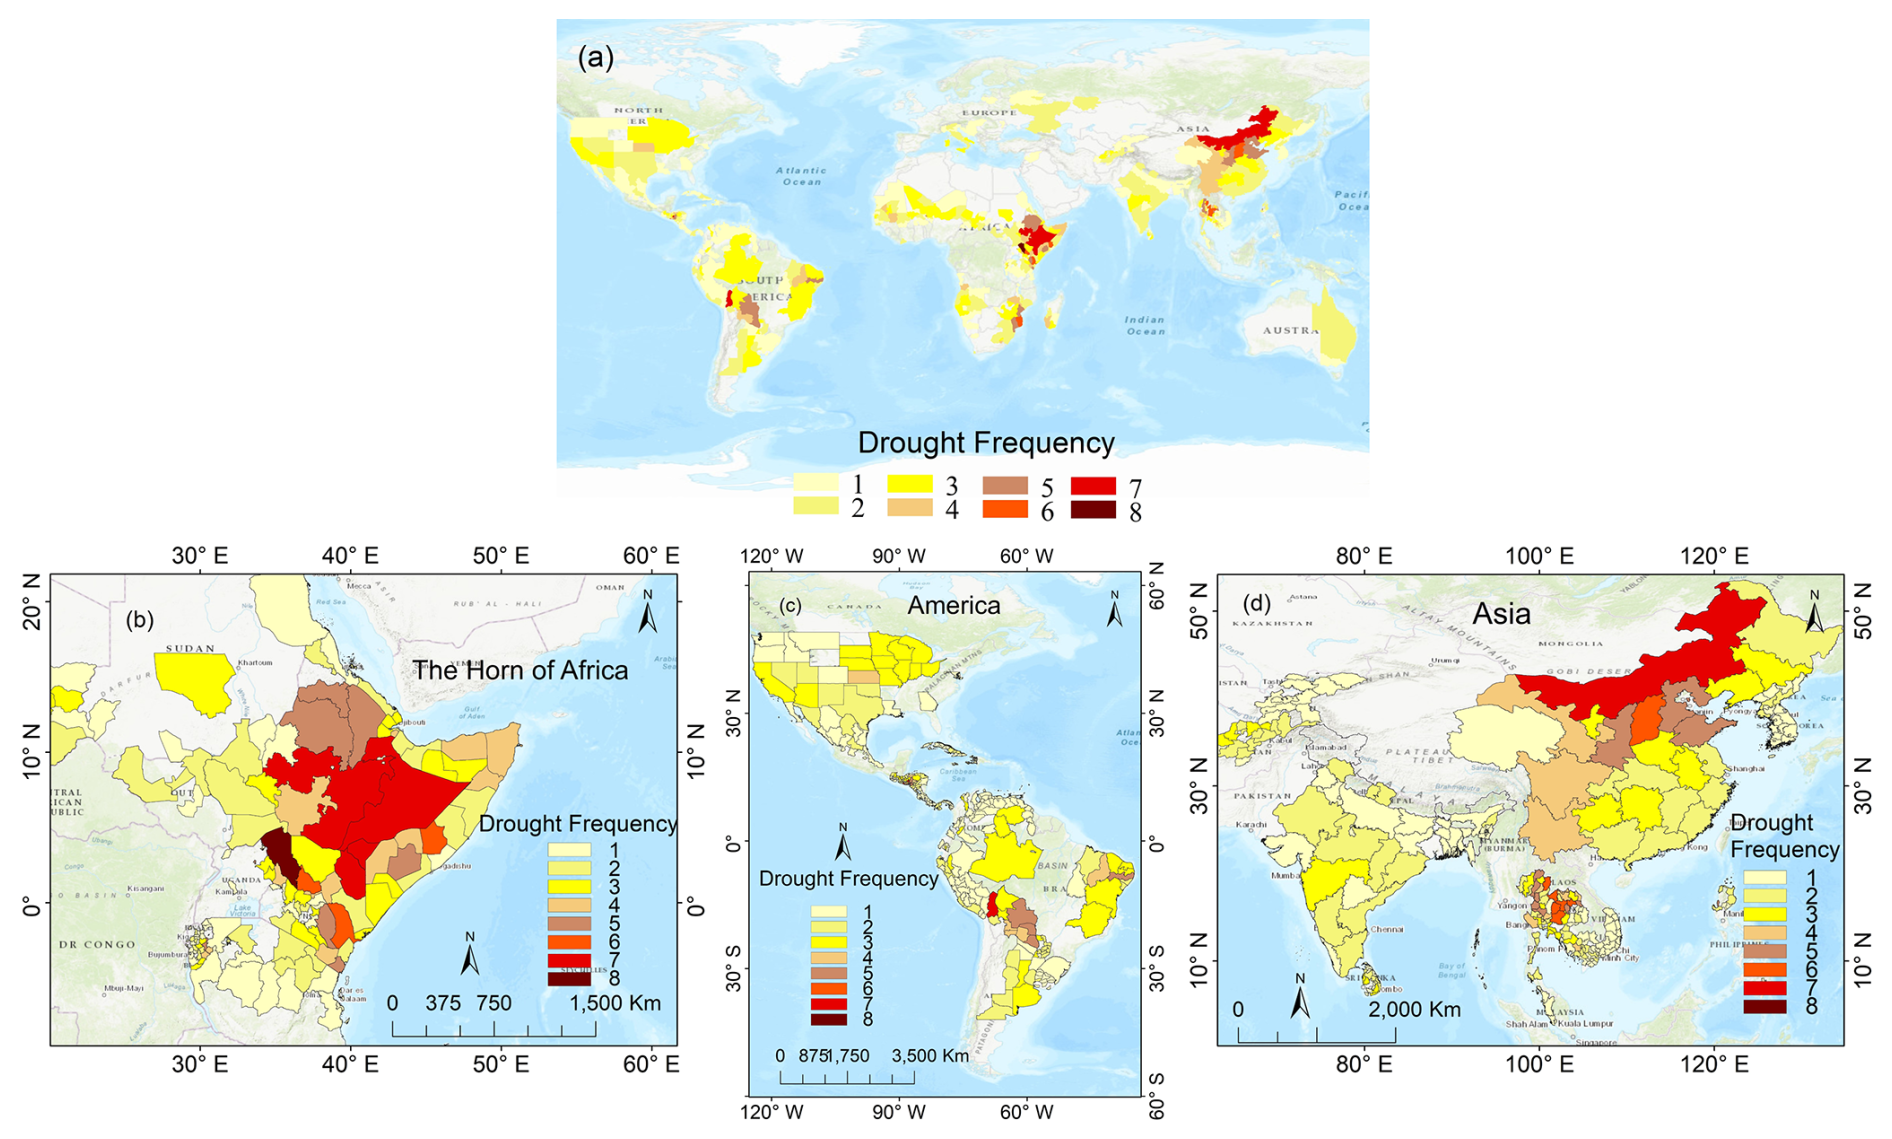
Figure 2Spatial distribution of GDIS drought frequencies: (a) global scale, (b) East Africa, (c) the Americas, and (d) Asia. The drought frequencies range from one to eight, represented by shades from light yellow (low frequency) to dark brown (high frequency). Note: the colour scheme used here is distinct from the CDI classification shown in Table 2 and represents event frequency, not drought intensity.
4.2 Performance of CDI in detecting GDIS events
In the computation of the CDI, one of the initial steps involves assigning weights to all input variables using the PCA method. Figure B1 shows the pixel-based weights for each variable for the sample month of April. Similar weights were computed for all 12 months across four input variables (Appendix C: rainfall – Fig. C1, temperature – Fig. C2, NDVI – Fig. C3, and soil moisture – Fig. C4). In April, the highest weights were assigned to soil moisture, indicating its greater contribution to the development of CDI compared to NDVI, land surface temperature (LST), and rainfall. Lower weights were assigned to LST, suggesting a weaker correlation with other variables and a lesser role in CDI formation for April. Significant variations in these weights have been observed across different global regions, reflecting seasonal dynamics. In the tropical areas of Southeast Asia and parts of Africa, rainfall and soil moisture exhibit higher weights during the monsoon seasons from June to September, while NDVI becomes more prominent in the subsequent months. Meanwhile, in parts of North America, NDVI shows higher weights in September and October, followed by soil moisture and rainfall (Appendix C).
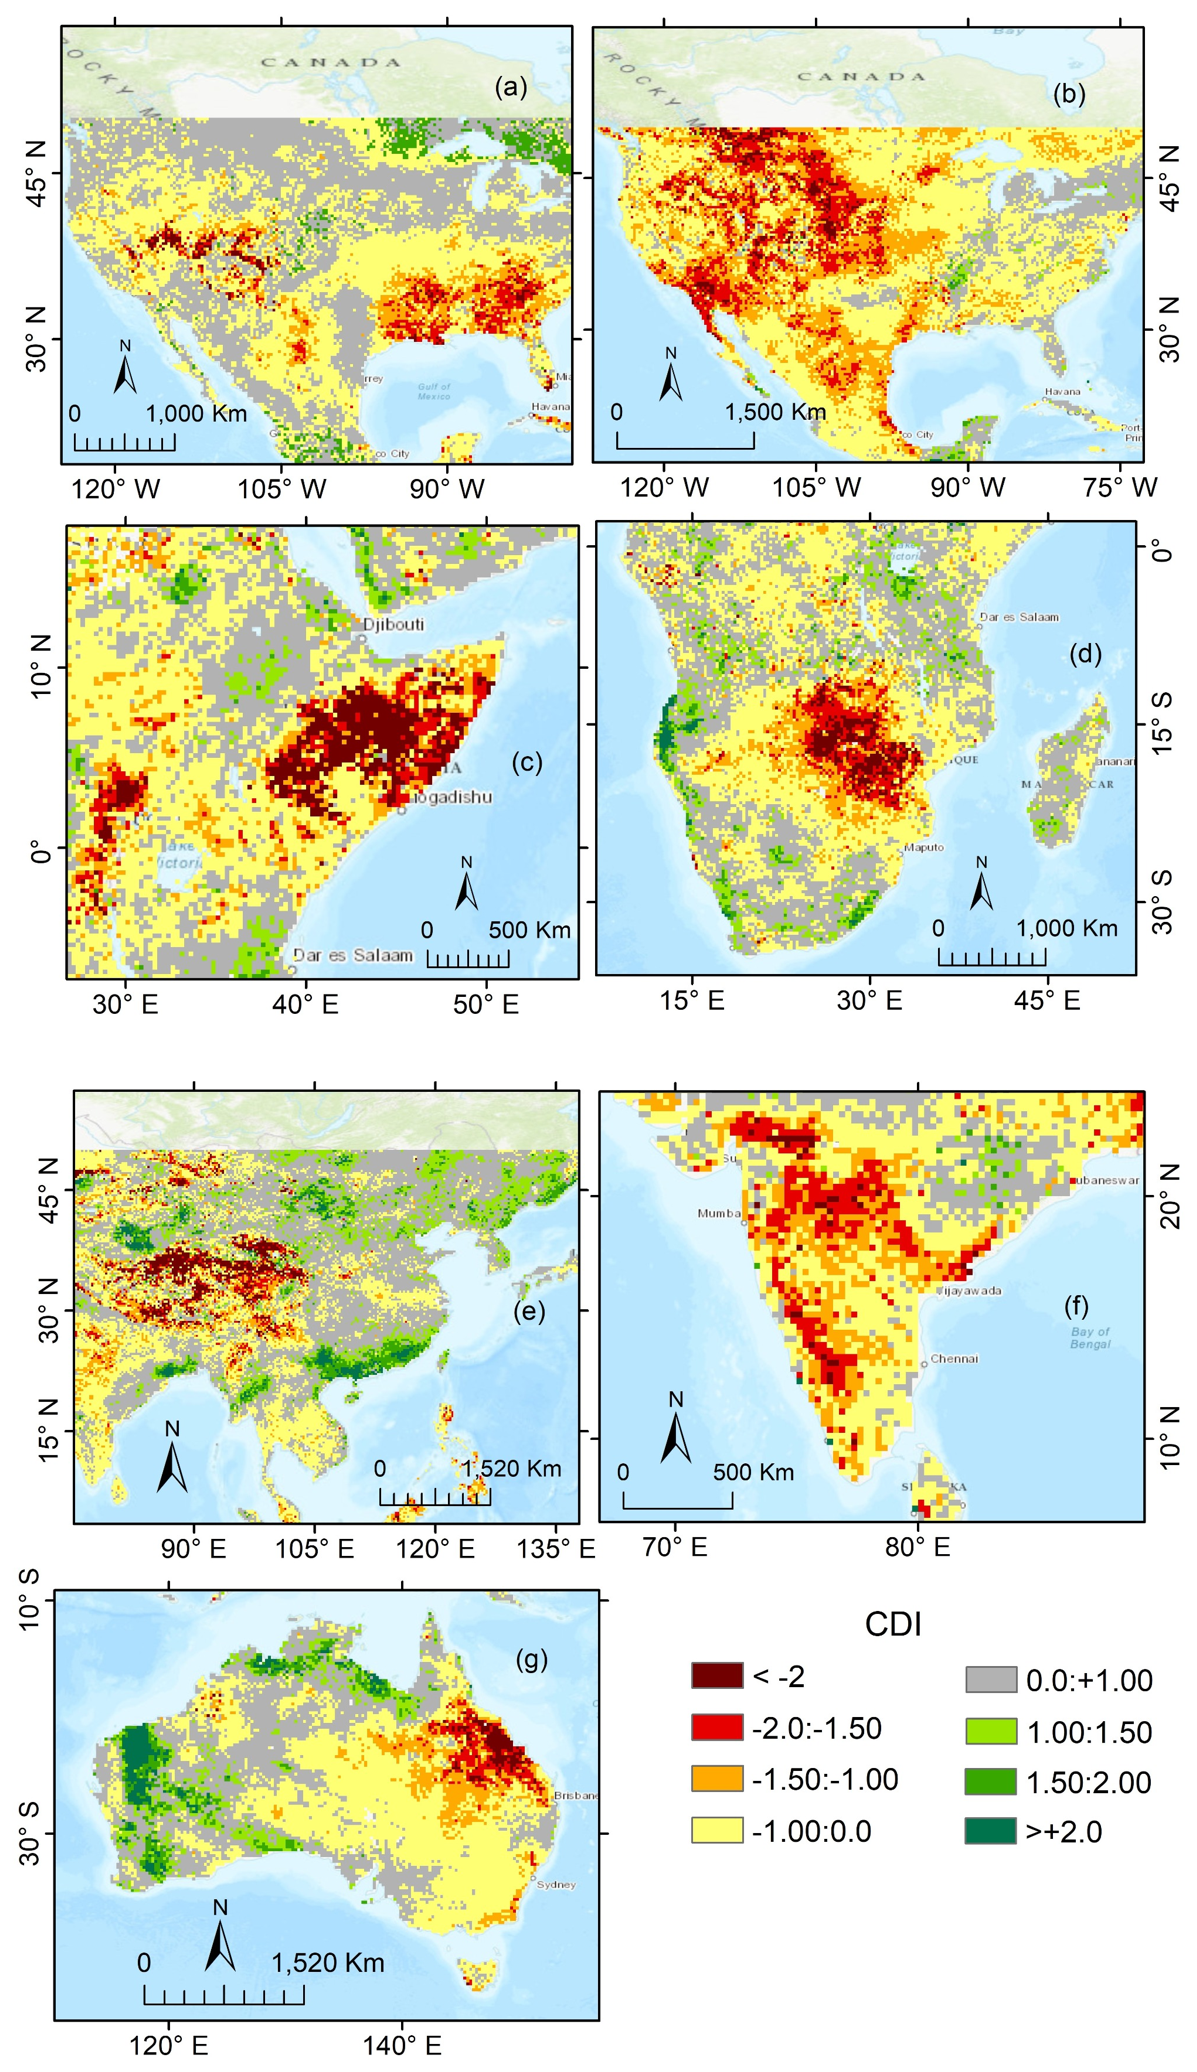
Figure 3Major drought events detected by CDI in various global regions, including: (a) the United States in August 2007 and (b) July 2012, (c) the Horn of Africa in July 2015, (d) Malawi and Zambia in February 2016, (e) western and northern China in July 2015, (f) India in July 2015, and (g) Australia in January 2019.
The CDI maps, as shown in Fig. 3, helped to identify different categories of droughts between 2001 and 2021 over various regions of the globe. Severe to extreme drought conditions were observed over South African countries such as Malawi and Zambia, as well as the Horn of Africa, including Ethiopia, Kenya, and Somalia, during 2015–2016. In the United States, the years 2007–2008 and 2012 were marked as severe to extreme drought years, affecting the southeastern states and the Midwest, respectively. During November 2009, the CDI noted one of the most destructive drought periods in northern and western China. The year 2015 was marked by the CDI as a severe drought year in India, affecting 52 % to 67 % of the region and causing massive agrarian stress. Additionally, the CDI data indicated that during early 2019, areas of Australia, particularly Queensland and New South Wales, experienced some of the most severe drought conditions recorded in recent years. Further, overlapping the GDIS polygons on these CDI results helped to explain the association between CDI and GDIS drought events.
Figure 4 demonstrates the performance of CDI in detecting GDIS events. Figure 4a shows CDI for North and Central America in June 2015 overlaid with black polygons representing GDIS data for the same period. Similarly, Fig. 4b and c showcase the CDI maps for Africa in June 2009 and South America in August 2009, respectively, aligning with periods of reported GDIS events with their corresponding polygons. In these examples, it is clearly seen that GDIS polygons are exactly aligned with severe to extreme drought areas, as evident through the base maps of CDI. Likewise, out of a total of 2142 GDIS global drought events with an actual event period (AEP), CDI can detect 1885 (88 %) drought events when the drought criteria were set to −1 or less and 2117 (98.83 %) when the criteria were set to 0 or less. After adjusting the criteria to consider drought events lasting 2 months or longer, the total event count was reduced to 1641 GDIS events. Under this criterion, CDI identified 1550 (94.45 %) GDIS events when the drought threshold was set to −1 and 1635 (99.63 %) when the threshold was set to 0. Adjusting the criteria and thresholds more rigorously (1 month prior to the end of GDIS events, 2 months prior to the end of GDIS events, and 3 months prior to the end of GDIS events) resulted in a stronger association between GDIS and CDI, with percentages ranging from 91 % to 100 % (Table 3). In the first criterion, when considering 1 month prior to the AEP and using a threshold of −1, CDI detected 1954 events, accounting for 91.22 % of the total. When the threshold was changed to 0, 2130 events (99.44 %) were identified by CDI, in alignment with GDIS. When short-duration drought events were excluded under the same criterion, CDI detected 1573 events (95.86 %) at the −1 threshold and 1637 events (99.76 %) at the 0 threshold.
Under the second criterion, when 2 months prior to AEP, CDI detected 2010 events (93.84 %) using a threshold of −1 and 2137 events (99.77 %) when the threshold was adjusted to 0. Excluding short drought events in this scenario, CDI identified 1587 events (96.71 %) at the −1 threshold and 1637 events (99.76 %) at the 0 threshold. In the final criterion, considering 3 months prior to AEP, CDI detected 2042 events (95.33 %) at the −1 threshold and 100 % of events at the 0 threshold. After excluding short drought cases, 1589 events (96.83 %) were captured at the −1 threshold, and, again, all events (100 %) were identified at the 0 threshold. Among the shifting windows, the 3-month prior criterion with a threshold of 0 demonstrated the highest detection rate, capturing 100 % of GDIS events. However, this also suggests a higher likelihood of false alarms, as early indicators may not always align with actual drought impacts.
These results highlight that GDIS events, which appear to occur in specific months, may actually be the outcome of agro-climatic variability occurring 1, 2, or even 3 months prior to the reported event, rather than being confined to that specific month alone.
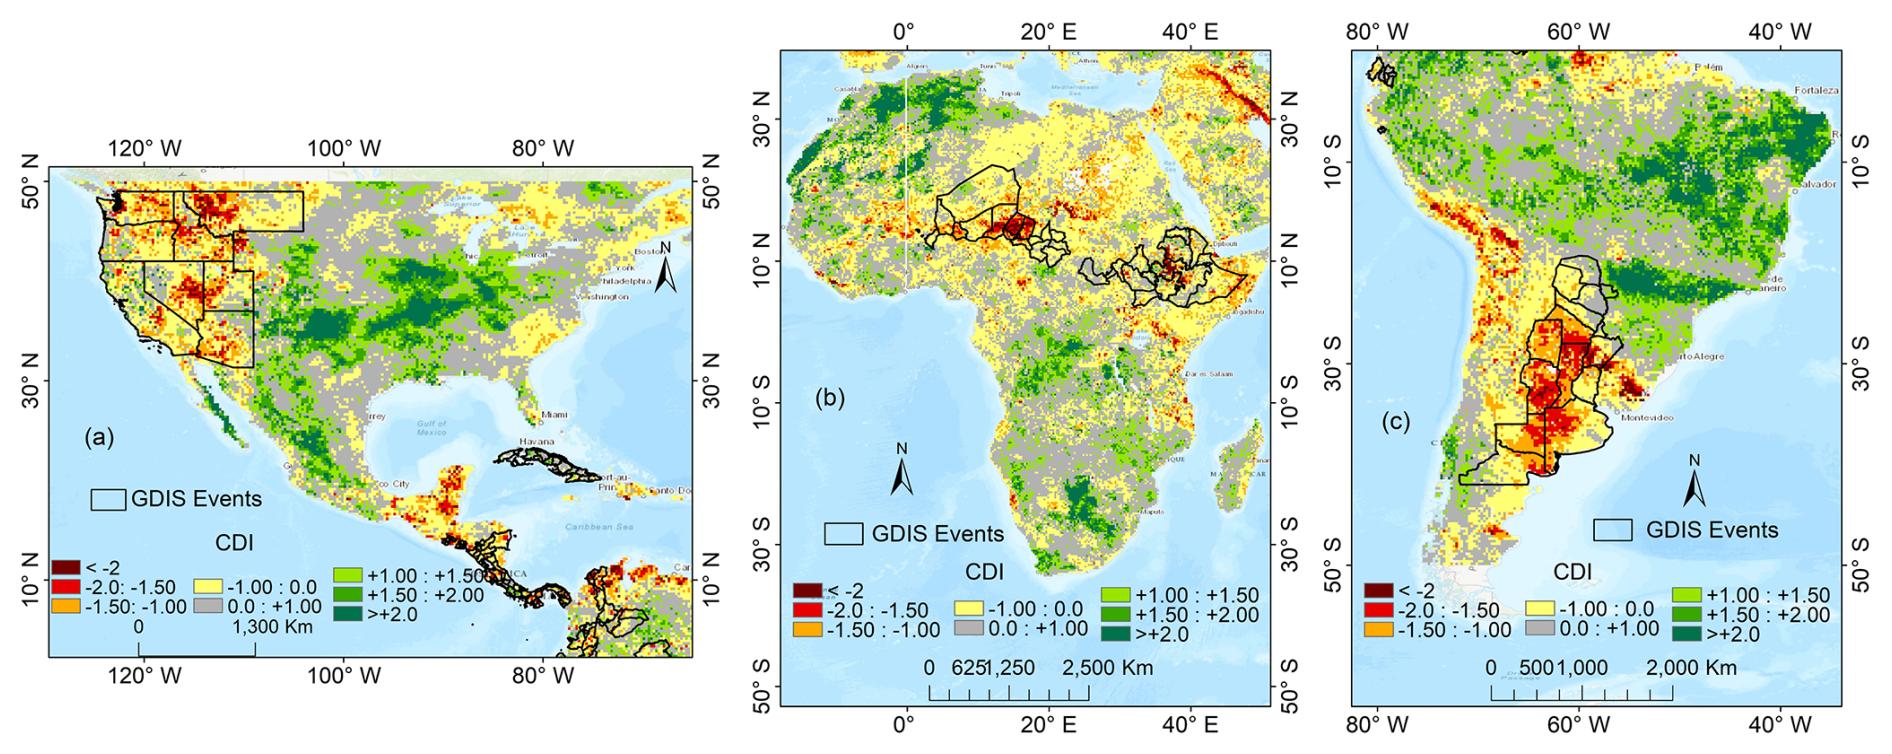
Figure 4Assessment of drought using CDI with overlay of GDIS events over North America (June 2015) (a), Africa (June 2009) (b), and South America (August 2009) (c). The black polygons represent GIS polygons from GDIS, indicating drought-affected administrative units based on GDIS data. The base maps display CDI results for the respective GDIS drought months, ranging from dark brown (indicating extreme dry conditions) to dark green (indicating extreme wet conditions). The alignment of GDIS polygons with droughts detected by CDI demonstrates the CDI's capability to accurately identify GDIS droughts during the respective periods.
Table 3Performance of CDI in detecting GDIS events using multiple criteria.
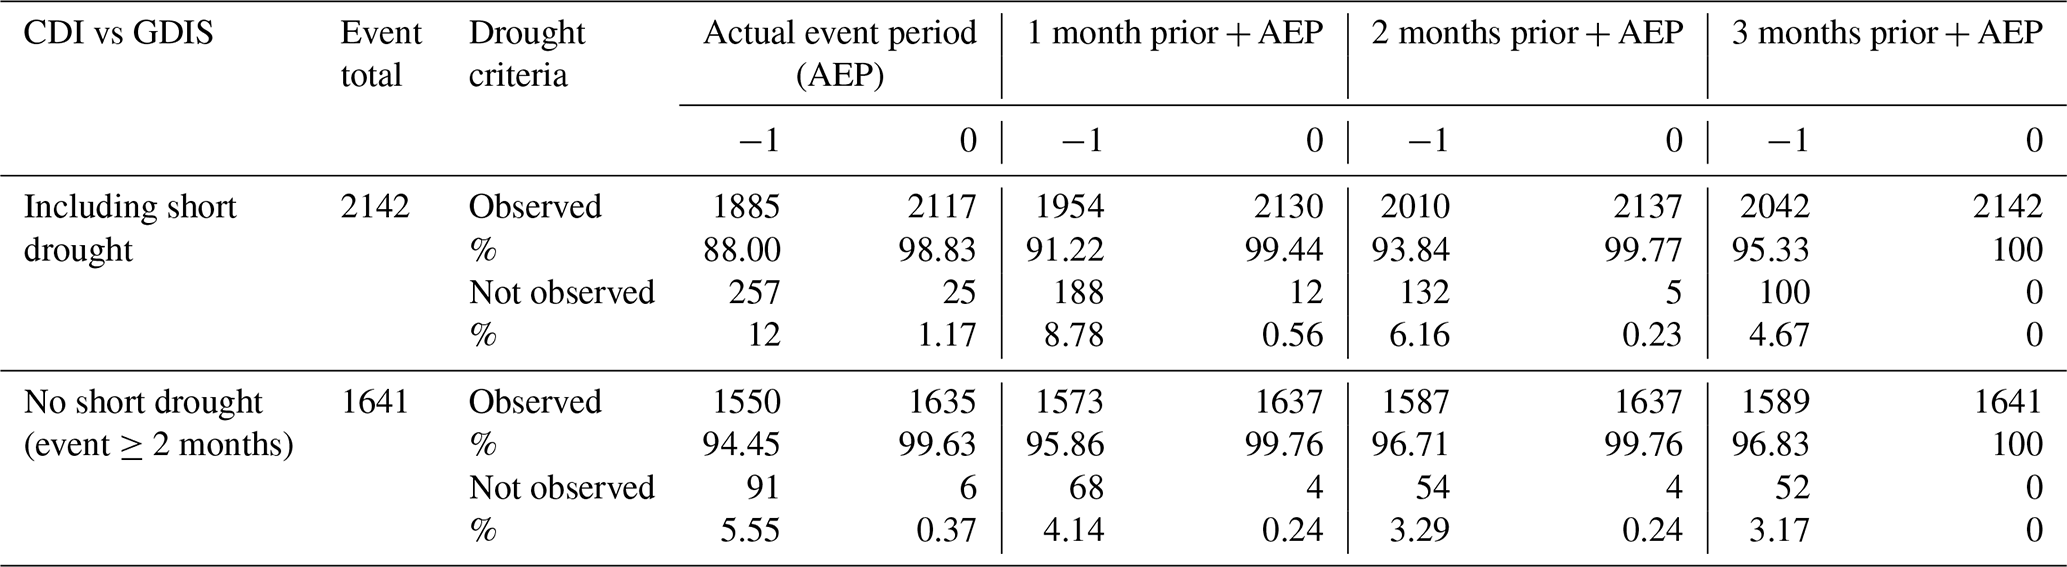
Figure 5 illustrates the performance of CDI in detecting GDIS drought events across different regions (Fig. D1 represents the performance of traditional indices). In this analysis, the drought identification criteria were set as all GDIS events, including short-duration cases, with a drought threshold set at −1 or less. Out of a total of 2142 GDIS events, the highest number was observed in Africa, with 779 events, of which CDI successfully detected 678 (87.03 %). Following Africa, South and Southeast Asia experienced 613 (78.69 %) GDIS drought events, with CDI accurately identifying 526 (67.52 %) of these. In South and Central America, there were 434 GDIS drought events, and CDI identified 387 (89.17 %) of them. East Asia and the Pacific saw 144 GDIS events, with CDI detecting 138 (95.83 %). Europe and Central Asia, as well as North America, had the fewest GDIS events. CDI detected 111 events in Europe and Central Asia and all 53 events in North America. These findings indicate that CDI exhibits high accuracy in regions with larger subnational scales compared to areas with smaller scales. The 100 % detection rate of GDIS droughts in North America by CDI may be attributed to the extensive area extent of the region. In line with our results, a previous study by Kageyama and Sawada (2022) also showed that developed countries are easier to detect. These countries did not suffer from droughts without strong climatological hazard signals, which enhances the capability of our climatology-based hazard index. The vast subnational scale of North America includes a greater number of CDI image pixels, which likely enhances the correlation with GDIS events.
Despite the higher association of CDI in detecting GDIS events, there were a few instances (e.g. Burundi and parts of Thailand) where CDI failed to capture GDIS events. The smaller spatial extents (subnational scales in Southeast Asia or parts of Africa) could be one reason for this discrepancy. Additionally, these regions might be experiencing other types of stress beyond agro-climatological factors (as indicated by CDI) that contribute to the GDIS events. It was also found that CDI identified stress conditions in some locations that were not reflected in GDIS. For instance, CDI detected severe drought events in South Argentina during 2014–2015, Namibia in 2013, and parts of Europe in 2018, which were not reflected in GDIS event records. These instances highlight that not all agro-climatic droughts lead to recorded socio-economic impacts, especially in regions with strong adaptation and mitigation capacities. Practices such as advanced irrigation, drought-resistant crop varieties, or effective early warning systems may help manage the agricultural and societal impacts of climatic stress, thereby reducing the likelihood of such events being recorded in GDIS. It is also important to note that GDIS does not comprehensively capture all real-world drought events, particularly in regions with limited reporting mechanisms or institutional capacity. As a result, some drought events, especially in low-income or remote areas, may go undocumented despite having significant local impacts.
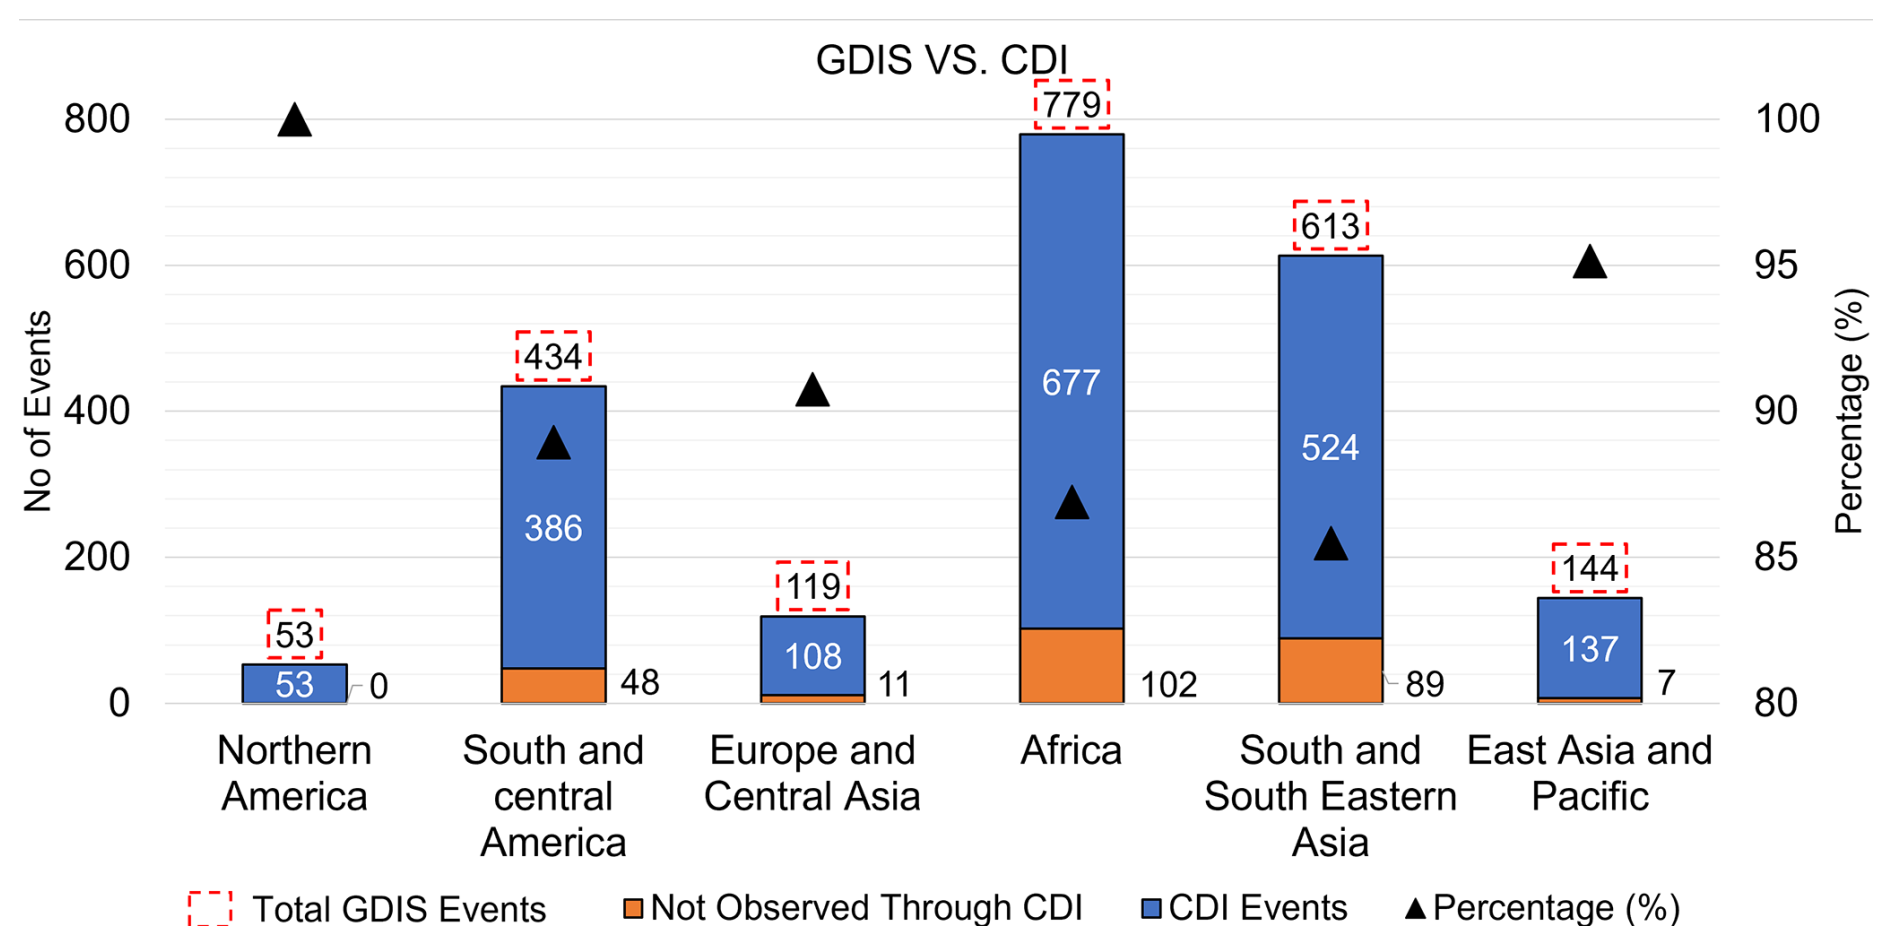
Figure 5Performance of CDI in detecting GDIS events across different geographic regions. A total of 2142 drought events were identified from GDIS. CDI successfully detected events marked in blue, with counts indicated by red dotted boxes. Events missed by CDI are represented in orange. The black triangles indicate the percentage of GDIS events captured by CDI.
4.3 Comparative assessment of CDI and individual parameter-based traditional indices
Figure 6 presents a comparative analysis of multiple drought indices, including CDI, in detecting GDIS events using various criteria. When considering the initial criteria (Fig. 6a), which cover the actual event period of GDIS and include all events, including short-duration droughts, a total of 2142 events were identified in GDIS. Among these, CDI exhibited the highest detection rate with 1885 (88 %) events, followed by NDVI with 1867 (87.16 %) events, SSMI with 1770 (82.63 %) events, SPI with 1740 (81.23 %) events, and STI with 1650 (77.03 %) events. Here, the criterion was set to consider all events, including short-term drought occurrences, with the drought threshold set to −1 or lower. The number of the GDIS drought events captured by each index can easily be increased by the lower threshold of drought identification (Fig. 6a, b, c, d, and subplot 2), although it inevitably increases the false alarms. This association remained consistent when the drought criteria were further refined to exclude events shorter than 2 months (Fig. 6a, b, c, d, and subplot 2). It is also notable that the agricultural indices (NDVI and SSMI) exhibit greater efficacy in identifying GDIS drought events compared to meteorological indices (SPI and STI). This suggests that they may offer a more accurate representation of socio-economic conditions. Through this analysis, we observed that NDVI performs better in regions with diverse vegetation cover and seasonal variability, such as the Indian subcontinent and South America (Fig. E1). In contrast, SSMI detected more drought events than NDVI in semi-arid areas like Central Asia (e.g. Kyrgyzstan, Afghanistan), where NDVI is less informative due to sparse vegetation.
When considering an alternative criterion that includes drought data spanning 2 months prior to the onset of the GDIS event until its end date, with the exclusion of short-term drought occurrences, a total of 1641 GDIS events were observed. Out of these 1641 events, CDI demonstrated the highest efficacy by detecting 1587 (96.71 %) events. Subsequently, NDVI identified 1574 (95.91 %) GDIS events, while SSMI detected 1580 (96.28 %) events. SPI observed 1550 (94.45 %) events, and STI represented 1510 (92.02 %) events, showcasing its lesser capability in detecting GDIS events. It is observed that, across most criteria (Fig. 6b, c, d), CDI demonstrated a superior capability in identifying GDIS events compared to other indices. It is also observed that, across most criteria, CDI has a greater potential to detect GDIS droughts compared to traditional drought indices based on single input variables (Appendix F: Tables F1, F2, F3, and F4).
However, there were three instances where CDI lagged other indices, primarily NDVI or SSMI, in detecting GDIS events. In the first scenario (Fig. 6b, criterion: 1 month prior to AEP and including short droughts), CDI detected 1954 (91.22 %) GDIS events, while NDVI identified 1983 (92.58 %) GDIS events. Similarly, in the second scenario (Fig. 6b, criterion: 2 months prior to AEP and including short droughts), NDVI maintained its superiority in detecting GDIS events, observing 2028 (94.68 %) events compared to CDI's detection of 2010 (93.84 %) events. In the third scenario (Fig. 6c, criterion: 3 months prior to AEP and no short droughts considered), although CDI detected 1589 (96.83 %) GDIS events, SSMI outperformed by observing 1610 (98.11 %) GDIS events. These discrepancies may be caused by CDI giving more weight to input parameters such as SPI and STI, influenced by regional variability, local environmental conditions, and land cover patterns during these event periods.
For comparative analysis of drought detection performance, recall serves as a crucial metric, as it quantifies the ability of each index to correctly identify actual drought events. High recall is especially important in early warning systems, where missing events can lead to unmitigated impacts. As illustrated in Fig. G1, the CDI index consistently outperforms others across all time windows, particularly for events lasting ≥2 months, where it achieves recall values between 0.94 and 0.97, demonstrating robust and reliable drought detection capability. For a more comprehensive understanding of detection performance, additional metrics derived from a full confusion matrix, such as precision, specificity, and F1 score, could provide further insights and represent a promising direction for future work.
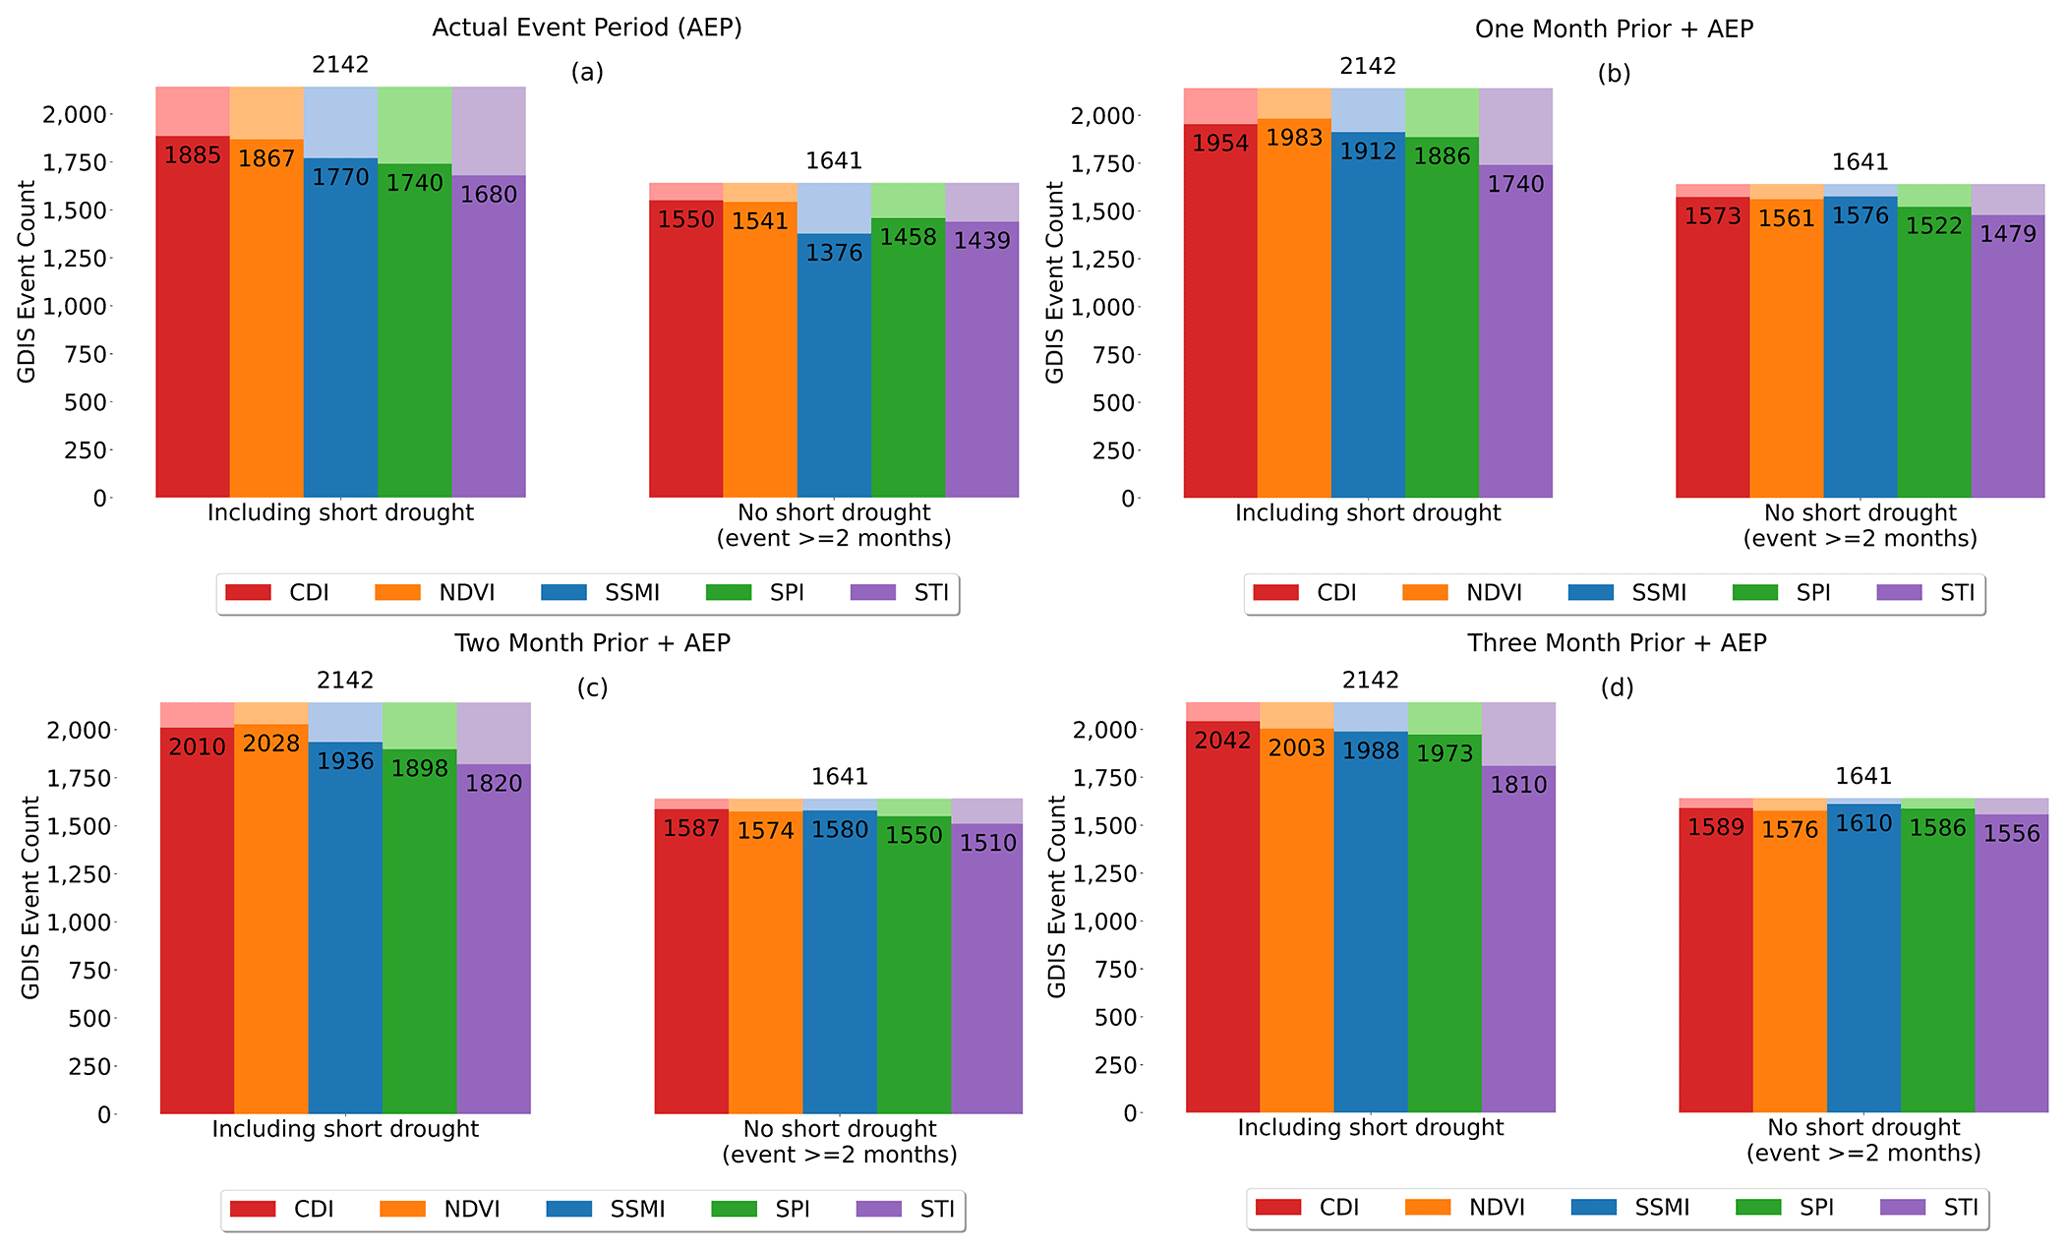
Figure 6Comparative assessment of CDI vs traditional drought indices in detecting GDIS droughts (drought identification threshold: −1 or less). The first subplot of (a), (b), (c), and (d) illustrates the performance of indices in detecting droughts from a total of 2142 GDIS drought events (considering short drought events). The second subplot of (a), (b), (c), and (d) shows the performance of indices in detecting GDIS drought events when short drought events are excluded, resulting in a total count of 1641. Actual event period (AEP) is the exact period when the GDIS event occurred, for which index data have been considered. In (b), (c), and (d), 1 month, 2 months, and 3 months prior + AEP are the respective previous months relative to GDIS events plus the actual event period from which index data were considered to understand the lag effect in GDIS event occurrences.
One of the reasons for the superiority of CDI in detecting GDIS drought events is its flexibility. CDI can be tailored to suit local or regional contexts, taking into account the unique characteristics represented by specific traditional indices or combinations of multiple indices. Figure 7 provides examples of such cases, where one or more individual indices represented GDIS drought events, allowing CDI to also detect those GDIS events. Figure 7a shows one of the event cases over Busoni, Burundi, from Africa, where the GDIS event was observed from April 2014 to September 2014. In this case, the lines for NDVI, SPI, or STI did not cross the drought threshold (−1) during the particular period; hence, the GDIS event could not be detected. SSMI could detect this drought, and CDI has a relatively large weight on SSMI, so CDI could also detect it. The average rainfall is low with small variability over this region in this period, resulting in SPI not detecting this event, whereas the common hot and semi-arid climate of this region would not have helped STI and NDVI to detect drought over Burundi. The decreased availability of groundwater or surface water in this area likely resulted in reduced soil moisture supply, contributing to SSMI drought. In the second example (Fig. 7b), a GDIS drought event was observed over Gaya, Bihar, India, from May to September 2009. This region is located along the banks of the Ganga River, which is likely to provide ample irrigation. Consequently, SSMI and NDVI did not indicate a drought in this area. However, the insufficient rainfall over Gaya during this period caused socio-economic stress, which was detected by both SPI and CDI.
Figure 7c shows the performance of various indices over Holguin, Cuba, where a GDIS event was reported from August 2004 to March 2005. In this case, STI and SPI did not detect the drought, whereas NDVI and SSMI indicated drought conditions, leading to the CDI's detection of the drought as well. Despite non-drought conditions in precipitation and temperature, agricultural stress factors such as poor vegetation health or subsurface water depletion could have contributed to this drought, which was effectively captured by NDVI, SSMI, CDI, and GDIS. In the fourth example (Fig. 7d), a GDIS event was observed over Nebraska, USA, from June 2012 to November 2012. All five indices (NDVI, SSMI, STI, SPI, and CDI) detected this event, highlighting the extreme drought severity during this period in the United States.
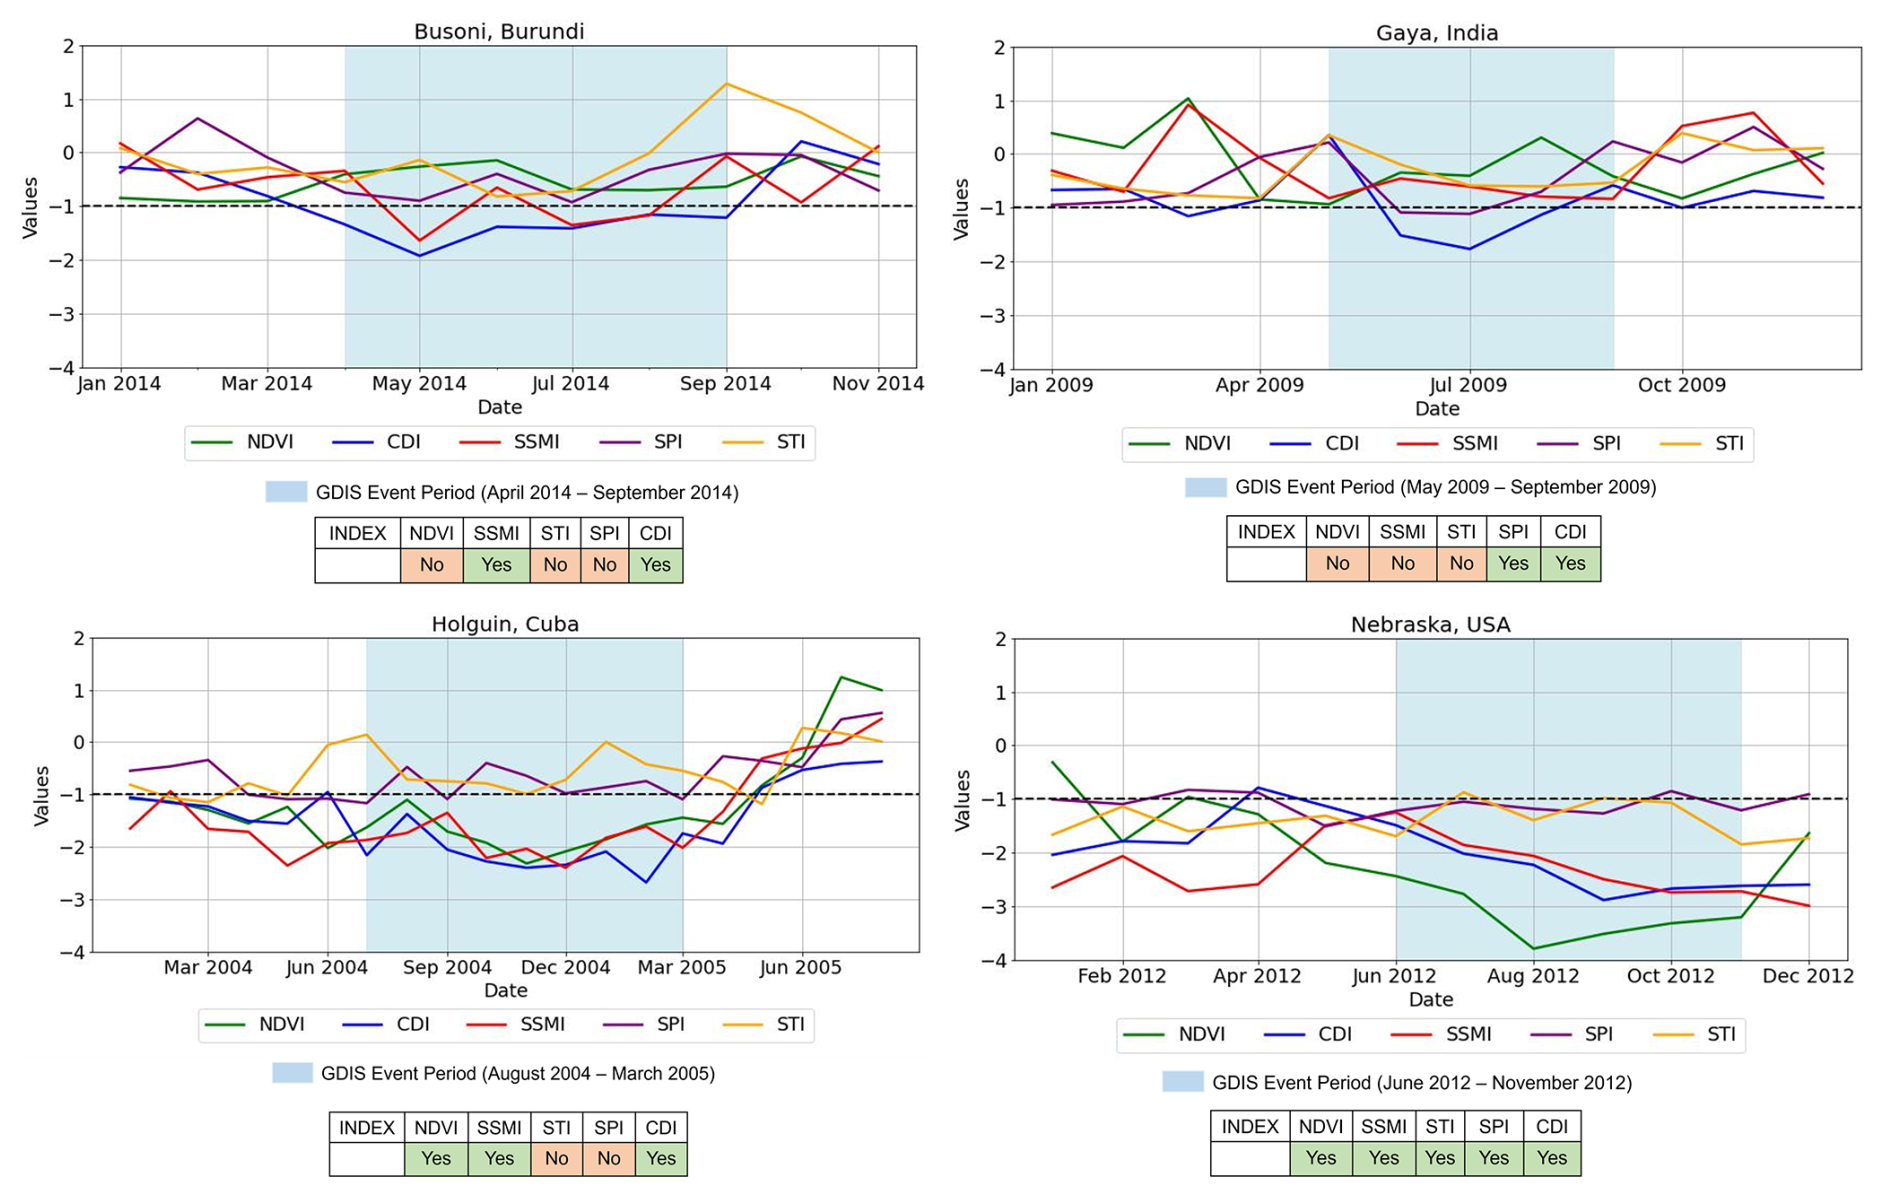
Figure 7Performance of CDI, SPI, STI, SSMI, and NDVI in detecting GDIS events over Burundi, Gaya, Holguin, and Nebraska. The blue boxes denote the duration of GDIS events, while coloured line graphs represent the index values of NDVI (green), CDI (blue), SSMI (red), SPI (purple), and STI (yellow). If the line of any index value crosses the drought threshold of −1 (black dotted line) during the specified GDIS event period (blue box), that index is considered capable of identifying the GDIS drought event.
Figure 8 represents the zonal validation results for drought index performance across four climate zones (arid, tropical, temperate, and cold) based on Köppen's climate (Peel et al., 2007) classification (threshold criterion: −1). The figure highlights how different indices perform differently under varying climatic conditions, while the CDI demonstrates consistently high detection accuracy across all zones. In the arid zone (a), CDI detected 95.4 % of GDIS events (the highest among all indices), while SSMI and NDVI also performed well with 93.0 % and 90.5 %, respectively. This outcome can be attributed to the high sensitivity of NDVI and SSMI to vegetation and soil moisture stress, which are obvious under arid conditions. However, in the cold zone (d), individual index performance dropped noticeably, with SPI detecting only 66.0 % of events, whereas CDI still maintained 80.3 % detection. Similarly, in the temperate zone (c), both CDI and SSMI showed strong association with GDIS at 87.2 % and 89.2 %, respectively, indicating that some indices may be better suited for certain climate types. In contrast, the tropical zone (b) showed relatively lower detection percentages for all indices, with CDI still leading at 80.9 %. SSMI performance in the tropical and cold zones was lower, possibly due to dense vegetation cover and higher variability in surface moisture, which can limit the accuracy of soil moisture retrievals. These results emphasise that while individual indices can perform well in specific climate zones, their performance is not consistent across all zones. CDI, by integrating multiple indicators, offers more universally reliable detection, making it better suited for broader applications in drought monitoring across diverse climatic regions.
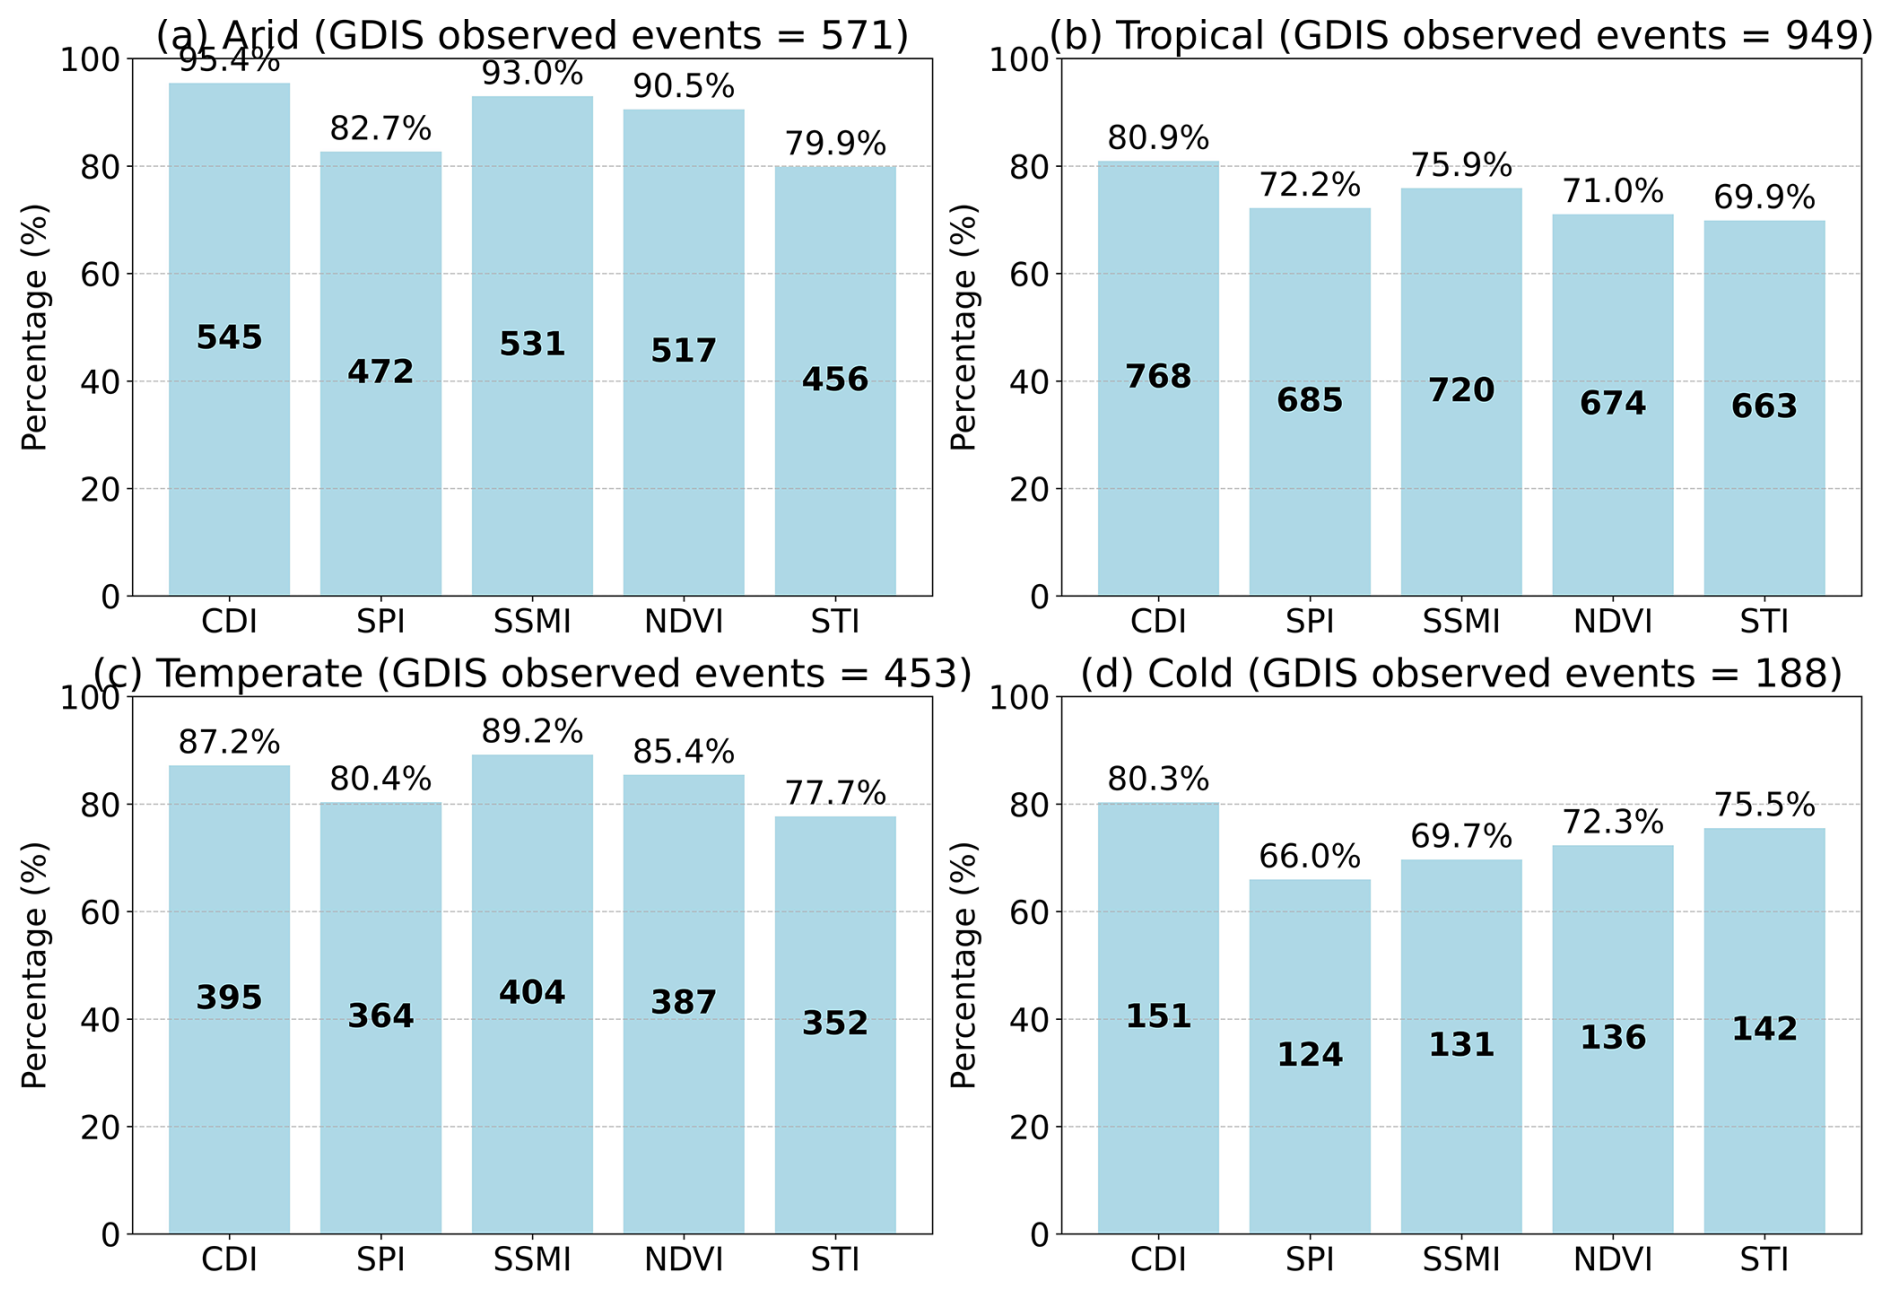
Figure 8Zone-wise accuracy of drought indices (CDI, SPI, SSMI, NDVI, STI) in detecting GDIS events across four Köppen climate zones: arid, tropical, temperate, and cold. The bar heights represent the percentage of GDIS events accurately captured by each index (threshold = −1), and the numbers inside the bars indicate the absolute number of consistent detections. The total number of GDIS events considered per zone is as follows: arid – 571, tropical – 949, temperate – 453, and cold – 188 (total = 2161).
Similarly, we performed a zonal validation of drought index performance across major land cover classes, i.e. forest, shrubland and savanna, agriculture and cropland, settlement, and barren lands, based on MODIS land cover data. As shown in Fig. H1, the results indicate that CDI consistently outperformed individual indices across all land cover types in detecting GDIS events. This reinforces the robustness of CDI in capturing multi-dimensional drought signals, even across heterogeneous land surface conditions.
To better understand the spatial behaviour of the CDI, a correlation analysis was performed (Fig. 9) to examine how consistently each input index aligns with the composite signal across regions. In general, strong correlations were observed between CDI and SSMI, followed by NDVI, SPI, and STI among the four single-input-based traditional indices. CDI was highly associated with SSMI over the Indian subcontinent, Australia, and South America. However, these correlations exhibited spatial and temporal variability. Monthly assessments revealed significant seasonal variations in the correlations between CDI and other indices. During monsoon months (June, July, August, and September), CDI exhibited a higher correlation with SPI over the Indian subcontinent compared to non-monsoon months. Similarly, in arid regions of Africa, strong correlations between NDVI, SSMI, and CDI were observed during rainy months (June to September), which diminished during dry months. As a sample example, Figure 9 depicts the spatial correlation between CDI and other indices in the sample month of April. On average, NDVI exhibited a higher correlation with CDI, particularly in North America, southern parts of Africa, and the Indian subcontinent. Following NDVI, SSMI and SPI demonstrated stronger associations with CDI. However, in April, CDI exhibited a lower correlation with STI. Parts of South America, South Africa, Australia, and the Indian subcontinent even displayed a negative correlation between CDI and STI, indicating worsened or more severe drought impacts during this period.
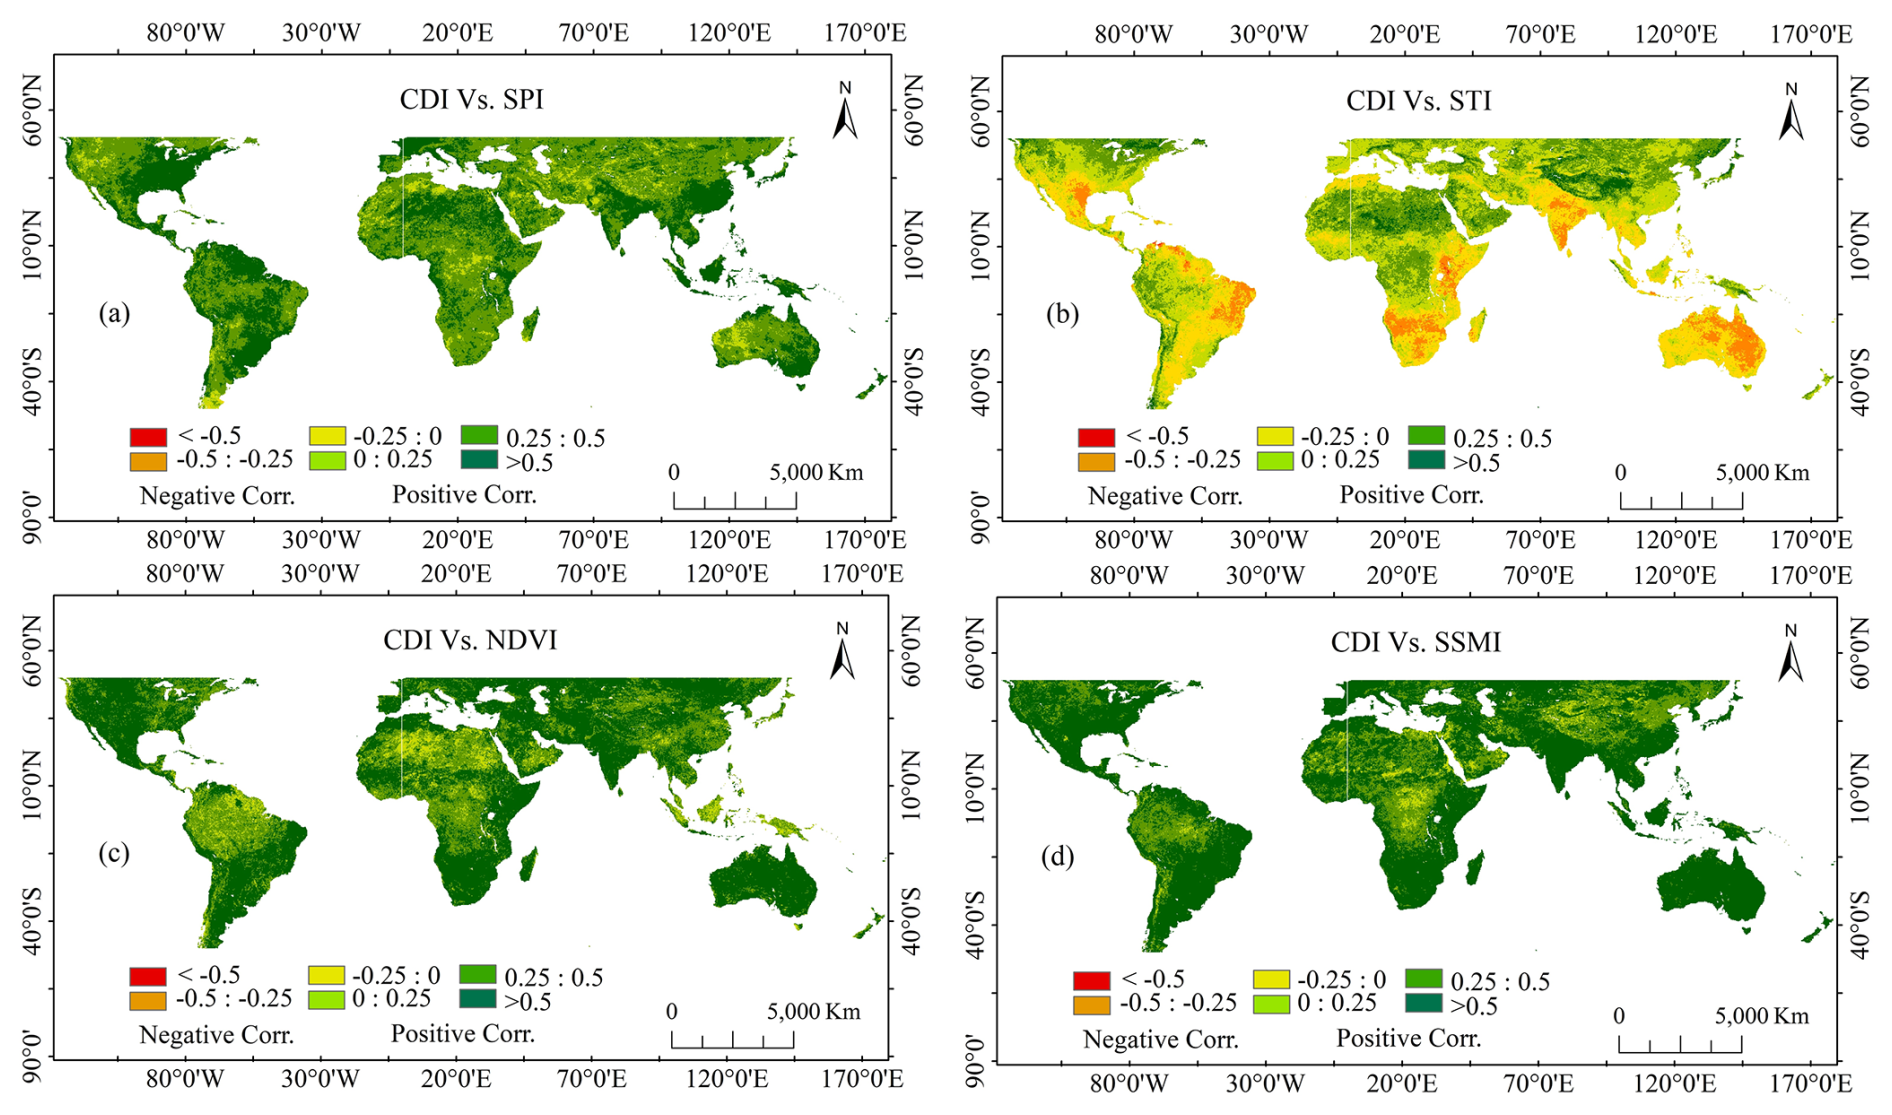
Figure 9Spatial correlation between CDI and single-input-based traditional indices for a sample month (April): (a) CDI vs SPI, (b) CDI vs STI, (c) CDI vs NDVI, and (d) CDI vs SSMI. Negative correlations are represented in shades from yellow to red, while positive correlations are shown in shades from light green to dark green.
One major challenge in drought studies is assessing the after effects and propagation of specific drought events on society and their long-term impacts. Some researchers have attempted to shed light on this issue, using proxies to show the socio-economic effects. Noel et al. (2020) compared weekly hazard maps with socio-economic impacts across the United States, and Bachmair et al. (2016) described thresholds for hydrometeorological droughts to understand the socio-economic impacts of droughts in Germany and the U.K. However, these studies were region-specific and insufficient to provide a global perspective. Our study addressed this research gap with the help of GDIS data. The use of GDIS data in this study allowed us to obtain precise subnational information on disaster locations, and instead of relying on proxies, this dataset provided direct on-ground impact information. Consistent with the findings of Kageyama and Sawada (2022), our study also observed that sub-Saharan Africa and South Asia experienced a higher number of GDIS drought events, highlighting the high vulnerability of these regions to droughts and their socio-economic repercussions.
Previous studies, whether regional or global, often relied on single-parameter-based indices for drought monitoring, such as SPI (Ji and Peters, 2003; Kulkarni et al., 2021; Liu et al., 2022; McKee et al., 1993). Each of these has limitations for understanding drought. For instance, SPI is commonly used, but its effectiveness depends heavily on the selected timescale. Shorter timescales, such as SPI-1 and SPI-3, are effective for detecting meteorological and agricultural droughts, respectively, while longer timescales (e.g. SPI-6 or SPI-12) are more suitable for identifying hydrological droughts (World Meteorological Organization, 2012). However, in regions with distinct wet and dry seasons, SPI can sometimes misrepresent actual drought conditions; for example, a short-term SPI may indicate drought during a naturally dry season, even when annual water availability remains within normal limits. Regarding NDVI, results may vary depending on the type of vegetation, as different plants respond differently to drought stress, which may not always be captured by NDVI. Additionally, particularly in places with abundant rainfall, NDVI may not be able to differentiate between dense vegetation and healthy vegetation. Soil moisture index has limitations in its spatial coverage and the variability of its levels over time, which can respond differently to changing conditions. Hence, the development of CDI in our study and its analysis on a global scale mark a significant departure from previous studies (Ji and Peters, 2003; Liu et al., 2022; McKee et al., 1993) that focused on single input parameters. By integrating multiple parameters for the analysis, CDI offers a more comprehensive understanding of drought conditions, transcending the limitations inherent in single-parameter approaches. Bayissa et al. (2022), Jiao et al. (2019), Kulkarni et al. (2020), and others employed a comprehensive approach, emphasising the importance of CDI in their regional drought monitoring studies over Sri Lanka, India, and the United States, respectively. However, these studies were limited to regional analyses. Hence, in this study, taking a step ahead, we analysed droughts using the CDI technique at the subnational level on a global scale.
While some regional studies have used socio-economic data such as crop prices or agricultural losses for drought monitoring (Brown and Funk, 2008; Lobell and Burke, 2010; Wang et al., 2022), we exclude such variables to avoid overlapping with GDIS, which already reflects socio-economic drought events. Our focus is on evaluating how well agro-climatological indices capture these events. Additionally, globally consistent socio-economic datasets are limited, making climate-based indicators more practical for large-scale drought monitoring.
In this study, the computation of CDI-based droughts involved implementing the PCA technique to assign weights to each input parameter. In contrast, previous researchers (Kulkarni et al., 2020; Thomas et al., 2016) relied on the expert judgement method or copula method (Shah and Mishra, 2020; Tosunoglu and Can, 2016) to assign weights for the input parameters. The expert judgement method is highly subjective, and weight assignments can fluctuate based on individual opinions. Furthermore, the Copula method is more susceptible to outliers, potentially leading to biased weight assessments compared to PCA. Our study addressed these limitations by employing the PCA technique. PCA enhances the assessment of drought severity by objectively identifying influential variables and capturing data patterns, thereby enhancing the accuracy and reliability of our findings.
The comparative analysis between the CDI and other individual parameter-based indices suggests that CDI offers a strong overall capability for detecting GDIS events, showing robust performance across time windows and a closer association with socio-economic impacts. Inconsistencies between the CDI and other indicators may stem from the different mechanisms these indices use to detect droughts versus the actual ground conditions. One such inconsistency was observed in the Horn of Africa, where the CDI and other indices identified a GDIS drought event, but the SPI did not. This discrepancy could be due to less pronounced precipitation anomalies in the SPI for this region, where baseline rainfall is already low and may not reflect drought conditions accurately. Additionally, it is possible that the observed impact was not solely related to meteorological drought but rather to agricultural or hydrological drought. Factors such as reduced soil moisture, land degradation, or soil types with low water retention capacity captured by SSMI, STI, NDVI, and CDI may have played a more significant role in triggering the event. Another example is from North Argentina (South America), where the SSMI failed to detect a drought that was identified by other indices. This disparity might be due to the presence of the Paraná River, the second-largest river in South America, which provides a significant source of soil moisture. Therefore, the SSMI might not reflect drought conditions. However, it is also possible that the impact was not directly related to soil moisture but instead resulted from meteorological factors such as reduced rainfall or elevated temperatures, which could lead to drought and socio-economic stress, as reflected in GDIS. A further example is from Ballia (Uttar Pradesh, India), where the SPI and SSMI did not detect a GDIS drought, but the NDVI and CDI did. Ballia is near the Ganga River, which supplies ample soil moisture to the surrounding areas. However, the NDVI is particularly effective at identifying droughts in highly vegetated areas due to its sensitivity to precipitation and soil moisture and its inverse correlation with temperature. Thus, the drought was detected by the NDVI and CDI. The current CDI primarily reflects agro-environmental droughts due to the nature of its input indices. However, because it combines precipitation, temperature, soil moisture, and vegetation data, it may also capture broader drought signals relevant to urban systems, such as water availability and heat stress (Bhanage et al., 2023; Hao and Singh, 2015; R. et al., 2021; Vicente-Serrano et al., 2010). In future work, we aim to enhance CDI by incorporating sector-specific indicators to better assess socio-economic impacts beyond agriculture.
Through this study, we observed that the relationship between hazard (CDI) and socio-economic impacts (GDIS) is significantly more complex than initially anticipated. The relationship between CDI and GDIS, as well as their vulnerability to drought, varies markedly between developed and less developed regions. Despite some areas in North America and Europe having lower CDI values (less than or equal to −1.5), these regions have not exhibited corresponding GDIS (socio-economic repercussions of droughts) droughts. Conversely, relatively higher CDI values (less than or equal to −1.0 or even −0.5 in some cases) over South Africa or parts of Asia and South America have led to noticeable GDIS events (socio-economic impacts). Hence, the threshold values of drought impacts (CDI) differ across regions. These findings align with previous studies (Tanoue et al., 2016; Tschumi and Zscheischler, 2020), which represent the behaviour of developed versus developing nations, showing that, although developed nations may experience significant climate anomalies relative to their local climatic norms, they are generally less socio-economically impacted by droughts than developing countries, which tend to be more vulnerable due to limited adaptive capacity. To support this notion, Tanoue et al. (2016) mentioned that vulnerability is associated with the gross domestic product (GDP) of a region, with higher GDP (Europe, North America) indicating less vulnerability and lower GDP (South Africa, South America, South Asia) indicating greater vulnerability.
Similarly, Birkmann et al. (2022), Chen et al. (2020), and Lavell et al. (2012) claimed that developed regions, with their robust infrastructure, diversified economies, and social safety nets, are better equipped to cope with drought impacts compared to less developed regions with limited resources and institutional capacities. For instance, developed countries may have access to advanced irrigation systems and drought insurance schemes, whereas less developed countries often rely heavily on rainfed agriculture and face greater challenges in mitigating drought impacts. By understanding the association between CDI and GDIS, our study helped to highlight the disparities and complex dynamics of drought hazard and vulnerability between developed and developing nations. These insights could be used to inform area-specific policy implementation and management practices. By integrating multiple indicators, CDI provides a more comprehensive view of drought conditions that is useful for identifying at-risk areas. For example, in regions like East Africa or Central India, where both rainfall deficits and vegetation stress are common during droughts, CDI captures these multiple dimensions more effectively than single-parameter indices. Its regionalised structure ensures better alignment with local climate dynamics, enhancing its potential utility in forecasting and policy targeting. With adaptation to near-real-time inputs, the CDI framework could support early warning systems and guide proactive measures such as crop insurance triggers or water allocation planning. While this study focused on false-negative cases using GDIS as a reference, a systematic assessment of false-positive cases remains challenging. This is due not only to the lack of defined temporal frames for reverse analysis but also to the incomplete coverage of drought impacts in GDIS, especially in developing regions where many drought events may go unreported. These limitations could be addressed in future research using more comprehensive and high-resolution impact datasets.
Although 96 % of GDIS events aligned with CDI, there were a few GDIS events that CDI could not capture. This indicates that there was socio-economic stress during these periods, but it was not due to hydro-climatological drought hazards. Other factors must have contributed to this stress. One such event was observed in Burundi (Africa) from June 2001 to December 2001 and in Uganda and Eswatini in southern Africa. Another inconsistent GDIS event was noticed in Peru (South America) in 2010 and Thailand in 2005, when no significant CDI anomalies were observed, yet these periods were noted in the GDIS dataset. These observations demand a more detailed analysis of these events and an understanding of the regional characteristics that might have led to these discrepancies.
The association between the CDI and the GDIS is one of the key takeaway messages of our study, as it directly addresses the gap in understanding actual drought hazards and their socio-economic impacts. However, there are some limitations to this study. One of the primary limitations is the incompleteness of the GDIS data. Although GDIS provides valuable information on impacts, the dataset covers only 60 % of events registered in EM-DAT at the subnational level. Neither EM-DAT nor GDIS can cover all disaster details and impacts comprehensively. Additionally, EM-DAT data sometimes lack exact start and end dates for certain disasters, which might mislead the analysis. Hence, there is still room for improvement in understanding the socio-economic impacts of hazards using accurate datasets or on-ground insights. Emerging approaches such as text mining and natural language processing (NLP) offer promising pathways to address this gap by automatically extracting drought impact information from news articles, institutional reports, and other social media (Fritz et al., 2019; Sathianarayanan et al., 2024) and could serve as alternative or supplementary impact datasets alongside GDIS and EM-DAT. In this study, we developed and compared CDI with the main widely used indices; however, CDI should also be compared with other drought monitoring indices to establish its superiority. One of the other limitations of this research is not considering hydrological variables (groundwater, surface runoff, etc.) in the development of CDI. Due to the limited availability of consistent and high-resolution hydrological data on a global scale, hydrological variables were not included in this study. This may have contributed to certain disparities in detecting GDIS events. While regional high-resolution modelled datasets (e.g. LISFLOOD in Europe) are available, the lack of globally consistent and validated hydrological data remains a constraint. In future work, we will aim to incorporate hydrological variables for computing CDI weights to further improve drought detection and its link to socio-economic events. Further, other alternative methods such as entropy weighting, the analytic hierarchy process, or machine learning-based feature importance (like random forests) could be explored to compute weights in CDI, as they may better capture indicator relevance by incorporating data variability, expert knowledge, or nonlinear relationships with observed impacts.
Droughts rank among the most dangerous natural disasters, influencing a wide array of factors both directly and indirectly, with significant impacts on various socio-economic sectors. Despite numerous techniques and indices for analysing the physical characteristics of droughts, the methods for understanding their direct socio-economic impacts remain underexplored, particularly at subnational levels. Our study addressed this research gap by investigating the direct propagation of agro-climatological droughts to socio-economic impacts using the GDIS dataset, which provides socio-economic disaster information. Although several indices exist for drought assessment, many rely on single input parameters and fail to consider a comprehensive range of contributing factors, limiting their effectiveness in representing the socio-economic impacts of droughts. To address this limitation, we developed a new combined drought indicator (CDI) that integrates two agricultural (soil moisture and NDVI) and two meteorological (rainfall and temperature) variables to assess drought conditions. The comparative analysis indicates that the proposed index performs consistently well across different drought scenarios and offers a more integrated representation of drought patterns, showing a strong association with observed GDIS events and potential links to socio-economic impacts. The takeaway messages from this study can be summarised as follows:
-
Globally, the multiparameter approach of the CDI proves to be a highly useful tool for assessing agro-climatological droughts compared to commonly used single-parameter-based traditional indicators such as SPI, SSMI, NDVI, and STI.
-
CDI-derived drought clusters show strong spatial and temporal association with GDIS-reported drought events, with approximately 95 % of GDIS events successfully identified using the CDI. This suggests that the index effectively captures drought conditions that frequently align with documented socio-economic impacts.
-
The GDIS dataset provides direct socio-economic hazard event information and can be a valuable validation tool for drought indices.
-
Regions characterised by the highest frequencies of drought events, as identified by GDIS and multiple indices, including CDI, are predominantly located in sub-Saharan Africa, South Asia, South America, and Central America, underscoring the heightened vulnerability of these areas to drought occurrences.
This study underscores the applicability of CDI in analysing droughts with enhanced precision compared to individual indices, effectively capturing their socio-economic repercussions. The direct usability of this technique worldwide could advance drought monitoring systems and inform policy development aimed at addressing both the socio-economic and agro-climatological impacts of droughts.
Table A1Stepwise procedure for assessing the consistency of gridded drought indices with GDIS drought events.
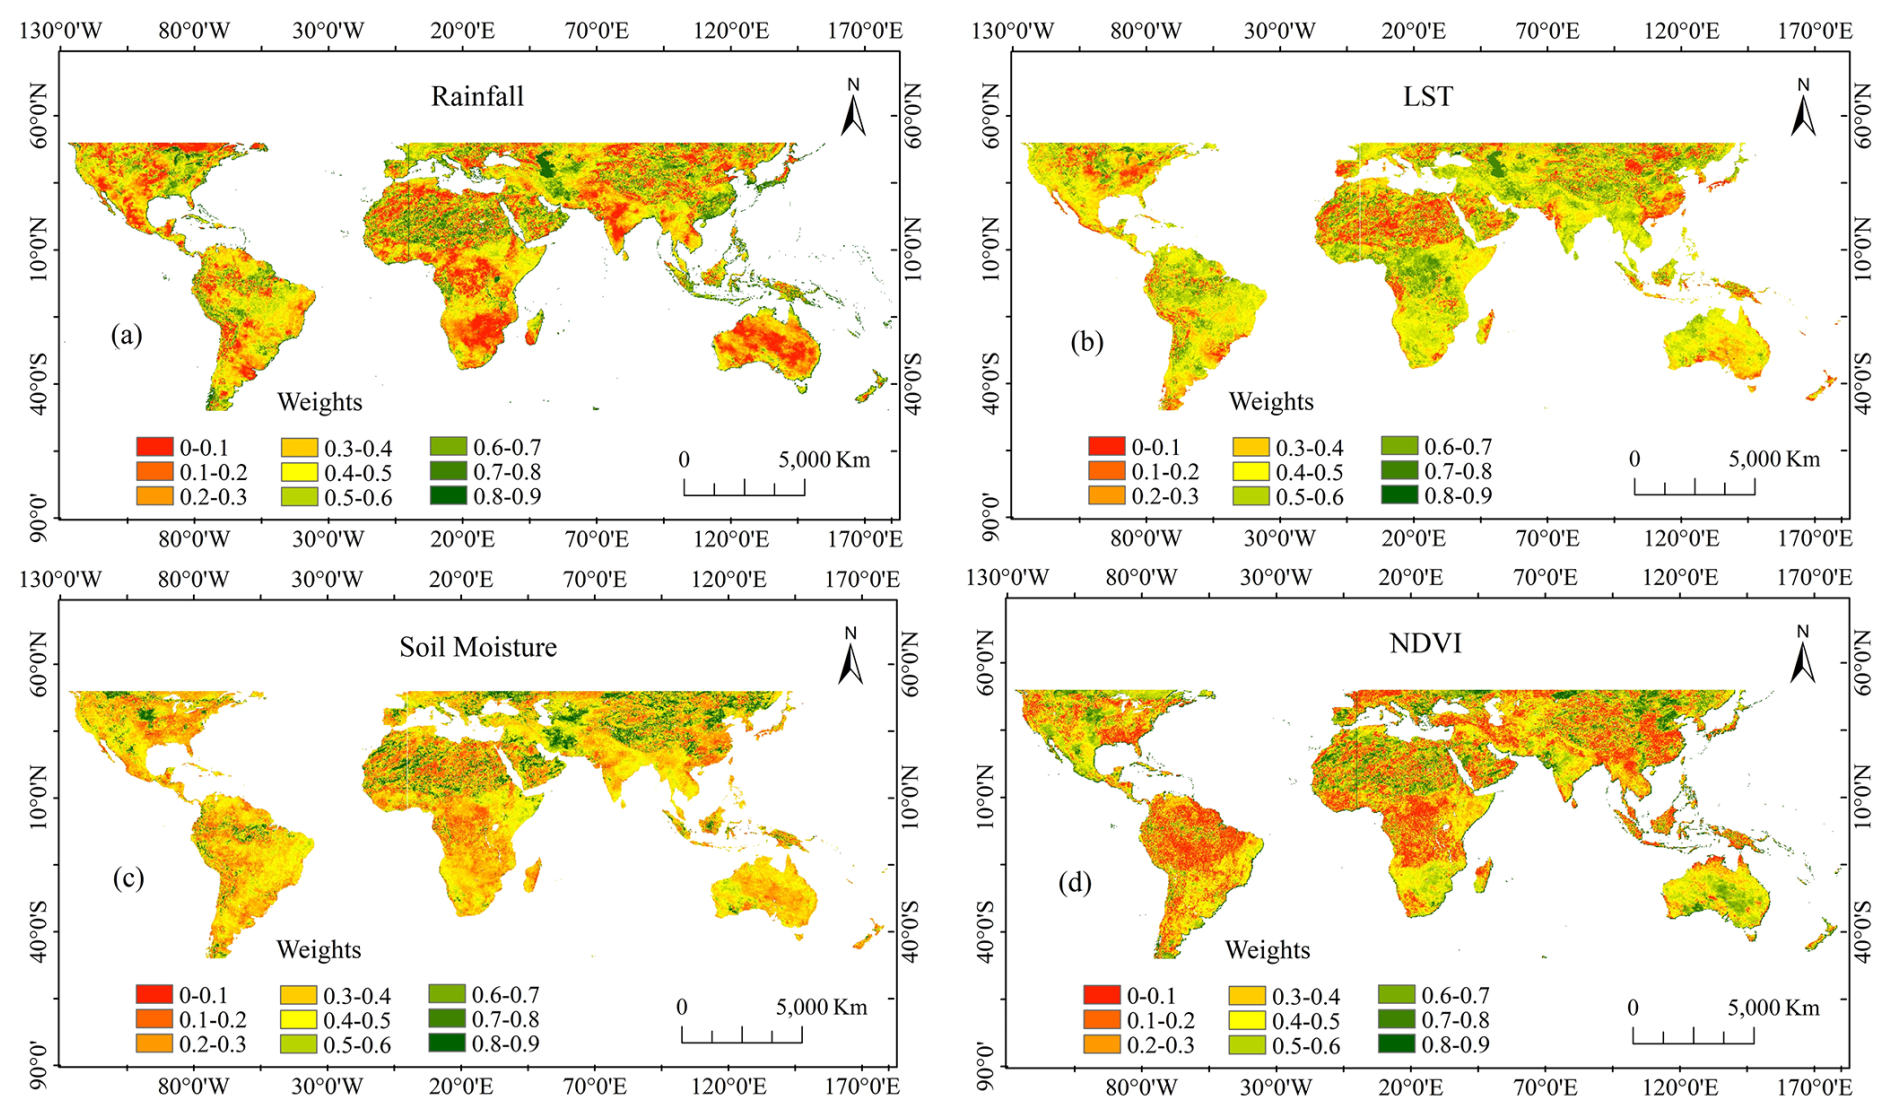
Figure B1Example of pixel-based weights for the four input variables of CDI, i.e. rainfall (a), LST (b), soil moisture (c), and NDVI (d), calculated using the PCA method for a sample month (April). The weights range from 0 to 1, with colours varying from dark red (lower weights) to dark green (higher weights).
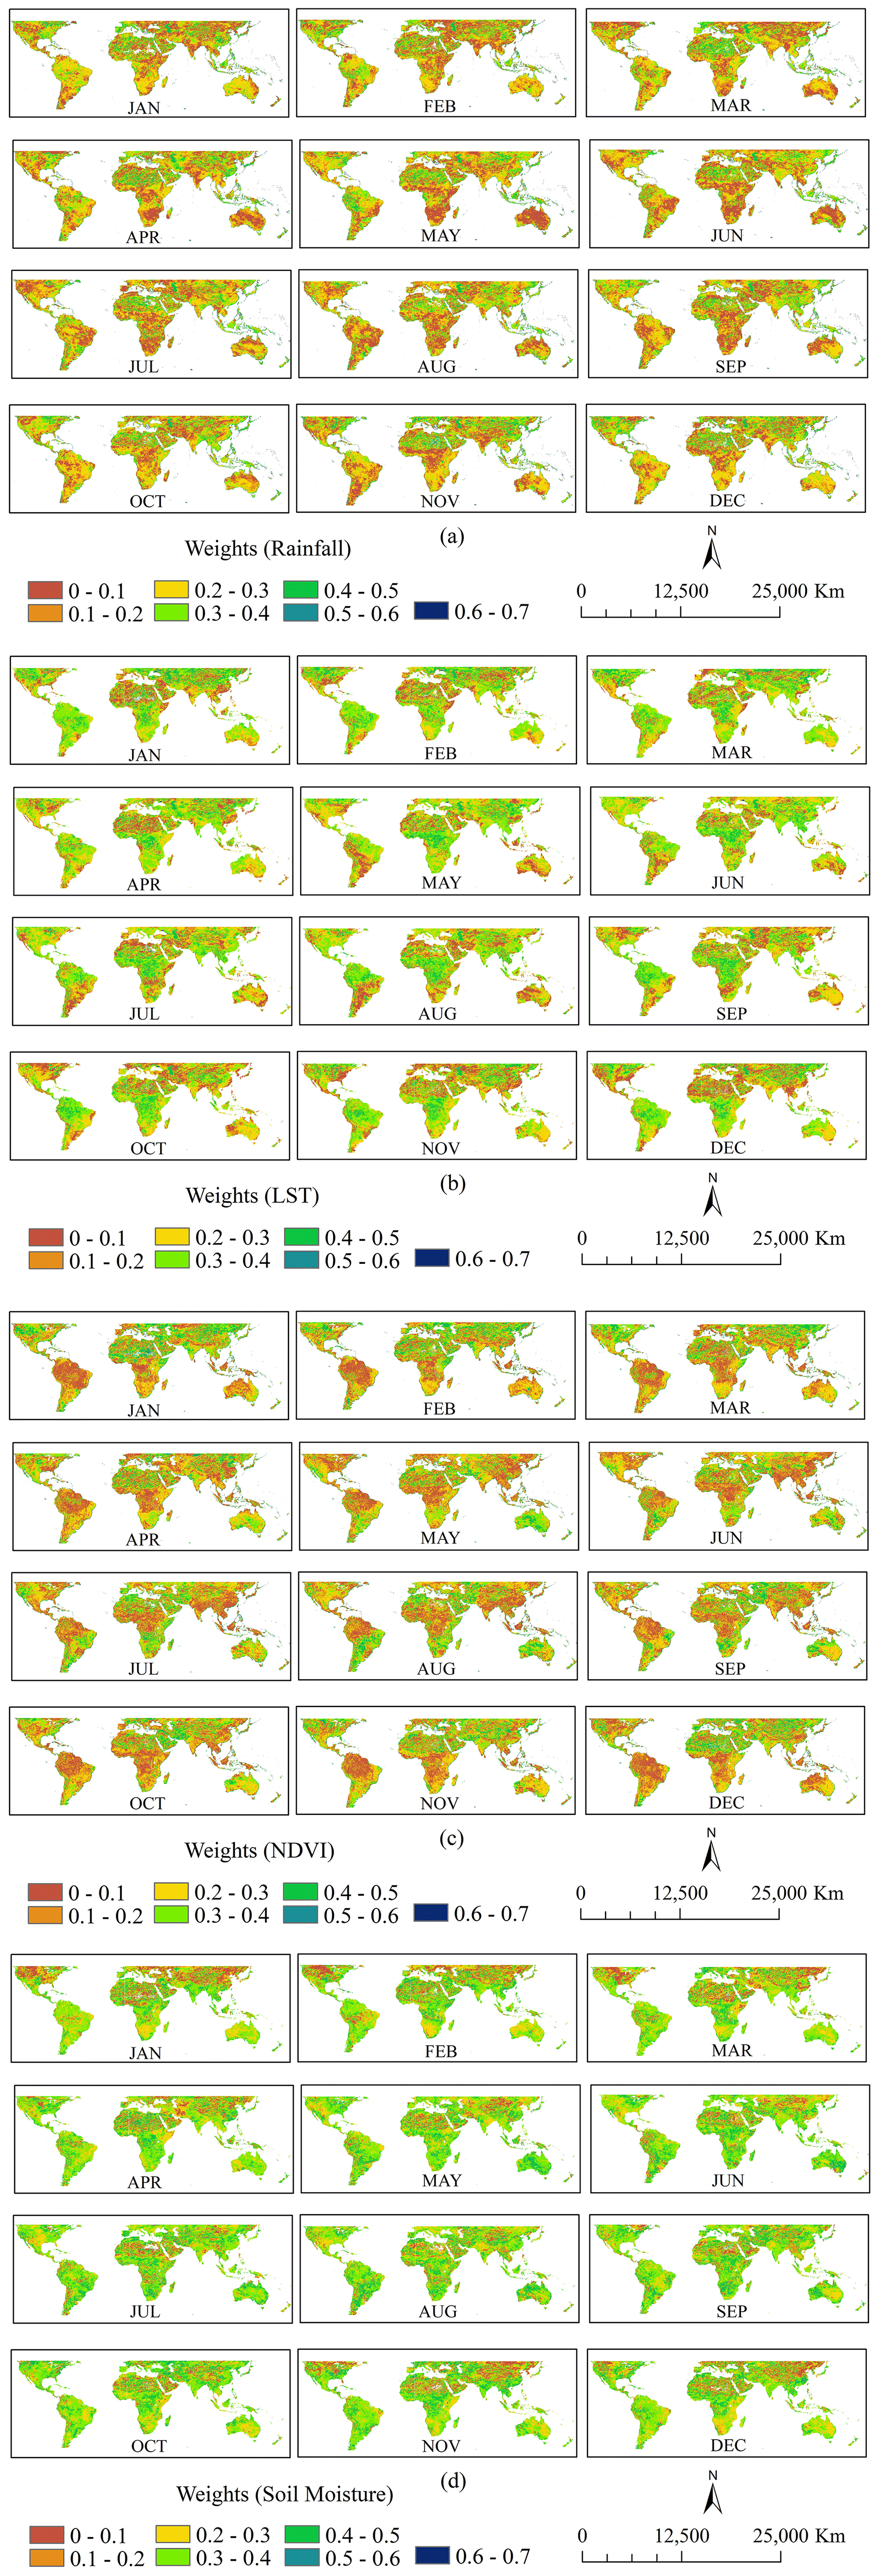
Figure C1Monthly spatial distribution of PCA-derived weights for rainfall (a); colour scales indicate the relative contribution of each variable to CDI (brown = low weight, green = moderate weight, blue = high weight). Monthly spatial distribution of PCA-derived weights for temperature (b); colour scales indicate the relative contribution of each variable to CDI (brown = low weight, green = moderate weight, blue = high weight). Monthly spatial distribution of PCA-derived weights for NDVI (c); colour scales indicate the relative contribution of each variable to CDI (brown = low weight, green = moderate weight, blue = high weight). Monthly spatial distribution of PCA-derived weights for soil moisture (d); colour scales indicate the relative contribution of each variable to CDI (brown = low weight, green = moderate weight, blue = high weight).
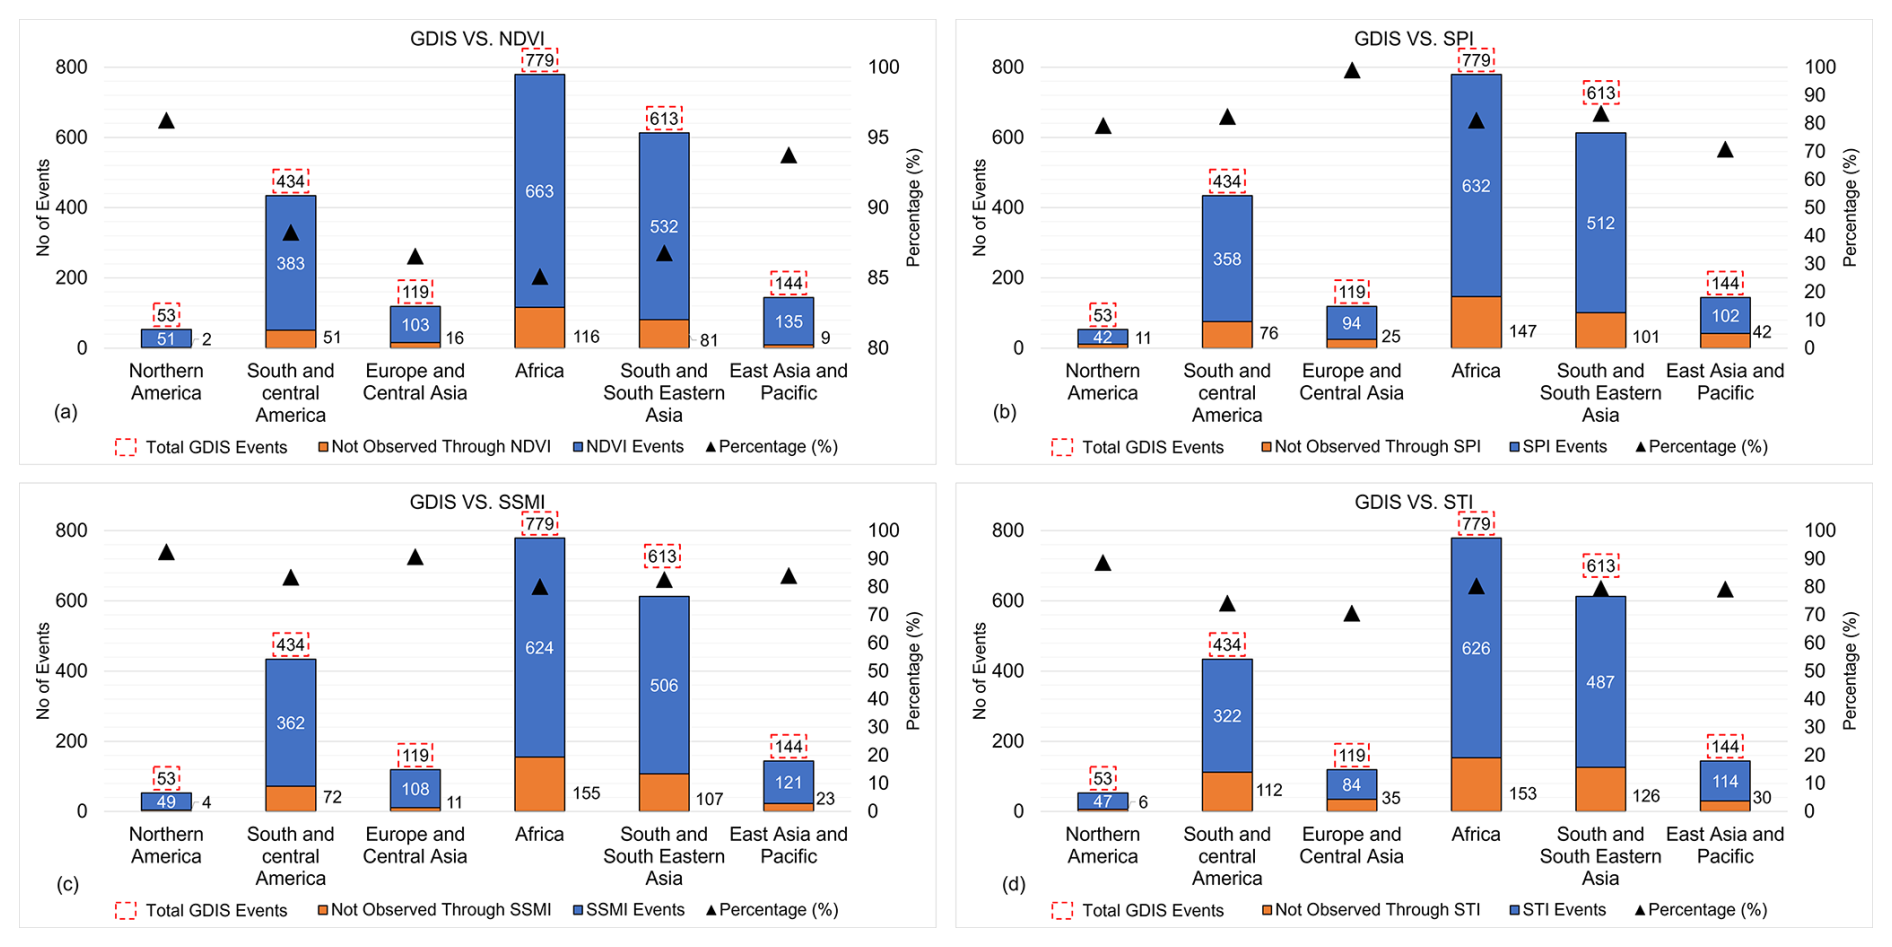
Figure D1Performance of traditional drought indices in capturing GDIS events across global regions: comparative assessment of (a) NDVI, (b) SPI, (c) SSMI, and (d) STI.
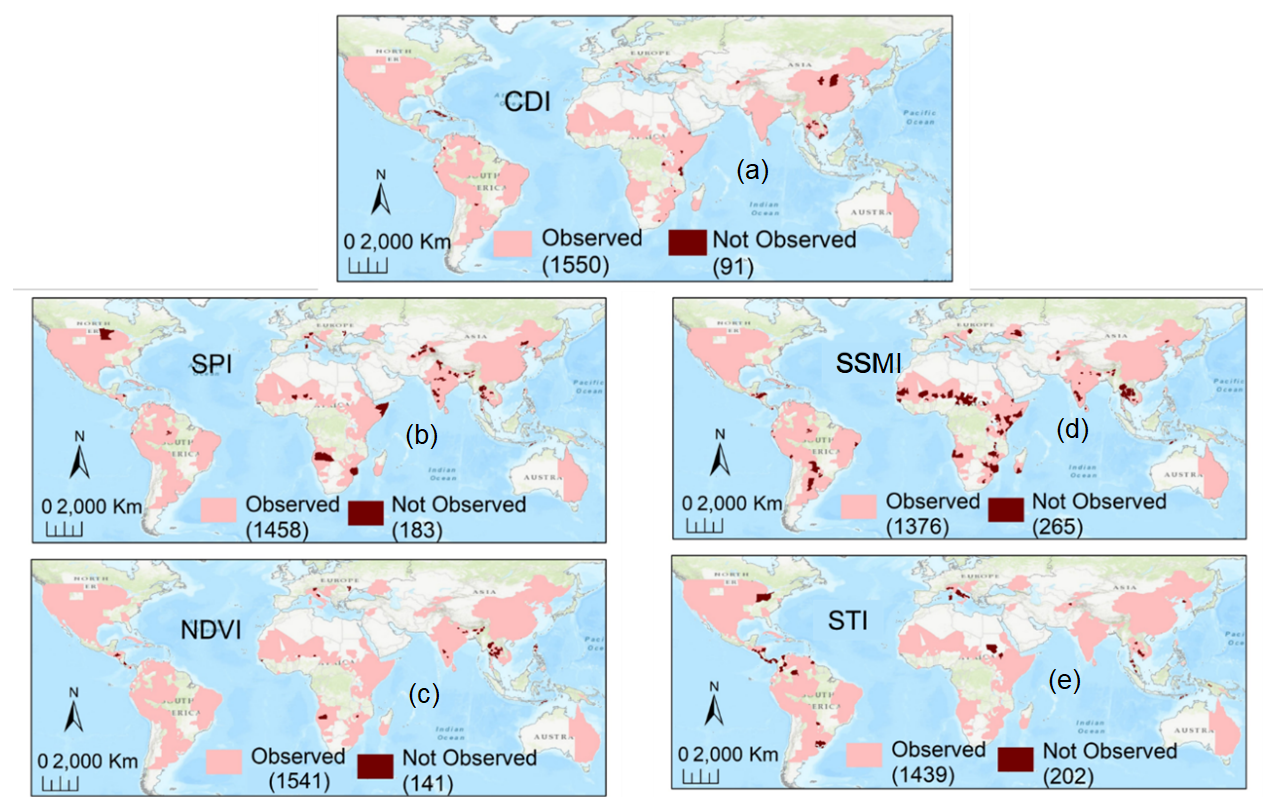
Figure E1Spatial location-wise performance of CDI (a), SPI (b), NDVI (c), SSMI (d), and STI (e) in detecting GDIS events, where consistent events detected by each index are shown in pink, while inconsistent GDIS events (not observed) are shown in dark brown. The drought identification criteria were set to events during the actual drought period without considering short droughts (total GDIS events count = 1641).
Table F1Performance of SPI in detecting GDIS events using multiple criteria.
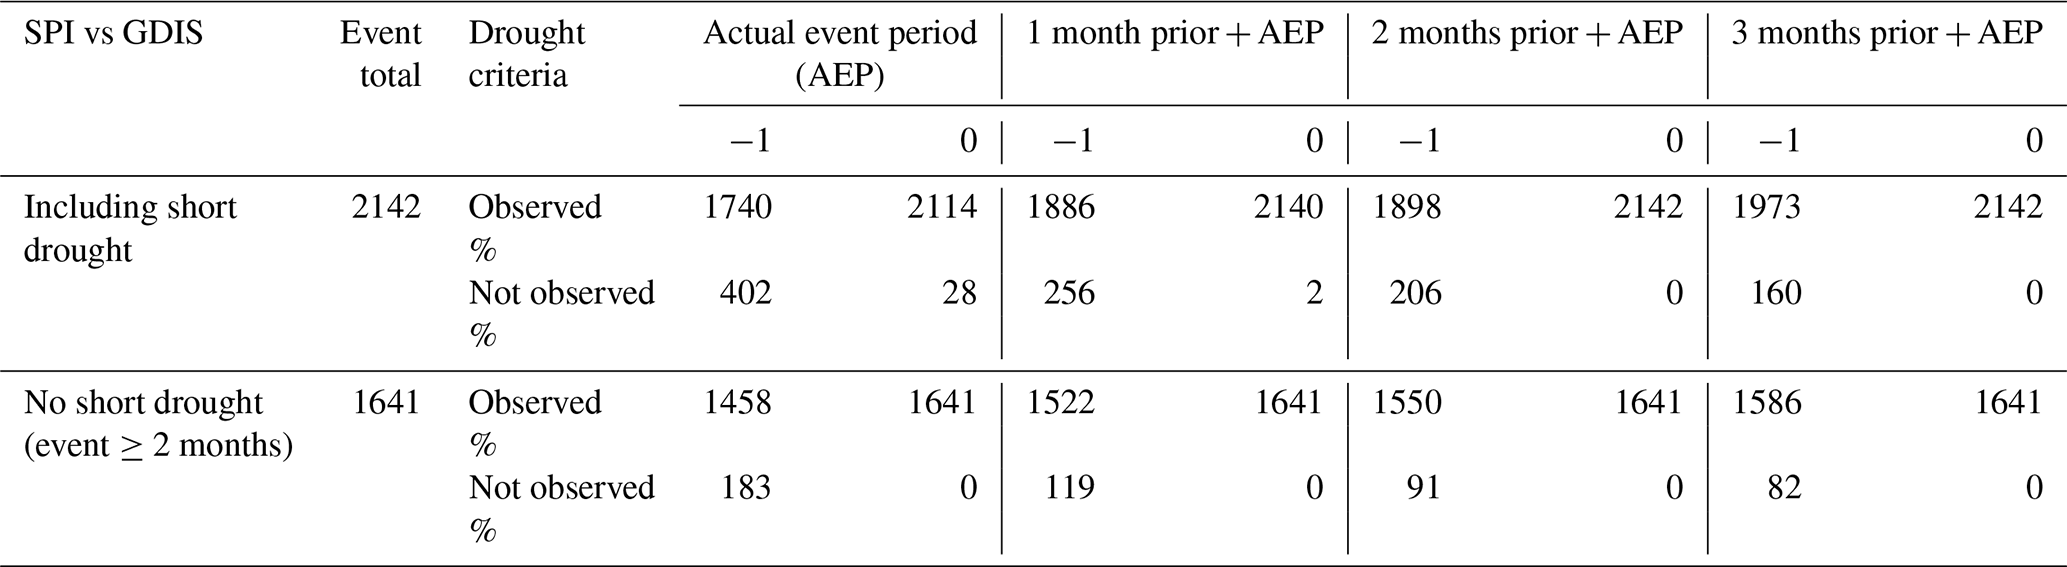
Table F2Performance of SSMI in detecting GDIS events using multiple criteria.
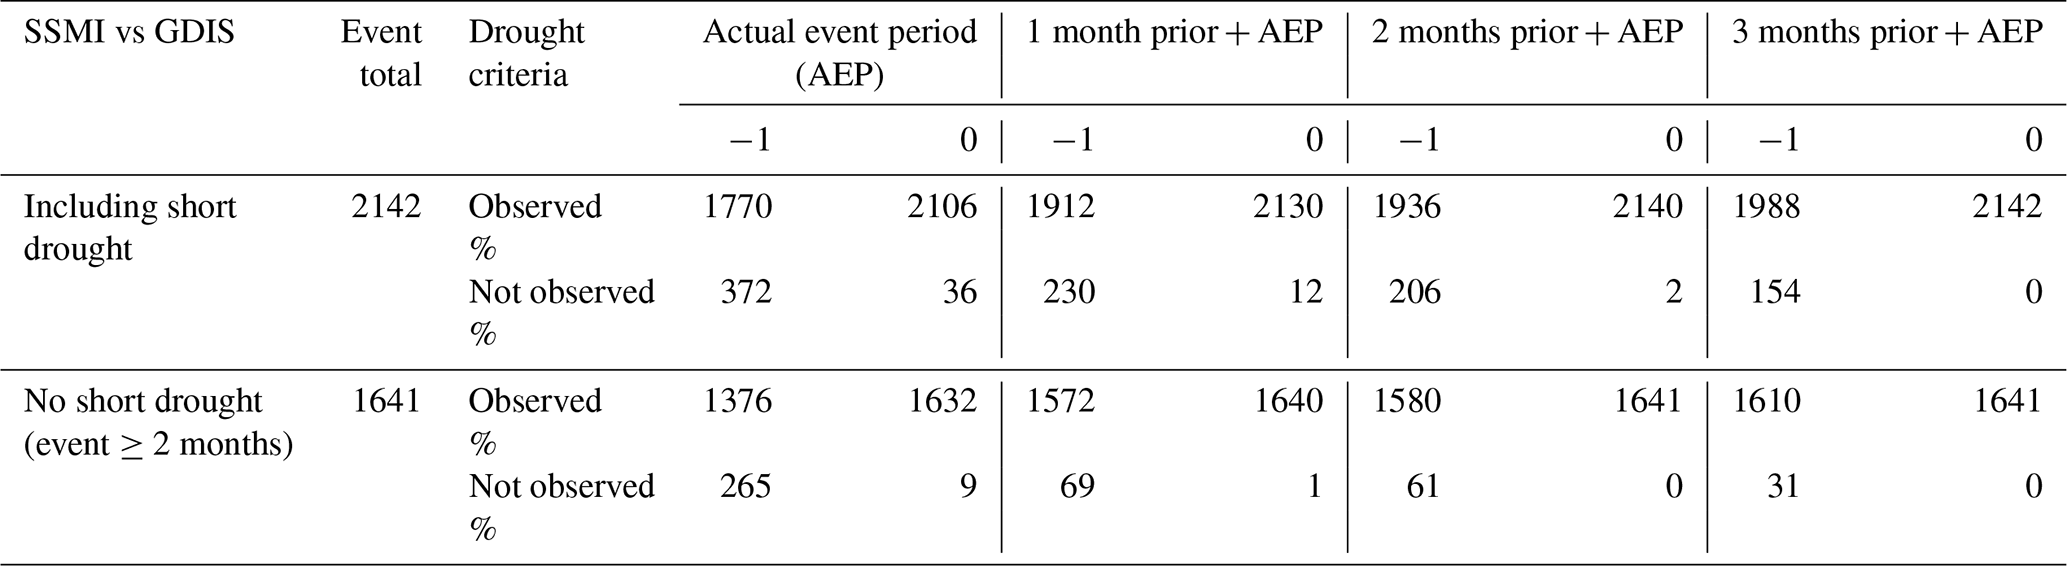
Table F3Performance of NDVI in detecting GDIS events using multiple criteria.
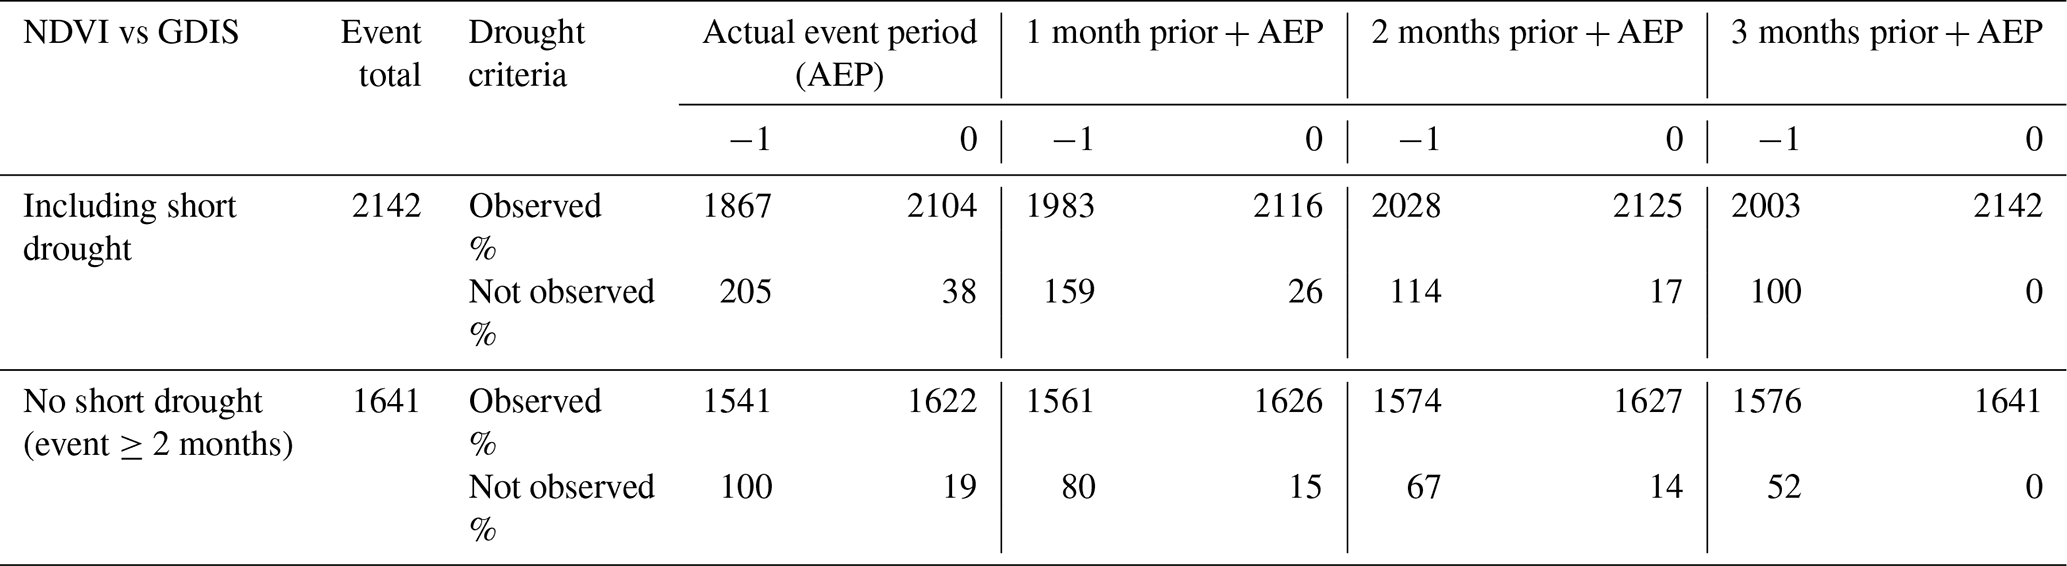
Table F4Performance of STI in detecting GDIS events using multiple criteria.
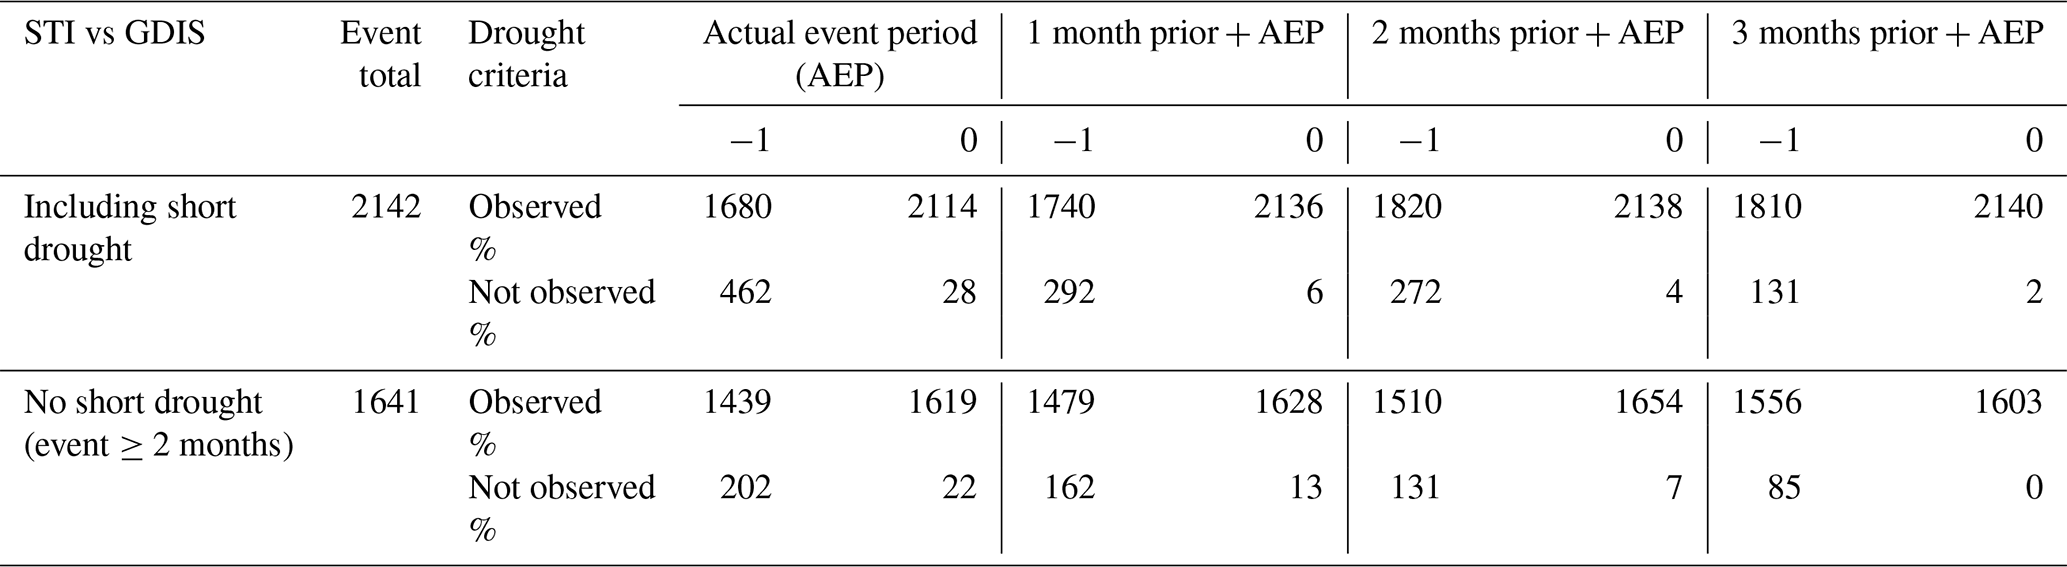
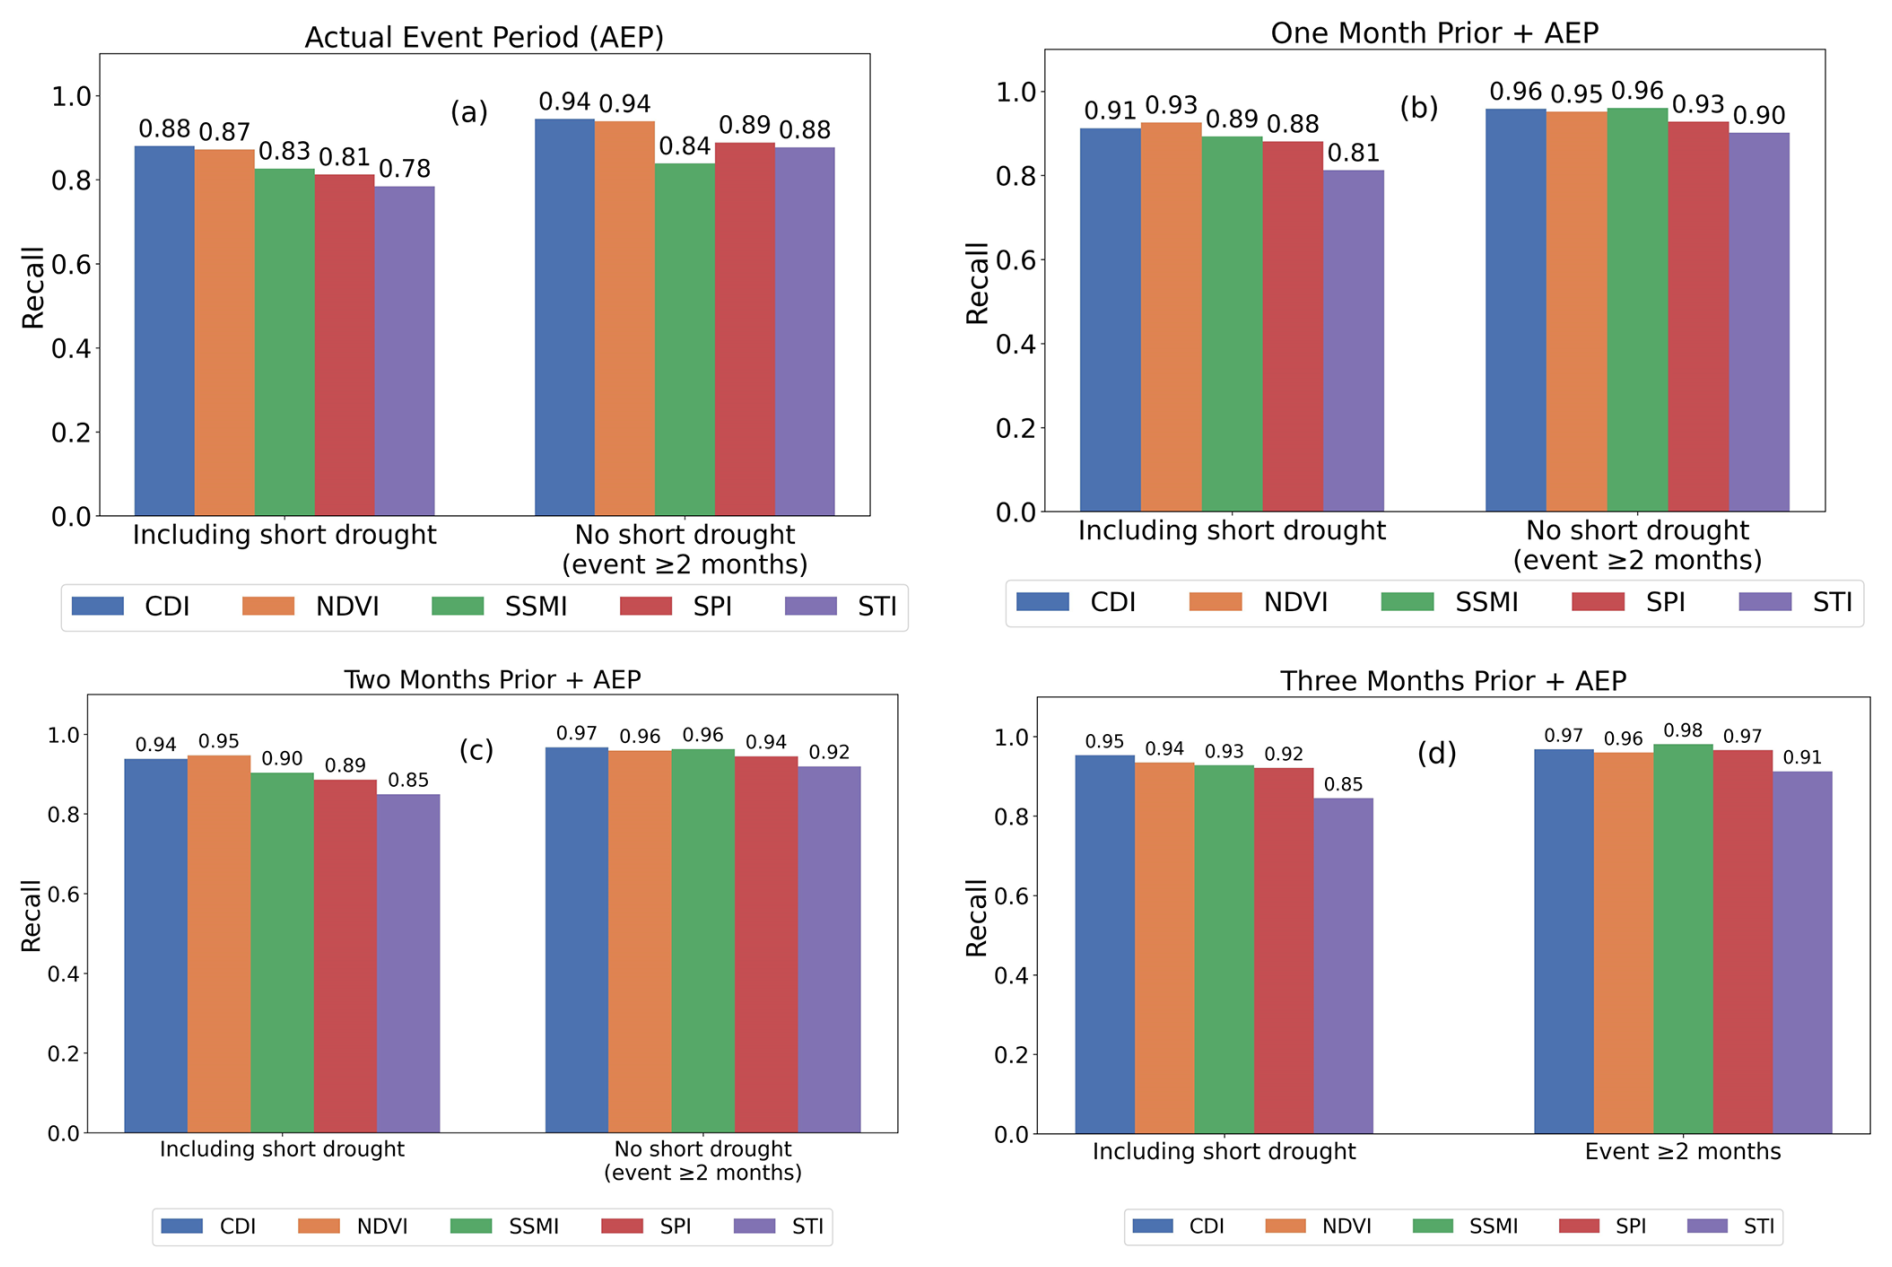
Figure G1Comparative performance recall of five drought indices (CDI, NDVI, SSMI, SPI, and STI) across different time windows and event durations.
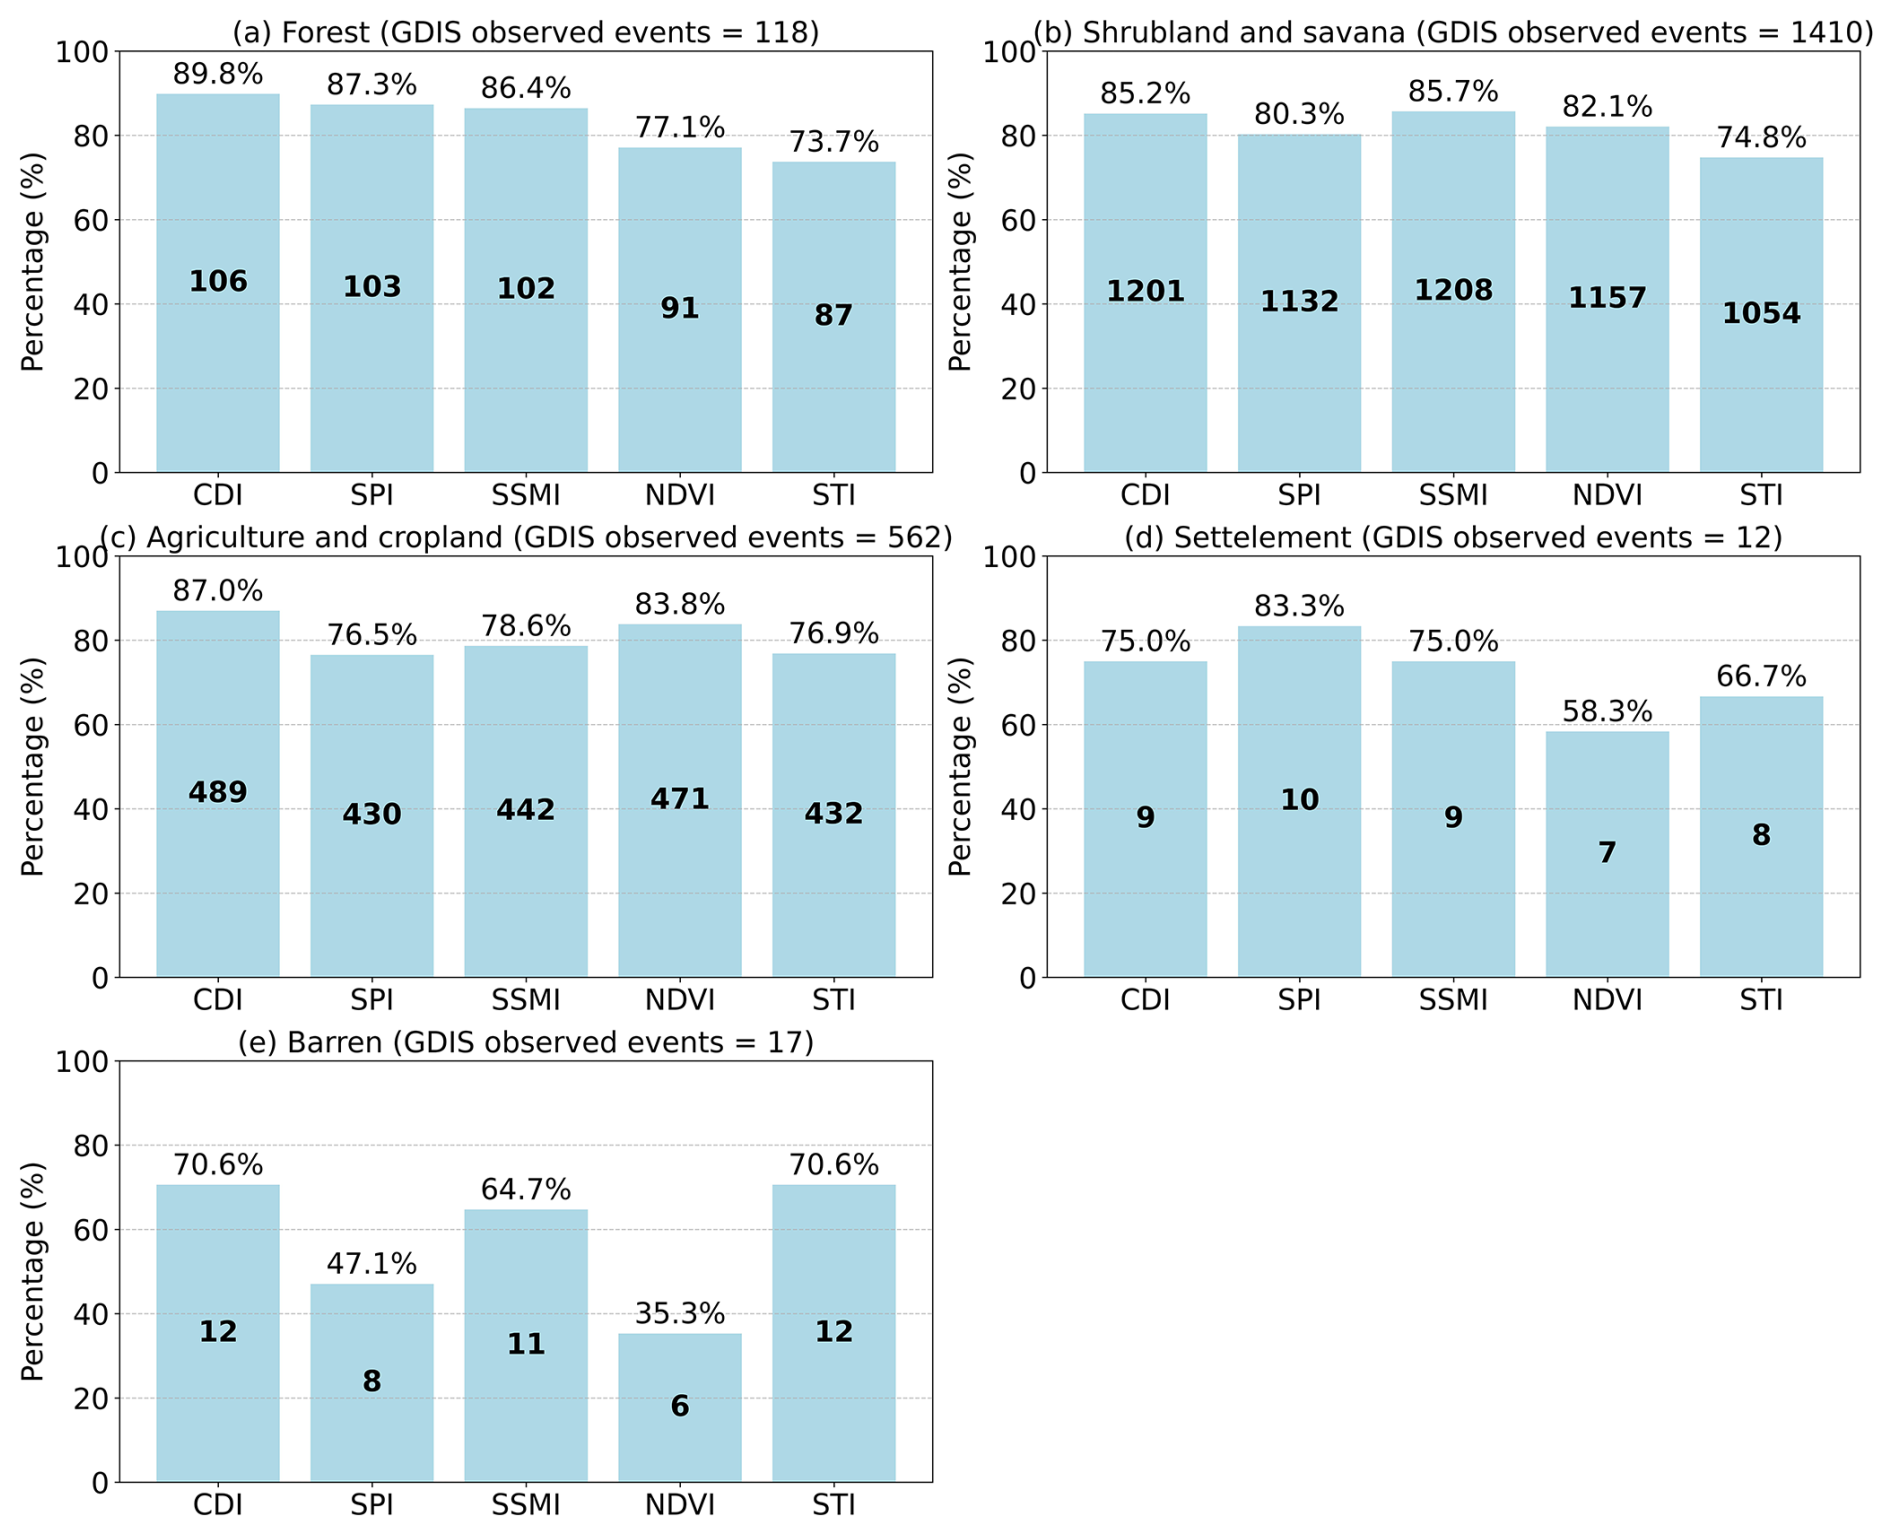
Figure H1Land-cover-wise accuracy of drought indices (CDI, SPI, SSMI, NDVI, STI) in detecting GDIS events across five major land cover classes (forest, shrubland and savanna, agriculture and cropland, settlement, and barren) based on MODIS land cover data. The bar heights represent the percentage of GDIS events accurately captured, while values inside the bars indicate the absolute number of consistent detections. The total number of GDIS events considered per land cover class is as follows: forest – 118, shrubland and savanna – 1410, agriculture and cropland – 562, settlement – 12, and barren – 17.
All data and codes are available from the corresponding authors upon request.
SK and YS designed the study, with SK executing the work. SK prepared the paper with contributions from YS, YB, and BW. YS and SK secured the funding.
The contact author has declared that none of the authors has any competing interests.
Publisher’s note: Copernicus Publications remains neutral with regard to jurisdictional claims made in the text, published maps, institutional affiliations, or any other geographical representation in this paper. While Copernicus Publications makes every effort to include appropriate place names, the final responsibility lies with the authors.
This article is part of the special issue “Drought, society, and ecosystems (NHESS/BG/GC/HESS inter-journal SI)”. It is not associated with a conference.
We gratefully acknowledge the financial support provided by the Japan Aerospace Exploration Agency (grant no. ER3AMF106), JSPS KAKENHI (grant nos. 21H01430 and 24K17352), the Japan Society for the Promotion of Science (grant no. 21H01430), and the Katsu Kimura Research Award for this research. We are also thankful to the executive editor (Giuliano Di Baldassarre), Jasmin Heilemann, Samuel Jonson Sutanto, and the anonymous reviewer for their valuable comments and suggestions during the revision process, which significantly contributed to improving the quality of this paper.
This research has been supported by the Japan Aerospace Exploration Agency (grant no. ER3AMF106), JSPS KAKENHI (grant nos. 21H01430 and 24K17352), the Japan Society for the Promotion of Science (grant no. 21H01430), and the Katsu Kimura Research Award.
This paper was edited by Giuliano Di Baldassarre and reviewed by Jasmin Heilemann, Samuel Jonson Sutanto, and one anonymous referee.
Bachmair, S., Stahl, K., Collins, K., Hannaford, J., Acreman, M., Svoboda, M., Knutson, C., Smith, K. H., Wall, N., Fuchs, B., Crossman, N. D., and Overton, I. C.: Drought indicators revisited: the need for a wider consideration of environment and society, WIREs Water, 3, 516–536, https://doi.org/10.1002/wat2.1154, 2016.
Bayissa, Y., Srinivasan, R., Joseph, G., Bahuguna, A., Shrestha, A., Ayling, S., Punyawardena, R., and Nandalal, K. D. W.: Developing a Combined Drought Index to Monitor Agricultural Drought in Sri Lanka, Water (Switzerland), 14, 3317, https://doi.org/10.3390/w14203317, 2022.
Bayissa, Y. A., Tadesse, T., Svoboda, M., Wardlow, B., Poulsen, C., Swigart, J., and Van Andel, S. J.: Developing a satellite-based combined drought indicator to monitor agricultural drought: a case study for Ethiopia, GIsci. Remote Sens., 56, 718–748, https://doi.org/10.1080/15481603.2018.1552508, 2019.
Bhanage, V., Lee, H. S., Kubota, T., Pradana, R. P., Fajary, F. R., Arya Putra, I. D. G., and Nimiya, H.: City-Wise Assessment of Suitable CMIP6 GCM in Simulating Different Urban Meteorological Variables over Major Cities in Indonesia, Climate, 11, 100, https://doi.org/10.3390/cli11050100, 2023.
Bhunia, P., Das, P., and Maiti, R.: Meteorological Drought Study Through SPI in Three Drought Prone Districts of West Bengal, India, Earth Systems and Environment, 4, 43–55, https://doi.org/10.1007/s41748-019-00137-6, 2020.
Birkmann, J., Jamshed, A., McMillan, J. M., Feldmeyer, D., Totin, E., Solecki, W., Ibrahim, Z. Z., Roberts, D., Kerr, R. B., Poertner, H. O., Pelling, M., Djalante, R., Garschagen, M., Leal Filho, W., Guha-Sapir, D., and Alegría, A.: Understanding human vulnerability to climate change: A global perspective on index validation for adaptation planning, Sci. Total Environ., 803, 150065, https://doi.org/10.1016/j.scitotenv.2021.150065, 2022.
Blain, G. C., da Rocha Sobierajski, G., Weight, E., Martins, L. L., and Xavier, A. C. F.: Improving the interpretation of standardized precipitation index estimates to capture drought characteristics in changing climate conditions, Int. J. Climatol., 42, 5586–5608, https://doi.org/10.1002/joc.7550, 2022.
Bolten, J. D., Crow, W. T., Jackson, T. J., Zhan, X., and Reynolds, C. A.: Evaluating the Utility of Remotely Sensed Soil Moisture Retrievals for Operational Agricultural Drought Monitoring, IEEE J. Sel. Top. Appl., 3, 57–66, https://doi.org/10.1109/JSTARS.2009.2037163, 2010.
Brooks, N., Adger, W. N., and Kelly, P. M.: The determinants of vulnerability and adaptive capacity at the national level and the implications for adaptation, Global Environmental Change, 15, 151–163, https://doi.org/10.1016/J.GLOENVCHA.2004.12.006, 2005.
Brown, J. F., Wardlow, B. D., Tadesse, T., Hayes, M. J., and Reed, B. C.: The Vegetation Drought Response Index (VegDRI): A new integrated approach for monitoring drought stress in vegetation, GIsci. Remote Sens., 45, 16–46, https://doi.org/10.2747/1548-1603.45.1.16, 2008.
Brown, M. E. and Funk, C. C.: Food security under climate change, Science (1979), 319, 580–581, https://doi.org/10.1126/SCIENCE.1154102, 2008.
Chen, Z., Wang, W., Yu, Z., Xia, J., and Schwartz, F. W.: The collapse points of increasing trend of vegetation rain-use efficiency under droughts, Environ. Res. Lett., 15, 104072, https://doi.org/10.1088/1748-9326/abb332, 2020.
Christian, J. I., Basara, J. B., Hunt, E. D., Otkin, J. A., Furtado, J. C., Mishra, V., Xiao, X., and Randall, R. M.: Global distribution, trends, and drivers of flash drought occurrence, Nat. Commun., 12, 6330, https://doi.org/10.1038/s41467-021-26692-z, 2021.
Christian, J. I., Hobbins, M., Hoell, A., Otkin, J. A., Ford, T. W., Cravens, A. E., Powlen, K. A., Wang, H., and Mishra, V.: Flash drought: A state of the science review, WIREs Water, 11, e1714, https://doi.org/10.1002/wat2.1714, 2024.
Climate Hazards Center – UC Santa Barbara: CHIRPS: Rainfall Estimates from Rain Gauge and Satellite Observations, https://www.chc.ucsb.edu/data/chirps, last access: 20 September 2023.
Costanza, J. K., Koch, F. H., and Reeves, M. C.: Future exposure of forest ecosystems to multi-year drought in the United States, Ecosphere, 14, e4525, https://doi.org/10.1002/ecs2.4525, 2023.
Didan, K. and Huete, A.: MOD13A3 MODIS/Terra Vegetation Indices Monthly L3 Global 1 km SIN Grid (Version 6.1) [Data set], NASA Land Processes Distributed Active Archive Center, https://doi.org/10.5067/MODIS/MOD13A3.061 2023.
Ding, Y., He, X., Zhou, Z., Hu, J., Cai, H., Wang, X., Li, L., Xu, J., and Shi, H.: Response of vegetation to drought and yield monitoring based on NDVI and SIF, Catena (Amst), 219, 106328, https://doi.org/10.1016/j.catena.2022.106328, 2022.
National Drought Mitigation Center Drought Impact Reporter (DIR): In Drought.gov. U.S. National Integrated Drought Information System, https://www.drought.gov/data-maps-tools/drought-impact-reporter-dir (last access: 26 March 2025), 2025.
European Centre for Medium-Range Weather Forecasts.: ERA5-Land monthly mean surface air temperature, Copernicus Climate Change Service (C3S) Climate Data Store (CDS), https://cds.climate.copernicus.eu/datasets/reanalysis-era5-land-monthly-means (last access: 9 September 2025), 2023.
European Drought Centre.: European Drought Impact Report Inventory (EDII) and European Drought Reference (EDR) database, https://europeandroughtcentre.com/news/european-drought-impact-report-inventory-edii-and-european-drought-reference-edr-database/, last access: 26 March 2025.
European Environment Agency.: European Drought Observatory (EDO), https://www.eea.europa.eu/policy-documents/european-drought-observatory-edo, last access: 26 March 2025.
Forootan, E., Khaki, M., Schumacher, M., Wulfmeyer, V., Mehrnegar, N., van Dijk, A. I. J. M., Brocca, L., Farzaneh, S., Akinluyi, F., Ramillien, G., Shum, C. K., Awange, J., and Mostafaie, A.: Understanding the global hydrological droughts of 2003–2016 and their relationships with teleconnections, Sci. Total Environ., 650, 2587–2604, https://doi.org/10.1016/j.scitotenv.2018.09.231, 2019.
Fritz, S., See, L., Carlson, T., Haklay, M. (Muki), Oliver, J. L., Fraisl, D., Mondardini, R., Brocklehurst, M., Shanley, L. A., Schade, S., Wehn, U., Abrate, T., Anstee, J., Arnold, S., Billot, M., Campbell, J., Espey, J., Gold, M., Hager, G., He, S., Hepburn, L., Hsu, A., Long, D., Masó, J., McCallum, I., Muniafu, M., Moorthy, I., Obersteiner, M., Parker, A. J., Weissplug, M., and West, S.: Citizen science and the United Nations Sustainable Development Goals, Nature Sustainability, 2, 922–930, https://doi.org/10.1038/s41893-019-0390-3, 2019.
Gorsuch, R. L.: Factor analysis: Classic edition, Routledge, 2014.
Grillakis, M. G.: Increase in severe and extreme soil moisture droughts for Europe under climate change, Sci. Total Environ., 660, 1245–1255, https://doi.org/10.1016/j.scitotenv.2019.01.001, 2019.
Guillory, L., Pudmenzky, C., Nguyen-Huy, T., Cobon, D., and Stone, R.: A drought monitor for Australia, Environ. Modell. Softw., 170, 105852, https://doi.org/10.1016/j.envsoft.2023.105852, 2023.
Hannachi, A., Jolliffe, I. T., and Stephenson, D. B.: Empirical orthogonal functions and related techniques in atmospheric science: A review, Int. J. Climatol., 27, 1119–1152, https://doi.org/10.1002/JOC.1499, 2007.
Hao, Z. and Singh, V. P.: Drought characterization from a multivariate perspective: A review, J. Hydrol. (Amst), 527, 668–678, https://doi.org/10.1016/J.JHYDROL.2015.05.031, 2015.
Hao, Z., AghaKouchak, A., Nakhjiri, N., and Farahmand, A.: Global integrated drought monitoring and prediction system, Sci. Data, 1, 140001, https://doi.org/10.1038/sdata.2014.1, 2014a.
Hao, Z., AghaKouchak, A., Nakhjiri, N., and Farahmand, A.: Global integrated drought monitoring and prediction system, Sci. Data, 1, 140001, https://doi.org/10.1038/sdata.2014.1, 2014b.
Hossain, A. T. MacMurchy, K., Shah, J., and Swatuk, L.: Creating Water-Secure Futures in Megacities: A Comparative Case Study of “Day Zero” Cities–Bangalore and Chennai, in: The Political Economy of Urban Water Security under Climate Change, edited by: Swatuk, L. and Cash, C., Springer International Publishing, Cham, 105–134, https://doi.org/10.1007/978-3-031-08108-8_5, 2022.
Huang, S., Wang, L., Wang, H., Huang, Q., Leng, G., Fang, W., and Zhang, Y.: Spatio-temporal characteristics of drought structure across China using an integrated drought index, Agr. Water Manage., 218, 182–192, https://doi.org/10.1016/j.agwat.2019.03.053, 2019.
Jackson, D. A.: Stopping Rules in Principal Components Analysis: A Comparison of Heuristical and Statistical Approaches, Ecology, 74, 2204–2214, https://doi.org/10.2307/1939574, 1993.
Ji, L. and Peters, A. J.: Assessing vegetation response to drought in the northern Great Plains using vegetation and drought indices, Remote Sens. Environ., 87, 85–98, https://doi.org/10.1016/S0034-4257(03)00174-3, 2003.
Jiao, W., Tian, C., Chang, Q., Novick, K. A., and Wang, L.: A new multi-sensor integrated index for drought monitoring, Agr. Forest Meteorol., 268, 74–85, https://doi.org/10.1016/j.agrformet.2019.01.008, 2019.
Jolliffe, I. T.: Principal component analysis (2nd ed.), Springer, https://doi.org/10.1007/b98835, 2002.
Kageyama, Y. and Sawada, Y.: Global assessment of subnational drought impact based on the Geocoded Disasters dataset and land reanalysis, Hydrol. Earth Syst. Sci., 26, 4707–4720, https://doi.org/10.5194/hess-26-4707-2022, 2022.
Kazemzadeh, M., Noori, Z., Alipour, H., Jamali, S., Akbari, J., Ghorbanian, A., and Duan, Z.: Detecting drought events over Iran during 1983–2017 using satellite and ground-based precipitation observations, Atmos. Res., 269, 106052, https://doi.org/10.1016/j.atmosres.2022.106052, 2022.
Kogan, F. N.: Application of vegetation index and brightness temperature for drought detection, Adv. Space Res., 15, 91–100, https://doi.org/10.1016/0273-1177(95)00079-T, 1995.
Kulkarni, S. and Gedam, S.: Geospatial approach to categorize and compare the agro-climatological droughts over marathwada region of Maharashtra, India, ISPRS Ann. Photogramm. Remote Sens. Spatial Inf. Sci., IV-5, 279–285, https://doi.org/10.5194/isprs-annals-IV-5-279-2018, 2018.
Kulkarni, S., Gedam, S., and Dhorde, A.: District Wise Comparative Analysis of Rainfall Trends in Konkan-Goa and Marathwada Meteorological Subdivision of India, Applied Ecology and Environmental Sciences, 9, 885–894, https://doi.org/10.12691/aees-9-10-6, 2021.
Kulkarni, S., Kumar, V., Bhanage, V., and Gedam, S.: Exploring the Association between Changing Crop Types and Water Scarcity: A Case Study over West-Central India, Climate, 11, 93, https://doi.org/10.3390/cli11050093, 2023.
Kulkarni, S. S., Wardlow, B. D., Bayissa, Y. A., Tadesse, T., Svoboda, M. D., and Gedam, S. S.: Developing a remote sensing-based combined drought indicator approach for agricultural drought monitoring over Marathwada, India, Remote Sens. (Basel), 12, 2091, https://doi.org/10.3390/rs12132091, 2020.
Lavell, A., Oppenheimer, M., Diop, C., Hess, J., Lempert, R., Li, J., Muir-Wood, R., Myeong, S., Moser, S., Takeuchi, K., Cardona, O. D., Hallegatte, S., Lemos, M., Little, C., Lotsch, A., and Weber, E.: Climate change: New dimensions in disaster risk, exposure, vulnerability, and resilience, in: Managing the Risks of Extreme Events and Disasters to Advance Climate Change Adaptation: Special Report of the Intergovernmental Panel on Climate Change, edited by: Field, C. B., Barros, V., Stocker, T. F., Qin, D., Dokken, D., Ebi, K. L., Mastrandrea, M. D., Mach, K. J., Plattner, G.-K., Allen, S. K., Tignor, M., and Midgley, P. M., Cambridge University Press, Cambridge, UK, 25–64, https://doi.org/10.1017/CBO9781139177245.004, 2012.
Liu, Y., Liu, Y., Wang, W., Fan, X., and Cui, W.: Soil moisture droughts in East Africa: Spatiotemporal patterns and climate drivers, J. Hydrol. Reg. Stud., 40, 101013, https://doi.org/10.1016/j.ejrh.2022.101013, 2022.
Livada, I. and Assimakopoulos, V. D.: Spatial and temporal analysis of drought in Greece using the Standardized Precipitation Index (SPI), Theor. Appl. Climatol., 89, 143–153, https://doi.org/10.1007/s00704-005-0227-z, 2007.
Lobell, D. B. and Burke, M. B.: On the use of statistical models to predict crop yield responses to climate change, Agr. Forest Meteorol., 150, 1443–1452, https://doi.org/10.1016/J.AGRFORMET.2010.07.008, 2010.
McKee, T. B., Doesken, N. J., and Kleist, J.: The Relationship of Drought Frequency and Duration to Time Scales, in: Proceedings of the 8th Conference on Applied Climatology, American Meteorological Society, Anaheim, California, USA, 17–22 January 1993, 179–184, https://climate.colostate.edu/pdfs/relationshipofdroughtfrequency.pdf, 1993.
Mishra, V.: Long-term (1870–2018) drought reconstruction in context of surface water security in India, J. Hydrol. (Amst), 580, 124228, https://doi.org/10.1016/j.jhydrol.2019.124228, 2020.
Mukherjee, S. and Mishra, A. K.: Global Flash Drought Analysis: Uncertainties From Indicators and Datasets, Earth's Future, 10, e2022EF002660, https://doi.org/10.1029/2022EF002660, 2022.
Muñoz Sabater, J.: ERA5-Land monthly averaged data from 1950 to present. Copernicus Climate Change Service (C3S) Climate Data Store (CDS) [data set], https://doi.org/10.24381/cds.68d2bb30, 2019.
Nam, W. H., Tadesse, T., Wardlow, B. D., Hayes, M. J., Svoboda, M. D., Hong, E. M., Pachepsky, Y. A., and Jang, M. W.: Developing the vegetation drought response index for south korea (Vegdri-skorea) to assess the vegetation condition during drought events, Int. J. Remote Sens., 39, 1548–1574, https://doi.org/10.1080/01431161.2017.1407047, 2018.
Noel, M., Bathke, D., Fuchs, B., Gutzmer, D., Haigh, T., Hayes, M., Poděbradská, M., Shield, C., Smith, K., and Svoboda, M.: Linking drought impacts to drought severity at the state level, B. Am. Meteorol. Soc., 101, E1312–E1321, https://doi.org/10.1175/BAMS-D-19-0067.1, 2020.
Pak-Uthai, S. and Faysse, N.: The risk of second-best adaptive measures: Farmers facing drought in Thailand, Int. J. Disast. Risk Re., 28, 711–719, https://doi.org/10.1016/J.IJDRR.2018.01.032, 2018.
Panwar, V. and Sen, S.: Disaster Damage Records of EM-DAT and DesInventar: A Systematic Comparison, Econ. Disaster Clim. Chang., 4, 295–317, https://doi.org/10.1007/s41885-019-00052-0, 2020.
Peel, M. C., Finlayson, B. L., and McMahon, T. A.: Updated world map of the Köppen-Geiger climate classification, Hydrol. Earth Syst. Sci., 11, 1633–1644, https://doi.org/10.5194/hess-11-1633-2007, 2007.
R., L., B. S., M., B. S., S., Bhanage, V., Rathod, A., Tiwari, A., Beig, G., and Singh, S.: Propagation of cloud base to higher levels during Covid-19-Lockdown, Sci. Total Environ., 759, 144299, https://doi.org/10.1016/j.scitotenv.2020.144299, 2021.
Reyniers, N., Osborn, T. J., Addor, N., and Darch, G.: Projected changes in droughts and extreme droughts in Great Britain strongly influenced by the choice of drought index, Hydrol. Earth Syst. Sci., 27, 1151–1171, https://doi.org/10.5194/hess-27-1151-2023, 2023.
Rosvold, E. and H. Buhaug.: GDIS, a global dataset of geocoded disaster locations, Sci. Data, 8, 61, https://doi.org/10.1038/S41597-021-00846-6, 2021.
Sánchez, N., González-Zamora, Á., Martínez-Fernández, J., Piles, M., and Pablos, M.: Integrated remote sensing approach to global agricultural drought monitoring, Agr. Forest Meteorol., 259, 141–153, https://doi.org/10.1016/j.agrformet.2018.04.022, 2018.
Sandeep, P., Obi Reddy, G. P., Jegankumar, R., and Arun Kumar, K. C.: Monitoring of agricultural drought in semi-arid ecosystem of Peninsular India through indices derived from time-series CHIRPS and MODIS datasets, Ecol. Indic., 121, 107033, https://doi.org/10.1016/j.ecolind.2020.107033, 2021.
Saaty, T. L.: Principles of the Analytic Hierarchy Process, edited by: Mumpower, J. L., Renn, O., Phillips, L. D., Uppuluri, V. R. R., Expert Judgment and Expert Systems, NATO ASI Series, Springer, Berlin, Heidelberg, 35, https://doi.org/10.1007/978-3-642-86679-1_3, 1987.
Sathianarayanan, M., Hsu, P. H., and Chang, C. C.: Extracting disaster location identification from social media images using deep learning, Int. J. Disast. Risk Re., 104, 104352, https://doi.org/10.1016/J.IJDRR.2024.104352, 2024.
Sawada, Y.: Quantifying drought propagation from soil moisture to vegetation dynamics using a newly developed ecohydrological land reanalysis, Remote Sens (Basel), 10, 1197, https://doi.org/10.3390/rs10081197, 2018.
Sehgal, V., Sridhar, V., and Tyagi, A.: Stratified drought analysis using a stochastic ensemble of simulated and in-situ soil moisture observations, J. Hydrol. (Amst), 545, 226–250, https://doi.org/10.1016/j.jhydrol.2016.12.033, 2017.
Sepulcre-Canto, G., Horion, S., Singleton, A., Carrao, H., and Vogt, J.: Development of a Combined Drought Indicator to detect agricultural drought in Europe, Nat. Hazards Earth Syst. Sci., 12, 3519–3531, https://doi.org/10.5194/nhess-12-3519-2012, 2012.
Shah, D. and Mishra, V.: Integrated Drought Index (IDI) for Drought Monitoring and Assessment in India, Water Resour. Res., 56, e2019WR026284, https://doi.org/10.1029/2019WR026284, 2020.
Svoboda, M., Lecomte, D., Hayes, M., Heim, R., Gleason, K., Angel, J., Rippey, B., Tinker, R., Palecki, M., Stooksbury, D., Miskus, D., and Stephens, S.: The Drought Monitor, B. Am. Meteorol. Soc., 83, 1181–1190, 2002.
Svoboda, M., Hayes, M., and Wood, D.: Standardized Precipitation Index: User Guide, WMO-No. 1090, World Meteorological Organization, Geneva, Switzerland, 24 pp., ISBN 978-92-63-11091-6, https://library.wmo.int/records/item/39629-standardized-precipitation-index-user-guide, 2012.
Tang, X., Feng, Y., Gao, C., Lei, Z., Chen, S., Wang, R., Jin, Y., and Tong, X.: Entropy-weight-based spatiotemporal drought assessment using MODIS products and Sentinel-1A images in Urumqi, China, Natural Hazards 119, 387–408, https://doi.org/10.1007/s11069-023-06131-6, 2023.
Tanoue, M., Hirabayashi, Y., and Ikeuchi, H.: Global-scale river flood vulnerability in the last 50 years, Sci. Rep., 6, 36021, https://doi.org/10.1038/srep36021, 2016.
Tao, L., Ryu, D., Western, A., and Boyd, D.: A new drought index for soil moisture monitoring based on MPDI-NDVI trapezoid space using modis data, Remote Sens. (Basel), 13, 122, https://doi.org/10.3390/rs13010122, 2021.
Thomas, T., Jaiswal, R. K., Galkate, R., Nayak, P. C., and Ghosh, N. C.: Drought indicators-based integrated assessment of drought vulnerability: a case study of Bundelkhand droughts in central India, Nat. Hazards, 81, 1627–1652, https://doi.org/10.1007/s11069-016-2149-8, 2016.
Tosunoglu, F. and Can, I.: Application of copulas for regional bivariate frequency analysis of meteorological droughts in Turkey, Nat. Hazards, 82, 1457–1477, https://doi.org/10.1007/s11069-016-2253-9, 2016.
Tschumi, E. and Zscheischler, J.: Countrywide climate features during recorded climate-related disasters, Climatic change, 158, 593–609, 2020.
Udmale, P., Ichikawa, Y., S. Kiem, A., and N. Panda, S.: Drought Impacts and Adaptation Strategies for Agriculture and Rural Livelihood in the Maharashtra State of India, Open Agric. J., 8, 41–47, https://doi.org/10.2174/1874331501408010041, 2014.
Vicente-Serrano, S. M., Beguería, S., and López-Moreno, J. I.: A multiscalar drought index sensitive to global warming: The standardized precipitation evapotranspiration index, J. Climate, 23, 1696–1718, https://doi.org/10.1175/2009JCLI2909.1, 2010.
Vicente-Serrano, S. M., Peña-Angulo, D., Beguería, S., Domínguez-Castro, F., Tomás-Burguera, M., Noguera, I., Gimeno-Sotelo, L., and El Kenawy, A.: Global drought trends and future projections, Philos. T. R. Soc. A, 380, 20210285, https://doi.org/10.1098/rsta.2021.0285, 2022.
Wang, H., Liu, H., and Wang, D.: Agricultural Insurance, Climate Change, and Food Security: Evidence from Chinese Farmers, Sustainability (Switzerland), 14, 9493, https://doi.org/10.3390/su14159493, 2022.
Wang, T. and Sun, F.: Integrated drought vulnerability and risk assessment for future scenarios: An indicator based analysis, Sci. Total Environ., 900, 165591, https://doi.org/10.1016/j.scitotenv.2023.165591, 2023.
World Meteorological Organization: Standardized Precipitation Index User Guide, edited by: Svoboda, M., Hayes, M., and Wood, D., WMO-No. 1090, 24, https://library.wmo.int/viewer/39629/?offset=1&utm_source=chatgpt.com#page=1&viewer=picture&o=bookmarks&n=0&q= 2012.
Zhang, Q., Li, J., Singh, V. P., and Bai, Y.: SPI-based evaluation of drought events in Xinjiang, China, Nat. Hazards, 64, 481–492, https://doi.org/10.1007/s11069-012-0251-0, 2012.
- Abstract
- Introduction
- Data
- Method
- Results
- Discussion
- Conclusion
- Appendix A: Consistency assessment workflow
- Appendix B: CDI input weights by PCA (April)
- Appendix C: PCA-derived monthly weight
- Appendix D: Drought index comparison across regions
- Appendix E: Spatial detection of GDIS events by drought indices
- Appendix F: Performance of traditional drought indices in detecting GDIS events using multiple criteria
- Appendix G: Recall comparison of drought indices
- Appendix H: Drought indices accuracy by land cover type
- Data availability
- Author contributions
- Competing interests
- Disclaimer
- Special issue statement
- Acknowledgements
- Financial support
- Review statement
- References