the Creative Commons Attribution 4.0 License.
the Creative Commons Attribution 4.0 License.
 | 11 Sep 2025
Where can rewetting of forested peatland reduce extreme flows? Model experiment on the hydrology of Sweden
Maria Elenius
Charlotta Pers
Sara Schützer
Göran Lindström
Historical drainage to improve forestry practices has resulted in around 7×10⁵ ha drained forested peatland in Sweden. This has reduced the storage of water in the landscape and may impact greenhouse gas emissions, biodiversity, and the damping of extreme water flows. National restoration actions therefore aim at rewetting 1×10⁵ ha of forested peatland in Sweden, despite the limited and sometimes contradictory evidence of the impacts of rewetting. To clarify the potential impact of rewetting on extreme flows and their cause–effect relationships, we simulated flow under various conditions of climate, local hydrology, and rewetting practices (ditch blocking alone or combined with reduced tree cover). For this, we used the HYPE model setup across Sweden (450 000 km2) with improved calculations of runoff in drained forest and routines for recharge and discharge areas. National evaluation of changes in discharge extremes was combined with a detailed study in south-east Sweden, with the aim to understand rewetting impacts at various scales. We found that the change in discharge extremes from catchments of 10 km2 is small because there is considerable mixing with runoff from various land covers. Hence, at the larger scale, rewetting is not an efficient measure to combat droughts or floods. However, for ecosystems in streams draining only peatlands, rewetting can have an impact if appropriate sites for restoration are selected. The results show that groundwater level prior to rewetting and reduced tree cover govern the effect on water runoff. Wetland allocation and management practices are thus crucial if the purpose is to reduce flow extremes in peatland streams.
- Article
(7399 KB) - Full-text XML
- BibTeX
- EndNote


There is clear evidence in existing scientific literature that the climate is changing (IPCC, 2023) in a way which goes beyond our present experience and exceeds our preparedness, e.g. adaptation to water risks (Sörensen and Mobini, 2017). Changes of extremes, such as hot and cold days, warm-spell duration, and heavy rainfall, all affect the hydrological cycle and thereby water security. We also see these effects in cold-temperate and subarctic climates; for instance, the dry period in Sweden during the spring and summer of 2018 was attributed to climate change (Vogel et al., 2019) and led to water scarcity, with severe problems for agriculture, and forest fires. An increase in temperature leads to an exponential increase in the moisture-holding capacity of air, with increasing precipitation noted over Fennoscandia (Westra et al., 2013) and record-breaking daily precipitation extremes (Lehmann et al., 2015). Cloudbursts and flooding in Sweden are reported to trigger enhanced transport of chemical and microbial pollutants, e.g. from sewer overflow (Olsson et al., 2013), as well as erosion and landslides, nutrient transport (Wu and Malmström, 2015), and acidification (Erlandsson et al., 2010). Hence, water in Sweden follows global tendencies of becoming too little, too much, and more polluted as an effect of global warming. Being among the top five countries with the most lakes in the world (Messager et al., 2016), Sweden has profited from lakes dampening high flows and buffering against low flows. However, climate change may put new stress on water management, and urgent actions are thus needed due to signs of enhanced competing interests for sustainable water-related security.
One method that has been proposed to further dampen high flows and buffer against low flows is the rewetting of historically drained forested peatlands. The aspiration has been to return to undrained conditions of peatlands acting as sponges, storing rainfall during storms and then gradually releasing water in drier periods (Holden, 2005). It has been estimated that as much as 87 % of wetlands globally may have been degraded by human activity since 1700 (Davidson, 2014), and Sweden follows this trend; Holmen (1964) estimated that around 7×10⁵ ha of forested peatland was drained in Sweden only in the period 1873–1960. Rewetting of peatlands by ditch blocking is a policy action, not least in this country, where a long-term goal is to rewet 1×10⁵ ha of drained forested peatlands (Drott and Eriksson, 2021), currently with a focus on greenhouse gas reductions but also considering other ecosystem services such as damping flow fluctuations.
Previous studies, largely based on evidence from Finland, Canada, and the UK, show variable ability of both natural (or unaltered and undrained) and rewet peatlands in terms of damping flow extremes. The damping in unaltered peatlands has been found to depend on the antecedent storage prior to rainfall events (Acreman and Holden, 2013), the position in the landscape (Åhlén et al., 2022), and flow path structure and catchment size (Edokpa et al., 2022). Karimi et al. (2023) found no significant attenuation of floods from peatlands in a recent study involving 9 years of hydrometric data from 14 catchments in northern Sweden, and they claimed that this could be due to the overshadowing impact of other land cover types in the catchment. Arheimer and Pers (2017) showed that previous efforts in constructing 1574 wetlands in the southern half of Sweden, aimed at damping flows to allow nutrient removal, had very minor effects on transport of nutrients from land to sea. The wetland area remained very minor, and the constructions were not done in optimal locations for nutrient retention.
In terms of the impact of wetland restoration measures, such as rewetting peatlands, a recent review on temperate and boreal forests by Bring et al. (2022) showed that groundwater levels 1 m from the intervention increased on average by 0.45 m, but the effect was reduced by a factor of 2 already at 9 m distance. This was compared with drainage, which had a similar change in near-ditch groundwater levels from undisturbed conditions by −0.42 m, but here the effect was reduced to 50 % at a larger distance of 21 m, meaning that it may be difficult to reverse drainage impacts away from ditches. The authors tried to relate the variable restoration impact to peat depth, time since intervention, intervention magnitude, soil type, ditch spacing, transect type, and climate zone, but no significant results were obtained, except that restoration of blanket bogs (not included in the numbers above) had small effects on groundwater levels.
In contrast, Holden et al. (2011) found no discernable effect on groundwater, and Karimi et al. (2024) found only a 0.03 m increase in groundwater level, in addition to the change of a reference site during the same period. The literature also shows variable impacts on runoff and discharge after peatland restoration, e.g. with peak flows reduced (Menberu et al., 2018; Wilson et al., 2010) or with peak flows sometimes reduced and sometimes increased (Ballard et al., 2012). The large knowledge gaps in the fundamental drivers of the hydrological response to rewetting forested peatland pose challenges in how to allocate societies' resources effectively when rewetting is applied to improve water security. Important efforts to acquire more data on peatland hydrology before and after rewetting in various settings are currently being pursued but are costly and time-consuming. An easily achievable approach that can provide direct insights and guide data collection is the analysis of hydrological simulation results with variable inputs. Previous simulation studies on selected catchments in a Swedish context show small impacts from changed ditch drainage on both low flows (Lindström, 2019; Stensen et al., 2019) and high flows (Johansson, 1993). Complementary large-scale simulations are needed to better discern the impacts and the driving factors of the variable results from rewetting reported in the literature.
Here, we make use of a hydrological model applied at the national scale (Strömqvist et al., 2012) that explicitly simulates groundwater levels, runoff, and discharge for the entire Sweden (450 000 km2), represented by approximately 40 000 sub-catchments, each with up to 116 hydrological response units (HRUs) to account for spatial variability (see Appendix A). The aim of this model study is to understand the main drivers behind the heterogeneous impacts of rewetting on discharge extremes. We draw on a recently published national data set of ditches (Lidberg et al., 2023), and we present simulated rewetting impacts on discharge (i.e. the accumulated discharge from upstream areas and the accumulated local runoff) and the local impacts on peatland groundwater levels and peatland runoff. More importantly, we carefully examine how these impacts depend on peatland properties, the drained state, the position in the landscape, and the type of rewetting performed. This sensitivity study focuses on the 882 sub-catchments in the Motala Ström catchment in south-east Sweden, which have large variability in land use, soil types, and precipitation. We distinguish between two important aspects of rewetting – a direct impact due to removal of hydrological pathways (ditches) and increased soil wetness following reduced tree density, which can be the result of either tree removal or trees being unable to cope with a wetter environment after ditch removal.
Here we describe the study areas and the hydrological model, focusing on aspects important for rewetting impacts, and the sensitivity matrix that was applied to draw conclusions on the important drivers of varying rewetting performance. Throughout this paper, we use the term “forested peatland” for forests on peat and fens in the landscape.
2.1 Study areas
We study the entire country of Sweden, situated in northern Europe, and perform a more detailed study of the Motala Ström catchment in south-east Sweden; see Fig. 1. Sweden was previously glaciated and has subarctic and cold-temperate climates, with the Motala Ström catchment situated in the cold-temperate climate zone. The land use and peat cover presented below are based on national data sets introduced in Sect. 2.2.
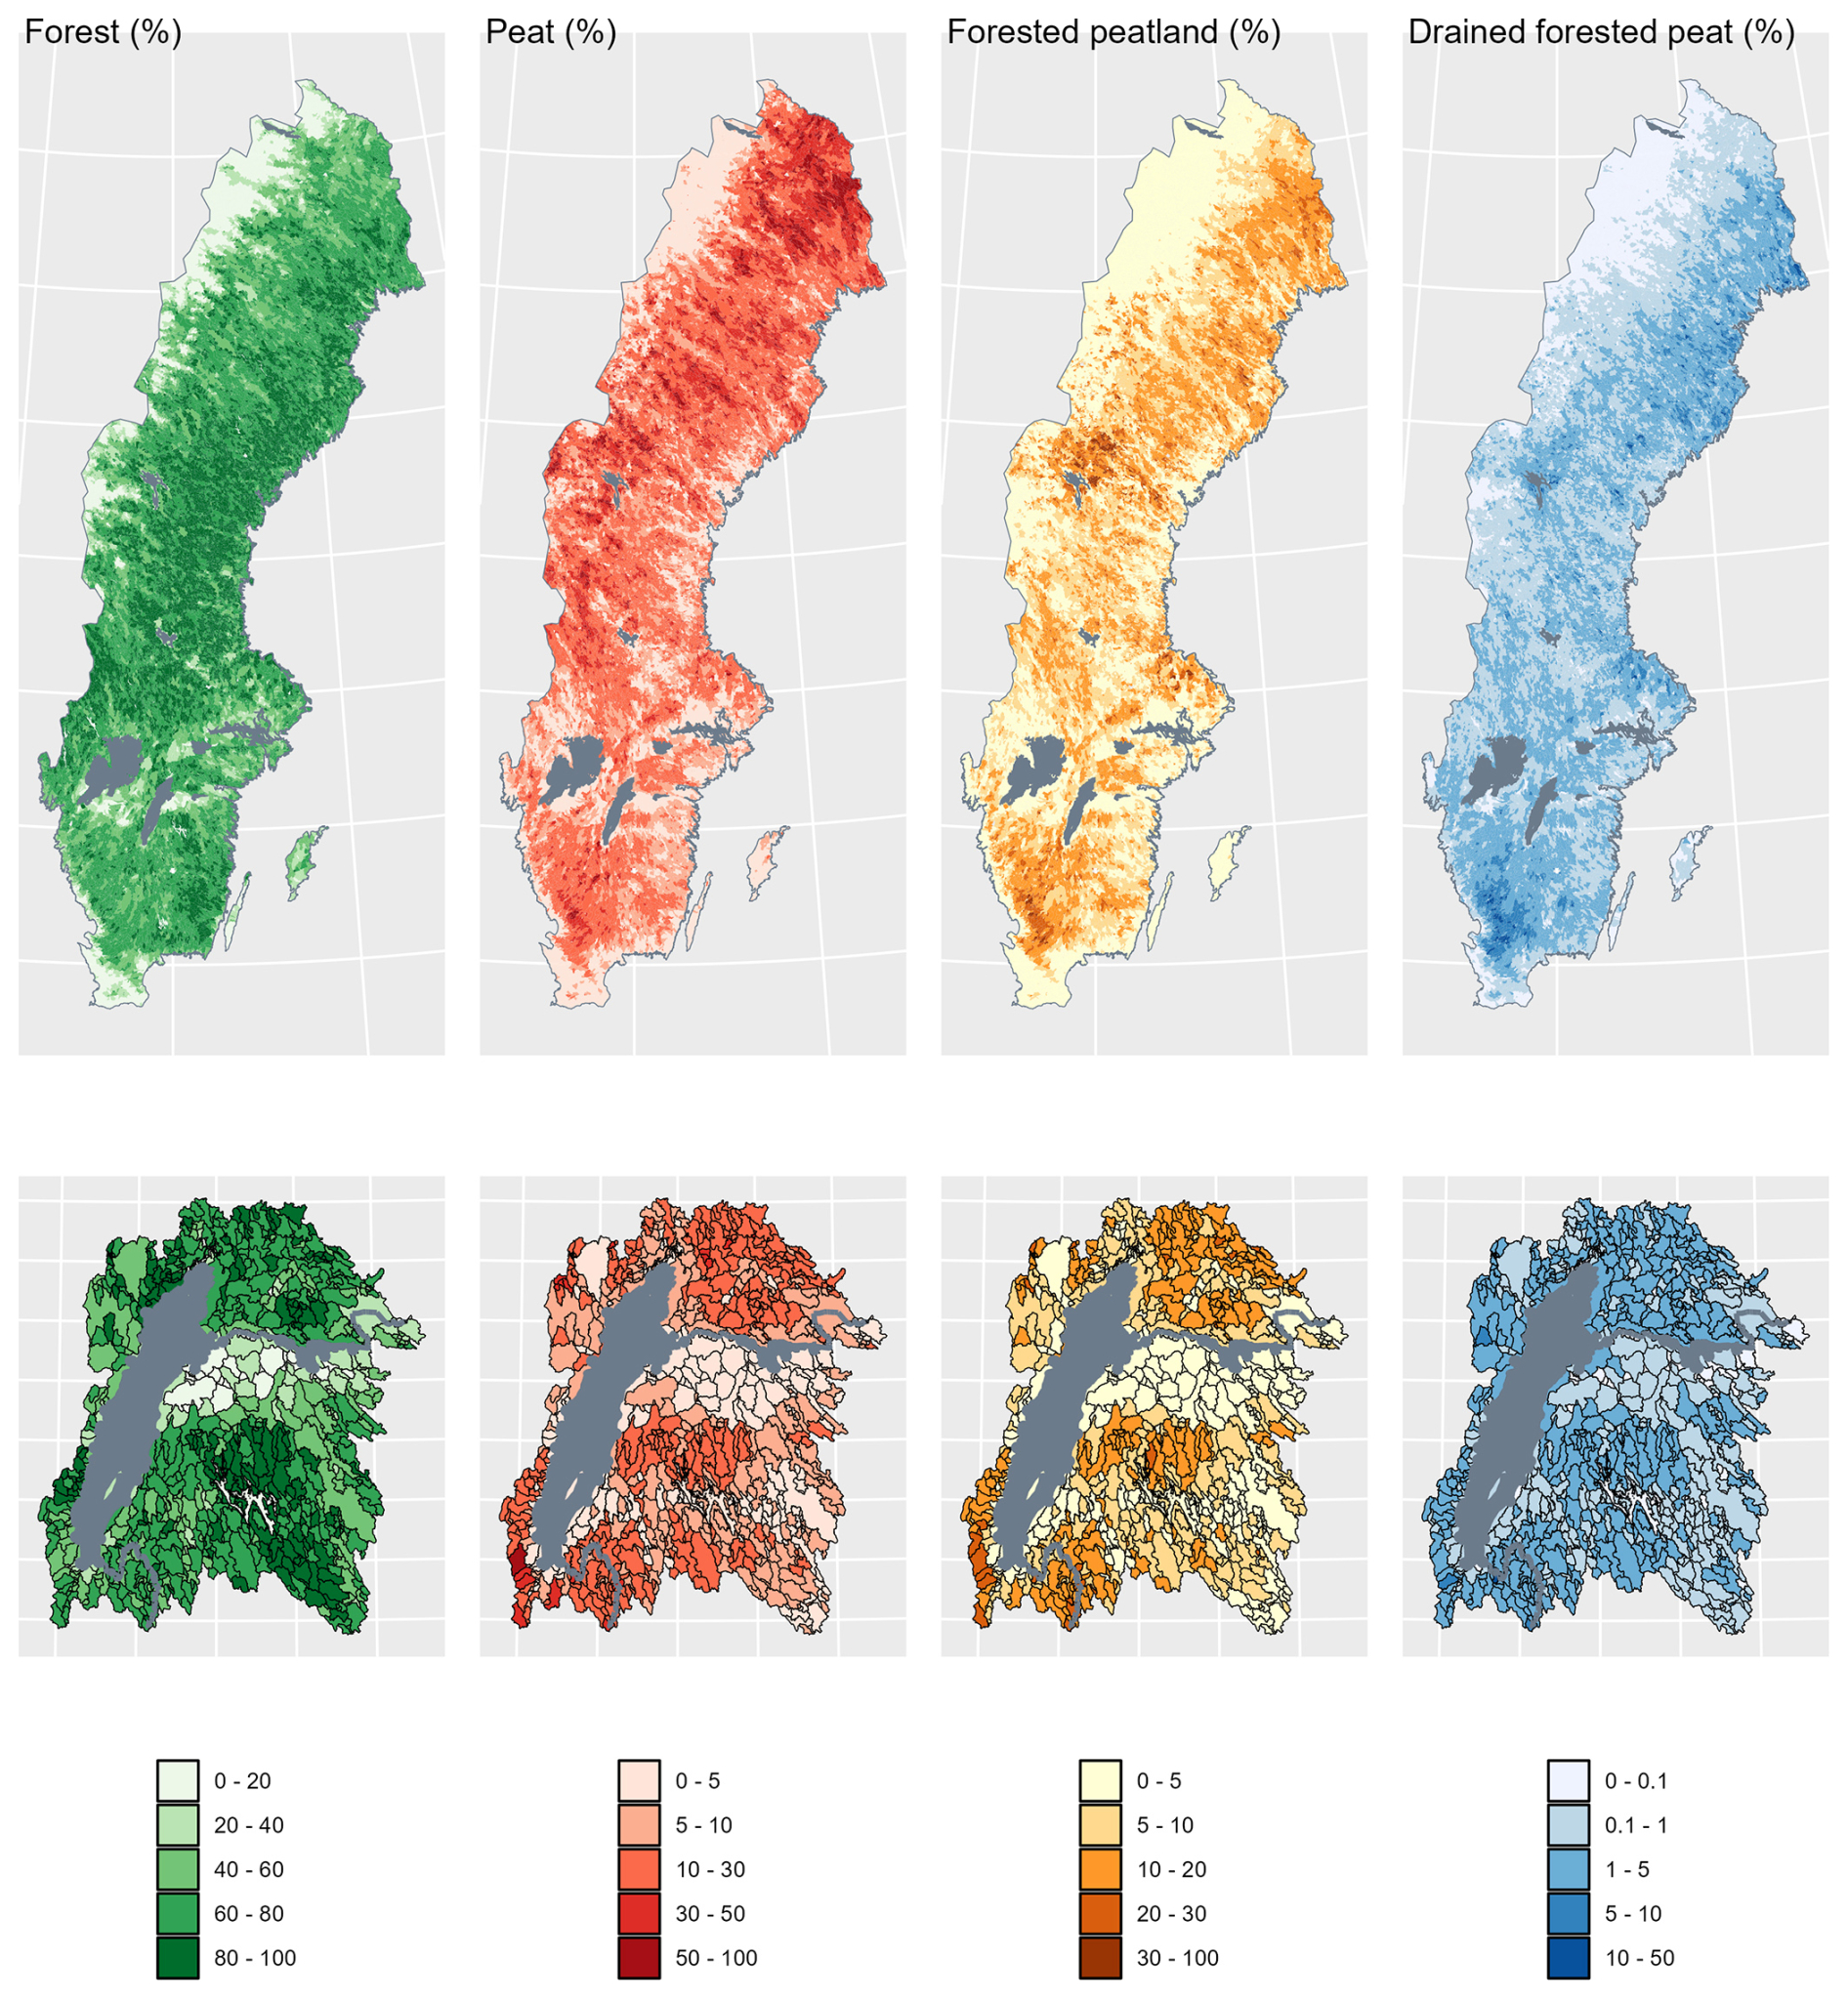
Figure 1Peatland and drainage in Sweden, including a more detailed view of the Motala Ström catchment.
Sweden is largely covered by forest, making up 61 % of the total surface area, whereas peat soils cover 17 % of the entire surface and cover 7 % of forests. Assuming that drained conditions extend 20 m laterally from ditches, 1.4 % of the forested area in Sweden constitutes drained forested peat, or 630 000 ha, which is not far from the 650 000–700 000 ha estimated by Holmen (1964) for the period 1873–1960. Holmen assumed 6 ha of drained conditions per kilometre length of ditch, which corresponds to 30 m to either side of the ditch if ditches do not intersect within this distance.
The Motala Ström catchment (1.5×10⁶ ha) covers both forested and cultivated areas and also peatland. The distribution is similar to that at the national scale, with 53 % forest, 9 % peat, and 7 % forested peat and 0.3 % of sub-catchments having more than 10 % drained forested peat (1 % have more than 5 % drained forested peat, and 44 % have more than 1 %). The large Lake Vättern in the western part of the catchment (grey in the figure) is the second-largest lake in Sweden and sixth-largest lake in Europe. It drains to the Motala Ström river (also marked in grey in the lower panels), with an outlet in the Baltic Sea. There are many lakes in this catchment (as in Sweden in general), and several of them, including Vättern, are regulated for hydropower.
2.2 Hydrological data and sensitivity matrix
2.2.1 Simulation setup
The impact of rewetting was assessed based on simulations of drained and rewet conditions using the hydrological model HYPE (Lindström et al., 2010), as set up for Sweden, referred to as S-HYPE (Strömqvist et al., 2012, 2022; version 2016i). This model version has a very good description of Swedish daily water flow (average Nash–Sutcliffe efficiency (NSE; Nash and Sutcliffe, 1970) of 0.86 for 157 river gauges and volume error of −3 % over the calibration period 2006–2020 or 0.74 and −2 % for 350 gauges when including stations affected by hydropower). The model is used operationally for national monitoring, with indicators of the hydrological status of rivers and waterbodies, design values for buildings and infrastructure, climate change impact assessments, and the national service of flood warnings and notifications of low flow. S-HYPE is calibrated based on HRUs, representing mainly combinations of land use and soil type (Appendix B), which also enables assessment of ungauged basins (Arheimer and Lindström, 2013). In the current study, evaluation is based on simulations covering the 10-year period between 2012 and 2021, following a 5-year initialization period (2007–2011). The model uses precipitation and temperature as forcing, and results are provided at a daily time step for sub-catchments with an average size of 10 km2 (or 1000 ha; deriving 40 000 sub-catchments for Sweden and 882 for Motala Ström). Within each sub-catchment, calculations for land use and soil classes are performed in up to 116 HRUs.
In the current model setup, land cover and soil data have been collected from various sources (Strömqvist et al., 2022). Forest land-use data for different kinds of forest, including forested wetland, were obtained from the national land cover data NMD (Swedish Environmental Protection Agency, 2023) with 10 m resolution. The forested wetland was here combined from NMD classes 1.2–1.7, which have “tree-covered areas on wetlands with a total crown cover of > 10 %”. We interpret this as fens (Swedish: kärr) since other wetlands less frequently have forest. Soil-type data (including peat) of forested land, with varying resolutions of between 1:25 000 and 1:750 000, were collected from the Swedish Geological Survey (2024). Total soil depth was collected and simplified from Daniels and Thunholm (2014), and calculations are typically performed within three soil layers that extend to depths originally motivated by top soils (affected by plough depth in the case of agricultural fields), the remainder of the root zone, and any soil beneath the root zone. The main focus here is on forested peatlands, and the three soil layers of these HRUs extend to 0.25, 0.75, and 1.5 or 2.25 m below the soil surface.
Appendix A provides an overview of the HYPE model, and Appendix B explains the calibration method used in S-HYPE and further illustrates model performance and uncertainties related to the current study. Full model documentation and open-source code can be found at https://hypeweb.smhi.se/model-water/ (last access: 21 August 2025), while the text below focuses on the aspects most relevant for the model experiment on rewetting peatlands.
2.2.2 Runoff description
Since our objective is to study the hydrological response to rewetting, the model description of runoff is essential. In HYPE, runoff from the HRUs occurs through soils, in drainage tiles/ditches, and as surface runoff (which in Sweden mainly consists of reels and temporary creeks) if the soil is saturated or the infiltration capacity is exceeded. Saturated surface runoff is calculated as a land-use-dependent fraction srrcs of the free water above the soil surface that drains every day (Table 1). Runoff through soil depends on the soil saturation above field capacity; the groundwater table (pressure head) in relation to stream depth; and a soil-type-dependent recession coefficient rrcs, which is given as input for the top and bottom layers and calculated for the middle soil layer to fit an exponential decrease with depth. Drainage through ditches (or tiles, which have the same model description) occurs when the groundwater level is above the level of ditches, in which case a soil-type-dependent fraction trrcs of the water at saturation above field capacity is drained every day. Only water above the depth of ditches is affected by this drainage, and it is also possible to limit the lateral extent of the impact as a fraction of the HRU area. In this case, trrcs is multiplied by this fraction to obtain a proportionally smaller runoff coefficient for ditches. In the description of runoff in the model, it is also possible to use a regionally calibrated correction factor rrcscorr such that rrcs = rrcs ⋅ (1+ rrcscorr) in each soil layer (Lindström, 2016), and the same correction is used for srrcs and trrcs. There are 330 geographical parameter regions in the Swedish model setup with varying rrcscorr. We performed simulations both with and without this correction.
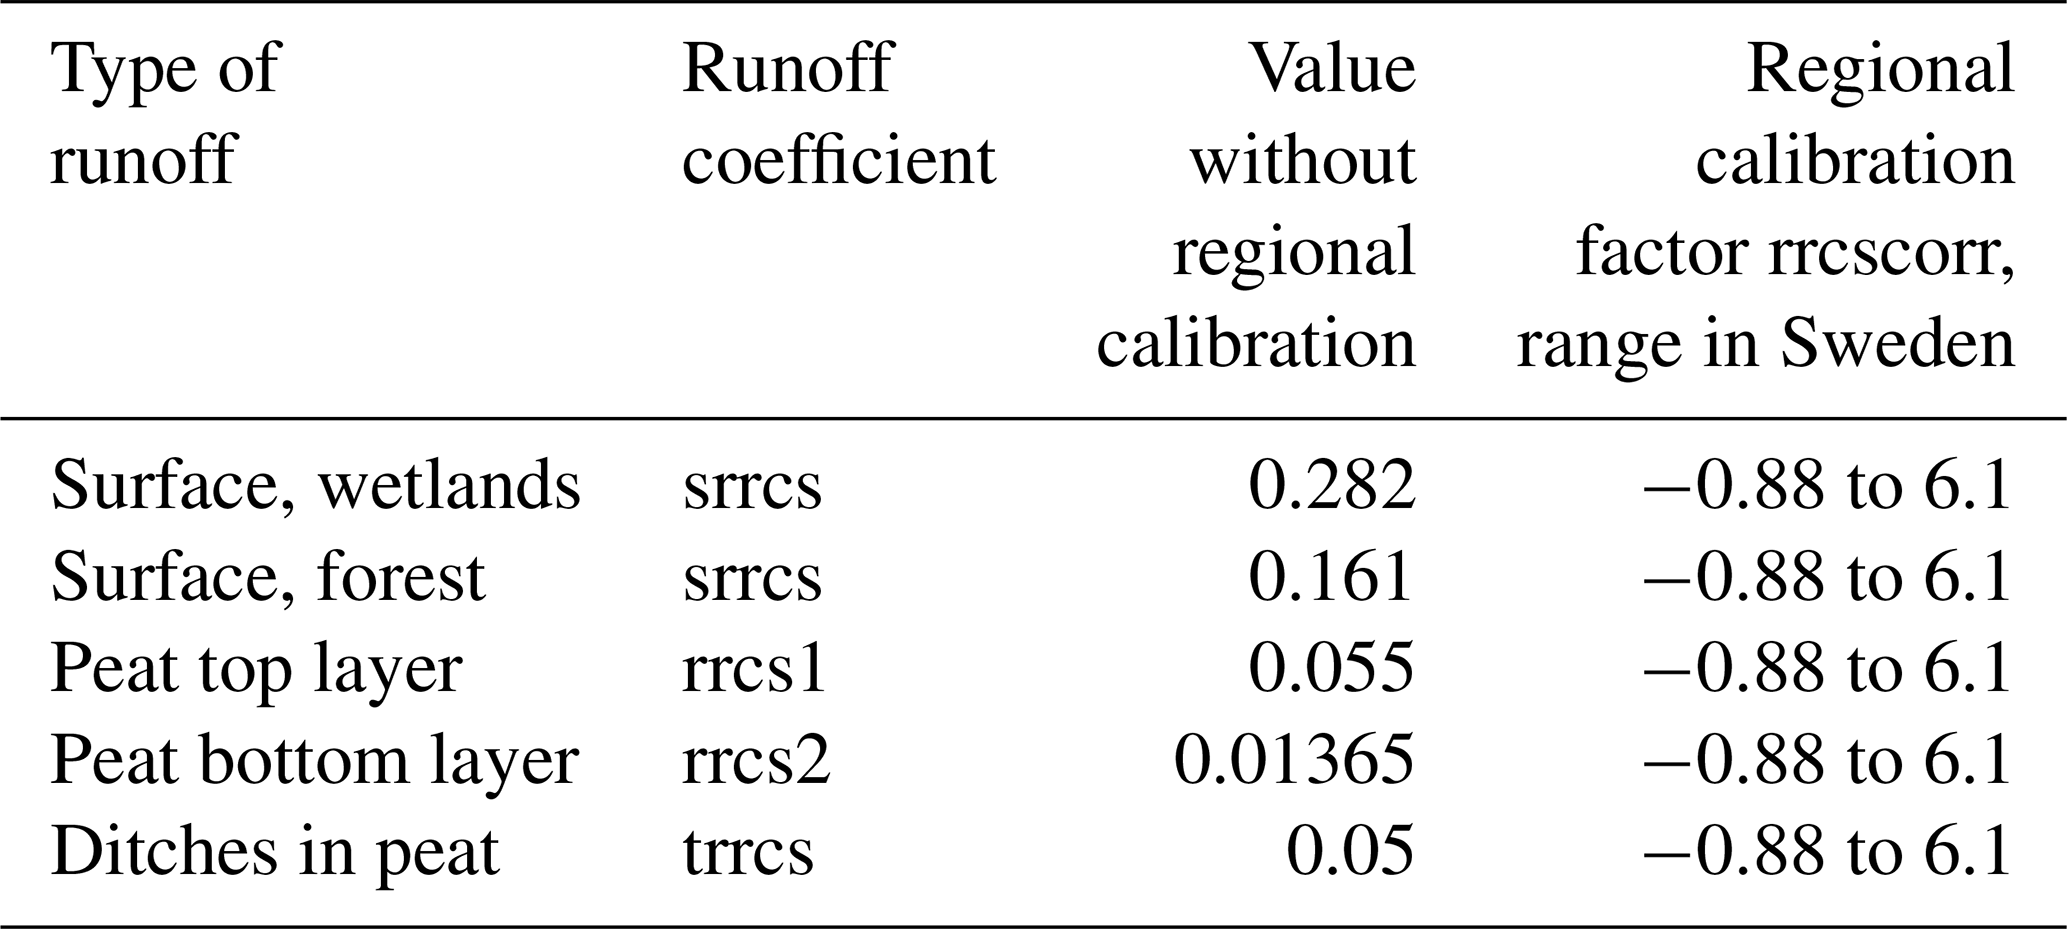
To describe the impact of ditch drainage, we first implemented new data on the location of Swedish ditches (Lidberg et al., 2023) in the hydrological model. The data do not contain information on the depth of ditches or the lateral impact of ditches. Piirainen et al. (2017) state that drainage is performed to 0.5–1.0 m depth in Swedish forests, and we chose 0.7 m as a baseline scenario. Based on the literature review of Bring et al. (2022), we defined the nearest 20 m of ditches as impacted by drainage. The model does not account for the gradual reduction in impact away from ditches but assumes the ditches act directly on the region defined as drained. We analysed what fraction of each forested HRU in each sub-catchment is located within 20 m from ditches (“drained”) and then grouped HRUs with similar drained fractions nationally, arriving at five groups, of which two are considered here for rewetting, i.e. fens (4 % of Sweden's surface area) and other forested peatland (3 % of Sweden's surface area). Nationally, 22 % and 14 % of the soil in these groups is drained under our assumptions, but the simulations do account for the local percentage affected in each sub-catchment.
All runoff is directly routed to surface waters in the sub-catchment (first entering a generic “local stream”). As part of the current study, the possibility to first route runoff from recharge HRUs to discharge HRUs was developed, where a given percentage of the runoff from recharge HRUs enters the third soil layer of the discharge HRUs (e.g. peatlands) within each sub-catchment (see Appendix A). The idea behind this development was to be able to reflect differences related to the position in the landscape, which had previously been found to impact the hydrological response of peatlands (Åhlén et al., 2022). This also facilitates more accurate representation of peatlands typically occurring in topographic depressions with groundwater levels close to the surface (Bring et al., 2022).
2.2.3 Interception and evapotranspiration
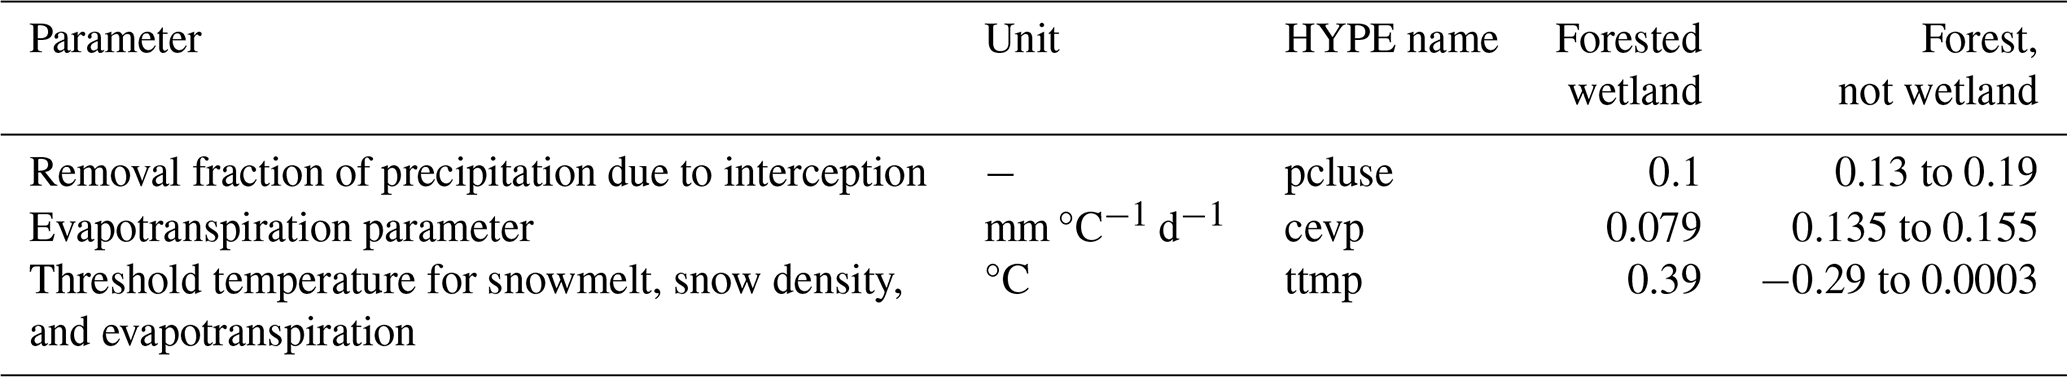
Apart from the direct impact of rewetting on runoff through removal of hydrological pathways in ditches, other hydrological changes may also occur when forests are rewet. Most notably, tree density is often reduced, either by cutting trees or because conditions become too wet, and therefore interception and evapotranspiration are reduced (Lindström, 2019). This can be exemplified by the differences in calibrated S-HYPE parameters between existing forest wetlands and other forests, shown in Table 2, with less interception and evapotranspiration in wetlands. Challenges occur in distinguishing between the changes in interception and evapotranspiration in model calibration, but here the combined impact is considered.
Table 2Example parameters that differ between forested wetland (> 10 % crown cover) and other forest. The model also has calibrated values for open wetland (no tree cover), and these are the same as the forested wetland parameters in this table, except for a slightly larger cevp in open wetland (0.087 mm °C−1 d−1).
2.2.4 Sensitivity matrix and impact indicators
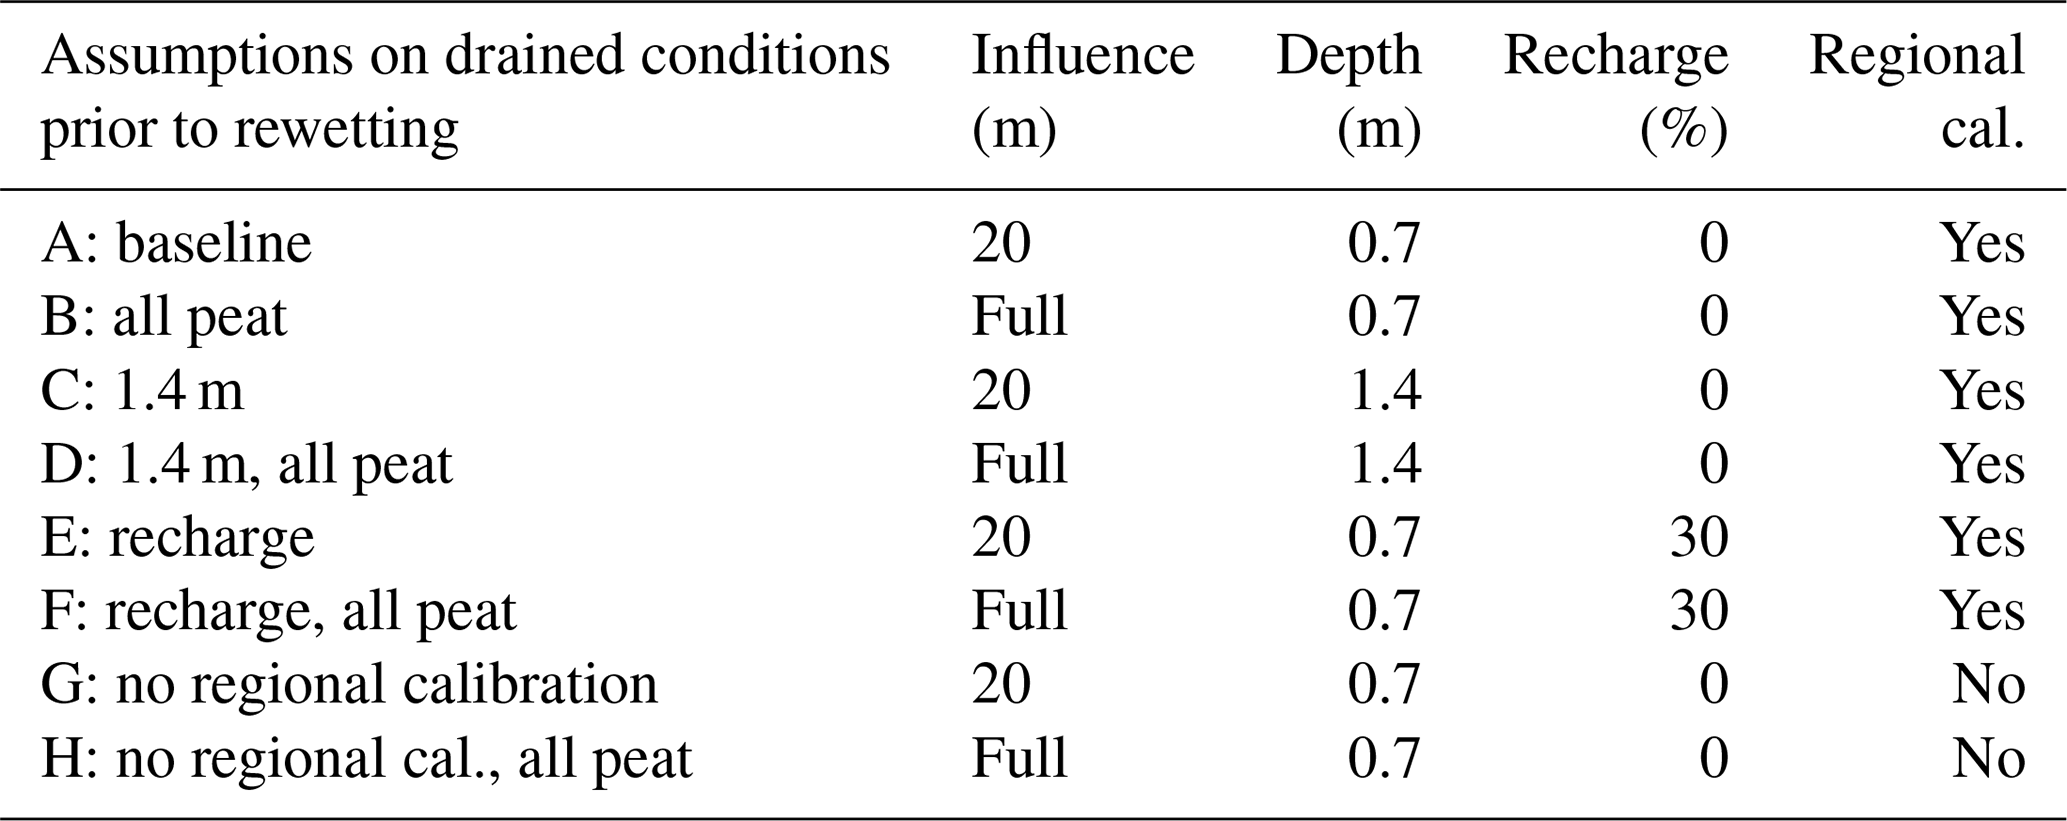
As discussed above (Sect. 1), there are large knowledge gaps in the fundamental drivers of variable rewetting success. To analyse this, a sensitivity study according to Table 3 was performed for the Motala Ström catchment with respect to the most important factors, which we suggest are related to the efficiency of ditch drainage prior to rewetting (“influence” and “depth” in the table), peat properties (“regional calibration”), the position in the landscape (“recharge”), and the different aspects of rewetting (“Rewet1” for removal of hydrological pathways and “Rewet2” where losses to interception and evapotranspiration are also reduced and surface runoff is increased to represent wetlands). Starting from the baseline scenario (“A” in the table), the drainage efficiency of ditches in other scenarios was assumed to be the same or larger, with ditches affecting the full HRU and/or being twice as deep. Together with the assumptions of complete restoration to natural conditions, the sensitivity matrix therefore likely produces overestimates of the impact in general, and this design was chosen because an initial investigation (Schützer et al., 2023) showed insignificant impacts using the baseline scenario (A). Parameters describing the impact of ditches or recharge from other land were only changed from the baseline scenario for HRUs that would be rewet, whereas regional calibration of runoff (yes/no) was changed in all HRUs.
Table 3Sensitivity matrix. Recharge 30 % means that within sub-catchments up to 30 % of runoff from forest on soil other than peat is diverted to forested peatland, but the contributing area is at most a factor of 3 larger than that of the forested peatland. Rewet1 and Rewet2 were tested on all cases (A–H), where Rewet1 is a removal of ditches only and Rewet2 also changes the land use of the drained part (20 m or full) to forested wetland (cf. Table 2).
The impact of rewetting was studied in terms of changes in the average yearly minimum and maximum groundwater level, runoff, and discharge (positive values referring to increases with rewetting). Groundwater and runoff changes are expressed in absolute terms (m and mm d−1) to facilitate detailed analysis of the driving factors, but discharge is presented as percent change relative to the drained state. An exception is that the changes in minimum discharge are expressed as percent change relative to the drained average discharge rather than minimum discharge to avoid division by zero.
Here we present the rewetting impacts, starting with discharge impacts at the national domain, followed by a description of changes in discharge, peatland groundwater levels, and peatland runoff in the Motala Ström catchment. These results form the basis of the analyses of the driving factors of the heterogeneity in rewetting impact.
3.1 National rewetting impacts on discharge extremes
Figure 2 shows changes in discharge extremes from the national evaluation of downstream impacts of rewetting using the baseline conditions (case A, with Rewet1 and Rewet2, Table 3). The average of the minimum and maximum discharge per year changed by less than 1 % in the vast majority of sub-catchments and is always less than 4 % with Rewet1. It changed less than 5 % with Rewet2, except in a negligible number of sub-catchments (11 out of approximately 40 000, where the maximum flow increased between 5 % and 9 %). No sub-catchment with an upstream area larger than 44 km2 had changes in minimum or maximum discharge of more than 1 % (the average upstream area of sub-catchments in the model is 630 km2). We refer to changes in discharge extremes of less than 5 % as small in the sensitivity analysis of Motala Ström catchment below. This is of course subjective but can be compared with the assessment of ecological status according to the Swedish implementation of the Water Framework Directive, where average daily volume changes of less than 5 % do not invoke any reduction in status (Swedish Agency for Marine and Water Management, 2019). The small impact at the scale of sub-catchments is related to the small coverage of drained forested peatlands (Sect. 2.1) in relation to other combinations of land use and soil type. For example, only 0.8 % of sub-catchments have more than 10 % drained forested peat, whereas 5 % have more than 5 % and 38 % have more than 1 %.
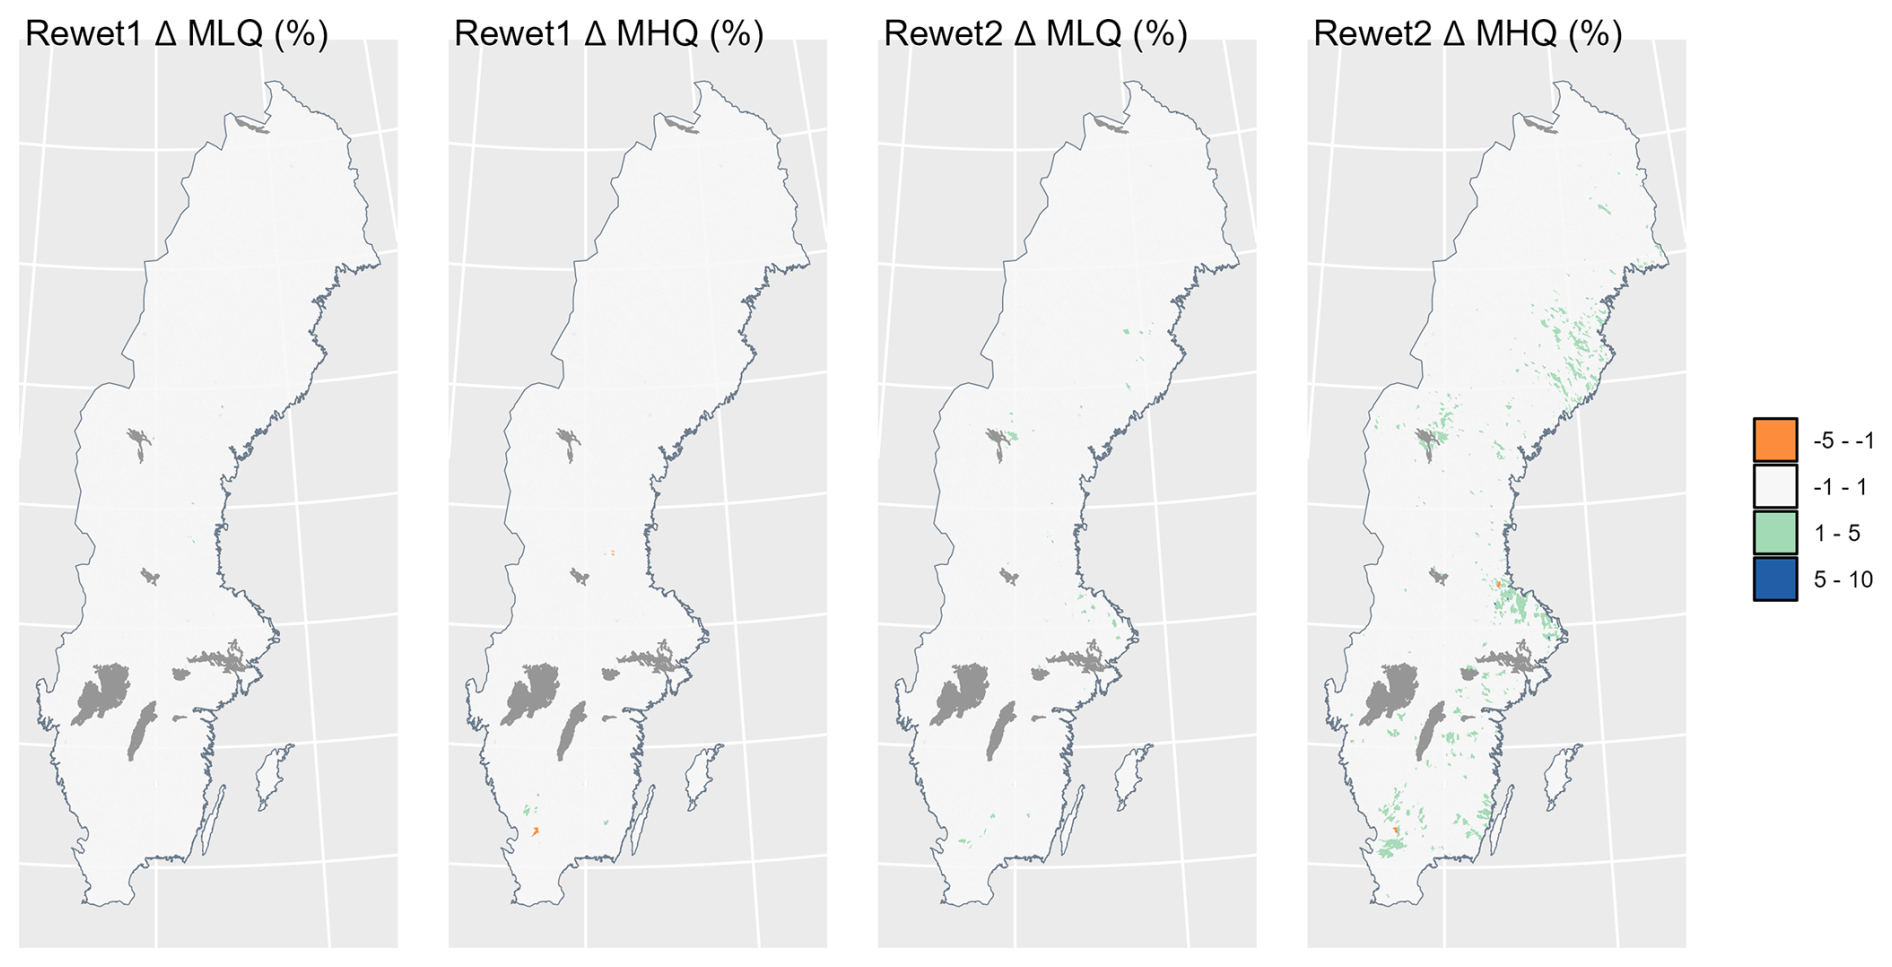
Figure 2Relative changes (%) in the average minimum (MLQ) and maximum (MHQ) yearly discharge over the study period 2012–2021. Forested peatland and fens were rewet.
3.2 Motala Ström rewetting impacts
Following the national evaluation, we proceed with results from the Motala Ström sensitivity study and first analyse the impact of rewetting on discharge; see Fig. 3. All changes in discharge extremes are small under the most realistic assumption of 20 m influence of ditches (cases A, C, E, G in the left panel) regardless of the rewetting scenario (1 or 2), except in one sub-catchment of one case.
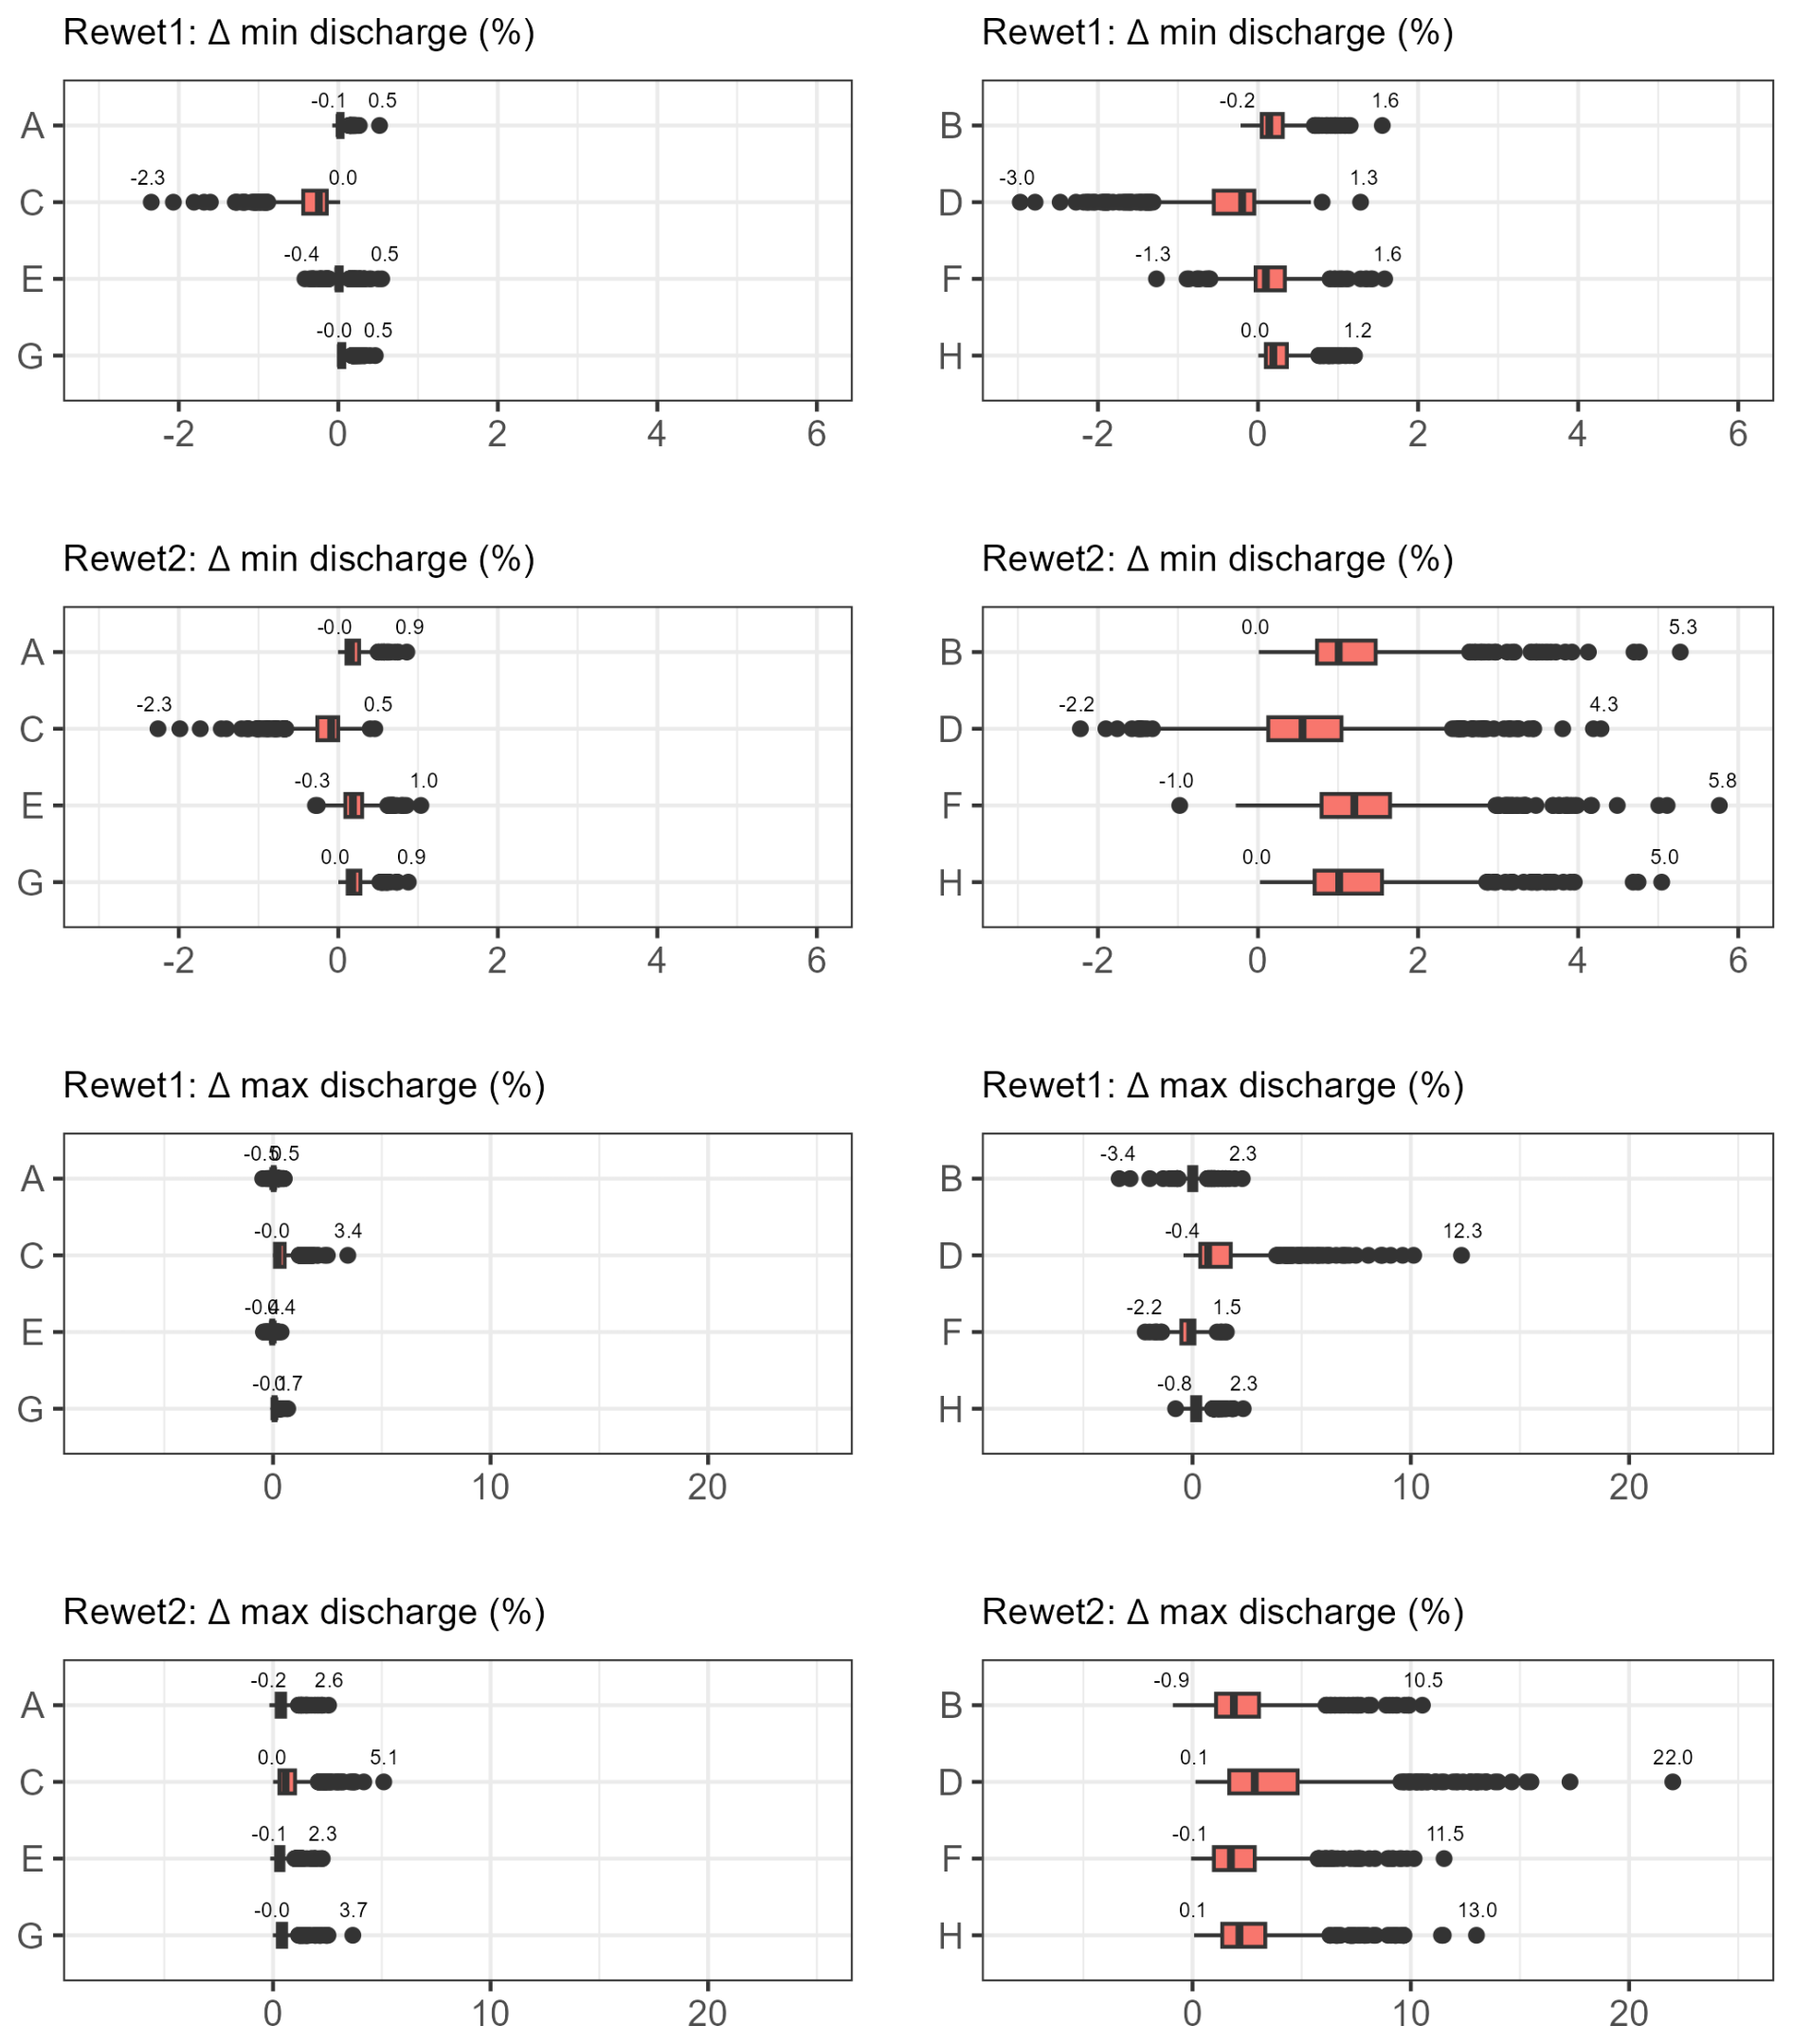
Figure 3Changes in sub-catchment average yearly minimum and maximum discharge with rewetting. The statistics are based on the 656 sub-catchments that have coniferous forest on peatland (depth 1.5 m). Cases with 20 m influence (A, C, E, G) are presented in the left panels, and cases with full influence (B, D, F, H) are shown in the right panels.
With full influence of ditches (B, D, F, H in the right panel), changes to minimum discharge are also small (except in five sub-catchments), but here, there are substantial increases in maximum discharge in some sub-catchments of up to 22 %. This increased maximum discharge was found mostly in the central part of the catchment (Fig. 4). These results for the full lateral influence of ditches are estimated to be unlikely to occur and are given as an estimate on the upper bound of possible impact. The impact of regional calibration on minimum and maximum discharge was found to be negligible.
The discharge extremes in the realistic case of 20 m lateral influence of ditches were therefore small at sub-catchment outlets, where runoff from rewet peatlands is mixed with other runoff, similar to the conclusions of Johansson (1993), Karimi et al. (2023), Lindström (2019), and Stensen et al. (2019). To understand if discharge extremes could be larger for small rivers mainly draining rewet peatlands, i.e. when the discharge mainly represents runoff from the restored soils, we also analysed the changes in peatland runoff extremes with rewetting. This varies by type of forest, and we chose to present results for coniferous forest with a depth of 1.5 m, which is one of the most common forest types on peatland in Motala Ström (8400 ha), although for Rewet2, the land use was always changed to fens, which originally covered 67 000 ha in the catchment. (The model also has 800 ha coniferous forest on peat with 2.25 m depth.) Runoff extremes are closely linked with groundwater extremes, which are therefore also presented. For this analysis, the cases with full influence of ditches are described (B, D, F, H) to show local conditions in soil that is initially drained.
We begin with an examination of the runoff exceedance curves of the examined HRU (Fig. 5) to get a sense of the magnitudes of both low and high runoff. We refer to runoff that exceeded 5 % of days as R05 and runoff that exceeded 95 % of days as R95. The drained state (“drained”) has R95 in the range from (5th to 95th percentiles between sub-catchments) 0.006 to 0.03 mm d−1 at reference case B, with very similar values in case H (no regional calibration) and generally lower values for deep ditches (D, to 0.03 mm d−1, not fully shown in the figure) and higher values with recharge (F). Rewet1 does not change R95 much, except if ditches were deep (D, lower range increasing to 0.006 mm d−1). Rewet2 generally gives much higher R95 (as desired), with the lower/upper limits of the range increasing by a factor of (B), (D), (F), and (H). The large factor of increase for the lower range of D means that we do get runoff; i.e. it should not be used to generalize impacts of rewetting.
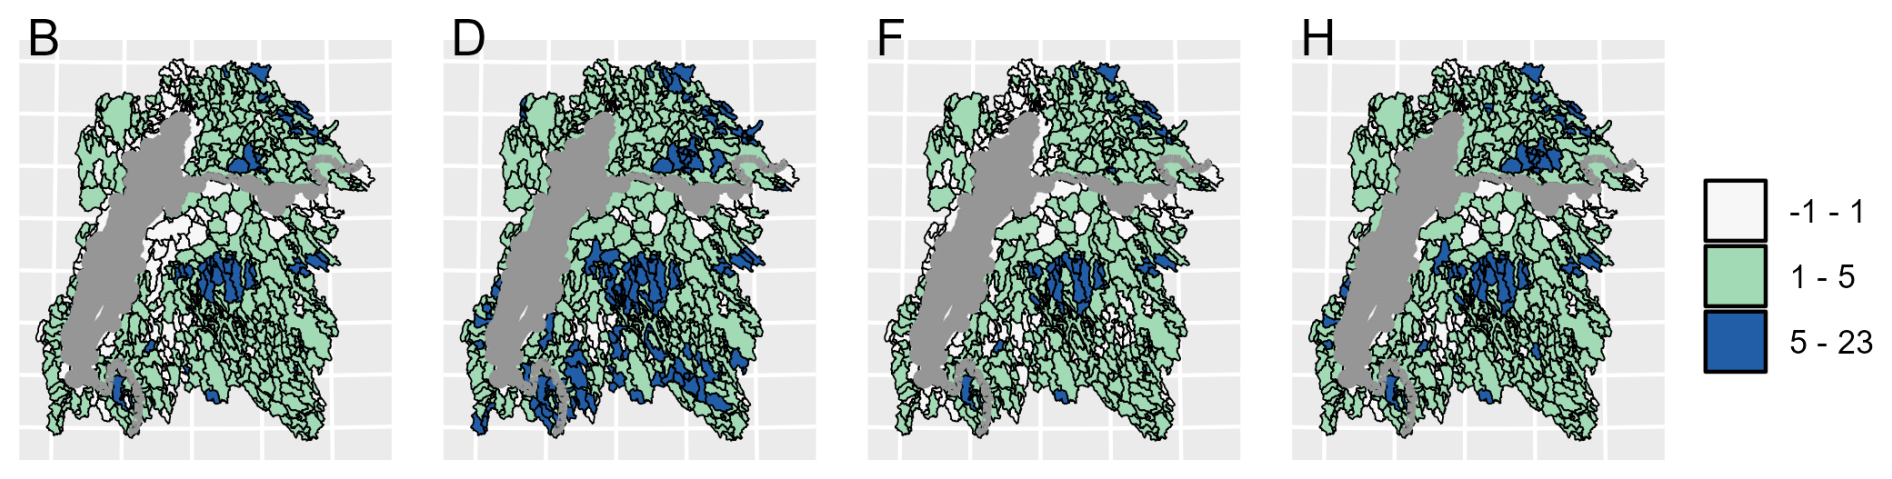
Figure 4Relative changes (%) in maximum yearly discharge after the Rewet2 scenario (ditch plugging and reduced tree cover) in the extreme case of ditches impacting the full HRUs.
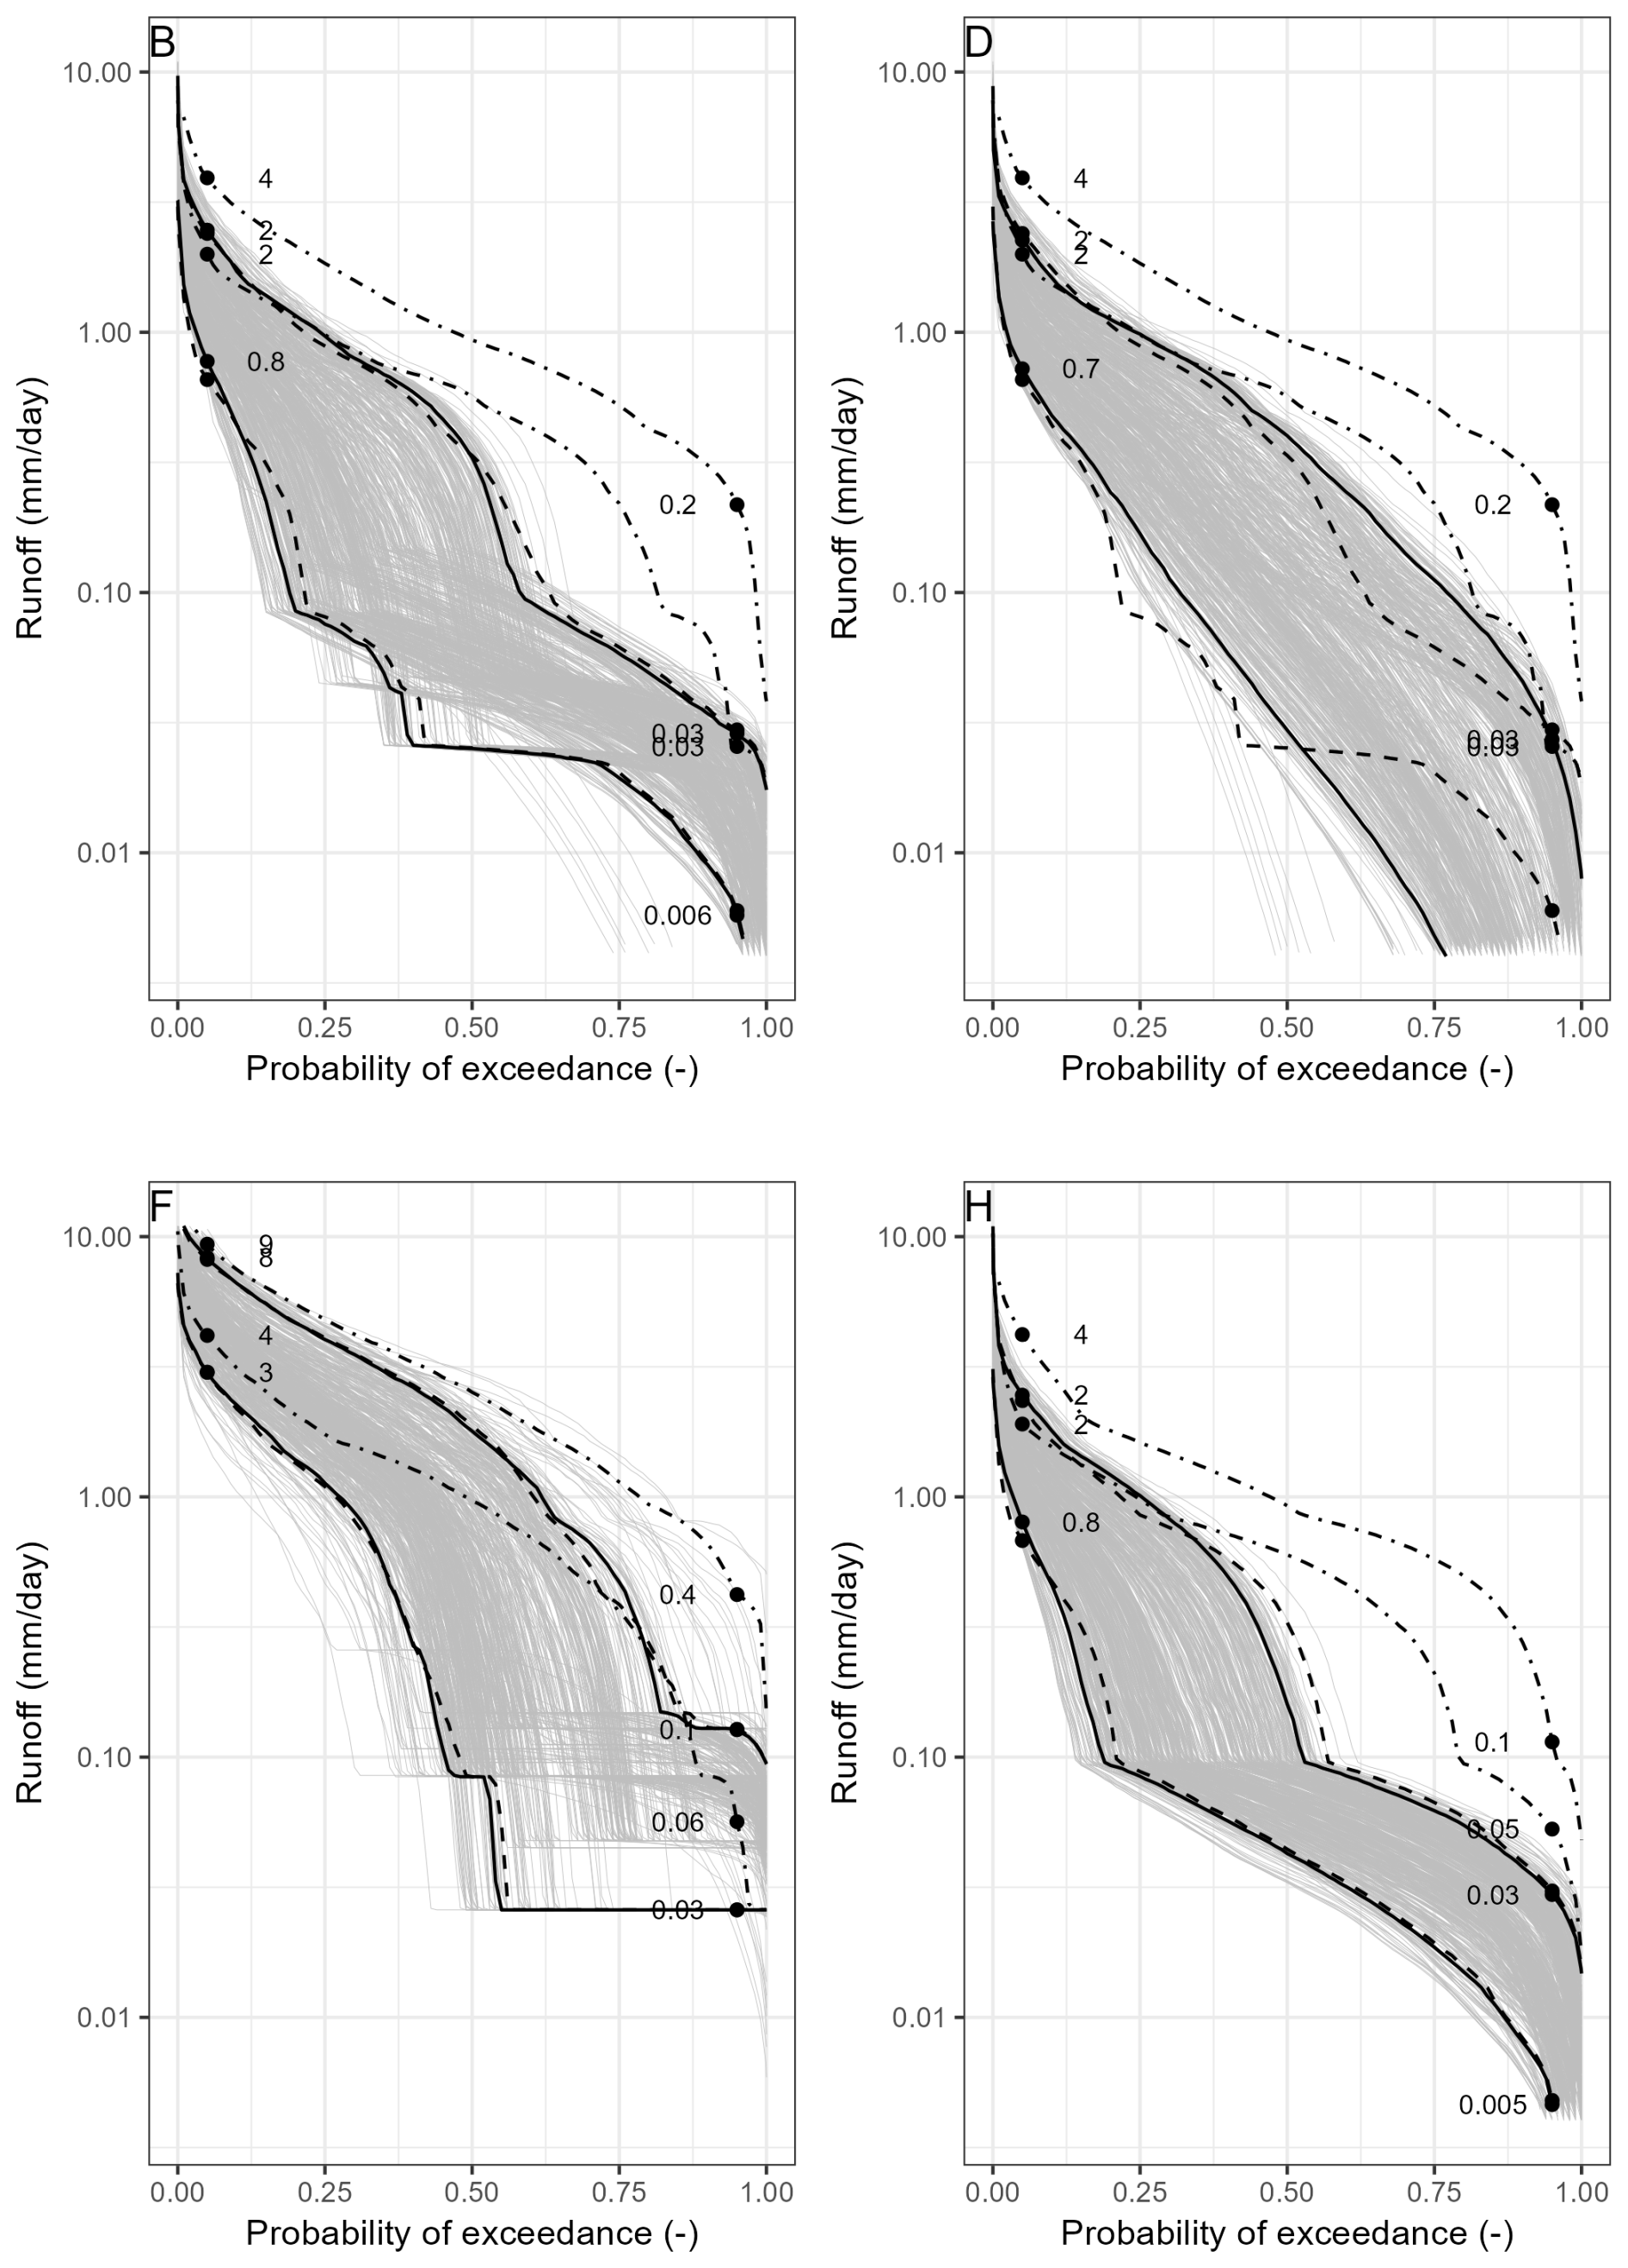
Figure 5Runoff exceedance curves for coniferous forest on peat (fens with Rewet2). Drained catchments are shown with grey lines. 5th and 95th percentiles are shown for Drained with solid black lines, while Rewet1 is shown with dashed lines and Rewet2 is shown with dot-dashed lines. R05 and R95 are shown for these lines from Drained and Rewet2 (n= 656).
R05 at the drained reference case (B) varies in the range of 0.8 to 2 mm d−1 and is similar for other cases, except with recharge (F), where the range is 3 to 8 mm d−1. Results are again not changed much with Rewet1, whereas Rewet2 mostly gives increased R05 (unfortunately) by a factor of 2 to 3, except in F, which has small changes in R05.
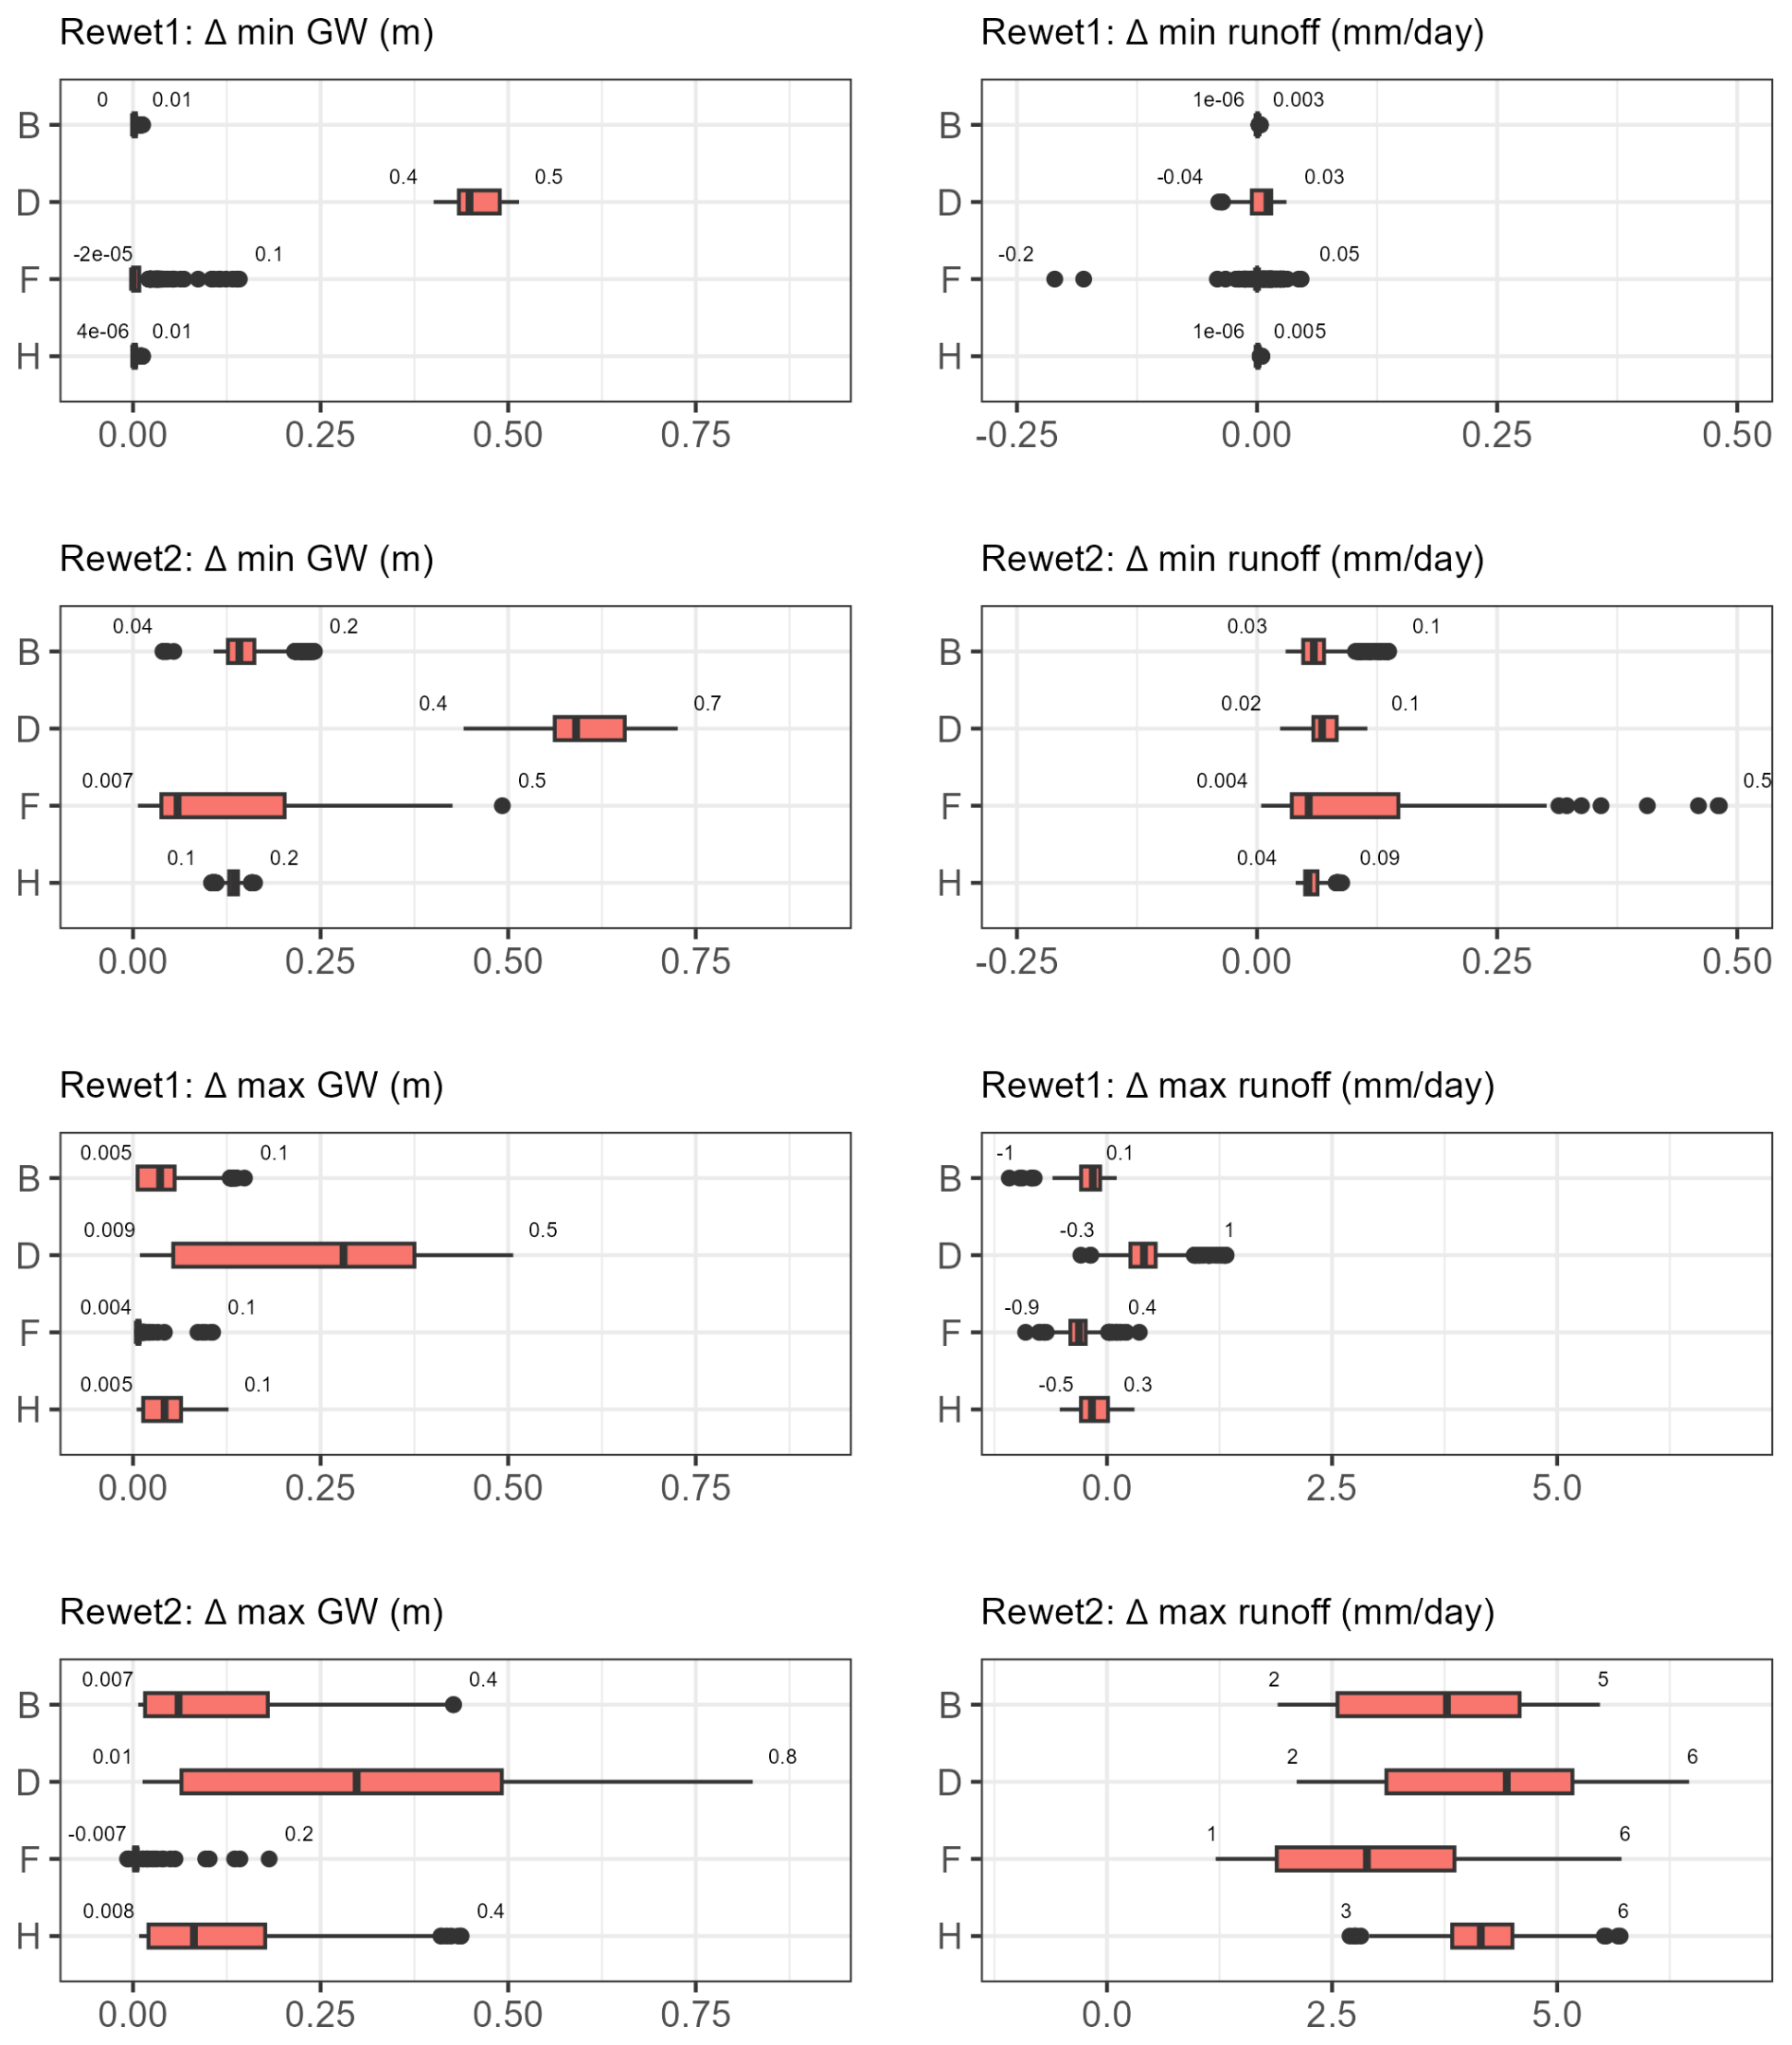
Figure 6Change in minimum and maximum groundwater levels and runoff with Rewet1 and Rewet2, for coniferous forest on peatland. n= 656 per case (sub-catchments with coniferous forest on peat of 1.5 m depth).
Next, we return to the yearly averages of minimum and maximum values; see Fig. 6. The minimum and maximum groundwater level increases up to 0.7 and 0.8 m, but there are also cases and sub-catchments with no increase after rewetting (similar to the results of Holden et al., 2011, and Karimi et al., 2024). This range is slightly larger than the range (95th percentiles) for groundwater level change in the literature review of Bring et al. (2022), which was a 0.27–0.63 m increase near the intervention and half as much on average 9 m (range 5–26 m) from the intervention. Their results were not presented in terms of minimum and maximum yearly values. When comparing Rewet1 and Rewet2, the latter gives substantially larger increases in the minimum and maximum groundwater levels, and the increases are especially large for case D (1.4 m ditches).
The minimum runoff changes between −0.2 and +0.5 mm d−1. These changes are large when compared with the range in drained minimum runoff presented in Fig. 5. The maximum runoff changes between −1 and +6 mm d−1, with at least the upper end being substantial when compared to typical high-runoff values (Fig. 5). Rewet2 gives larger minimum and maximum runoff compared with Rewet1, as expected. The relationship between groundwater extremes and runoff extremes requires some analysis (next section) because increases in minimum and maximum groundwater levels do not give the same response in runoff between cases.
3.3 Driving factors of variable rewetting responses
Here, we evaluate what factors determine the rewetting response in yearly runoff extremes in drained peatlands with coniferous forest. Groundwater extremes are also shown as an important part of the analysis.
3.3.1 Minimum groundwater levels and runoff
Before showing detailed quantitative results regarding changes in minimum yearly values (in Fig. 8), we briefly explain three different situations that occur; see Fig. 7. The minimum yearly groundwater level often increases with rewetting because of the lost ditch drainage at times of the year when the ditch was active (i.e. the groundwater level was above the ditch depth). Higher groundwater levels are associated with increased soil runoff. If the drained minimum level was below the level of ditches (left), then increased soil drainage is the only effect of rewetting on the minimum runoff, which increases. If the drained minimum groundwater level was instead slightly above the level of ditches (centre), the minimum runoff also increases because the increase in soil runoff is large enough to compensate for the small loss of ditch drainage. With higher initial groundwater levels (right), the increase in soil runoff can no longer compensate for the loss of ditch drainage, which means that the minimum runoff decreases with rewetting; however this is only true for Rewet1. With Rewet2, the additional wetness following reduced interception and evaporation also causes increased runoff here.
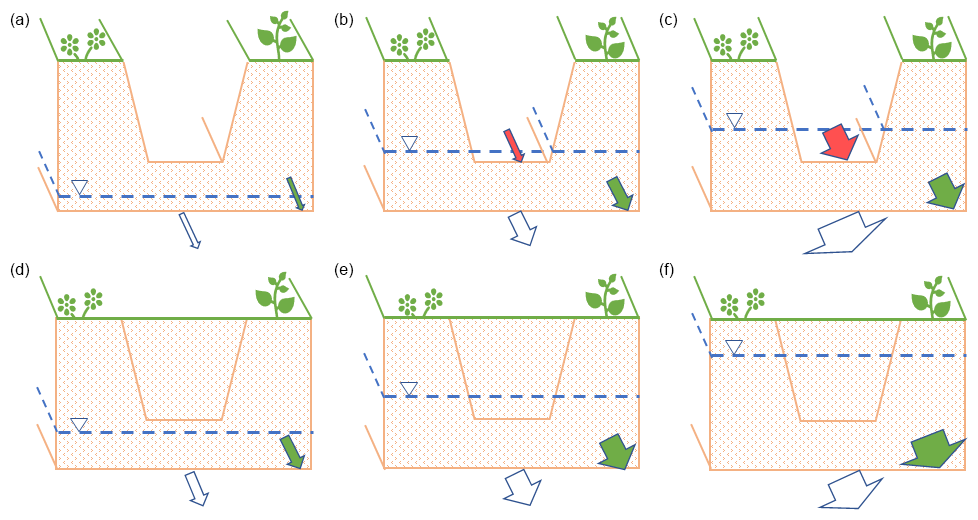
Figure 7Schematic of drained (a, b, c) and rewet (d, e, f) conditions during the time of the lowest groundwater level per year. Soil runoff (green), ditch runoff (red), and total runoff (white) are represented by arrows.
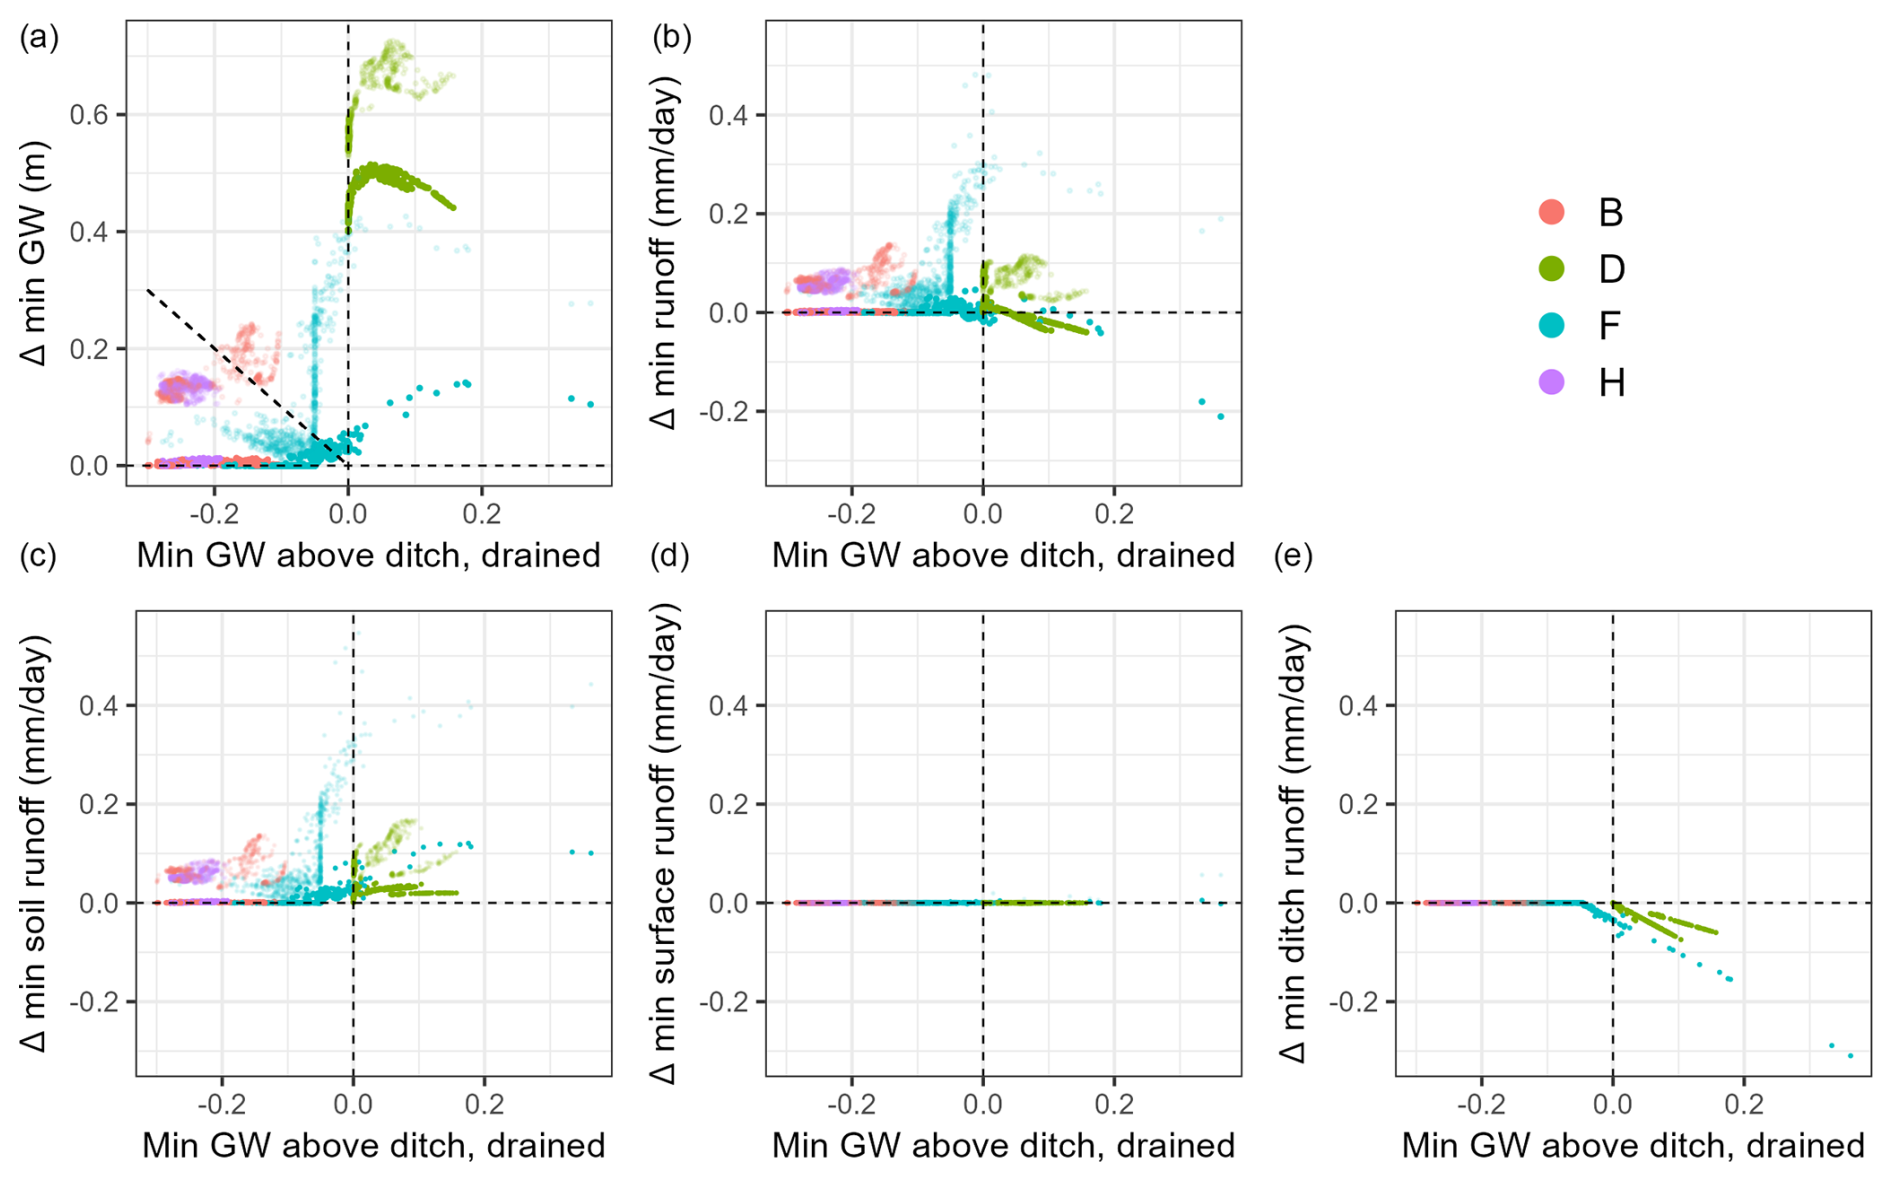
Figure 8Changes in average yearly minimum groundwater level and runoff, including the runoff pathways at the time of minimum total runoff, as a function of the drained minimum groundwater level above the level of ditches. Rewet1 cases are in full colour, and Rewet2 cases are shaded. At the diagonal line in (a), a change with rewetting would bring the minimum groundwater level to the level of the removed ditch, which in cases B, F, and H represents 0.7 m below the surface, i.e. close to the lower extent of the second soil layer, and in case D it represents 1.4 m below the surface (still in the third soil).
Figure 8 shows the quantitative data. Note first the increased minimum runoff for sub-catchments/cases/rewet scenarios to the left of the vertical line, i.e. with drained minimum groundwater levels below ditches (left panel of Fig. 7), although Rewet2 gives much larger increases compared with Rewet1. Even with the wetter conditions of Rewet2, the minimum level often remains in the third soil layer, perhaps because of the higher evaporation losses (which only impact the first and second layers) or the higher runoff coefficient above this layer, which effectively removes water from the soil.
Some sub-catchments of cases D (1.4 m) and F (recharge) have drained levels that are slightly above the ditch depth (middle panel of Fig. 7), and the small loss of ditch drainage is compensated for by increased soil runoff. With higher drained levels, the lost ditch runoff is larger, and with Rewet1 (but not Rewet2), the total runoff decreases.
3.3.2 Maximum groundwater levels and runoff
Impacts on the maximum yearly runoff are highly connected with the drained maximum groundwater levels; see Fig. 9. In most cases, the drained maximum level is below the soil surface prior to rewetting (top-left panel). If it remains below the surface (left centre), the maximum runoff decreases (as desired) because lost drainage is not compensated for by soil runoff alone without the additional “help” from surface runoff. If the level reaches the surface, then the total runoff increases instead (lower left) because surface runoff “helps” compensate for the lost ditch runoff. If the drained maximum groundwater level was already above the soil surface (top-right panel), some cases do not get sufficient increases in the surface runoff to compensate for the loss of ditch drainage (right centre), meaning that the total runoff is reduced. Other cases get very large increases in surface runoff that cause increases in the total runoff (bottom-right panel). Below we explore what causes the difference in behaviour between the centre and lower panels.
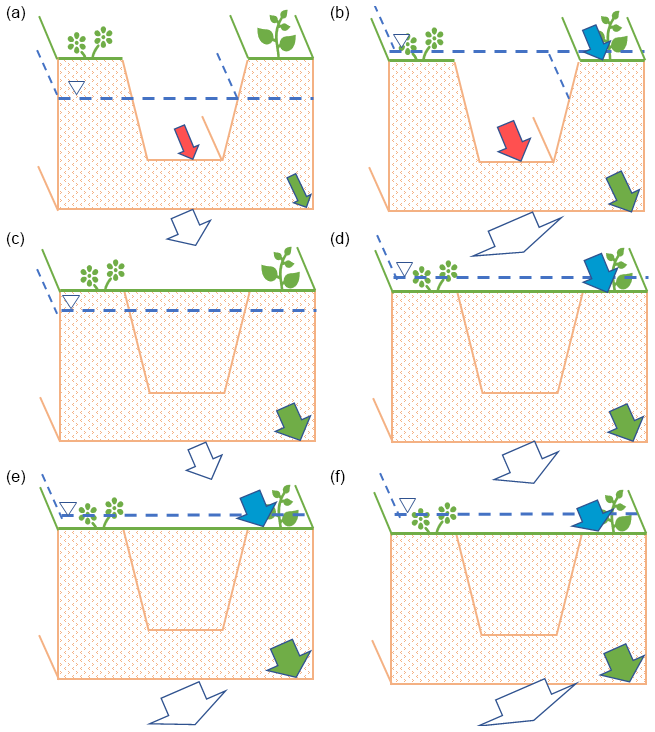
Figure 9Schematic of drained (a, b) and rewet (middle and lower rows) conditions during the time of the maximum runoff per year for situations where the drained level was below (a, c, e) or above (b, d, f) the soil surface. Soil runoff (green), ditch runoff (red), surface runoff (blue), and total runoff (white) are represented by arrows.
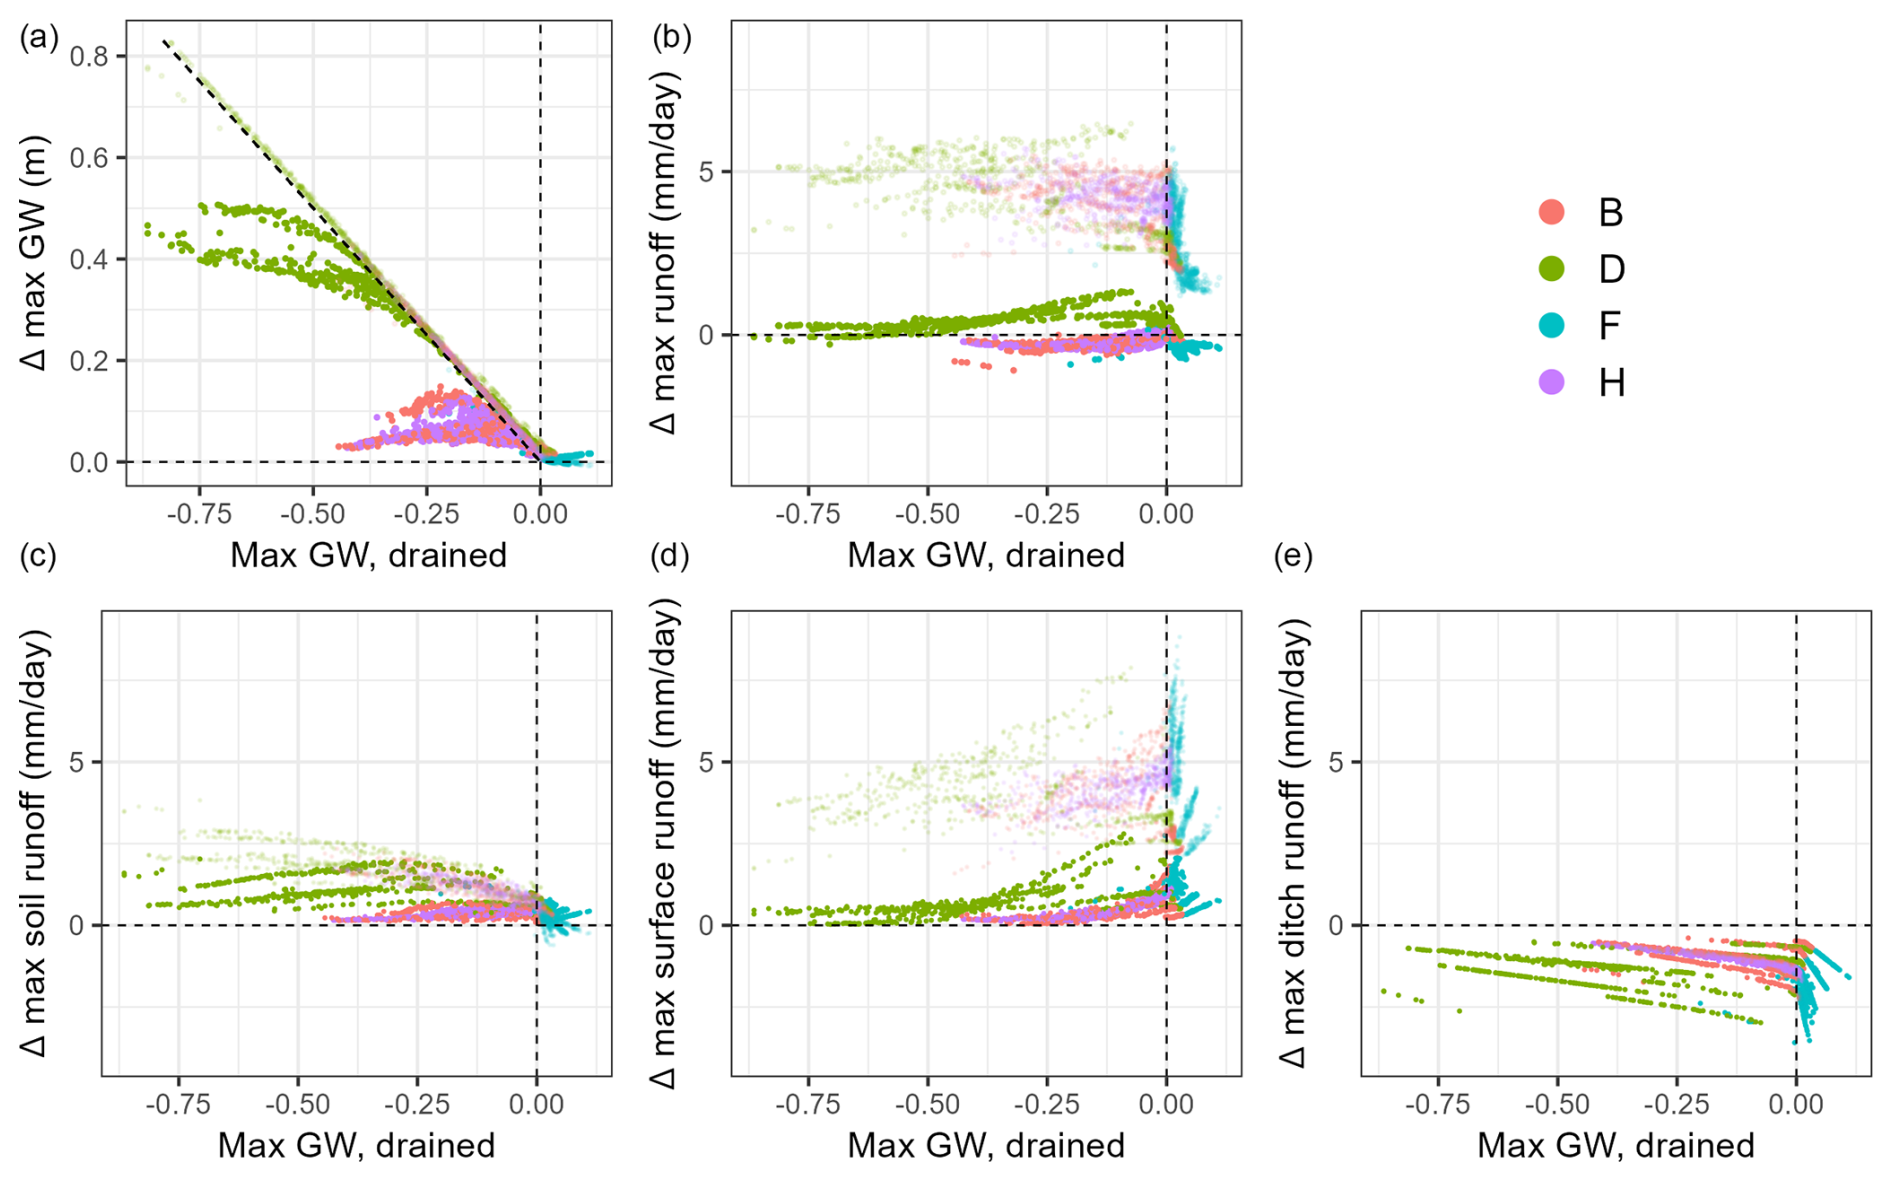
Figure 10Changes in average yearly maximum groundwater level and runoff, including the runoff pathways at the time of maximum total runoff, as a function of the drained maximum groundwater level. Rewet1 cases are in full colour, and Rewet2 cases are shaded. At the diagonal line in (a), a change with rewetting would bring the maximum groundwater level to the soil surface.
Figure 10 shows the quantitative data. Note first the sub-catchments/cases/rewet scenarios to the left of the vertical line, i.e. with drained maximum groundwater levels below the soil surface (left panel of Fig. 9), which is the most common. When the maximum level reaches the surface after rewetting, the maximum runoff is increased. This almost always occurs with Rewet2, with large increases in the maximum runoff mostly in the range of 3–6 mm d−1. With Rewet1, only some of these originally below-surface sub-catchments reach the surface, and when they do, the increase in runoff is smaller, around 0–1 mm d−1, or even shows small reductions in some sub-catchments. Here, with lower drained levels, the levels remain below the surface, and the runoff is almost unchanged.
With case F (recharge), the drained maximum level was already above the surface due to the additional inflow from recharge areas. Here, with Rewet1, the loss of substantial ditch drainage after rewetting overshadows the increases in soil and surface runoff, reducing the total runoff by up to 1 mm d−1. With Rewet2 (case F), the total runoff instead increases (around 1–5 mm d−1) due to a larger increase in the surface runoff. Some cases here have a minor decrease in soil runoff despite a small increase in groundwater level, but this is only because they represent different times. The groundwater level is shown at the end of the time step but does change within the time step, for example, with heavy rain and surface runoff, meaning that the day of the maximum total runoff (i.e. the day we show soil runoff) can be different from the day of the maximum groundwater level, and even when these days are the same, soil runoff is calculated early in the time step and is therefore more affected by the groundwater level from the previous time step. The timing of maximum runoff in case F is impacted by surface runoff, which may be why the perceived discrepancy was only seen here.
The results presented here imply the following related to the potential of rewetting of ditched forested peatland to increase water security in Swedish streams.
Rewetting of these lands unfortunately cannot help improve water security (increasing low flow or reducing peak flows) in catchments of 10 km2 or more. We base this conclusion on the extensive analysis of simulation results where the change in minimum and maximum yearly discharge was less than 5 %. Here, we also remind the reader that the study design already implies an overestimate of the impact because rewetting was applied to all drained forested peatlands, which is not in the current plans (only around 1×10⁵ ha of 7×10⁵ ha nationally will be restored). In addition, we assumed perfect recovery to undrained conditions, which would probably not occur or would take a long time. The peatland area considered for rewetting is simply too small a fraction of the surface area of Sweden (1 %) to have any significant buffering impact on water discharge.
The question is then whether rewetting can impact extreme flows at smaller scales, which could be important e.g. for local biodiversity in those streams. The largest relative impact would be obtained in small streams draining only peatlands that were fully impacted by drainage before rewetting and then fully restored. For these cases, we can conclude the following regarding the runoff from the drained and rewet peatland:
-
Rewetting with restoration to naturally lower tree density (in addition to ditch blocking) often results in substantial increases in simulated low runoff, with an increase of up to a factor of 10. If tree density remained unchanged, changes in low runoff were smaller, and here, very active ditches prior to restoration (deep ditches or wet soil due to lateral inflow) sometimes resulted in reduced low runoff after rewetting. In other words, rewetting can help improve water security related to increased low flow in small streams draining only rewet peatlands if restored conditions mimic those of original wetlands, including reduced tree cover.
-
Similarly, simulated high runoff in small streams draining only rewet peatlands is only substantially impacted if conditions are restored to the natural conditions of wetlands, but unfortunately substantial changes only occur in the opposite direction to what is desired by water managers, with higher high flows. If the peatland was already wet due to lateral inflow, the changes in high runoff were sometimes smaller. This means that rewetting generally cannot help improve water security related to high flows in these small streams and that the situation is expected to worsen if or when conditions are returned to those of original wetlands.
The analysis of changes in groundwater extremes was only included in this study to understand flow extremes, but we note briefly that the minimum and maximum groundwater levels increased substantially in many cases and that the range of impact was larger than in a recent literature review by Bring et al. (2022). Changes in groundwater level might have implications for other ecosystem services and risks, related to e.g. forest fires, greenhouse gas emissions, water quality, biodiversity, recreation, and pests. This is now a very important and extensive research field in Sweden (e.g. SLU, 2025).
Rewetting with the restoration of topographical barriers was not studied here and might be better described by the literature on constructed wetlands with defined outflow sections.
From this model experiment, the following conclusions could be drawn regarding rewetting of forested peatlands to solve problems with extreme flows in Sweden and to identify the main causes behind the diverse impacts noted in the literature:
-
Rewetting drained forested peatlands is not a method that will increase water security related to too little or too much water in the landscapes of Sweden (catchments with a size of 10 km2 or more), as these lands constitute a fraction of the landscape that is too small (1 %).
-
Tree cover is a major driver of the discrepancy in hydrological impacts in small streams draining from rewetted peatlands. Hydrological drought can be reduced if trees are removed during the restoration; however, high flows are then likely to increase. To reduce high flows instead, the trees should thus be kept. Hence, it is important to decide which of these extremes should be addressed with a specific rewetting activity depending on the conditions downstream.
-
Groundwater levels often increase substantially with rewetting, which is the purpose of rewetting and thus expected. The groundwater levels before rewetting were found to be of major importance for the hydrological impact. We recommend that their implications for various ecosystem services and risks should be monitored and documented accordingly to follow up on environmental change and resilience.
It would be ideal to compare conclusions from this work with field observations. Variable impacts on flow extremes observed in field studies can be more easily understood if the following data are recorded:
-
Catchment characteristics. These include the area, land use, and soils of the catchment and the area, land use, and soils of the restored area (in relation to the full catchment).
-
Drained conditions. These include the depth of ditches and dynamic groundwater levels, including the lateral influence of ditches in transect groundwater wells, extreme groundwater levels in relation to ditch depth, and soil surface.
-
Type of rewetting performed/achieved. This includes ditch blocking performance, change in tree cover density, and impacts on groundwater levels.
This appendix gives a complementary overview of the HYPE model and more details for specific parts important to modelling the hydrological effects of peatland restoration.
A1 Stores and fluxes within and between sub-catchments
Spatial variability in water balance and fluxes across a landscape is simulated through meteorological forcing, topography, hydrological response units (HRUs), human alteration, and features of waterbodies along the river network. When setting up the HYPE model, a river basin or catchment is therefore divided into parts, not overlapping, called sub-catchments or subbasins, which are defined by topography. At each time step, forcing through precipitation and temperature initiates alterations to air–land–vegetation–soil–groundwater processes, which, together with human withdrawals, discharges, and dam regulations, cause a response in waterbodies in the river network and eventually discharge at the subbasin outlet (Fig. A1).
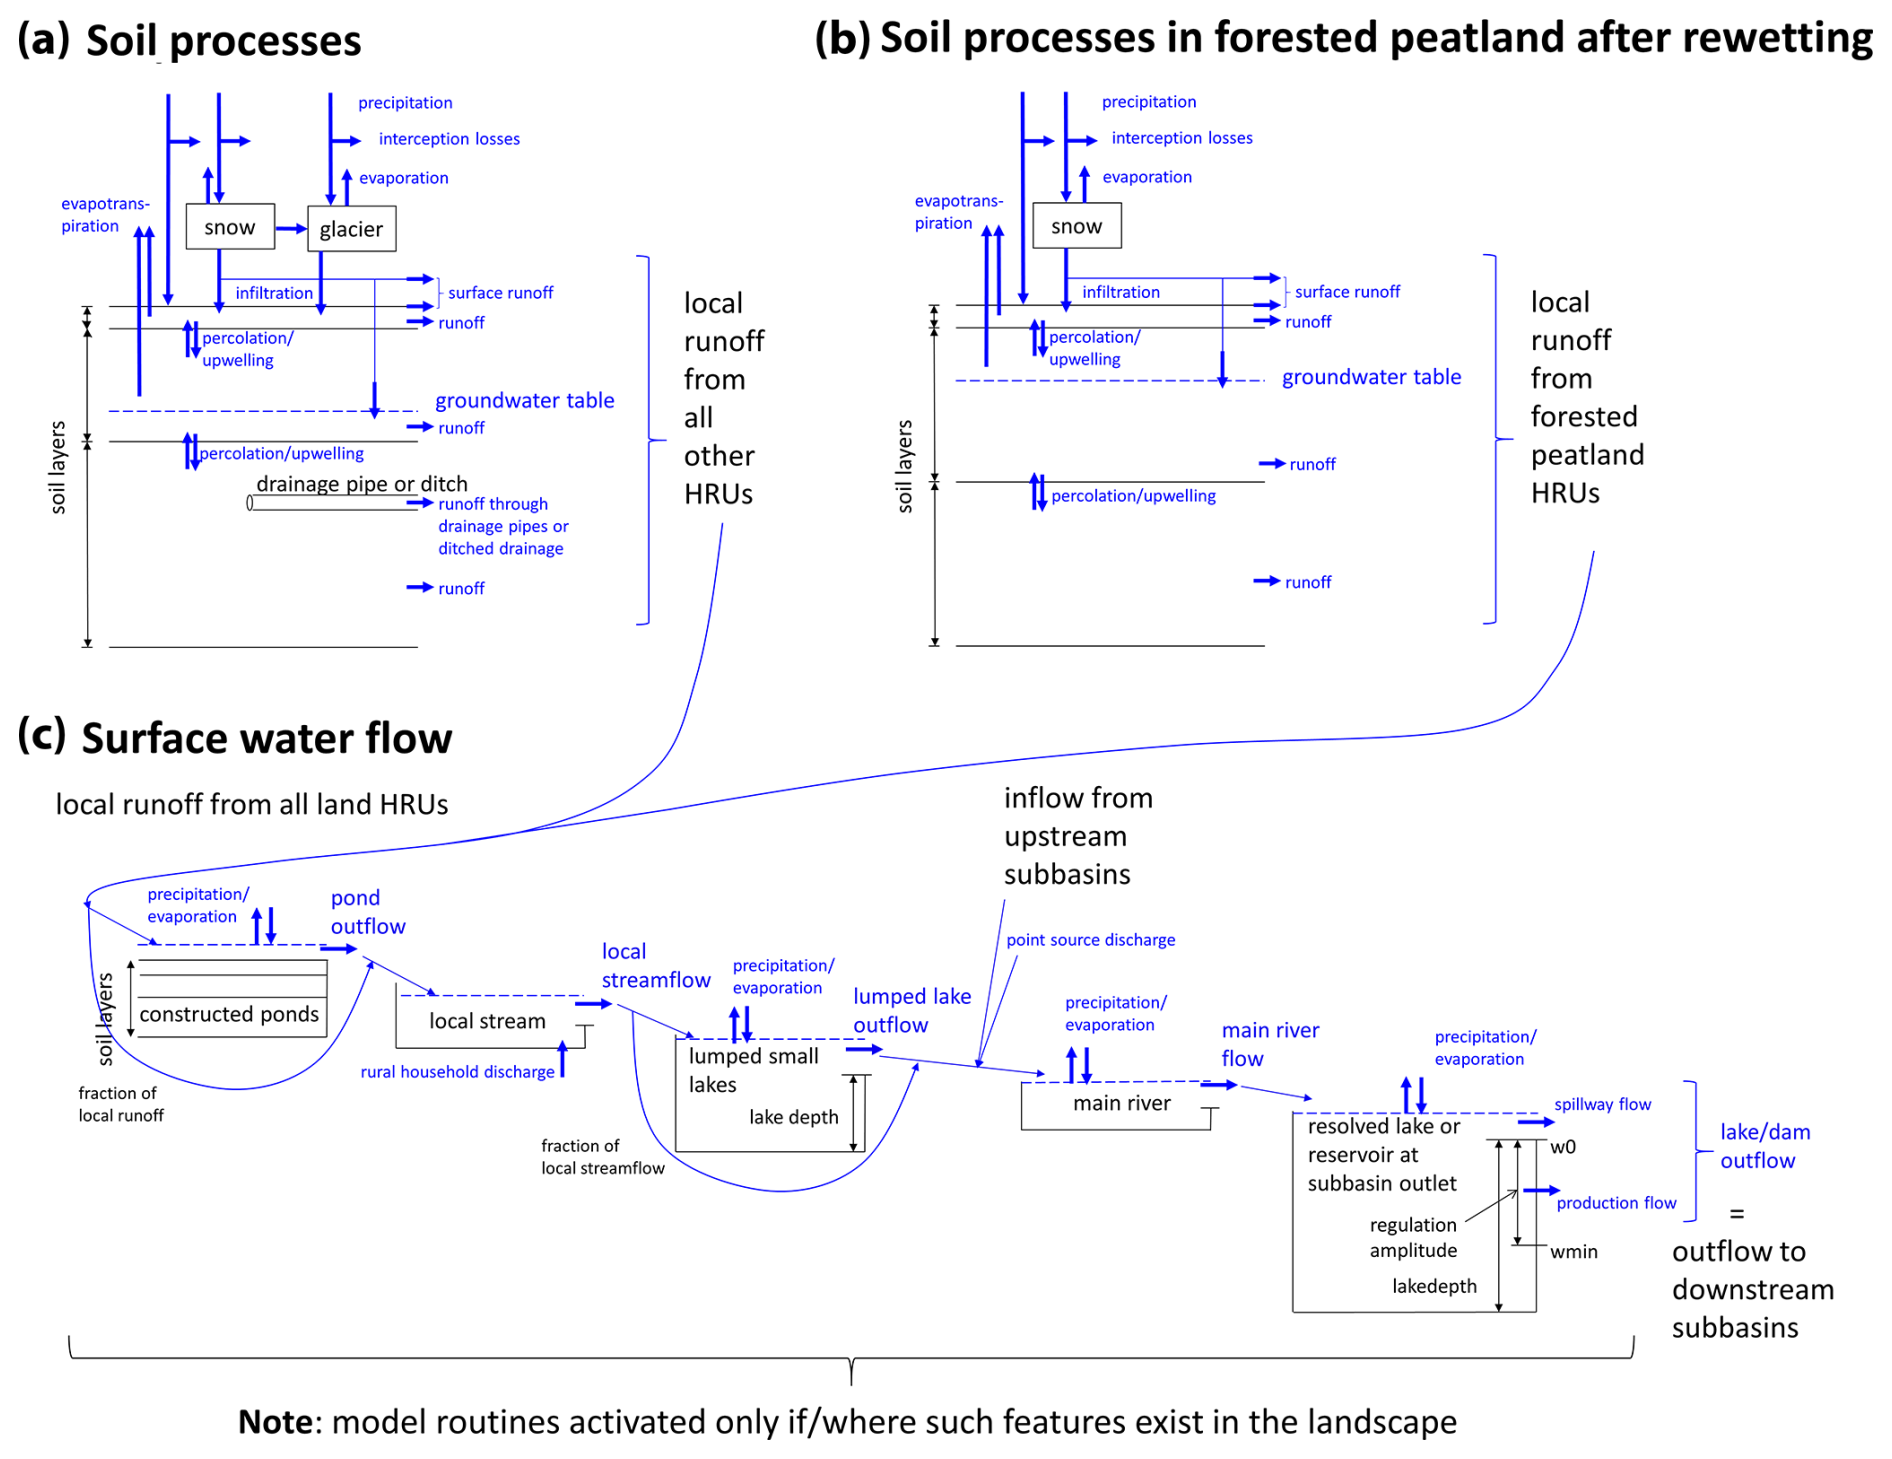
Figure A1Overview of water flow, fluxes, and storage simulated in a HYPE subbasin, illustrated as vertical profiles of the water balance in different segments of the landscape, where (a) and (b) flow into (c). Each scheme shows the processes accounted for in (a) each soil/vegetation layer or snow and ice cover, (b) rewet peatlands, and (c) potential waterbodies of the surface water network in each subbasin.
Upstream subbasins contribute to a downstream subbasin with an inflow to the subbasin's main river. The subbasin river network can be composed of the main river, a lake at the outlet of the subbasin, and one conceptual local stream and lake that receive (part of) the runoff from the subbasin's land. The land area of a subbasin is divided into HRUs composed of combinations of land use, soil type, and soil depth. The HRUs normally do not influence each other; each responds to the forcing data (precipitation and air temperature), depending on the characteristics and parameters of the HRU (a and b in Fig. A1). The surface waters (e.g. lakes, rivers, and constructed ponds) depend on inflow from surrounding or upstream areas. They are calculated in series for the river network located within the subbasin (c in Fig. A1).
The two rewetting scenarios analysed correspond to the forested peatland HRU in Fig. A1b. Scenario Rewet1 (restoration by filling ditches) is represented in the model by removal of pathway runoff through ditch drainage. Scenario Rewet2 (changing land use of the drained part to forested wetland, in addition to filling ditches) is represented in the figure by changed fluxes due to evaporation, interception, and surface runoff (size of flows). Note that in Fig. A1a the ditch drainage is located in soil layer three, similar to assumptions C and D in the sensitivity analysis of conditions prior to rewetting (Table 3 in the main text), whereas in other simulated assumptions, it is located in soil layer two to analyse the impact of ditch depth on restoration performance. Assumptions E and F (recharge–discharge area model) correspond to a fraction of the runoff from the soil in Fig. A1a being diverted to the soil in Fig. A1b, creating wetter conditions there.
Wetland HRUs separate themselves from other HRUs by having other values of model parameters. In the parameterization used here (version S-HYPE2016i), three wetland HRUs with peat soil are simulated, in addition to one constructed pond HRU. Common differences between wetlands and other HRUs are a lower evapotranspiration rate and larger interception, consistent with less vegetation and a higher snowmelt rate due to higher insolation (than e.g. forests). They have higher water content than other soils and lower runoff coefficients than e.g. moraine. One of the wetland HRUs is forested wetland (on peat soil). In this study, we explore the rewetting of forests on peat; i.e. the soil type does not change with rewetting.
Interception losses are simulated as a reduction in the precipitation before it reaches the soil surface of an HRU. The HYPE parameter in question, pcluse, depends on the land use and is defined as the removal fraction of precipitation; i.e. precipitation is multiplied by the factor (1 − pcluse) (see Table 2 in the main text).
The actual evapotranspiration is calculated as a fraction of modelled potential evapotranspiration (PET). The model in this paper uses HYPE's default model algorithm for PET together with regional calibration. The algorithm is temperature and land use dependent and has a sinusoidal seasonal adjustment. The regional correction factor, cevpcorr, adjusts the rate in larger regions. HYPE does not simulate evaporation separately from transpiration. PET is calculated for the top two soil layers, assuming an exponential decrease with depth, if the air temperature is above a certain threshold (parameter ttmp; see Table 2 in the main text). In addition to PET, actual evapotranspiration of the land HRUs depends on the current soil moisture relative to field capacity and is linearly reduced to be zero at the wilting point.
The S-HYPE model was calibrated in two steps: first, finding general parameter values for the whole domain (i.e. the country of Sweden) and thereafter adjusting regional deviations for key parameters from these general values. The general parameters are of three types: (1) constant in the whole model domain, (2) coupled to land use, and (3) coupled to soil type. These parameters were calibrated for 153 small- and medium-sized basins (< 2000 km2), unaffected by hydropower regulation. The general model parameters were calibrated manually by compromising between the overall agreement (focusing on the NSE criterion) for the basins with discharge observations and keeping the parameters within realistic ranges. Since the S-HYPE model is also used for water quality applications, special attention was paid to the behaviour of groundwater levels, surface runoff, water flow paths, and the water-holding characteristics of different soil types during calibration. By including these pathways, we were able to represent observed changes in groundwater levels with rewetting (similar range), as shown in the current study. For daily discharge, the mean NSE is 0.86, and the volume error is −3 % (cf. 0.74 and −2 % in 350 stations that also include those impacted by hydropower). The model performance was further evaluated against catchment characteristics to make sure that no trends in volume errors with respect to e.g. land use remained (see e.g. Fig. B1).
The regional deviations of key parameters within selected parameter regions govern how these parameters deviate from the general values. They are a compromise between a completely general model and a model where all parameters are calibrated individually for each gauging station. The regional deviations are calibrated based on the regional agreement and the deviation from the general values. The long-term vision is to continuously improve the model structure and input data, thereby reducing the need for regional adjustments. The S-HYPE model is currently used in both versions: the general setup, without regional adjustments, for instance for water balance studies, and with full regional adjustments, for example forecasts and warning services. In this paper, both versions are used as the impact of regional calibration is assessed (cases G and H compared with A and B).
In this study on the impact of rewetting peatlands on extreme flows, model performance on high and low flows is of particular interest. Figure B2 shows an evaluation of low flows (MLQ: mean of the lowest flows for each year), mean flow (MQ: mean flow), and high flows (MHQ: mean of the highest flows for each year). The corresponding NSE for each data set is 0.74, 0.99, and 0.95. The figure illustrates that the relative uncertainty is the largest for low flows, with a slight average overestimation, whereas the high flows are often slightly underestimated. The errors in average discharge (MQ) are typically negligible. The discrepancies between modelled and recorded values are, however, not only due to uncertainties in the modelled values. The recorded values are in fact not really measurements but are estimated through rating curves, with large uncertainties in the extremes (both low and high) due to real-life problems such as damming by, for instance, ice or vegetation, missing observations, and other perturbations to the river section in question. The data extracted from the database have a resolution of 1 L s−1, which is a further indication of the many uncertainties in the recorded data, especially during low flow.
In summary, the model is able to produce realistic responses to both dry and wet conditions, and because it was also developed for water quality assessments, it contains necessary pathways and provides similar local groundwater responses to rewetting to those found in the literature. In addition, the setup of the current study effectively removes uncertainties related to meteorological variability, which often disturb conclusions from experiments using only observed data from field studies. We therefore consider this model to be highly suitable for the analysis of hydrological impacts from rewetting forested peatlands in Sweden.
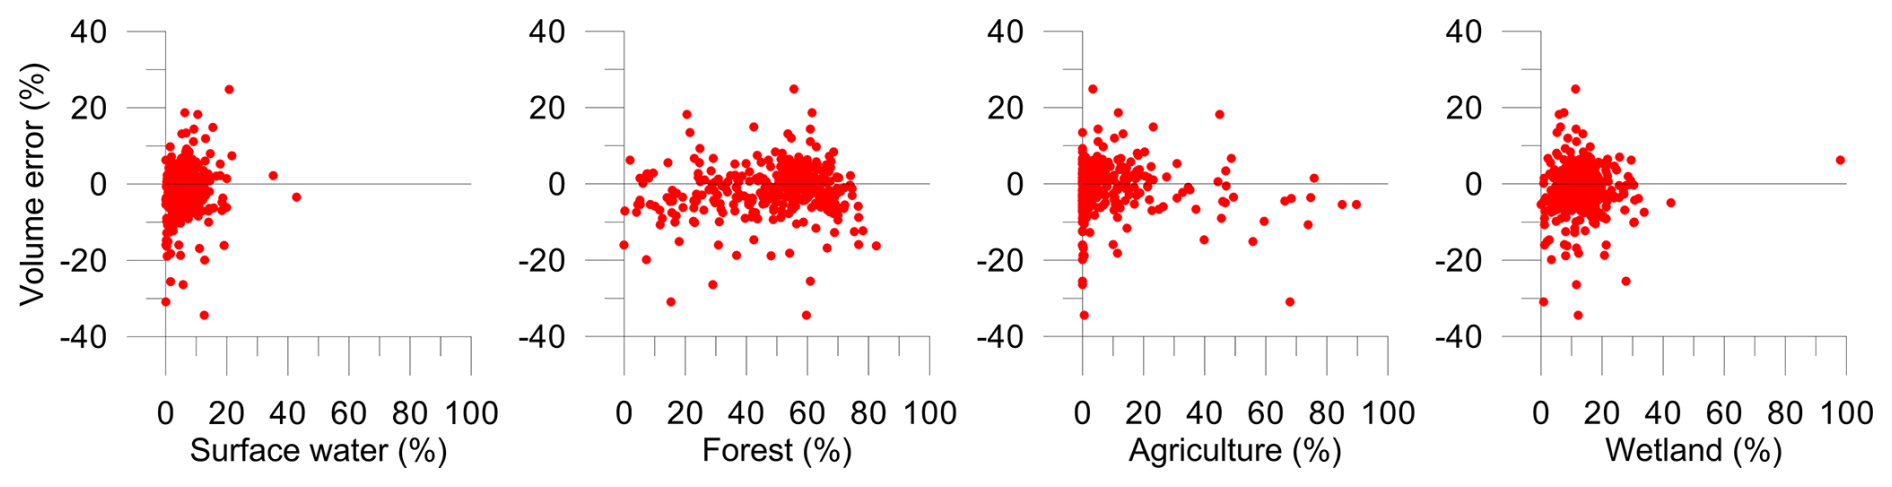
Figure B1Scatter plot of volume errors versus percentages of surface water, forest, agriculture, and wetland from 350 basins with at least 10 years of observations.
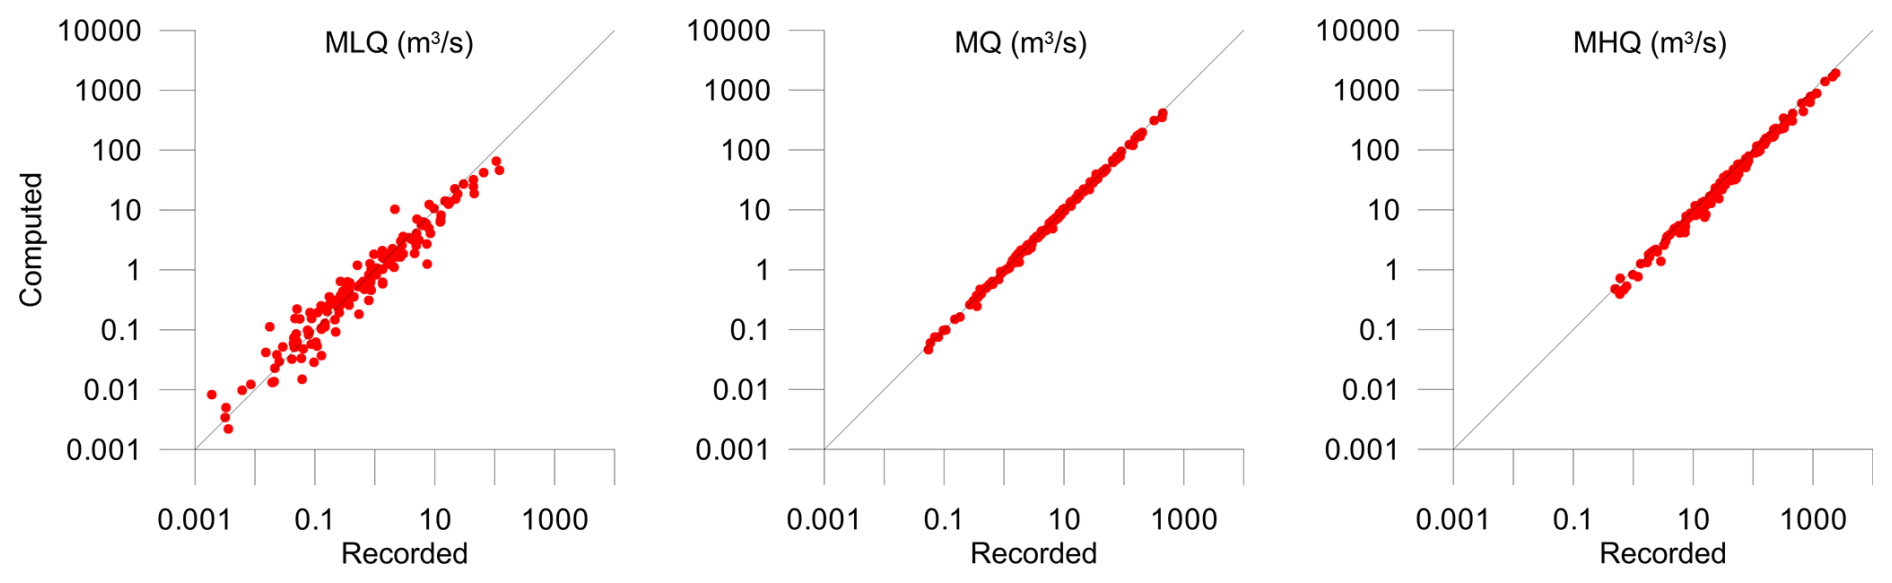
Figure B2Evaluation of annual low flows, mean, annual high flows, and daily means per station. NSE of 0.74, 0.99, and 0.95, respectively. A total of 157 stations with at least 15 years of complete daily data, with negligible hydropower regulation.
The processed simulation results are available at https://doi.org/10.5281/zenodo.13472209 (Elenius et al., 2024). The HYPE open-source code HYPE version 5.19.0 (SMHI, 2022) is available at https://sourceforge.net/projects/hype/files/release_hype_5_19_0/, where also documentation of the code can be found. It was used to produce time series of discharge with S-HYPE version 2016i (SMHI, 2024, the data used in Appendix B) which are available at https://vattenwebb.smhi.se/archive/V-2024-05-21/. The HYPE code HYPE version 5.19.3 (SMHI, 2023) is available at https://sourceforge.net/projects/hype/files/release_hype_5_19_3/, and is the same as the code used for simulating the rewetting scenarios (HYPE version 5.19.2), except for a bug fix that was not affecting our scenarios.
ME conceived the study. GL and CP made HYPE code developments. ME and SS performed HYPE simulations and analysis. CP and BA contributed to the interpretation of the results. ME and BA designed the paper structure and wrote the initial draft. ME, CP, GL, and BA contributed to the final paper and revisions. CP wrote the main parts of Appendix A, and GL wrote the main parts of Appendix B, while ME and BA contributed to both appendices.
The contact author has declared that none of the authors has any competing interests.
Publisher’s note: Copernicus Publications remains neutral with regard to jurisdictional claims made in the text, published maps, institutional affiliations, or any other geographical representation in this paper. While Copernicus Publications makes every effort to include appropriate place names, the final responsibility lies with the authors.
The authors acknowledge the funders and Kristina Isberg at SMHI for help with data processing of ditches, as well as the constructive feedback from the two anonymous reviewers. The study was inspired by the International Association of Hydrological Sciences (IAHS) Science for Solutions decade 2023-2032 (HELPING).
This research has been supported by the Naturvårdsverket (grant nos. NV-01874-23 and NV-08138-18) and the Svenska Forskningsrådet Formas (grant no. FR-2022/0006).
The publication of this article was funded by the Swedish Research Council, Forte, Formas, and Vinnova.
This paper was edited by Loes van Schaik and reviewed by two anonymous referees.
Acreman, M. C. and Holden, J.: How wetlands affect floods, Wetlands, 33, 773–786, https://doi.org/10.1007/s13157-013-0473-2, 2013.
Åhlén, I., Thorslund, J., Hambäck, P., Destouni, G., and Jarsjö, J.: Wetland position in the landscape: Impact on water storage and flood buffering, Ecohydrology, 15, e2458, https://doi.org/10.1002/eco.2458, 2022.
Arheimer, B. and Lindström, G.: Implementing the EU water framework directive in Sweden, Runoff Predictions in Ungauged Basins–Synthesis across processes, places and scales, edited by: Blöschl, G., Sivapalan, M., Wagener, T., Viglione, A., and Savenije, H., Cambridge University Press, Cambridge, UK, 465, 353–359, https://doi.org/10.1017/CBO9781139235761.014, 2013.
Arheimer, B. and Pers, B. C.: Lessons learned? Effects of nutrient reductions from constructing wetlands in 1996–2006 across Sweden, Ecol. Eng., 103, 404–414, https://doi.org/10.1016/j.ecoleng.2016.01.088, 2017.
Ballard, C. E., McIntyre, N., and Wheater, H. S.: Effects of peatland drainage management on peak flows, Hydrol. Earth Syst. Sci., 16, 2299–2310, https://doi.org/10.5194/hess-16-2299-2012, 2012.
Bring, A., Thorslund, J., Rosén, L., Tonderski, K., Åberg, C., Envall, I., and Laudon, H.: Effects on groundwater storage of restoring, constructing or draining wetlands in temperate and boreal climates: a systematic review, Environ. Evid., 11, 38, https://doi.org/10.1186/s13750-022-00289-5, 2022.
Daniels, J. and Thunholm, B.: Rikstäckande jorddjupsmodell (National soil depth model), SGU, Rapp. 2014:14, https://resource.sgu.se/dokument/publikation/sgurapport/sgurapport201414rapport/s1414-rapport.pdf (last access: 22 August 2025), 2014.
Davidson, N. C.: How much wetland has the world lost? Long-term and recent trends in global wetland area, Mar. Freshwater Res., 65, 934–941, https://doi.org/10.1071/MF14173, 2014.
Drott, A. and Eriksson, H.: Klimatpåverkan från dikad torvtäckt skogsmark – effekter av dikesunderhåll och återvätning (Kunskapssammanställning och analys) [Climate impacts from drained peat-covered forest – effects from ditch maintenance and rewetting], Skogsstyrelsen, Rapp. 2021/7, https://www.skogsstyrelsen.se/globalassets/om-oss/rapporter/rapporter-20222021202020192018/rapport-2021-7-klimatpaverkan-fran-dikad-torvtackt-skogsmark–effekter-av-dikesunderhall-och-atervatning.pdf (last access: 22 August 2025), 2021.
Edokpa, D., Milledge, D., Allott, T., Holden, J., Shuttleworth, E., Kay, M., Johnston, A., Millin-Chalabi, G., Scott-Campbell, M., and Chandler, D.: Rainfall intensity and catchment size control storm runoff in a gullied blanket peatland, J. Hydrol., 609, 127688, https://doi.org/10.1016/j.jhydrol.2022.127688, 2022.
Elenius, M., Pers, C., Schützer, S., and Arheimer, B.: research data for the article Elenius et al, 'Where can rewetting of forested peatland reduce extreme flows?', Zenodo [data set], https://doi.org/10.5281/zenodo.13472209, 2024.
Erlandsson, M., Laudon, H., and Fölster, J.: Spatiotemporal patterns of drivers of episodic acidification in Swedish streams and their relationships to hydrometeorological factors, Sci. Total Environ., 408, 4633–4643, https://doi.org/10.1016/j.scitotenv.2010.06.010, 2010.
Holden, J.: Peatland hydrology and carbon release: why small-scale process matters, Philos. T. R. Soc., 363, 2891–2913, https://doi.org/10.1098/rsta.2005.1671, 2005.
Holden, J., Wallage, Z., Lane, S., and McDonald, A.: Water table dynamics in undisturbed, drained and restored blanket peat, J. Hydrol., 402, 103–114, https://doi.org/10.1016/j.jhydrol.2011.03.010, 2011.
Holmen, H.: Forest ecological studies on drained peat land in the province of Uppland, Sweden, parts I–III, Skogshögskolan, https://pub.epsilon.slu.se/12768/1/SFS016.pdf (last access: 22 August 2025), 1964.
IPCC: Sections, in: Climate Change 2023: Synthesis Report, Contribution of Working Groups I, II and III to the Sixth Assessment Report of the Intergovernmental Panel on Climate Change, edited by: Core Writing Team, Lee, H., and Romero, J., IPCC, Geneva, Switzerland, 35–115, https://doi.org/10.59327/IPCC/AR6-9789291691647, 2023.
Johansson, B.: Modelling the effects of wetland drainage on high flows, SMHI, RH8, ISSN 0283-1104, https://urn.kb.se/resolve?urn=urn:nbn:se:smhi:diva-2676 (last access: 22 August 2025), 1993.
Karimi, S., Leach, J., Karlsen, R. H., Seibert, J., Bishop, K., and Laudon, H.: Local-and network-scale influence of peatlands on boreal catchment response to rainfall events, Hydrol. Process., 37, e14998, https://doi.org/10.1002/hyp.14998, 2023.
Karimi, S., Hasselquist, E. M., Salimi, S., Järveoja, J., and Laudon, H.: Rewetting impact on the hydrological function of a drained peatland in the boreal landscape, J. Hydrol., 641, 131729, https://doi.org/10.1016/j.jhydrol.2024.131729, 2024.
Lehmann, J., Coumou, D., and Frieler, K.: Increased record-breaking precipitation events under global warming, Climatic Change, 132, 501–515, https://doi.org/10.1007/s10584-015-1434-y, 2015.
Lidberg, W., Paul, S. S., Westphal, F., Richter, K. F., Lavesson, N., Melniks, R., Ivanovs, J., Ciesielski, M., Leinonen, A., and Ågren, A. M.: Mapping drainage ditches in forested landscapes using deep learning and aerial laser scanning, J. Irrig. Drain. Eng., 149, 04022051, https://doi.org/10.1061/JIDEDH.IRENG-9796, 2023.
Lindström, G.: Lake water levels for calibration of the S-HYPE model, Hydrol. Res. 47, 672–682, https://doi.org/10.2166/nh.2016.019, 2016.
Lindström, G.: Hydrologiska aspekter på åtgärder mot vattenbrist och torka inom avrinningsområden [Hydrological aspects on measures against water scarcity and drought in catchments], SMHI, https://urn.kb.se/resolve?urn=urn:nbn:se:smhi:diva-5486 (last access: 22 August 2025), 2019.
Lindström, G., Pers, C., Rosberg, J., Strömqvist, J., and Arheimer, B.: Development and testing of the HYPE (Hydrological Predictions for the Environment) water quality model for different spatial scales, Hydrol. Res., 41, 295–319, https://doi.org/10.2166/nh.2010.007, 2010.
Menberu, M. W., Haghighi, A. T., Ronkanen, A., Marttila, H., and Kløve, B.: Effects of drainage and subsequent restoration on peatland hydrological processes at catchment scale, Water Resour. Res., 54, 4479–4497, https://doi.org/10.1029/2017WR022362, 2018.
Messager, M. L., Lehner, B., Grill, G., Nedeva, I., and Schmitt, O.: Estimating the volume and age of water stored in global lakes using a geo-statistical approach, Nat. Commun., 7, 13603, https://doi.org/10.1038/ncomms13603, 2016.
Nash, J. E. and Sutcliffe, J. V.: River flow forecasting through conceptual models part I – a discussion of principles, J. Hydrol., 10, 282–290, https://doi.org/10.1016/0022-1694(70)90255-6, 1970.
Olsson, J., Amaguchi, H., Alsterhag, E., Dåverhög, M., Adrian, P.-E., and Kawamura, A.: Adaptation to climate change impacts on urban storm water: A case study in Arvika, Sweden, Climatic Change, 116, 231–247, https://doi.org/10.1007/s10584-012-0480-y, 2013.
Piirainen, S., Finér, L., Andersson, E., Armolaitis, K., Belova, O., Čiuldienė, D., Futter, M., Gil, W., Glazko, Z., Hiltunen, T., Högbom, L., Janek, M., Joensuu, S., Jägrud, L., Libiete, Z. ,Lode, E., Löfgren, S., Pierzgalski, E., Sikström, U., Zarins, J., and Thorell, D.: Forest drainage and water protection in the Baltic Sea Region countries – current knowledge, methods and areas for development, WAMBAF project report, https://www.skogsstyrelsen.se/globalassets/projektwebbplatser/wambaf/drainage/reviews/forest-drainage_short_document_imposed_21032017.pdf (last access: 22 August 2025), 2017.
Schützer, S., Elenius, M., Isberg, K., and Temnerud, J.: Nedströmseffekter från återvätning av dikad skog på torv [Downstream effects from rewetting of ditched forest on peat], SMHI, https://urn.kb.se/resolve?urn=urn:nbn:se:smhi:diva-6417 (last access: 22 August 2025), 2023.
SLU: Rewetting of drained forest wetlands: strategies for implementation and adaptation to future climate, https://www.slu.se/en/research/research-catalogue/projekt/aa/Rewetting-of-drained-forest-wetlands/ (last access: 22 August 2025), (updated June 2025) 2025.
SMHI: HYPE version 5.19.0, Sourceforge [code], https://sourceforge.net/projects/hype/files/release_hype_5_19_0/, (last access: 21 August 2025), 2022.
SMHI: HYPE version 5.19.3, Sourceforge [code], https://sourceforge.net/projects/hype/files/release_hype_5_19_3/, (last access: 21 August 2025), 2023.
SMHI: Vattenweb Arkiv, Version ID V-2024-05-21, SMHI [data set], https://vattenwebb.smhi.se/archive/V-2024-05-21/, (last access: 21 August 2025), 2024.
Sörensen, J. and Mobini, S.: Pluvial, urban flood mechanisms and characteristics–assessment based on insurance claims, J. Hydrol., 555, 51–67, https://doi.org/10.1016/j.jhydrol.2017.09.039, 2017.
Stensen, K., Matti, B., Rasmusson, K., and Hjerdt, N.: Modellstudie för att undersöka åtgärder som påverkar lågflöden:–Delrapport 2 i regeringsuppdrag om åtgärder för att motverkavattenbrist i ytvattentäkter [Model study to investigate measures that affect low flows: Partial report 2 in government assignment on measures to counteract water shortage in surface water sources], SMHI, https://urn.kb.se/resolve?urn=urn:nbn:se:smhi:diva-5435 (last access: 22 August 2025), 2019.
Strömqvist, J., Arheimer, B., Dahné, J., Donnelly, C., and Lindström, G.: Water and nutrient predictions in ungauged basins: set-up and evaluation of a model at the national scale, Hydrolog. Sci. J., 57, 229–247, https://doi.org/10.1080/02626667.2011.637497, 2012.
Strömqvist, J., Elenius, M., Lindström, G., Pers, C., and Temnerud, J.: Beräkning av näringsämnestillförsel till ytvatten och retention i sjöar och vattendrag för PLC8-rapportering [Calculated nutrient transport to surface waters and retention in lakes and rivers for PLC8-reporting], SMHI, SMED Rapp. 24, https://www.smed.se/vatten/5472 (last access: 22 August 2025), 2022.
Swedish Agency for Marine and Water Management: Havs- och vattenmyndighetens föreskrifter om klassificering och miljökvalitetsnormer avseende ytvatten [Swedish Agency for Marine and Water Management regulations on classification and environmental quality norms for surface waters], HVMFS 2019:25, https://www.havochvatten.se/vagledning-foreskrifter-och-lagar/foreskrifter/register-vattenforvaltning/klassificering-och-miljokvalitetsnormer-avseende-ytvatten-hvmfs-201925.html (last access: 22 August 2025), 2019.
Swedish Environmental Protection Agency: Nationella marktäckedata 2018 basskikt [National landuse data 2018 base layer], SNV [data set], https://geodata.naturvardsverket.se/nedladdning/marktacke/NMD2018/ (last access: 22 August 2025), 2023.
Swedish Geological Survey: Produkt: Jordarter 1:25 000–1:100 000 [Product: Soil data 1:25 000–1:100 000], SGU [data set], https://resource.sgu.se/dokument/produkter/jordarter-25-100000-beskrivning.pdf (last access: 22 August 2025), 2024.
Vogel, M. M., Zscheischler, J., Wartenburger, R., Dee, D., and Seneviratne, S. I.: Concurrent 2018 hot extremes across Northern Hemisphere due to human-induced climate change, Earths Future, 7, 692–703, https://doi.org/10.1029/2019EF001189, 2019.
Westra, S., Alexander, L. V., and Zwiers, F. W.: Global increasing trends in annual maximum daily precipitation, J. Climate, 26, 3904–3918, https://doi.org/10.1175/JCLI-D-12-00502.1, 2013.
Wilson, L., Wilson, J., Holden, J., Johnstone, I., Armstrong, A., and Morris, M.: Recovery of water tables in Welsh blanket bog after drain blocking: discharge rates, time scales and the influence of local conditions, J. Hydrol., 391, 377–386, https://doi.org/10.1016/j.jhydrol.2010.07.042, 2010.
Wu, J. and Malmström, M. E.: Nutrient loadings from urban catchments under climate change scenarios: Case studies in Stockholm, Sweden, Sci. Total Environ., 518, 393–406, https://doi.org/10.1016/j.scitotenv.2015.02.041, 2015.
- Abstract
- Introduction
- Methods and data
- Results and discussion
- Implications for policymakers
- Conclusions
- Appendix A: HYPE model overview
- Appendix B: Calibration method and model uncertainty
- Data availability
- Author contributions
- Competing interests
- Disclaimer
- Acknowledgements
- Financial support
- Review statement
- References