the Creative Commons Attribution 4.0 License.
the Creative Commons Attribution 4.0 License.
Combined impacts of climate change and human activities on blue and green water resources in a high-intensity development watershed
Xuejin Tan
Bingjun Liu
Zeqin Huang
Jianyu Fu
Sustainable management of blue and green water resources is vital for the stability and sustainability of watershed ecosystems. Although there has been extensive attention paid to blue water (BW), which is closely related to human beings, the relevance of green water (GW) to ecosystem security is typically disregarded in water resource evaluations. Specifically, comprehensive studies are scarce on the detection and attribution of variations of blue and green water in the Dongjiang River basin (DRB), an important source of regional water supply in the Guangdong–Hong Kong–Macao Greater Bay Area (GBA) of China. Here we assess the variations of BW and GW scarcity and quantify the impacts of climate change and land use change on BW and GW in DRB using the multi-water-flux calibrated Soil and Water Assessment Tool (SWAT). Results show that BW and green water storage (GWS) in DRB increased slowly at rates of 0.14 and 0.015 mm a−1, respectively, while green water flow (GWF) decreased significantly at a rate of −0.21 mm a−1. The degree of BW and GW scarcity in DRB is low, and the per capita water resources in more than 80 % of DRB exceed 1700 m3 per capita per year. Attribution results show that 88.0 %, 88.5 %, and 39.4 % of changes in BW, GWF, and GWS result from climate change. Both climate change and land use change have decreased BW, while climate change (land use change) has decreased (increased) GWF in DRB. These findings can guide the optimization of the allocation of blue and green water resources between upper and lower reach areas in DRB and further improve the understanding of blue and green water evolution patterns in humid regions.
- Article
(7743 KB) - Full-text XML
-
Supplement
(1273 KB) - BibTeX
- EndNote
Land use and land cover change (LUCC) and climate variability may alter hydrological processes in watersheds (Berezovskaya et al., 2004; Chagas et al., 2022; Konapala et al., 2020; Tan et al., 2022a), which successively affect variations of regional water resources (Hoek van Dijke et al., 2022; Pokhrel et al., 2021; Stocker et al., 2023; Suzuki et al., 2021), potentially leading to ecosystem degradation and severe water shortage crises (Aghakhani Afshar et al., 2018; Zuo et al., 2015). With the development of society and the economy, there is an increasing need for water resources to accommodate human water utilization, encompassing agricultural, domestic, and industrial water usage. Water scarcity and spatiotemporal mismatch between regional water supply and demand in certain regions are becoming increasingly severe, significantly affecting sustainable development in these regions (Cook et al., 2014). Quantifying water resources in a changing environment is crucial for guiding efficient and sustainable water use.
Previous studies on water resource assessment explored the effects of climate change and anthropogenic factors on available water resources, including streamflow (Ahiablame et al., 2017; Tan et al., 2023), baseflow (Ficklin et al., 2016; Tan et al., 2020), lake water (Acero Triana and Ajami, 2022; Tao et al., 2020), and groundwater (Han et al., 2020). Falkenmark and Rockström (2006) introduced a novel perspective on water resource assessment by categorizing water resources as blue water (BW) or green water (GW). BW is the total of deep aquifer recharge and river streamflow, such as water in lakes and rivers. Water users such as industries, agriculture, and municipal users can directly utilize BW. By contrast, GW is the portion of precipitation that is not drained to the river for streamflow generation. GW is temporarily retained in the soil before eventually being released back into the air by evapotranspiration (ET). GW encompasses both green water flow (GWF) and green water storage (GWS) (Veettil and Mishra, 2018; Zang and Liu, 2013). Traditional water resource assessments concentrate on available water resources and only consider BW while neglecting GW (Dai et al., 2022), although GW is also essential. GW supplies about 80 % of the total water resources, sustaining crop growth and the sustainable development of forest and grassland ecosystems in arid regions or during dry seasons (Li et al., 2018; Schuol et al., 2008). Green water scarcity can lead to ecosystem degradation and intensify competition between human needs and ecosystems for water resources (Falkenmark et al., 2003; Veettil and Mishra, 2018). Compared to traditional streamflow assessment methods, water resource scarcity assessment methods based on the framework of BW and GW are more appropriate for maintaining sustainable water resource management (Cooper et al., 2022; Liu et al., 2017). Recently, some studies characterized water scarcity by assessing variations of BW and GW. For example, Veettil and Mishra (2020) assessed blue water scarcity and green water scarcity to show the water security status of counties in the United States. Hoekstra et al. (2012) used the concept of the BW footprint to study water scarcity issues. Schyns et al. (2019) used the GW footprint to investigate green water scarcity and found that the increasingly severe shortage of GW poses a significant threat to natural ecosystems.
The impacts of climate change and human activities on the hydrological cycle processes in watersheds have attracted widespread attention (Ahiablame et al., 2017; Chouchane et al., 2020; Cooper et al., 2022; Tan et al., 2022b; Veettil and Mishra, 2016). Changes in land use alter the underlying surface conditions. For example, afforestation or deforestation may exacerbate or alleviate global or regional climate change and thus affect hydrological cycle processes (Bai et al., 2020; Lian et al., 2020; Qiu et al., 2023). Changes in land use often lead to alterations in land–atmosphere interactions, and vegetation cover changes are essential for regulating climate systems and land ecosystems (Foley et al., 2005; Huang et al., 2020). Large-scale greening could modify geophysical interactions between the atmosphere and the ground, impacting larger or local regional hydrological cycles. Land degradation (Walters and Babbar-Sebens, 2016), deforestation (Lee et al., 2011), and urbanization (Mohan and Kandya, 2015; Zhang et al., 2018) also have far-reaching effects on the climate and hydrological cycle.
Climate change is also crucial to the variations in BW and GW resources. Precipitation is the source of BW and GW, and factors such as temperature, solar radiation, and potential evapotranspiration significantly influence the changes in BW and GW in watersheds, especially in GWF (Pandey et al., 2019; Schewe et al., 2014). For a single watershed, BW depends directly on precipitation and evapotranspiration (GWF) (Shen et al., 2017; Vano et al., 2012). Furthermore, precipitation intensity can have a significant impact on the redistribution of precipitation, BW, and GW by altering infiltration and runoff generation processes (Eekhout et al., 2018; Nearing et al., 2005). Therefore, it is crucial to quantify the effects of climate change and LUCC on BW and GW resources in a watershed for effective water resource planning and management.
Water resource management is the primary issue to be addressed for water security. Hydrological models are important tools for meeting various needs in water resource management. Hydrological model simulation is an effective method for evaluating changes in blue and green water resources. As a widely used semi-distributed parametric hydrological model, the SWAT (Soil and Water Assessment Tool) model is increasingly being used in water resource management at the watershed scale. Based on the SWAT model, researchers simulated the spatiotemporal changes in blue and green water resources in Iran (Ahiablame et al., 2017), the Yangtze River basin (Nie et al., 2023), the Poyang Lake basin (Liu et al., 2023), and India (Sharma et al., 2023). Some studies have also used model simulations to analyze the effects of climate change and human activities on water resource changes in the Meki River basin (Hordofa et al., 2023), China (Liu et al., 2022), and Ningxia (Ahiablame et al., 2017). However, most of the hydrological models used in the study were calibrated and validated using only observed streamflow data without checking the accuracy of other simulated water variables, which can lead to uncertainties in modeling soil moisture and evapotranspiration (Nie et al., 2023).
The Dongjiang River basin (DRB) is a crucial water source region for core cities in the Greater Bay Area (GBA), such as Shenzhen, Hong Kong, and Huizhou. Given the significant BW demand from agriculture, domestic utilization, and industry as well as the GW demand from over 18 000 km2 of forested land, the water resource stress in DRB is extremely high, although DRB is located in wet South China (Liu et al., 2018). The growing mismatch between increasing water demand and decreasing water supply, along with seasonal and pollution-induced water scarcity issues, is becoming increasingly prominent (Yang et al., 2018). However, the majority of current studies on water resources of DRB focus on changes and scarcity of surface water and groundwater (BW) while overlooking the critical role and spatiotemporal variations of GW (Huang et al., 2022; Jiang et al., 2023; Wu et al., 2021). With the high-intensity urbanization and climate change in DRB, changes in BW and GW resources in DRB remain unknown.
This study aims to analyze the influence of climate change and LUCC on BW and GW in DRB. The objectives of this study are (a) to build the SWAT model for DRB hydrological simulation, (b) to quantitatively evaluate the spatial and temporal variation of BW and GW in DRB, (c) to assess the status of water scarcity in DRB using the framework of BW and GW resources, and (d) to estimate the effects of climate change and LUCC on BW and GW in DRB.
2.1 Study area
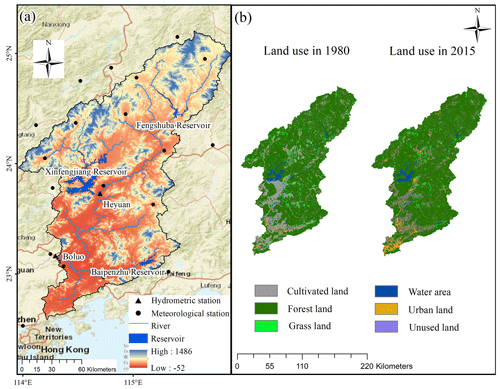
The Dongjiang River is an important tributary of the Pearl River, located between longitude 113°25′–115°52′ E and latitude 22°26′–25°12′ N. It originates in Xunwu County, Jiangxi Province, flows through Jiangxi and Guangdong provinces, and goes across major cities, including Longchuan, Heyuan, Dongguan, and Shenzhen. The trunk stream of the Dongjiang River has a total length of 562 km. DRB covers a watershed area of 3.5×10⁴ km2. DRB is in the subtropical monsoon climate zone with adequate precipitation and high temperatures. The average annual precipitation ranges from 1500 to 2400 mm, and the average temperature of the basin is 21°C (Wu et al., 2019a). The altitude of the basin decreases from the northeast to the southwest. Regions of the upper reaches of DRB are dominated by mountains and hills, those of the middle reaches of DRB are dominated by hills and plains, and those of the lower reaches of DRB are dominated by plains.
Previous hydrological simulation studies of DRB mainly used the Boluo hydrometric station as the outlet of the watershed (He et al., 2013; Wu et al., 2019a), so this study only analyzes the area of DRB where water flows to the Boluo station (Fig. 1). The Boluo hydrometric station is the main control station in the lower reaches of the Dongjiang River. The Boluo hydrometric station occupies a drainage area of 25 325 km2, which is 71.7 % of the total area of DRB. Since the 1950s, more than 896 reservoirs, ponds, dams, and other water conservancy facilities have been constructed in DRB. Among them, the Baipenzhu Reservoir, Fengshuiba Reservoir, and Xinfengjiang Reservoir are the three largest reservoirs in the basin, with a cumulative storage capacity of 17 048×106 m3. The Dongjiang–Shenzhen Water Supply Project constructed in 1964 diverts water from the Dongjiang River to Shenzhen and Hong Kong to provide freshwater resources for municipal use. Over 70 % of Hong Kong's freshwater supply comes from the Dongjiang River. Therefore, it is crucial to comprehend the shifts in water resources within DRB for projecting future available water resources for the development of GBA.
2.2 Methodology
2.2.1 SWAT model
The SWAT model was adopted to simulate hydrological processes and estimate the amount of BW and GW for DRB (Arnold et al., 1998; Neitsch et al., 2002). The SWAT model is widely applied to simulate streamflow and surface runoff (Arshad et al., 2022; Martínez-Salvador and Conesa-García, 2020; Nie et al., 2023). The SWAT model is also widely utilized for exploring changes in BW and GW (Dai et al., 2022; Liang et al., 2018; Schuol et al., 2008).
In SWAT modeling, DRB was divided into 63 subbasins (Fig. S1 in the Supplement), and each subbasin was then categorized into hydrological response units (HRUs) depending on land use, soils, and slope. The Soil Conservation Service (SCS) curve number method was used for flow partitioning according to land use, soil type and antecedent soil moisture. The Penman–Monteith method was used to calculate potential evapotranspiration, which comprehensively considered various climatic factors such as solar radiation, air temperature, wind speed, and relative humidity (Arnold et al., 1998; Neitsch et al., 2002).
2.2.2 Model calibration and validation
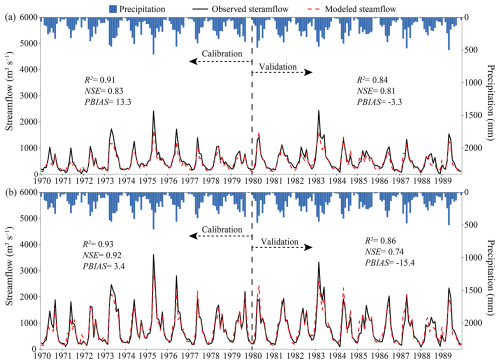
To reduce the influence of hydraulic engineering, the SWAT model was calibrated and validated by utilizing monthly restored natural streamflow at the Boluo and Heyuan hydrometric stations. The optimum model parameters are shown in Table 1. All the selected parameters are automatically calibrated with 500 simulations via SWAT-CUP. The warmup period for model simulations is the first 2 years of the simulation period. Reconstructed natural streamflow in 1970–1979 was used to calibrate the model, and monthly time series of reconstructed natural streamflow, ET from Global Land Evaporation Amsterdam Model (GLEAM) and soil moisture data from ERA5 during 1980–1989 were used to validate the model. The calibration period for this study was 1970–1979, and the validation period was 1980–1989. Three metrics, i.e., the determination coefficient (R2), the percentage bias (PBIAS), and Nash–Sutcliffe efficiency (NSE), were applied to evaluate the simulation performance of the SWAT model:
where Qnat, Qave, Qsim, and are monthly natural streamflow, mean monthly natural streamflow, simulated streamflow, and mean monthly simulated streamflow, respectively. n is the total number of time steps.
Table 1Range of the main parameters and their optimal values obtained from the model calibration.
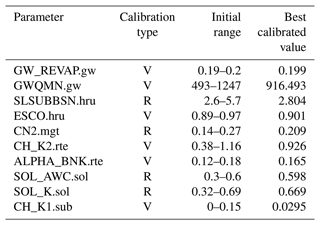
Note: the symbols V and R denote a replacement and a relative change to the default parameter value.
This study reconstructed the natural monthly streamflow series of the basin by combining the inflow and outflow of the three major reservoirs (Xinfengjiang Reservoir, Fengshuba Reservoir, and Baipenzhu Reservoir) in DRB, based on the watershed water balance (Tu et al., 2018):
where ΔQ is the total reduced water volume and Qo, Qin, and Qout are the observed streamflow, reservoir inflow, and reservoir outflow, respectively.
2.3 Calculation of blue and green water and water security indicators
2.3.1 Calculation of blue and green water
BW is calculated from the sum of water yield (SWAT output WYLD) and groundwater storage. The former refers to the amount of water that leaves the HRU and enters the channel. The latter represents the net amount of water recharged to aquifers (SWAT output GW_RCHG) and the amount of aquifer water discharged to the main channel (SWAT output GW_W) during a time step (Hordofa et al., 2023). GW can be divided into two components, i.e., GWF, which is the actual evapotranspiration (SWAT output ET) from the HRU, and GWS, which is the soil water moisture (SWAT output SW) (Nie et al., 2023; Veettil and Mishra, 2018). The calculation of the Green Water Index (GWI) involves dividing the quantity of GW by the sum of BW and GW (Ding et al., 2024).
2.3.2 Blue and green water scarcity
Blue water scarcity (BWSC) is determined by the quotient of BW withdrawal and availability. The estimation of BW withdrawals (BWWs) in this study involved the multiplication of the aggregate population in each subbasin by the combined water consumption per person (Liang et al., 2020). The population of each subbasin was extracted from the population raster data. Blue water availability (BWA) represents the quantity of water that can be utilized without negatively impacting the river ecosystems. Exhaustive exploitation of BW in rivers may adversely impact river ecosystems. Previous studies have generally used environmental flow requirements (EFRs) as a suitable metric for sustaining robust ecosystems (Honrado et al., 2013). According to the studies of Richter (2010) and Richter et al. (2012), extracting more than 20 % of the water from rivers may result in ecological degradation. Therefore, 20 % of streamflow can be deemed BW and used for water supply (Veettil and Mishra, 2016). The calculations of EFR, BWA, and BWSC are as follows:
where EFR(a,t) is the EFR for subbasin “a” during time “t”; Qmean is the long-term monthly average streamflow.
Green water scarcity (GWSC) is defined as the ratio between green water footprint (GWFO) and green water availability (GWA). GWFO denotes the actual evapotranspiration from the watershed. GWA is the soil moisture that is available for evapotranspiration and vegetation transpiration and is equal to the initial soil moisture (Liang et al., 2020). GWSC can be formulated as
where GWSC is the green water scarcity, GWFO(x,t) is the actual evapotranspiration, and GWA(a,t) is the initial soil moisture.
Based on the blue water scarcity and green water scarcity, the water scarcity of a region is categorized as mild scarcity, moderate scarcity, severe scarcity, and extreme scarcity, with thresholds set at 100 %, 150 %, and 200 %, respectively.
2.3.3 Regional water stress
The Falkenmark index (FLK) (Falkenmark et al., 1989) is a widely used measure of water stress, defined as the proportion of BWA to the overall population. The Falkenmark index is classified as no stress, stress, scarcity, and absolute scarcity based on per capita water use. Absolute scarcity is regarded as occurring in areas where the indicator threshold is lower than 500 m3 per capita per year, and no stress is thought to occur in areas where the threshold is higher than 1700 m3 per capita per year.
2.4 Calculation of relative contributions
2.4.1 Scenario design and simulation
Three scenarios were constructed to assess the impacts of climate change and LUCC on BW and GW by changing climate conditions (land use) while keeping land use (climate conditions) for the three scenario simulations (Table 2). The land use map was fixed when simulating the influences of climate change on blue and green water (S2–S1), while climate conditions were fixed when simulating the influences of LUCC on blue and green water (S3–S2). The climate conditions and the land use were altered when assessing the joint influences of climate change and LUCC on blue and green water (S3–S1).
2.4.2 Relative contribution rate calculation
The influences of climate change and LUCC on the changes in blue and green water in different periods are evaluated utilizing the relative contribution (RC) in this study (Li et al., 2021).
The climate change contribution to BW and GW change is estimated by
where X1, X2, and X3 are the amounts of water including BW, GWF, and GWS, respectively, for scenarios S1, S2, and S3.
The contributions of LUCC to changes in BW and GW are estimated by Eq. (11).
2.5 Data
The dataset used in this study consists of three parts: (1) hydrometeorological data; (2) geospatial data encompassing DEMs, soil types, and land uses; and (3) socioeconomic data encompassing per capita water consumption and population data.
Observed monthly streamflow data of the two hydrological stations in the study were collected for the years 1970–2000 from the Boluo station and Heyuan station, and the observed streamflow time series of these two hydrological stations have no missing data. Monthly inflow and outflow data of the three major reservoirs in DRB were also collected. All the hydrological data were obtained from the Guangdong Provincial Hydrological Bureau. Meteorological daily precipitation, temperature, and other data for 1968–2017 from 21 meteorological stations in the watershed were obtained from the National Meteorological Information Center of the China Meteorological Administration. Monthly actual ET data for SWAT model validation were obtained from the Amsterdam Evapotranspiration Model dataset with a spatial resolution of 0.25°×0.25° (Martens et al., 2017). Monthly soil moisture data for SWAT model validation were obtained from the European Centre for Medium-Range Weather Forecasts ERA5-Land dataset with a spatial resolution of 0.1°×0.1° (Hersbach et al., 2023). The actual evapotranspiration and soil moisture of the watershed equal the average of all grids included in DRB.
The 90 m resolution DEM data and 30 m resolution land use data at 10-year intervals (i.e., 1980, 1990, 2000, 2010, and 2015) are obtained from the Resource and Environment Science and Data Platform of the Chinese Academy of Sciences (Xu et al., 2018). Soil data are obtained from the 1 km resolution Harmonized World Soil Database from the Food and Agriculture Organization of the United Nations (Fischer et al., 2008).
The annual per capita integrated water consumption data of DRB from 2000 to 2017 were acquired from the Water Resources Bulletin of Guangdong Province. The population data in 2000, 2005, 2010, and 2015 were obtained from the 1×1 km spatial raster data of the Resource and Environment Science and Data Center of the Chinese Academy of Sciences (Xu, 2017b).
3.1 Model performance
3.1.1 Streamflow reconstruction
The difference between the monthly average observed streamflow and the monthly average natural streamflow is small (Fig. 2). The monthly average measured streamflow and natural streamflow at the Heyuan station are 492.1 and 507.9 m3 s−1, respectively, while the monthly average measured streamflow and natural streamflow at the Boluo station are 768.4 and 796.7 m3 s−1, respectively. The difference between the measured streamflow and the natural streamflow mainly occurs in November, December, January, and February (when the measured streamflow is greater than the natural streamflow) and in May, June, and July (when the measured streamflow is less than the natural streamflow) (Fig. 2a and c).
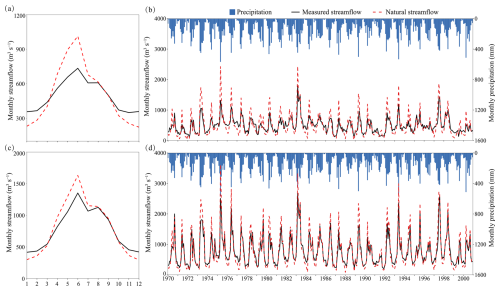
Figure 2Observed streamflow and natural streamflow processes at the Heyuan and Boluo stations from 1970 to 2000. (a) Annual distribution of streamflow at the Heyuan station, (b) streamflow process at the Heyuan station, (c) annual distribution of streamflow at the Boluo station, and (d) streamflow process at the Boluo station.
3.1.2 Model calibration and verification
The SWAT model shows sufficient accuracies in simulating streamflow, actual evapotranspiration, and soil moisture changes in DRB and can better simulate both seasonal and interannual changes in streamflow. During the calibration period, both stations achieved R2 above 0.9, a NSE exceeding 0.8, and a PBIAS of less than 14 % (Fig. 3). Both stations had a simulated streamflow R2 of greater than 0.8 during the validation period. The NSE values for streamflow simulation at the Heyuan station and Boluo station of the validation were 0.81 and 0.74, respectively. The model performs well in simulating the ET and soil moisture. Since the GLEAM ET data and ERA5 soil moisture data are raster data with a spatial resolution of 0.25×0.25°, considering the influence of data accuracy on the results, this study uses the watershed scale to validate the simulation results of ET and soil moisture. In the validation period, the R2 and NSE for the simulation of evapotranspiration were 0.92 and 0.8, respectively (Fig. S2), while the R2 and the NSE for the soil moisture simulation were both greater than 0.6. These validation results show that the model can be used to simulate hydrological regimes in DRB.
3.2 LUCC and climate variability in DRB
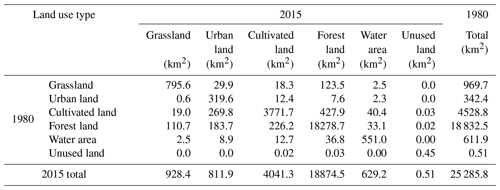
The LUCC in DRB is mainly the decrease in cultivated land and the increase in urban land. The land use in DRB primarily consisted of forest land (18 875–18 833 km2), which forms more than 70 % of DRB. From 1980 to 2015, the urban land and water areas showed increases of 469.4 km2 (137 %) and 17.4 km2 (2.8 %), while the grassland, cultivated land, and forest land showed decreases of 41.3 km2 (4.3 %), 487.5 km2 (10.8 %), and 42.1 km2 (0.2 %), respectively (Table 3).
DRB exhibited significant regional differences in multiyear average precipitation, temperature, and potential evapotranspiration. The precipitation exhibited an increasing trend from the center to the south and north of DRB. The temperature and potential evapotranspiration showed an overall distribution pattern of greater values in the south and minor values in the north of DRB (Fig. 4). The multiyear average precipitation for the entire DRB was 1790.1 mm, with annual precipitation ranging from 1236.2 to 2567.5 mm. The regions with the highest multiyear average annual precipitation are located in the southeast of DRB, where annual precipitation exceeds 2200 mm, while the regions with the lowest precipitation are in the northeast of the watershed. The average annual temperature in DRB ranged from 19.5 to 21.3 °C, and the average annual potential evapotranspiration ranged from 1101.5 to 1320.6 mm. The south of DRB is predominantly urban and characterized by the urban heat island effect, while the north of DRB is mountainous with higher elevations, leading to the spatial distribution of temperatures.
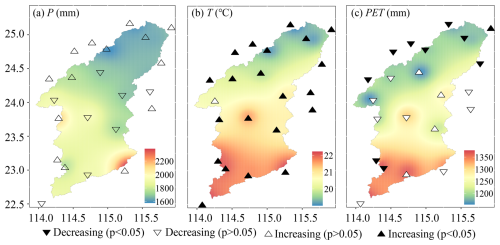
Figure 4Spatial distribution of the annual mean (a) precipitation, (b) temperature, and (c) potential evapotranspiration in DRB from 1960 to 2017. Each triangle represents the Mann–Kendall test result at a meteorological station.
The average temperature and potential evapotranspiration at DRB meteorological stations exhibited significant variations, while precipitation showed a relatively minor trend (Fig. 4). Overall, basin-averaged precipitation and potential evapotranspiration showed a nonsignificant decreasing trend, while temperatures showed a significant increasing trend. There was no significant change trend of precipitation for all stations in DRB (Fig. 4a). Twenty out of 21 meteorological stations in the region showed statistically significant increasing trends in average temperature, indicating a warming trend (Fig. 4b). Nine stations showed a significant decreasing trend in potential evapotranspiration that was primarily located in northern DRB (Fig. 4c).
The mean precipitation, temperature, and potential evapotranspiration of DRB can be obtained from the precipitation, temperature, and potential evapotranspiration of stations using the Tyson polygon method. The interannual variation of annual precipitation in DRB showed an insignificant decreasing trend (−0.51 mm a−1). The annual mean temperature showed a significant increasing trend (0.024 °C a−1). The annual potential evapotranspiration showed a significant decreasing trend (−0.38 mm a−1) (Fig. S3).
3.3 Blue and green water resources
The average annual BW and GW were 1240.8 and 840.7 mm, respectively. The DRB water resources were dominated by BW, representing 60.1 % of the total water resources, and BW was 1.48 times higher than that of GW resources. The average GWF and GWS were 689.3 and 151.4 mm, respectively.
The annual BW resources in the subbasins of DRB ranged from 893.7 to 1990 mm, showing an increasing trend from the center to the south and north of DRB, aligning with the spatial distribution of precipitation (Fig. 5a). The regions with abundant BW resources are located in the central and southeastern parts of DRB (>1300 mm), and the BW in the upper reaches is comparatively low (<1100 mm). Differences in the spatial distribution of BW are primarily caused by differences in the spatial distribution of precipitation. Overall, the GWF and GWS are more evenly distributed in the subbasins than BW. The annual GWF in the subbasins of DRB ranged from 573.6 to 923.6 mm. The subbasins with higher GWF are primarily located in the Xinfengjiang Reservoir area in the middle reaches (>700 mm), while the low GWF subbasins are located in the southwest of DRB (<600 mm) (Fig. 5b). The land use in the subbasins where the Xinfengjiang Reservoir is located is primarily water areas, with a higher water evaporation rate than other regions, resulting in a greater GWF in this area than in the other regions. The annual GWS in the subbasins of DRB ranged from 126 to 190.6 mm. The subbasins with higher GWS are mainly located in the lower part of DRB (>150 mm) (Fig. 5c). The distribution pattern of GWS resources has a close relationship with the soil type of the watershed. The upper reaches and the northwestern part of the watershed are mostly red soil, while the middle and lower reaches are dominated by reddish soil. Reddish soil has a smaller water storage capacity than red soil, loses water faster, and has weaker water conservation and water supply performance than red soil. This is the primary factor in the north–south discrepancies in the number of GWS resources in DRB. In addition, the southern region mostly has large- and medium-sized cities. As urban construction land expands, the land use type in the region gradually changes to urban land and industrial land and the solidification of road surfaces reduces the area of bare soil in the region, resulting in a decrease in GWS resources. The annual GWI (Fig. 5d) showed a spatial pattern opposite to BW, decreasing from 0.45 in the upper reaches to 0.3 in the lower reaches. The highest GWI is found in the upper reaches, which is due to the relatively low rainfall in the upper reaches and the lush vegetation with significant plant interception and transpiration, resulting in a higher proportion of total evapotranspiration than in the middle and lower reaches. The central part of the basin has the highest precipitation, leading to a lower GWI. The southern part of the watershed has the highest temperature, and the evapotranspiration is high. Meanwhile, the lower reaches have a large proportion of agricultural and urban land, and crop irrigation can increase evapotranspiration.
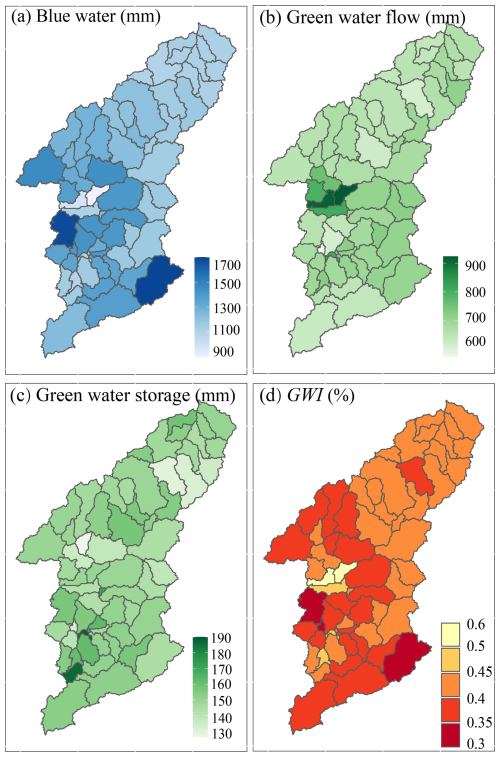
Figure 5Spatial distribution of the mean (a) BW, (b) GWF, (c) GWS, and (d) GWI in DRB over 1970–2017.
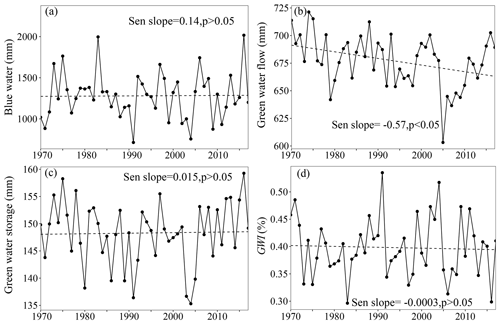
In DRB, there was no significant increasing trend in either BW or GWS, while GWF exhibited a significant decreasing trend. The annual trend rate of BW in DRB was 0.14 mm a−1, with an annual fluctuation range of 713.6–2017.5 mm during 1970–2017. The minimum BW occurred in 1991, while the maximum BW was recorded in 2016 (Fig. 6a). The GWF in DRB from 1970 to 2017 exhibited a significant decreasing trend (−0.57 mm a−1) (Fig. 6b). The minimum GWF occurred in 2005 (603.1 mm), while the maximum GWF was recorded in 1974 (721.3 mm). In contrast, the GWS in DRB from 1970 to 2017 has been slowly increasing at a rate of 0.015 mm a−1 (Fig. 6c). The annual fluctuation in GWS was smaller than BW and GWF. The GWI in DRB from 1970 to 2017 showed no significant decreasing trend at a rate of −0.0003 % a−1 (p>0.05) (Fig. 6d), implying that the redistribution of precipitation in DRB might change slowly.
3.4 Blue and green water scarcity
The average blue water scarcity level in DRB was low (22.4 %) during 1970–2017. The blue water scarcity levels in various subbasins ranged from 0.1 % to 206 %. The multiyear average blue water scarcities, except for one subbasin in the southwest, were all low (<100 %) (Fig. 7a). This indicates that blue water scarcity is not common in DRB at the annual scale. Regions with relatively high blue water scarcity (>20 %) are mostly situated in the upper reaches of various tributaries within the watershed, where river streamflow is relatively low. The area with the highest blue water scarcity (206 %) is located in the 63rd subbasin of Shenzhen and Huizhou, reaching a moderate level of blue water scarcity. This region has a large population, with a much higher blue water demand than other areas. Additionally, this subbasin is situated in the upper reaches of the primary tributary of DRB, resulting in a limited supply of BW resources. Although the northern parts of subbasins 55, 56, and 61 have large populations, these subbasins are situated downstream of the main Dongjiang River with a higher streamflow, leading to lower BWSC levels. The average GWSC in the entire basin from 1970 to 2017 was low (41.4 %). The blue water scarcity levels in the various subbasins ranged from 31 % to 104 %. The vegetation cover in DRB is high, and DRB thus has relatively high rates of vegetation transpiration and interception evaporation. The basin experiences a GWSC of nearly 50 %, indicating a potential occurrence of GWSC. The areas with higher GWSC are primarily situated in the middle reaches for DRB (Fig. 7b), where water surface evaporation is high, resulting in their GWSC exceeding 100 %. The evaporated water in these areas originates from the reservoirs, not the soil, leading to an overestimation of the GWSC in these subbasins.
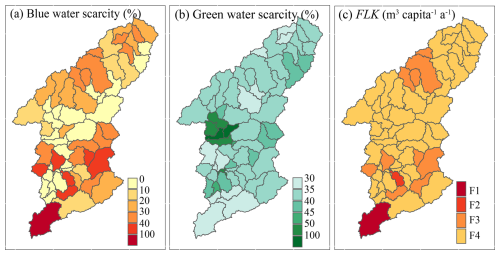
Figure 7Spatial distribution of the mean (a) BWSC, (b) GWSC, and (c) FLK index in DRB over 1970–2017.
Furthermore, the FLK index was used to quantify population-driven water resource scarcity. F1–F4 represent absolute scarcity, scarcity, stress, and no stress, respectively. The results showed that most regions in DRB have no water scarcity pressure (Fig. 7c). However, the 63rd subbasin experienced absolute water scarcity and the 52nd subbasin experienced water scarcity. There were six lower-reach subbasins and four upper-reach subbasins facing water stress. DRB receives ample precipitation, resulting in a relatively large river flow and generally leading to a higher FLK index. As a result, the basin faces lower water resource pressure.
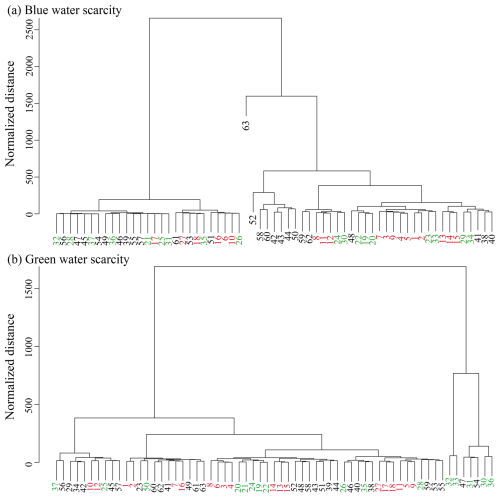
This study also further identified hotspots of BWSC and GWSC in DRB using hierarchical clustering of BWSC and GWSC in each subbasin. Figure 8 shows the clustering tree results for BWSC and GWSC. When the standardized distance was set to 500, all the subbasins could be divided into four categories according to blue water scarcity: (1) the first category consisted of 27 subbasins, such as 32, 56, and 28, where the blue water scarcity level was lowest (<20 %). (2) The second category comprised subbasin 63, which has the most severe blue water scarcity (206 %). (3) The third category comprised seven subbasins, such as 52, 58, and 60, all located in the lower reaches, with relatively high blue water scarcity levels (40 %–100 %). These subbasins are mostly located in the tributaries of the lower reaches, with a relatively large population and smaller river streamflow compared to the mainstem of the Dongjiang River. (4) The fourth category consisted of 28 subbasins, such as 59, 62, and 8, with blue water scarcity levels ranging from 20 % to 40 %. Similarly, hierarchical clustering was conducted for GWSC. When the standardized distance was set to 500, GWSC in the subbasins could be divided into three categories: (1) the first category consisted of 56 subbasins, such as 37, 56, and 29, with relatively low GWSC levels, all below 50 %, indicating low GWSC. (2) The second category consisted of subbasins 32 and 33, where the predominant land use type was water areas, leading to higher GWSC due to high water surface evaporation. (3) The third category consisted of subbasins 47, 31, 54, 30, and 36, where the water area proportion in these subbasins was larger than in the others, leading to significant influences from water surface evaporation. Figure S4 shows the annual variation of blue water scarcity and green water scarcity in the basin. Except for some subbasins, the blue and green water scarcity in most of them is less than 50 %. The degree of green water scarcity is higher than that of blue water scarcity in most of the subbasins. Only subbasin 63 downstream experienced a severe blue water scarcity.
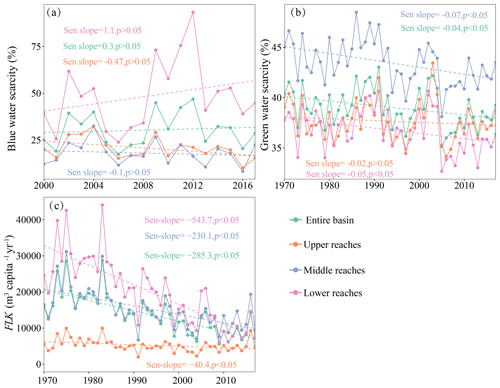
The interannual variations in BWSC and GWSC in DRB showed distinct regional differences. The BWSC in the basin slowly increased at a rate of 0.3 % a−1 (Fig. 9a). The BWSC in the lower reaches slowly increased at a rate of 1.1 % a−1, while the BWSC in the upper and middle reaches slowly decreased at −0.47 % a−1 and −0.1 % a−1, respectively. The GWSC in the upper, middle, and lower reaches of DRB showed a decreasing trend, with the basin-scale GWSC decreasing significantly at a rate of −0.04 % a−1 (Fig. 9b). Despite the acceleration of urbanization and a significant increase in population in the middle and lower reaches of the watershed, blue water availability and the amount of obtainable BW have been increasing. Additionally, the annual per capita water consumption in the basin has decreased from 481.0 m3 in 2000 to 245.0 m3 in 2020. As a result, the rate of increase in BWSC in the watershed has been relatively small. In contrast, the GWF in DRB demonstrated a significant decreasing trend, and the GWS increased slowly. Therefore, the GWSC in DRB demonstrated a significant decreasing trend. Meanwhile, the FLK index of the watershed showed a significant decreasing trend (−285.3 m3 yr−1), which means that the per capita water resources in the watershed have significantly decreased (Fig. 9c). This is due to the rapid population growth in the watershed and the slow increase in available water resources.
3.5 Impacts of LUCC and climate change on blue and green water
To examine the impacts of climate change and LUCC on BW and GW change, this study set three climate conditions and land use scenarios to explore this effect by comparing the scenarios (Table 3). The combined impacts of climate change and LUCC on BW and GWS in DRB were superimposed, and the combined effect on GWF was a negatively synergistic effect. Figure 10 shows the variations in BW and GW under the impacts of climate change (S2–S1) and LUCC (S3–S2), their combined effects (S3–S1), and the relative contributions of climate change and LUCC to the BW and GW changes in DRB during 1970–2017. Under the joint influences of climate change and LUCC, BW decreased by 4.5 mm a−1. Of this decrease, climate change resulted in a loss in BW of 3.9 mm a−1, contributing 88.0 %, while LUCC led to a loss in BW of 0.5 mm a−1, contributing 12.0 % (Fig. 10a). The effect of climate change on BW variation is much greater than that of LUCC at the basin scale. Under the combined influences of climate change and LUCC, GWF decreased by 17.0 mm a−1. Of this decrease, climate change accounted for a decrease in GWF of 19.5 mm a−1, contributing 88.5 % to the decrease, while LUCC led to an increase in GWF of 2.5 mm a−1, contributing 11.5 % (Fig. 10b). Overall, the influence of climate change on GWF changes in the watershed is significantly more pronounced than that of LUCC. Under the joint influences of climate change and LUCC, GWS increased by 0.7 mm a−1. Of this increase, climate change contributed to an increase in GWS of 0.3 mm a−1, accounting for 39.4 %, while LUCC contributed to an increase in GWS of 0.4 mm a−1, accounting for 60.6 % (Fig. 10c). DRB is situated in a humid region with high GWS, resulting in small fluctuations of GWS in response to precipitation changes. The fluctuations of GWS are primarily influenced by soil properties and land use. In general, the effect of climate change on the GWS change in DRB is smaller than the effect of LUCC.
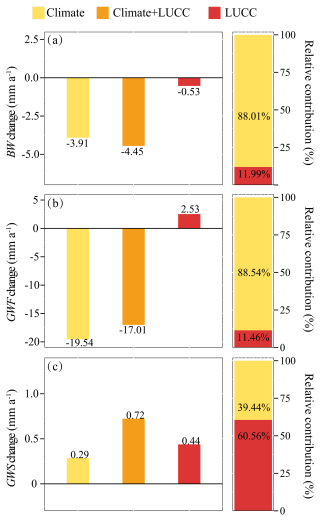
Figure 10Effects and relative contribution of climate change and LUCC to the changes in (a) BW, (b) GWF, and (c) GWS in DRB during 1970–2017.
Under the coupled influences of climate change and LUCC, the BW and GW resources in DRB have changed. However, there were differences in the joint impacts of climate change and LUCC on BW and GW. Both climate change and LUCC have led to the decrease in BW in the watershed, and the combined effect of climate change and LUCC on BW equals the sum of their individual effects. Climate change, such as a decrease in potential evapotranspiration, has resulted in a decrease in GWF in DRB, while LUCC has led to an increase in GWF. Therefore, the joint impacts of climate change and LUCC on GWF were partially offset, resulting in the joint impacts of climate change and LUCC on GWF being less than the sum of their absolute individual effects. Both climate change and LUCC have led to an increase in GWS in DRB, and the joint impacts of climate change and LUCC on GWS equal the sum of their individual effects.
This study used the SWAT model to simulate changes in BW and GW resources in DRB over the past 5 decades and their responses to climate change and LUCC. It also assessed water resource security in the basin. The findings revealed that GWF exhibited a decreasing trend and that BW and GWS exhibited an increasing trend. Liu et al. (2010) similarly found an increasing trend in annual surface runoff in DRB. Potential evapotranspiration in DRB showed a decreasing trend, which may be the main cause of the significant decrease in GWF in the basin (Fig. S3), and similar conclusions are drawn in He et al. (2013).
We show that water resources in DRB are dominated by BW with a mean annual GWI of 0.4, which is the same as what many studies show in humid areas (Nie et al., 2023). Although the GWI in humid areas is much smaller than that in arid areas, the ratio of GW in DRB still reaches 40 %, so it is imperative to incorporate GW into the water resource assessment system. The GWI in the upper and middle reaches of DRB exceeded 0.4, while that in the lower reaches was only about 0.3. These results mean that, to ensure the appropriate utilization of water resources, effective water management in the upper and middle reaches of DRB should consider GW planning, while water management in the lower reaches should mainly consider BW. The assessment results of BWSC and GWSC in DRB similarly illustrate this issue. The GWSC in the upper and middle reaches was bigger than that in the lower reaches of DRB, while the BWSC in the lower reaches of DRB was bigger than in the upper and middle reaches (Fig. 9).
There are robust correlations between BW and precipitation, GWF, and potential evapotranspiration in DRB. Climate change plays a dominant role in variations of BW and GWF. BW is more sensitive to precipitation and potential evapotranspiration. GWF shows sensitivity to changes in potential evapotranspiration, and GWS is influenced by both precipitation and potential evapotranspiration (Ahiablame et al., 2017; He et al., 2015). Of course, some studies in arid regions show that GWF is mainly affected by precipitation (Ahiablame et al., 2017), which may be linked to the hydrothermal conditions of the basin. There is sufficient precipitation in DRB, where the GWF changes are mainly energy-limited and the effect of precipitation on GWF is smaller.
Although BW and GW are mainly affected by climate change, the influences of LUCC on them cannot be ignored. The reaction of water resources to LUCC is exceedingly intricate and involves various hydrological processes, including runoff yield, infiltration, and groundwater (Cuo, 2016; Zhang and Shangguan, 2016). As there is a strong compensatory effect of diverse land use in the hydrological system, particularly in expansive watersheds, this could create a strong resistance to GW and BW conversion (Lin et al., 2015). A decrease in forest land or an increase in cultivated and urban land could lead to a rise in BW and a decline in GW in the watershed. Veettil and Mishra (2018) demonstrated that there is a 10 % rise in forest land cover and a 1.4 % drop in BW, indicating a negative elasticity between the two. However, the effect of urban land on streamflow in different periods showed the opposite effect. On the one hand, the increase in urban land results in increases in impermeable area and thus surface runoff in the basin, but at the same time the increase in urban land may also reduce groundwater discharge to streamflow. At the same time, LUCC often results in changes in vegetation. Vegetation variations affect the water cycle by altering canopy interception (Shao et al., 2018; Wu et al., 2019b), transpiration (Chen et al., 2023), and canopy evaporation and ameliorating soil structure (Qiu et al., 2022). Therefore, increasing vegetation often increases infiltration and soil moisture and reduces surface runoff.
There are several limitations and uncertainties in this study. (1) Since the quantity of the BW and GW is derived from the output results of the model simulations, including water yield, ET, soil moisture, and groundwater, the precision of the outcomes depends largely on the precision of the model simulations. Given the absence of observed evapotranspiration and soil moisture data for DRB, this study calibrated and validated the SWAT model using only monthly streamflow, which may weaken these results to some extent. To enhance the credibility of the model, this study also utilized widely used actual evapotranspiration data (GLEAM) and soil moisture (ERA5-Land) during model validation at a basin scale. The findings indicated that the simulation performance is relatively good and meets the accuracy requirements for simulation. (2) Climate change, LUCC, and large reservoir operation are the primary factors influencing the changes in hydrological conditions in DRB. The contributions of reservoir regulation, LUCC, water resource utilization, and climate change to the distribution of intra-annual flow are 33.5 %, −9 %, 4.5 %, and 1 %, respectively, during 1956–2009 (Tu et al., 2015). The operation of reservoirs, including large reservoirs like the Xinfengjiang Reservoir, is one important reason for hydrological changes in DRB (Lin et al., 2014; Zhang et al., 2015). The reservoir module was not established when constructing the SWAT model in this study. To obtain natural BW and GW volumes in the watershed and mitigate the impact of hydraulic engineering, reconstructed natural streamflow based on observed flow was utilized for model calibration and validation. However, hydraulic engineering significantly influences the annual allocation of BW. The flow restoration considered the impacts of the three major reservoirs on the Dongjiang River and did not consider the impacts of other minor hydraulic projects and human water consumption. (3) The calculations of BWSC and the FLK index both include environmental flows. This study represented the proportion of environmental flow in streamflow as 80 %. Some studies have suggested that assuming environmental flow to be 80 % of the total water resources in a basin may overestimate water scarcity (Liu et al., 2017; Richter et al., 2012). Therefore, we varied the proportion of environmental flow and assessed the degree of BWSC using 60 % and 70 % proportions. Results show that only the 63rd subbasin changed from severe BWSC to moderate to high BWSC, while other subbasins remained with low BWSC. Therefore, the threshold for environmental flow has a minor impact in this paper. The assessment of BWSC and per capita water resources did not take into account the water demand of cities such as Shenzhen and Hong Kong, although the water supply for these cities primarily comes from the Dongjiang River through the Dongjiang–Shenzhen Water Supply Project. (4) The hydrological modeling approach utilized in this study is a frequently used method for quantitative analysis of attribution. Nevertheless, it implies independence between climate change and LUCC and does not adequately distinguish between the impacts of these two components. Such restrictions are diffusely recognized as existing (Dey and Mishra, 2017). Despite this recognized limitation, hydrological modeling methods have been widely used in numerous similar studies, yielding credible results (Li et al., 2021; Nie et al., 2023).
This study analyzed the spatiotemporal evolution of BW and GW, assessed the water security, and evaluated the effects of climate change and LUCC on BW and GW in DRB using the SWAT model. The conclusions can be outlined as follows:
-
During 1970–2017, grassland, cultivated land, and forest land in DRB decreased by 4.3 %, 10.8 %, and 0.2 %, respectively, while urban land and water areas increased by 137 % and 2.8 %, respectively. The annual precipitation and potential evapotranspiration showed a nonsignificant decreasing trend, while the annual average temperature showed a significantly increasing trend.
-
The annual BW, GWF, and green storage in DRB from 1970 to 2017 were 1240.8, 840.7, and 151.4 mm, respectively. BW (0.14 mm a−1) and GWS (0.015 mm a−1) in DRB showed no significant increasing trend, and GWF (−0.57 mm a−1) showed a significant decreasing trend.
-
The levels of the annual BWSC and GWSC in DRB were low, and per capita water resources exceeded 1700 m3 per capita per year. BWSC displayed a nonsignificant increasing trend, while GWSC and the FLK index displayed a significant decreasing trend, especially in the lower reaches.
-
Climate change was the major driving factor of changes in BW and GWF, and LUCC was the major driving factor of GWS change. Climate change contributed 88.0 %, 88.5 %, and 39.4 % of the changes in BW, GWF, and GWS in DRB. Both climate change and LUCC decrease (increase) BW (GWS), while climate change (LUCC) decreases (increases) GWF in DRB.
All codes are available upon request.
The daily meteorological data were obtained from https://data.cma.cn/ (CMA, 2025). The ERA5-Land monthly soil moisture data were obtained from https://doi.org/10.24381/cds.f17050d7 (Hersbach et al., 2023). The GLEAM monthly actual evapotranspiration data were downloaded from https://www.gleam.eu/ (GLEAM, 2025). The DEM, population density data, GDP data and land use data were obtained from https://doi.org/10.12078/2017121102 (Xu, 2017a), https://doi.org/10.12078/2017121101 (Xu, 2017b) and https://doi.org/10.12078/2018070201 (Xu et al., 2018). The soil data were obtained from https://www.fao.org/soils-portal/soil-survey/soil-maps-and-databases/harmonized-world-soil-database-v12/en/ (Fischer et al., 2008).
The supplement related to this article is available online at: https://doi.org/10.5194/hess-29-427-2025-supplement.
XuejT, BL and XuezT designed the study and performed the analyses. XuejT wrote the paper, and ZH and JF helped with the result interpretation and data collection.
The contact author has declared that none of the authors has any competing interests.
Publisher's note: Copernicus Publications remains neutral with regard to jurisdictional claims made in the text, published maps, institutional affiliations, or any other geographical representation in this paper. While Copernicus Publications makes every effort to include appropriate place names, the final responsibility lies with the authors.
This study was supported by the National Key Research and Development Program of China (grant no. 2021YFC3001000), the National Natural Science Foundation of China (grant nos. 42401021, 52179029, and 52179030), and the Science and Technology Program of Guangdong (grant no. 2024B1212040001).
This paper was edited by Elham R. Freund and reviewed by three anonymous referees.
Acero Triana, J. S. and Ajami, H.: Identifying Major Hydrologic Change Drivers in a Highly Managed Transboundary Endorheic Basin: Integrating Hydro-Ecological Models and Time Series Data Mining Techniques, Water Resour. Res., 58, e2022WR032281, https://doi.org/10.1029/2022WR032281, 2022.
Aghakhani Afshar, A., Hassanzadeh, Y., Pourreza-Bilondi, M., and Ahmadi, A.: Analyzing long-term spatial variability of blue and green water footprints in a semi-arid mountainous basin with MIROC-ESM model (case study: Kashafrood River Basin, Iran), Theor. Appl. Climatol., 134, 885–899, https://doi.org/10.1007/s00704-017-2309-0, 2018.
Ahiablame, L., Sheshukov, A. Y., Rahmani, V., and Moriasi, D.: Annual baseflow variations as influenced by climate variability and agricultural land use change in the Missouri River Basin, J. Hydrol., 551, 188–202, https://doi.org/10.1016/j.jhydrol.2017.05.055, 2017.
Arnold, J. G., Srinivasan, R., Muttiah, R. S., and Williams, J. R.: Large Area Hydrologic Modeling and Assessment Part I: Model Development1, J. Am. Water Resour. Assoc., 34, 73–89, https://doi.org/10.1111/j.1752-1688.1998.tb05961.x, 1998.
Arshad, A., Mirchi, A., Samimi, M., and Ahmad, B.: Combining downscaled-GRACE data with SWAT to improve the estimation of groundwater storage and depletion variations in the Irrigated Indus Basin (IIB), Sci. Total Environ., 838, 156044, https://doi.org/10.1016/j.scitotenv.2022.156044, 2022.
Bai, P., Liu, X., Zhang, Y., and Liu, C.: Assessing the Impacts of Vegetation Greenness Change on Evapotranspiration and Water Yield in China, Water Resour. Res., 56, e2019WR027019, https://doi.org/10.1029/2019WR027019, 2020.
Berezovskaya, S., Yang, D., and Kane, D. L.: Compatibility analysis of precipitation and runoff trends over the large Siberian watersheds, Geophys. Res. Lett., 31, L21502, https://doi.org/10.1029/2004GL021277, 2004.
Chagas, V. B. P., Chaffe, P. L. B., and Blöschl, G.: Climate and land management accelerate the Brazilian water cycle, Nat. Commun., 13, 5136, https://doi.org/10.1038/s41467-022-32580-x, 2022.
Chen, Z., Wang, W., Cescatti, A., and Forzieri, G.: Climate-driven vegetation greening further reduces water availability in drylands, Global Change Biol., 29, 1628–1647, https://doi.org/10.1111/gcb.16561, 2023.
Chouchane, H., Krol, M. S., and Hoekstra, A. Y.: Changing global cropping patterns to minimize national blue water scarcity, Hydrol. Earth Syst. Sci., 24, 3015–3031, https://doi.org/10.5194/hess-24-3015-2020, 2020.
CMA: Surface meteorological observation data, https://data.cma.cn/ (last access: 19 January 2025), 2025.
Cook, B. I., Smerdon, J. E., Seager, R., and Coats, S.: Global warming and 21st century drying, Clim. Dynam., 43, 2607–2627, https://doi.org/10.1007/s00382-014-2075-y, 2014.
Cooper, C. M., Troutman, J. P., Awal, R., Habibi, H., and Fares, A.: Climate change-induced variations in blue and green water usage in U.S. urban agriculture, J. Clean. Product., 348, 131326, https://doi.org/10.1016/j.jclepro.2022.131326, 2022.
Cuo, L.: Land use/cover change impacts on hydrology in large river basins: a review, in: Terrestrial Water Cycle and Climate Change: Natural and Human-Induced Impacts, AGU, https://doi.org/10.1002/9781118971772.ch6, 2016.
Dai, C., Qin, X., Dong, F., and Cai, Y.: Climate change impact on blue and green water resources distributions in the Beijiang River basin based on CORDEX projections, J. Water Clim. Change, 13, 2780–2798, https://doi.org/10.2166/wcc.2022.115, 2022.
Dey, P. and Mishra, A.: Separating the impacts of climate change and human activities on streamflow: A review of methodologies and critical assumptions, J. Hydrol., 548, 278–290, https://doi.org/10.1016/j.jhydrol.2017.03.014, 2017.
Ding, B., Zhang, J., Zheng, P., Li, Z., Wang, Y., Jia, G., and Yu, X.: Water security assessment for effective water resource management based on multi-temporal blue and green water footprints, J. Hydrol., 632, 130761, https://doi.org/10.1016/j.jhydrol.2024.130761, 2024.
Eekhout, J. P. C., Hunink, J. E., Terink, W., and de Vente, J.: Why increased extreme precipitation under climate change negatively affects water security, Hydrol. Earth Syst. Sci., 22, 5935–5946, https://doi.org/10.5194/hess-22-5935-2018, 2018.
Falkenmark, M. and Rockström, J.: The New Blue and Green Water Paradigm: Breaking New Ground for Water Resources Planning and Management, J. Water Resour. Pl. Manage., 132, 129–132, https://doi.org/10.1061/(ASCE)0733-9496(2006)132:3(129), 2006.
Falkenmark, M., Lundqvist, J., and Widstrand, C.: Macro-scale water scarcity requires micro-scale approaches, Nat. Resour. Forum, 13, 258–267, https://doi.org/10.1111/j.1477-8947.1989.tb00348.x, 1989.
Falkenmark, M., Folke, C., and Falkenmark, M.: Freshwater as shared between society and ecosystems: from divided approaches to integrated challenges, Philos. T. Roy. Soc. Lond. B, 358, 2037–2049, https://doi.org/10.1098/rstb.2003.1386, 2003.
Farr, T. G., Rosen, P. A., Caro, E., Crippen, R., Duren, R., Hensley, S., Kobrick, M., Paller, M., Rodriguez, E., Roth, L., Seal, D., Shaffer, S., Shimada, J., Umland, J., Werner, M., Oskin, M., Burbank, D., and Alsdorf, D.: The Shuttle Radar Topography Mission, Rev. Geophys., 45, RG2004, https://doi.org/10.1029/2005RG000183, 2007.
Ficklin, D. L., Robeson, S. M., and Knouft, J. H.: Impacts of recent climate change on trends in baseflow and stormflow in United States watersheds, Geophys. Res. Lett., 43, 5079–5088, https://doi.org/10.1002/2016gl069121, 2016.
Fischer, G., Nachtergaele, F., Prieler, S., Van Velthuizen, H. T., Verelst, L., and Wiberg, D.: Global agro-ecological zones assessment for agriculture (GAEZ 2008), IIASA, Laxenburg, Austria and FAO, Rome, Italy, 10 pp. https://www.fao.org/soils-portal/soil-survey/soil-maps-and-databases/harmonized-world-soil-database-v12/en/ (last access: 19 January 2025), 2008.
Foley, J. A., DeFries, R., Asner, G. P., Barford, C., Bonan, G., Carpenter, S. R., Chapin, F. S., Coe, M. T., Daily, G. C., and Gibbs, H. K.: Global consequences of land use, Science, 309, 570–574, https://doi.org/10.1126/science.1111772, 2005.
GLEAM: Method GLEAM|Global Land Evaporation Amsterdam Model, https://www.gleam.eu/ (last access: 19 January 2025), 2025.
Han, Z., Huang, S., Huang, Q., Bai, Q., Leng, G., Wang, H., Zhao, J., Wei, X., and Zheng, X.: Effects of vegetation restoration on groundwater drought in the Loess Plateau, China, J. Hydrol., 591, 125566, https://doi.org/10.1016/j.jhydrol.2020.125566, 2020.
He, Y., Lin, K., and Chen, X.: Effect of Land Use and Climate Change on Runoff in the Dongjiang Basin of South China, Math. Probl. Eng., 2013, e471429, https://doi.org/10.1155/2013/471429, 2013.
He, Y., Lin, K., Chen, X., Ye, C., and Cheng, L.: Classification-Based Spatiotemporal Variations of Pan Evaporation Across the Guangdong Province, South China, Water Resour. Manage., 29, 901–912, https://doi.org/10.1007/s11269-014-0850-5, 2015.
Hersbach, H., Bell, B., Berrisford, P., Biavati, G., Horányi, A., Muñoz Sabater, J., Nicolas, J., Peubey, C., Radu, R., Rozum, I., Schepers, D., Simmons, A., Soci, C., Dee, D., and Thépaut, J.-N.: ERA5 monthly averaged data on single levels from 1940 to present, Copernicus Climate Change Service (C3S) Climate Data Store (CDS) [data set], https://doi.org/10.24381/cds.f17050d7, 2023.
Hoekstra, A. Y., Mekonnen, M. M., Chapagain, A. K., Mathews, R. E., and Richter, B. D.: Global Monthly Water Scarcity: Blue Water Footprints versus Blue Water Availability, PLOS ONE, 7, e32688, https://doi.org/10.1371/journal.pone.0032688, 2012.
Hoek van Dijke, A. J., Herold, M., Mallick, K., Benedict, I., Machwitz, M., Schlerf, M., Pranindita, A., Theeuwen, J. J. E., Bastin, J.-F., and Teuling, A. J.: Shifts in regional water availability due to global tree restoration, Nat. Geosci., 15, 363–368, https://doi.org/10.1038/s41561-022-00935-0, 2022.
Honrado, J. P., Vieira, C., Soares, C., Monteiro, M. B., Marcos, B., Pereira, H. M., and Partidário, M. R.: Can we infer about ecosystem services from EIA and SEA practice? A framework for analysis and examples from Portugal, Environ. Imp. Assess. Rev., 40, 14–24, https://doi.org/10.1016/j.eiar.2012.12.002, 2013.
Hordofa, A. T., Leta, O. T., Alamirew, T., and Chukalla, A. D.: Climate Change Impacts on Blue and Green Water of Meki River Sub-Basin, Water Resour. Manage., 37, 2835–2851, https://doi.org/10.1007/s11269-023-03490-4, 2023.
Huang, H., Xue, Y., Chilukoti, N., Liu, Y., Chen, G., and Diallo, I.: Assessing Global and Regional Effects of Reconstructed Land-Use and Land-Cover Change on Climate since 1950 Using a Coupled Land–Atmosphere–Ocean Model, J. Climate, 33, 8997–9013, https://doi.org/10.1175/JCLI-D-20-0108.1, 2020.
Huang, Y., Cai, Y., Xie, Y., Zhang, F., He, Y., Zhang, P., Li, B., Li, B., Jia, Q., Wang, Y., and Qi, Z.: An optimization model for water resources allocation in Dongjiang River Basin of Guangdong-Hong Kong-Macao Greater Bay Area under multiple complexities, Sci. Total Environ., 820, 153198, https://doi.org/10.1016/j.scitotenv.2022.153198, 2022.
Jiang, J., Wang, Z., Lai, C., Wu, X., and Chen, X.: Climate and landuse change enhance spatio-temporal variability of Dongjiang river flow and ammonia nitrogen, Sci. Total Environ., 867, 161483, https://doi.org/10.1016/j.scitotenv.2023.161483, 2023.
Konapala, G., Mishra, A. K., Wada, Y., and Mann, M. E.: Climate change will affect global water availability through compounding changes in seasonal precipitation and evaporation, Nat. Commun., 11, 3044, https://doi.org/10.1038/s41467-020-16757-w, 2020.
Lee, X., Goulden, M. L., Hollinger, D. Y., Barr, A., Black, T. A., Bohrer, G., Bracho, R., Drake, B., Goldstein, A., and Gu, L.: Observed increase in local cooling effect of deforestation at higher latitudes, Nature, 479, 384–387, https://doi.org/10.1038/nature10588, 2011.
Li, C., Tang, G., and Hong, Y.: Cross-evaluation of ground-based, multi-satellite and reanalysis precipitation products: Applicability of the Triple Collocation method across Mainland China, J. Hydrol., 562, 71–83, https://doi.org/10.1016/j.jhydrol.2018.04.039, 2018.
Li, X., Zhang, Y., Ma, N., Li, C., and Luan, J.: Contrasting effects of climate and LULC change on blue water resources at varying temporal and spatial scales, Sci. Total Environ., 786, 147488, https://doi.org/10.1016/j.scitotenv.2021.147488, 2021.
Lian, X., Piao, S., Li, L. Z. X., Li, Y., Huntingford, C., Ciais, P., Cescatti, A., Janssens, I. A., Peñuelas, J., Buermann, W., Chen, A., Li, X., Myneni, R. B., Wang, X., Wang, Y., Yang, Y., Zeng, Z., Zhang, Y., and McVicar, T. R.: Summer soil drying exacerbated by earlier spring greening of northern vegetation, Sci. Adv., 6, eaax0255, https://doi.org/10.1126/sciadv.aax0255, 2020.
Liang, J., He, X., Zeng, G., Zhong, M., Gao, X., Li, X., Li, X., Wu, H., Feng, C., and Xing, W.: Integrating priority areas and ecological corridors into national network for conservation planning in China, Sci. Total Environ., 626, 22–29, https://doi.org/10.1016/j.scitotenv.2018.01.086, 2018.
Liang, J., Liu, Q., Zhang, H., Li, X., Qian, Z., Lei, M., Li, X., Peng, Y., Li, S., and Zeng, G.: Interactive effects of climate variability and human activities on blue and green water scarcity in rapidly developing watershed, J. Clean. Product., 265, 121834, https://doi.org/10.1016/j.jclepro.2020.121834, 2020.
Lin, B., Chen, X., Yao, H., Chen, Y., Liu, M., Gao, L., and James, A.: Analyses of landuse change impacts on catchment runoff using different time indicators based on SWAT model, Ecol. Indicat., 58, 55–63, https://doi.org/10.1016/j.ecolind.2015.05.031, 2015.
Lin, K., Lian, Y., Chen, X., and Lu, F.: Changes in runoff and eco-flow in the Dongjiang River of the Pearl River Basin, China, Front. Earth Sci., 8, 547–557, https://doi.org/10.1007/s11707-014-0434-y, 2014.
Liu, B., Peng, S., Liao, Y., and Long, W.: The causes and impacts of water resources crises in the Pearl River Delta, J. Clean. Product., 177, 413–425, https://doi.org/10.1016/j.jclepro.2017.12.203, 2018.
Liu, D., Chen, X., Lian, Y., and Lou, Z.: Impacts of climate change and human activities on surface runoff in the Dongjiang River basin of China, Hydrol. Process., 24, 1487–1495, https://doi.org/10.1002/hyp.7609, 2010.
Liu, J., Yang, H., Gosling, S. N., Kummu, M., Flörke, M., Pfister, S., Hanasaki, N., Wada, Y., Zhang, X., Zheng, C., Alcamo, J., and Oki, T.: Water scarcity assessments in the past, present, and future, Earth's Future, 5, 545–559, https://doi.org/10.1002/2016EF000518, 2017.
Liu, M., Wang, D., Chen, X., Chen, Y., Gao, L., and Deng, H.: Impacts of climate variability and land use on the blue and green water resources in a subtropical basin of China, Sci. Rep., 12, 20993, https://doi.org/10.1038/s41598-022-21880-3, 2022.
Liu, M., Zhang, P., Cai, Y., Chu, J., Li, Y., Wang, X., Li, C., and Liu, Q.: Spatial-temporal heterogeneity analysis of blue and green water resources for Poyang Lake basin, China, J. Hydrol., 617, 128983, https://doi.org/10.1016/j.jhydrol.2022.128983, 2023.
Martens, B., Miralles, D. G., Lievens, H., Fernández-Prieto, D., Beck, H. E., Dorigo, W. A., and Verhoest, N. E. C.: GLEAM v3: satellite-based land evaporation and root-zone soil moisture, Geosci. Model Dev., 10, 1903–1925, https://doi.org/10.5194/gmd-10-1903-2017, 2017.
Martínez-Salvador, A. and Conesa-García, C.: Suitability of the SWAT Model for Simulating Water Discharge and Sediment Load in a Karst Watershed of the Semiarid Mediterranean Basin, Water Resour. Manage., 34, 785–802, https://doi.org/10.1007/s11269-019-02477-4, 2020.
Mohan, M. and Kandya, A.: Impact of urbanization and land-use/land-cover change on diurnal temperature range: A case study of tropical urban airshed of India using remote sensing data, Sci. Total Environ., 506, 453–465, https://doi.org/10.1016/j.scitotenv.2014.11.006, 2015.
Nearing, M. A., Jetten, V., Baffaut, C., Cerdan, O., Couturier, A., Hernandez, M., Le Bissonnais, Y., Nichols, M. H., Nunes, J. P., and Renschler, C. S.: Modeling response of soil erosion and runoff to changes in precipitation and cover, Catena, 61, 131–154, https://doi.org/10.1016/j.catena.2005.03.007, 2005.
Neitsch, S., Arnold, J., Kiniry, J., Williams, J., and King, K.: Soil and water assessment tool (SWAT): theoretical documentation, version 2000, TWRI Report TR-191, Texas Water Resources Institute, College Station, Texas, https://swat.tamu.edu/media/1290/swat2000theory.pdf (last access: 19 January 2025), 2002.
Nie, N., Li, T., Miao, Y., Zhang, W., Gao, H., He, H., Zhao, D., and Liu, M.: Asymmetry of blue and green water changes in the Yangtze river basin, China, examined by multi-water-variable calibrated SWAT model, J. Hydrol., 625, 130099, https://doi.org/10.1016/j.jhydrol.2023.130099, 2023.
Pandey, B. K., Khare, D., Kawasaki, A., and Mishra, P. K.: Climate Change Impact Assessment on Blue and Green Water by Coupling of Representative CMIP5 Climate Models with Physical Based Hydrological Model, Water Resour. Manage., 33, 141–158, https://doi.org/10.1007/s11269-018-2093-3, 2019.
Pokhrel, Y., Felfelani, F., Satoh, Y., Boulange, J., Burek, P., Gädeke, A., Gerten, D., Gosling, S. N., Grillakis, M., Gudmundsson, L., Hanasaki, N., Kim, H., Koutroulis, A., Liu, J., Papadimitriou, L., Schewe, J., Müller Schmied, H., Stacke, T., Telteu, C.-E., Thiery, W., Veldkamp, T., Zhao, F., and Wada, Y.: Global terrestrial water storage and drought severity under climate change, Nat. Clim. Change, 11, 226–233, https://doi.org/10.1038/s41558-020-00972-w, 2021.
Qiu, D., Xu, R., Wu, C., Mu, X., Zhao, G., and Gao, P.: Vegetation restoration improves soil hydrological properties by regulating soil physicochemical properties in the Loess Plateau, China, J. Hydrol., 609, 127730, https://doi.org/10.1016/j.jhydrol.2022.127730, 2022.
Qiu, D., Xu, R., Wu, C., Mu, X., Zhao, G., and Gao, P.: Effects of vegetation restoration on soil infiltrability and preferential flow in hilly gully areas of the Loess Plateau, China, Catena, 221, 106770, https://doi.org/10.1016/j.catena.2022.106770, 2023.
Richter, B. D.: Re-thinking environmental flows: from allocations and reserves to sustainability boundaries, River Res. Appl., 26, 1052–1063, https://doi.org/10.1002/rra.1320, 2010.
Richter, B. D., Davis, M. M., Apse, C., and Konrad, C.: A Presumptive Standard for Environmental Flow Protection, River Res. Appl., 28, 1312–1321, https://doi.org/10.1002/rra.1511, 2012.
Schewe, J., Heinke, J., Gerten, D., Haddeland, I., Arnell, N. W., Clark, D. B., Dankers, R., Eisner, S., Fekete, B. M., Colón-González, F. J., Gosling, S. N., Kim, H., Liu, X., Masaki, Y., Portmann, F. T., Satoh, Y., Stacke, T., Tang, Q., Wada, Y., Wisser, D., Albrecht, T., Frieler, K., Piontek, F., Warszawski, L., and Kabat, P.: Multimodel assessment of water scarcity under climate change, P. Natl. Acad. Sci. USA, 111, 3245–3250, https://doi.org/10.1073/pnas.1222460110, 2014.
Schuol, J., Abbaspour, K. C., Yang, H., Srinivasan, R., and Zehnder, A. J.: Modeling blue and green water availability in Africa, Water Resour. Res., 44, e2007WR0066095, https://doi.org/10.1029/2007WR006609, 2008.
Schyns, J. F., Hoekstra, A. Y., Booij, M. J., Hogeboom, R. J., and Mekonnen, M. M.: Limits to the world's green water resources for food, feed, fiber, timber, and bioenergy, P. Natl. Acad. Sci. USA, 116, 4893–4898, https://doi.org/10.1073/pnas.1817380116, 2019.
Shao, M., Wang, Y., Xia, Y., and Jia, X.: Soil drought and water carrying capacity for vegetation in the critical zone of the Loess Plateau: A review, Vadose Zone J., 17, 1539–1663, https://doi.org/10.2136/vzj2017.04.0077, 2018.
Sharma, A., Patel, P. L., and Sharma, P. J.: Blue and green water accounting for climate change adaptation in a water scarce river basin, J. Clean. Product., 426, 139206, https://doi.org/10.1016/j.jclepro.2023.139206, 2023.
Shen, Q., Cong, Z., and Lei, H.: Evaluating the impact of climate and underlying surface change on runoff within the Budyko framework: A study across 224 catchments in China, J. Hydrol., 554, 251–262, https://doi.org/10.1016/j.jhydrol.2017.09.023, 2017.
Stocker, B. D., Tumber-Dávila, S. J., Konings, A. G., Anderson, M. C., Hain, C., and Jackson, R. B.: Global patterns of water storage in the rooting zones of vegetation, Nat. Geosci., 16, 250–256, https://doi.org/10.1038/s41561-023-01125-2, 2023.
Suzuki, K., Park, H., Makarieva, O., Kanamori, H., Hori, M., Matsuo, K., Matsumura, S., Nesterova, N., and Hiyama, T.: Effect of Permafrost Thawing on Discharge of the Kolyma River, Northeastern Siberia, Remote Sens., 13, 4389, https://doi.org/10.3390/rs13214389, 2021.
Tan, X., Liu, B., and Tan, X.: Global Changes in Baseflow Under the Impacts of Changing Climate and Vegetation, Water Resour. Res., 56, e2020WR027349, https://doi.org/10.1029/2020WR027349, 2020.
Tan, X., Wu, X., Huang, Z., Deng, S., Hu, M., and Yew Gan, T.: Detection and attribution of the decreasing precipitation and extreme drought 2020 in southeastern China, J. Hydrol., 610, 127996, https://doi.org/10.1016/j.jhydrol.2022.127996, 2022a.
Tan, X., Liu, B., Tan, X., and Chen, X.: Long-Term Water Imbalances of Watersheds Resulting From Biases in Hydroclimatic Data Sets for Water Budget Analyses, Water Resour. Res., 58, e2021WR031209, https://doi.org/10.1029/2021WR031209, 2022b.
Tan, X., Tan, X., Liu, B., and Huang, Z.: Contribution of changes in vegetation composition and climate variability on streamflow across the global watersheds, Catena, 232, 107394, https://doi.org/10.1016/j.catena.2023.107394, 2023.
Tao, S., Fang, J., Ma, S., Cai, Q., Xiong, X., Tian, D., Zhao, X., Fang, L., Zhang, H., Zhu, J., and Zhao, S.: Changes in China's lakes: climate and human impacts, Natl. Sci. Rev., 7, 132–140, https://doi.org/10.1093/nsr/nwz103, 2020.
Tu, X., Singh, V. P., Chen, X., Chen, L., Zhang, Q., and Zhao, Y.: Intra-annual Distribution of Streamflow and Individual Impacts of Climate Change and Human Activities in the Dongijang River Basin, China, Water Resour. Manage., 29, 2677–2695, https://doi.org/10.1007/s11269-015-0963-5, 2015.
Tu, X., Wu, H., Singh, V. P., Chen, X., Lin, K., and Xie, Y.: Multivariate design of socioeconomic drought and impact of water reservoirs, J. Hydrol., 566, 192–204, https://doi.org/10.1016/j.jhydrol.2018.09.012, 2018.
Vano, J. A., Das, T., and Lettenmaier, D. P.: Hydrologic sensitivities of Colorado River runoff to changes in precipitation and temperature, J. Hydrometeorol., 13, 932–949, https://doi.org/10.1175/JHM-D-11-069.1, 2012.
Veettil, A. V. and Mishra, A.: Water Security Assessment for the Contiguous United States Using Water Footprint Concepts, Geophys. Res. Lett., 47, e2020GL087061, https://doi.org/10.1029/2020GL087061, 2020.
Veettil, A. V. and Mishra, A. K.: Water security assessment using blue and green water footprint concepts, J. Hydrol., 542, 589–602, https://doi.org/10.1016/j.jhydrol.2016.09.032, 2016.
Veettil, A. V. and Mishra, A. K.: Potential influence of climate and anthropogenic variables on water security using blue and green water scarcity, Falkenmark index, and freshwater provision indicator, J. Environ. Manage., 228, 346–362, https://doi.org/10.1016/j.jenvman.2018.09.012, 2018.
Walters, K. M. and Babbar-Sebens, M.: Using climate change scenarios to evaluate future effectiveness of potential wetlands in mitigating high flows in a Midwestern US watershed, Ecol. Eng., 89, 80–102, https://doi.org/10.1016/j.ecoleng.2016.01.014, 2016.
Wu, J., Chen, X., Yu, Z., Yao, H., Li, W., and Zhang, D.: Assessing the impact of human regulations on hydrological drought development and recovery based on a `simulated-observed' comparison of the SWAT model, J. Hydrol., 577, 123990, https://doi.org/10.1016/j.jhydrol.2019.123990, 2019a.
Wu, J., Liu, L., Sun, C., Su, Y., Wang, C., Yang, J., Liao, J., He, X., Li, Q., Zhang, C., and Zhang, H.: Estimating Rainfall Interception of Vegetation Canopy from MODIS Imageries in Southern China, Remote Sens., 11, 2468, https://doi.org/10.3390/rs11212468, 2019b.
Wu, J., Chen, X., Yuan, X., Yao, H., Zhao, Y., and AghaKouchak, A.: The interactions between hydrological drought evolution and precipitation-streamflow relationship, J. Hydrol., 597, 126210, https://doi.org/10.1016/j.jhydrol.2021.126210, 2021.
Xu, X.: China GDP spatial distribution kilometer grid data set, Data Registration and Publishing System of Resource and Environmental Science Data Center of Chinese Academy of Sciences [data set], https://doi.org/10.12078/2017121102, 2017a.
Xu, X.: China population spatial distribution kilometer grid dataset, Data Registration and Publishing System of Resource and Environmental Science Data Center of Chinese Academy of Sciences [data set], https://doi.org/10.12078/2017121101, 2017b.
Xu, X., Liu, J., Zhang, S., Li, R., Yan, C., and Wu, S.: Multi-period land use land cover remote sensing monitoring dataset in China (CNLUCC), Resource and Environmental Science Data Registration and Publication System [data set], https://doi.org/10.12078/2018070201, 2018.
Xu, X., Liu, J., Zhang, S., Li, R., Yan, C., and Wu, S.: Multi-period land use land cover remote sensing monitoring dataset in China (CNLUCC), Resource and Environmental Science Data Registration and Publication System, https://doi.org/10.12078/2018070201, 2018.
Yang, L. E., Chan, F. K. S., and Scheffran, J.: Climate change, water management and stakeholder analysis in the Dongjiang River basin in South China, Int. J. Water Resour. Dev., 34, 166–191, https://doi.org/10.1080/07900627.2016.1264294, 2018.
Zang, C. and Liu, J.: Trend analysis for the flows of green and blue water in the Heihe River basin, northwestern China, J. Hydrol., 502, 27–36, https://doi.org/10.1016/j.jhydrol.2013.08.022, 2013.
Zhang, Q., Gu, X., Singh, V. P., and Chen, X.: Evaluation of ecological instream flow using multiple ecological indicators with consideration of hydrological alterations, J. Hydrol., 529, 711–722, https://doi.org/10.1016/j.jhydrol.2015.08.066, 2015.
Zhang, Y. and Shangguan, Z.: The change of soil water storage in three land use types after 10 years on the Loess Plateau, Catena, 147, 87–95, https://doi.org/10.1016/j.catena.2016.06.036, 2016.
Zhang, Y., Xia, J., Yu, J., Randall, M., Zhang, Y., Zhao, T., Pan, X., Zhai, X., and Shao, Q.: Simulation and assessment of urbanization impacts on runoff metrics: insights from landuse changes, J. Hydrol., 560, 247–258, https://doi.org/10.1016/j.jhydrol.2018.03.031, 2018.
Zuo, D., Xu, Z., Peng, D., Song, J., Cheng, L., Wei, S., Abbaspour, K. C., and Yang, H.: Simulating spatiotemporal variability of blue and green water resources availability with uncertainty analysis, Hydrol. Process., 29, 1942–1955, https://doi.org/10.1002/hyp.10307, 2015.


