the Creative Commons Attribution 4.0 License.
the Creative Commons Attribution 4.0 License.
 | 03 Sep 2025
Trends in hydroclimate extremes: how changes in winter affect water storage and baseflow
Hjalmar Laudon
Northern ecosystems are undergoing accelerated climate warming, with average temperature increases exceeding the global mean. In snow-dominated catchments, where cold-season conditions are essential for sustaining streamflow across subsequent seasons, substantial uncertainty persists regarding the impacts of future warming on catchment water storage and runoff dynamics. Here, we utilized 40 years of hydrological data from the boreal Krycklan Catchment, set within a 130-year climate record from a nearby station, to evaluate how 27 extreme climate indices can capture changes and trends in water storage and stream low flow during winter and summer. Our results show that annual temperatures have risen by 2.2 °C over the past 4 decades, with even more pronounced seasonal impacts. Notably, six winter extreme indices and two summer indices revealed distinct trends. We found that warm winters have led to increased winter stream runoff but reduced summer runoff. Predictive modelling indicated that the accumulated freezing degree days (AFDD<0) were the strongest predictor of minimum winter flow, while a combination of AFDD<0 and maximum summer temperature (MaxTmax) best explained variations in minimum summer flow. Furthermore, analysis of streamflow partitioning using water isotopes and the seasonal origin index (SOI) over the past 22 years revealed an increasing winter precipitation signal in winter runoff, accompanied by a declining contribution to summer streamflow. Together, these findings demonstrate that warm winters are fundamentally altering catchment-scale water storage and flow partitioning, with important implications for water availability and ecosystem functioning during the growing season in boreal landscapes.
- Article
(3971 KB) - Full-text XML
-
Supplement
(1970 KB) - BibTeX
- EndNote


Over the past few decades, high-latitude areas have undergone a warming trend exceeding the global average, with the region continuing to warm at a rate more than twice as fast as the rest of the world (Rantanen et al., 2022; Druckenmiller et al., 2021). The boreal zone is particularly sensitive to changes in climate (Ali et al., 2024; Fu et al., 2023; Seidl et al., 2020) as its thermal regime is strongly affected by snow cover. Hence, temperature changes are likely to affect snow accumulation and the timing of melt (Bouchard et al., 2024; Friesen et al., 2021; Kim et al., 2012; Peng et al., 2013), which are mechanisms that are important for regulating the length of the growing season and plant phenology (Easterling, 2002; Way, 2011; Cleland et al., 2007). Consequently, shifts in the timing of the onset and end of winter are among the most fundamental anticipated effects of climate change in northern latitudes, which can increase the risk of severe and, in some cases, irreversible ecological impacts. Yet, how changes in seasonal cycles, temperature, and moisture regimes feed back on terrestrial ecosystems, biogeochemical cycles, and hydrological balance remains largely unknown.
Winter conditions define the timing and magnitude of hydrological processes within northern catchments, particularly as seen in river runoff (Barnett et al., 2005; Blöschl et al., 2017; Hrycik et al., 2024; Murray et al., 2023). For instance, temperatures below freezing are conducive for precipitation to accumulate as snow and ice, which is made available for groundwater recharge during melting. The freezing period is therefore a key determinant of the amount of water stored in catchments, based not only on temperature departure below zero, but also on the duration of the below-zero period and the subsequent melting rate (Stieglitz et al., 2001; Simons, 1967; Nygren et al., 2020). Any changes to the period of below freezing will ultimately affect the duration of the cold period, with consequences for the water cycle, leading to alterations in the flow regime (Blöschl et al., 2017). Observed changes in the winter period have already led to significant trends in ice duration, freezing period, and break-up dates based on long-term data from Sweden and Finland (Arheimer and Lindström, 2015; Hallerbäck et al., 2022). Such results have consequential effects on soil freeze–thaw cycles and lake and river ice dynamics (Kim et al., 2012; Peng et al., 2013) across the Northern Hemisphere. However, despite this growing body of evidence about warm winters, the implications for water storage and seasonal runoff dynamics are still elusive.
Changes in river runoff are essential factors for assessing the impact of climate change on the hydrological cycle as the discharge is highly dependent on precipitation (P), evapotranspiration (ET), and changes in water storage (White et al., 2007). One of the most prominent effects of changes in water flux can be seen during low-flow periods, which for a given catchment are largely regulated by the amount of water stored in the catchments. In high-latitude and high-altitude regions with long winters, mid-winter baseflow quantities are primarily reliant on the factors conducive to winter snowmelt or direct contributions from rain on snow. In contrast, summer low flows are often more dependent on water storage in soil and groundwater, often dominated by recharge occurring during snowmelt. Despite the host of studies that have demonstrated that snow melts earlier in years with less winter snow accumulation (Irannezhad et al., 2022; Venäläinen et al., 2020; Hrycik et al., 2024), resulting in decreasing summer baseflow trends (Murray et al., 2023), clear evidence on how winter climate affects runoff and, consequently, catchment recharge is still lacking (Tiwari et al., 2019, 2018). Understanding how such changes in winter conditions will affect subsequent seasonal runoff patterns is largely reliant on identifying techniques that can detect changes in the duration, magnitude, and intensity of the freezing period and their application towards understanding how water recharge and storage are affected (Blahušiaková et al., 2020; Dierauer et al., 2018).
A powerful technique for assessing changes in streamflow involves using the differences in the water isotopic signatures of δ18O in precipitation across seasons (Allen et al., 2019). The seasonality of isotopic signals in precipitation presents the possibility of tracing the fraction of water arriving in winter that can either be stored in the catchment or become streamflow directly during the current or during succeeding seasons. Similarly, the seasonal origin index (SOI) can be used to infer the fraction of winter precipitation that becomes stream runoff during the summer. Using isotopic signals to understand the water partitioning in catchments offers a possibility to trace the role of winter precipitation contributions to stream runoff that is not possible by using hydrometric measurements only. This can be done by adapting the SOI to implicitly test the proportion of winter precipitation versus summer precipitation in stream water with δ18O isotopes using the methods outlined in Allen et al. (2019). The results from the SOI analysis can then be used to test whether increases in winter runoff and decreases in summer baseflow are the result of changes in winter precipitation.
The techniques of identifying when changes in climate time series occur usually involve using models to detect the statistical departures from historical baselines (Alexander et al., 2006; Reeves et al., 2007; Wilmking et al., 2020). However, monitoring trends in seasonal variables has become increasingly challenging, as traditional definitions of seasonality are insufficient to reflect changes associated with fluctuating weather conditions. For instance, the most commonly used definitions (e.g. astronomical and meteorological) are static in both time and space (Allen and Sheridan, 2015; Trenberth, 1983). Considerable changes to transition periods (spring and autumn) between the warmest seasons in the summer and the coldest season in the winter are often not adequately defined based on their spatiotemporal variability (Huschke, 1959). As such, static definitions of seasons are insufficient to properly characterize seasonal timing and length, which are also likely to change in the future. Currently, many indicators of seasonality changes are based on temperature-related impacts on ecosystems, and hence they provide estimates of changes in the seasonal timing of the growing season. Minimum, mean, and maximum daily temperatures have been taken as the most important temperature characteristics in the analysis of climate change (Moberg et al., 2006; Cohen et al., 2014; Cassou and Cattiaux, 2016). Various indices have been used in the literature to divide seasons, such as those based on temperature (Alexander et al., 2006; Hekmatzadeh et al., 2020) and phenology (Cleland et al., 2007; Schwartz and Crawford, 2001; Peng et al., 2013), moving-average smoothing techniques to identify the time that temperature rises above or falls below the long-term mean (Blöschl et al., 2017; Park et al., 2021), or defined thresholds such as the 75th and 25th percentiles to identify the coldest and warmest periods (Zschenderlein et al., 2019). These studies suggest that the onset and offset of seasons depend on the geographical location of the study region and its specific purpose, where a variable threshold should be used for determining the start and end dates.
This study integrates long-term hydroclimatic trend analysis, seasonal extreme indices, and water-isotope-based seasonal origin tracing to assess how changes in winter climate influence inferred water storage and seasonal runoff dynamics in a well-studied boreal catchment. Although the effects of snowmelt and warming on streamflow have been widely investigated, the direct role of winter climate in controlling water storage and baseflow remains poorly quantified. To address this gap, a combined approach was applied using historical trend analysis, indices of climate extremes, and stable isotope data to evaluate the effects of winter climate on seasonal streamflow. The first objective was to identify possible significant changes in temperature trends using a 130-year historical dataset and assess their relationship to more recent changes captured in a 40-year on-site time series. Seasonal climate extremes were then derived from the last 30 years, where we have high-resolution data, to identify extremes across the seasons. The second objective focused on quantifying the influence of these climate extremes on key hydrological processes during winter and summer, using regression analysis to identify dominant drivers of seasonal runoff. The final objective involved the application of the seasonal origin index (SOI), based on δ18O isotope signatures, to quantify the relative contribution of winter precipitation to streamflow during winter and summer and to verify consistency with observed hydroclimatic trends.
2.1 The Krycklan Catchment and Svartberget
This study focuses on the Krycklan Catchment, which is a research infrastructure that has been monitored since the 1980s (Laudon and Sponseller, 2018). It is located in the boreal zone of northern Sweden, approximately 1 h from the city of Umeå and the Baltic Sea. Nested within the Krycklan Catchment is the Svartberget Catchment (C7), which has the longest high-quality monitoring record of runoff in the region (Fig. 1) (Laudon et al., 2021). The 47 ha of C7 is dominated by forest (81 %), primarily Norway spruce (Picea abies) and Scots pine (Pinus sylvestris) on till soils (81 %) and peatland (19 %). The location of Svartberget represents the conditions in Scandinavian boreal forests and is part of a network of stations within the Integrated Carbon Observation System (ICOS) – a European research infrastructure established to quantify and understand the greenhouse gas balance of the European continent and adjacent regions (Chi et al., 2020).
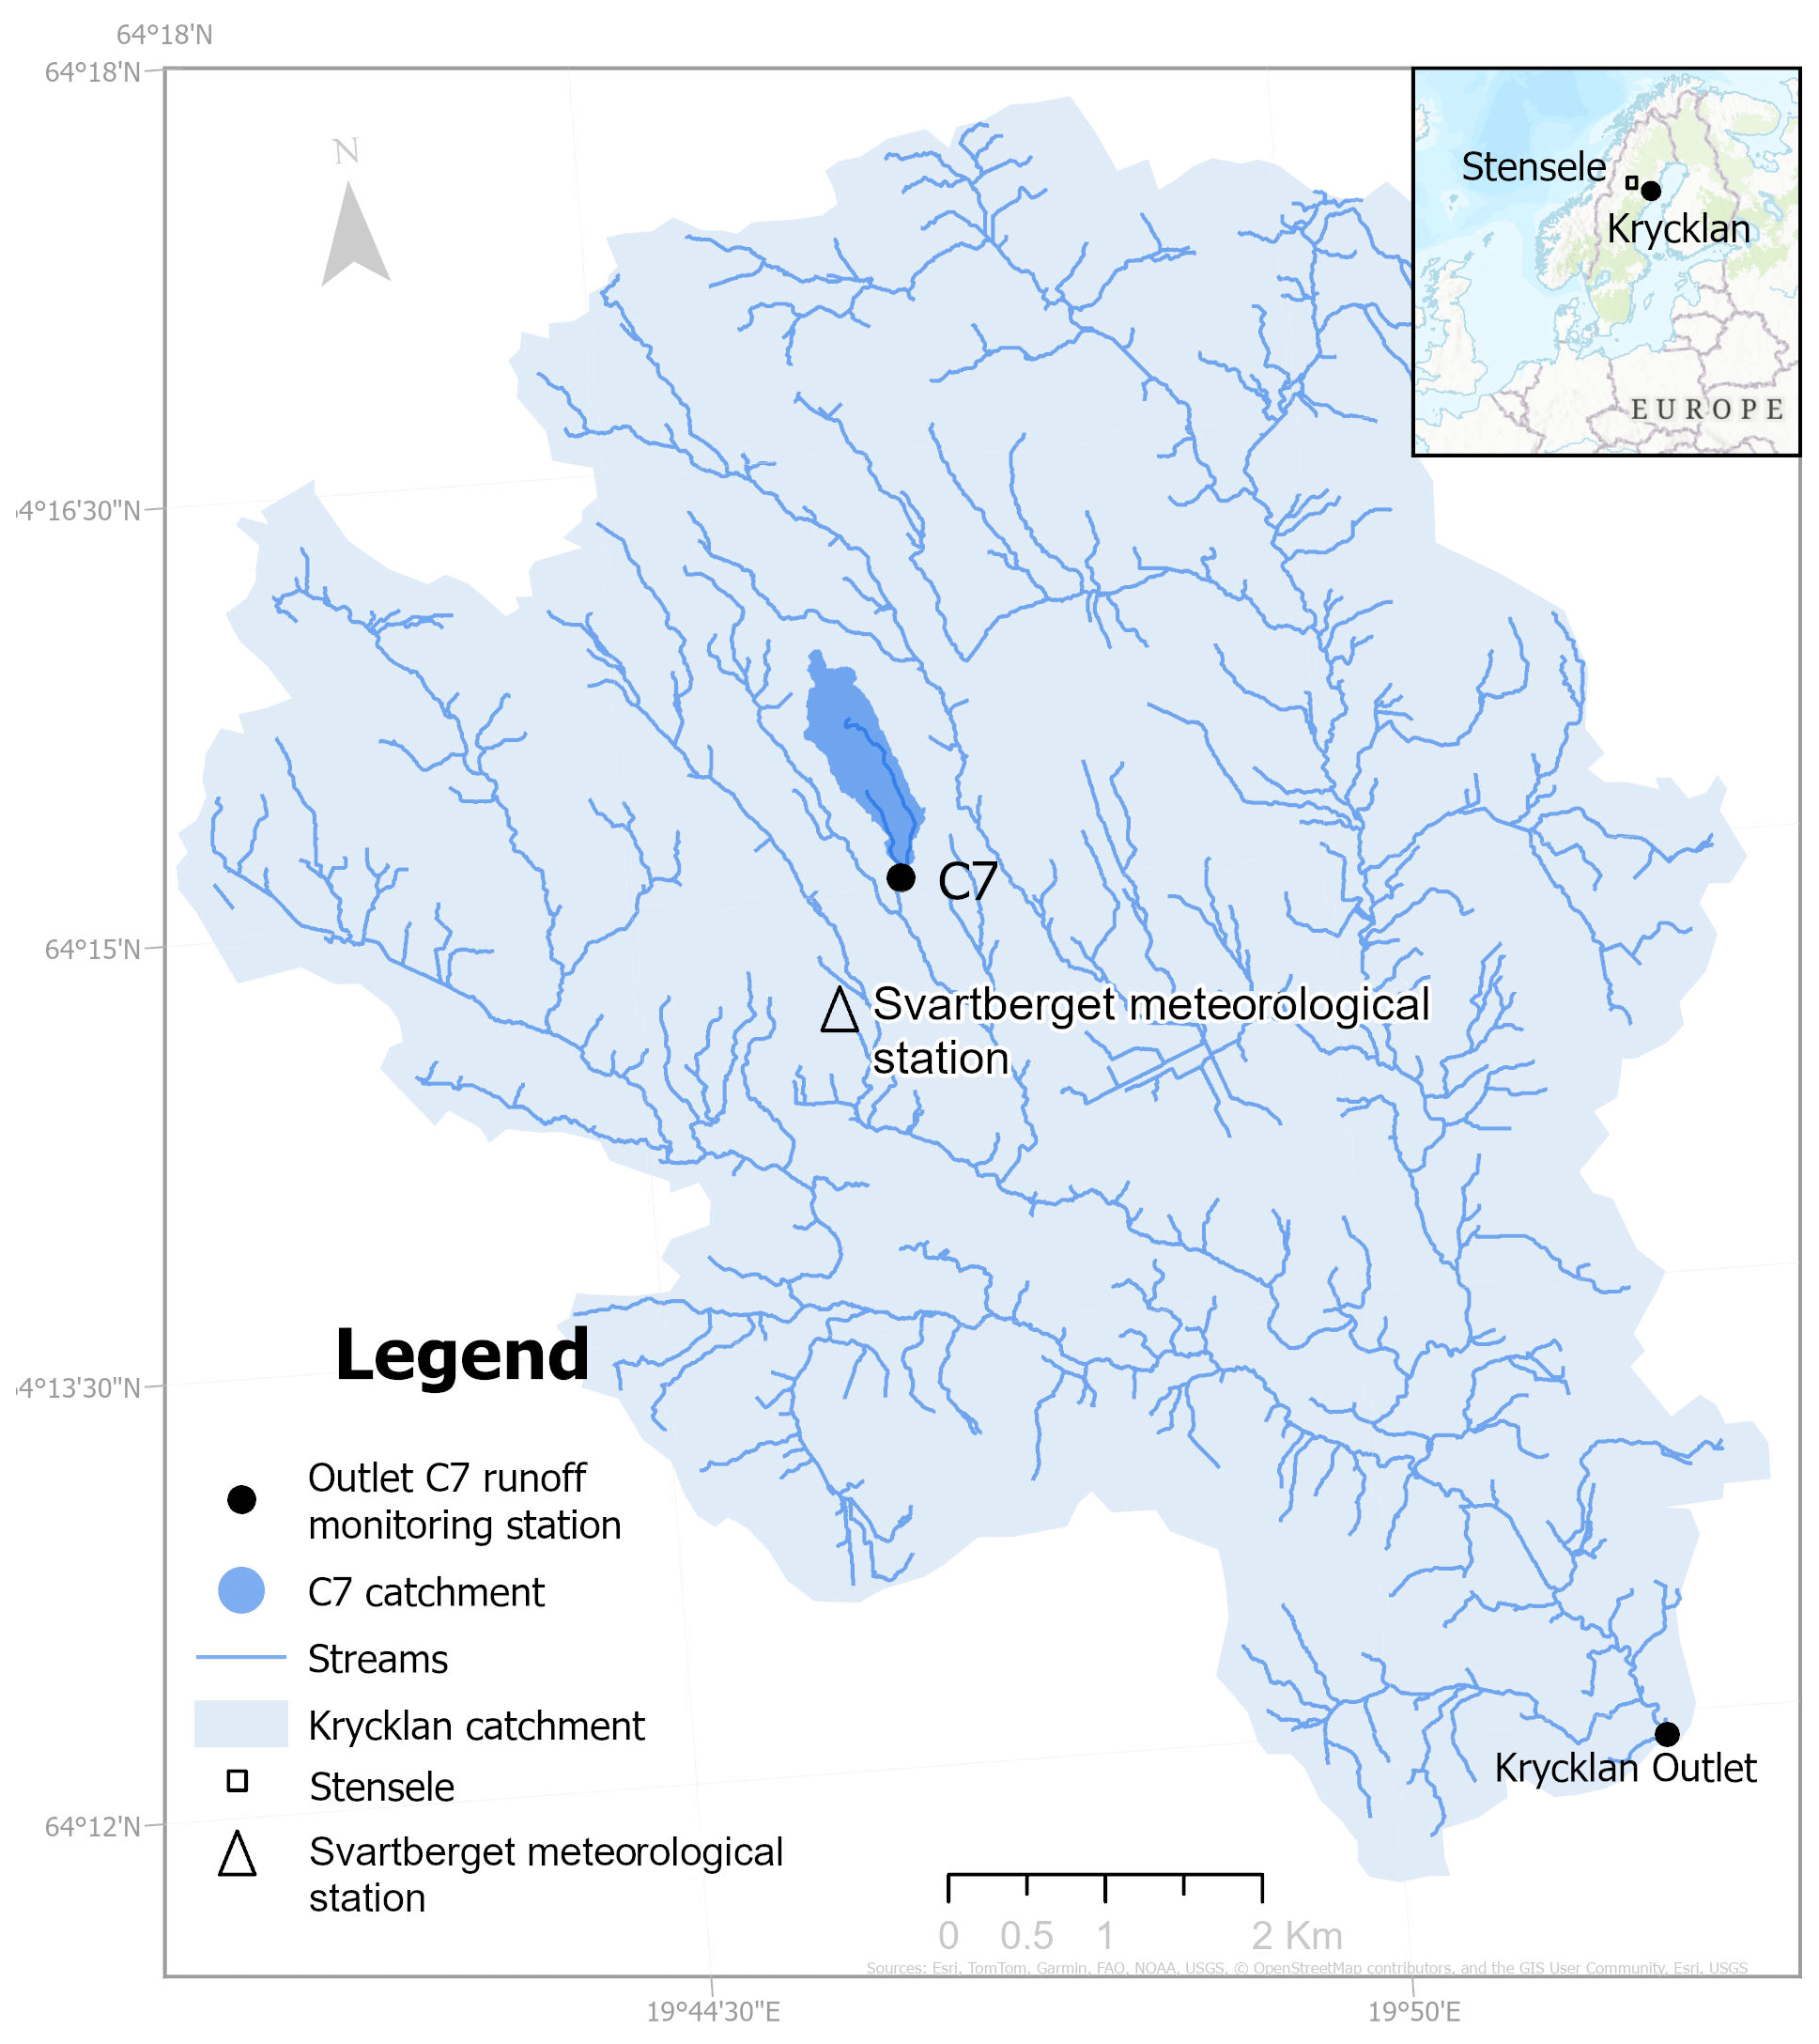
Figure 1Map showing the Krycklan Catchment, the location of the Svartberget meteorological tower in relation to the C7 catchment, the runoff monitoring station, and the nearby Stensele meteorological station.
2.2 Meteorological measurements and data
Precipitation and temperature data from the Svartberget field station (Fig. 1) were obtained from the SITES data portal (https://data.fieldsites.se/portal/, last access: 26 August 2024). Precipitation (mm) was determined using daily (00:00–24:00 CEST, UTC + 2) accumulated rain and snowfall amounts from manual measurements using a standard Swedish Meteorological and Hydrological Institute (SMHI) gauge with a windshield located 1.5 m above the ground (Climate monitoring programme at SLU experimental forests and SITES Svartberget) (Laudon et al., 2013). The data available for Svartberget included two time periods: 1982–2022, which consisted of daily mean precipitation and temperature used to detect long-term trends, and 1992–2022, with daily, average daily minimum (min), and average daily maximum (max) temperatures needed for detecting extreme climate change indices. Two datasets were used in this study because the earlier dataset of 1982–1992 only provided one value for daily mean, while 1992–2022 provided 10 min recordings of temperatures from which daily minimums and maximums could be determined. Average daily minimums (Tmin) and maximums (Tmax) represent the coldest and warmest temperatures recorded in a day (Fig. S1 in the Supplement). Both Tmin and Tmax were used in the extreme indices to identify the coldest (minTmin) and warmest (maxTmax) temperatures in the season.
In addition to the Krycklan data, we included a longer-term dataset (1891–2004) from the SMHI meteorological station in Stensele, located approximately 150 km west of the Krycklan Catchment (Fig. 1). The Stensele dataset was used to place observed trends from the past 40 years in Krycklan into a longer-term climatic context. Temperature records from Stensele and Svartberget show strong agreement during their overlapping period (1982–2004), with an r2 of 0.92 and a root mean square error (RMSE) of 0.05 based on daily average temperatures (Fig. S2 in the Supplement). Minor systematic biases were identified: maximum temperatures were slightly higher in Svartberget, whereas minimum temperatures were slightly lower in Stensele. However, these differences were small (<3 %) and did not affect the overall trends in the time series, which were the primary focus of this study. Therefore, the Stensele dataset was considered a reliable proxy for assessing historical climatic trends in the region.
2.3 Runoff measurements and data
Runoff measurements from the Svartberget Catchment (C7) were done using a field-based recording of hourly stage height and established rating curves to calculate the daily discharge from a weir located in a heated hut. The rating curve was established using the salt dilution technique and bucket-method measurements (Laudon et al., 2004). Occasional missing data (4 %) were gap filled using the HBV model (Karimi et al., 2022; Karlsen et al., 2016). The data available extended across 40 years from 1982–2022. The entire time series was used to show the long-term trends in minimum runoff (Qmin); however, the modelling was done using a subset of the dataset (1992–2022) for the seasonal analysis to synchronize with the extreme indices.
2.4 Seasonal definitions
Seasons were separated according to the thermal threshold definition (Contosta et al., 2020), where winter is a consistent frozen period when the air temperature is below 0 °C for more than 7 consecutive days (Fig. S3 in the Supplement). We used the SMHI 10 °C threshold for the definition of summer, which is the period when the daily mean air temperature was above 10 °C for more than 5 consecutive days. Summer ended when the mean air temperature fell below 10 °C for more than 5 consecutive days. The spring period between winter and summer was classified as the period when air temperature was above 0 °C for more than 7 consecutive days but less than 10 °C for more than 7 consecutive days. The autumn season was not used in this study; however, we checked the effects of autumn precipitation and runoff on mid-winter runoff and winter Qmin, which did not show any significant effects (Fig. S4 in the Supplement).
2.5 Extreme climate indices
A total of 27 climate change indices were used in this study, which were developed by the World Meteorological Organization (WMO) Expert Team on Climate Change Detection and Indices (Donat et al., 2020). These indices assess various aspects of temperature and precipitation variability, including the (i) intensity, (ii) duration, and (iii) frequency of events. The identified indices were then determined for each seasonal block (winter, spring, and summer; Table 1) and used in the regression analysis to understand their relation to runoff. To address inhomogeneity in the dataset, we used the bootstrap technique to test whether the trends in climate indices would vary depending on the window use (i.e. 3, 5, 7 d) based on the description of the climate index (https://etccdi.pacificclimate.org/list_27_indices.shtml, last access: 26 August 2024).
2.6 Temperature and precipitation extreme climate indices
Temperature intensity was assessed using seven variables from the daily average, minimum, and maximum as follows: (i) the coldest daily maximum temperature (Min Tmax), (ii) the coldest daily minimum temperature (Min Tmin), (iii) the warmest daily maximum temperature (Max Tmax), (iv) the warmest daily minimum temperature (Max Tmin), (v) the mean difference between daily maximum and daily minimum temperature (diurnal temperature range), (vi) the number of days when Tmax<0 °C (icing days), and (vii) the accumulated degree days below 0 °C (AFDD<0). The duration of extreme periods in the seasons was categorized as (i) the number of days with at least 6 consecutive days when Tmin<10th percentile (cold spell) and (ii) the number of episodes with at least 6 consecutive days with Tmax>90th percentile (warm spell). The frequency of events within each season was identified as (i) the percentage of days when Tmax<10th percentile (cool days), (ii) the percentage of days when Tmin<10th percentile (cool nights), (iii) the percentage of days when Tmax>90th percentile (warm days), (iv) the percentage of days when Tmin>90th percentile (warm nights), and (v) the number of days when Tmin<0 °C (frost days; Table 1).
The intensity, duration, and frequency of seasonal precipitation patterns were determined to also highlight extremes across the years. Precipitation intensity was measured using (i) the maximum 1 d precipitation total, (ii) the maximum 5 d precipitation total, (iii) the sum of daily precipitation>95th percentile (wet days), and (iv) the sum of daily precipitation>99th percentile (very wet days), while the duration of precipitation events was measured using (i) the maximum number of consecutive wet days (precipitation>1 mm) and (ii) the maximum number of consecutive dry days (precipitation). It should be noted that W and S are used in the regression models to distinguish between winter and summer variables.
2.7 Analysis: trend detection and regression analysis
Trends in extreme climate indices were assessed using the trend detection package in R (R Development Core Team, 2021), applied to long-term (1982–2022) datasets of average daily temperature, precipitation, and runoff. Analyses were conducted for both annual and seasonal datasets (winter, spring, and summer) across 27 indices, examining trends in mean values and variability (standard deviation). The Mann–Kendall test was used to determine trend direction and p values for significance. To identify which significant climate indices best explained minimum seasonal runoff (Qmin), stepwise linear regression was performed using Minitab® statistical software (2021). For winter Qmin, significant winter temperature and precipitation indices were used, while summer Qmin was predicted based on significant indices from winter, spring, and summer.
2.8 δ18O and seasonal origin index
As a verification test for understanding the contributions of seasonal precipitation to annual runoff, the analysis of δ18O isotopes was carried out. Samples were collected at regular intervals from 2002–2022 in precipitation (n=1930) and stream water (n=821). Precipitation sampling was done manually using national standard precipitation gauges with a windshield where samples were collected in dark glass bottles with a hermetic lid to minimize evaporation during storage. Stream water samples were collected weekly, with more frequent sampling during the snowmelt season, in similar bottles to those of precipitation samples. During the winter, a heated weir house enables sampling throughout the frozen season. Both precipitation and stream samples were analysed using a Picarro cavity ringdown laser spectrometer (L1102-i and L2130-i after September 2013) and the vaporizer module (V1102-i and later A0211) (see Peralta-Tapia et al., 2016, for more details). Calibration of the isotopic signatures of water was done using internal laboratory standards calibrated against three International Atomic Energy Agency (IAEA) official standards, the Vienna Standard Mean Ocean Water (VSMOW), the Greenland Ice Sheet Precipitation (GISP), and the Standard Light Antarctic Precipitation (SLAP) (Coplen, 1995).
The δ18O data were then used in the seasonal origin index (SOI) analysis to test whether winter or summer precipitation is overrepresented in seasonal streamflow (Allen et al., 2019). The SOI is a technique that can be used to identify the prevalence of winter versus summer precipitation sources in stream water due to the inherent differences in the winter and summer precipitation signals. This can be done using the deviation of annual average discharge from annual precipitation and scaling the deviation by the strength of the seasonal signals using Eq. (1):
where , , , and represent the δ18O values of summer, winter, volume-weighted annual precipitation in the C7 catchment, and annual volume-weighted mean streamflow, respectively. To determine the SOI of winter and summer, we calculate the SOI of individual streamflow samples using their individual isotope ratios. The January samples were used to represent the winter isotopic signals, and the July samples were used to represent the summer isotopic signals. Linear regression was then used to show the proportion of winter precipitation in winter and summer baseflows, where positive (closer to 1) in the summer indicates a larger fraction of summer precipitation in streamflow. Similarly, increasing negative (closer to −1) during the winter means greater contributions from winter precipitation to streamflow.
3.1 Trends in temperature, precipitation, and runoff in Svartberget
Over the last 4 decades, the increase in temperature has accelerated by 2.2 °C, where the long-term average daily temperature trend changed from 1 °C in 1980 to 3.2 °C in 2022 (Fig. 2a). Placing these trends in a much longer perspective by using time series that extend to 1892 from the nearby SMHI Stensele meteorological station, we note that the increasing trends observed in Svartberget are part of a much longer-term temperature trend that extends over 100 years. Looking back at the 30-year normal period trends over this period, we can observe that at the beginning of the century (1892–1922), the annual average air temperature was much colder (−0.29 °C) than in the most recent 30-year normal period (1993–2022), which was warmer (2.5 °C) (Fig. 2a).
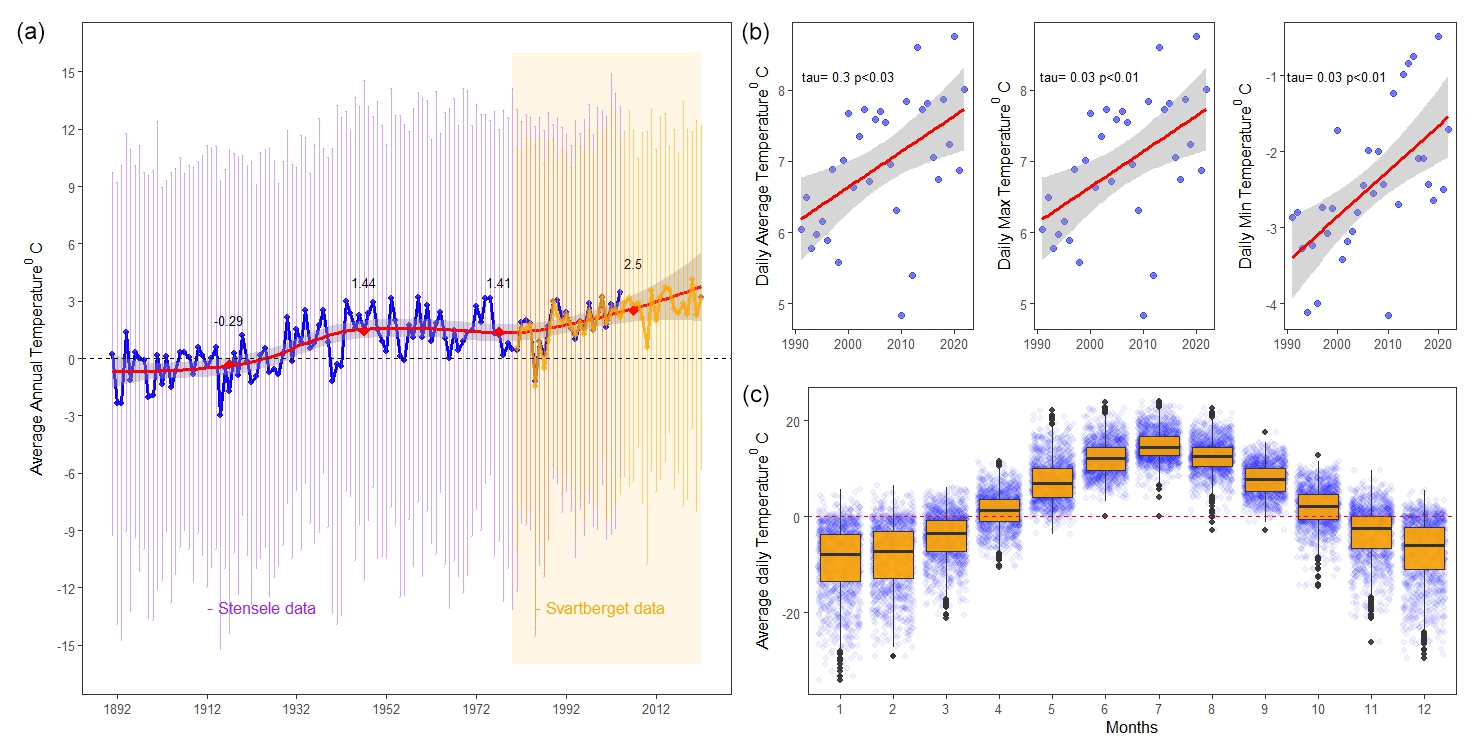
Figure 2Trends in long-term temperature in the Krycklan Catchment, showing (a) the relation to the much longer-term time series from the SMHI Stensele data (1891–2004); (b) trends in average daily air temperature (avg.), maximum (max) daily air temperature, and minimum (min) daily temperatures; and (c) variability in daily temperatures over months, across 30 years from 1992–2022. In panel (a), the red symbols indicate the average within a 30-year period from 2022 backwards, while purple and orange error bars represent the standard deviation in the Stensele and Svartberget datasets respectively. The grey-shaded area in panel (b) represents the standard error in the datasets, and the blue jitter dots in panel (c) represent daily average temperatures in Svartberget.
A closer look at the last 30 years of variability in temperatures in the Krycklan Catchment (1992–2022) showed annual average temperatures ranging from 0.5–5 °C across the years, increasing from 1.5 °C in 1992 to 3.1 °C by 2022 (Fig. 2b) when observing the long-term trend line. Trends in average daily temperatures showed significant increases in observed annual averages (0.3, p<0.03), average daily maximums (0.3, p<0.01), and average daily minimums (0.3, p<0.01) during the period 1992–2022 (Fig. 2b and Table S1 in the Supplement). Annual average maximum temperatures ranged from 4.8–8.7 °C with an increasing trend from 6.4 °C in 1991 to 7.8 °C in 2022, also indicating an increase in maximum temperature of 1.4 °C across the 30 years. The warmest periods occur during month 7 (July) when the temperature ranges from 17.4–25.2 °C (Fig. 2c). The annual average minimum temperature ranges from −4.1 to −0.4 °C, with the coldest average monthly temperatures occurring in either January or February, ranging from −20.6 to −7.6 °C (Fig. 2c). There is a significant increase in minimum temperatures from 1992–2022 (−3.4 to −1.6 °C), indicating an increase of 1.8 °C during the coldest months (Fig. 2b). These changes in minimum temperatures suggest that the winter seasons on average are becoming warmer.
The long-term trends (1982–2022) showed an increase in total annual precipitation, while total annual runoff showed a decrease when fitted with a linear regression (Fig. 3a). A closer look at the variability in both the total annual precipitation and the runoff across the time series indicated that trends were variable across the years, decreasing in the period 1982–1997, followed by an increase towards 2022, as shown with the loss regression (Fig. S5 and Table S1 in the Supplement). It should be noted that this variability, as measured by the standard deviation in runoff, decreased by 0.5 mm d−1 from 1.6 mm d−1 to 1.1 mm d−1, while the variability in precipitation increased significantly from 3.5 mm d−1 to 4.2 mm d−1 during the same period (Fig. 3b). Annually, on average, the highest total monthly precipitation occurred in July (86 mm on average across the years), while the lowest occurred in April (28 mm). The annual average precipitation was 650 mm yr−1, with the lowest records occurring in 1994 and 2002 (446 and 470 mm respectively) (Fig. 3a) when July/August precipitation was less than 30 % of the long-term July/August values. The average total annual runoff was 318 mm yr−1, with the lowest runoff occurring in February (5.8 mm month−1) and the highest in May (spring flood) with 96 mm month−1, accounting for 30 % of the total annual runoff. While no significant trends in total annual precipitation and runoff could be detected (τ=0.12, p>0.1, , p>0.1, for P and Q respectively), ET during the same period calculated from the differences between precipitation and runoff showed a generally increasing annual trend (0.3, p=0.02) (Fig. 3a).
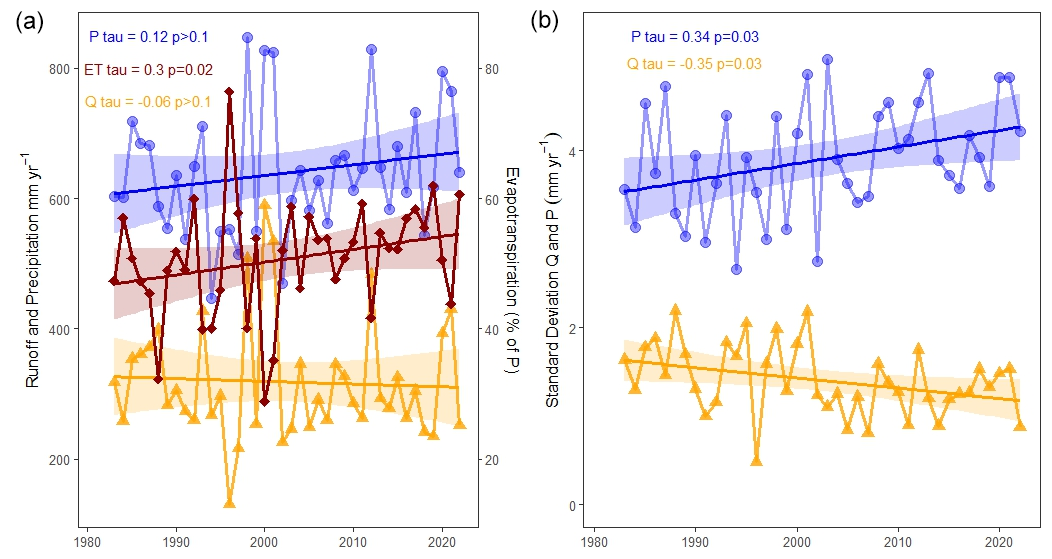
Figure 3Long-term trends in total annual precipitation (P) and total annual runoff (Q) from the Krycklan Catchment across 40 years, showing the differences between the percentage of precipitation (P) and runoff (Q) that represents evapotranspiration (ET) (a). The variability during the period, as measured by the standard deviation in runoff (Q) and precipitation (P), is shown in panel (b). The shaded areas represent the standard error in the datasets.
3.2 Variability in winter and summer climate variables
The significant changes in minimum and maximum annual temperatures prompted further investigations into the variability of temperature and precipitation during the coldest (winter) and warmest (summer) seasons. The temperature trends in Svartberget during winter and summer are consistent with the longer-term time series from the SMHI Stensele dataset (Fig. 4a and b). The analysis showed significant increases in average winter temperatures (τ=0.12, p=0.14), where daily averages ranged from −30.7 to 6.1 °C, with the coldest winters occurring in 1986 and 2010 (with average winter temperatures of −11 and −9.5 °C) and the warmest winters in 2014 and 1992 (average winter temperatures of −3.7 and 3.2 °C) (Fig. 4c). The duration of the winter period changed from 171–140 d over the 30 years, showing a loss of 31 d, with the start of winter shifting 16 d later and ending 15 d earlier (Fig. 4d and e). Summers, on the other hand, while showing warmer average temperature trends (0.12, p=0.14), were found in the analysis to be getting longer (22 d), moving from 80 d in early 1982 to 102 d in 2022 (Fig. 4d and f). The start and end of summers shifted on average 11 d earlier and later respectively (Fig. 4f). Total precipitation during winter has decreased overall but has increased during the summer; however, neither of these trends was significant (Table 1).
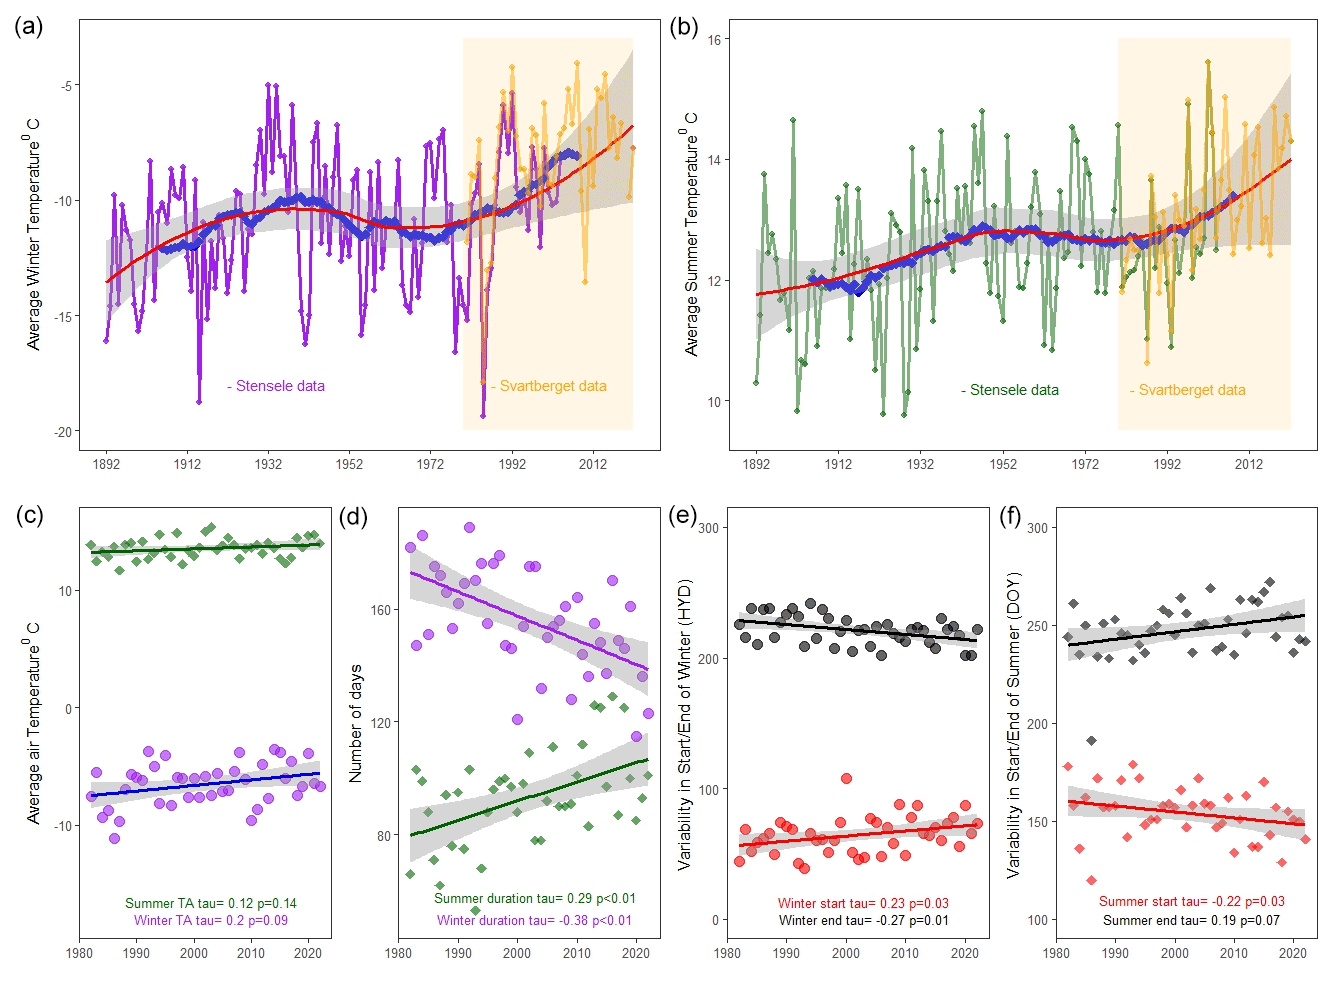
Figure 4Variability in seasonal temperature across 40 years in the Krycklan Catchment (orange box), showing changes in temperature during the winter (a) and summer (b) in relation to the SMHI Stensele longer-term dataset (1891–2004). The variability in annual air temperature (c) and duration (d) is represented by purple symbols for the winter period and green symbols for the summer period. Changes in the start (red) and end (black) of winter (circle) and summer (diamonds) are depicted in panels (e) and (f) respectively. Standard errors in the datasets (a, b, d–f) are shown as grey shading.
Table 1Extreme climate indices used in the analysis of 30 years of climate data from 1992–2022, showing the description of the indices and the results of the Mann–Kendall trend test (τ) and significant (p) values. A detailed description of each index can be found on the World Meteorological Organization Expert Team on Climate Change Detection and Indices website (http://etccdi.pacificclimate.org/list_27_indices.shtml, last access: 26 August 2024; commissioned by the World Meteorological Organization Commission for Climatology (CCl)/CLIVAR/JCOMM).
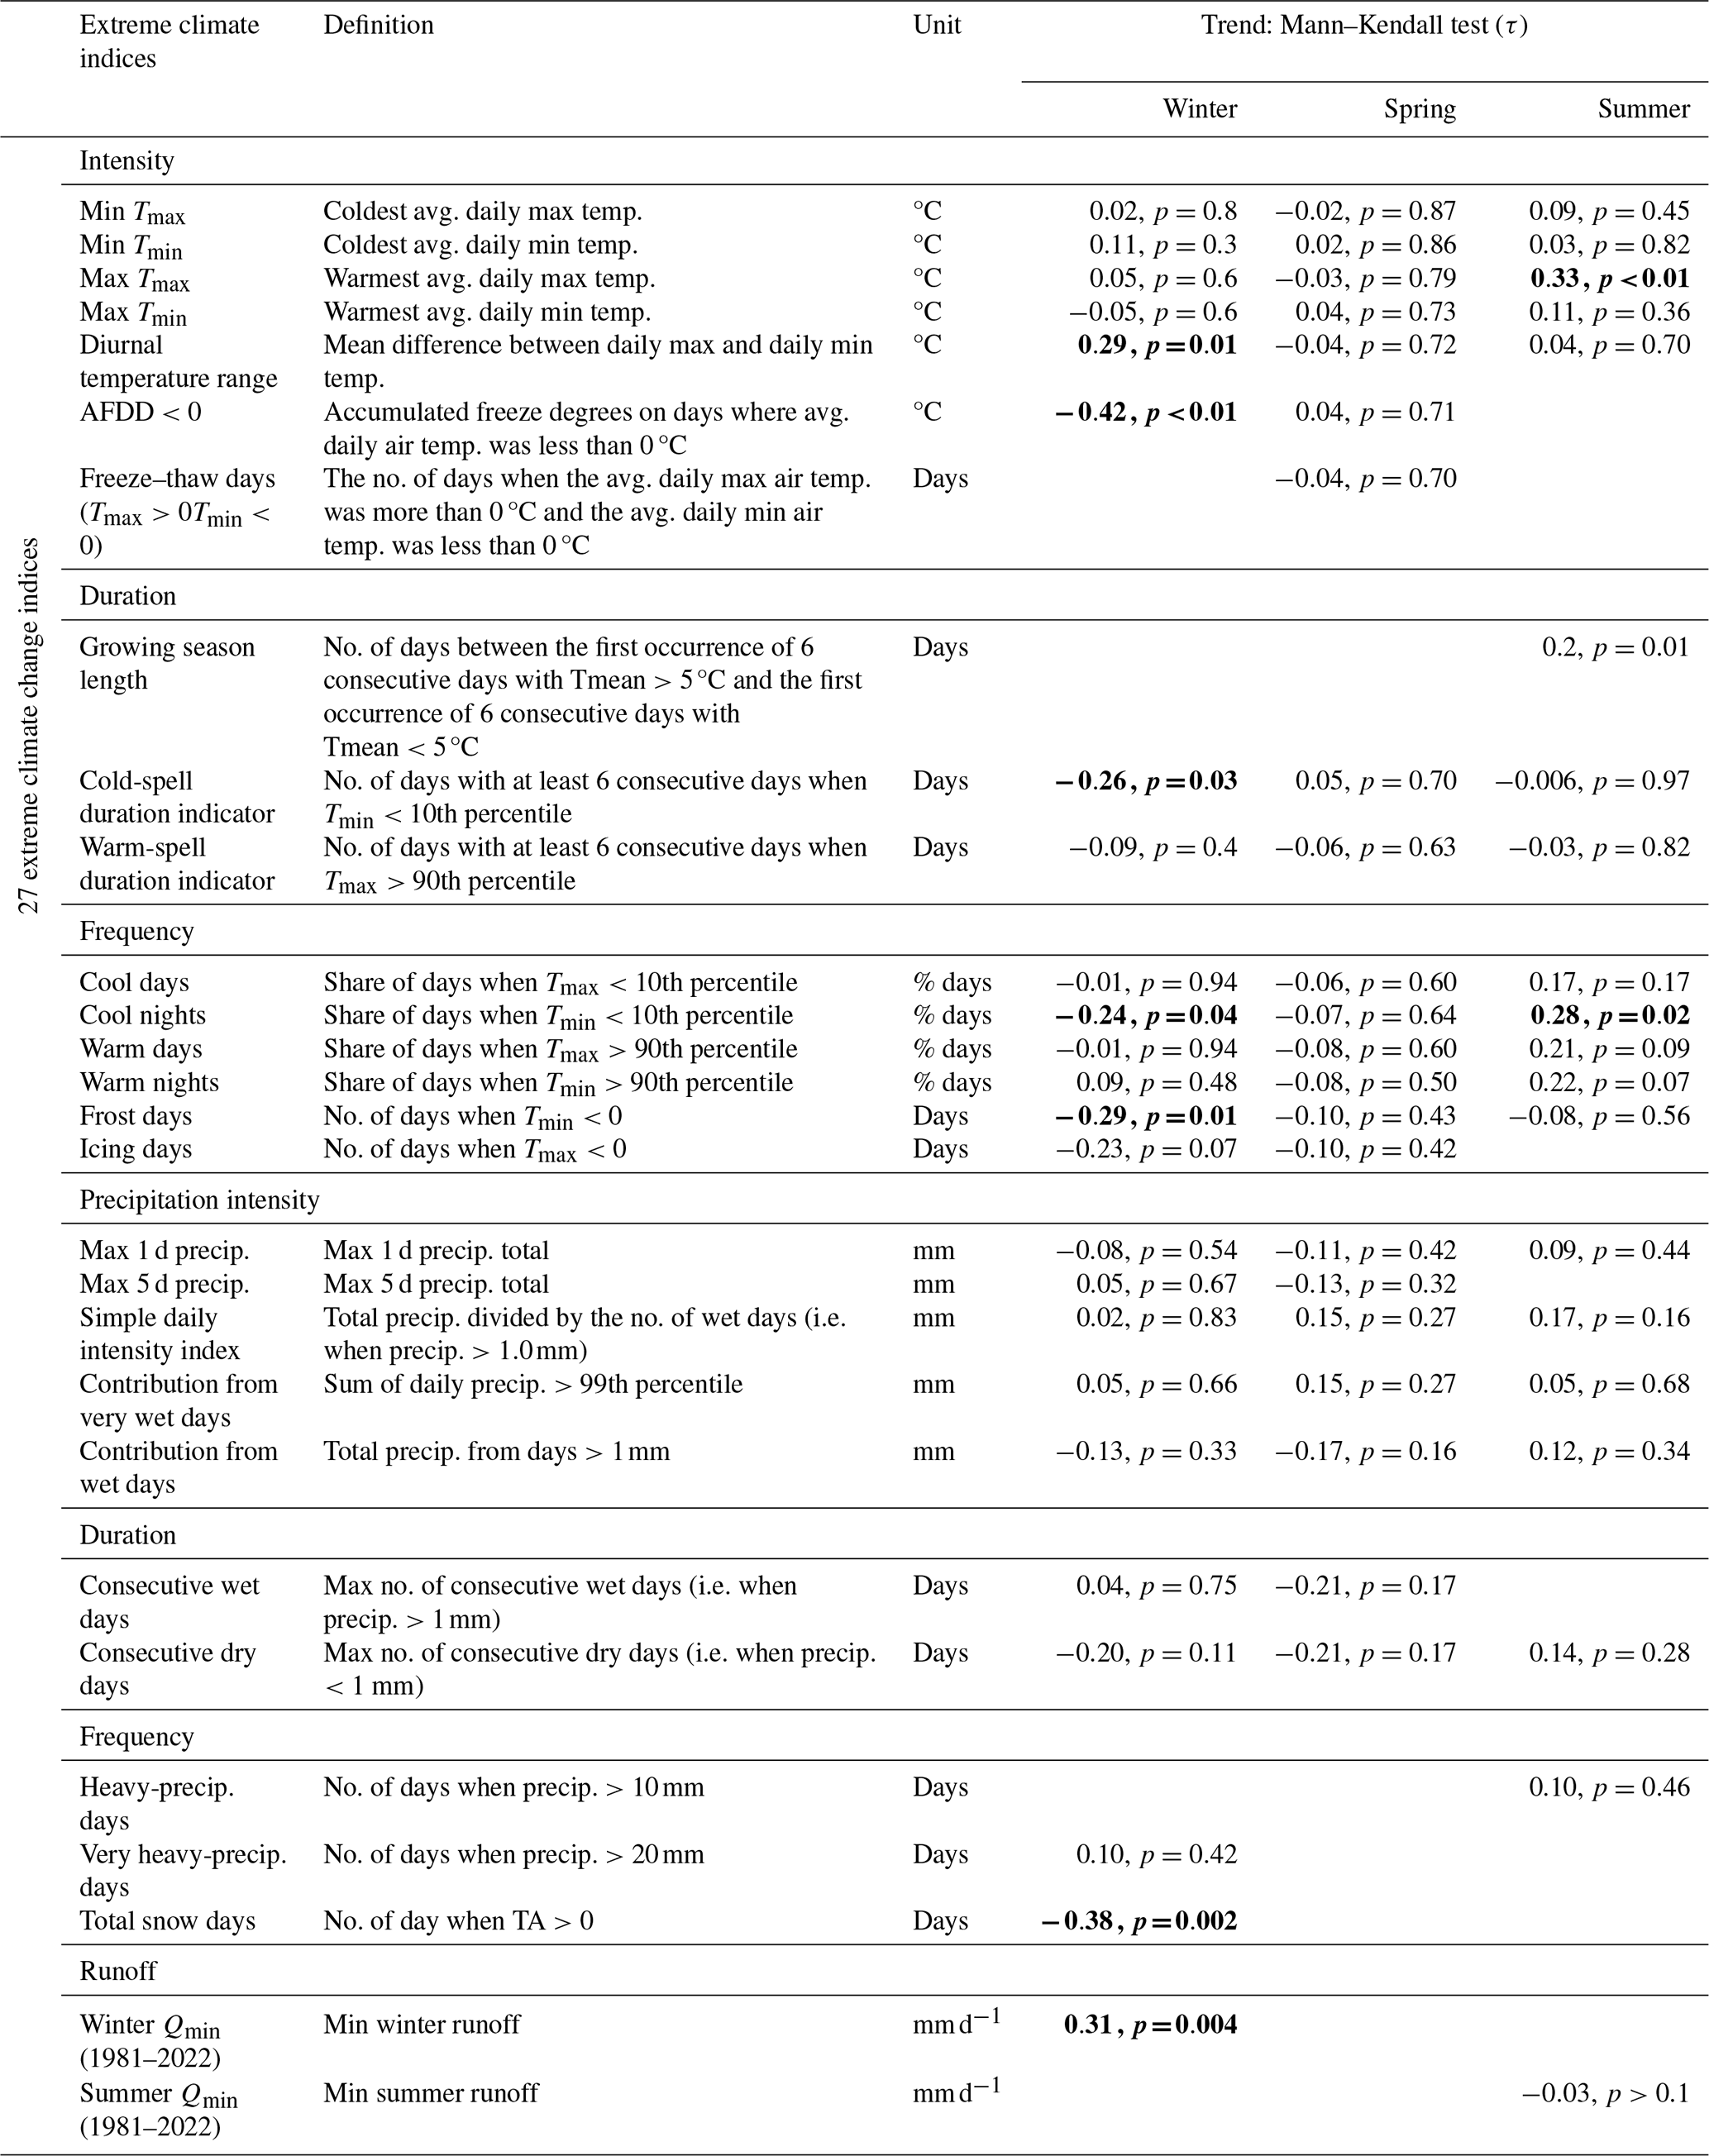
3.3 Extreme climate indices
Trends in extreme indices during the winter suggest that winters are becoming warmer, with significant changes in the diurnal temperature range, AFDD<0, cold-spell durations, cool nights, frost days, and total snow days (Table 1). The extreme climate change indices during spring showed no significant trends (p>0.05) across the 30-year period. Analysis of summer seasons showed significant increases (p<0.05) in the MaxTmax (warmest average daily maximum temperatures) and growing season length (Table 1 and Fig. S6 in the Supplement). No significant increase in precipitation indices was found during summer.
3.4 Variability in seasonal runoff data
Looking at the runoff time series between 1982–2022, we observed similar increases in winter trends in Qmin (τ=0.3, p<0.01). Winter Qmin varied between 0.001–0.05 mm d−1, where runoff ranged between 0.1 and 1.1 mm d−1 on average. The lowest runoff was recorded in 1996, and the highest runoff was recorded in 2007 (Fig. 5c). During the summer, the minimum trends in runoff also decreased (, p=0.14), with average daily runoff varying from 0.13–2.45 mm d−1. Daily minimums varied from 0.01–0.4 mm d−1, while maximum runoff during the summers varied from 0.8–21.9 mm d−1. The driest years were recorded in 2006, where the average daily minimum was 0.03 mm d−1, and the wettest years were recorded in 1993, where the average daily minimum was 0.42 mm d−1 (Fig. 5d).
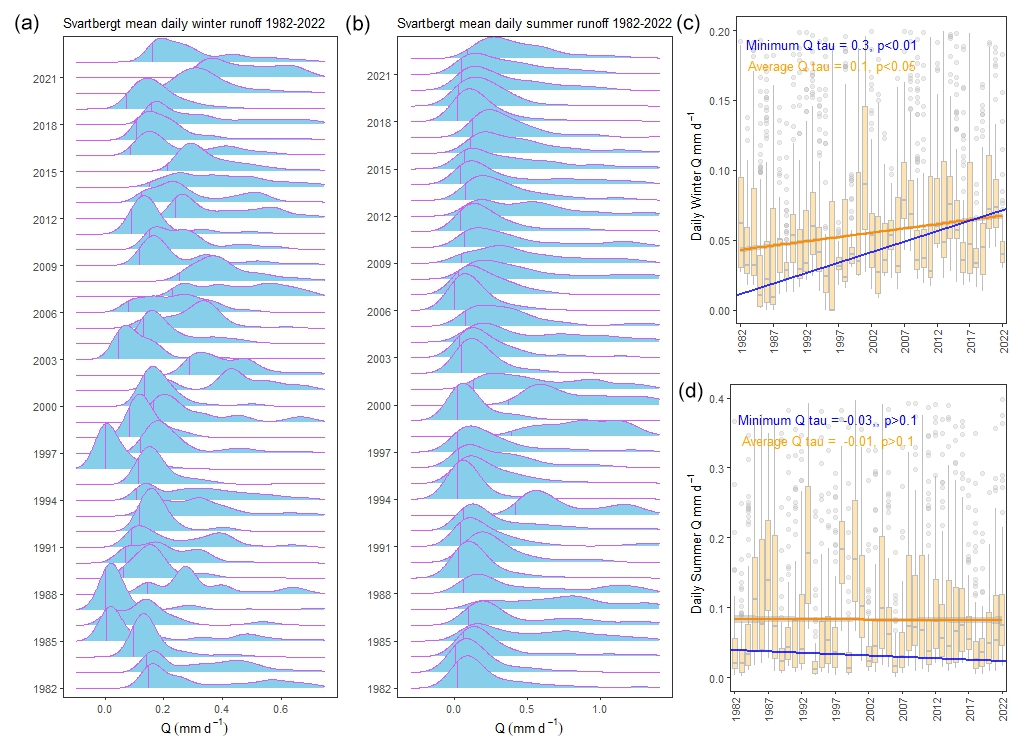
Figure 5Variability in seasonal runoff, showing hydrographs during the winter (a) and summer (b) in the C7 catchment. The minimum flows in each year during the winter and summer are identified as vertical lines each year. The annual variability of winter runoff is shown as boxplots (c) and trends in minimum (blue line) and average (orange) runoff across the years. In panel (d), the boxplots show the annual variability of summer runoff and trends in minimum (blue line) and average (orange) runoff across the years.
3.5 Model of changes in runoff
To understand which hydroclimatic variable drove the minimum runoff during the winter and summer seasons, we use a stepwise linear regression analysis to identify the best explanatory climate variables of the succeeding season for runoff in Minitab statistical software 17. A trend detection test was first performed in R to determine if there was a significant trend in each seasonal dataset using the trend package and Mann–Kendall trend test. Only the extreme climate variables that showed a significant trend (p<0.05) were used in the seasonal runoff regression models.
From this analysis, we found that the winter accumulated degree days below zero (AFDD<0) were the best explanatory variable of Qmin during the winter (r2=0.44, p<0.05, W_Qmin=1.26–0.0065 AFDD<0) (Table S1). The analysis showed that winters with fewer AFDD<0 (warmer winters, e.g. 2014 when AFDD was 1053 °C) were associated with higher winter Qmin (0.2 mm d−1), while winters with more AFDD<0 (cold winters, e.g. 1994 when AFDD was −2138 °C) showed low winter Qmin (0.1 mm d−1) (Fig. 6a). The best explanatory factor of runoff variability in summer Qmin was a multivariate model (S_Qmin=0.3–0.007 ), which included winter variables W_AFDD<0 and summer MaxTmax (r2=0.45, p<0.05), as found from the stepwise linear regression model. The 3 years of 1993, 1998, and 2000 were the largest outliers in the model because these were the wettest years when minimum runoff was above 0.35 mm d−1 (Fig. 6b).
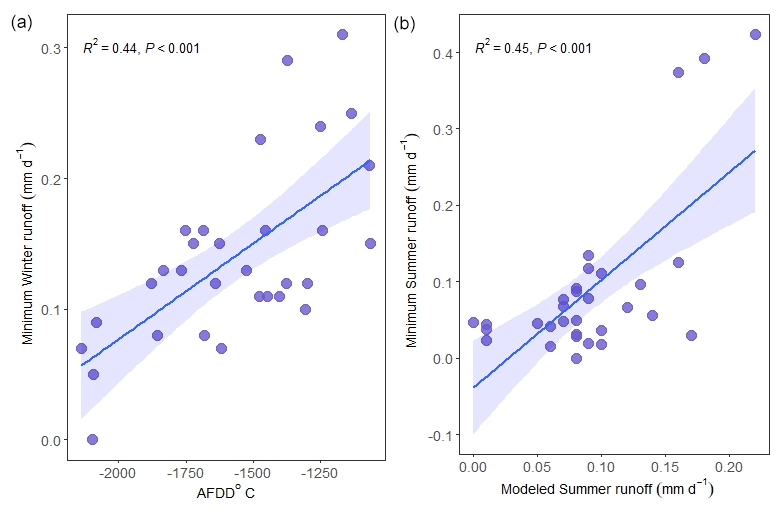
Figure 6The best explanatory climate indices of winter minimum runoff (Qmin) were the accumulated freeze degree days below zero (AFDD<0) (W_Qmin=1.26–0.0065 AFDD<0) for the winter and the summer (S_Qmin=0.3–0.007 ). The standard error in each dataset is represented by the blue shading.
3.6 Isotope analysis using the season origin index (SOI)
To test if the changes in runoff identified during the winter and summer seasonal analysis of Qmin could be explained by the contribution of seasonal precipitation to streamflow, we use the SOI analysis to further understand observed trends. This analysis showed that the SOI in the C7 catchment showed strong seasonality across the years when looking at monthly variability. In the colder months, SOI averaged −0.5 in December, January, and February, while in the warmer months, averages increased to 0.5 in June, July, and August (Fig. 7a). A closer look at the winter SOI in January showed that a greater fraction of the winter precipitation was represented in the streamflow across time, as indicated by the SOI values shifting closer to −1 (typical of mid-winter precipitation) (Fig. 7b). This corresponded with the higher Qmin during the winter identified using the runoff analysis. The SOI in the summer (July) increased closer to 1 (typical of midsummer precipitation), indicating that a larger fraction of summer precipitation in later years became streamflow relative to the total precipitation, suggesting a shift away from the mid-winter signal (−1) (Fig. 7c). This infers a lower contribution of winter precipitation to summer streamflow, corresponding to the decreasing trends in Qmin during the summer identified using the Qmin trend analysis.
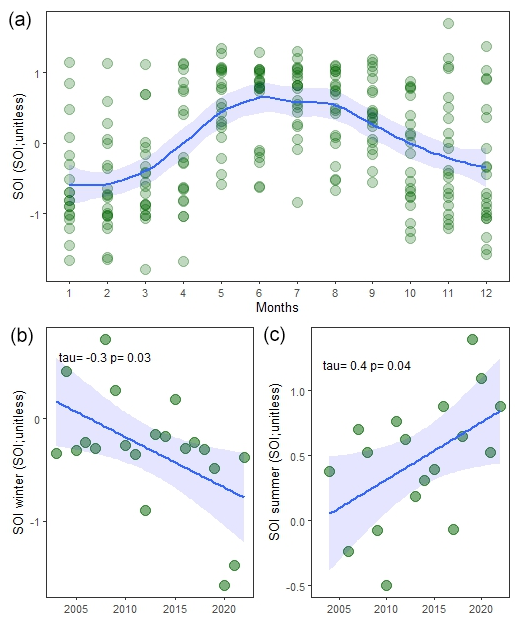
Figure 7Variability in season origin index (SOI) daily values from 2003–2022 in the C7 catchment, with a loss curve (blue) representing average monthly SOI values (a). The fraction of mid-winter precipitation and midsummer precipitation that becomes streamflow each year is shown in panels (b) and (c) fitted with linear regression.
Analysis of extreme climate indices over the past 40 years in the boreal Krycklan Catchment has shown that the most pronounced changes occurred in the winter, where warmer winters have increased minimum runoff quantities, which resulted in an exhaustion of water left for baseflow in the succeeding summers. The changes in runoff during the winter and summer are further supported by isotope analysis that shows an increasing contribution of winter precipitation to winter runoff and a decreasing contribution to summer runoff. These results, based on a 40-year time series, are consistent with a longer-term trend dating back to 1891 from a nearby meteorological station (Stensele), which shows an acceleration, particularly in the last few decades (Figs. 2a, 4a and b). Nevertheless, the 40-year time series of both meteorological and hydrological data allowed for the study of the effects of changing seasonal hydroclimatic variables on runoff in ways that previously had not been possible. The findings presented in this study suggest that warmer winter climates provide direct feedback on the hydrological flow regime with consequential changes to the seasonal distribution of water in the catchment linked to the inferred change in water storage. This reconfiguration of flow pathways may reduce subsurface water storage capacity, with potential consequences for aquatic ecosystems, soil moisture retention, and the resilience of water supplies during dry periods.
In boreal catchments, snowpack typically acts as a natural reservoir, accumulating water through the winter and gradually releasing it during the spring melt (Trenberth, 2011). Under historically colder conditions, this process ensured a slow recharge of both surface and subsurface waters. However, our results show a shift towards warmer winter conditions, as evidenced by six temperature- and snow-related climate indices (Table 1 and Fig. S6). This warming corresponds to a significant reduction in the number of snow days and increased frequency of mid-winter thaw periods, consistent with regional and global studies (Sillmann et al., 2013; Easterling et al., 2016). Isotopic analysis of δ18O further confirmed that the increased winter Qmin is not primarily driven by higher total winter precipitation but rather by enhanced mid-winter snowmelt, which rapidly delivers precipitation to streamflow instead of storing it as snow. Supporting this, three supplementary analyses found no significant relationship between autumn conditions and mid-winter runoff (Fig. S4), suggesting that the dominant control is winter temperature, not antecedent moisture conditions. The results indicate a climatic shift in hydrological partitioning, favouring rapid surface runoff over groundwater recharge and sustained summer streamflow.
Modelling the winter Qmin runoff using a stepwise linear regression showed that the best predictor was AFDD<0 (Fig. 6a), which illustrated that warm winters with lower AFDD<0 had higher winter Qmin compared to the years with colder winters. These results can be explained by an increase in the frequency of mild (>0 °C) periods and/or induced mid-winter snowmelt, as suggested by Laternser and Schneebeli (2003), as compared to colder winters that produce deeper snow cover and delayed snowmelt (Rixen et al., 2022; Bokhorst et al., 2016). A similar increase in winter runoff has also been recorded in Finland (Rutgersson et al., 2022; Kasvi et al., 2019) and in southern Sweden, with earlier lake ice break-up (58 %) between 1913–2014 (Arheimer and Lindström, 2015; Hallerbäck et al., 2022). The consequences of warmer winters have already been found to reduce soil frost (Friesen et al., 2021; Girardin et al., 2022; Easterling, 2002), alter stream runoff, and change the timing of succeeding spring floods (Breton et al., 2022; Blöschl et al., 2017). If such conditions become more frequent, future changes in the magnitude and intensity of flooding caused by rapid snowmelt due to warmer winters could increase economic uncertainties for vulnerable areas and infrastructures (Tabari, 2020; Nasr et al., 2021) should these events become more prevalent.
The best model of summer Qmin runoff was a multiple regression of two indices (winter AFDD<0 and summer MaxTmax) (r2=0.45, p<0.05) (Fig. 6b), indicating that both warmer winters and warm/dry summer conditions affect low runoff in the summer. This is in line with previous research that showed the importance of antecedent hydroclimatic conditions in explaining the inter-annual variability in summer runoff (Earman et al., 2006; Beaulieu et al., 2012; Van Loon and Laaha, 2015; Dubois et al., 2022; Kinnard et al., 2022). Analysis of the SOI based on δ18O data showed a distinction between summer and winter values (Fig. 7a). Based on summer SOI values from 2002–2022, we observed increasing positive values across time, indicating a reduction in winter precipitation in summer streamflow (Fig. 7c). The trajectory of decreasing winter precipitation infers that there is reduced contribution from winter/spring groundwater recharge in summer stream runoff. The physical mechanism that facilitates this could be related to mid-winter snowmelt, where a greater proportion of snow melts during winter, which shifts the seasonality of winter streamflow to an enhanced winter precipitation signal (Fig. 7b), resulting in less water available for aquifer recharge, as seen across other cold regions (Jenicek et al., 2016; Teutschbein et al., 2022; Boumaiza et al., 2020). With the higher rates of evapotranspiration observed across the years (Fig. 3a), warm winters together with high summer temperatures intensify the magnitude of low flows in boreal catchments. While these findings highlight the vulnerability of groundwater resources in Fennoscandia to changes in winter and summer climate conditions, they call for a deeper understanding of how the changes in the magnitude, intensity, and frequency of other hydrological events will be affected in the future.
To understand whether the observed climate change in this study was driven by much larger climate systems, we investigated the effects of the North Atlantic Oscillation (NAO) index on the winter and summer conditions (Fig. S7 in the Supplement). While previous studies have shown a connection between the NOA (Ulén et al., 2019) and the Atlantic Meridonal Overturning Circulation (AMOC) (Schenk et al., 2018) to winter climate conditions (winter temperature, precipitation, snow accumulation, frozen soil) in southern Sweden and along the coast of Norway, no such effects have, to the best of our knowledge, previously been reported related to the climate in the north. However, using the NAO index (https://www.ncei.noaa.gov/access/monitoring/nao/, last access: 15 February 2025) to test the correlation with seasonal hydroclimatic variables from the Krycklan Catchment, we found significant correlations with four winter indices (average winter temperature, Tmin, cold spells, and warm spells) and four summer temperature extreme indices (average summer temperature, Tmax, summer cold spells, and summer cold days) (Fig. S7). These results suggest the observed changes in winter and summer climate could be related to the much larger regional NAO system, which in turn can be key to understanding the mechanism regulating winter runoff processes.
The findings of this study emphasize the substantial implications of warm winters for hydrological processes within boreal catchments. Specifically, the observed increase in winter runoff, coupled with the altered timing and magnitude of the cold season, signals significant changes in water storage and redistribution over the course of the year. Notably, the intensified mid-winter snowmelt events appear to reduce the snowpack that would otherwise contribute to spring runoff and groundwater recharge, diminishing water availability during the critical summer months when baseflow and groundwater are most critical (Nygren et al., 2020; Klove et al., 2017; Jasechko et al., 2017). A higher risk of hydrological droughts could occur where deficits in both surface and subsurface water coincide, resulting in stronger impacts on biophysical conditions and biogeochemical processes (Teutschbein et al., 2022; Bouchard et al., 2024; Blahušiaková et al., 2020) and hence aquatic organisms (Kreyling et al., 2019; Williams et al., 2015). While the isotopic analysis confirmed shifts in the relative contributions of winter precipitation to streamflow, it also highlighted the complexity of these processes. The increased winter runoff does not directly correlate with increased winter precipitation, suggesting that warmer winter temperatures and mid-winter snowmelt are the primary drivers of these changes. These results point to the potential for more frequent and severe hydrological extremes, such as flooding from rapid snowmelt combined with rain on snow in winter and water scarcity in summer, as winter warming intensifies. During the low-flow regime, the strong control of stream temperature affects life in aquatic ecosystems and the water availability for drinking and irrigation purposes, exacerbating low reservoir levels and decreasing hydropower generation (Dierauer et al., 2018). Other implications of warmer winters and summer processes have already been shown to affect net ecosystem exchange (NEE) (Monson et al., 2005), water table depth (Dao et al., 2024; Nygren et al., 2021; Dubois et al., 2022), ecological processes (Hrycik et al., 2021), and tree growth decline (Laudon et al., 2024). While higher winter runoff moderates snowmelt-related flooding (Blöschl et al., 2017; Irannezhad et al., 2022), lower groundwater recharge can result in drier summer landscapes with severe consequences for wildfire activity (Westerling et al., 2006), tree mortality (Sterck et al., 2024), ecosystem stress (Hatchett and Mcevoy, 2018), and carbon uptake (Van Der Woude et al., 2023). These implications underscore the urgent need for further research on how changes in seasonal runoff dynamics, driven by broader climatic factors like the NAO, will impact regional water resources and ecosystem functions in the future.
In this study, we found significant trends in many warming-related climate extreme indices over the last 4 decades during both winter and summer. The warming observed in the last 40 years corroborates with the longer 130-year time series that dates to the 1890s, showing progressive warming temperatures across time. Evaluating how these changes affect key hydrological processes during the same period, we observed higher runoff during the winter and decreasing runoff during the following summers. Using the significant trends in the extreme indices to evaluate the effects on catchment seasonal runoff, we found that winter variables were best at explaining winter minimum runoff, while winter and summer maximum temperatures could explain the changes observed in summer minimum runoff. These findings were supported by water isotopic analysis that showed an increasing seasonal origin index during the winter, indicating higher contributions of winter precipitation to winter runoff and, consequently, lower contributions of winter precipitation to summer runoff. With the decreased catchment water storage due to increased winter runoff before the occurrence of the true spring flood, the potential for maintaining summer baseflow runs the risk of being exhausted in the future, should warming trends persist. This work highlights the importance of understanding future hydroclimatic trends where changes in the seasonal distribution of water could further affect low-flow conditions, with implications for drought-related issues considering future climate change.
Runoff data, meteorological data, and isotope data for Svartberget can be downloaded from the SITES data portal (https://data.fieldsites.se/portal/, SITES, 2024). Long-term data from the Stensele station can be obtained from SMHI achieves. Codes used in the production of graphs and their associated files can be found on https://doi.org/10.6084/m9.figshare.27320538 (Tiwari, 2024).
The supplement related to this article is available online at https://doi.org/10.5194/hess-29-4055-2025-supplement.
HL developed the initial concept, assisted in the analysis of results, and created the first draft of the manuscript. TT processed the data, analysed the results, and wrote the first draft of the manuscript.
The contact author has declared that neither of the authors has any competing interests.
Publisher's note: Copernicus Publications remains neutral with regard to jurisdictional claims made in the text, published maps, institutional affiliations, or any other geographical representation in this paper. While Copernicus Publications makes every effort to include appropriate place names, the final responsibility lies with the authors.
This article is part of the special issue “Northern hydrology in transition – impacts of a changing cryosphere on water resources, ecosystems, and humans (TC/HESS inter-journal SI)”. It is not associated with a conference.
We would like to thank the staff from the SLU Unit for Field-based Forest Research for technical and logistical support.
This research has been supported by the Knut och Alice Wallenbergs Stiftelse (grant nos. 2018.0259 and 2023.0245).
The publication of this article was funded by the Swedish Research Council, Forte, Formas, and Vinnova.
This paper was edited by Laura Brown and reviewed by three anonymous referees.
Alexander, L. V., Zhang, X., Peterson, T. C., Caesar, J., Gleason, B., Tank, A. M. G. K., Haylock, M., Collins, D., Trewin, B., Rahimzadeh, F., Tagipour, A., Kumar, K. R., Revadekar, J., Griffiths, G., Vincent, L., Stephenson, D. B., Burn, J., Aguilar, E., Brunet, M., Taylor, M., New, M., Zhai, P., Rusticucci, M., and Vazquez-Aguirre, J. L.: Global observed changes in daily climate extremes of temperature and precipitation, J. Geophys. Res.-Atmos., 111, D05109, https://doi.org/10.1029/2005jd006290, 2006.
Ali, S., Basit, A., Umair, M., and Ni, J.: Impacts of climate and land coverage changes on potential evapotranspiration and its sensitivity on drought phenomena over South Asia, Int. J. Climatol., 44, 812–830, https://doi.org/10.1002/joc.8357, 2024.
Allen, J., von Freyberg, M., Weiler, G., Goldsmith, G. R., & Kirchner, J. W.: The seasonal origins of streamwater in Switzerland, Geophys. Res. Lett., 46, 10425–10434, https://doi.org/10.1029/2019GL084552, 2019.
Allen, J., and Sheridan, S. C.: Evaluating changes in season length, onset, and end dates across the United States (1948–2012), Int. J. Climatol., 36, 1268–1277, https://doi.org/10.1002/joc.4422, 2015.
Arheimer, B. and Lindström, G.: Climate impact on floods: changes in high flows in Sweden in the past and the future (1911–2100), Hydrol. Earth Syst. Sci., 19, 771–784, https://doi.org/10.5194/hess-19-771-2015, 2015.
Barnett, T. P., Adam, J. C., and Lettenmaier, D. P.: Potential impacts of a warming climate on water availability in snow-dominated regions, Nature, 438, 303–309, https://doi.org/10.1038/nature04141, 2005.
Beaulieu, M., Schreier, H., and Jost, G.: A shifting hydrological regime: a field investigation of snowmelt runoff processes and their connection to summer base flow, Sunshine Coast, British Columbia, Hydrol. Process., 26, 2672–2682, https://doi.org/10.1002/hyp.9404, 2012.
Blahušiaková, A., Matoušková, M., Jenicek, M., Ledvinka, O., Kliment, Z., Podolinská, J., and Snopková, Z.: Snow and climate trends and their impact on seasonal runoff and hydrological drought types in selected mountain catchments in Central Europe, Hydrolog. Sci. J., 65, 2083–2096, https://doi.org/10.1080/02626667.2020.1784900, 2020.
Blöschl, G., Hall, J., Parajka, J., Perdigao, R. A. P., Merz, B., Arheimer, B., Aronica, G. T., Bilibashi, A., Bonacci, O., Borga, M., Canjevac, I., Castellarin, A., Chirico, G. B., Claps, P., Fiala, K., Frolova, N., Gorbachova, L., Gül, A., Hannaford, J., Harrigan, S., Kireeva, M., Kiss, A., Kjeldsen, T. R., Kohnová, S., Koskela, J. J., Ledvinka, O., Macdonald, N., Mavrova-Guirguinova, M., Mediero, L., Merz, R., Molnar, P., Montanari, A., Murphy, C., Osuch, M., Ovcharuk, V., Radevski, I., Rogger, M., Salinas, J. L., Sauquet, E., Sraj, M., Szolgay, J., Viglione, A., Volpi, E., Wilson, D., Zaimi, K., and Zivkovic, N.: Changing climate shifts timing of European floods, Science, 357, 588–590, https://doi.org/10.1126/science.aan2506, 2017.
Bokhorst, S., Pedersen, S. H., Brucker, L., Anisimov, O., Bjerke, J. W., Brown, R. D., Ehrich, D., Essery, R. L. H., Heilig, A., Ingvander, S., Johansson, C., Johansson, M., Jónsdóttir, I. S., Inga, N., Luojus, K., Macelloni, G., Mariash, H., McLennan, D., Rosqvist, G. N., Sato, A., Savela, H., Schneebeli, M., Sokolov, A., Sokratov, S. A., Terzago, S., Vikhamar-Schuler, D., Williamson, S., Qiu, Y. B., and Callaghan, T. V.: Changing Arctic snow cover: A review of recent developments and assessment of future needs for observations, modelling, and impacts, Ambio, 45, 516–537, https://doi.org/10.1007/s13280-016-0770-0, 2016.
Bouchard, B., Nadeau, D. F., Domine, F., Anctil, F., Jonas, T., and Tremblay, É.: How does a warm and low-snow winter impact the snow cover dynamics in a humid and discontinuous boreal forest? Insights from observations and modeling in eastern Canada, Hydrol. Earth Syst. Sci., 28, 2745–2765, https://doi.org/10.5194/hess-28-2745-2024, 2024.
Boumaiza, L., Chesnaux, R., Walter, J., and Stumpp, C.: Assessing groundwater recharge and transpiration in a humid northern region dominated by snowmelt using vadose-zone depth profiles, Hydrogeol. J., 28, 2315–2329, https://doi.org/10.1007/s10040-020-02204-z, 2020.
Breton, F., Vrac, M., Yiou, P., Vaittinada Ayar, P., and Jézéquel, A.: Seasonal circulation regimes in the North Atlantic: Towards a new seasonality, Int. J. Climatol., 42, 5848–5870, https://doi.org/10.1002/joc.7565, 2022.
Cassou, C. and Cattiaux, J.: Disruption of the European climate seasonal clock in a warming world, Nat. Clim. Change, 6, 589–594, https://doi.org/10.1038/nclimate2969, 2016.
Chi, J. S., Nilsson, M. B., Laudon, H., Lindroth, A., Wallerman, J., Fransson, J. E. S., Kljun, N., Lundmark, T., Löfvenius, M. O., and Peichl, M.: The Net Landscape Carbon Balance-Integrating terrestrial and aquatic carbon fluxes in a managed boreal forest landscape in Sweden, Glob. Change Biol., 26, 2353–2367, https://doi.org/10.1111/gcb.14983, 2020.
Cleland, E. E., Chuine, I., Menzel, A., Mooney, H. A., and Schwartz, M. D.: Shifting plant phenology in response to global change, Trends Ecol. Evol., 22, 357–365, https://doi.org/10.1016/j.tree.2007.04.003, 2007.
Cohen, J., Screen, J. A., Furtado, J. C., Barlow, M., Whittleston, D., Coumou, D., Francis, J., Dethloff, K., Entekhabi, D., Overland, J., and Jones, J.: Recent Arctic amplification and extreme mid-latitude weather, Nat. Geosci., 7, 627–637, https://doi.org/10.1038/ngeo2234, 2014.
Contosta, A. R., Casson, N. J., Nelson, S. J., and Garlick, S.: Defining frigid winter illuminates its loss across seasonally snow-covered areas of eastern North America, Environ. Res. Lett., 15, 034027, https://doi.org/10.1088/1748-9326/ab54f3, 2020.
Coplen, T. B.: New Iupac Guidelines for the Reporting of Stable Hydrogen, Carbon, and Oxygen Isotope-Ratio Data, J. Res. Natl. Inst. Stan., 100, 285–285, https://doi.org/10.6028/jres.100.021, 1995.
Dao, P. U., Heuzard, A. G., Le, T. X. H., Zhao, J., Yin, R., Shang, C., and Fan, C. H.: The impacts of climate change on groundwater quality: A review, Sci. Total Environ., 912, 169241, https://doi.org/10.1016/j.scitotenv.2023.169241, 2024.
Dierauer, J. R., Whitfield, P. H., and Allen, D. M.: Climate Controls on Runoff and Low Flows in Mountain Catchments of Western North America, Water Resour. Res., 54, 7495–7510, https://doi.org/10.1029/2018wr023087, 2018.
Donat, M. G., Sillmann, J., and Fischer, E. M.: Changes in climate extremes in observations and climate model simulations. From the past to the future, Climate Extremes and Their Implications for Impact and Risk Assessment, 31–57, https://doi.org/10.1016/B978-0-12-814895-2.00003-3, 2020.
Druckenmiller, M. L., Moon, T., and Thoman, R.: The Arctic, B. Am. Meteorol. Soc., 102, S263–S315, https://doi.org/10.1175/Bams-D-21-0086.1, 2021.
Dubois, E., Larocque, M., Gagné, S., and Braun, M.: Climate Change Impacts on Groundwater Recharge in Cold and Humid Climates: Controlling Processes and Thresholds, Climate, 10, 6, https://doi.org/10.3390/cli10010006, 2022.
Earman, S., Campbell, A. R., Phillips, F. M., and Newman, B. D.: Isotopic exchange between snow and atmospheric water vapor: Estimation of the snowmelt component of groundwater recharge in the southwestern United States, J. Geophys. Res.-Atmos., 111, D09109, https://doi.org/10.1029/2005jd006470, 2006.
Easterling, D. R.: Recent changes in frost days and the frost-free season in the United States, B. Am. Meteorol. Soc., 83, 1327–1332, https://doi.org/10.1175/1520-0477-83.9.1327, 2002.
Easterling, D. R., Kunkel, K. E., Wehner, M. E., and Sun, L. Q.: Detection and attribution of climate extremes in the observed record, Weather Clim. Extreme, 11, 17–27, https://doi.org/10.1016/j.wace.2016.01.001, 2016.
Friesen, H. C., Slesak, R. A., Karwan, D. L., and Kolka, R. K.: Effects of snow and climate on soil temperature and frost development in forested peatlands in minnesota, USA, Geoderma, 394, 115015, https://doi.org/10.1016/j.geoderma.2021.115015, 2021.
Fu, W., Tian, L., Tao, Y., Li, M., and Guo, H.: Spatiotemporal changes in the boreal forest in Siberia over the period 1985–2015 against the background of climate change, Earth Syst. Dynam., 14, 223–239, https://doi.org/10.5194/esd-14-223-2023, 2023.
Girardin, M. P., Guo, J., Gervais, D., Metsaranta, J., Campbell, E. M., Arsenault, A., Isaac-Renton, M., and Hogg, E. H.: Cold-season freeze frequency is a pervasive driver of subcontinental forest growth, P. Natl. Acad. Sci. USA, 119, 18, https://doi.org/10.1073/pnas.2117464119, 2022.
Hallerbäck, S., Huning, L. S., Love, C., Persson, M., Stensen, K., Gustafsson, D., and AghaKouchak, A.: Climate warming shortens ice durations and alters freeze and break-up patterns in Swedish water bodies, The Cryosphere, 16, 2493–2503, https://doi.org/10.5194/tc-16-2493-2022, 2022.
Hatchett, B. J. and McEvoy, D. J.: Exploring the Origins of Snow Drought in the Northern Sierra Nevada, California, Earth Interact., 22, 1–19, https://doi.org/10.1175/Ei-D-17-0027.1, 2018.
Hekmatzadeh, A. A., Kaboli, S., and Torabi Haghighi, A.: New indices for assessing changes in seasons and in timing characteristics of air temperature, Theor. Appl. Climatol., 140, 1247–1261, https://doi.org/10.1007/s00704-020-03156-w, 2020.
Hrycik, A. R., Isles, P. D. F., Adrian, R., Albright, M., Bacon, L. C., Berger, S. A., Bhattacharya, R., Grossart, H. P., Hejzlar, J., Hetherington, A. L., Knoll, L. B., Laas, A., McDonald, C. P., Merrell, K., Nejstgaard, J. C., Nelson, K., Noges, P., Paterson, A. M., Pilla, R. M., Robertson, D. M., Rudstam, L. G., Rusak, J. A., Sadro, S., Silow, E. A., Stockwell, J. D., Yao, H., Yokota, K., and Pierson, D. C.: Earlier winter/spring runoff and snowmelt during warmer winters lead to lower summer chlorophyll-a in north temperate lakes, Glob. Change Biol., 27, 4615–4629, https://doi.org/10.1111/gcb.15797, 2021.
Hrycik, A. R., Isles, P. D. F., Pierson, D. C., and Stockwell, J. D.: Winter/Spring Runoff Is Earlier, More Protracted, and Increasing in Volume in the Laurentian Great Lakes Basin, Water Resour. Res., 60, 3, https://doi.org/10.1029/2023wr035773, 2024.
Huschke, R. E.: Glossary of meteorology, American Meteorological Society, Boston, ISBN 9780933876354, 1959.
Irannezhad, M., Ahmadian, S., Sadeqi, A., Minaei, M., Ahmadi, B., and Marttila, H.: Peak Spring Flood Discharge Magnitude and Timing in Natural Rivers across Northern Finland: Long-Term Variability, Trends, and Links to Climate Teleconnections, Water, 14, 81312, https://doi.org/10.3390/w14081312, 2022.
Jasechko, S., Wassenaar, L. I., and Mayer, B.: Isotopic evidence for widespread cold-season-biased groundwater recharge and young streamflow across central Canada, Hydrol. Process., 31, 2196–2209, https://doi.org/10.1002/hyp.11175, 2017.
Jenicek, M., Seibert, J., Zappa, M., Staudinger, M., and Jonas, T.: Importance of maximum snow accumulation for summer low flows in humid catchments, Hydrol. Earth Syst. Sci., 20, 859–874, https://doi.org/10.5194/hess-20-859-2016, 2016.
Karimi, S., Seibert, J., and Laudon, H.: Evaluating the effects of alternative model structures on dynamic storage simulation in heterogeneous boreal catchments, Hydrol. Res., 53, 562–583, https://doi.org/10.2166/nh.2022.121, 2022.
Karlsen, R. H., Grabs, T., Bishop, K., Buffam, I., Laudon, H., and Seibert, J.: Landscape controls on spatiotemporal discharge variability in a boreal catchment, Water Resour. Res., 52, 6541–6556, https://doi.org/10.1002/2016wr019186, 2016.
Kasvi, E., Lotsari, E., Kumpumäki, M., Dubrovin, T., and Veijalainen, N.: Effects of Climate Change and Flow Regulation on the Flow Characteristics of a Low-Relief River within Southern Boreal Climate Area, Water, 11, 1827, https://doi.org/10.3390/w11091827, 2019.
Kim, Y., Kimball, J. S., Zhang, K., and McDonald, K. C.: Satellite detection of increasing Northern Hemisphere non-frozen seasons from 1979 to 2008: Implications for regional vegetation growth, Remote Sens. Environ., 121, 472–487, https://doi.org/10.1016/j.rse.2012.02.014, 2012.
Kinnard, C., Bzeouich, G., and Assani, A.: Impacts of summer and winter conditions on summer river low flows in low elevation, snow-affected catchments, J. Hydrol., 605, 127393, https://doi.org/10.1016/j.jhydrol.2021.127393, 2022.
Klove, B., Kvitsand, H. M. L., Pitkanen, T., Gunnarsdottir, M. J., Gaut, S., Gardarsson, S. M., Rossi, P. M., and Miettinen, I.: Overview of groundwater sources and water-supply systems, and associated microbial pollution, in Finland, Norway and Iceland, Hydrogeol. J., 25, 1033–1044, https://doi.org/10.1007/s10040-017-1552-x, 2017.
Kreyling, J., Grant, K., Hammerl, V., Arfin-Khan, M. A. S., Malyshev, A. V., Peñuelas, J., Pritsch, K., Sardans, J., Schloter, M., Schuerings, J., Jentsch, A., and Beierkuhnlein, C.: Winter warming is ecologically more relevant than summer warming in a cool-temperate grassland, Sci. Rep.-UK, 9, 16031, https://doi.org/10.1038/s41598-019-51221-w, 2019.
Laternser, M. and Schneebeli, M.: Long-term snow climate trends of the Swiss Alps (1931–99), Int. J. Climatol., 23, 733–750, https://doi.org/10.1002/joc.912, 2003.
Laudon, H. and Sponseller, R. A.: How landscape organization and scale shape catchment hydrology and biogeochemistry: insights from a long-term catchment study, Wires Water, 5, e1265, https://doi.org/10.1002/wat2.1265, 2018.
Laudon, H., Seibert, J., Köhler, S., and Bishop, K.: Hydrological flow paths during snowmelt: Congruence between hydrometric measurements and oxygen 18 in meltwater, soil water, and runoff, Water Resour. Res., 40, W03107, https://doi.org/10.1029/2003wr002455, 2004.
Laudon, H., Tetzlaff, D., Soulsby, C., Carey, S., Seibert, J., Buttle, J., Shanley, J., McDonnell, J. J., and McGuire, K.: Change in winter climate will affect dissolved organic carbon and water fluxes in mid-to-high latitude catchments, Hydrol. Process., 27, 700–709, https://doi.org/10.1002/hyp.9686, 2013.
Laudon, H., Hasselquist, E. M., Peichl, M., Lindgren, K., Sponseller, R., Lidman, F., Kuglerová, L., Hasselquist, N. J., Bishop, K., Nilsson, M. B., and Ågren, A. M.: Northern landscapes in transition: Evidence, approach and ways forward using the Krycklan Catchment Study, Hydrol. Process., 35, e14170, https://doi.org/10.1002/hyp.14170, 2021.
Laudon, H., Mensah, A. A., Fridman, J., Nasholm, T., and Jamtgard, S.: Swedish forest growth decline: A consequence of climate warming?, Forest Ecol. Manag., 565, 122052, https://doi.org/10.1016/j.foreco.2024.122052, 2024.
Moberg, A., Jones, P. D., Lister, D., Walther, A., Brunet, M., Jacobeit, J., Alexander, L. V., Della-Marta, P. M., Luterbacher, J., Yiou, P., Chen, D., Klein Tank, A. M. G., Saladié, O., Sigró, J., Aguilar, E., Alexandersson, H., Almarza, C., Auer, I., Barriendos, M., Begert, M., Bergström, H., Böhm, R., Butler, C. J., Caesar, J., Drebs, A., Founda, D., Gerstengarbe, F. W., Micela, G., Maugeri, M., Österle, H., Pandzic, K., Petrakis, M., Srnec, L., Tolasz, R., Tuomenvirta, H., Werner, P. C., Linderholm, H., Philipp, A., Wanner, H., and Xoplaki, E.: Indices for daily temperature and precipitation extremes in Europe analyzed for the period 1901–2000, J. Geophys. Res.-Atmos., 111, D22106, https://doi.org/10.1029/2006jd007103, 2006.
Monson, R. K., Sparks, J. P., Rosenstiel, T. N., Scott-Denton, L. E., Huxman, T. E., Harley, P. C., Turnipseed, A. A., Burns, S. P., Backlund, B., and Hu, J.: Climatic influences on net ecosystem CO exchange during the transition from wintertime carbon source to springtime carbon sink in a high-elevation, subalpine forest, Oecologia, 146, 130–147, https://doi.org/10.1007/s00442-005-0169-2, 2005.
Murray, J., Ayers, J., and Brookfield, A.: The impact of climate change on monthly baseflow trends across Canada, J. Hydrol., 618, 129254, https://doi.org/10.1016/j.jhydrol.2023.129254, 2023.
Nasr, A., Björnsson, I., Honfi, D., Ivanov, O. L., Johansson, J., and Kjellström, E.: A review of the potential impacts of climate change on the safety and performance of bridges, Sustain. Resil. Infras., 6, 192–212, https://doi.org/10.1080/23789689.2019.1593003, 2021.
Nygren, M., Giese, M., Kløve, B., Haaf, E., Rossi, P. M., and Barthel, R.: Changes in seasonality of groundwater level fluctuations in a temperate-cold climate transition zone, J. Hydrol., X, 8, https://doi.org/10.1016/j.hydroa.2020.100062, 2020.
Nygren, M., Giese, M., and Barthel, R.: Recent trends in hydroclimate and groundwater levels in a region with seasonal frost cover, J. Hydrol., 602, 126732, https://doi.org/10.1016/j.jhydrol.2021.126732, 2021.
Park, B.-J., Min, S.-K., and Weller, E.: Lengthening of summer season over the Northern Hemisphere under 1.5 °C and 2.0 °C global warming, Environ. Res. Lett., 17, 014008, https://doi.org/10.1088/1748-9326/ac3f64, 2021.
Peng, S. S., Piao, S. L., Ciais, P., Friedlingstein, P., Zhou, L. M., and Wang, T.: Change in snow phenology and its potential feedback to temperature in the Northern Hemisphere over the last three decades, Environ. Res. Lett., 8, 014008, https://doi.org/10.1088/1748-9326/8/1/014008, 2013.
Peralta-Tapia, A., Soulsby, C., Tetzlaff, D., Sponseller, R., Bishop, K., and Laudon, H.: Hydroclimatic influences on non-stationary transit time distributions in a boreal headwater catchment, J. Hydrol., 543, 7–16, https://doi.org/10.1016/j.jhydrol.2016.01.079, 2016.
R Core Team: R: A language and environment for statistical computing. R Foundation for Statistical Computing, https://www.R-project.org/, 2021.
Rantanen, M., Karpechko, A. Y., Lipponen, A., Nordling, K., Hyvärinen, O., Ruosteenoja, K., Vihma, T., and Laaksonen, A.: The Arctic has warmed nearly four times faster than the globe since 1979, Commun. Earth Environ., 3, 102, https://doi.org/10.1038/s43247-022-00498-3, 2022.
Reeves, J., Chen, J., Wang, X. L. L., Lund, R., and Lu, Q. Q.: A review and comparison of changepoint detection techniques for climate data, J. Appl. Meteorol. Clim., 46, 900–915, https://doi.org/10.1175/Jam2493.1, 2007.
Rixen, C., Hoye, T. T., Macek, P., Aerts, R., Alatalo, J. M., Anderson, J. T., Arnold, P. A., Barrio, I. C., Bjerke, J. W., Björkman, M. P., Blok, D., Blume-Werry, G., Boike, J., Bokhorst, S., Carbognani, M., Christiansen, C. T., Convey, P., Cooper, E. J., Cornelissen, J. H. C., Coulson, S. J., Dorrepaal, E., Elberling, B., Elmendorf, S. C., Elphinstone, C., Forte, T. G. W., Frei, E. R., Geange, S. R., Gehrmann, F., Gibson, C., Grogan, P., Halbritter, A. H., Harte, J., Henry, G. H. R., Inouye, D. W., Irwin, R. E., Jespersen, G., Jónsdóttir, I. S., Jung, J. Y., Klinges, D. H., Kudo, G., Lämsä, J., Lee, H., Lembrechts, J. J., Lett, S., Lynn, J. S., Mann, H. M. R., Mastepanov, M., Morse, J., Myers-Smith, I. H., Olofsson, J., Paavola, R., Petraglia, A., Phoenix, G. K., Semenchuk, P., Siewert, M. B., Slatyer, R., Spasojevic, M. J., Suding, K., Sullivan, P., Thompson, K. L., Väisänen, M., Vandvik, V., Venn, S., Walz, J., Way, R., Welker, J. M., Wipf, S., and Zong, S. W.: Winters are changing: snow effects on Arctic and alpine tundra ecosystems, Arct. Sci., 8, 572–608, https://doi.org/10.1139/as-2020-0058, 2022.
Rutgersson, A., Kjellström, E., Haapala, J., Stendel, M., Danilovich, I., Drews, M., Jylhä, K., Kujala, P., Larsén, X. G., Halsnæs, K., Lehtonen, I., Luomaranta, A., Nilsson, E., Olsson, T., Särkkä, J., Tuomi, L., and Wasmund, N.: Natural hazards and extreme events in the Baltic Sea region, Earth Syst. Dynam., 13, 251–301, https://doi.org/10.5194/esd-13-251-2022, 2022.
Schenk, F., Väliranta, M., Muschitiello, F., Tarasov, L., Heikkilä, M., Björck, S., Brandefelt, J., Johansson, A. V., Näslund, J. O., and Wohlfarth, B.: Warm summers during the Younger Dryas cold reversal, Nat. Commun., 9, https://doi.org/10.1038/s41467-018-04071-5, 2018.
Schwartz, M. D. and Crawford, T. M.: Detecting energy balance modifications at the onset of spring, Phys. Geogr., 22, 394–409, https://doi.org/10.1080/02723646.2001.10642751, 2001.
Seidl, R., Honkaniemi, J., Aakala, T., Aleinikov, A., Angelstam, P., Bouchard, M., Boulanger, Y., Burton, P. J., De Grandpré, L., Gauthier, S., Hansen, W. D., Jepsen, J. U., Jogiste, K., Kneeshaw, D. D., Kuuluvainen, T., Lisitsyna, O., Makoto, K., Mori, A. S., Pureswaran, D. S., Shorohova, E., Shubnitsina, E., Taylor, A. R., Vladimirova, N., Vodde, F., and Senf, C.: Globally consistent climate sensitivity of natural disturbances across boreal and temperate forest ecosystems, Ecography, 43, 967–978, https://doi.org/10.1111/ecog.04995, 2020.
Sillmann, J., Kharin, V. V., Zhang, X., Zwiers, F. W., and Bronaugh, D.: Climate extremes indices in the CMIP5 multimodel ensemble: Part 1. Model evaluation in the present climate, J. Geophys. Res.-Atmos., 118, 1716–1733, https://doi.org/10.1002/jgrd.50203, 2013.
Simons, W. D.: Effects of temperature on winter runoff U. S. Geological Survey, WRD, Menlo Park, California, USA, 1967.
SITES: Data portal [data set], https://data.fieldsites.se/portal/ (last access: 26 August 2024), 2024.
Sterck, F. J., Song, Y. J., and Poorter, L.: Drought- and heat-induced mortality of conifer trees is explained by leaf and growth legacies, Sci. Adv., 10, 15, https://doi.org/10.1126/sciadv.adl4800, 2024.
Stieglitz, M., Ducharne, A., Koster, R., and Suarez, M.: The impact of detailed snow physics on the simulation of snow cover and subsurface thermodynamics at continental scales, J. Hydrometeorol., 2, 228–242, https://doi.org/10.1175/1525-7541(2001)002<0228:Tiodsp>2.0.Co;2, 2001.
Tabari, H.: Climate change impact on flood and extreme precipitation increases with water availability (vol 10, 13768, 2020), Sci. Rep.-UK, 10, 13768, https://doi.org/10.1038/s41598-020-74038-4, 2020.
Teutschbein, C., Montano, B. Q., Todorovic, A., and Grabs, T.: Streamflow droughts in Sweden: Spatiotemporal patterns emerging from six decades of observations, J. Hydrol.-Reg. Stud., 42, 101171, https://doi.org/10.1016/j.ejrh.2022.101171, 2022.
Tiwari, T.: Data for detecting trends in hydroclimatic changes in the Svartberget Krycklan catchment, figshare [data set], https://doi.org/10.6084/m9.figshare.27320538.v1, 2024.
Tiwari, T., Sponseller, R. A., and Laudon, H.: Extreme Climate Effects on Dissolved Organic Carbon Concentrations During Snowmelt, J. Geophys. Res.-Biogeo., 123, 1277–1288, https://doi.org/10.1002/2017jg004272, 2018.
Tiwari, T., Sponseller, R. A., and Laudon, H.: Contrasting responses in dissolved organic carbon to extreme climate events from adjacent boreal landscapes in Northern Sweden, Environ. Res. Lett., 14, 044006, https://doi.org/10.1088/1748-9326/ab23d4, 2019.
Trenberth, K. E.: What Are the Seasons, B. Am. Meteorol. Soc., 64, 1276–1282, JSTOR, http://www.jstor.org/stable/26223401, (last access: 26 August 2025), 1983.
Trenberth, K. E.: Changes in precipitation with climate change, Clim. Res., 47, 123–138, https://doi.org/10.3354/cr00953, 2011.
Ulén, B., Lewan, E., Kyllmar, K., Blomberg, M., and Andersson, S.: Impact of the North Atlantic Oscillation on Swedish Winter Climate and Nutrient Leaching, J. Environ. Qual., 48, 941–949, https://doi.org/10.2134/jeq2018.06.0237, 2019.
van der Woude, A. M., Peters, W., Joetzjer, E., Lafont, S., Koren, G., Ciais, P., Ramonet, M., Xu, Y. D., Bastos, A., Botia, S., Sitch, S., de Kok, R., Kneuer, T., Kubistin, D., Jacotot, A., Loubet, B., Herig-Coimbra, P. H., Loustau, D., and Luijkx, I. T.: Temperature extremes of 2022 reduced carbon uptake by forests in Europe, Nat. Commun., 14, 1, https://doi.org/10.1038/s41467-023-41851-0, 2023.
Van Loon, A. F. and Laaha, G.: Hydrological drought severity explained by climate and catchment characteristics, J. Hydrol., 526, 3–14, https://doi.org/10.1016/j.jhydrol.2014.10.059, 2015.
Venäläinen, A., Lehtonen, I., Laapas, M., Ruosteenoja, K., Tikkanen, O. P., Viiri, H., Ikonen, V. P., and Peltola, H.: Climate change induces multiple risks to boreal forests and forestry in Finland: A literature review, Glob. Change Biol., 26, 4178–4196, https://doi.org/10.1111/gcb.15183, 2020.
Way, D. A.: Tree phenology responses to warming: spring forward, fall back?, Tree Physiol., 31, 469–471, https://doi.org/10.1093/treephys/tpr044, 2011.
Westerling, A. L., Hidalgo, H. G., Cayan, D. R., and Swetnam, T. W.: Warming and earlier spring increase western US forest wildfire activity, Science, 313, 940–943, https://doi.org/10.1126/science.1128834, 2006.
White, D., Hinzman, L., Alessa, L., Cassano, J., Chambers, M., Falkner, K., Francis, J., Gutowski, W. J., Holland, M., Holmes, R. M., Huntington, H., Kane, D., Kliskey, A., Lee, C., McClelland, J., Peterson, B., Rupp, T. S., Straneo, F., Steele, M., Woodgate, R., Yang, D., Yoshikawa, K., and Zhang, T.: The arctic freshwater system: Changes and impacts, J. Geophys. Res.-Biogeo., 112, G04S54, https://doi.org/10.1029/2006jg000353, 2007.
Williams, C. M., Henry, H. A., and Sinclair, B. J.: Cold truths: how winter drives responses of terrestrial organisms to climate change, Biol. Rev. Camb. Philos., 90, 214–235, https://doi.org/10.1111/brv.12105, 2015.
Wilmking, M., van der Maaten-Theunissen, M., van der Maaten, E., Scharnweber, T., Buras, A., Biermann, C., Gurskaya, M., Hallinger, M., Lange, J., Shetti, R., Smiljanic, M., and Trouillier, M.: Global assessment of relationships between climate and tree growth, Glob. Change Biol., 26, 3212–3220, https://doi.org/10.1111/gcb.15057, 2020.
Zschenderlein, P., Fink, A. H., Pfahl, S., and Wernli, H.: Processes determining heat waves across different European climates, Q. J. Roy. Meteor. Soc., 145, 2973–2989, https://doi.org/10.1002/qj.3599, 2019.