the Creative Commons Attribution 4.0 License.
the Creative Commons Attribution 4.0 License.
Potential of long-term satellite observations and reanalysis products for characterising soil drying: trends and drought events
Martin Hirschi
Pietro Stradiotti
Bas Crezee
Wouter Dorigo
Sonia I. Seneviratne
Soil drying has multiple adverse impacts on the environment, society, and economy. Thus, it is crucial to monitor and characterise related drought events and to understand how underlying geophysical trends may affect them. Here, we compare the ability of long-term satellite observations and state-of-the-art reanalysis products to characterise soil drying. We consider the European Space Agency Climate Change Initiative (ESA CCI) remote-sensing surface soil moisture products (encompassing an ACTIVE, a PASSIVE, and a COMBINED product) as well as surface and root zone soil moisture from the ERA5, ERA5-Land, and MERRA-2 reanalysis products. In addition, we use a new root zone soil moisture dataset derived from the ESA CCI COMBINED product.
We analyse global surface and root zone soil moisture trends in these products over the 2000–2022 period. Furthermore, we investigate the impact of the products' trend representation on their ability to capture major seasonal soil moisture (or agroecological) drought events as a use case. The latter is based on the analysis of 17 selected drought events documented in the scientific literature; these events are characterised by their severity (the time-accumulated standardised soil moisture anomalies), magnitude (the minimum of the standardised anomalies over time), duration, and spatial extent.
The soil moisture trends are globally diverse and partly contradictory between products. ERA5, ERA5-Land, and ESA CCI COMBINED show larger fractions of drying trends, whereas ESA CCI ACTIVE and MERRA-2 display more widespread wetting trends. The differences between reanalysis products are related to a positive mean bias in the precipitation trends and regionally negative biases in surface air temperature trends in MERRA-2 compared with ground observational products, suggesting that this reanalysis underestimates drying trends. Given these biases in the MERRA-2 precipitation and temperature trends and considering available validation studies, the ESA CCI COMBINED-based products and ERA5-Land are considered more reliable and are consecutively used for a synthesis of global surface and root zone soil moisture trends. This synthesis suggests a consistent tendency towards soil drying during the last 2 decades in these products in 49.3 % of the surface and 44.5 % of the root zone layers of the covered global land area. The respective fractions of wetting trends amount to 21.1 % and 20.6 % for the surface and root zone, respectively, while areas with no trend direction consensus amount to 29.6 % and 35.0 %, respectively, reflecting the considerable uncertainties associated with global soil moisture trends. Geographically, drying is localised to parts of Europe and the Mediterranean; the Black Sea–Caspian Sea and Central Asian region; Siberia; parts of the western USA and the Canadian Prairies; and larger parts of South America, parts of southern and northern Africa, and parts of northwestern Australia.
All investigated products mostly capture the considered drought events. Overall, the events tend to be least pronounced in the ACTIVE remote-sensing product across all drought metrics, particularly with respect to the magnitudes. Furthermore, MERRA-2 shows lower drought magnitudes than the other products, in both the surface layer and the root zone. The COMBINED remote-sensing products (surface and root zone soil moisture dataset) display partly stronger drought severities than the other products. In the root zone, the droughts are dampened with respect to the magnitude and smaller with respect to the spatial extent than in the surface layer, but they show a tendency toward prolonged durations and stronger severities. The product differences in the magnitude and severity of the drought events are consistent with the differences in soil moisture trends, which demonstrates that the representation of soil moisture trends plays a fundamental role in the drought-detection capacity of the different products.
- Article
(15196 KB) - Full-text XML
-
Supplement
(2917 KB) - BibTeX
- EndNote
Soil drying and related droughts have multiple impacts on the environment, society, and economy, including substantial impacts on agriculture, ecosystems, and the public water supply (Stahl et al., 2016; Seneviratne et al., 2021). Furthermore, both can act as triggers for other natural hazards at the subcontinental scale, including increased wildfire activity (Gudmundsson et al., 2014). Through feedback with the atmosphere, the prevailing dry conditions may further enhance air temperatures and trigger heat extremes (e.g. Miralles et al., 2014; Hirschi et al., 2011; Mueller and Seneviratne, 2012).
Based on varying data products, regional soil moisture drying trends have been reported for areas such as East Asia (e.g. Jia et al., 2018; Cheng et al., 2015), western and central Europe (e.g. Trnka et al., 2015; Scherrer et al., 2022), and the Mediterranean (e.g. Hanel et al., 2018; Moravec et al., 2019). Moreover, global studies have documented soil moisture drying during past decades for several regions (Dorigo et al., 2012; Albergel et al., 2013; Gu et al., 2019; Preimesberger et al., 2021). However, the involved products show considerable differences in the global patterns and magnitudes of the soil moisture drying. At the same time, important drought metrics, such as the duration and magnitude, rely on the robustness of the applied climatology (Lloyd-Hughes and Saunders, 2002), as demonstrated by the relevance of the baseline period as a design choice in drought studies (Champagne et al., 2019). Any inherent trend in the climatology will result in a different distribution of the data, potentially affecting the ranking of drought events or even their detection. However, the impact of soil drying and its uncertainty on drought representation is under-studied.
The recent Intergovernmental Panel on Climate Change (IPCC) Sixth Assessment Report (AR6) report assessed three types of droughts (Seneviratne et al., 2021; Douville et al., 2021): meteorological droughts based on precipitation deficits, agricultural and ecological droughts – here referred to as “agroecological droughts” (Zaitchik et al., 2023) – related to deficits in soil moisture and other measures of changes in the land water balance, and hydrological droughts related to streamflow deficits. The most impact-relevant drought types are agroecological and hydrological droughts. The primary driver of these droughts is a lack of precipitation (meteorological drought; see e.g. Seneviratne, 2012; Seneviratne et al., 2021; Liu et al., 2020). Increased evapotranspiration due to enhanced radiation, wind speed, or vapour pressure deficit (the latter of which is inherently linked to temperature and relative humidity) can further intensify the water shortage and lead to critical soil moisture values (agroecological drought) inducing, for example, adverse impacts on vegetation development (due to increased water stress) and crop yield reduction/failure (e.g. Teuling et al., 2013; Seneviratne et al., 2021; Bueechi et al., 2023). Furthermore, preconditioning (pre-event soil moisture, surface, snow and/or groundwater storage) can contribute to the emergence of agroecological and hydrological droughts (Koster et al., 2010). Under strong droughts, soil moisture can also become limiting for evapotranspiration, thus reducing the evaporative cooling effect (e.g. Miralles et al., 2014; Seneviratne et al., 2010). The IPCC AR6 concluded that a number of regions of the world are affected by increases in agroecological droughts (Seneviratne et al., 2021), mostly due to increases in evapotranspiration (Padron et al., 2020). Thus, monitoring and characterising soil moisture droughts is crucial and will only become more important with ongoing global warming.
As in situ observations of soil moisture are still scarce and not continuously available in space and time over long time periods (Dorigo et al., 2011, 2021a), reanalysis and merged remote-sensing products provide an alternative to global long-term time series with respect to investigating drying trends and soil moisture droughts at supra-regional scales. Here, we investigate the ability of the European Space Agency Climate Change Initiative (ESA CCI) soil moisture long-term remote-sensing dataset (encompassing multi-sensor merged ACTIVE, PASSIVE, and COMBINED surface soil moisture products as well as a new root zone soil moisture product based on COMBINED) and selected state-of-the-art reanalysis products (ERA5, the offline ERA5-Land, and MERRA-2) to characterise soil drying. Soil moisture trends in long-term satellite observations and differences in these trends between measuring approaches are still under-studied. Most of the available ESA CCI soil-moisture-based trend analyses use the COMBINED product (e.g. Dorigo et al., 2012; Albergel et al., 2013; Feng and Zhang, 2015; Gu et al., 2019; Preimesberger et al., 2021), with many focusing on regional trends only (e.g. Li et al., 2015; Rahmani et al., 2016; Wang et al., 2016; Zheng et al., 2016; An et al., 2016; Jia et al., 2018). Previous analyses have indicated that global trend patterns in ESA CCI COMBINED soil moisture may be subject to differences between product versions (Hirschi et al., 2023), due to currently unknown reasons. Even though the patterns have become more stable with the latest product versions, potential sources of uncertainty include the different merging steps involved in the ESA CCI processing chain, changes in the sensor composition between versions, and inherent characteristics of the underlying ACTIVE and PASSIVE products that translate into the COMBINED product. Understanding where confidence in the remote-sensing-based soil moisture trends is justified (and where it is not) is, thus, fundamental to the use of such products as climate data records. The same applies to (land) reanalysis products, which we use as a comparison. To attribute some of the product differences, potential drivers of the global soil moisture trends in the reanalyses are analysed by considering trends in the relevant variables of the land water balance and surface air temperature as well as corresponding trends in ground observational data. Additionally, we look at bioclimatic indicators and land-surface characteristics that potentially affect the stability of the soil moisture retrieval and the reanalysis-based soil moisture.
Focusing on agroecological drought as a use case, we further systematically characterise documented major seasonal drought events in the 2000–2022 period and analyse the impact of the soil moisture trend representation of the products on their ability to capture these events. The drought events are selected based on the scientific literature and drought reports, providing the temporal and spatial bounds for the analysis. Given the lack of widely available ground data on soil moisture, we rely on well-documented drought events and focus on the relative behaviour of the products within the temporal and spatial bounds of the events. Thus, we do not aim for an in situ validation of the products with respect to their representation of the soil moisture trends and considered drought events; rather, we focus on the product ensemble to identify the products with larger deviations from the majority and collect a convergence of evidence. The considered products, in particular those from the Copernicus Climate Change Service (C3S) Climate Data Store (CDS), also offer new opportunities for monitoring ongoing droughts and applications like drought index insurance (Vroege et al., 2021), as they are available in near-real time.
2.1 Remote-sensing and reanalysis soil moisture
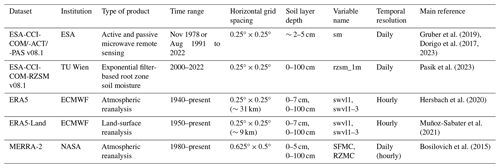
Soil moisture is considered from both the near-surface soil layer and the root zone. Despite the overall strong correlation of surface soil moisture with deeper soil layers, evapotranspiration and vegetation processes might be more sensitive to variations in the root zone soil moisture, in particular under very dry conditions (Hirschi et al., 2014). The surface layer corresponds to roughly 0–5 cm depth (according to GCOS, 2016) and covers the penetration depth of microwave remote-sensing soil moisture products. Note that this upper-soil-layer depth may slightly vary per product, depending on the microwave sensing frequency or the land-surface model. For the root zone, the 0–100 cm soil layer depth is considered. All data presented in the following (see Table 1 for an overview) have been regridded to a common 0.5°×0.5° spatial resolution using first-order conservative remapping from the Climate Data Operators (CDO) software after the retrieval.
Table 1Product summary of the considered soil moisture products. The “horizontal grid spacing” column lists the resolution of the data retrieved; if applicable, the native resolution of the dataset is listed in parentheses. Similarly, for the “temporal resolution” column, terms in parentheses indicate the underlying temporal resolution when this differs from the retrieved resolution.
2.1.1 ESA CCI soil moisture
The European Space Agency (ESA) Climate Change Initiative (CCI) soil moisture (ESA CCI soil moisture, v08.1) provides satellite-retrieved surface soil moisture over the globe from a large set of active and passive microwave sensors (with soil penetration depths of ∼2–5 cm). The dataset contains the following sub-products: “ACTIVE”, “PASSIVE”, and “COMBINED” (denoted using ESA-CCI-ACT, ESA-CCI-PAS, and ESA-CCI-COM, respectively, in the following). The ESA-CCI-ACT and ESA-CCI-PAS products were created using scatterometer (active microwave sensing) and radiometer (passive microwave sensing) soil moisture products, respectively. For ESA-CCI-COM, all active and passive single-sensor products are directly merged based on the signal-to-noise ratio of the input datasets (Gruber et al., 2019). Note that, in the merging process for ESA-CCI-COM, the active and passive L2 products are scaled against surface soil moisture from the GLDAS-Noah v2.1 land-surface model (Rodell et al., 2004) from which the dynamic range is inherited (Dorigo et al., 2017; Gruber et al., 2019). As of v08.1, a break adjustment is implemented for ESA-CCI-COM, which corrects for breaks in the mean and variance (Preimesberger et al., 2021; Su et al., 2016).
Microwave retrievals are impossible under snow and ice or when the soil is frozen, and complex topography, surface water, and urban structures have negative impacts on the retrieval quality (Dorigo et al., 2017, 2015). In addition, dense vegetation attenuates the microwave emission and backscatter from the soil surface and may (partly) mask the soil moisture signal. Altogether, these limitations result in spatial and temporal data gaps in remote-sensing-based soil moisture estimates, with the main affected areas being the high latitudes during winter and the tropical rainforests (due to very dense vegetation).
The product is provided on a 0.25°×0.25° spatial grid and at a daily temporal resolution from November 1978 (for ESA-CCI-PAS and ESA-CCI-COM) or from August 1991 (for ESA-CCI-ACT) until 2022. Data coverage is limited in the early years of ESA-CCI-COM (and ESA-CCI-PAS), as only a few passive sensors were available (e.g. Loew et al., 2013). The inclusion of active sensors from July 1991 (Gruber et al., 2019) and the availability of multiple passive and active sensors after 2000 increased the spatiotemporal coverage (Hirschi et al., 2023). The ESA CCI soil moisture product has been extensively validated (Dorigo et al., 2015; Beck et al., 2021; Hirschi et al., 2023) and used in various research applications (see Dorigo et al., 2017, for an overview).
In addition to these ESA CCI surface soil moisture products, an ESA-CCI-COM-based root zone soil moisture dataset is included in the analysis, which is derived by extrapolating surface soil moisture to deeper soil layers (hereafter referred to as ESA-CCI-COM-RZSM). The extrapolation is based on an exponential filter (Wagner et al., 1999; Albergel et al., 2008), which is applied to ESA-CCI-COM soil moisture (v08.1) and uses optimal values for the temporal length of the filter (T parameter) determined from a large number of in situ time series (Pasik et al., 2023). The data represent the root zone down to 1 m soil depth and will be released with the ESA CCI soil moisture products as of v09.1.
2.1.2 ERA5
ERA5 is the fifth-generation ECMWF reanalysis of global climate and weather for the past decades (Hersbach et al., 2020). Data are available from 1940 until the present and are updated daily with a latency of about 5 d. ERA5 is produced using 4D-Var data assimilation in CY41R2 of ECMWF's Integrated Forecast System (IFS) and provides hourly data with a spatial resolution of 31 km.
The land-surface scheme of ERA5, HTESSEL (Hydrology-Tiled ECMWF Scheme for Surface Exchanges over Land; Balsamo et al., 2009) distinguishes between four different soil layers with the following layer depths: layer 1 at 0–7 cm, layer 2 at 7–28 cm, layer 3 at 28–100 cm, and layer 4 at 100–289 cm. Apart from the assimilation of 2 m temperature and relative humidity pseudo-observations (e.g. De Rosnay et al., 2013), ERA5 is the first ECMWF reanalysis that includes remotely sensed observations in a soil moisture analysis. Remote-sensing soil moisture from scatterometers (ERS-1, ERS-2, MetOp-A, and MetOp-B ASCAT) is assimilated in the land data assimilation from 1991 onward using a simplified extended Kalman filter for the three soil moisture layers of the top 1 m of the soil (Hersbach et al., 2020; De Rosnay et al., 2014).
On the one hand, we focus on layer 1 (0–7 cm), i.e. (near-)surface soil moisture to allow for comparison with the ESA CCI remote-sensing soil moisture products (see above). On the other hand, average soil moisture from layers 1 to 3 (i.e. 0–100 cm; a layer-depth-weighted value) is considered to be a representation of root zone soil moisture. The ERA5 data have been retrieved from the CDS on a regular latitude–longitude grid with a 0.25°×0.25° spatial resolution and an hourly temporal resolution. We have further aggregated the retrieved hourly data to daily means.
2.1.3 ERA5-Land
The land component of the ERA5 reanalysis provides global, hourly, high-resolution information on the water and energy cycles over land in a consistent representation (Muñoz-Sabater et al., 2021). ERA5-Land is a single simulation based on the HTESSEL land-surface model (Balsamo et al., 2009) forced by ERA5 near-surface atmospheric fields, with additional lapse-rate correction of temperature. Compared with ERA5, near-surface quantities are available at higher spatial resolution, and the soil parameters are more homogeneous between ERA5 production streams (Hersbach et al., 2020). There is no feedback from the land-surface model to the atmospheric parameters, and atmospheric observations only influence the land-surface simulations indirectly through the ERA5 forcing. Unlike ERA5, ERA5-Land does not assimilate remote-sensing soil moisture or other land variables. ERA5-Land is available from 1950 onwards and is updated monthly with a latency of about 3 months. It provides hourly data with a spatial resolution of 9 km, thus allowing more spatial detail compared with ERA5.
The representation of the soil compartments in ERA5-Land is consistent with ERA5, as both products consider the same HTESSEL land-surface model (see Sect. 2.1.2). Consequently, as for ERA5, soil moisture from layer 1 (surface soil moisture) and from layers 1 to 3 (root zone soil moisture, as a layer-depth-weighted average value) are considered in the analyses. Evaluation against in situ observations and other reference datasets shows the added value of ERA5-Land in the description of the hydrological cycle when compared with ERA5, with enhanced soil moisture and lake representation as well as a better agreement of river discharge with observations (Muñoz-Sabater et al., 2021).
The ERA5-Land data have been extracted from the CDS on a regular latitude–longitude grid with a 0.25°×0.25° spatial resolution and hourly temporal resolution. We have further aggregated the retrieved hourly data to daily means.
2.1.4 MERRA-2
The Modern-Era Retrospective Analysis for Research and Applications, Version 2 (MERRA-2), is the latest atmospheric reanalysis of the modern satellite era produced by NASA's Global Modeling and Assimilation Office (GMAO; Gelaro et al., 2017). It was introduced to replace the original MERRA dataset because of advances made in the assimilation system that enabled the assimilation of modern hyperspectral radiance and microwave observations, along with GPS radio occultation datasets. Among the advances in MERRA-2 are the assimilation of aerosol observations; several improvements to the representation of the stratosphere, including ozone; and improved representations of cryospheric processes. Other improvements in the quality of MERRA-2 compared with MERRA include the reduction in some spurious trends and breaks related to changes in the observing system and reduced biases and imbalances in aspects of the water cycle. MERRA-2 provides data beginning in 1980, at a 0.625°×0.5° spatial resolution and an hourly temporal resolution. For an overview of the dataset, see Gelaro et al. (2017).
The land-surface model used in MERRA-2 is the Catchment Land Surface Model (CLSM; Koster et al., 2000). It explicitly addresses sub-grid-scale soil moisture variability and its effect on runoff and evaporation, using the basic computational element of a hydrological catchment. The land hydrology of MERRA-2 has been assessed against GRACE terrestrial water storage data as well as against in situ soil moisture data (Reichle et al., 2017a). MERRA-2 is produced using four separate streams, initialised in 1979, 1991, 2000, and 2010. The first year of each stream is designated as spin-up (Bosilovich et al., 2015). The land-surface restart files for each MERRA-2 stream were themselves spun up for at least 20 years, using the offline (land only) version of the MERRA-2 land model forced with MERRA surface meteorological fields (Reichle et al., 2017b). Despite this allowance for a spin-up, it has been documented that discontinuities remain in the high latitudes for root zone soil moisture (cf. Fig. 13 of Reichle et al., 2017b).
The variables SFMC (water surface layer, 0–5 cm depth) and RZMC (water root zone, 0–100 cm depth) have been retrieved from the Goddard Earth Sciences Data and Information Services Center (GES DISC) as daily aggregated data (GMAO, 2015).
2.2 Other meteorological variables from reanalyses and ground observations
Apart from soil moisture, the following variables are used from the ERA5, ERA5-Land, and MERRA-2 reanalysis products: total precipitation, evapotranspiration, runoff, and surface air temperature. Note that ERA5 and ERA5-Land share the same precipitation data, except for the higher spatial resolution of the latter.
Observed global land-surface precipitation and air temperature are taken from CRU TS (Climatic Research Unit gridded Time Series, v4.07). The dataset is derived via the interpolation of monthly climate anomalies from extensive networks of weather station observations (Harris et al., 2020) and is available at a 0.5°×0.5° spatial resolution and monthly temporal resolution, spanning the 1901–2022 period. The choice of this monthly product is driven by the fact that daily gridded observations for both temperature and precipitation were not readily available up to 2022 at the time of the analysis.
2.3 Land-surface characteristics and bioclimatic indicators
ESA CCI provides a set of ancillary datasets that were used in the generation of the products (Dorigo et al., 2021b). The ESA CCI soil porosity map has been used to convert ESA-CCI-ACT from the original units of “percentage of saturation” to volumetric soil moisture (in m3 m−3), as provided by the other considered products. The porosity map has been derived according to Saxton and Rawls (2006), taking clay, sand, silt, and organic matter of the Harmonized World Soil Database as input.
To investigate the impacts of land-surface and bioclimatic variables on the soil moisture trends in the various products (see Sect. 5.3), the latter are compared globally to those calculated using the maximum number of data available over the 2000–2022 period for the vegetation optical depth (VOD; Zotta et al., 2024); ERA5-derived aridity (2000–2018 only; Wouters, 2021); and fractional cover values of urban area, bare soil, and tree cover (C3S, 2019).
3.1 Trend estimation
The analysis of trends is based on the yearly averages of the daily soil moisture data. For this, the daily soil moisture of the reanalysis products is masked for frozen soil conditions (based on the surface-layer soil temperatures of the respective products), while ESA CCI soil moisture is already masked for this (Dorigo et al., 2017). A mutual masking of all products is then applied, yielding in a consistent coverage. Trends are derived using the Theil–Sen trend estimator. The significance of the trends is determined with the Mann–Kendall test with a false-rejection rate (or α value) of 0.05, and non-significant trends are masked in the trend maps when indicated. All trends are scaled to a denominator of per 20 years ((20 yr)−1) to enhance readability and interpretability.
Apart from surface and root zone soil moisture, trends in other relevant variables of the land water balance (i.e. total precipitation, evapotranspiration, runoff) as well as in the surface air temperature are also considered. For an easier comparison to these variables, we focus on trends in absolute soil moisture. These trends are based on yearly means of monthly data (see Sect. 2.2). In addition, we also look at trends in various land-surface characteristics and bioclimatic indicators (see Sect. 2.3).
3.2 Drought event characterisation
3.2.1 Event definitions
Based on guidance from WMO (2023), extreme weather and climate events can be described quantitatively by a combination of the following metrics and information:
-
an index describing the anomaly from normal conditions (based on observations),
-
a threshold (above or below which conditions become “extreme”),
-
temporal information (records of the start date, end date, and duration),
-
spatial information (the geographic area affected).
Here, we focus on documented major drought events of the past 2 decades, with regions and periods that are predefined based on the scientific literature and drought reports. From 2011 onward, in particular the Bulletin of the American Meteorological Society (BAMS) “Explaining Extreme Events from a Climate Perspective” report series is considered for this purpose. These event definitions serve as spatial and temporal bounds for the characterisation of the individual drought events. An overview of the considered events and their predefined event regions and event periods is given in Table S1 in the Supplement. This analysis extends on the extreme event catalogue and event metrics developed within the C3S_511 Quality Assessment of ECV Products (Crezee et al., 2019; Yang et al., 2022).
3.2.2 Index and drought metrics' calculation
The soil moisture products considered here are given as a volumetric moisture content (i.e. in units of m3 m−3), except for ESA-CCI-ACT which is originally provided as percent of saturation and converted to the volumetric moisture content using the ESA CCI soil porosity map (see above). However, care needs to be taken when comparing absolute soil moisture from different sources, as the absolute values are known to be dependent on underlying assumptions of the land-surface models and related soil property datasets (e.g. differing soil depths and soil properties, like porosity) as well as on varying penetration depths of the remote-sensing products. We apply a standardisation (z-transformation) to remove differences in absolute levels and variability in the soil moisture values between the products, as well as between locations, and focus on the temporal anomalies (see e.g. Koster et al., 2009; Orlowsky and Seneviratne, 2013).
These unitless standardised soil moisture anomalies (SMAs; e.g. Orlowsky and Seneviratne, 2013) are based on daily input data and are calculated per individual grid point with respect to the climatology of the 2000–2022 reference period:
In Eq. (1), SMy,d denotes soil moisture at any year y and day d, while μd and σd denote the respective climatological mean and interannual standard deviation of soil moisture of day d calculated over the reference period. To enhance the sample size, calculation of μd and σd for each day of the year is based on the days in an 11 d window around d, i.e. by applying an 11 d moving average to the original soil moisture time series. Note that a reference period identical to the analysis period is chosen in order to (1) keep the calculation of the standardised anomalies independent of temporal fluctuations in the original time series prior to that and (2) avoid reduced data coverage in the remote-sensing products in earlier periods (e.g. Hirschi et al., 2023). A 3 d running mean is applied in addition on the resulting daily standardised anomalies with the purpose of filling daily gaps in the remote-sensing products.
For the definition of a drought, a threshold standardised anomaly value of −1.5 is chosen, and any value below this is considered to be an abnormal dry state (i.e. ). This threshold is inspired by the Standardised Precipitation Index (SPI)-based categorisation of droughts, where values below −1.5 represent severe to extreme drought (McKee et al., 1993).
Four different metrics are defined to characterise each drought event within the predefined event region and event period (see Table S1). The magnitude of the event is the minimum standardised anomaly over time. The duration of the event is the total number of days (not necessarily consecutive) during the event for which the standardised anomaly is below the threshold value of −1.5. The severity is defined as the time-accumulated standardised anomalies over the days (i.e. consecutive and non-consecutive) for which the standardised anomaly is below the threshold value. These metrics are all calculated at the grid point scale. In addition, the temporally varying spatial extent of the event is defined as the area in which the standardised anomaly is below the threshold of −1.5.
Note that the application of the 3 d running mean smoothing of the standardised anomalies helps to fill temporal gaps in the remote-sensing products whilst also allowing the products to remain as close as possible to the original data. For the remote-sensing products, a larger smoothing window size (i.e. 5 d window) mainly impacts the calculation of the magnitude, while the duration and severity only slightly change. Furthermore, sensitivity tests showed that there is not much impact of varying smoothing windows on the results for the reanalysis products (not shown).
As the severity captures both the duration and the amplitude of the event, it is suitable for defining the most affected core of the event region as represented by the products. This core region is defined as all grid points for which the severity is larger than the median of all non-zero-severity grid points of the event and is used to spatially aggregate the drought metrics for summarising the events.
4.1 Trends in soil moisture
Among the remote-sensing products, ESA-CCI-COM and its root zone estimate ESA-CCI-COM-RZSM show more widespread significant soil moisture drying trends, in particular in Siberia, the Black Sea–Caspian Sea region, southern Africa, and parts of South America and Australia (Fig. 1d–f, j; see also Fig. 2). In contrast, ESA-CCI-ACT and, to a lesser extent, ESA-CCI-PAS display larger fractions and more pronounced wetting trends. Partly consistent drying trends in the ESA CCI products (considering the trend direction; see Fig. S1a in the Supplement) can be observed in small parts of Siberia, the Caspian Sea region, parts of central Europe, southern South America, and northern Australia, whereas consistent wetting trends can mainly be observed in Asia, North America, northwest Brazil, and southeastern Australia. Overall, the agreement in the trend direction is limited among the ESA CCI products.
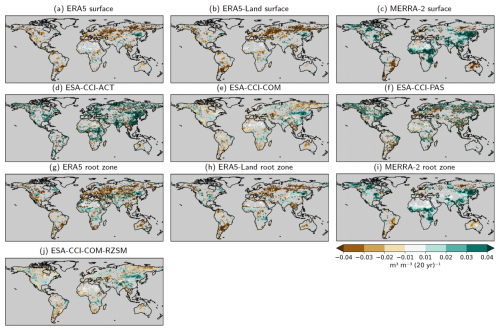
Figure 1Theil–Sen trend estimate (in ) for yearly mean soil moisture (based on daily data mutually masked for ESA CCI data availability and non-frozen soil conditions of the reanalysis products) in the (a–f) surface and (g–j) root zone layers for the 2000–2022 period. A Mann–Kendall test with a false-rejection rate (or α value) of 0.05 was performed to mask out regions in which no significant trend was present.
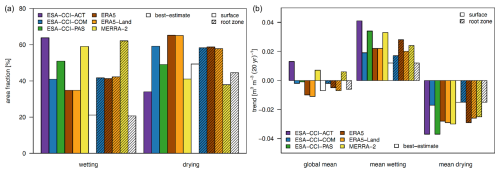
Figure 2(a) Area fractions (in %) of wetting and drying trends within each product. (b) Global mean trends and the respective mean wetting and drying trends (in ) within each product. Trends are not masked according to significance but, rather, for common spatial coverage of the datasets. The values for the best-estimate products (see Sect. 5.1) are based on the areas with trend direction consensus. Note that the respective numbers that are referred to in the text can be found in Table S2.
The ERA5 and ERA5-Land reanalysis products show mostly significant drying trends, particularly for surface soil moisture (Fig. 1a, b, g, h; Fig. 2). Strong and widespread drying can be observed in the northern middle to high latitudes, South America, and Central Africa; in addition to these regions, strong and widespread drying for the root zone can also be noted in southern Africa and parts of Australia. MERRA-2, in contrast, displays widespread significant wetting trends in both surface and root zone soil moisture, except for South America, Australia, and parts of Siberia and Europe (Fig. 1c, i). For the latter, consistent drying trends are observable in all reanalysis products (see also Fig. S1b). Consistent wetting trends in the reanalyses (Fig. S1b) can be observed in East Asia and India, parts of Central Africa and North America, and in southeastern Australia, but these appear less widespread in ERA5 and ERA5-Land compared with MERRA-2. Significant drying trends in ESA-CCI-COM and ESA-CCI-COM-RZSM mostly agree with ERA5 and ERA5-Land, while wetting trends in Asia tend to agree more with MERRA-2.
Of all of the products, ERA5-Land, ERA5, and ESA-CCI-COM, show largest area fractions of surface soil moisture drying trends (65.2 %, 65.2 %, and 59.1 %, respectively; trends not masked according to significance), while ESA-CCI-ACT and MERRA-2 show the largest fractions of wetting trends (63.8 % and 59.0 %, respectively; Fig. 2a, Table S2). Similarly, the largest area fractions of root zone soil moisture drying trends are present in ERA5, ERA5-Land, and ESA-CCI-COM-RZSM (58.7 %, 57.8 %, and 58.3 %, respectively), while the largest fractions of wetting trends are found in MERRA-2 (62.1 %). Nevertheless, some regions with largely consistent drying trends in all products (considering the trend direction; see also Fig. S1c) are apparent in parts of Europe, the region northeast of the Caspian Sea, southern Africa, northeastern Australia, and in parts of Siberia and South America.
Not only do the area fractions of the trend directions diverge between the products but their trend magnitudes also differ (Fig. 2b). ESA-CCI-ACT and MERRA-2 show positive global means of the trends, whereas all other products show negative global means. The mean trend magnitudes in the wetting areas are largest for surface soil moisture of ESA-CCI-ACT and ESA-CCI-PAS as well as for MERRA-2 (0.03–0.04 ; Table S2). Both ESA-CCI-ACT and ESA-CCI-PAS also show the largest drying-trend magnitudes (around −0.035 ). The mean drying-trend magnitude is somewhat lower but largely consistent between the reanalysis products (around −0.03 ) for both the surface and root zone soil moisture. The overall lowest trend magnitudes in both directions can be observed for ESA-CCI-COM and ESA-CCI-COM-RZSM (less than 0.02 ).
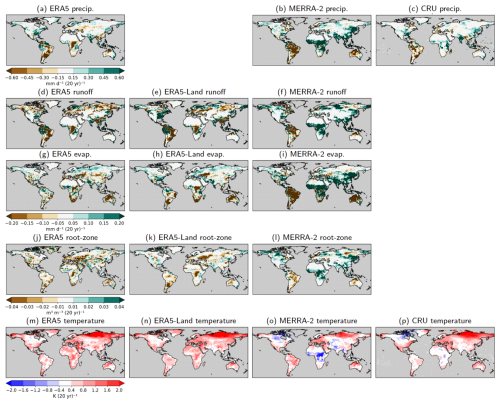
Figure 3Theil–Sen trend estimate (2000–2022 period) for yearly means of monthly precipitation (a–c), runoff (d–f), evapotranspiration(g–i), root zone soil moisture (j–l), and surface air temperature (m–p) from the reanalysis products as well as two gridded station-based datasets for precipitation and temperature. Values are in millimetres per day per 20 years () for the respective fluxes, cubic metres per cubic metre per 20 years () for soil moisture, and kelvin per 20 years (K (20 yr)−1) for temperature. Regions with non-significant trends are not masked out in order to enable easier comparison with the trends in soil moisture. Note that ERA5-Land is forced by ERA5 precipitation; thus, precipitation is not shown for ERA5-Land.
4.2 Drivers of soil moisture trends in the reanalysis products
To shed light on possible reasons for the observed differences in soil moisture trends between ERA5/ERA5-Land and MERRA-2, Fig. 3 displays the Theil–Sen trend estimates for yearly means of monthly precipitation, runoff, evapotranspiration, and 2 m temperature (in addition to the trends in root zone soil moisture) for these products as well as for two gridded station-based datasets of precipitation and temperature (both CRU). The patterns in precipitation trends (Fig. 3a, b) of ERA5 and MERRA-2 show positive values in parts of East Asia and India, the western USA, parts of east Africa, northern South America, and southeastern Australia. Negative trends in both products are present in large parts of South America and in northwestern Australia. However, precipitation trends disagree in Central Africa (negative trends in ERA5 but positive trends in MERRA-2) as well as Southeast Asia (more widespread positive trends in MERRA-2). In addition, the positive trends in MERRA-2 precipitation are often more pronounced and widespread compared with ERA5. While the pattern correlations with the observed precipitation trends (Fig. 3c) are similar for ERA5 and MERRA-2 (0.33 for ERA5 and 0.34 for MERRA-2), MERRA-2 precipitation trends display a positive mean bias (0.171 ) and a larger root-mean-square deviation (RMSD) (0.847 ) compared with ERA5, which has a slight negative bias (−0.004 ) and a lower RMSD (0.492 ; see Table S3). This results in larger differences between the reanalyses for trends in runoff and, particularly, evapotranspiration (Fig. 3d–i). In large parts of Asia, Africa, and North America, trends in evapotranspiration are strongly and widely positive in MERRA-2, whereas ERA5 and ERA5-Land show more mixed or negative trends in these regions. These differences in evapotranspiration trends are reflected in the described differences in the soil moisture trends (Fig. 3j–l; see Sect. 4.1). Figure S2 also shows the trends in the yearly means of the cumulated monthly terrestrial water balance (i.e. precipitation minus evapotranspiration minus runoff, cumulated on an annual basis). These trends in the annual terrestrial water balance (or terrestrial water storage) show a relation to the trends seen in soil moisture as well as some differences. ERA5 and ERA5-Land particularly show more widespread wetting with respect to the terrestrial water storage compared with soil moisture, while MERRA-2 shows more widespread drying. These differences are due to components other than root zone soil moisture (i.e. deeper-layer soil moisture and groundwater, snow, ice, and biomass water) that contribute to terrestrial water storage and its trends.
The regional product differences in evapotranspiration and soil moisture trends also show a link to regional differences in 2 m temperature trends (Fig. 3m–o). In the mentioned regions, the temperature trends for MERRA-2 are (more) negative, whereas ERA5 and ERA5-Land show positive or only weak negative temperature trends. As for the precipitation trends, the temperature trends based on gridded observations (Fig. 3p) in fact agree better with ERA5 and ERA5-Land, while MERRA-2 overestimates the negative trends in Asia, Africa, and North America compared with the observations, resulting in a larger RMSD of 0.613 K (20 yr)−1 for MERRA-2 compared with 0.536 K (20 yr)−1 for ERA5 and 0.511 K (20 yr)−1 for ERA5-Land (Table S3). Corresponding pattern correlations with the observed temperature trends amount to 0.65 for MERRA-2 and ERA5 and to 0.7 for ERA5-Land, with a negative mean bias of −0.219 K (20 yr)−1 for MERRA-2 compared with a positive bias for ERA5 (ERA5-Land) of 0.221 K (20 yr)−1 (0.238 K (20 yr)−1).
Overall, the lower biases in ERA5 precipitation trends and the stronger constraint with observed regional temperature trends result in more widespread soil drying and evapotranspiration decreases in both ERA5 and ERA5-Land. In contrast, the overly positive trends in precipitation in MERRA-2 translate into enhanced soil moisture and evapotranspiration as well as a resulting stronger regional cooling, which is less in line with the observed temperature trends.
4.3 The 2022 drought in Europe
In the following, we investigate the products' ability to capture major agroecological drought events as a use case. Detailed results are presented for the 2022 drought in western central Europe (Schumacher et al., 2022, 2024) as an example. This is followed by the characterisation of multiple recent major drought events worldwide considering all products (Sect. 4.4) and the product intercomparison based on these events (Sect. 4.5).
The severity of the 2022 drought event appears to be highest in central and western Europe, with the highest values based on surface soil moisture in Germany, Switzerland, France, Italy, and parts of eastern Europe (Fig. 4a–f). This core of the event region (see Sect. 3.2.2) is captured by all products, but the region appears less coherent in the ESA-CCI-ACT (and partly ESA-CCI-PAS) remote-sensing product. Due to the strong correlation of surface soil moisture with deeper soil layers (e.g. Hirschi et al., 2014), the location of the event in the root zone is very similar compared to the surface layer (Fig. 4g–j). However, the core region is less coherent and widespread in the root zone (see the horizontal line segments of Fig. 7b, which indicate the spatial extent of the core region).
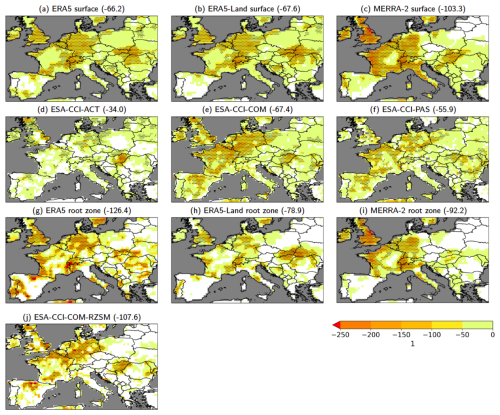
Figure 4Severity of the 2022 European drought event (in units of standard deviation) based on the time-accumulated soil moisture anomalies in the (a–f) surface and (g–j) root zone layers. The core of the event region is stippled, and the area mean of the severity over the respective core of the event region is denoted in parentheses.
For surface-layer soil moisture, the event appears most severe in MERRA-2 (although within a smaller extent of the core region than the other reanalyses), followed by ERA5-Land, ESA-CCI-COM, and ERA5 (Fig. 4; see also Table S4 for an overview of all drought metrics for the 2022 event in Europe). ESA-CCI-ACT shows weaker severities for this event. The magnitude of the 2022 European drought based on ESA-CCI-COM and ESA-CCI-PAS is comparable to the reanalysis products over large parts of the area, with values of −3 and below in parts of the core region of the event (Fig. 5). ESA-CCI-ACT shows weaker magnitudes. The event shows the longest durations in MERRA-2, with over 90 d in parts of the core region and over 50 d on average over this same area (Fig. 6). ERA5, ERA5-Land, ESA-CCI-COM, and ESA-CCI-PAS display average durations of around 30 d, whereas ESA-CCI-ACT results in the shortest duration of 18 d.
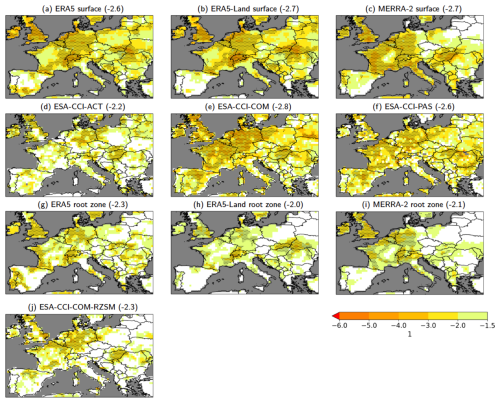
Figure 5Magnitude of the 2022 European drought event (in units of standard deviation) based on the temporal minimum of the standardised soil moisture anomalies in the (a–f) surface and (g–j) root zone layers. The core of the event region is stippled, and the area mean of the magnitude over the respective core of the event region is denoted in parentheses.
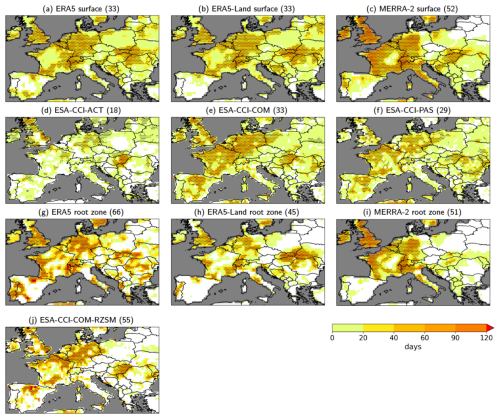
Figure 6Duration of the 2022 European drought event (in days) based on the number of days within the event period with standardised soil moisture anomalies below −1.5 in the (a–f) surface and (g–j) root zone layers. The core of the event region is stippled, and the area mean of the duration over the respective core of the event region is denoted in parentheses.
In the root zone of ERA5-Land and, particularly, ERA5 and ESA-CCI-COM-RZSM, the 2022 European drought appears more severe compared with the surface layer (Fig. 4; see also Table S4), mostly due to longer durations (Fig. 6), while the magnitudes are weaker (Fig. 5). MERRA-2 shows a similarly reduced drought magnitude in the root zone to ERA5 and ERA5-Land; however, in contrast, the duration is similar to that in the surface layer (where it is already substantially longer than in ERA5 and ERA5-Land). Together with partly weaker negative anomalies (see Fig. 7a), the severity in the root zone of MERRA-2 is therefore reduced compared with the surface layer.
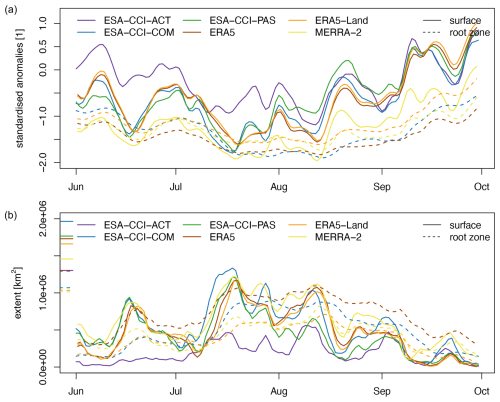
Figure 7(a) Average of the standardised surface (solid lines) and root zone (dashed lines) soil moisture anomalies within the respective cores of the event regions (see stippled regions in Figs. 4–6) during the 2022 European drought event period. (b) Spatial extent of the standardised surface (solid lines) and root zone (dashed lines) soil moisture anomalies below −1.5 within the core of the event region during the 2022 European drought event. Line segments at the left border of the figure indicate the extent of the core region for each dataset (i.e. corresponding to the extents of the stippled areas in Figs. 4–6 where the severity is larger than the median of all non-zero-severity grid points).
The temporal evolution of the standardised surface soil moisture anomalies averaged over the core of the event region shows the two strongest phases of the event in the second half of July and first half of August 2022 (Fig. 7a), respectively, with average standardised anomalies based on the reanalysis products reaching −1.5. Anomalies are most pronounced (i.e. close to −2) and prolonged for MERRA-2 compared with the other products. ERA5 and ERA5-Land show weaker negative anomalies and a quicker return to normal conditions. Among the remote-sensing products, ESA-CCI-COM and ESA-CCI-PAS show the most negative anomalies, although with a minimum in the second half of July. Over the whole period, ESA-CCI-ACT shows the overall weakest standardised anomalies, which are, on average, only briefly below normal conditions.
Root zone soil moisture anomalies from the reanalysis products display less temporal variation, with longer-lasting minimum values in July and August (dashed lines in Fig. 7a). In the root zone, the dryer-than-normal conditions persist during late summer and early autumn, with standardised anomaly values still below −1. The strongest and most prolonged root zone soil moisture anomalies are displayed by ERA5 and ESA-CCI-COM-RZSM, whereas ERA5-Land and MERRA-2 show weaker negative anomalies.
The temporal evolution of the spatial extent of the drought (i.e. the area of standardised soil moisture anomalies below −1.5 within the core of the event region) shows the highest values during July, reaching over 1.3×10⁶ km2 for surface soil moisture for ESA-CCI-COM (Fig. 7b, Table S4), followed by 1.2×10⁶ km2 for MERRA-2 and ESA-CCI-PAS. The maximum spatial extent of the event in the root zone is clearly lower compared with the respective surface layer in ERA5-Land, MERRA-2, and ESA-CCI-COM-RZSM, while it is less reduced in ERA5. Correspondingly, ERA5 shows the largest spatial extent of the drought in the root zone, with a maximum of 1.09×10⁶ km2, followed by ESA-CCI-COM-RZSM, with a maximum of 0.90×10⁶ km2 (Table S4).
4.4 Recent major drought events
An overview of the characteristics of major drought events in the 2000–2022 period as represented in the various products is given in Fig. 8a (based on surface and root zone soil moisture).
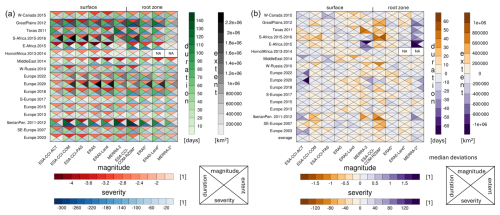
Figure 8(a) Drought metrics of recent major drought events. The values are based on surface soil moisture and root zone soil moisture (products denoted with *) and represent the area mean over the respective core of the event region in the case of the severity, magnitude, and duration or the temporal maximum in the case of the spatial extent. (b) Product deviations in these drought metrics with respect to the product median of each event, separately calculated for the surface and the root zone (i.e. comparable to the product deviations that are shown in Figs. 11, S3, and S4). In this case, the average of the product median deviations is also shown for the individual products. NA is displayed when products do not exhibit standardised anomalies below −1.5 for a specific event.
The 2011–2012 Iberian Peninsula drought and the 2011 Texas and 2012 Great Plains droughts appear to be the most severe and longest in most of the products with respect to both the surface and root zone layers. The East Africa drought of 2015 shows the strongest magnitudes overall (except in MERRA-2), followed by the 2011–2012 Iberian Peninsula drought. The spatial extents of the droughts reach the highest values for the 2020 European and the 2015–2016 South African droughts, although with large differences between the products. In the root zone, the drought events appear weaker in terms of their magnitude but are often prolonged and partly more severe.
As for the 2022 European drought event, ESA-CCI-ACT often displays weaker droughts according to all metrics compared with the ESA-CCI-COM and the ERA5 and ERA5-Land products. This is also visible in Fig. 8b, which displays the respective product deviations in the drought metrics with respect to the product median of each event as a baseline. The weaker drought representation of ESA-CCI-ACT is particularly pronounced for events in Europe and is evident in all metrics (+17 for severity, +0.2 for magnitude, −6 d for duration, and −129 000 km2 for spatial extent on average over all events). Moreover, MERRA-2 shows weaker droughts in the root zone compared with the other products, which is most evident for events in North America and Africa (+33 for severity, +0.25 for magnitude, −14 d for duration, and −105 000 km2 for spatial extent on average over all events). In the surface layer, the MERRA-2 deviations are more mixed, with a weaker representation of the 2015 East African drought but a stronger representation (particularly in terms of duration and severity) of the 2011 Texas and 2011–2012 Iberian Peninsula droughts. For other events, the durations also tend to be prolonged and the corresponding severities tend to be higher in MERRA-2 surface soil moisture, while the magnitudes are partly weaker and spatial extents are smaller.
Compared with the reanalysis products, ESA-CCI-COM-RZSM shows partly stronger drought severities and corresponding longer event durations (e.g. the 2011–2012 Iberian Peninsula, 2015–2016 South African, and 2011 Texan events) as well as often stronger magnitudes. Furthermore, the spatial extents of the droughts appear larger in ESA-CCI-COM-RZSM in some cases (e.g. the 2007 southeastern Europe, 2015–2016 South African, and 2012 Great Plains events).
4.5 Product intercomparison
The overall product behaviour during the analysed drought events is summarised in Fig. 9. In line with the results of the previous sections, the dampened drought magnitudes and smaller spatial extents in the root zone compared with the surface layer are again visible in the respective products. Moreover, a tendency toward prolonged durations and stronger severities of the droughts in the root zone is observable (except for MERRA-2, which already shows partly longer durations in the surface layer compared with the other products). ESA-CCI-COM-RZSM displays a partly stronger representation of the drought severities and, particularly, magnitudes compared with the reanalysis products, whereas MERRA-2 shows weaker drought magnitudes and partly shorter durations and lower severities.
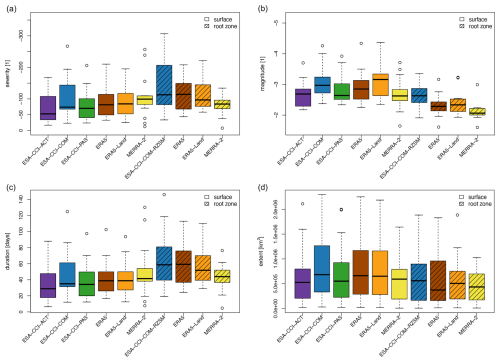
Figure 9Product intercomparison based on the drought metrics of (a) severity, (b) magnitude, (c) duration, and (d) spatial extent. The box-and-whisker plots represent the distributions of the drought metrics for the 17 drought events analysed.
For surface soil moisture, the ESA-CCI-ACT and, to a lesser extent, the ESA-CCI-PAS products tend to show partly weaker drought signals in all presented metrics compared with ESA-CCI-COM, ERA5, and ERA5-Land. This is most pronounced for the drought magnitudes of ESA-CCI-ACT. Similarly to the results for the root zone, ESA-CCI-COM displays partly stronger drought severities (see ESA-CCI-COM-RZSM) and longer durations. As for the root zone, MERRA-2 displays weaker drought magnitudes compared with the other products, while particularly shorter droughts appear partly prolonged (and more severe) in its surface layer (see the 2022 European drought above and the corresponding Figs. 4–6, Table S4, and Fig. 8 for all events).
The spatial extents of the droughts based on surface soil moisture tend to be larger for ESA-CCI-COM, ERA5, and ERA-Land, particularly for larger droughts. In the root zone, the spatial extents of larger droughts tend to be smaller.
Appendix A provides an intercomparison of the products based on their spatial drought metric patterns. Figure A1 shows the pairwise pattern correlations and RMSDs of severity, magnitude, and duration (see Figs. 4–6 for the 2022 European drought) as represented by the products. The Pearson correlations between the patterns of the products are positive and significant for all metrics overall, showing the general product agreement with respect to the location and spatial variation in the considered droughts. The correlations between products are similar for severity and duration (which are related by design; see Sect. 3.2.2), but they tend to be lower for the drought magnitude. As expected, related products (i.e. ERA5 and ERA5-Land or ESA-CCI-COM and ESA-CCI-COM-RZSM) as well as the surface and corresponding root zone soil moisture products show the closest agreement, with correlations of 0.6 for severity and duration (and 0.5 for magnitude). Similarly, correlations between the satellite products also amount to 0.6 for severity and duration but tend to be lower for magnitude. The patterns in the RMSD values are less distinct, but ERA5, ERA5-Land, and ESA-CCI-COM show comparably lower values for severity and duration, whereas ESA-CCI-COM-RZSM and MERRA-2 tend to show the largest values.
5.1 Synthesis of soil moisture trends
Section 4.2 has shown that ERA5 and ERA5-Land appear to be more consistent with observed precipitation and temperature trends. The resulting more widespread soil drying and evapotranspiration decreases can thus be assumed to be more realistic in these products than in MERRA-2. In contrast to ERA5, MERRA-2 does not benefit from an analysis of synoptic surface air temperature observations (Simmons et al., 2017); thus, the latter product is less constrained by ground observations. This could explain the identified regional negative biases in the 2 m temperature trends in MERRA-2 compared with ERA5. The latter includes an assimilation of these ground-based surface air temperature measurements, from which ERA5-Land also indirectly benefits. In addition, the assimilation of 2 m temperature and relative humidity pseudo-observations in the soil moisture analysis of ERA5 tends to have an important impact on root zone soil moisture and the latent and sensible heat fluxes (Fairbairn et al., 2019), which could contribute to the higher sensitivity of ERA5 to drought events.
Apart from the impact of differences in the forcing and in the data assimilation strategies on the observed soil moisture trends in the reanalyses, differing land-surface model parameterisations may further contribute to product-specific drought representation and trends in the reanalyses. In particular, MERRA-2 has been shown to exhibit a prolonged surface soil moisture memory (cf. Fig. 6 in Dirmeyer et al., 2016), which contributes to the observed partly prolonged durations (and stronger severities) of shorter droughts in the surface layer of this product. Furthermore, He et al. (2023) reported that, in water-limited evapotranspiration regimes, MERRA-2 shows a larger overestimation of soil moisture memory times compared with estimates from SMAP, while the bias in ERA5 is lower. It is noted that soil moisture thresholds (i.e. wilting point and critical point; see e.g. Seneviratne et al., 2010) in the land-surface model parameterisations contribute to the observed differences in the soil moisture memory times. Comparing these soil moisture thresholds between ERA5 (based on HTESSEL) and MERRA-2 (based on the CLSM) reveals that both the wilting point and, particularly, the critical point tend to be higher for ERA5 than for MERRA-2 (cf. Fig. 14 in Schwingshackl et al., 2017). This may translate into the observed stronger drought representation of ERA5, as it more quickly enters a soil-moisture-limited evapotranspiration regime during dry-downs.

Figure 10Best-estimate product average of 2000–2022 Theil–Sen trends (in ) for yearly mean (a) surface and (b) root zone soil moisture. Underlying daily data are masked based on the (a) ESA-CCI-COM and (b) ESA-CCI-COM-RZSM data availability as well as on the (a, b) non-frozen soil conditions of ERA5-Land. The mean trends are only shown in areas with trend direction agreement with respect to both respective best-estimate products, while the white colour denotes no consensus with respect to the trend direction. Additionally, areas of common significant trends are hatched.
ERA5, ERA5-Land, and MERRA-2 soil moisture have been jointly evaluated with other reanalyses against in situ observations from various networks (Li et al., 2020; Beck et al., 2021; Zheng et al., 2024). At the network scale, ERA5 showed higher consistency with observed soil moisture compared with MERRA-2 based on temporal correlation coefficients and standard deviations, as well as when considering the correlations of the seasonal-trend-decomposed time series (Li et al., 2020). Furthermore, ERA5-Land soil moisture shows a consistent improvement compared with ERA5 based on a large set of in situ observations (Beck et al., 2021; Muñoz-Sabater et al., 2021). The improvement is more marked for root zone soil moisture than for surface soil moisture. Furthermore, compared with cosmic-ray neutron-sensing observations, ERA5-Land outperforms MERRA-2 (Zheng et al., 2024). Within the remote-sensing products, available validation studies indicate that ESA-CCI-COM outperforms the individual ESA-CCI-ACT and ESA-CCI-PAS products when compared to in situ soil moisture measurements (Gruber et al., 2019; Beck et al., 2021; Hirschi et al., 2023). Moreover, previous studies point to artificial wetting trends in ASCAT soil moisture in areas of widespread deforestation or urban growth (Hahn et al., 2023). This is reflected in the observed larger fractions of wetting trends in ESA-CCI-ACT, which has been solely based on ASCAT observations since 2007. Given these available evaluation studies and the identified biases in MERRA-2 precipitation and temperature trends (Sect. 4.2), we only consider the ESA-CCI-COM-based products and ERA5-Land in the following for a synthesis of the global surface and root zone soil moisture trends based on these best-estimate products. It should be noted that ESA-CCI-COM-RZSM is unlikely to show surface–root-zone decoupling in trends given the exponential filter derivation.
Based on the average of the respective two best-estimate products' trends (Fig. 10), common soil moisture drying can be observed in Siberia; in the region of the Black Sea–Caspian Sea and Central Asia; in parts of Europe and the Mediterranean; in parts of the western USA and the Canadian Prairies; and in larger parts of South America, parts of southern and northern Africa, and northwestern Australia. These drying trends are often significant in both products (p<0.05; see hatched areas in Fig. 10), and the regions are mostly consistent with previous studies on trends in water availability (e.g. Padron et al., 2020). Common wetting trends are present in East Asia and India, southeastern Australia, and eastern Africa. Common significant wetting trends appear less widespread than drying trends and are mostly refined to parts of Asia and central and eastern Africa.
The corresponding global area fractions of common soil moisture drying trends amount to 49.3 % for the surface soil layer and to about 44.5 % for the root zone (Fig. 2a, Table S2). The respective wetting trends amount to 21.1 % (surface) and 20.6 % (root zone), while areas with no consensus with respect to trend direction amount to 29.6 % (surface) and 35.0 % (root zone), reflecting the considerable uncertainties associated with global soil moisture trends.
5.2 Relation of drought representation and soil moisture trends
In the following, we investigate the effect of the diverse and partly contradictory soil moisture trends in the products on their representation of the investigated drought events. For each event and product, Fig. 11 shows the product deviation in the representation of these events in terms of the magnitude vs. the deviation in the 2000–2022 trend. The analysis is stratified by separating the drought regions in areas with drying-trend agreement and in those without trend direction agreement (see respective brown and white areas in Fig. S1c). Trends and magnitudes are averaged over these respective areas, and the respective deviations are calculated with respect to the product median of each event. The chronology of the events within the 2000–2022 period is indicated using an increasing circle size.
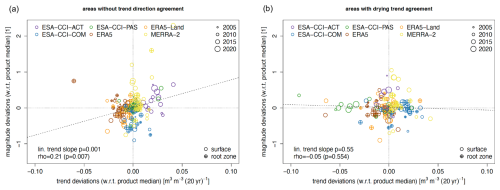
Figure 11Product deviations in drought magnitude as a function of product deviations in the 2000–2022 soil moisture trends, with the circle sizes depending on the chronology of the events within the investigated period (i.e. later events are displayed using larger circles). Panel (a) presents the relation in areas without trend direction agreement of the products, whereas panel (b) shows the relation in areas with a drying-trend agreement. Deviations are displayed with respect to the product median of each event, separately calculated for the surface and the root zone (with the latter additionally indicated with a “+”). The trends and drought magnitudes are averaged over the respective areas of drying-trend agreement and trend direction disagreement within the drought regions. The p values of the linear trend slope (dashed line) and the Spearman rank correlation (ρ) between the drought metrics and the soil moisture trends are noted as well.
The scatter plots reveal that a significant relation between deviations in drought magnitude and deviations in the trend is present in areas without trend direction agreement (Fig. 11a). Thus, as expected, products with negative (positive) deviations in trends are connected with stronger (weaker) drought magnitudes (i.e. corresponding to negative and positive deviations in the magnitude, respectively). The scatter plot in Fig. 11a also indicates a temporal dependency of the deviations, as the largest deviations tend to relate to events occurring after around 2010, further showing the importance of the trend representation with respect to the products' ability to detect droughts. However, in areas with drying-trend agreement of the products (Fig. 11b), such a relation between product deviations in the drought magnitude and the corresponding deviations in the trend is not present. Analogous results are obtained by considering the severity of drought events, rather than their magnitude (Fig. S3). Thus, consensus with respect to the soil moisture drying results in more consistent drought signals in the products. Overall, this analysis highlights that the trend representation has a significant influence on the drought-detection capacity of the products.
For ESA-CCI-ACT and MERRA-2, the positive deviations in the trends and the reduced drought magnitudes and severities are visible in the location of several events in the respective upper-right quadrants of Figs. 11a and S3a. These are the products that show larger area fractions of positive compared with negative trends (see Fig. 2a, Table S2). ESA-CCI-ACT also exhibits an intensification and extension of the wetting trends in the later part of the analysis period (compared to the 2000–2022 period; not shown), which further contributes to the reduced drought magnitudes of later events. An additional contribution may come from active microwave remote-sensing sensing issues during dry spells, which lead to an increase in the backscatter of the signal due to subsurface scattering, resulting in an erroneous increase in soil moisture (Wagner et al., 2022).
Apart from the trend representation, the interannual variability in soil moisture may also contribute to the drought-detection capacity of the products. This is investigated by relating the product deviations in drought severity and magnitude to the product deviations in the interannual variability in the standardised soil moisture anomalies. The interannual variability is characterised by the standard deviation of the annual mean standardised soil moisture anomalies of the 2000–2022 period, which are detrended using a locally weighted scatterplot smoothing (LOWESS) filter. Figure S4a indicates a significant relation between drought severity and the interannual variability in the soil moisture. Thus, products with larger interannual variability in soil moisture display stronger drought severities. However, such a relation is not evident for the drought magnitudes, which show no significant relation with interannual soil moisture variability (Fig. S4b). This may be because magnitude represents only 1 d of each event (i.e. the temporal minimum of the standardised anomalies during the drought period), whereas severity is calculated as the accumulated standardised anomalies over all days below the drought threshold and, thus, tends to be more related to the annual mean of the anomalies.
5.3 Impact of land-surface and bioclimatic variables on satellite soil moisture retrieval and modelling uncertainties
The detected differences in trend (and consequent drought) representation of reanalysis and remote-sensing products (Fig. 1) have partly been reported previously (e.g. Dorigo et al., 2012; Preimesberger et al., 2021). Past studies have linked them to fundamental modelling simplifications in the description of human impacts, which may explain regional differences (Qiu et al., 2016). However, differences also result from the intrinsic trend representation error in the satellite products. The evidence of locally contradicting trends between the ESA-CCI-ACT, ESA-CCI-PAS, and ESA-CCI-COM products considered (Fig. 1) suggests that the differences in the observation system and retrieval algorithm used in the various products have a non-negligible effect on their trend- and drought-detection capacity.
The presented trend analysis is bound to deal with heterogeneity in the true spatial support and sampling frequency of the products, which can explain part of the observed deviations if accounted for explicitly (Wen et al., 2022). In this respect, the satellite products are set apart by the lower observational density that results from ingesting (in the 2000–2022 analysis period) four sensors in the ACTIVE products against more than double that number in the PASSIVE and COMBINED products. This affects the noise levels and – remarkably – their rate of change over time (Hirschi et al., 2023), which leads to biased trends. Moreover, the individual sensors are subject to their own performance drift (Fennig et al., 2020), which propagates into the merged products but is virtually impossible to isolate in the merged soil moisture signal. Generally, spurious trends are also attributed to non-resolved inter-sensor biases in the merging process (Yang et al., 2013). However, this was not found to be the case in antecedent product versions of the ESA CCI products considered (Preimesberger et al., 2021; Su et al., 2016).
Dynamic processes on the land surface present an additional potential impediment to the stability of the soil moisture retrieval and the reanalysis-based soil moisture (and thus trend and anomaly representations). Retrieval algorithms, as well as the land-surface models underlying the reanalyses, may in fact be grounded on stationarity assumptions that are challenged by evolving land-surface characteristics. For instance, the vegetation correction of the H SAF ASCAT soil moisture record ingested in the ESA-CCI-ACT and ESA-CCI-COM products is parameterised on a seasonal basis in the TU Wien model (Naeimi et al., 2009; H SAF, 2021), thus not accounting for interannual differences and trends in vegetation (Vreugdenhil et al., 2016). This may introduce biases over time, leading to an inconsistent representation of the anomalies and to spurious trends in certain areas. The same effect would be caused by temporal variations in the statically calibrated dry reference and wet reference, following soil porosity variations. Abrupt land-cover changes are also not automatically parameterised and cause artificial trends that should be visible, for instance, in areas of widespread deforestation or urban growth (Hahn et al., 2023).
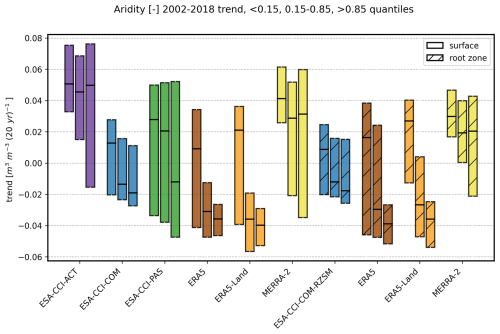
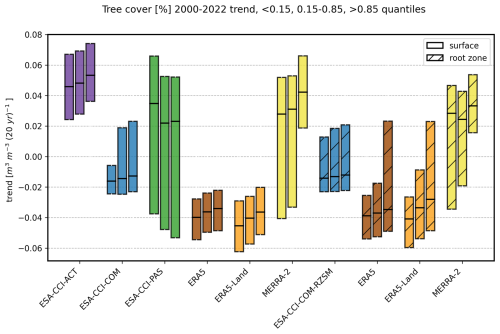
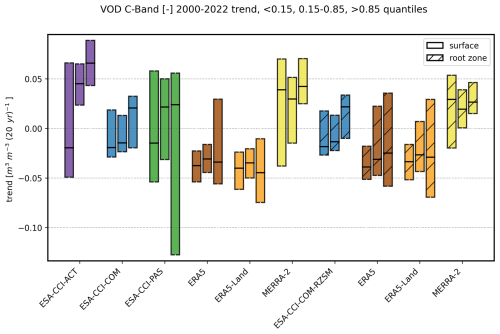
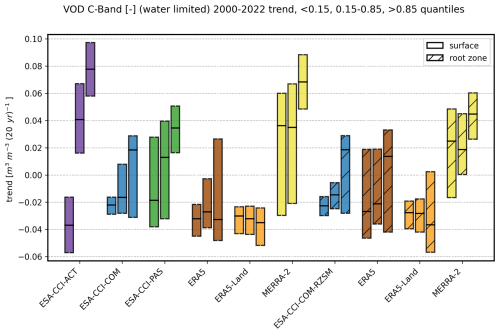
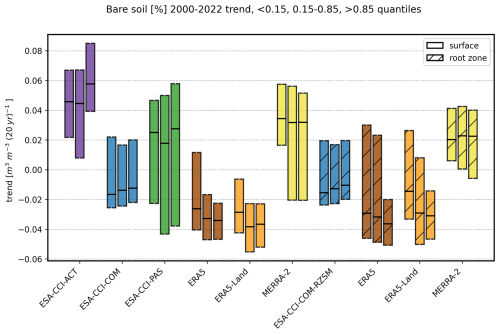
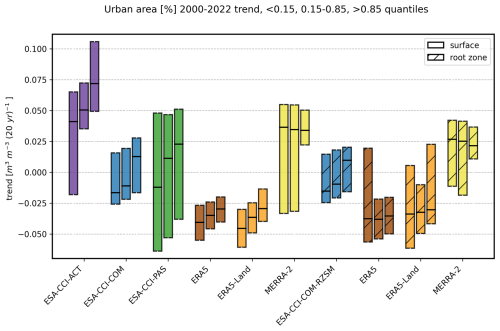
Based on the above, trends in the remote-sensing and reanalysis products – or at least differences between them – might be explained by considering the underlying trends in relevant land-surface characteristics and bioclimatic indicators. Hence, trends in soil moisture are compared globally to those calculated using the maximum number of data available over the 2000–2022 period for the VOD; ERA5-derived aridity (2000–2018 only); and fractional cover values of urban area, bare soil, and tree cover (see Appendix B for the results of these comparisons). The VOD data are masked in a manner consistent with the underlying daily data used for calculating the soil moisture trends; this was not possible for the other variables, as they were already aggregated above the daily level in the original products. In the case of aridity, there appears to be a strong explanatory capacity for the soil moisture trends in all considered reanalyses – not just ERA5 and ERA5-Land, for which this is expected due to the model internal consistency – and in most of the satellite-based products (Fig. B1). On the contrary, the soil moisture trends in ESA-CCI-ACT are mixed for all aridity trend regimes, which is consistent with the weaker drought representation found for this product (Fig. 9). As argued, trends in vegetation cover or density may be reflected in the soil moisture signal of the remote-sensing products, due to the role that these variables play in the uncertainty budget, but they should also reflect the soil moisture signal, as a result of changes in water availability, in both satellite and model data. In the case of tree cover (Fig. B2), ESA-CCI-ACT shows a relation with (dry) wet trends in areas of (de-)forestation, whereas ESA-CCI-PAS shows the opposite relation. A positive relation is, to a lesser extent, also visible in ERA5 and ERA5-Land (more pronounced in the root zone) and in ESA-CCI-COM-RZSM (when considering the upper quartile of the trend distributions) as well as in MERRA-2 (when considering the lower quartile). Conversely, the global VOD (Fig. B3) only explains trends in the ESA-CCI-ACT product and, to a lesser extent, in ESA-CCI-COM and ESA-CCI-COM-RZSM, but it does not relate to the modelled trends in the surface or in the root zone. The physical relation between the VOD and water availability shows more clearly when water-limited areas only are considered (below the 25th percentile of the mean ERA5 100–289 cm depth layer soil moisture for the 2000–2020 period; Fig. B4). In this case, soil moisture emerges more distinctly as a vegetation control in the remote-sensing products (Lyons et al., 2021) and is better captured by the satellite-based products. No distinct relations emerge with bare-soil trends for any of the products (except for a mild negative relation for ERA5 and ERA5-Land trends), although a subsurface scattering effect (Wagner et al., 2022) might explain remarkably wetter trends in the higher bare-ground quantiles for ESA-CCI-ACT (Fig. B5). ESA-CCI-ACT also displays an evident increase in soil moisture trends with trends in the urban area fraction (Fig. B6). This is consistent with similar observations made for the ASCAT-derived products (Hahn et al., 2023) and is also visible in ESA-CCI-COM (which also ingested ASCAT).
In synthesis, several controls can be identified for the soil moisture trends in the various products, although no one variable explains all trends coherently. In some cases (e.g. for urban areas), these may be artefacts of the L0 signal that should be decoupled in the retrieval of soil moisture via an update in the model parameterisation. In other cases, it is reasonable to assume some form of relationship (e.g. for the aridity indicator or for the VOD in water-limited regions), although a few products fail to render this relation.
We investigated the potential of long-term remote-sensing and selected state-of-the-art reanalysis products for characterising soil drying by analysing their 2000–2022 Theil–Sen soil moisture trends and their ability to capture major agroecological drought events of this period. The product differences in the representation of the drought events as a use case were confronted with the soil moisture trends and their drivers, and a synthesis of the global trends was provided based on the best-estimate products. We focused on the relative behaviour of the products to circumvent the lack of widely available ground data of soil moisture. Thus, we did not aim for an in situ validation of the products regarding their representation of the soil moisture trends and considered drought events; rather, we focused on the product ensemble and identified the products with larger deviations from the majority to collect a convergence of evidence.
Global distributions of the soil moisture trends are diverse and partly contradictory between the products. ERA5-Land, ERA5, and ESA-CCI-COM show larger area fractions of drying trends in surface soil moisture, whereas ESA-CCI-ACT and MERRA-2 show larger fractions of wetting trends (with area fractions of approximately 60 % and above in both cases). Moreover, corresponding trend magnitudes diverge, resulting in global mean wetting trends for ESA-CCI-ACT and MERRA-2, whereas all other products show global mean drying trends. The different global patterns of soil moisture trends in the ERA5, ERA5-Land, and MERRA-2 reanalysis products are reflected in regional differences in their runoff and particular evapotranspiration trends. These differences are driven by a positive mean bias in the precipitation trends in MERRA-2 and a larger RMSD compared with ERA5, which has a slight negative bias and a lower RMSD compared with observed precipitation trends (0.171 vs. −0.004 bias and 0.847 vs. 0.492 RMSD for MERRA-2 compared with ERA5). The diverse soil moisture and evapotranspiration trends also show a clear link to regional differences in 2 m temperature trends in parts of Asia, Africa, and North America, where MERRA-2 shows a negative bias compared with observed temperature trends, and a corresponding larger RMSD than ERA5 and ERA5-Land (0.613 K (20 yr)−1 RMSD for MERRA-2 compared with 0.536 K (20 yr)−1 for ERA5 and 0.511 K (20 yr)−1 for ERA5-Land). The lower bias in precipitation trends in ERA5 and its stronger constraint with observed regional temperature trends results in more widespread soil moisture drying and evapotranspiration decreases in ERA5 and ERA5-Land. In MERRA-2, the overly strong positive trends in precipitation translate into more widespread wetting trends in soil moisture and enhanced evapotranspiration as well as an unrealistic regional cooling.
Given these biases in MERRA-2 precipitation and temperature trends and based on available validation studies, ESA-CCI-COM and ESA-CCI-COM-RZSM as well as ERA5-Land were considered for a synthesis of global surface and root zone soil moisture trends. Based on these best-estimate products, common soil moisture drying trends can be observed in 49.3 % of the surface and 44.5 % of the root zone layers of the covered global area. The common drying trends are localised in Siberia; in the region of the Black Sea–Caspian Sea and Central Asia; in parts of Europe and the Mediterranean; in parts of the western USA and the Canadian Prairies; and in larger parts of South America, parts of southern and northern Africa, and northwestern Australia.
We also analysed the products' ability to detect major drought events as a use case based on their severity, magnitude, duration, and spatial extent, which are calculated from standardised daily anomalies of surface and root zone soil moisture. We considered well-documented drought events selected based on the scientific literature and drought reports. The investigated products mostly capture the 17 drought events considered. The ESA-CCI-ACT microwave remote sensing and, to a lesser extent, the ESA-CCI-PAS products tend to show partly weaker drought signals based on surface soil moisture in all metrics compared with the combined ESA-CCI-COM product and ERA5/ERA5-Land. This is most pronounced for the drought magnitudes of ESA-CCI-ACT. The magnitudes are also reduced in MERRA-2, in both the surface layer and the root zone. ESA-CCI-COM displays partly stronger drought severities and prolonged durations. In the root zone (based on the reanalysis products and ESA-CCI-COM-RZSM), the drought events appear dampened with respect to magnitude and smaller with respect to spatial extent, while a tendency toward prolonged durations and stronger severities of the droughts is observable (except for MERRA-2). ESA-CCI-COM-RZSM displays a partly stronger representation of the droughts with respect to severity and magnitude compared with the reanalysis products.
The product deviations with respect to the drought magnitude and severity further showed a significant relation with deviations in the soil moisture trends in areas without trend direction agreement. This is most visible in the reduced drought magnitudes of MERRA-2 and the ESA-CCI-ACT remote-sensing product compared with the other products, which is linked to their larger global fractions of strong positive trends in soil moisture. In areas with drying-trend agreement of the products, however, such a relation between product deviations with respect to the drought magnitude or severity and the corresponding deviations in the trend was not present. This study demonstrates that soil moisture trends play a fundamental role in the drought-detection capacity of different products. Uncertainties in the representation and global distribution of soil moisture trends, as reflected in the large proportions of areas where there is no consensus with respect to trend direction, both between and among remote-sensing and reanalysis products, contribute to product-specific representations of droughts, particularly affecting the drought magnitude.
We also identified several land-surface characteristics and bioclimatic indicators (i.e. the aridity; VOD; and fractional coverage of urban area, tree cover, and bare soil) that control soil moisture trends in the various products, although none of these variables explain all of the trends coherently. The analysis of trends in these land-surface and bioclimatic variables qualitatively showed that the soil moisture trends are affected by retrieval or modelling artefacts, e.g. due to non-valid stationarity assumptions in the land-surface variables. Conversely, trends in these variables may show valid physical relationships to trends in soil moisture (e.g. in the case of aridity and the VOD in water-limited regions), although these relations are not represented by some products. As a future step, the exact sources of such artefacts should be identified to reconcile the different – and partially diverging – trend representations and advance the drought assessment capacity of the remote-sensing observations and reanalysis systems.
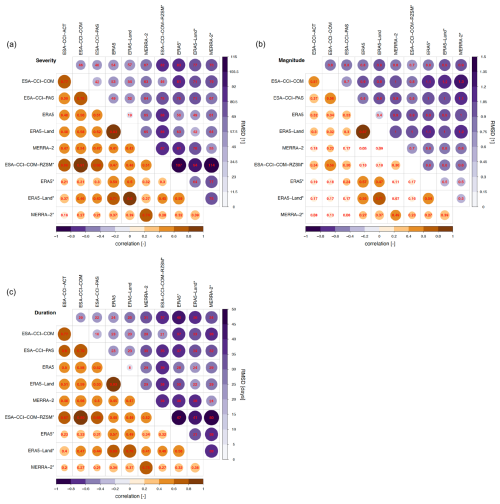
Figure A1Pairwise pattern correlation (lower left) and RMSD (upper right) of (a) drought severity, (b) magnitude, and (c) duration between individual products, calculated over all events. Only significant values are shown for the Pearson correlation (p<0.05), and root zone soil moisture products are denoted using an asterisk (*).
All products used in the study are publicly available. ESA CCI soil moisture (v08.1) is available from http://catalogue.ceda.ac.uk/uuid/ff890589c21f4033803aa550f52c980c (Dorigo et al., 2023). The ESA-CCI-COM-based root zone soil moisture can be accessed at https://doi.org/10.48436/v8cwj-jk556 (Stradiotti and Preimesberger, 2024). ERA5 and ERA5-Land are available from the CDS at https://doi.org/10.24381/cds.adbb2d47 (Hersbach et al., 2023) and https://doi.org/10.24381/cds.e2161bac (Muñoz Sabater, 2019), respectively. MERRA-2 is available from GES DISC at https://doi.org/10.5067/RKPHT8KC1Y1T (GMAO, 2015). CRU TS v4.07 can be downloaded from https://catalogue.ceda.ac.uk/uuid/5fda109ab71947b6b7724077bf7eb753 (Harris et al., 2023).
The supplement related to this article is available online at: https://doi.org/10.5194/hess-29-397-2025-supplement.
MH, PS, BC, WD, and SIS: conceptualisation; MH, BC, and PS: formal analysis, investigation, methodology, and visualisation; MH: writing – original draft preparation; all authors: writing – review and editing.
The contact author has declared that none of the authors has any competing interests.
Publisher's note: Copernicus Publications remains neutral with regard to jurisdictional claims made in the text, published maps, institutional affiliations, or any other geographical representation in this paper. While Copernicus Publications makes every effort to include appropriate place names, the final responsibility lies with the authors.
Martin Hirschi, Pietro Stradiotti, and Wouter Dorigo acknowledge financial support from the ESA's Climate Change Initiative for Soil Moisture. The authors also wish to acknowledge the Copernicus Climate Change Service C3S_511 Quality Assessment of ECV Products, which is funded by the European Union and implemented by ECMWF.
This research has been supported by the European Space Agency (grant no. 4000126684/19/I-NB).
This paper was edited by Xing Yuan and reviewed by three anonymous referees.
Albergel, C., Rüdiger, C., Pellarin, T., Calvet, J.-C., Fritz, N., Froissard, F., Suquia, D., Petitpa, A., Piguet, B., and Martin, E.: From near-surface to root-zone soil moisture using an exponential filter: an assessment of the method based on in-situ observations and model simulations, Hydrol. Earth Syst. Sci., 12, 1323–1337, https://doi.org/10.5194/hess-12-1323-2008, 2008.
Albergel, C., Dorigo, W., Reichle, R. H., Balsamo, G., de Rosnay, P., Munoz-Sabater, J., Isaksen, L., de Jeu, R., and Wagner, W.: Skill and Global Trend Analysis of Soil Moisture from Reanalyses and Microwave Remote Sensing, J. Hydrometeorol., 14, 1259–1277, https://doi.org/10.1175/jhm-d-12-0161.1, 2013.
An, R., Zhang, L., Wang, Z., Quaye-Ballard, J. A., You, J. J., Shen, X. J., Gao, W., Huang, L. J., Zhao, Y. H., and Ke, Z. Y.: Validation of the ESA CCI soil moisture product in China, Int. J. Appl. Earth Obs., 48, 28–36, https://doi.org/10.1016/j.jag.2015.09.009, 2016.
Balsamo, G., Viterbo, P., Beljaars, A., van den Hurk, B., Hirschi, M., Betts, A. K., and Scipal, K.: A Revised Hydrology for the ECMWF Model: Verification from Field Site to Terrestrial Water Storage and Impact in the Integrated Forecast System, J. Hydrometeorol., 10, 623–643, https://doi.org/10.1175/2008jhm1068.1, 2009.
Beck, H. E., Pan, M., Miralles, D. G., Reichle, R. H., Dorigo, W. A., Hahn, S., Sheffield, J., Karthikeyan, L., Balsamo, G., Parinussa, R. M., van Dijk, A. I. J. M., Du, J., Kimball, J. S., Vergopolan, N., and Wood, E. F.: Evaluation of 18 satellite- and model-based soil moisture products using in situ measurements from 826 sensors, Hydrol. Earth Syst. Sci., 25, 17–40, https://doi.org/10.5194/hess-25-17-2021, 2021.
Bosilovich, M. G., Akella, S., Coy, L., Cullather, R., Draper, C., Gelaro, R., Kovach, R., Liu, Q., Molod, A., Norris, P., Wargan, K., Chao, W., Reichle, R., Takacs, L., Vikhliaev, Y., Bloom, S., Collow, A., Firth, S., Labow, G., Partyka, G., Pawson, S., Reale, O., Schubert, S. D., and Suarez, M.: MERRA-2: Initial evaluation of the climate, National Aeronautics and Space Administration, Goddard Space Flight Center, Greenbelt, Maryland, https://gmao.gsfc.nasa.gov/pubs/docs/Bosilovich803.pdf (last access: 10 January 2025), 2015.
Bueechi, E., Fischer, M., Crocetti, L., Trnka, M., Grlj, A., Zappa, L., and Dorigo, W.: Crop yield anomaly forecasting in the Pannonian basin using gradient boosting and its performance in years of severe drought, Agr. Forest Meteorol., 340, 109596, https://doi.org/10.1016/j.agrformet.2023.109596, 2023.
Champagne, C., White, J., Berg, A., Belair, S., and Carrera, M.: Impact of Soil Moisture Data Characteristics on the Sensitivity to Crop Yields Under Drought and Excess Moisture Conditions, Remote Sens.-Basel, 11, 372, https://doi.org/10.3390/rs11040372, 2019.
Cheng, S. J., Guan, X. D., Huang, J. P., Ji, F., and Guo, R. X.: Long-term trend and variability of soil moisture over East Asia, J. Geophys. Res.-Atmos., 120, 8658–8670, https://doi.org/10.1002/2015jd023206, 2015.
Crezee, B., Hirschi, M., Thorne, P., Coll, J., Müller, B., Yang, C., Pisano, A., and Hassler, B.: Deliverable D511.1.5: Data catalogue for extreme events and extreme event metrics, 54 pp., https://drive.google.com/file/d/13KlOW-1xq82LuMKLvbS2MmOtCDMMpYWO/view (last access: 10 January 2025), 2019.
C3S: Land cover classification gridded maps from 1992 to present derived from satellite observation, Copernicus Climate Change Service (C3S) Climate Data Store (CDS) [data set], https://doi.org/10.24381/cds.006f2c9a, 2019.
de Rosnay, P., Drusch, M., Vasiljevic, D., Balsamo, G., Albergel, C., and Isaksen, L.: A simplified Extended Kalman Filter for the global operational soil moisture analysis at ECMWF, Q. J. Roy. Meteor. Soc., 139, 1199–1213, https://doi.org/10.1002/qj.2023, 2013.
de Rosnay, P., Balsamo, G., Albergel, C., Munoz-Sabater, J., and Isaksen, L.: Initialisation of Land Surface Variables for Numerical Weather Prediction, Surv. Geophys., 35, 607–621, https://doi.org/10.1007/s10712-012-9207-x, 2014.
Dirmeyer, P. A., Wu, J. X., Norton, H. E., Dorigo, W. A., Quiring, S. M., Ford, T. W., Santanello, J. A., Bosilovich, M. G., Ek, M. B., Koster, R. D., Balsamo, G., and Lawrence, D. M.: Confronting Weather and Climate Models with Observational Data from Soil Moisture Networks over the United States, J. Hydrometeorol., 17, 1049–1067, https://doi.org/10.1175/Jhm-D-15-0196.1, 2016.
Dorigo, W., de Jeu, R., Chung, D., Parinussa, R., Liu, Y., Wagner, W., and Fernandez-Prieto, D.: Evaluating global trends (1988–2010) in harmonized multi-satellite surface soil moisture, Geophys. Res. Lett., 39, L18405, https://doi.org/10.1029/2012gl052988, 2012.
Dorigo, W., Wagner, W., Albergel, C., Albrecht, F., Balsamo, G., Brocca, L., Chung, D., Ertl, M., Forkel, M., Gruber, A., Haas, E., Hamer, P. D., Hirschi, M., Ikonen, J., de Jeu, R., Kidd, R., Lahoz, W., Liu, Y. Y., Miralles, D., Mistelbauer, T., Nicolai-Shaw, N., Parinussa, R., Pratola, C., Reimer, C., van der Schalie, R., Seneviratne, S. I., Smolander, T., and Lecomte, P.: ESA CCI Soil Moisture for improved Earth system understanding: State-of-the art and future directions, Remote Sens. Environ., 203, 185–215, https://doi.org/10.1016/j.rse.2017.07.001, 2017.
Dorigo, W., Himmelbauer, I., Aberer, D., Schremmer, L., Petrakovic, I., Zappa, L., Preimesberger, W., Xaver, A., Annor, F., Ardö, J., Baldocchi, D., Bitelli, M., Blöschl, G., Bogena, H., Brocca, L., Calvet, J.-C., Camarero, J. J., Capello, G., Choi, M., Cosh, M. C., van de Giesen, N., Hajdu, I., Ikonen, J., Jensen, K. H., Kanniah, K. D., de Kat, I., Kirchengast, G., Kumar Rai, P., Kyrouac, J., Larson, K., Liu, S., Loew, A., Moghaddam, M., Martínez Fernández, J., Mattar Bader, C., Morbidelli, R., Musial, J. P., Osenga, E., Palecki, M. A., Pellarin, T., Petropoulos, G. P., Pfeil, I., Powers, J., Robock, A., Rüdiger, C., Rummel, U., Strobel, M., Su, Z., Sullivan, R., Tagesson, T., Varlagin, A., Vreugdenhil, M., Walker, J., Wen, J., Wenger, F., Wigneron, J. P., Woods, M., Yang, K., Zeng, Y., Zhang, X., Zreda, M., Dietrich, S., Gruber, A., van Oevelen, P., Wagner, W., Scipal, K., Drusch, M., and Sabia, R.: The International Soil Moisture Network: serving Earth system science for over a decade, Hydrol. Earth Syst. Sci., 25, 5749–5804, https://doi.org/10.5194/hess-25-5749-2021, 2021a.
Dorigo, W., Preimesberger, W., Moesinger, L., Pasik, A., Scanlon, T., Hahn, S., Van der Schalie, R., Van der Vliet, M., De Jeu, R., Kidd, R., Rodriguez-Fernandez, N., and Hirschi, M.: ESA Soil Moisture Climate Change Initiative (Soil_Moisture_cci): Version 06.1 data collection [data set], https://doi.org/10.5285/28935552223242ca97953a8db99c2821, 2021b.
Dorigo, W., Preimesberger, W., Hahn, S., Van der Schalie, R., De Jeu, R., Kidd, R., Rodriguez-Fernandez, N., Hirschi, M., Stradiotti, P., Frederikse, T., Gruber, A., and Madelon, R.: ESA Soil Moisture Climate Change Initiative (Soil_Moisture_cci): Version 08.1 data collection, NERC EDS Centre for Environmental Data Analysis [data set], http://catalogue.ceda.ac.uk/uuid/ff890589c21f4033803aa550f52c980c (last access: 10 January 2025), 2023.
Dorigo, W. A., Wagner, W., Hohensinn, R., Hahn, S., Paulik, C., Xaver, A., Gruber, A., Drusch, M., Mecklenburg, S., van Oevelen, P., Robock, A., and Jackson, T.: The International Soil Moisture Network: a data hosting facility for global in situ soil moisture measurements, Hydrol. Earth Syst. Sci., 15, 1675–1698, https://doi.org/10.5194/hess-15-1675-2011, 2011.
Dorigo, W. A., Gruber, A., De Jeu, R. A. M., Wagner, W., Stacke, T., Loew, A., Albergel, C., Brocca, L., Chung, D., Parinussa, R. M., and Kidd, R.: Evaluation of the ESA CCI soil moisture product using ground-based observations, Remote Sens. Environ., 162, 380–395, https://doi.org/10.1016/j.rse.2014.07.023, 2015.
Douville, H., Raghavan, K., Renwick, J., Allan, R. P., Arias, P. A., Barlow, M., Cerezo-Mota, R., Cherchi, A., Gan, T. Y., Gergis, J., Jiang, D., Khan, A., Mba, W. P., Rosenfeld, D., Tierney, J., and Zolina, O.: Water Cycle Changes, in: Climate Change 2021: The Physical Science Basis. Contribution of Working Group I to the Sixth Assessment Report of the Intergovernmental Panel on Climate Change, edited by: Masson-Delmotte, V., Zhai, P., Pirani, A., Connors, S. L., Péan, C., Berger, S., Caud, N., Chen, Y., Goldfarb, L., Gomis, M. I., Huang, M., Leitzell, K., Lonnoy, E., Matthews, J. B. R., Maycock, T. K., Waterfield, T., Yelekçi, O., Yu, R., and Zhou, B., Cambridge University Press, 1055–1210, https://doi.org/10.1017/9781009157896.010, 2021.
Fairbairn, D., de Rosnay, P., and Browne, P. A.: The New Stand-Alone Surface Analysis at ECMWF: Implications for Land-Atmosphere DA Coupling, J. Hydrometeorol., 20, 2023–2042, https://doi.org/10.1175/Jhm-D-19-0074.1, 2019.
Feng, H. H. and Zhang, M. Y.: Global land moisture trends: drier in dry and wetter in wet over land, Sci. Rep.-UK, 5, 18018, https://doi.org/10.1038/srep18018, 2015.
Fennig, K., Schröder, M., Andersson, A., and Hollmann, R.: A Fundamental Climate Data Record of SMMR, SSM/I, and SSMIS brightness temperatures, Earth Syst. Sci. Data, 12, 647–681, https://doi.org/10.5194/essd-12-647-2020, 2020.
GCOS: The global observing system for climate: Implementation needs, GCOS-200, https://library.wmo.int/idurl/4/55469 (last access: 10 January 2025), 2016.
Gelaro, R., McCarty, W., Suarez, M. J., Todling, R., Molod, A., Takacs, L., Randles, C. A., Darmenov, A., Bosilovich, M. G., Reichle, R., Wargan, K., Coy, L., Cullather, R., Draper, C., Akella, S., Buchard, V., Conaty, A., da Silva, A. M., Gu, W., Kim, G.-K., Koster, R., Lucchesi, R., Merkova, D., Nielsen, J. E., Partyka, G., Pawson, S., Putman, W., Rienecker, M., Schubert, S. D., Sienkiewicz, M., and Zhao, B.: The Modern-Era Retrospective Analysis for Research and Applications, Version 2 (MERRA-2), J. Climate, 30, 5419–5454, https://doi.org/10.1175/jcli-d-16-0758.1, 2017.
GMAO: MERRA-2 tavg1_2d_lnd_Nx: 2d,1-Hourly,Time-Averaged,Single-Level,Assimilation,Land Surface Diagnostics V5.12.4, Goddard Earth Sciences Data and Information Services Center (GES DISC) [data set], https://doi.org/10.5067/RKPHT8KC1Y1T, 2015.
Gruber, A., Scanlon, T., van der Schalie, R., Wagner, W., and Dorigo, W.: Evolution of the ESA CCI Soil Moisture climate data records and their underlying merging methodology, Earth Syst. Sci. Data, 11, 717–739, https://doi.org/10.5194/essd-11-717-2019, 2019.
Gu, X. H., Li, J. F., Chen, Y. D., Kong, D. D., and Liu, J. Y.: Consistency and Discrepancy of Global Surface Soil Moisture Changes From Multiple Model-Based Data Sets Against Satellite Observations, J. Geophys. Res.-Atmos., 124, 1474–1495, https://doi.org/10.1029/2018jd029304, 2019.
Gudmundsson, L., Rego, F. C., Rocha, M., and Seneviratne, S. I.: Predicting above normal wildfire activity in southern Europe as a function of meteorological drought, Environ. Res. Lett., 9, 084008, https://doi.org/10.1088/1748-9326/9/8/084008, 2014.
Hahn, S., Wagner, W., Alves, O., Muguda Sanjeevamurthy, P., Vreugdenhil, M., and Melzer, T.: Metop ASCAT soil moisture trends: Mitigating the effects of long-term land cover changes, EGU General Assembly 2023, Vienna, Austria, 24–28 Apr 2023, EGU23-16205, https://doi.org/10.5194/egusphere-egu23-16205, 2023.
Hanel, M., Rakovec, O., Markonis, Y., Maca, P., Samaniego, L., Kysely, J., and Kumar, R.: Revisiting the recent European droughts from a long-term perspective, Sci. Rep., 8, 9499, https://doi.org/10.1038/s41598-018-27464-4, 2018.
Harris, I., Osborn, T. J., Jones, P., and Lister, D.: Version 4 of the CRU TS monthly high-resolution gridded multivariate climate dataset, Scientific Data, 7, 109, https://doi.org/10.1038/s41597-020-0453-3, 2020.
Harris, I. C., Jones, P. D., and Osborn, T.: CRU TS4.07: Climatic Research Unit (CRU) Time-Series (TS) version 4.07 of high-resolution gridded data of month-by-month variation in climate (Jan. 1901–Dec. 2022), NERC EDS Centre for Environmental Data Analysis [data set], https://catalogue.ceda.ac.uk/uuid/5fda109ab71947b6b7724077bf7eb753 (last access: 10 January 2025), 2023.
He, Q., Lu, H., and Yang, K.: Soil Moisture Memory of Land Surface Models Utilized in Major Reanalyses Differ Significantly From SMAP Observation, Earths Future, 11, e2022EF003215, https://doi.org/10.1029/2022EF003215, 2023.
Hersbach, H., Bell, B., Berrisford, P., Hirahara, S., Horányi, A., Muñoz-Sabater, J., Nicolas, J., Peubey, C., Radu, R., Schepers, D., Simmons, A., Soci, C., Abdalla, S., Abellan, X., Balsamo, G., Bechtold, P., Biavati, G., Bidlot, J., Bonavita, M., De Chiara, G., Dahlgren, P., Dee, D., Diamantakis, M., Dragani, R., Flemming, J., Forbes, R., Fuentes, M., Geer, A., Haimberger, L., Healy, S., Hogan, R. J., Hólm, E., Janisková, M., Keeley, S., Laloyaux, P., Lopez, P., Lupu, C., Radnoti, G., de Rosnay, P., Rozum, I., Vamborg, F., Villaume, S., and Thépaut, J.-N.: The ERA5 Global Reanalysis, Q. J. Roy. Meteor. Soc., 146, 1999–2049, https://doi.org/10.1002/qj.3803, 2020.
Hersbach, H., Bell, B., Berrisford, P., Biavati, G., Horányi, A., Muñoz Sabater, J., Nicolas, J., Peubey, C., Radu, R., Rozum, I., Schepers, D., Simmons, A., Soci, C., Dee, D., and Thépaut, J.-N.: ERA5 hourly data on single levels from 1940 to present, Copernicus Climate Change Service (C3S) Climate Data Store (CDS) [data set], https://doi.org/10.24381/cds.adbb2d47, 2023.
Hirschi, M., Seneviratne, S. I., Alexandrov, V., Boberg, F., Boroneant, C., Christensen, O. B., Formayer, H., Orlowsky, B., and Stepanek, P.: Observational evidence for soil-moisture impact on hot extremes in southeastern Europe, Nat. Geosci., 4, 17–21, https://doi.org/10.1038/Ngeo1032, 2011.
Hirschi, M., Mueller, B., Dorigo, W., and Seneviratne, S. I.: Using remotely sensed soil moisture for land-atmosphere coupling diagnostics: The role of surface vs. root-zone soil moisture variability, Remote Sens. Environ., 154, 246–252, https://doi.org/10.1016/j.rse.2014.08.030, 2014.
Hirschi, M., Stradiotti, P., Preimesberger, W., Dorigo, W., and Kidd, R.: Product Validation and Intercomparison Report (PVIR): Supporting Product version v08.1. Deliverable D4.1 Version 1, ESA Climate Change Initiative Plus – Soil Moisture, https://doi.org/10.5281/zenodo.8320930, 2023.
H SAF: Algorithm Theoretical Baseline Document (ATBD) Metop ASCAT Surface Soil Moisture Climate Data Record v7 12.5 km sampling (H119) and extension (H120), v0.1, 2021.
Jia, B. H., Liu, J. G., Xie, Z. H., and Shi, C. X.: Interannual Variations and Trends in Remotely Sensed and Modeled Soil Moisture in China, J. Hydrometeorol., 19, 831–847, https://doi.org/10.1175/Jhm-D-18-0003.1, 2018.
Koster, R. D., Suarez, M. J., Ducharne, A., Stieglitz, M., and Kumar, P.: A catchment-based approach to modeling land surface processes in a general circulation model: 1. Model structure, J. Geophys. Res.-Atmos., 105, 24809–24822, https://doi.org/10.1029/2000jd900327, 2000.
Koster, R. D., Guo, Z., Yang, R., Dirmeyer, P. A., Mitchell, K., and Puma, M. J.: On the Nature of Soil Moisture in Land Surface Models, J. Climate, 22, 4322–4335, https://doi.org/10.1175/2009jcli2832.1, 2009.
Koster, R. D., Mahanama, S. P. P., Livneh, B., Lettenmaier, D. P., and Reichle, R. H.: Skill in streamflow forecasts derived from large-scale estimates of soil moisture and snow, Nat. Geosci., 3, 613–616, https://doi.org/10.1038/Ngeo944, 2010.
Li, M., Wu, P., and Ma, Z.: A comprehensive evaluation of soil moisture and soil temperature from third-generation atmospheric and land reanalysis data sets, Int. J. Climatol., 40, 5744–5766, https://doi.org/10.1002/joc.6549, 2020.
Li, X. W., Gao, X. Z., Wang, J. K., and Guoa, H. D.: Microwave soil moisture dynamics and response to climate change in Central Asia and Xinjiang Province, China, over the last 30 years, J. Appl. Remote Sens., 9, 096012, https://doi.org/10.1117/1.Jrs.9.096012, 2015.
Liu, L. B., Gudmundsson, L., Hauser, M., Qin, D. H., Li, S. C., and Seneviratne, S. I.: Soil moisture dominates dryness stress on ecosystem production globally, Nat. Commun., 11, 4892, https://doi.org/10.1038/s41467-020-18631-1, 2020.
Lloyd-Hughes, B. and Saunders, M. A.: A drought climatology for Europe, Int. J. Climatol., 22, 1571–1592, https://doi.org/10.1002/joc.846, 2002.
Loew, A., Stacke, T., Dorigo, W., de Jeu, R., and Hagemann, S.: Potential and limitations of multidecadal satellite soil moisture observations for selected climate model evaluation studies, Hydrol. Earth Syst. Sci., 17, 3523–3542, https://doi.org/10.5194/hess-17-3523-2013, 2013.
Lyons, D. S., Dobrowski, S. Z., Holden, Z. A., Maneta, M. P., and Sala, A.: Soil moisture variation drives canopy water content dynamics across the western US, Remote Sens. Environ., 253, 112233, https://doi.org/10.1016/j.rse.2020.112233, 2021.
McKee, T. B., Doesken, N. J., and Kleist, J.: The relationship of drought frequency and duration to time scales, in: Eighth Conference on Applied Climatology, 17–22 January 1993, Anaheim, California, USA, 179–184,1993.
Miralles, D. G., Teuling, A. J., van Heerwaarden, C. C., and Vila-Guerau de Arellano, J.: Mega-heatwave temperatures due to combined soil desiccation and atmospheric heat accumulation, Nat. Geosci., 7, 345–349, https://doi.org/10.1038/ngeo2141, 2014.
Moravec, V., Markonis, Y., Rakovec, O., Kumar, R., and Hanel, M.: A 250-Year European Drought Inventory Derived From Ensemble Hydrologic Modeling, Geophys. Res. Lett., 46, 5909–5917, https://doi.org/10.1029/2019gl082783, 2019.
Mueller, B. and Seneviratne, S. I.: Hot days induced by precipitation deficits at the global scale, P. Natl. Acad. Sci. USA, 109, 12398–12403, https://doi.org/10.1073/pnas.1204330109, 2012.
Muñoz Sabater, J.: ERA5-Land hourly data from 1950 to present, Copernicus Climate Change Service (C3S) Climate Data Store (CDS) [data set], https://doi.org/10.24381/cds.e2161bac, 2019.
Muñoz-Sabater, J., Dutra, E., Agustí-Panareda, A., Albergel, C., Arduini, G., Balsamo, G., Boussetta, S., Choulga, M., Harrigan, S., Hersbach, H., Martens, B., Miralles, D. G., Piles, M., Rodríguez-Fernández, N. J., Zsoter, E., Buontempo, C., and Thépaut, J.-N.: ERA5-Land: a state-of-the-art global reanalysis dataset for land applications, Earth Syst. Sci. Data, 13, 4349–4383, https://doi.org/10.5194/essd-13-4349-2021, 2021.
Naeimi, V., Scipal, K., Bartalis, Z., Hasenauer, S., and Wagner, W.: An Improved Soil Moisture Retrieval Algorithm for ERS and METOP Scatterometer Observations, IEEE T. Geosci. Remote, 47, 1999–2013, https://doi.org/10.1109/Tgrs.2008.2011617, 2009.
Orlowsky, B. and Seneviratne, S. I.: Elusive drought: uncertainty in observed trends and short- and long-term CMIP5 projections, Hydrol. Earth Syst. Sci., 17, 1765–1781, https://doi.org/10.5194/hess-17-1765-2013, 2013.
Padron, R. S., Gudmundsson, L., Decharme, B., Ducharne, A., Lawrence, D. M., Mao, J. F., Peano, D., Krinner, G., Kim, H., and Seneviratne, S. I.: Observed changes in dry-season water availability attributed to human-induced climate change, Nat. Geosci., 13, 477–481, https://doi.org/10.1038/s41561-020-0594-1, 2020.
Pasik, A., Gruber, A., Preimesberger, W., De Santis, D., and Dorigo, W.: Uncertainty estimation for a new exponential-filter-based long-term root-zone soil moisture dataset from Copernicus Climate Change Service (C3S) surface observations, Geosci. Model Dev., 16, 4957–4976, https://doi.org/10.5194/gmd-16-4957-2023, 2023.
Preimesberger, W., Scanlon, T., Su, C.-H., Gruber, A., and Dorigo, W.: Homogenization of Structural Breaks in the Global ESA CCI Soil Moisture Multisatellite Climate Data Record, IEEE T. Geosci. Remote, 59, 2845–2862, https://doi.org/10.1109/tgrs.2020.3012896, 2021.
Qiu, J. X., Gao, Q. Z., Wang, S., and Su, Z. R.: Comparison of temporal trends from multiple soil moisture data sets and precipitation: The implication of irrigation on regional soil moisture trend, Int. J. Appl. Earth Obs., 48, 17–27, https://doi.org/10.1016/j.jag.2015.11.012, 2016.
Rahmani, A., Golian, S., and Brocca, L.: Multiyear monitoring of soil moisture over Iran through satellite and reanalysis soil moisture products, Int. J. Appl. Earth Obs., 48, 85–95, https://doi.org/10.1016/j.jag.2015.06.009, 2016.
Reichle, R. H., Draper, C. S., Liu, Q., Girotto, M., Mahanama, S. P. P., Koster, R. D., and De Lannoy, G. J. M.: Assessment of MERRA-2 Land Surface Hydrology Estimates, J. Climate, 30, 2937–2960, https://doi.org/10.1175/jcli-d-16-0720.1, 2017a.
Reichle, R. H., Liu, Q., Koster, R. D., Draper, C. S., Mahanama, S. P. P., and Partyka, G. S.: Land Surface Precipitation in MERRA-2, J. Climate, 30, 1643–1664, https://doi.org/10.1175/jcli-d-16-0570.1, 2017b.
Rodell, M., Houser, P. R., Jambor, U., Gottschalck, J., Mitchell, K., Meng, C. J., Arsenault, K., Cosgrove, B., Radakovich, J., Bosilovich, M., Entin, J. K., Walker, J. P., Lohmann, D., and Toll, D.: The global land data assimilation system, B. Am. Meteorol. Soc., 85, 381–394, https://doi.org/10.1175/Bams-85-3-381, 2004.
Saxton, K. E. and Rawls, W. J.: Soil water characteristic estimates by texture and organic matter for hydrologic solutions, Soil Sci. Soc. Am. J., 70, 1569–1578, https://doi.org/10.2136/sssaj2005.0117, 2006.
Scherrer, S. C., Hirschi, M., Spirig, C., Maurer, F., and Kotlarski, S.: Trends and drivers of recent summer drying in Switzerland, Environmental Research Communications, 4, 025004, https://doi.org/10.1088/2515-7620/ac4fb9, 2022.
Schumacher, D. L., Zachariah, M., Otto, F., Barnes, C., Philip, S., Kew, S., Vahlberg, M., Singh, R., Heinrich, D., Arrighi, J., van Aalst, M., Thalheimer, L., Raju, E., Hauser, M., Hirschi, M., Gudmundsson, L., Beaudoing, H. K., Rodell, M., Li, S., Yang, W., Vecchi, G. A., Vautard, R., Harrington, L. J., and Seneviratne, S. I.: High temperatures exacerbated by climate change made 2022 Northern Hemisphere soil moisture droughts more likely, World Weather Attribution, https://www.worldweatherattribution.org/wp-content/uploads/WCE-NH-drought-scientific-report.pdf (last access: 10 January 2025), 2022.
Schumacher, D. L., Zachariah, M., Otto, F., Barnes, C., Philip, S., Kew, S., Vahlberg, M., Singh, R., Heinrich, D., Arrighi, J., van Aalst, M., Hauser, M., Hirschi, M., Bessenbacher, V., Gudmundsson, L., Beaudoing, H. K., Rodell, M., Li, S., Yang, W., Vecchi, G. A., Harrington, L. J., Lehner, F., Balsamo, G., and Seneviratne, S. I.: Detecting the human fingerprint in the summer 2022 western–central European soil drought, Earth Syst. Dynam., 15, 131–154, https://doi.org/10.5194/esd-15-131-2024, 2024.
Schwingshackl, C., Hirschi, M., and Seneviratne, S. I.: Quantifying Spatiotemporal Variations of Soil Moisture Control on Surface Energy Balance and Near-Surface Air Temperature, J. Climate, 30, 7105–7124, https://doi.org/10.1175/Jcli-D-16-0727.1, 2017.
Seneviratne, S. I.: Climate science: Historical drought trends revisited, Nature, 491, 338–339, https://doi.org/10.1038/491338a, 2012.
Seneviratne, S. I., Corti, T., Davin, E. L., Hirschi, M., Jaeger, E. B., Lehner, I., Orlowsky, B., and Teuling, A. J.: Investigating soil moisture-climate interactions in a changing climate: A review, Earth-Sci. Rev., 99, 125–161, https://doi.org/10.1016/j.earscirev.2010.02.004, 2010.
Seneviratne, S. I., Zhang, X., Adnan, M., Badi, W., Dereczynski, C., Luca, A. D., Ghosh, S., Iskandar, I., Kossin, J., Lewis, S., Otto, F., Pinto, I., Satoh, M., Vicente-Serrano, S. M., Wehner, M., and Zhou, B.: Weather and Climate Extreme Events in a Changing Climate, in: Climate Change 2021: The Physical Science Basis. Contribution of Working Group I to the Sixth Assessment Report of the Intergovernmental Panel on Climate Change, edited by: Masson-Delmotte, V., Zhai, P., Pirani, A., Connors, S. L., Péan, C., Berger, S., Caud, N., Chen, Y., Goldfarb, L., Gomis, M. I., Huang, M., Leitzell, K., Lonnoy, E., Matthews, J. B. R., Maycock, T. K., Waterfield, T., Yelekçi, O., Yu, R., and Zhou, B., Cambridge University Press, 1513–1766, https://doi.org/10.1017/9781009157896.013, 2021.
Simmons, A. J., Berrisford, P., Dee, D. P., Hersbach, H., Hirahara, S., and Thepaut, J. N.: A reassessment of temperature variations and trends from global reanalyses and monthly surface climatological datasets, Q. J. Roy. Meteor. Soc., 143, 101–119, https://doi.org/10.1002/qj.2949, 2017.
Stahl, K., Kohn, I., Blauhut, V., Urquijo, J., De Stefano, L., Acácio, V., Dias, S., Stagge, J. H., Tallaksen, L. M., Kampragou, E., Van Loon, A. F., Barker, L. J., Melsen, L. A., Bifulco, C., Musolino, D., de Carli, A., Massarutto, A., Assimacopoulos, D., and Van Lanen, H. A. J.: Impacts of European drought events: insights from an international database of text-based reports, Nat. Hazards Earth Syst. Sci., 16, 801–819, https://doi.org/10.5194/nhess-16-801-2016, 2016.
Stradiotti, P. and Preimesberger, W.: ESA CCI SM RZSM Long-term Climate Record of Root-Zone Soil Moisture from merged multi-satellite observations (9.1), TU Wien [data set], https://doi.org/10.48436/v8cwj-jk556, 2024.
Su, C.-H., Ryu, D., Dorigo, W., Zwieback, S., Gruber, A., Albergel, C., Reichle, R. H., and Wagner, W.: Homogeneity of a global multisatellite soil moisture climate data record, Geophys. Res. Lett., 43, 11245–11252, https://doi.org/10.1002/2016gl070458, 2016.
Teuling, A. J., Van Loon, A. F., Seneviratne, S. I., Lehner, I., Aubinet, M., Heinesch, B., Bernhofer, C., Grunwald, T., Prasse, H., and Spank, U.: Evapotranspiration amplifies European summer drought, Geophys. Res. Lett., 40, 2071–2075, https://doi.org/10.1002/grl.50495, 2013.
Trnka, M., Brazdil, R., Mozny, M., Stepanek, P., Dobrovolny, P., Zahradnicek, P., Balek, J., Semeradova, D., Dubrovsky, M., Hlavinka, P., Eitzinger, J., Wardlow, B., Svoboda, M., Hayesi, M., and Zalud, Z.: Soil moisture trends in the Czech Republic between 1961 and 2012, Int. J. Climatol., 35, 3733–3747, https://doi.org/10.1002/joc.4242, 2015.
Vreugdenhil, M., Dorigo, W. A., Wagner, W., de Jeu, R. A. M., Hahn, S., and van Marle, M. J. E.: Analyzing the Vegetation Parameterization in the TU-Wien ASCAT Soil Moisture Retrieval, IEEE T. Geosci. Remote, 54, 3513–3531, https://doi.org/10.1109/Tgrs.2016.2519842, 2016.
Vroege, W., Bucheli, J., Dalhaus, T., Hirschi, M., and Finger, R.: Insuring crops from space: the potential of satellite-retrieved soil moisture to reduce farmers' drought risk exposure, Eur. Rev. Agric. Econ., 48, 266–314, https://doi.org/10.1093/erae/jbab010, 2021.
Wagner, W., Lemoine, G., and Rott, H.: A method for estimating soil moisture from ERS scatterometer and soil data, Remote Sens. Environ., 70, 191–207, https://doi.org/10.1016/S0034-4257(99)00036-X, 1999.
Wagner, W., Lindorfer, R., Melzer, T., Hahn, S., Bauer-Marschallinger, B., Morrison, K., Calvet, J. C., Hobbs, S., Quast, R., Greimeister-Pfeil, I., and Vreugdenhil, M.: Widespread occurrence of anomalous C-band backscatter signals in arid environments caused by subsurface scattering, Remote Sens. Environ., 276, 113025, https://doi.org/10.1016/j.rse.2022.113025, 2022.
Wang, S. S., Mo, X. G., Liu, S. X., Lin, Z. H., and Hu, S.: Validation and trend analysis of ECV soil moisture data on cropland in North China Plain during 1981–2010, Int. J. Appl. Earth Obs., 48, 110–121, https://doi.org/10.1016/j.jag.2015.10.010, 2016.
Wen, J., Wu, X., You, D., Ma, X., Ma, D., Wang, J., and Xiao, Q.: The main inherent uncertainty sources in trend estimation based on satellite remote sensing data, Theor. Appl. Climatol., 151, 915–934, https://doi.org/10.1007/s00704-022-04312-0, 2022.
WMO: Guidelines on the Definition and Characterization of Extreme Weather and Climate Events, WMO-No. 1310, https://library.wmo.int/idurl/4/58396 (last access: 10 January 2025), 2023.
Wouters, H.: Global bioclimatic indicators from 1979 to 2018 derived from reanalysis [data set], https://doi.org/10.24381/cds.bce175f0, 2021.
Yang, C. X., Cagnazzo, C., Artale, V., Nardelli, B. B., Buontempo, C., Busatto, J., Caporaso, L., Cesarini, C., Cionni, I., Coll, J., Crezee, B., Cristofanelli, P., de Toma, V., Essa, Y. H., Eyring, V., Fierli, F., Grant, L., Hassler, B., Hirschi, M., Huybrechts, P., Le Merle, E., Leonelli, F. E., Lin, X., Madonna, F., Mason, E., Massonnet, F., Marcos, M., Marullo, S., Muller, B., Obregon, A., Organelli, E., Palacz, A., Pascual, A., Pisano, A., Putero, D., Rana, A., Sanchez-Roman, A., Seneviratne, S. I., Serva, F., Storto, A., Thiery, W., Throne, P., Van Tricht, L., Verhaegen, Y., Volpe, G., and Santoleri, R.: Independent Quality Assessment of Essential Climate Variables: Lessons Learned from the Copernicus Climate Change Service, B. Am. Meteorol. Soc., 103, E2032–E2049, https://doi.org/10.1175/Bams-D-21-0109.1, 2022.
Yang, J., Gong, P., Fu, R., Zhang, M. H., Chen, J. M., Liang, S. L., Xu, B., Shi, J. C., and Dickinson, R.: The role of satellite remote sensing in climate change studies, Nat. Clim. Change, 3, 875–883, https://doi.org/10.1038/Nclimate1908, 2013.
Zaitchik, B. F., Rodell, M., Biasutti, M., and Seneviratne, S. I.: Wetting and drying trends under climate change, Nature Water, 1, 502–513, https://doi.org/10.1038/s44221-023-00073-w, 2023.
Zheng, X. M., Zhao, K., Ding, Y. L., Jiang, T., Zhang, S. Y., and Jin, M. J.: The spatiotemporal patterns of surface soil moisture in Northeast China based on remote sensing products, J. Water Clim. Change, 7, 708–720, https://doi.org/10.2166/wcc.2016.106, 2016.
Zheng, Y., Coxon, G., Woods, R., Power, D., Rico-Ramirez, M. A., McJannet, D., Rosolem, R., Li, J., and Feng, P.: Evaluation of reanalysis soil moisture products using cosmic ray neutron sensor observations across the globe, Hydrol. Earth Syst. Sci., 28, 1999–2022, https://doi.org/10.5194/hess-28-1999-2024, 2024.
Zotta, R.-M., Moesinger, L., van der Schalie, R., Vreugdenhil, M., Preimesberger, W., Frederikse, T., de Jeu, R., and Dorigo, W.: VODCA v2: multi-sensor, multi-frequency vegetation optical depth data for long-term canopy dynamics and biomass monitoring, Earth Syst. Sci. Data, 16, 4573–4617, https://doi.org/10.5194/essd-16-4573-2024, 2024.


