the Creative Commons Attribution 4.0 License.
the Creative Commons Attribution 4.0 License.
 | 13 Aug 2025
Predicting snow cover and frozen ground impacts on large basin runoff: developing appropriate model complexity
Nan Wu
Amir Naghibi
Hossein Hashemi
Zhongrui Ning
Qinuo Zhang
Xuejun Yi
Haijun Wang
Wei Liu
Wei Gao
Jerker Jarsjö
In cold regions, snow cover and seasonally frozen ground (SFG) exert a substantial influence on hydrological processes, yet their effects – especially at the scale of large basins – remain insufficiently understood due to limited observations and process-based analyses. To address this, we extended the widely used Grid Xinanjiang (GXAJ) hydrological model by developing two physically meaningful yet computationally efficient modules: (i) the GXAJ-S model, which incorporates snowmelt processes, and (ii) the GXAJ-S-SF model, which additionally accounts for freeze–thaw cycles of SFG. These modules strike a balance between physical representation and simplicity, making them applicable in data-sparse cold regions. The model performance was evaluated using multi-source remote sensing/reanalysis data and observed daily runoff, enabling a systematic investigation of how snow and SFG jointly regulate key hydrological processes. The results demonstrate that: (1) including both snowmelt and freeze–thaw processes significantly improves runoff simulation, especially during cold seasons; (2) snow dynamics directly modulates the development of soil freeze–thaw cycles, thereby altering the hydrothermal state of the vadose zone; and (3) the inclusion of the SFG module in the model variant, which already accounted for snowmelt, increased the predicted surface runoff by 39 %–77 % during cold months, reduced evapotranspiration by approximately 85 %, and substantially modified interflow processes, particularly during the early-spring thaw period. These findings provide quantitative evidence of the critical role of SFG in shaping the seasonal hydrological regime of large cold-region basins. Moreover, the modular and transferable design of the snow and SFG components allows for straightforward integration into other hydrological models, offering a valuable tool for hydro-climatic assessments and water resource management in mountainous regions under changing climate conditions.
- Article
(7276 KB) - Full-text XML
-
Supplement
(1102 KB) - BibTeX
- EndNote


Seasonally frozen ground (SFG) has significant implications for the energy balance and water equilibrium of the land surface, which in turn affects ecosystems, hydrologic processes, soil properties, and biological activity worldwide. Seasonal freezing occurs across extensive areas, with approximately 25 % of the Northern Hemisphere's land surface experiencing seasonal topsoil freezing in permafrost regions, i.e., the active layer and an additional 25 % outside the permafrost zone (Zhang et al., 2003). While the hydrological impacts of permafrost thaw and active layer changes have been extensively investigated over the past decade (Ford and Frauenfeld, 2016; Qin et al., 2017; Song et al., 2022; Streletskiy et al., 2015), the hydrological impacts of SFG in permafrost-free regions have received less attention (Ala-Aho et al., 2021). The hydrological response to SFG is controversial and appears to be highly site- and time-specific (Appels et al., 2018). A systematic review by Ala-Aho et al. (2021) concluded that the impact of SGF on runoff processes is profound in many small-scale applications. However, large knowledge gaps remain, not least regarding the complex and less clear responses on larger scales, for which the presence and absence of SFG may show considerable spatial variation. The possible spatially complex impacts of SFG on runoff in large basins may furthermore vary considerably within the year (Song et al., 2022). Shiklomanov (2012) similarly noted that despite the large scale and significant importance of SFG in cold regions, it has not received much attention due to a lack of long-term observational time series. Additionally, climate change is expected to alter frozen ground conditions and extent (Wang et al., 2019), increasing the frequency of freeze–thaw events in cold regions (Venäläinen et al., 2001). Thus, understanding the hydrological impacts of SFG under a warming climate, where permafrost is being transformed into SFG, is becoming increasingly important.
It is generally accepted that frozen ground, whether seasonally frozen or permafrost, constrains hydrological interactions to some extent. However, the hydrological response within permafrost regions differs significantly from areas where only the surface soil freezes seasonally. Permafrost extends deeply into the subsurface, impeding or even completely preventing deep groundwater runoff (Walvoord et al., 2012). This leads to shallow groundwater runoff and rapid surface water runoff during snowmelt if the active layer of permafrost has not yet thawed (Hinzman et al., 1991). In contrast, the effects of SFG typically remain shallow in depth, increasing surface water runoff and reducing groundwater recharge during snowmelt if the topsoil is frozen (Ireson et al., 2013). This suggests that SFG disrupts surface–subsurface hydraulic connectivity in winter and spring while increasing hillslope runoff into the stream channels (Covino, 2017). This study focuses on SFG, which, at the regional scale, can serve as a crucial indicator of climate change and frozen ground conditions in cold regions.
SFG regions generally experience seasonal snow cover, which significantly influences the soil freeze–thaw process. Due to the low thermal conductivity, high latent heat of melting, and high albedo of snow, changes in snow cover substantially alter the impact of air temperature on the thermal state of the soil (Goncharova et al., 2019), thereby affecting the soil freeze–thaw dynamics (Biskaborn et al., 2019). In areas of thin or transient snow cover in the SFG regions, thermal coupling between the ground and the atmosphere is more likely to increase the frequency and intensity of soil freezing while potentially reducing the duration of the freeze (Fuss et al., 2016). Consequently, soil in these regions may freeze more frequently and deeply but thaw more quickly due to weaker snowpack insulation. The seasonal effect of deep snowpack on ground temperatures depends on the thermal history of the ground, air temperature, and solar radiation that isolates the ground from the atmosphere (Maurer and Bowling, 2014). In a warming climate, a decrease in late-season snowpack may lead to increased soil freezing (Hardy et al., 2001). This phenomenon, termed “soil cooling in a warm world” (Groffman et al., 2001), emphasizes the complex effects of climate change on soil freezing and thawing processes. Therefore, the hydrological impacts of snow and SFG should be considered together as the two processes interact (Qi et al., 2019).
The impact of SFG and snow cover on hydrological processes can be simulated using process-based hydrological models (Gao et al., 2022; Qi et al., 2019). Physical process-based cold-region hydrological models such as the geomorphology-based eco-hydrological model (GBEHM) (Yang et al., 2015), the water and energy budget-based distributed hydrological model (WEB-DHM) (Wang et al., 2009), the variable infiltration capacity (VIC) model (Liang et al., 1996), and the cold region hydrological model (CRHM) (Pomeroy et al., 2007) have been developed to assess various hydrological impacts of SFG and snow cover (Jafarov et al., 2018; Qi et al., 2016; Walvoord et al., 2019). While these models offer rigorous physical interpretations, they require a number of high-quality input data, are hindered by parameterization complexities that induce simulation uncertainties (Gao et al., 2018), and exhibit slow computational speeds. Moreover, challenging climate and environmental conditions in cold regions pose difficulties for field observations, exacerbating local parameterization challenges.
Conventional hydrological models such as the Soil and Water Assessment Tool (SWAT; Arnold et al., 1995), the Hydrologiska Byråns Vattenbalansavdelning model (HBV; Krysanova, 1999), TOPMODEL (Beven and Kirkby, 1979), and the Xinanjiang model (Zhao, 1984) predominantly focus on soil moisture conditions, neglecting the impacts of snowmelt and soil freeze–thaw processes. However, the soil freeze–thaw cycle traverses runoff processes, including infiltration, evaporation, and water migration, constituting a pivotal aspect of the hydrological cycle in cold regions (Guo et al., 2022). Although efforts have been made to integrate soil freeze–thaw processes into conventional hydrological models (Ahmed et al., 2022; Huelsmann et al., 2015; Kalantari et al., 2015), most of them are based on changing relevant parameters and are unable to reflect the key physical processes in cold regions. Snow cover and SFG exhibit significant spatiotemporal heterogeneity and are influenced by numerous interconnected factors. The translation of point/slope-scale frozen processes into their basin-scale hydrological implications remains largely unexplored (Gao et al., 2022). Furthermore, there is also a lack of mechanistic and quantitative studies on how snow and SFG affect key hydrological processes.
The Tibetan Plateau, the source region for many major rivers in Asia, provides water for billions of people and downstream ecosystems, earning the title “Asian Water Tower” (Immerzeel et al., 2010). The cryosphere of the Tibetan Plateau, consisting primarily of snow, permafrost, and glaciers (Qi et al., 2019), is highly sensitive to climate change. Seasonal snow cover and frozen ground significantly influence the hydrological processes in cold alpine regions, exhibiting pronounced intra-annual regulatory effects (Gao et al., 2023). Consistent with this, Pomeroy et al. (2007) recommended considering the coupling of seasonal freeze–thaw cycles with precipitation (snowfall) as a potential primary control on hydrological processes. The Xinanjiang model and its derivatives are considered the most commonly used practical flood forecasting models in China (Yao et al., 2014), with significant experience accumulated in operational flood forecasting (Chen et al., 2023). However, its adaptability in cold regions is relatively poor because it does not account for the influence of snow cover and frozen ground on the hydrological process.
To address these limitations, this study developed two enhanced hydrological models based on the gridded Xinanjiang (GXAJ) framework. The enhancements are achieved through the addition of a snowmelt-enhanced module (GXAJ-S) and by the further addition of an SFG module (GXAJ-S-SF). A main innovation lies in explicitly coupling the physical mechanisms of snowmelt and freeze–thaw processes into a distributed hydrological model. In particular, SFG influences the partitioning of water into ice and liquid phases and modifies the vadose and humus layer thickness used in runoff generation, thereby altering seasonal runoff dynamics. The spatial distribution of SFG is strongly influenced by snow cover, and together, they regulate evapotranspiration and soil water availability. A related main novel aspect introduced in this work is how the additional processes are accounted for, taking advantage of the modular model design in a three-step manner (i.e., considering (i) the baseline model with no snow/SFG, (ii) adding the snow module, and (iii) further adding the SFG module), with the modules being grounded in well-established physical principles. This allows for increasing the complexity while transparently checking the model performance of each step. In particular, any potential increases in model performance can then be related to the dynamics created by the additional module (and the corresponding account for a new process). To the best of our knowledge, this has not previously been done in large cold-region basins. This is because previous comparisons have regarded models that differ in either structure (Gao et al., 2018; Li et al., 2018b; Song et al., 2022) or structure as well as complexity (e.g., Ahmed et al., 2022; Gao et al., 2018, 2022). In both cases, the differences in model performance may then partly be due to fundamental, structural, or parametrization differences between models, introducing uncertainty in how performance may be linked to complexity (i.e., the inclusion or omission of processes), which is avoided in the current approach. We aim to provide scientific and practical guidance on the appropriate level of model complexity needed for large-scale cold-region hydrological applications, especially where data limitations persist.
2.1 Cold-region runoff mechanisms
The critical importance of ground freezing in the runoff generation of cold regions lies in the transformation of pre-existing water in soil pores into ice, which inhibits vertical water connectivity (Ala-Aho et al., 2021). Consequently, in areas with frozen ground, runoff processes are influenced not only by precipitation and soil moisture but also by ground-freezing conditions driven by temperature variations (Wang et al., 2017). Based on the dynamic changes associated with seasonal freeze–thaw cycles and snow accumulation and snowmelt dynamics, the runoff generation process is divided into four stages (Guo et al., 2022): initial freezing stage (IFS), stable freezing with snow stage (SFS-S), initial thawing stage (ITS), and complete thawing stage (CTS) (Fig. 1).
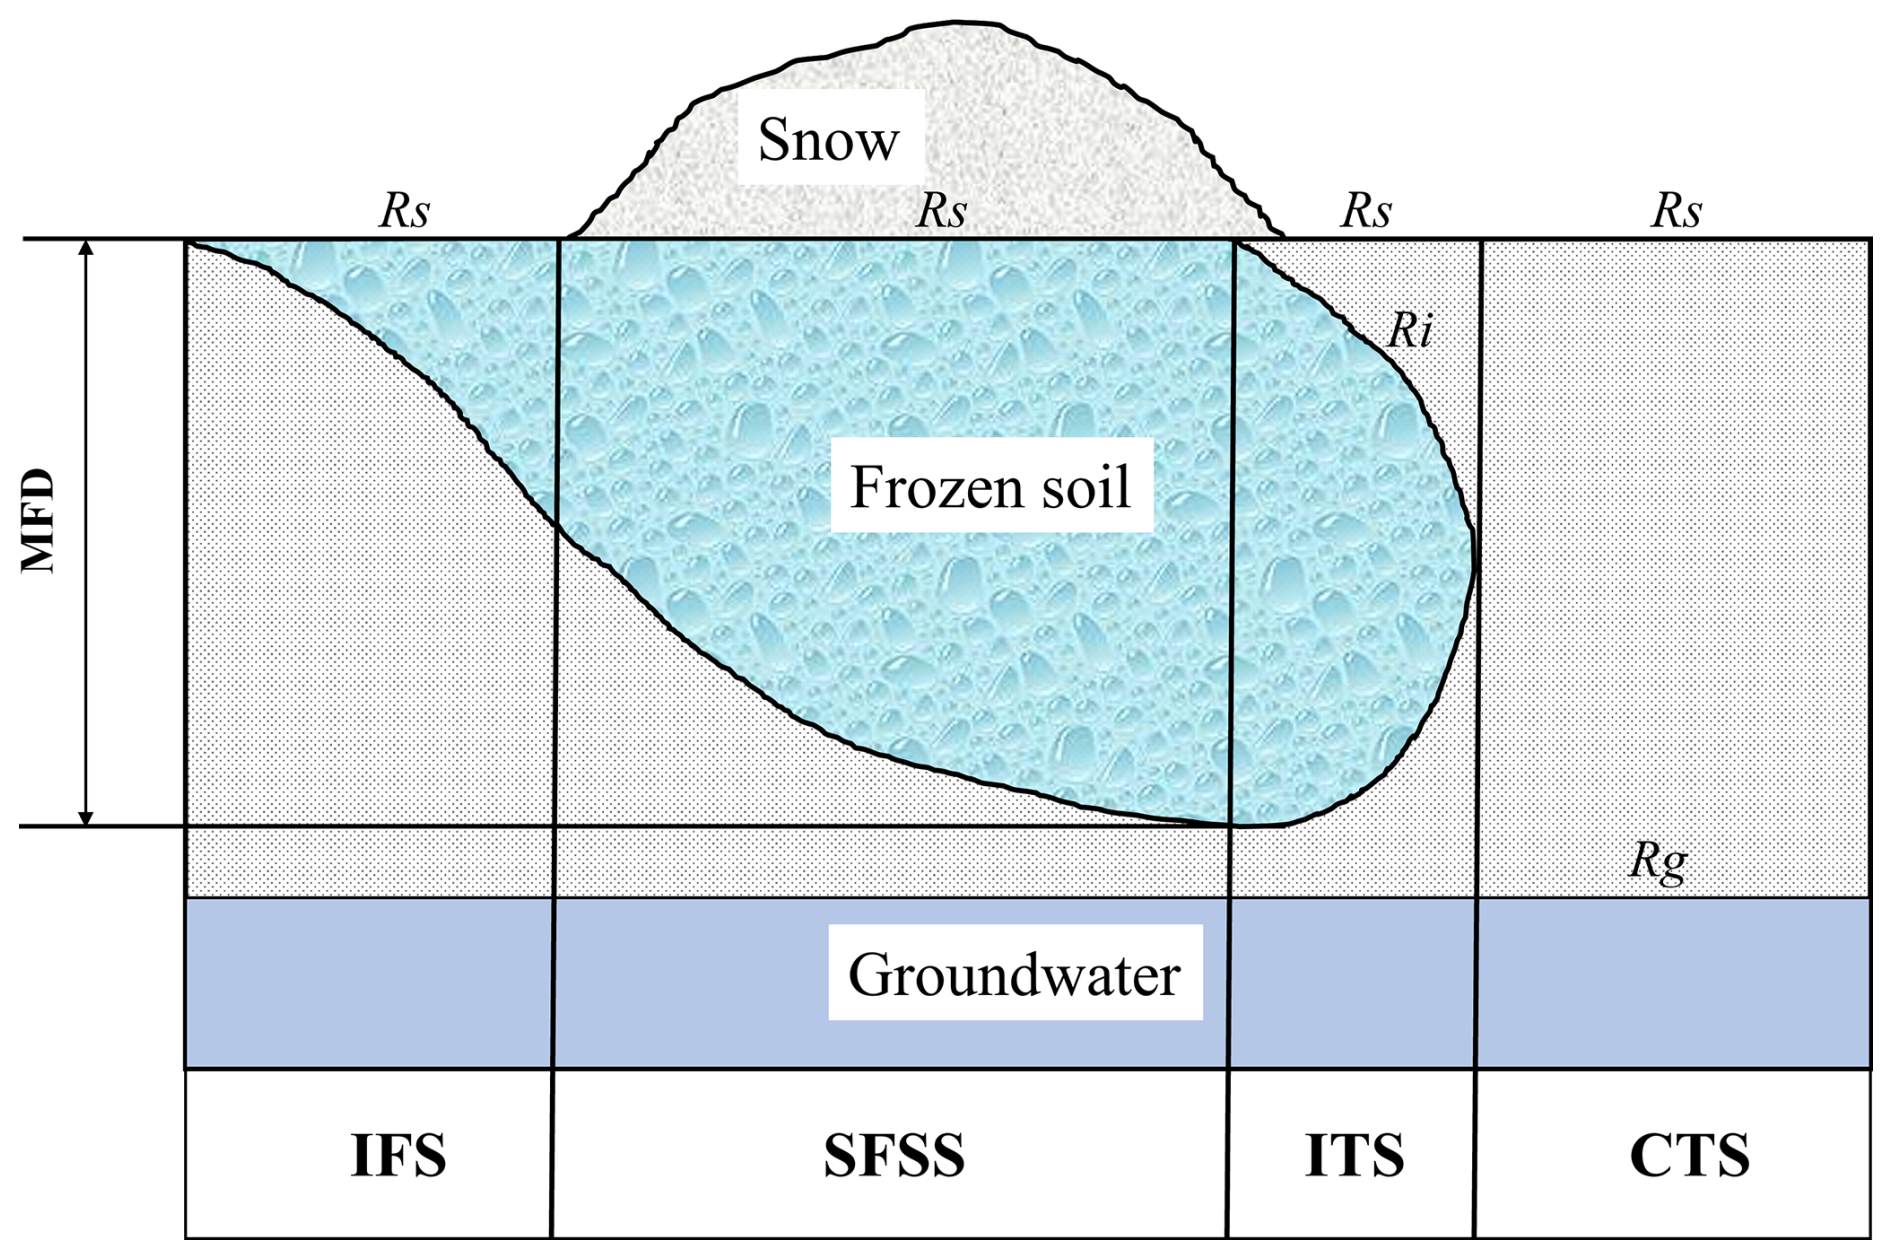
Figure 1Runoff generation model in seasonally frozen ground/snow regions. Rs, Ri, and Rg represent surface water runoff, interflow, and groundwater runoff, respectively; MFD means maximum seasonal frozen ground depth.
- i.
During the IFS, temperatures are low, but no snowfall occurs. The ground freezes from the surface downwards (Thomas et al., 2009), significantly inhibiting the evaporation of soil moisture into the air and making it difficult for vegetation to absorb it. Due to the frozen surface layer, groundwater recharge is restricted. The precipitation during this stage mainly generates surface water runoff (Rs), which becomes the primary runoff component.
- ii.
Persistent low temperatures cause the depth of the frozen ground to increase while snow accumulates on the surface, maintaining the frozen state. The snow protects the cold ground from solar radiation, despite warmer temperatures (Rush and Rajaram, 2022), until the snow melts completely. In the SFS-S, groundwater remains active beneath the frozen layer (Gao et al., 2022), soil evapotranspiration is nearly zero, and Rs generated by snowmelt or rainfall remains the main runoff component.
- iii.
During the ITS, as the temperature continues to rise and snow completely melts, the surface frozen ground begins to thaw, receiving substantial inputs from precipitation and snowmelt. During this stage, vegetation transpiration is very limited, and soil evaporation occurs only in the thawed surface layer. As a result, the surface layer easily saturates, generating saturation-excess runoff (Rs). With increasing thaw depth, interflow (Ri) appears above the thaw front. Runoff during this stage consists primarily of a mix of Rs and Ri.
- iv.
In the CTS, the atmospheric and soil layers restore vertical connectivity. Increased rainfall events replenish groundwater, and evapotranspiration gradually increases. Runoff processes in this stage include Rs, Ri, and groundwater runoff (Rg).
In SFG and snow-covered regions, precipitation and snowmelt are the primary sources of runoff. Temperature influences the seasonal freeze–thaw cycles of snow and frozen ground, and their interaction further affects soil water/ice content and evapotranspiration. Lower elevations generally experience higher temperatures compared to higher elevations, and south-facing slopes are generally warmer than north-facing slopes. Such local to regional temperature differences cause spatial variability in runoff, with transitions in runoff components across different freeze–thaw stages forming the fundamental runoff patterns in SFG regions.
2.2 Modeling approach
The GXAJ model (Yao et al., 2012) uses the concept of a saturated runoff mechanism, meaning that during rainfall, runoff will only occur once the soil water storage reaches the field capacity, with all incoming water being absorbed by the soil before that point. In the GXAJ model, the tension water storage capacity (WM) (mm) of any grid cell is determined by the geomorphological features and underlying surface conditions such as soil and vegetation (Stephens, 1996; United States Department of Agriculture, 2002). The potentially uneven distribution of WM within a grid cell is not considered. The measured precipitation in the computation period is first adjusted by subtracting the corresponding period's evapotranspiration, vegetation canopy interception, and river precipitation. Then the upstream inflow is considered to check if it can replenish the soil moisture in the current grid cell. This results in an effective precipitation (Pe) that is used for runoff (R) calculation.
The runoff (R) from a grid cell is divided into three components: surface runoff Rs, interflow Ri, and groundwater runoff Rg. The GXAJ model assumes that the surface soil of the capillary zone is a humus layer (determined by geomorphological features and soil, vegetation, and other surface conditions) (Li et al., 2004). The bottom of the humus layer is considered to be “relatively impermeable”. A portion of the runoff generates Ri in the humus layer, while another part infiltrates further to produce Rg. When the free water in the humus layer becomes saturated, surface runoff occurs. Similarly, the uneven distribution of free water storage capacity (SM) within the grid cell is not considered.
The GXAJ model calculates evapotranspiration using a three-layer model. The soil is divided into upper, lower, and deep layers, with each layer having corresponding tension water storage capacities of WUM, WLM, and WDM (mm). When calculating actual evapotranspiration in a grid cell, canopy interception is evaporated based on its evapotranspiration capacity. If the interception is less than the evapotranspiration capacity, the three-layer model is used. The calculation principle of the three-layer evapotranspiration model is as follows: the upper layer evaporates according to its capacity. If the upper layer's water content is insufficient, the remaining evapotranspiration capacity is used by the lower layer, which evaporates proportionally to the lower layer's water content and inversely to its water storage capacity. The ratio of the calculated lower-layer evapotranspiration to the remaining evapotranspiration capacity must not be less than the deep-layer evapotranspiration coefficient (C). Otherwise, the deficit is replenished by the lower layer's water content, and when the lower layer is insufficient, it is supplemented by the deep layer's water content.
In summary, the GXAJ model divides runoff into three components, i.e., Rs, Ri, and Rg, by calculating the tension water storage capacity (WM) in the vadose zone and the free water storage capacity (SM) in the humus layer. (The spatial distribution is shown in Fig. S1 in the Supplement.) The WM determines whether a grid cell generates runoff and runoff volume (i.e., saturation-excess runoff), while the free water content of the surface soil differentiates the runoff components into Ri and Rg. When the free water content reaches saturation, Rs is produced, as illustrated in Fig. S2a in the Supplement. For actual evapotranspiration calculation, the soil within each grid cell is divided into three layers: upper, lower, and deep, with corresponding soil moisture and evapotranspiration labeled as Wu, Wl, and Wd, and Eu, El, and Ed, respectively, as shown in Fig. S2b. Confluence processes follow the calculation order between grids, sequentially routing various water sources to the watershed outlet. For details, refer to Yao et al. (2009).
However, the original GXAJ model does not account for the impacts of snow cover and freeze–thaw processes on runoff generation; studies have shown that this model is not suitable for seasonally cold regions (Yao et al., 2009, 2012). To address this, we here introduce the snowmelt runoff process (SNOW17) and the freeze–thaw cycle processes into the GXAJ model, investigating if and to what extent the related expanded GXAJ-S model and the GXAJ-S-SF model could better represent cold-region hydrological processes (Fig. 2). Specifically, these processes explicitly account for the accumulation and melting of seasonal snow, as well as the spatiotemporal variations in soil freeze–thaw depth, using grid-based temperature and precipitation inputs. The SNOW17 model (Anderson, 1973) was chosen for snowmelt runoff calculation due to its minimal input requirements and clear representation of the most critical physical processes within the snowpack. Additionally, the Stefan equation was employed to predict seasonal soil freeze and thaw depths (Peng et al., 2017). The Stefan equation is widely used in conjunction with process-based models due to its simplicity and flexibility (Kurylyk, 2015).
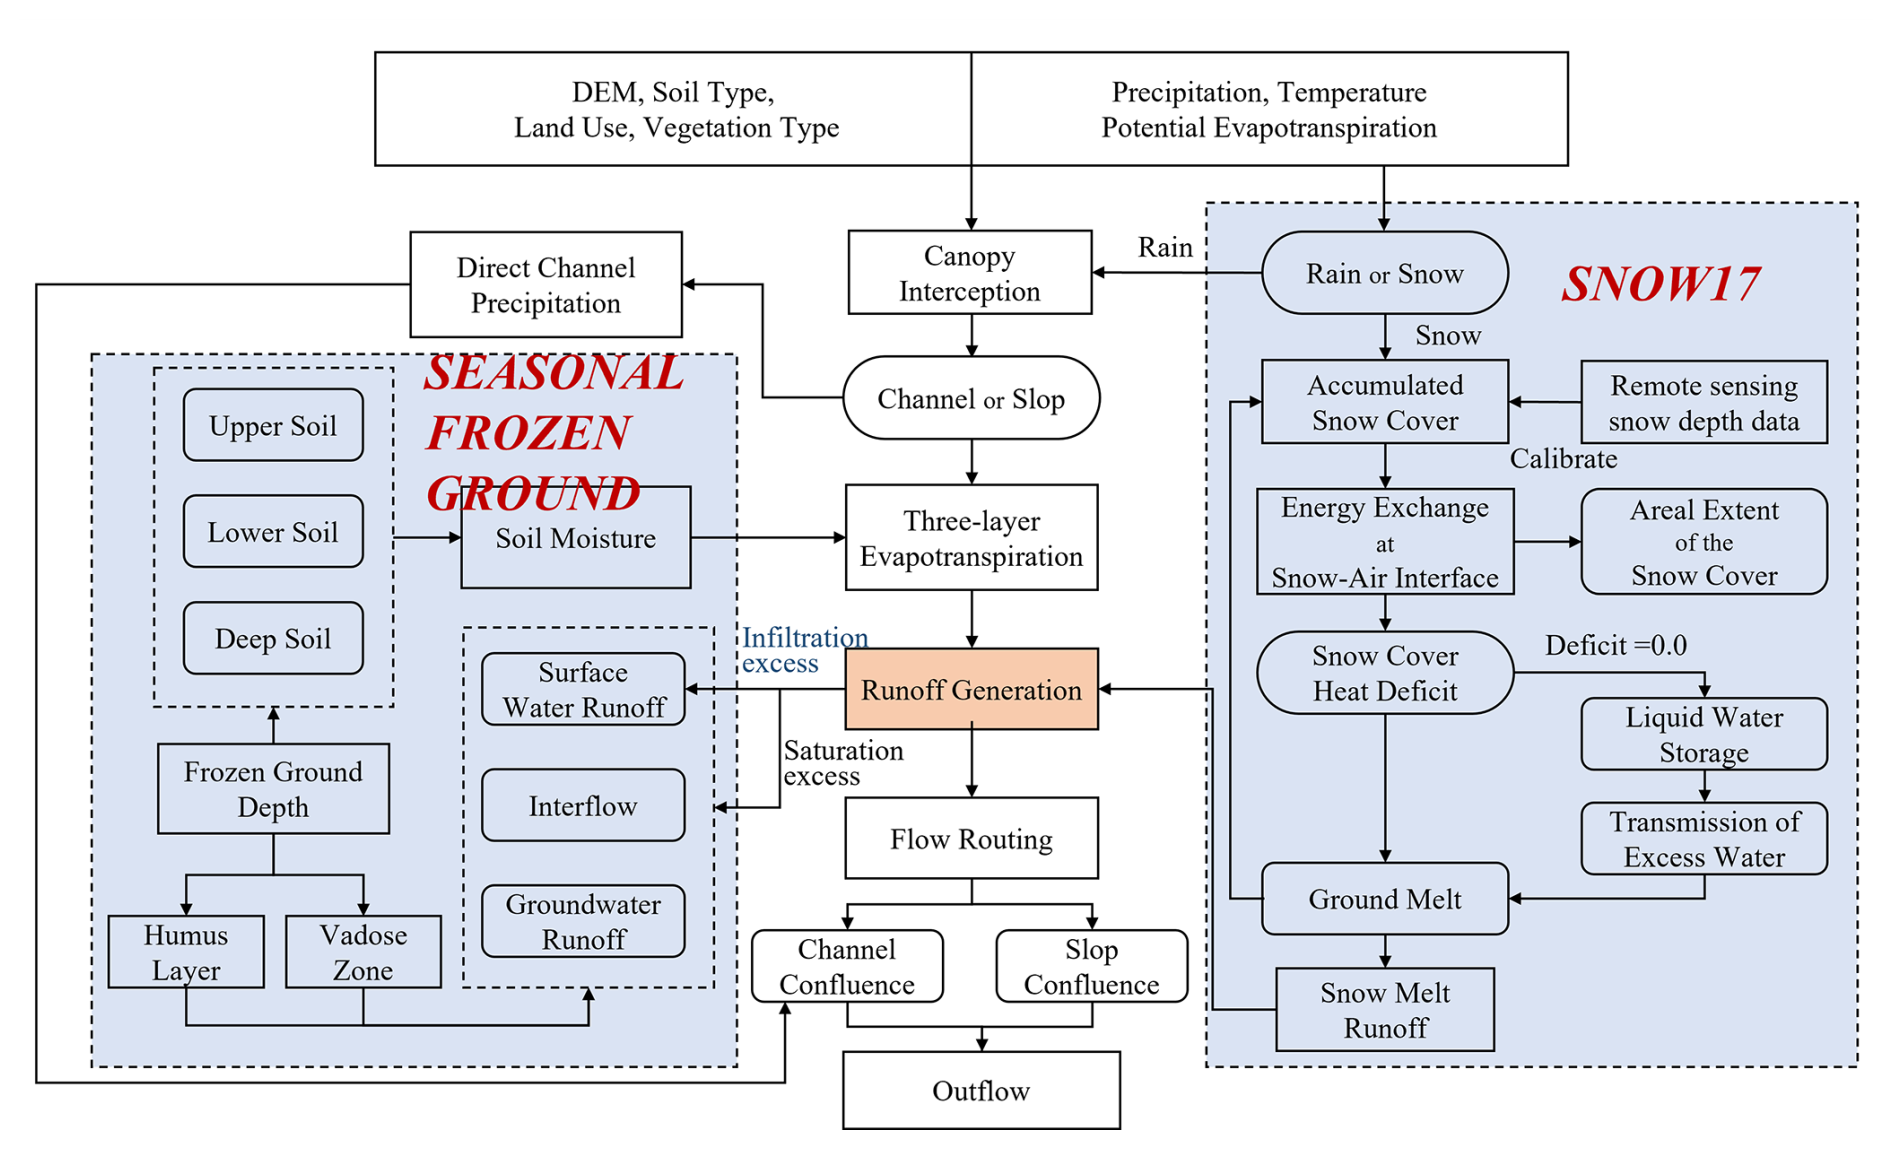
2.2.1 Snow accumulation and melting runoff
Before snowfall occurs, if ground temperatures remain below freezing (0 °C) for an extended period, the soil is subject to freezing (IFS) conditions. In related snow accumulation phases, as long as the snow cover remains relatively thin, most solar radiation is reflected by the snow cover due to its high albedo, yet it does not insulate the ground due to insufficient thickness. In contrast, thick snow cover, with a low thermal conductivity, can completely isolate the ground from the surrounding air temperature (Rush and Rajaram, 2022). Research has proposed a snow depth threshold of 30–40 cm (Hill, 2015), above which air temperature is not expected to affect ground temperature. At the lowest negative accumulated temperature, the maximum frozen depth is reached, with soil water retained as ice. As temperatures rise, the surface snow begins to melt first (Fig. S3 in the Supplement).
The SNOW17 model (Anderson, 1973), developed as part of the National Weather Service river forecast system in the US, was used for snowmelt prediction. The model description in this section is adapted from the latest references of the model (Anderson, 2006). SNOW17 is an empirical lumped model that uses average daily temperature as the sole index to simulate snow accumulation, heat storage, snowmelt, liquid water retention, and meltwater transmission, determining energy exchange at the snow–air interface, based on empirical relationships (He et al., 2011). The model outputs are snow depth and runoff time series. The snow accumulation and melting amount for each grid cell are calculated based on the snow-covered area. The SNOW17 model calculates snowmelt with and without rainfall, producing the total runoff during the snow cover period (Os, mm).
The snow surface melting equation with rainfall is
where Mr is the melt during rain-on-snow time intervals (mm), σ represents the Stefan–Boltzmann constant ( ), Δtp is the time interval of precipitation data (hour), Ta is the air temperature (°C), 273 represents 0 °C on the Kelvin scale, fr is the fraction of precipitation in the form of rain, Tr is the temperature of rain (°C), UADJ represents the average wind function (mm mb−1 per 6 h), and esat and Pa are saturated vapor pressure at Ta (mb) and atmospheric pressure (mb), respectively.
The snow surface melting equation without rainfall is
where Mnr is the melt during non-rain periods (mm), Mf is the melt factor (mm °C), Δtt is the time interval of temperature data (hours), and MBASE is the base temperature (°C).
Most soil moisture exists in the form of solid ice, and the presence of frozen ground obstructs the infiltration of snowmelt water, resulting in surface water runoff (, mm), as shown in Fig. S3a. In the presence of snow cover, soil moisture evaporation is generally impeded. The snow cover prevents the evaporation of moisture from the soil surface, while moisture on the snow surface is released into the atmosphere through sublimation (i.e., snow surface evaporation), as described by the SNOW17 model. Therefore, soil moisture evaporation is typically restricted under snow cover. Additionally, the frozen ground beneath the snow prevents soil moisture from being released into the atmosphere through evaporation, further limiting soil moisture evaporation. The soil moisture status at this time is shown in Fig. S3b.
2.2.2 Freeze–thaw process
The GXAJ-S-SF model employed the Stefan equation to estimate the approximate solution for the freeze–thaw depth. The Stefan equation is a temperature index-based freeze–thaw algorithm that assumes the sensible heat in soil freeze–thaw simulations can be neglected (Xie and Gough, 2013).
where SFD is the freeze–thaw depth (cm), Kf is the thermal conductivity of the soil (), and F is the surface freezing–thawing index, with the freezing index being the cumulative negative ground temperature during freezing and the thawing index being the cumulative positive ground temperature during thawing. L is the latent heat of fusion for ice (3.35×10⁵ J kg−1), ω is the water content, and ρ is the bulk density of the soil (kg m−3). We set the thermal conductivity to 2 , the water content ω to 0.12 (as a fraction of dry soil weight), and the bulk density ρ to 1000 kg m−3 (Gao et al., 2022). Due to the lack of ground temperature data, a conversion factor was used to transform air temperature into ground temperature. During the freezing period, this factor was 0.6, while during thawing, it was assumed that ground temperature equaled air temperature (Gisnas et al., 2016).
To account for the insulating effect of snow cover on frozen ground, a threshold of 30 cm was used: if the snow depth exceeded 30 cm (Hill, 2015), the air temperature effect on frozen ground was ignored, regardless of whether low temperatures caused soil freezing or high temperatures caused thawing. If the snow depth was below this threshold and the snow cover duration ranged between 60 and 140 d (Wu et al., 2024), the snow depth variable was added to the Stefan equation (Wang and Chen, 2022):
where ASD is the average snow depth.
In this study, the Stefan equation was driven by distributed temperature data, enabling us to simulate the soil freeze–thaw processes for each grid cell. The spatiotemporal variation of frozen soil depth affects runoff components, including soil water/ice and soil evapotranspiration. We distinguish between four different possible type cases for associated runoff generation, each of which is associated with different modeling routines:
Case (a). When the surface soil is frozen, as shown in Fig. S4a in the Supplement, rainfall and snowmelt primarily generate surface water runoff (). The soil water/ice content is shown in Fig. S5a in the Supplement. When the soil is in a frozen state, soil moisture cannot evaporate because the frozen ground forms an ice layer that prevents upward moisture evaporation.
Case (b). When the surface soil has thawed and the thawing depth is less than the depth of the humus layer (Fig. S4b), the surface soil moisture exists in the form of liquid water. In this case, the thawed soil layer is considered to be the “new” vadose zone and the humus layer. The bottom of the thawed (impermeable) layer generates interflow (), and since the thawed soil layer is relatively thin, surface saturation runoff () is easily generated:
where Pe is the net rainfall during the period used for runoff calculation (mm); is the initial soil moisture content of the thawed soil layer (mm); is the tension water storage capacity of the thawed soil layer; S∗ is the free water content in the thawed surface soil; Ki is the outflow coefficient of the surface-soil free water content to the interflow; and is the free water storage capacity in the thawed surface soil.
Among them, the variables with ∗ represent relevant variables in the thaw layer, and their values are related to the temporal and spatial changes in the frozen soil depth:
La and Lh are the thickness of the vadose zone and humus layer, respectively, which can be estimated by a soil moisture constant corresponding to the terrain index and soil type (mm); W0, S0, WM, and SM are the corresponding water contents when there is no frozen soil (Yao et al., 2009).
At this time, there are two scenarios for soil moisture (Fig. S5b1 and b2). As shown in Fig. S5b1, when the bottom of the thawed layer is in the upper soil, the upper soil moisture includes both liquid water and frozen solid ice . Evapotranspiration affects only the liquid water in the upper layer, while evapotranspiration in the lower and deep layers is zero. When is sufficient, the upper-layer evapotranspiration Eu is
where K is the evapotranspiration coefficient and EM is the water surface evaporation during the period (mm).
When the bottom of the thawed layer reaches the lower soil layer (Fig. S5b2), the entire upper soil is thawed, and the lower soil contains both solid and liquid water. At this time, the thawed lower layer is also affected by the evapotranspiration process. If the upper layer is dry and the lower thawed soil moisture content is sufficient, the upper and lower layers are affected by the evapotranspiration Eu and El, respectively:
where is the tension water storage capacity of the lower thawed soil layer (mm), which is related to the proportion of the lower thawed soil layer to the whole lower layer.
LM represents the depth of the lower layer soil, and is the frozen depth of the lower layer soil.
Case (c). When the humus layer is completely thawed (Fig. S4c), the thawed soil layer is considered to be the “new” vadose zone. According to the original GXAJ model's runoff generation theory, the bottom of the humus layer (a relatively impermeable layer) generates Ri. At this time, there are two components of interflow: Ri and . When the humus layer is saturated, Rs is generated. It is noteworthy that no groundwater runoff is generated throughout the frozen soil period.
where S is the free water content in the surface soil Lh, Kg is the outflow coefficient of S to groundwater runoff, and SM is the free water storage capacity of Lh.
Soil moisture is present in two scenarios, with the bottom of the thawed layer appearing in the lower soil (Fig. S5c1) and the deep soil (Fig. S5c2). The evapotranspiration calculation for the first scenario (Fig. S5c1) is consistent with Fig. S5b2. When the bottom of the thawed layer deepens to the deep soil (Fig. S5c2), if the soil moisture in the upper and lower layers is also insufficient, it is necessary to calculate the deep-layer thawed soil evapotranspiration Ed:
where C is the deep-layer evapotranspiration coefficient.
Case (d). Until the frozen soil is completely thawed, as shown in Fig. S5d, runoff calculation is performed according to the original GXAJ model (Fig. S2).
2.2.3 Model parameters and calibration
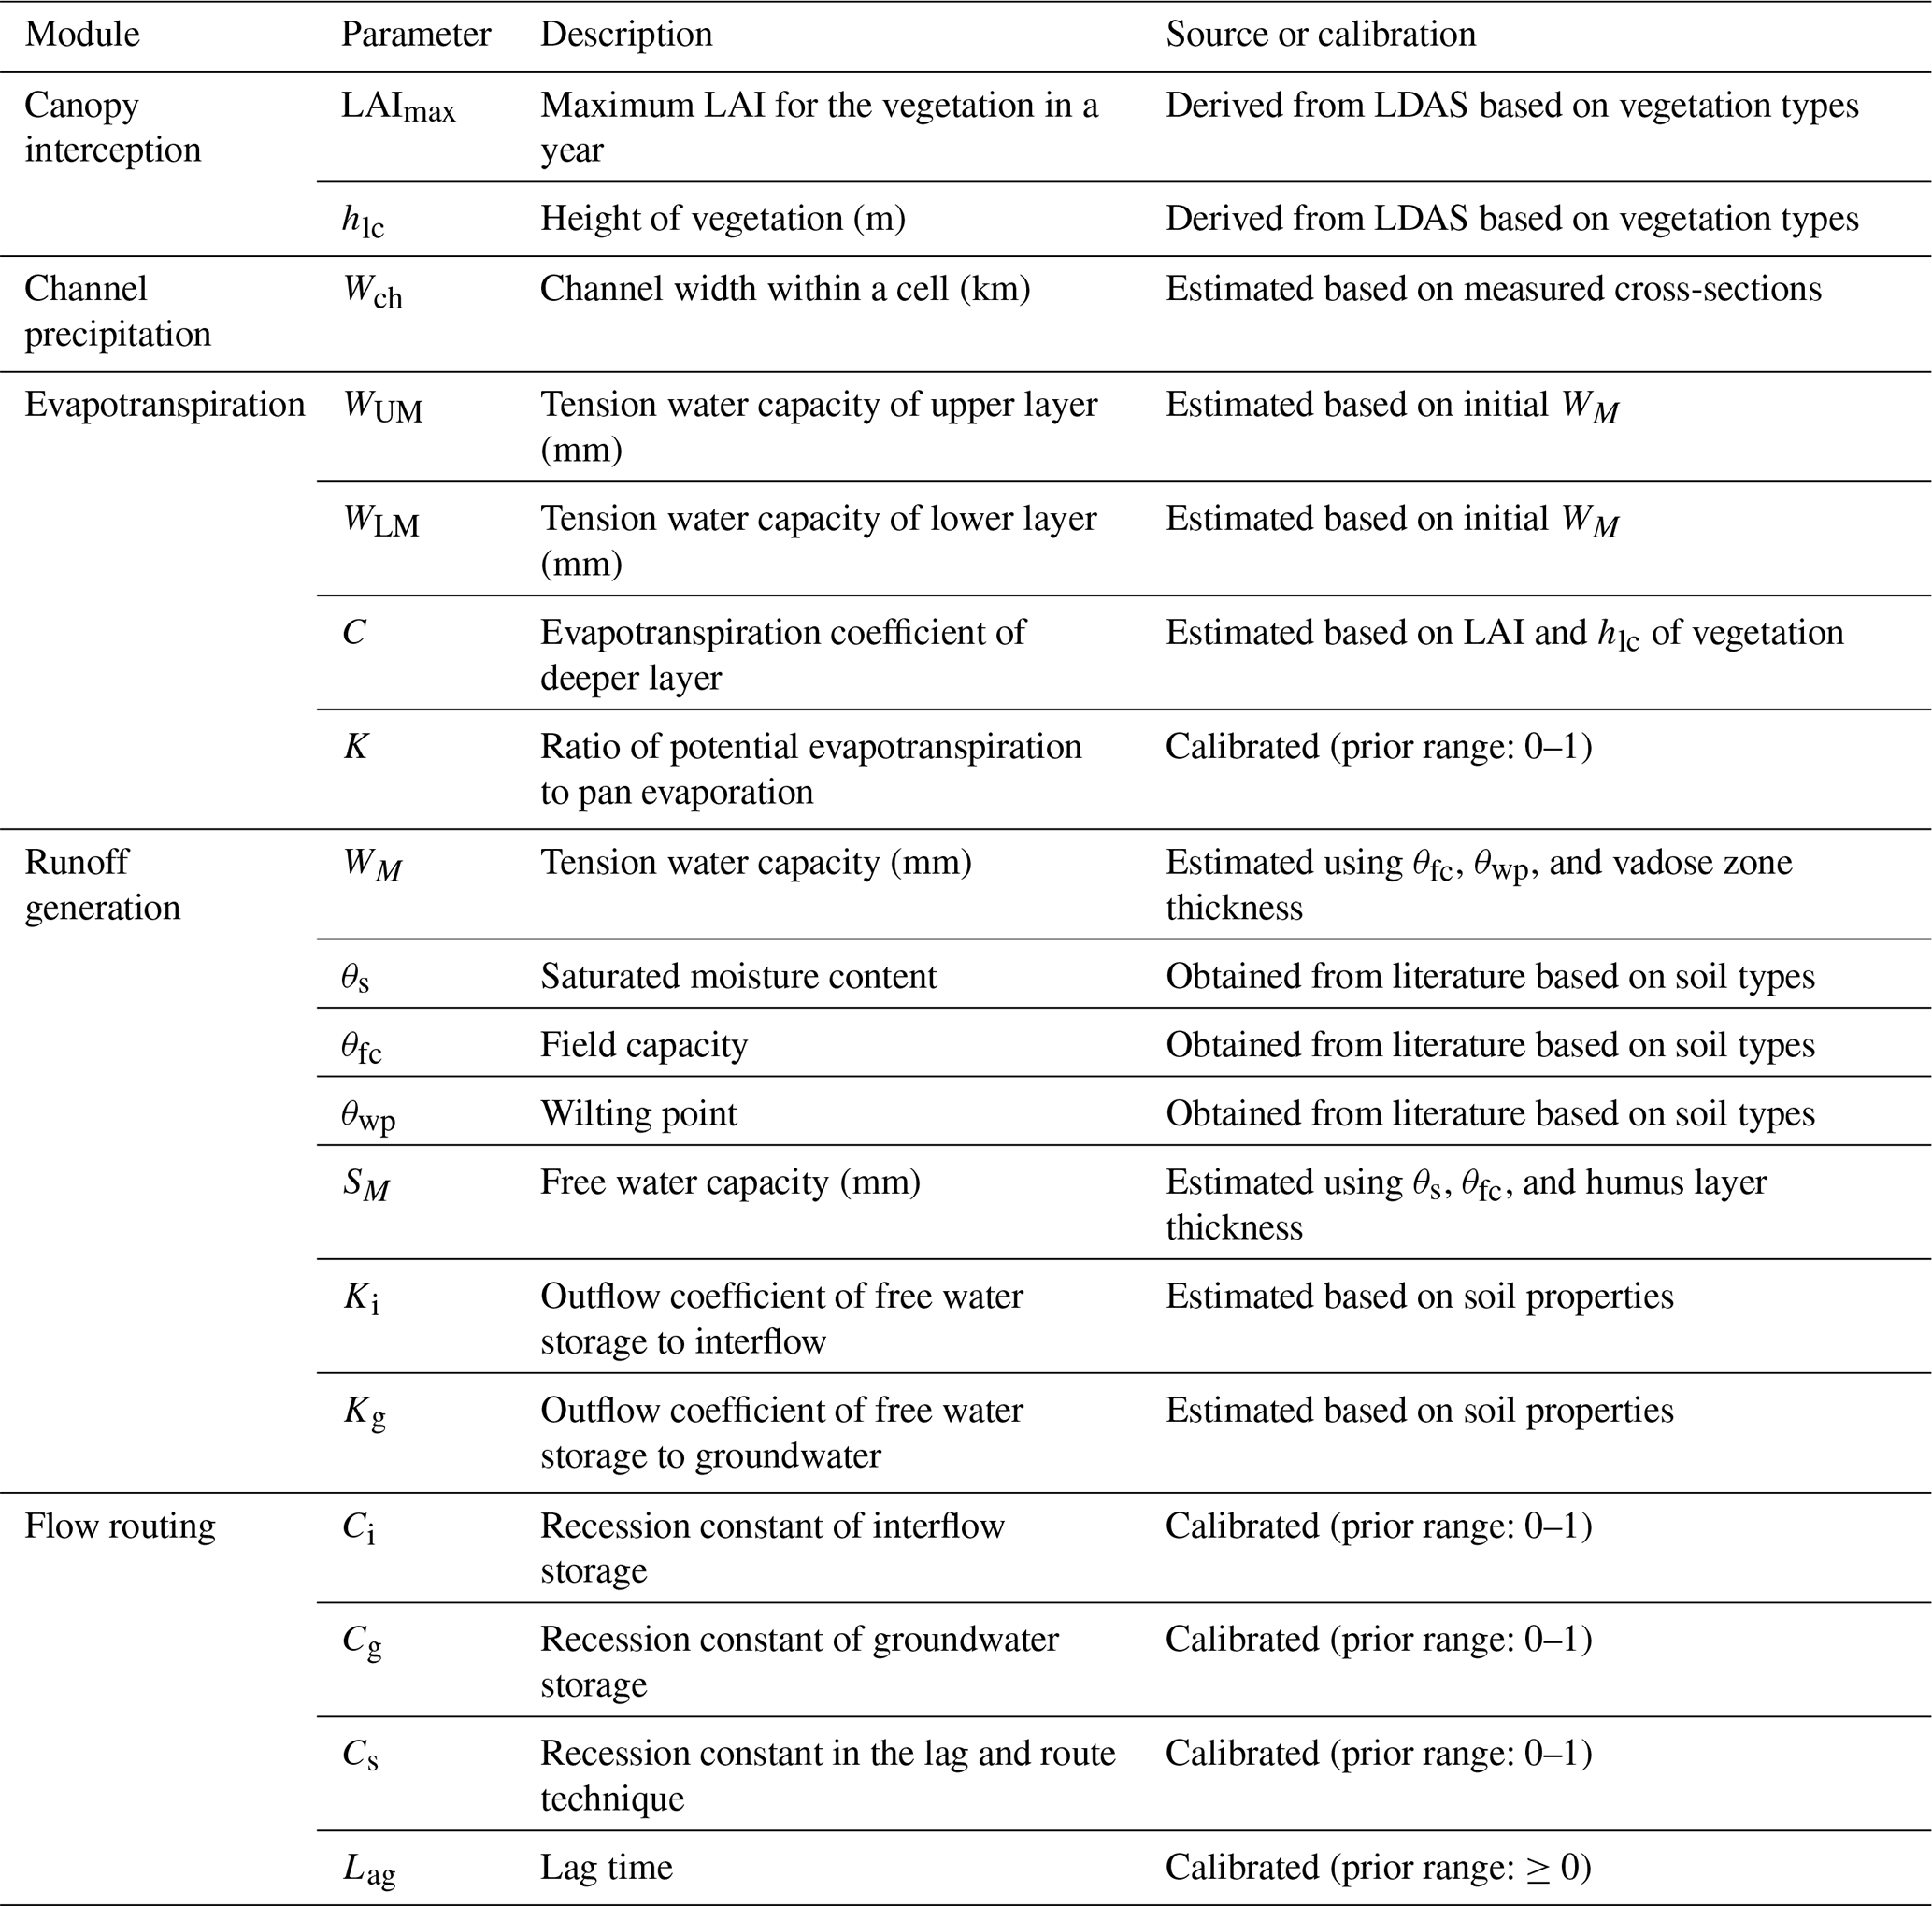
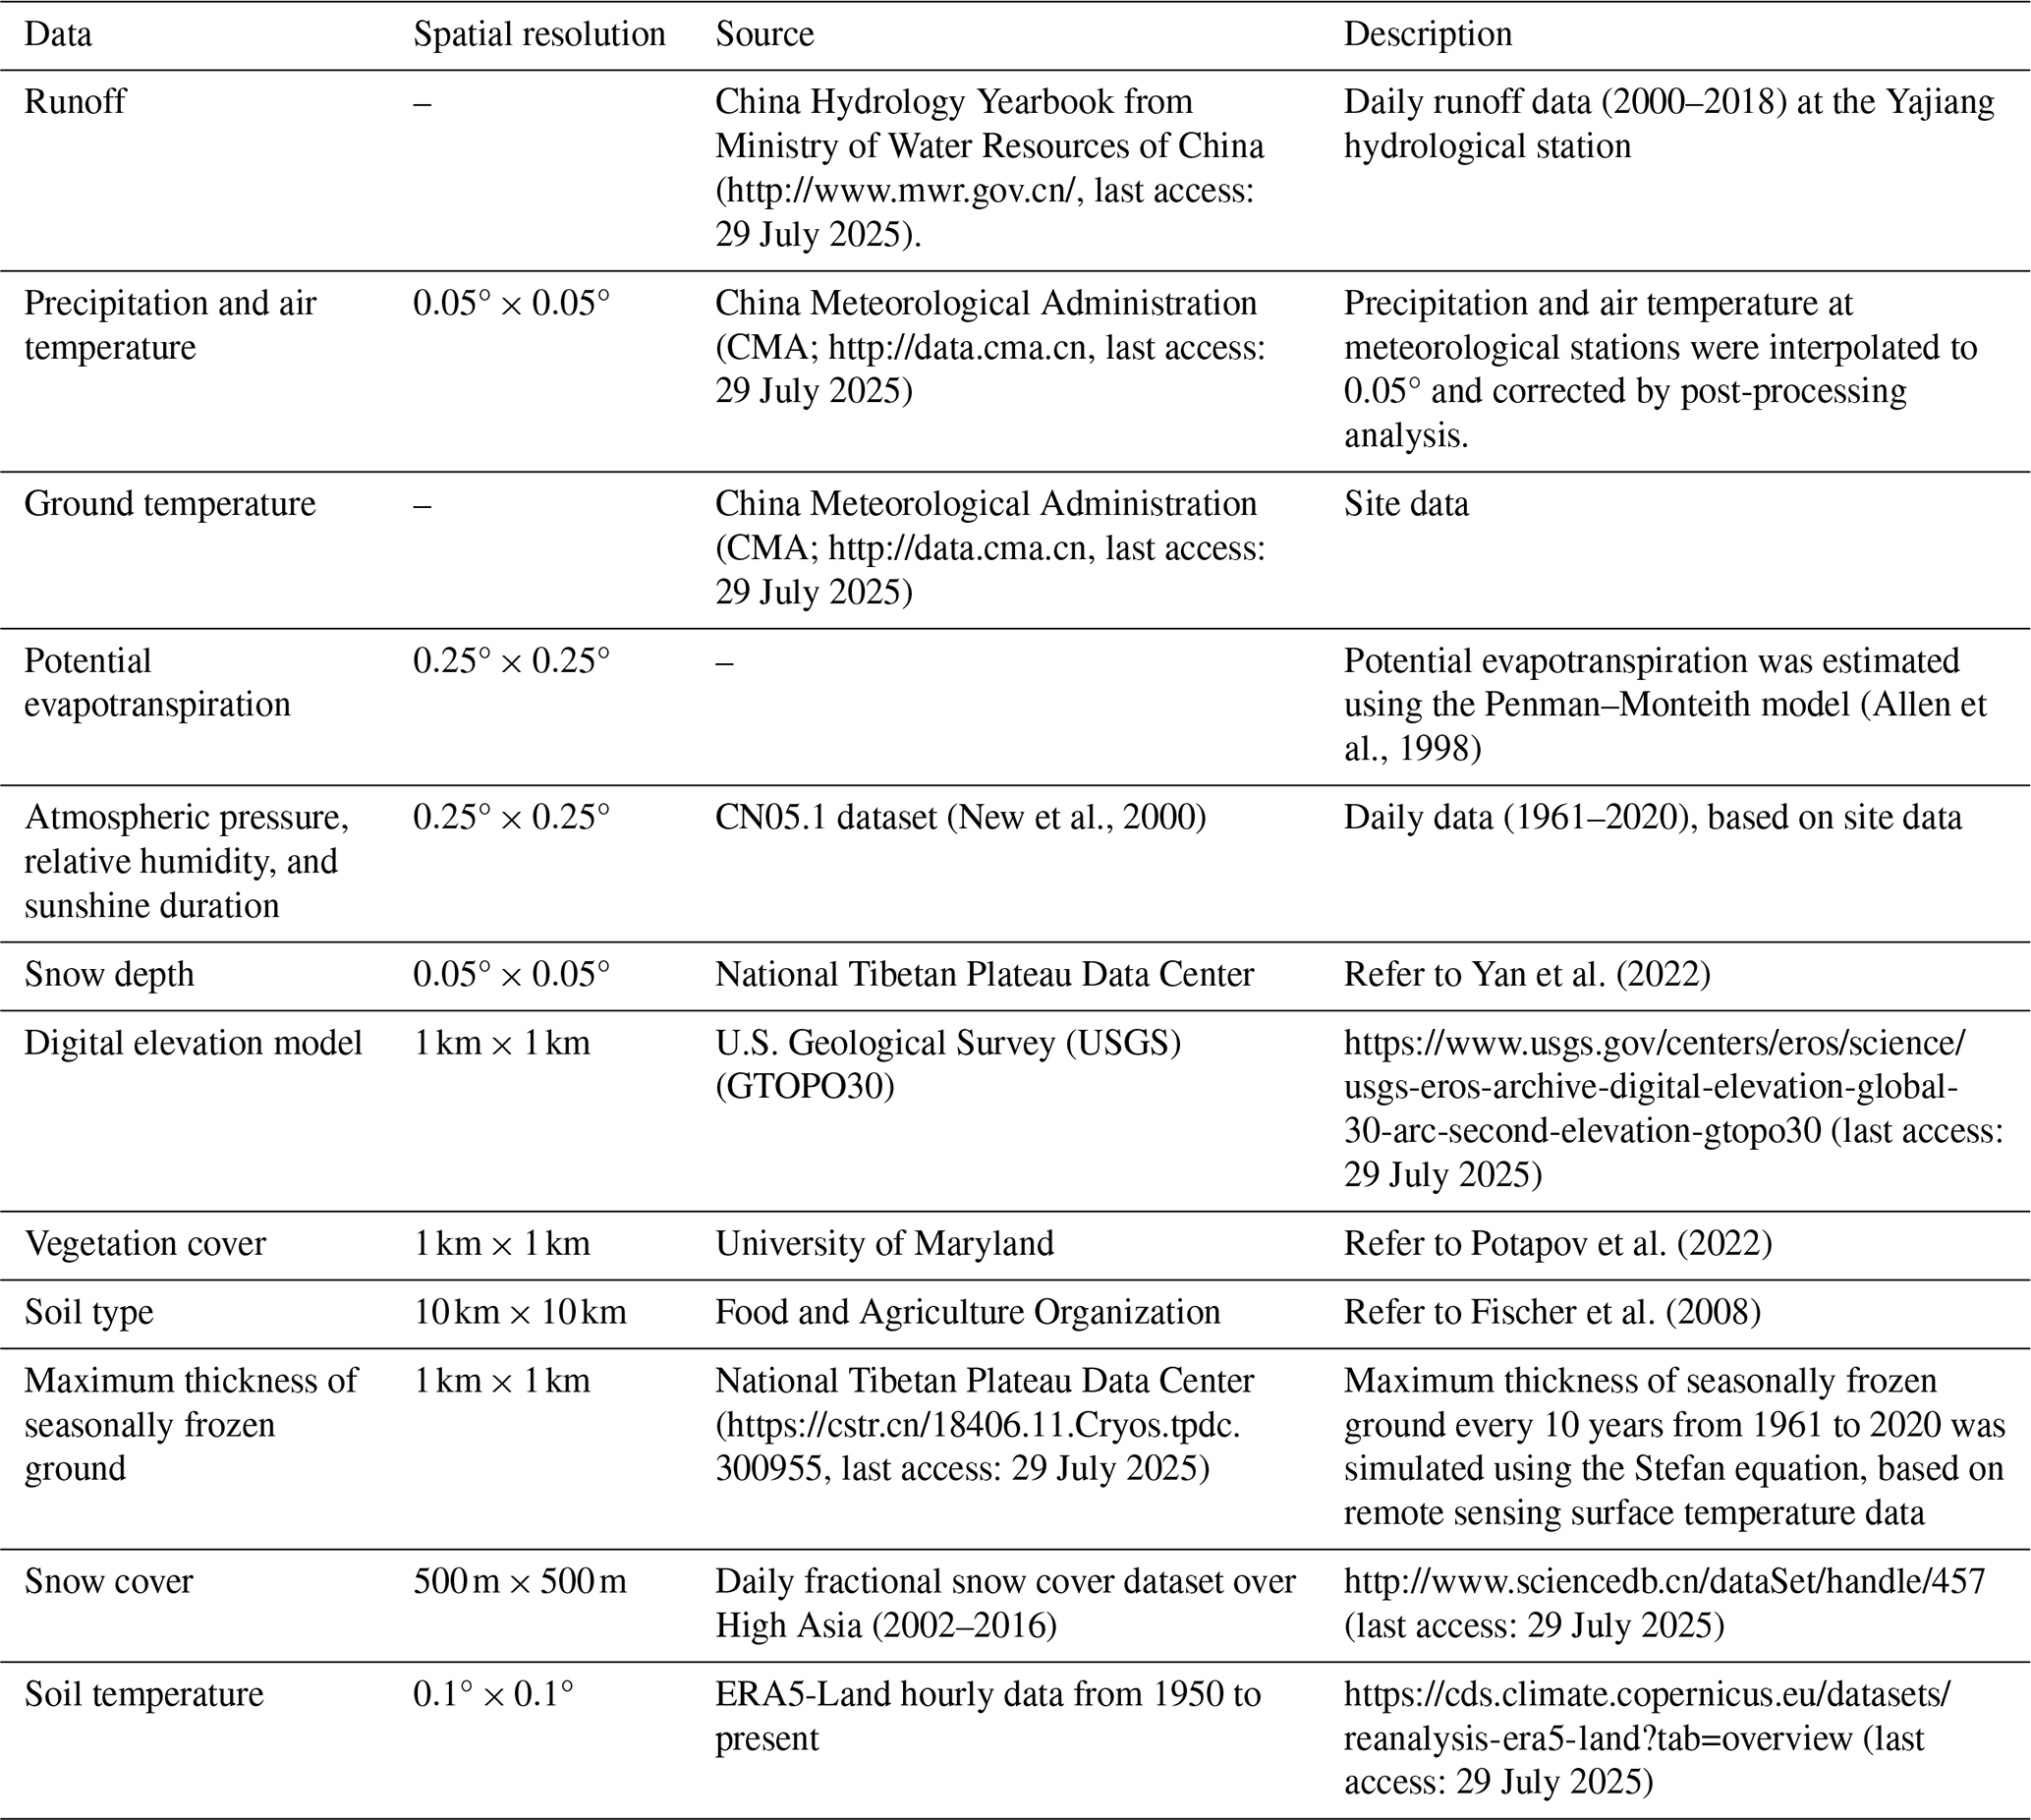
The original GXAJ model operates on a daily time step and includes 18 parameters (Table 1), 13 of which are spatially distributed and estimated based on vegetation type, soil texture, and topographic characteristics. The remaining five parameters are calibrated and derived from long-term empirical experience with the model. To incorporate snow and freeze–thaw processes without compromising model parsimony, we adopted a flexible approach by integrating the SNOW17 snowmelt module and a simplified freeze–thaw cycle module into the GXAJ model. The SNOW17 module contains 10 parameters in total (Table 2), of which only four are key parameters requiring calibration. These core parameters can initially be estimated using empirical guidelines (Anderson, 2002), and the remaining secondary parameters, which have limited influence on model performance, can be assigned based on general climate characteristics of the study area with minimal adjustment.
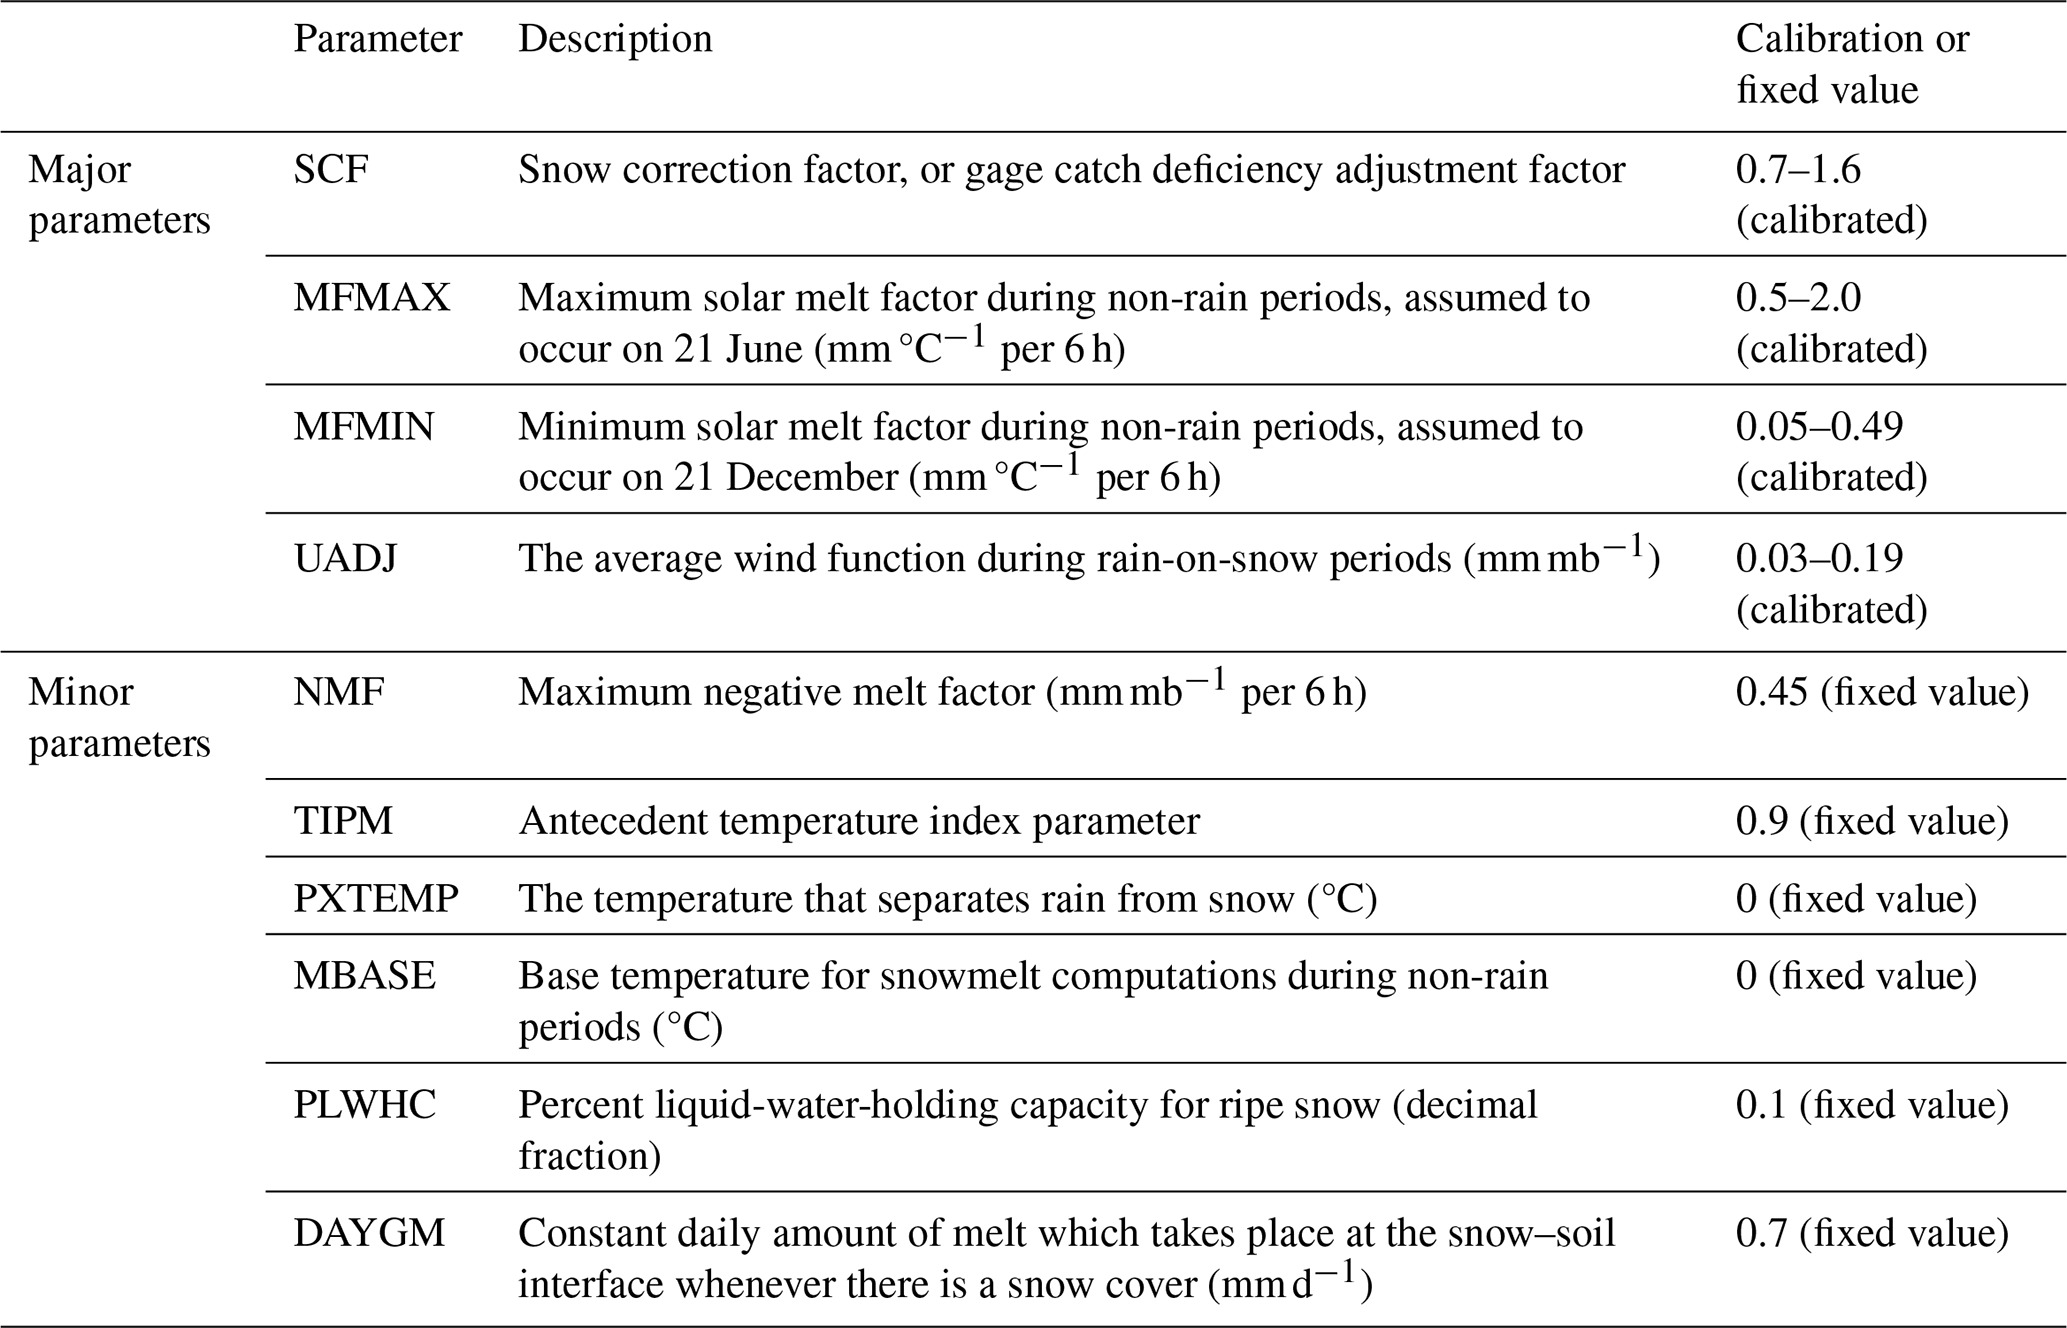
To prevent overfitting and to ensure model improvements stem from enhanced physical process representation rather than increased parameter freedom, the SNOW17 model was first run independently. Remotely sensed snow depth data were used as observational constraints to calibrate the four major snow parameters, ensuring that snow simulations aligned with observed snow dynamics. Once calibrated, the snowmelt model was coupled with the GXAJ model to form the GXAJ-S model. Importantly, this integration did not introduce any new parameters to the original GXAJ structure. The freeze–thaw process was implemented using a simplified module based on the Stefan equation with five empirical parameters (see Sect. 2.2.2). These were used to adjust soil moisture availability and runoff generation under frozen ground conditions. The resulting GXAJ-S-SF model thus includes only a limited number of additional parameters, all of which have clear physical interpretations and are easy to calibrate, making the model especially suitable for data-scarce regions.
All model configurations (GXAJ, GXAJ-S, GXAJ-S-SF) were calibrated using the shuffled complex evolution algorithm (SCE-UA; Duan et al., 1992). This global optimization algorithm uses samples from the parameter space using different prior configurations, reducing the risk of local minima and enhancing robustness. Only major parameters were subject to calibration, thereby reducing the risk of over-parameterization and ensuring model efficiency. Importantly, the snow and freeze–thaw modules developed here are model-independent and can be integrated into other hydrological models. Adaptation requires only alignment with the target model's soil layering and runoff generation structure – for example, setting the humus layer thickness Lh to zero if interflow is not considered, and the three-layer evapotranspiration scheme can be directly embedded. The flexible design preserves overall simplicity while ensuring physical consistency and adaptability, making the approach especially suitable for cold-region studies in ungauged or data-limited basins.
2.3 Model implementation and evaluations
2.3.1 Study area
The Yalong River is located in the southeastern part of the Tibetan Plateau and is the largest tributary of the Jinsha River. The main river stretches 1571 km with a natural drop of 3830 m. Rich in hydroelectric resources, 21 hydropower stations are planned along the river, primarily concentrated in the downstream region. This study focuses on the mid-upper reaches of the Yalong River basin (29.94–34.21° N, 96.82–101.63° E), with the Yajiang hydrological station serving as the outlet flow measurement (Fig. 3), covering an area of approximately 67 000 km2. The elevation ranges from 2500 to 5900 m. It has a general south–north orientation, with a high elevation in the northwest and a low elevation in the southeast, predominantly mountainous. Most precipitation occurs in summer, with limited snowfall in winter. Due to the complex terrain, meteorological observations in the study area are constrained. Seasonally frozen ground is widespread, with some areas containing sporadic permafrost (Ran et al., 2012). Seasonal snow significantly affects spring runoff, with about 50 % of runoff directly fed by precipitation and the rest from glacier melt and groundwater (Wu et al., 2024). This pattern may change in the future due to global warming (Yao et al., 2022).
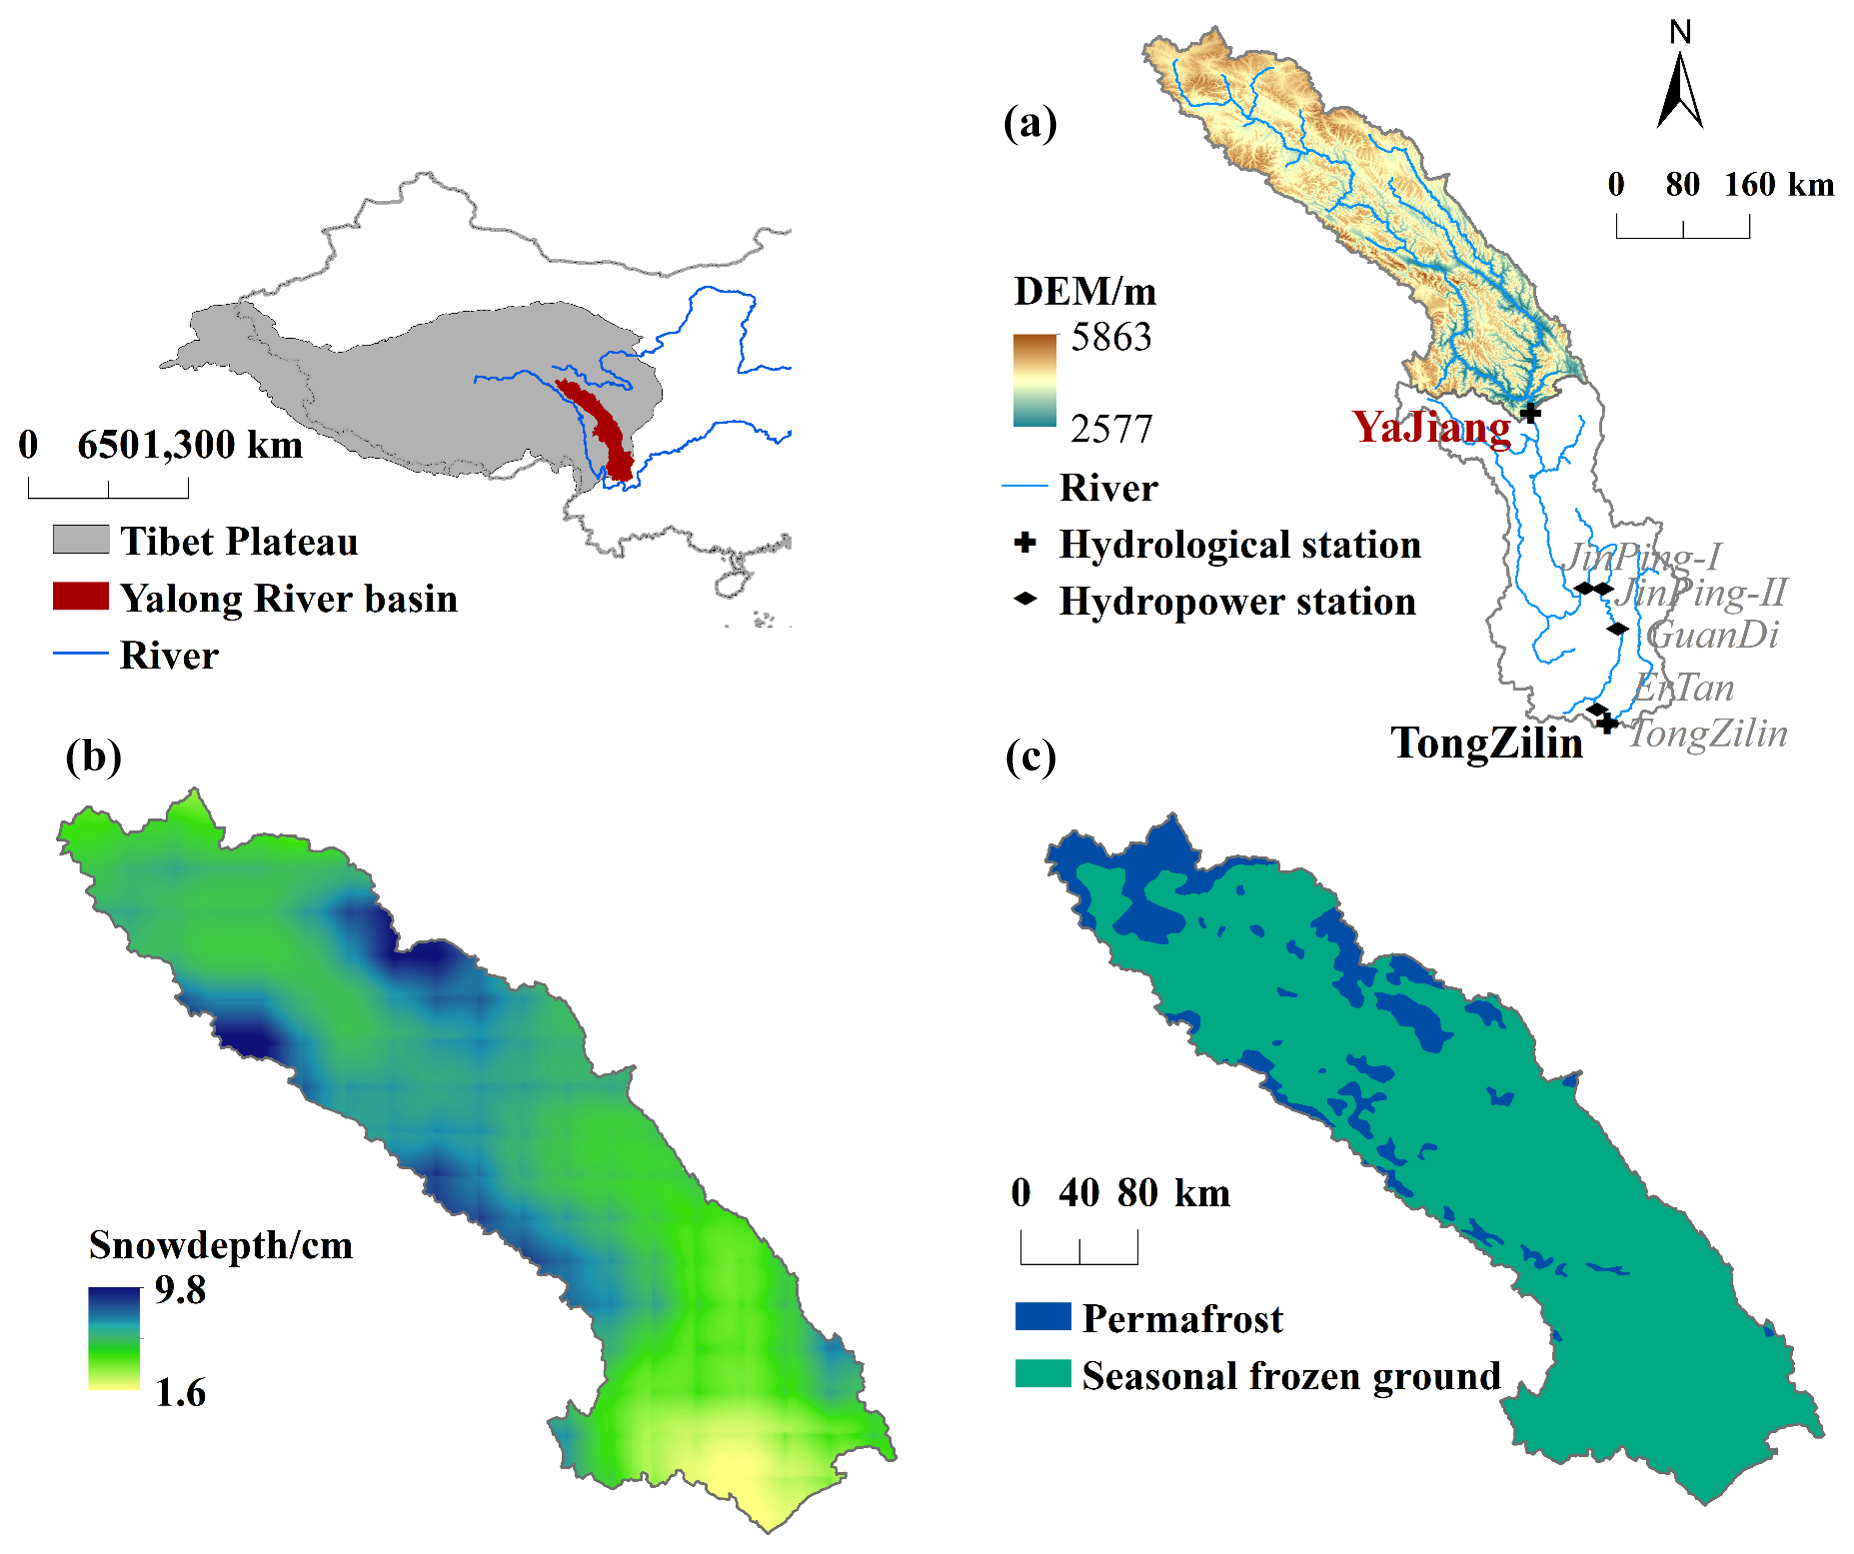
Figure 3The mid-upper reaches of the Yalong River basin in the southeastern Qinghai–Tibet Plateau, China: (a) topographic features, (b) annual average snow depth distribution, and (c) seasonal frozen ground areas (https://doi.org/10.3972/westdc.0078.2013.db).
2.3.2 Data collection, pre-processing, and implementation
The data collection and description are presented in Table 3. Considering the computational efficiency of the model, the precision of precipitation, air temperature, snow depth, and all other data were resampled to 0.05°. The hydrological simulation performance of the original models (GXAJ and SNOW17) and the further developed models (GXAJ-S and GXAJ-S-SF) were evaluated in the mid-upper reaches of the Yalong River basin. First, the SNOW17 model was calibrated (2000–2010) and validated (2011–2018) using remote sensing snow depth data to determine snowmelt parameters, with the freeze–thaw processes determined through empirical formulas. Then, the developed models GXAJ-S and GXAJ-S-SF were used to simulate runoff during the same period, focusing on the snowmelt runoff period from March to June and comparing with the original GXAJ model. The impact of the two components (SNOW17 and SFG) on the runoff process, including runoff sources, components, and evapotranspiration, was also analyzed. Various statistical criteria, including Nash–Sutcliffe efficiency (NSE), BIAS, relative error (RE), and root mean squared error (RMSE), were used to evaluate model performance. These criteria are defined in Eqs. (S1)–(S4) in the Supplement.
3.1 Simulation of snow accumulation and the freeze–thaw process
At the basin scale, the SNOW17 model was first applied to determine the model parameters. The average daily snow depth simulated during the calibration period (2000–2010) and the validation period (2011–2018) was compared to remote sensing data. As shown in Fig. 4, the simulated snow depth closely followed the trend observed in the remote sensing data. Although the model slightly overestimated snow depth overall, it demonstrated reasonable accuracy in capturing the dynamics of snow depth. The model performed better during the validation period (RMSE=1.6 cm, BIAS=0.3 cm) compared to the calibration period (RMSE=2.1 cm, BIAS=0.9 cm). The model simulation error is relatively large when the snow depth is high, which may be attributed to a more complex snow-melting process under deep-snow conditions. Shallower snow depths may reduce errors related to model simplifications of complex snowmelt processes under deep snow conditions, thereby improving the simulation accuracy. This may also be the reason why the simulation accuracy is higher in the validation period (shallower snow depth) than in the calibration period (deeper snow depth). The trend lines in Fig. 4 indicate a declining trend in snow depth from 2000 to 2018 in the mid-upper reaches of the Yalong River basin, which is evident in both the remote sensing data and the model simulation results. Overall, the SNOW17 model showed satisfactory simulation results of snow depth.
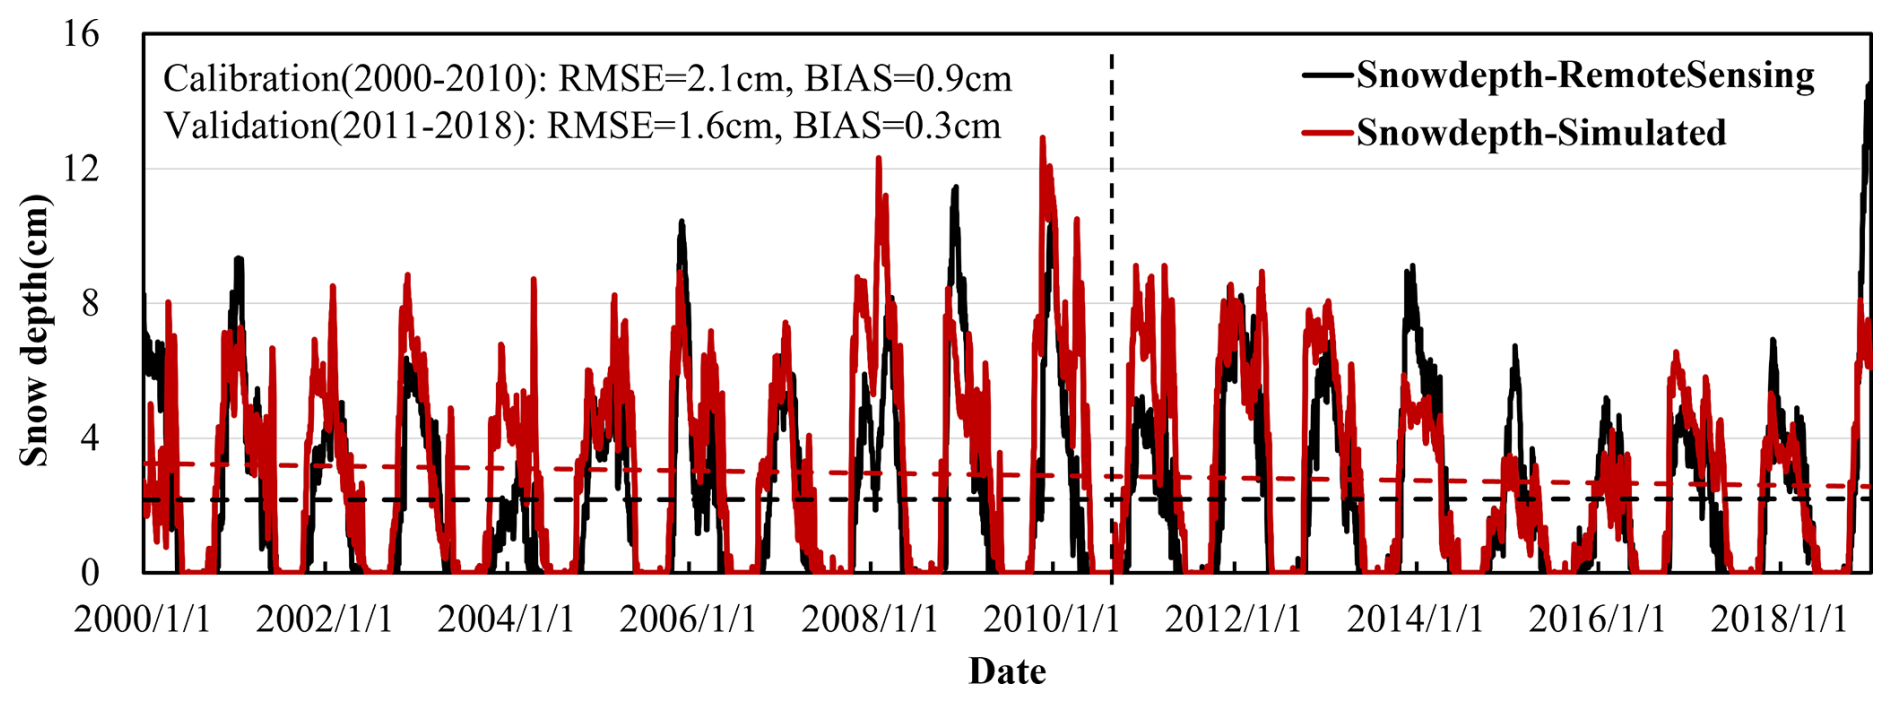
Figure 4Comparison of simulated and observed basin-average snow depth in the Yalong River basin during the calibration (2000–2010) and validation (2011–2018) periods. The dashed lines represent the trend of snow depth.
This study systematically validated the simulation results of frozen soil depth based on the Stefan empirical formula through multi-source data comparison. Figure 5 presents the frozen depth derived from ERA5 reanalysis data using four soil temperature layers (0–7 cm, 7–28 cm, 28–100 cm, and 100–289 cm; freezing occurs when layer temperatures fall below 0 °C). The seasonal freeze–thaw depths calculated by the Stefan formula exhibit high consistency with ERA5-derived results in both freeze–thaw timing and variation trends. Notably, the ERA5-based frozen depths display a stepwise variation pattern, with the maximum freezing depth terminating at the 100 cm layer, likely attributable to the freezing inhibition effect caused by higher temperatures in the deep soil layer (100–289 cm). The simulations indicate that the freezing process initiates in late September, reaches a maximum depth of 1.4 m by late March of the following year, and completes thawing by late May. This temporal pattern aligns closely with ground temperature observations from basin meteorological stations (Fig. S6 in the Supplement; mean errors of ≤5 d for initial freezing dates and ≤10 d for initial thawing dates).
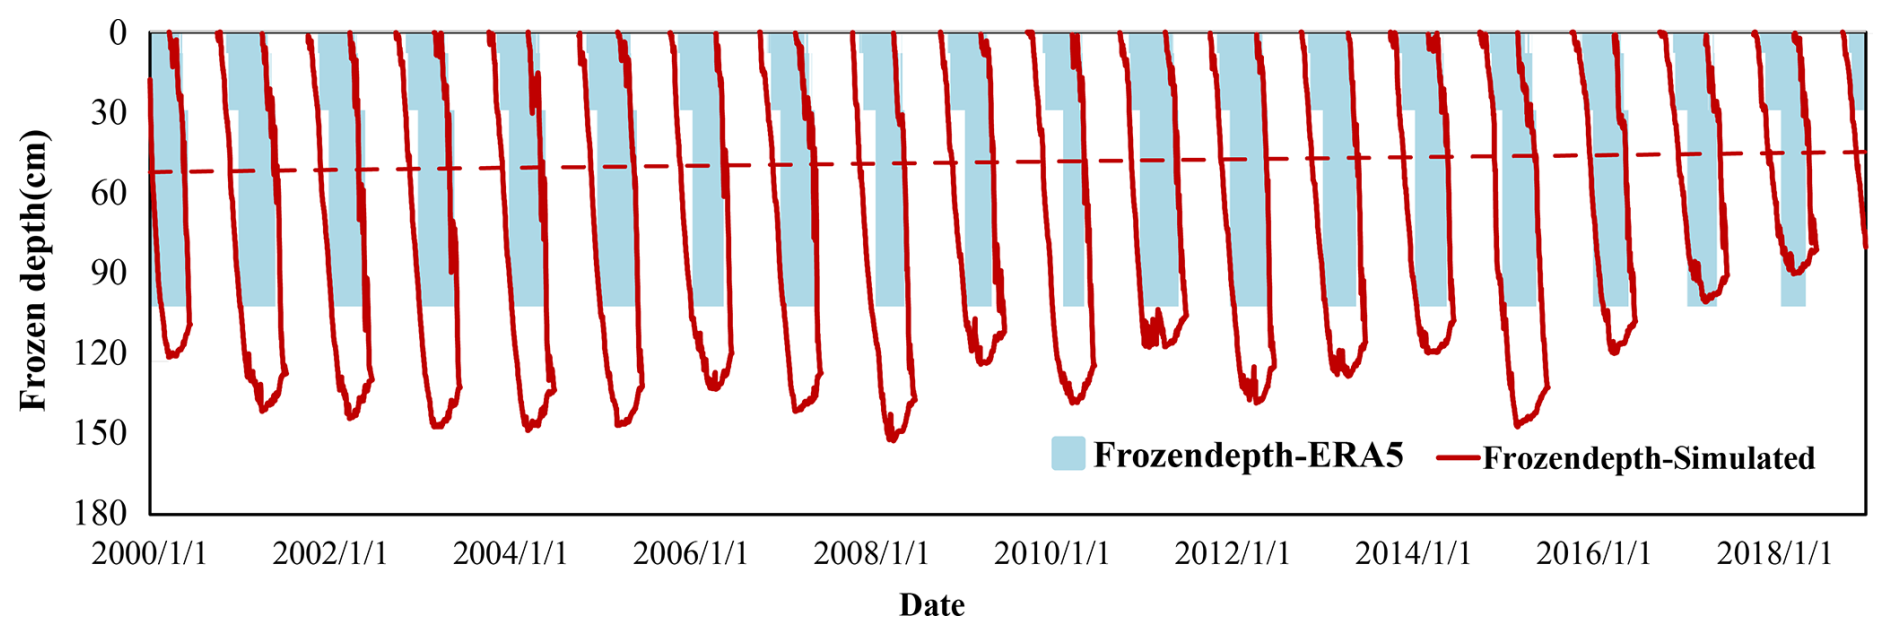
Figure 5Seasonal freeze–thaw depth changes calculated using the Stefan empirical formula and ERA5 data in the study area. The dashed lines represent the trend of frozen depth.
To further evaluate the model's spatial performance, the 2000–2018 mean maximum frozen depth distribution was compared to contemporaneous data from the National Tibetan Plateau Data Center (Table 3; Fig. S7 in the Supplement). The Stefan formula-based simulations, incorporating station-based temperature interpolation, demonstrate smoother spatial transitions – a characteristic linked to model parameterization. Both datasets reveal a gradient pattern of deeper frozen depths in upstream valley regions and shallower depths in downstream areas, with a spatial correlation coefficient of 0.89. Furthermore, the observed decreasing trend in frozen depth during 2000–2018 corresponds with accelerated snowmelt patterns (Fig. 4), highlighting the coupled response of the cryosphere to climate change.
To further illustrate the impacts of freeze–thaw processes, Fig. 6 shows the annual variation of basin-average snow depth, frozen ground, effective humus layer, effective vadose zone, and soil water/ice content in 2001. The figure shows that the formation of frozen ground preceded the occurrence of snow. In particular, during periods of little or shallow snow depth (October–December), the rate of ground freezing was relatively fast. However, as snow depth increased (enhancing its insulating effect), the freezing rate gradually slowed down. Snow depth reached its maximum value (approximately 9 cm) in February and then rapidly decreased to 3 cm. Only when the snow depth was small did the ground freeze begin to melt. Therefore, the ground freezing and thawing trends were closely aligned with changes in snow depth.
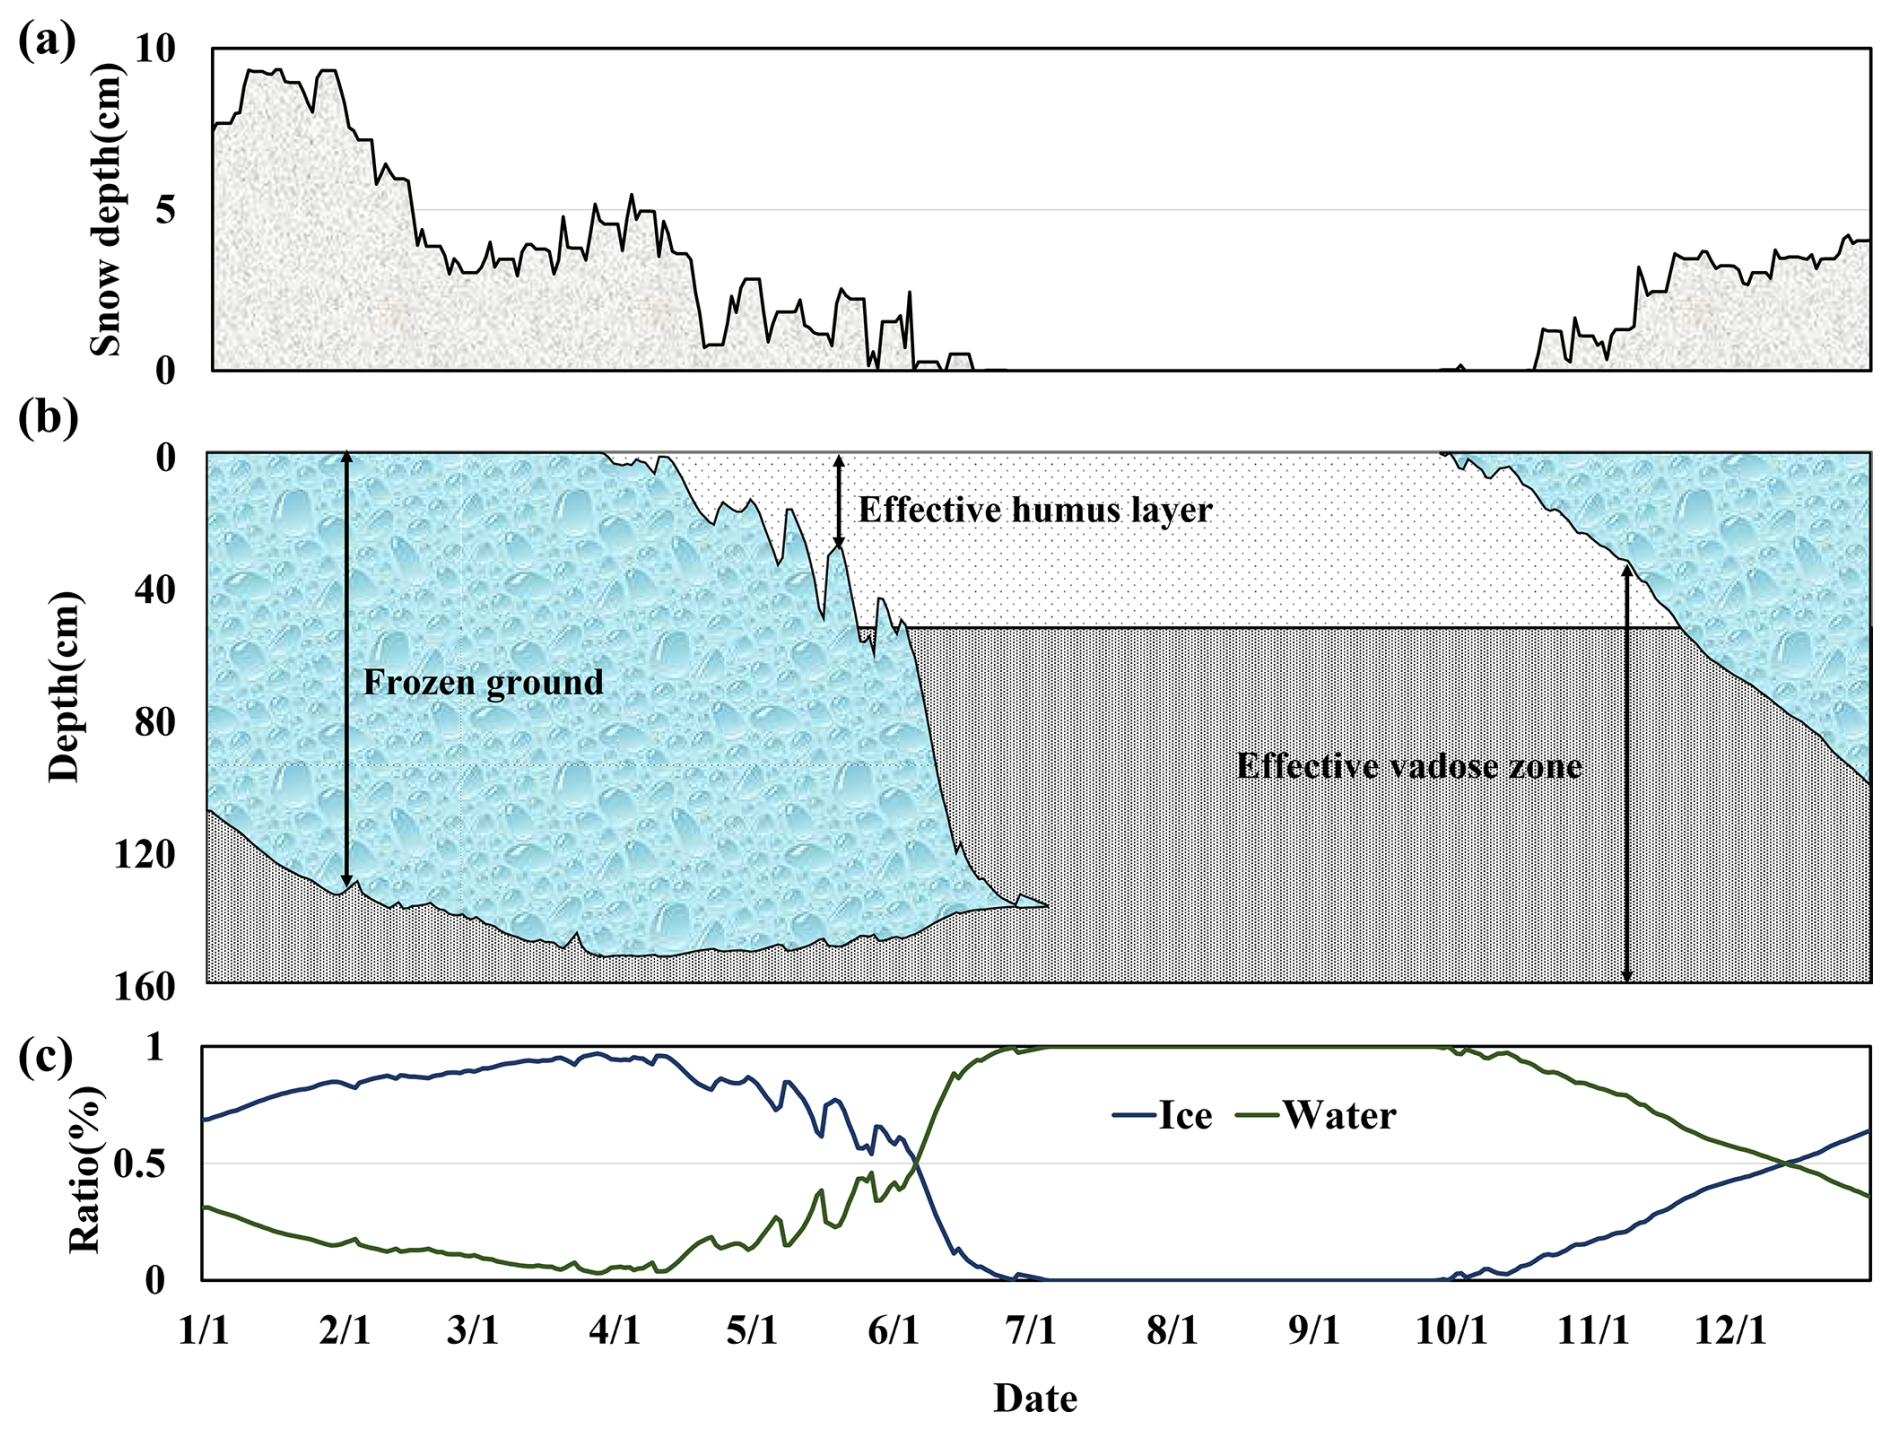
Figure 6(a) Annual variation of basin-average snow depth; (b) impact of frozen ground on the basin-average depths of the effective vadose zone and humus layer; (c) basin-average ratio of water/ice content in the vadose zone, taking 2001 as an example.
Moreover, Fig. 6b demonstrates that frozen ground freezes part of the vadose zone, significantly reducing the effective vadose zone thickness of the Yalong River basin, particularly during cold months (October–December and January–May), with the humus layer even becoming entirely frozen. When the temperature rises, the surface frozen ground melts rapidly, and there are frequent and short freeze–thaw cycles. In turn, the humus layer and the vadose zone melt and return to an unfrozen state. Figure 6c further illustrates a notable increase in soil ice content due to ground freezing, as well as a corresponding decrease in soil water content. These solid–liquid transformation processes of the Yalong River basin therefore exert a critical influence on the water storage capacity of the vadose zone, altering infiltration pathways and consequently affecting the partitioning of runoff into surface water and groundwater components.
3.2 Calibration and validation of the streamflow
Figure 7a shows the simulated daily streamflow at the Yalong station of the GXAJ model from 2000 to 2018, without considering the effects of snow and seasonally frozen ground (SFG). The model did not distinguish between rainfall and snowfall, and all incoming water was treated as rainfall. The model performed relatively well during both the calibration period (2000–2010) and the validation period (2010–2018), with NSE of around 0.8. However, streamflow was often underestimated in winter and spring, which can be related to the impacts of frozen ground and snow. To further understand the model's performance in specific periods, the streamflow simulation results from March to June were analyzed separately (Fig. 7b). The results then showed that the GXAJ model had considerable inaccuracies in simulating spring snowmelt, especially during the validation period, where NSE decreased to 0.44 and RE reached −0.50. These metrics reflect that the GXAJ model calculated spring streamflow based solely on rainfall, failing to reflect the delayed effect of snowmelt on streamflow, which consequently led to streamflow underestimation.
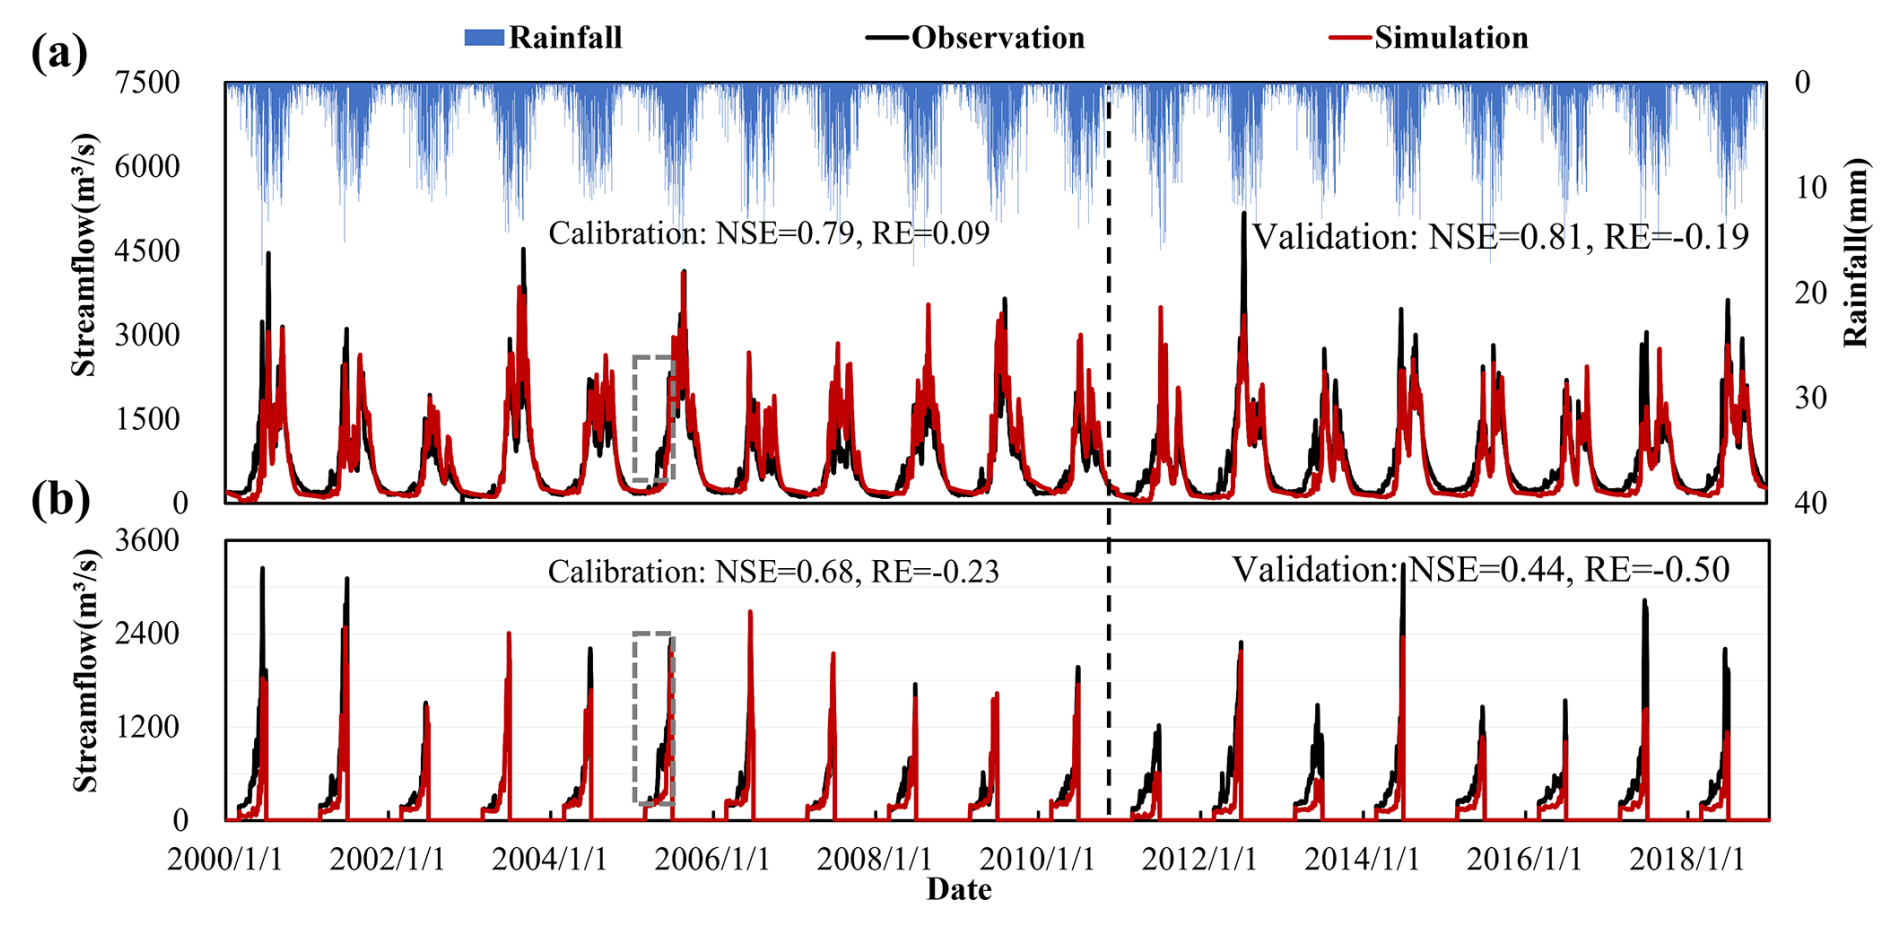
Figure 7(a) Daily observed streamflow at the Yalong station and simulated streamflow by the GXAJ model during the calibration (2000–2010) and validation (2011–2018) periods, (b) with spring snowmelt from March to June highlighted (in the dashed rectangle).
When snow cover effects were considered in the GXAJ-S model, the accuracy of daily streamflow simulation during 2000–2018 significantly improved (Fig. 8a), especially during the calibration period (NSE=0.82, RE=0.05), indicating a better performance of the GXAJ-S model in simulating snow accumulation and its hydrological effects, as compared to the original GXAJ model. However, as shown in Fig. 8b, the model still showed inaccuracies during the spring snowmelt period, particularly in the validation stage (NSE=0.68, ). The decrease in accuracy during the validation period may be partially related to changes in the applicability of model assumptions and parameter values between the calibration and validation periods. It probably also reflects that the model has not yet fully considered the interaction between snow and frozen ground on runoff, with the delayed water retention effect of frozen ground during the spring snowmelt period likely being a major source of error.
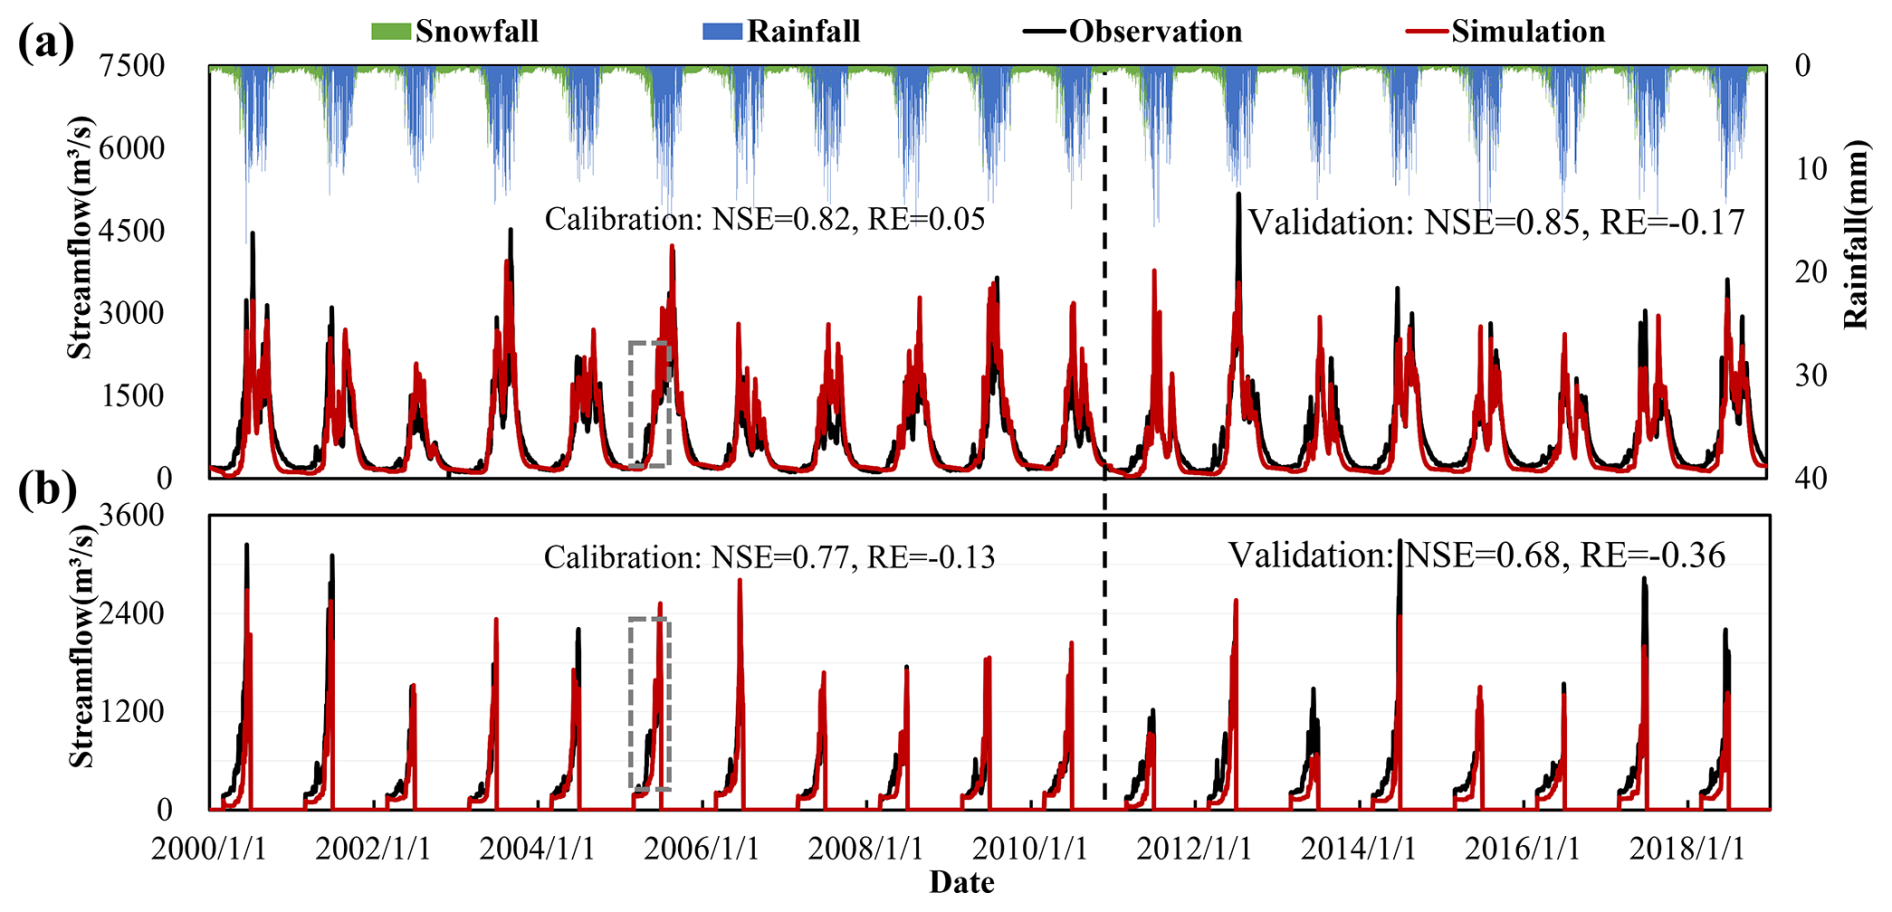
Figure 8(a) Comparison of GXAJ-S model simulation results with observed values, (b) highlighting spring snowmelt from March to June.
Considering both snow cover and SFG effects, the GXAJ-S-SF model demonstrated excellent performance in overall daily runoff simulation (Fig. 9a). The NSE values for both the calibration and validation periods exceeded 0.8, and the RE values were close to zero, indicating a high degree of fit between the model and the observed runoff time series. Compared to the GXAJ-S model, the GXAJ-S-SF model was more accurate in simulating daily runoff, especially during the calibration period, showing higher accuracy. In simulating spring snowmelt runoff (Fig. 9b), the GXAJ-S-SF model showed improvements over the previous models, particularly during the calibration phase, achieving higher accuracy. Although some underestimation remained in the validation period, the GXAJ-S-SF model demonstrated higher accuracy compared to the other two models.
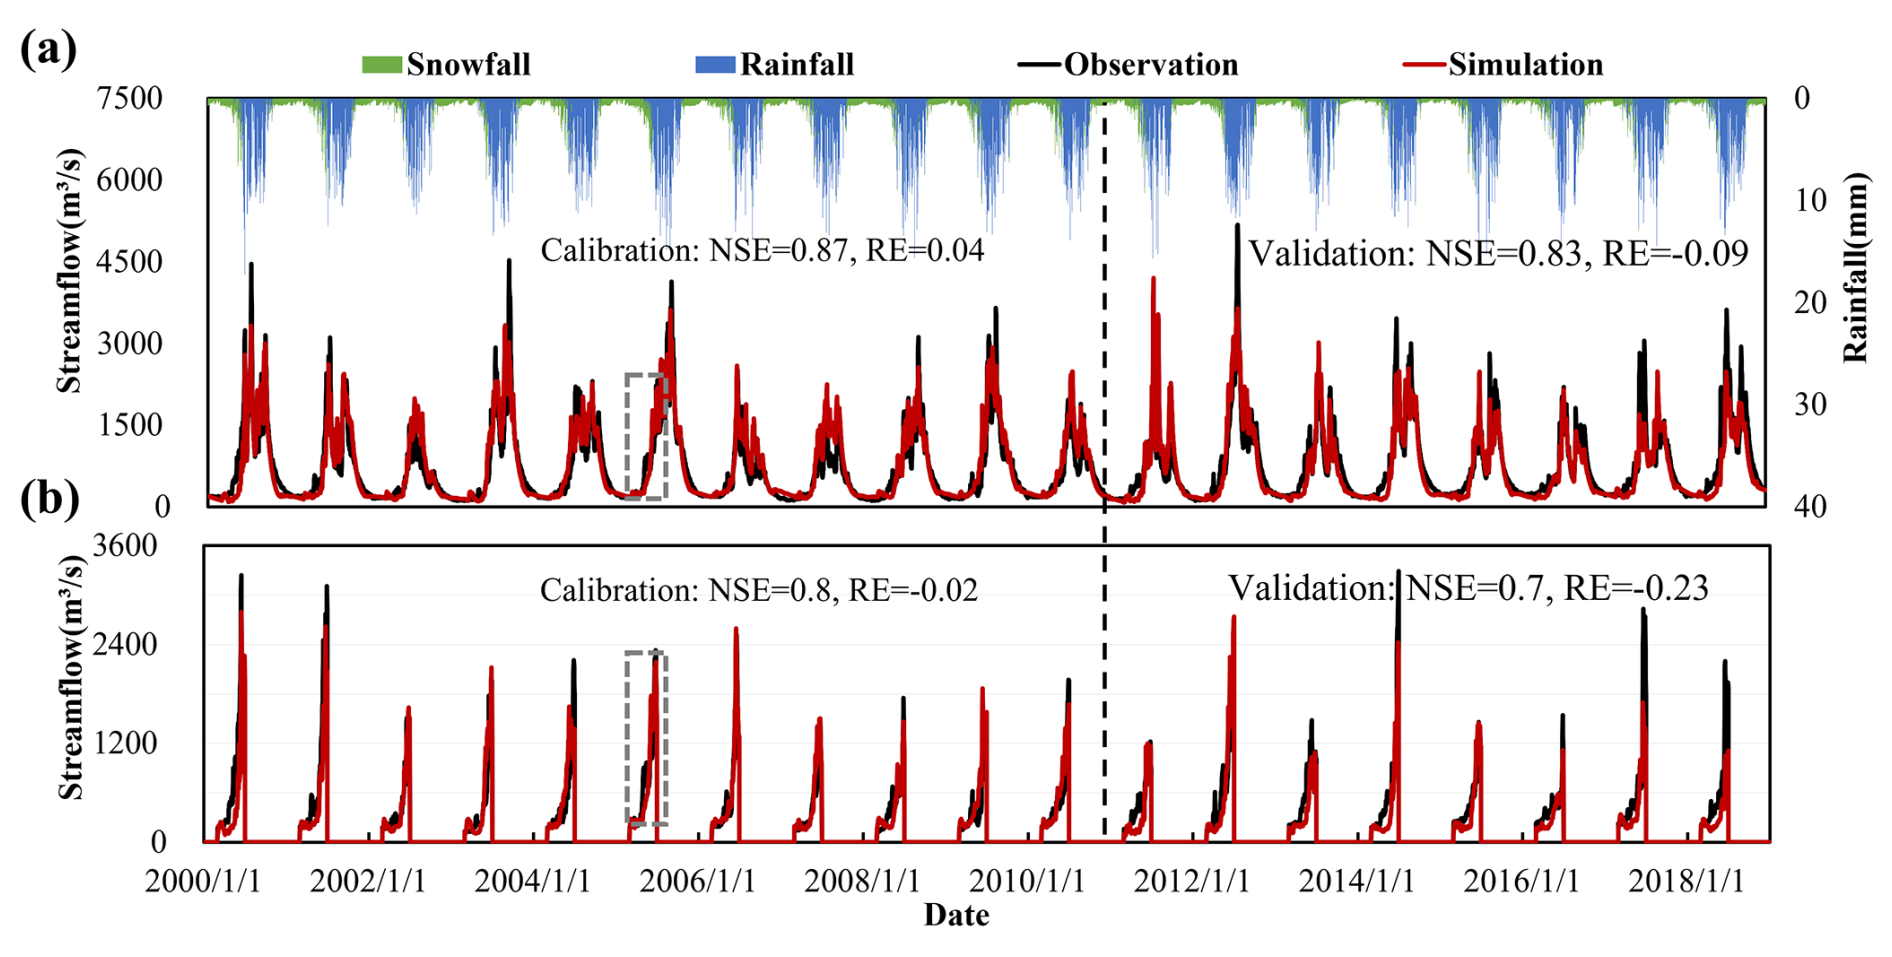
Figure 9(a) Comparison of GXAJ-S-SF model simulation results with observed values, (b) highlighting spring snowmelt from March to June.
To provide a more comprehensive comparison of the three models, we have included an evaluation of computational efficiency. Table S1 in the Supplement presents the calibration and simulation times for GXAJ, GXAJ-S, and GXAJ-S-SF. The results indicate that while GXAJ-S-SF provides improved physical representation, it requires longer computation time compared to GXAJ and GXAJ-S. This information is useful for users who may prioritize efficiency over accuracy in certain applications.
3.3 Model differences in simulated runoff components and soil evapotranspiration
Figure 10 illustrates differences in the simulation of surface water runoff, interflow, and groundwater runoff among different models. The GXAJ and GXAJ-S models simultaneously reached the minimum percentage of interflow and maximum percentage of surface runoff in June and May, respectively, possibly due to the modeled soil saturation in both cases reaching relatively high values during the rainy summer season, thereby increasing surface runoff. Overall, the runoff components simulated by the GXAJ and GXAJ-S models were similar, with interflow accounting for the largest proportion (55 %–70 %), followed by groundwater runoff (20 %–26 %). The similarities between these two cases suggest that the omission (in GXAJ) or inclusion (in GXAJ-S) of snow processes in the modeling had a relatively limited impact on the simulated runoff dynamics. However, the GXAJ-S-SF model exhibited significant simulation differences. Figure 10c shows that during the cold months (January–March, November–December), the proportion of surface water runoff increased significantly to 48 %–83 %, mainly influenced by SFG (39 %–77 %), as seen in Fig. 6b, while interflow and groundwater runoff decreased substantially. This was because SFG interrupted the connection between surface water and groundwater, preventing infiltration and leading to more surface water runoff. Additionally, the impact of SFG on interflow was most evident from March to May. As the surface soil thawed from top to bottom, the thawed soil layer tended to produce interflow. Groundwater runoff was hindered by frozen ground, remaining low during the cold season until frozen soil completely melted in summer, when groundwater runoff returned to its unfrozen state. This dynamic change indicates that SFG processes play a critical role in regulating runoff composition over time. Moreover, SFG has a pronounced “decoupling effect” on surface runoff and groundwater runoff during the cold months, interrupting their connection and restricting groundwater recharge and deep percolation.
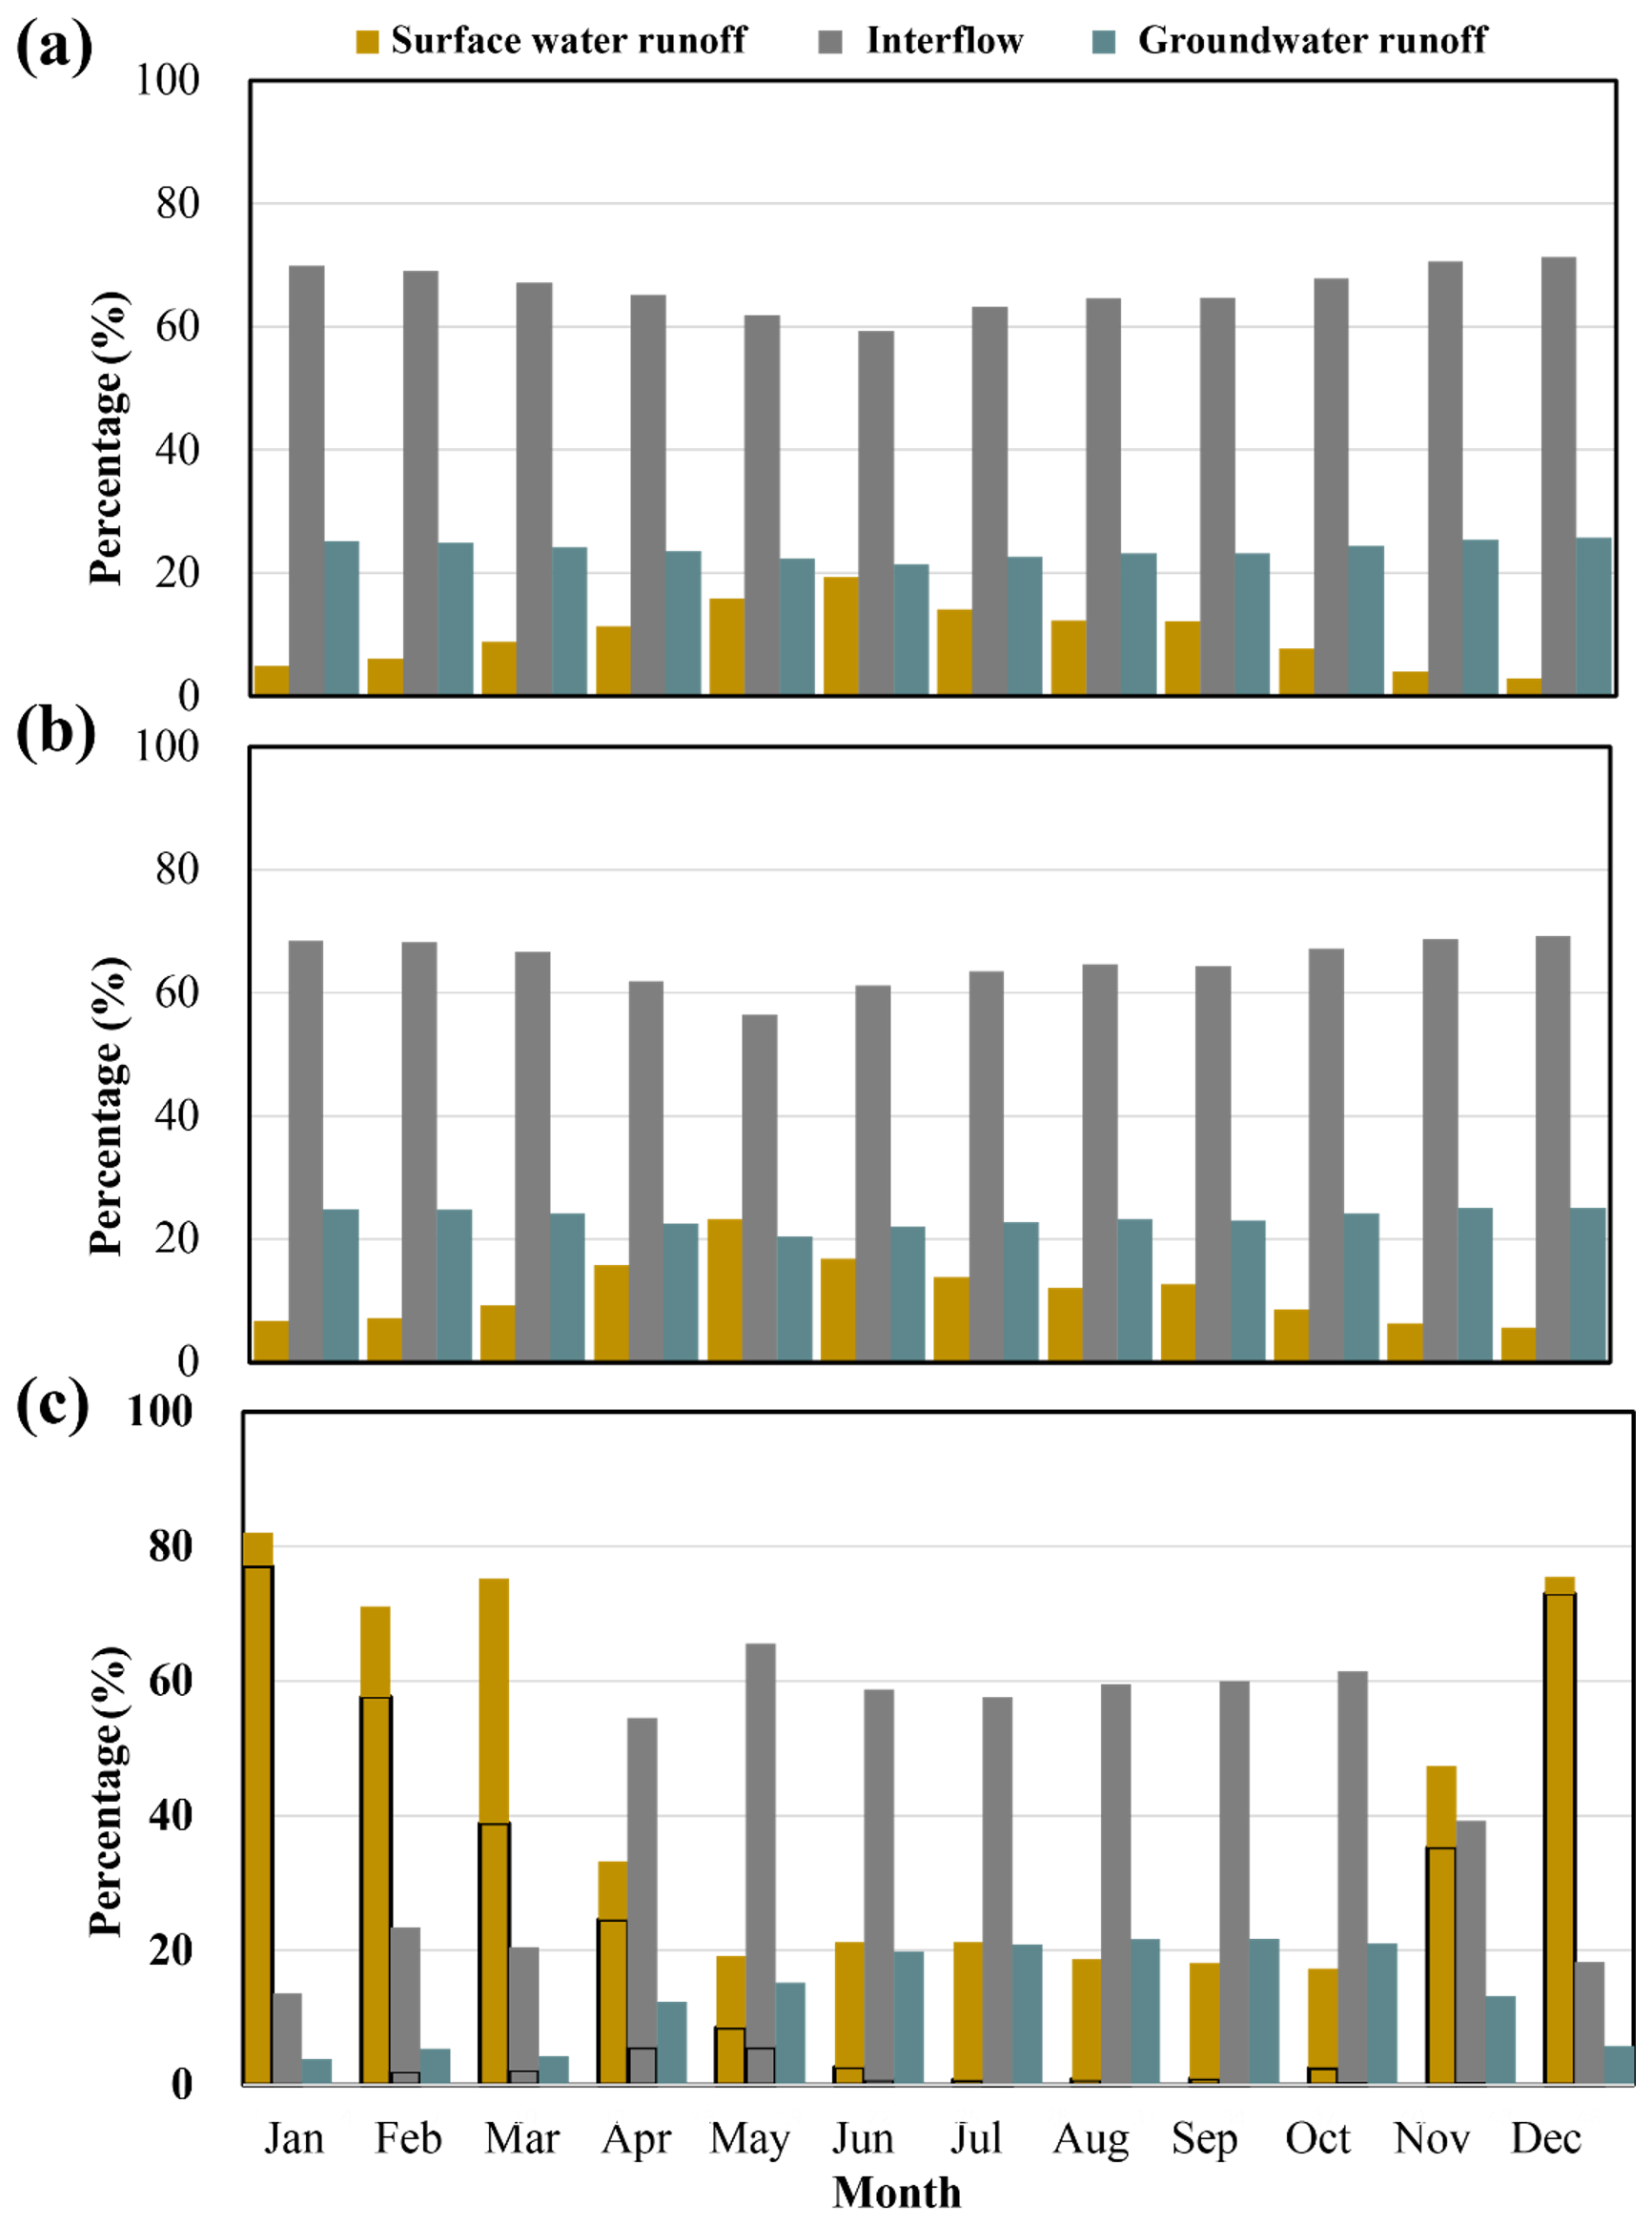
Figure 10Comparison of simulated runoff components by models: (a) GXAJ, (b) GXAJ-S, and (c) GXAJ-S-SF, with the black box in (c) indicating runoff components influenced by SFG. The percentage of the y axis represents the percent contribution of the considered runoff component (surface water runoff, interflow, and groundwater runoff) to the total runoff.
Based on the model comparison results shown in Fig. 11, the suppression effect of snow and frozen ground on soil evapotranspiration during the cold months exhibited significant temporal variability. During the cold period (November to March), evapotranspiration in the GXAJ-S-SF model remained generally below 5 mm, whereas in the GXAJ model, it ranged between 10 and 30 mm, with an average reduction of approximately 85 %. This substantial decrease was primarily attributed to two mechanisms: first, snow cover effectively inhibited soil moisture evaporation, leading to snow loss primarily through sublimation rather than direct evapotranspiration; second, the formation of frozen ground created a barrier within the soil, restricting upward water transport and significantly reducing soil moisture loss. As temperatures rose, evapotranspiration across the basin gradually intensified, and in May, the difference between the two models reached its maximum, approximately 30 mm. At this time, the snow had mostly melted, but frozen ground remained, continuing to influence soil moisture transport and evapotranspiration, thereby maximizing the discrepancy between the two models. During summer (July to September), the influence of snow and frozen ground gradually diminished, and the difference in simulated evapotranspiration between the two models decreased to within 5 mm, indicating that the effects of freezing had essentially disappeared. As shown in Fig. 11, with the dashed rectangular area representing the summer of 2010, the simulation results of both models converged, suggesting that even in high-altitude regions, the residual effects of frost and snow on basin-wide evapotranspiration were negligible. Overall, the comparison between the GXAJ-S-SF and GXAJ models clearly revealed the significant regulatory role of snow and frozen ground in soil evapotranspiration during cold seasons. This effect was particularly pronounced in winter, effectively preserving soil moisture and reducing water loss by suppressing evapotranspiration. However, as temperatures rose, this influence gradually weakened and eventually disappeared in the warm season.
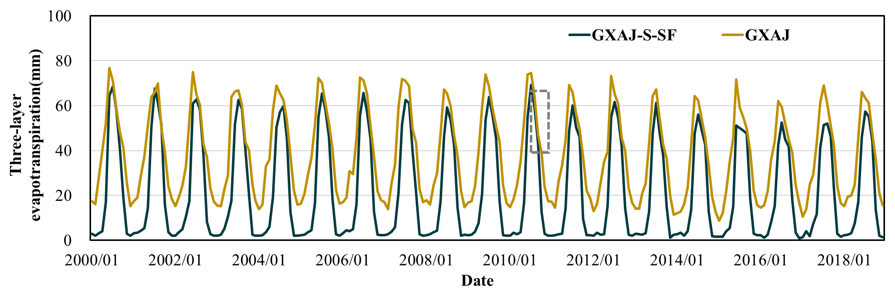
Figure 11Simulated monthly evapotranspiration series during the study period. The dashed rectangle represents the 2010 summer evapotranspiration.
4.1 Key limitations in hydrological models in relation to their process complexity
A limitation in the application of the GXAJ base model, which neglects the impacts of snow and ice, is related to the fact that the parameters of its modules are determined based on historical basin characteristics. Although such models without frozen ground components can, through appropriate calibration or optimization of parameters, in some cases successfully reproduce historical hydrological processes in cold regions under stable conditions (Li et al., 2011; Zhang et al., 2017), they may not be suitable for evaluating the consequences of future changes as their calibrated values do not represent new conditions of the basin and as the model lacks physical representation of key drivers of change. Our study demonstrates that incorporating the effects of seasonally frozen ground (SFG) and snow into a basic model can provide robust and physically consistent results in simulating large-scale hydrological processes in cold regions, which can be particularly important for predicting the hydrological impacts of future climate change scenarios.
Although significant progress has been made in physical models that account for snow and freeze–thaw processes, their application in cold-region hydrology remains challenging. The spatial heterogeneity in topography, vegetation, and soil properties in cold regions introduces substantial uncertainty in the energy balance and surface heat flux simulations (Gao et al., 2018). Errors in estimating surface albedo, net radiation, and snow thermal properties can cascade into inaccuracies in ground temperature and freeze–thaw simulations (Wang et al., 2024). Moreover, physical models often require high-resolution spatial inputs and detailed parameterization (e.g., soil hydraulic conductivity, canopy structure, and snow thermal conductivity) (Gao et al., 2018; Song et al., 2022), which are rarely available for large-scale and high-altitude basins like the Yalong River. The diversity in climatic and geographic conditions further reduces model transferability (Yong et al., 2023; Zhou et al., 2021).
In contrast, our proposed GXAJ-S and GXAJ-S-SF models adopt a distributed framework that integrates key cold-region hydrological processes (i.e., snowmelt and SFG dynamics), based on physically grounded but simplified formulations. For example, the snow module is adapted from the SNOW17 model, and the frost depth is calculated using the Stefan equation, incorporating snow insulation effects. In particular, our three-step approach (involving the GXAJ, GXAJ-S, and GXAJ-S-SF models) implies that a limited number of additional parameters are introduced in each performance evaluation step, which enables the identification of well-functioning levels of model complexity while involving only a small number of parameters. This greatly reduces the risk of overfitting. We also considered the risk of coincidental good performance by potentially overfitted models by evaluating in which way the addition of process-based modules alters the model behavior in multiple subcatchments and over multiple seasons. We could then, for instance, see that, rather than increasing the subcatchment and seasonal performance in random ways, the addition of the snow and SFG modules specifically increased cold-season performance in low-temperature (high-altitude) parts of the study area, which is consistent with the expected effects of the considered processes.
This therefore provides a logical explanation as to why the simulation performance demonstrated here was strong (e.g., with high NSE) despite being based on few parameters as compared to, for example, VIC and SWAT applications. In a direct comparison using the same study period (2007–2011), the VIC model yielded NSE values of 0.75 (calibration) and 0.65 (validation) in the Yalong River basin (Li et al., 2018b), whereas our model achieved NSE values of 0.87 and 0.74, respectively. This suggests that our approach is more suited to this data-scarce mountainous basin, where excessive model complexity may not translate into improved predictive accuracy (Wang et al., 2024). In turn, this may be related to increased demands of uncertain input data of complex physical models (Gao et al., 2018; Qin et al., 2017; Wang et al., 2024).
In complex mountainous cold regions, observation remains a bottleneck (Gao et al., 2022). Due to limitations in measured data on frozen soil and snow depth in the considered Yalong River basin, this study used multi-source remote sensing data and reanalysis data for calibration and verification from multiple perspectives. In particular, errors in remote sensing snow depth data (Yan et al., 2022; Zou et al., 2014) can propagate to the model output. However, previous studies have specifically investigated the remote sensing dataset used here for the Yalong River basin, showing that its accuracy is high (Wu et al., 2024), which suggests that model errors should be relatively low. This study further compared MODIS snow cover data with model simulations, revealing that snow cover extended over up to half of the study area, with the daily snow cover fraction exhibiting a high correlation coefficient of 0.91 between the two datasets. Figure S8 in the Supplement illustrates the spatial distribution of simulated snow depth and MODIS-derived snow cover on 1 December 2015, demonstrating strong consistency in coverage patterns. We also recognize that the use of surface/soil temperature and maximum frozen ground depth to verify the freeze–thaw process introduces some uncertainty (Li et al., 2022). Since the GXAJ-S and GXAJ-S-SF model variants used the same temperature, snow, and frozen ground data in the present simulations, they can be expected to share similar data errors. However, due the non-linear nature of the modeled processes, such data errors may still not be eliminated completely when comparing different models. Nevertheless, observed differences in model performance between these models are expected to reflect mainly differences in model capabilities rather than input datasets. Future work should focus on improving remote sensing data quality and exploring the long-term robustness of the model to further enhance performance and to improve our understanding of the freeze–thaw processes in complex mountainous areas in cold regions.
Hydrological modeling typically prioritizes model fitness, which in theory can be improved by introducing more fitting parameters. However, this study highlights differences that are due to the addition of process-based modules (regarding snow and frozen ground). This implies that improvements in model fit and differences in associated model output (e.g., runoff and evapotranspiration) reflect how the considered snow and/or frozen ground processes more concretely alter hydrological flows. This therefore increases the understanding of underlying hydrological processes (Gao et al., 2022) in large-scale applications such as the Yalong River basin, which additionally has a complex topography, with large elevation differences yielding high spatiotemporal heterogeneity in the snowmelt and freeze–thaw cycles of soil.
4.2 The impact of seasonal frozen ground/snow on hydrological processes
SFG is a thermally-driven phenomenon dependent on ground heat. As previously mentioned, it is clear that SFG in many cases has a crucial impact locally, as ground freezing causes ice to block previously water-filled soil pores, restricting water flow through them. This process directly affects the seasonal permeability of the vadose zone and groundwater recharge (Ge et al., 2011). Our study similarly found that the formation of frozen ground not only significantly reduces the effective thickness of the vadose zone but also leads to the complete freezing of the humus layer (Fig. 6). Additionally, snow cover plays a key role in modulating frozen ground development through its thermal insulation effect: when snow cover is shallow, the freezing rate is accelerated; however, as snow depth increases, the freezing rate of the frozen ground slows down (Fig. 6). This finding aligns with Iwata et al. (2018), who suggested that despite subzero air temperatures, thick early-winter snow cover can significantly reduce or even completely prevent ground freezing.
The impact of soil freeze–thaw cycles on basin runoff generation varies seasonally (Fig. 6; Gao et al., 2023). Previous studies have shown that spring runoff is primarily composed of surface runoff and interflow, while the summer thawing of frozen ground enhances groundwater recharge (Huelsmann et al., 2015). Through multi-model comparisons, this study further quantified these processes: when accounting for SFG effects, the proportion of surface runoff from November to March increased by 39 % to 77 % compared to the baseline model without SFG. Additionally, the influence of SFG on interflow was most pronounced in spring (Fig. 10). This is largely due to the relatively impermeable surface frozen ground, which directly generates substantial surface runoff. Even as temperatures rise and the surface soil gradually thaws, the effective vadose zone remains highly susceptible to saturation (Guo et al., 2022; Huelsmann et al., 2015; Ireson et al., 2013; Wang et al., 2017), leading to the formation of interflow at the base of the thawed layer (Fig. S4). Overall, the multi-model simulations of daily runoff processes therefore provided important insights into key factors governing basin hydrology under seasonal variations in cold regions.
Furthermore, the freeze–thaw process complicates soil water movement within the vadose zone (Yu et al., 2018). Within the frozen soil layer, water movement is minimal, resulting in negligible upward evaporation. Above the freezing interface, water moves upward and evaporates. As the thawed layer thickens, evaporation and infiltration capacities gradually increase (Yu et al., 2018). The simulation results from the GXAJ-S-SF model in this study further reflected significant seasonal differences in the suppression effect of the snow–frozen ground interaction on evapotranspiration (Fig. 11): during the freezing period (December–March), evapotranspiration decreased by 85 %, while after thawing (July–September), the difference was reduced to within 5 mm. This process not only highlights the barrier effect of frozen ground but also demonstrates the suppression of snow sublimation (Anderson, 1973). These processes, including freeze–thaw dynamics, soil moisture movement, and the effects of snow and SFG on evapotranspiration, can influence the hydrological cycle and ecosystems by altering water availability and flow patterns. These effects, particularly during freeze–thaw periods, may lead to changes in water storage, infiltration, and runoff, which can alter regional water resource management and ecosystem resilience.
In addition, snowmelt runoff is a vital component of spring runoff in the Yalong River basin, as further demonstrated in this study (Fig. S8). Snow cover varies with elevation, exhibiting significant spatiotemporal heterogeneity (Li et al., 2018). Under the backdrop of global warming, rising average temperatures are expected to affect the composition and duration of snow cover (Fig. S9 in the Supplement; IPCC, 2021). Changes in snowmelt volume can influence downstream runoff, impacting water resource management and ecological balance. Incorporating the effects of snow into this study has improved the predictive accuracy of hydrological simulations for daily runoff and spring snowmelt runoff (Figs. 7 and 8). Both remote sensing data and model simulation results in this study showed a decreasing trend in snow/frozen depth from 2000 to 2018 (Figs. 4 and 5), which is consistent with the results in similar study areas (Qin et al., 2017; Song et al., 2022). Winter snowmelt water typically infiltrates the upper soil layer, forming an almost impermeable “concrete frost” layer at the interface between the ground and the snow layer upon refreezing (Dunne and Black, 1971). Due to warming, the ice content in SFG is denser, potentially altering the hydrological response of SFG during major spring snowmelt periods (Hardy et al., 2001). The snowfall process profoundly impacts ground thermal conditions, with some proposing that we might even see “colder soils in warmer climates” (Halim and Thomas, 2018). In summary, predicting future changes in SFG and its hydrological importance remains challenging due to the complex interactions between climate, land, water, ecosystems, and human activities. The hydrological relevance of SFG may increase due to factors such as reduced snow cover and changes in snow insulation capacity, more frequent freeze–thaw cycles, rain-on-snow events, and land cover changes (Cuo et al., 2015). These factors may therefore significantly impact the spatial and temporal availability of water resources in SFG regions.
This study quantitatively analyzed the impact of seasonal snow and frozen ground on hydrological processes based on the hydrological model, and its validity was confirmed not only by measured runoff but also by multi-source data, especially the trends in snow and frozen soil changes. Although the model developed based on GXAJ has great potential for application in other cold regions, its use should be based on a thorough understanding of the assumptions and structural limitations of the model. Snow and seasonal frozen ground are only part of the hydrological drivers in cold environments, with other important factors such as glacial melt, geological conditions, and soil thermal properties also playing significant roles (Du et al., 2022; Gao et al., 2023), but these are often difficult to observe or measure directly. Additionally, topographic and vegetation dynamics can significantly impact runoff, infiltration, and evapotranspiration processes (Lazo et al., 2019). While these factors are not currently incorporated into our modeling system, future work could address this by integrating corresponding glacier runoff modules and vegetation–hydrology modules or by improving the representation of frozen ground. The empirical parameters in the SNOW17 model and the Stefan equation have clear physical significance and have been validated by previous studies (Anderson, 2006; Ran et al., 2022; Zou et al., 2014). However, when applied to other regions, the recalibration of key parameters is still necessary. Therefore, expanding the application of complex hydrological models requires careful attention to the local and regional variability of environmental conditions. This may increase the difficulty of modeling but also greatly enhance the understanding of hydrological processes and the generalizability of the assumptions. In cold and data-scarce regions, extending the application of complex hydrological models must strike a balance between model complexity and data availability to ensure their applicability and reliability.
The understanding of cold-region hydrology remains incomplete, primarily due to limited observational data, which also constrains quantitative analyses of water resources, especially in complex mountainous basins like the Tibetan Plateau. This study developed and applied two enhanced versions (GXAJ-S, which incorporates snowmelt; and GXAJ-S-SF, which additionally considers freeze–thaw processes), based on the original GXAJ model. The models were calibrated and validated using measured daily runoff (2000–2018) obtained at the Yajiang discharge station in the Yalong River basin. The results showed that the GXAJ-S-SF model achieved the highest simulation accuracy, with significant improvements in NSE and RE for total runoff and runoff during snowmelt conditions. These enhanced models integrate multiple key cold-region hydrological processes while maintaining low parameter complexity, making them particularly suitable for cold regions with complex hydro-meteorological conditions and scarce data availability.
Further analysis revealed the tightly coupled interactions between snow dynamics, freeze–thaw cycles, and unsaturated zone processes. Snow accumulation and subsequent melting were found to directly influence the depth and duration of soil freezing, altering the thermal and hydrological state of the vadose zone. The presence of frozen ground significantly reduced soil permeability and water-holding capacity, affecting runoff partitioning. During cold months (November–March), SFG processes led to a 39 %–77 % increase in simulated surface runoff, while interflow and groundwater recharge were substantially reduced or entirely suppressed. As thawing progressed (March–May), interflow became the most affected runoff component. Additionally, the model captured an average 85 % reduction in soil evapotranspiration during the frozen period relative to the baseline model, with the largest difference observed in May (∼30 mm), attributed to restricted moisture movement in frozen soils and the insulating effects of snow cover.
By comparing multiple model configurations, this study provides valuable insights into the role of cold-region processes in shaping water balance components. The findings emphasize that the improved modeling framework not only enhances runoff simulation but also assesses the impact of snow and frozen soil on runoff generation and water resource availability. The developed snow and SFG components are designed to be flexible and adaptable, allowing seamless integration with hydrological models beyond GXAJ. A comparative analysis between the set of models investigated in this study and the (even) more complex physically-based models illustrates that the data limitation in the Yalong basin is likely to currently constrain the performance of physically-based models. This therefore suggests the need to expand observational efforts before expanding modeling efforts to further improve predictive capacity.
The code and data used in this paper are available from the first author's GitHub repository (https://doi.org/10.5281/zenodo.16560959 and https://github.com/NanWu16/, Wu, 2025) or by contacting the corresponding author (kzhang@hhu.edu.cn).
The supplement related to this article is available online at https://doi.org/10.5194/hess-29-3703-2025-supplement.
NW, KZ, and JJ conceived the idea and designed the research framework. ZN, XY, and WL carried out the data collection, preprocessing, and method determination. HW, HH, and QZ performed the data analysis, graphical visualization, and paper preparation. KZ, AN, and WG contributed to the paper refinement. All the authors have read and agreed to the published version of the paper.
The contact author has declared that none of the authors has any competing interests.
Publisher's note: Copernicus Publications remains neutral with regard to jurisdictional claims made in the text, published maps, institutional affiliations, or any other geographical representation in this paper. While Copernicus Publications makes every effort to include appropriate place names, the final responsibility lies with the authors.
This study was supported by the Fundamental Research Funds for National Key Research and Development Program of China (2023YFC3006500), the Science and technology project of China Southern Power Grid Yunnan Power Grid Co., Ltd (YNKJXM20222329), the Special Fund Project of Jiangsu Province Science and Technology Program (BZ2024035), the fund of the National Key Laboratory of Water Disaster Prevention (524015222), and the “Applied Scientific Research on the `Three-Line Defense' Strengthening Foundation Project for Rainfall and Water Monitoring & Forecasting in Shandong Province” (37000000025001720240235). The first author also received a grant from the China Scholarship Council to study at Lund University in Sweden. The authors thank the Ministry of Water Resources of China (http://www.mwr.gov.cn/, last access: 29 July 2025) for providing the natural and observed streamflow and the China Meteorological Administration (CMA) for providing the climatic data (http://data.cma.cn/, last access: 29 July 2025).
This study was supported by the National Key Research and Development Program of China (2023YFC3006500), the Special Fund Project of Jiangsu Province Science and Technology Program (BZ2024035), the Science and technology project of China Southern Power Grid Yunnan Power Grid Co., Ltd (YNKJXM20222329), the fund of National Key Laboratory of Water Disaster Prevention (524015222), and the project “Applied Scientific Research on the `Three-Line Defense' Strengthening Foundation Project for Rainfall and Water Monitoring & Forecasting in Shandong Province” (37000000025001720240235).
This paper was edited by Roberto Greco and reviewed by two anonymous referees.
Ahmed, N., Wang, G., Booij, M. J., Marhaento, H., Pordhan, F. A., Ali, S., Munir, S., and Hashmi, M. Z.-R.: Variations in hydrological variables using distributed hydrological model in permafrost environment, Ecol. Indic., 145, 109609, https://doi.org/10.1016/j.ecolind.2022.109609, 2022.
Ala-Aho, P., Autio, A., Bhattacharjee, J., Isokangas, E., Kujala, K., Marttila, H., Menberu, M., Merio, L.-J., Postila, H., Rauhala, A., Ronkanen, A.-K., Rossi, P. M., Saari, M., Haghighi, A. T., and Klove, B.: What conditions favor the influence of seasonally frozen ground on hydrological partitioning? A systematic review, Environ. Res. Lett., 16, 043008, https://doi.org/10.1088/1748-9326/abe82c, 2021.
Allen, R. G., Pereira, L. S., Raes, D., and Smith, M.: Crop evapotranspiration – Guidelines for computing crop water requirements – FAO Irrigation and drainage paper 56, Food and Agriculture Organization of the United Nations, Rome, ISBN 92-5-104219-5, 1998.
Anderson, E.: Calibration of conceptual hydrologic models for use in river forecasting, US National Weather Service, Silver Spring, https://www.weather.gov/media/owp/oh/hrl/docs/1_Anderson_CalbManual.pdf (last access: 29 July 2025), 2002.
Anderson, E. A.: National Weather Service river forecast system: Snow accumulation and ablation model, US Department of Commerce, National Oceanic and Atmospheric Administration, Silver Spring, https://repository.library.noaa.gov/view/noaa/13507/noaa_13507_DS1.pdf (last access: 29 July 2025), 1973.
Anderson, E. A.: Snow accumulation and ablation model – SNOW-17, US National Weather Service, Silver Spring, MD, 61 pp., https://www.weather.gov/media/owp/oh/hrl/docs/22snow17.pdf (last access: 11 August 2025), 2006.
Appels, W. M., Coles, A. E., and McDonnell, J. J.: Infiltration into frozen soil: From core-scale dynamics to hillslope-scale connectivity, Hydrol. Process., 32, 66–79, https://doi.org/10.1002/hyp.11399, 2018.
Arnold, J., Williams, J., and Maidment, D.: Continuous-Time Water and Sediment Routing Model for Large Basins, J. Hydraul. Eng.-ASCE, 121, 171–183, https://doi.org/10.1061/(ASCE)0733-9429(1995)121:2(171), 1995.
Beven, K. J. and Kirkby, M. J.: A physically based, variable contributing area model of basin hydrology, Hydrolog. Sci. J., 24, 43–69, https://doi.org/10.1080/02626667909491834, 1979.
Biskaborn, B. K., Smith, S. L., Noetzli, J., Matthes, H., Vieira, G., Streletskiy, D. A., Schoeneich, P., Romanovsky, V. E., Lewkowicz, A. G., Abramov, A., Allard, M., Boike, J., Cable, W. L., Christiansen, H. H., Delaloye, R., Diekmann, B., Drozdov, D., Etzelmueller, B., Grosse, G., Guglielmin, M., Ingeman-Nielsen, T., Isaksen, K., Ishikawa, M., Johansson, M., Johannsson, H., Joo, A., Kaverin, D., Kholodov, A., Konstantinov, P., Kroeger, T., Lambiel, C., Lanckman, J.-P., Luo, D., Malkova, G., Meiklejohn, I., Moskalenko, N., Oliva, M., Phillips, M., Ramos, M., Sannel, A. B. K., Sergeev, D., Seybold, C., Skryabin, P., Vasiliev, A., Wu, Q., Yoshikawa, K., Zheleznyak, M., and Lantuit, H.: Permafrost is warming at a global scale, Nat. Commun., 10, 264, https://doi.org/10.1038/s41467-018-08240-4, 2019.
Chen, X., Zhang, K., Luo, Y., Zhang, Q., Zhou, J., Fan, Y., Huang, P., Yao, C., Chao, L., and Bao, H.: A distributed hydrological model for semi-humid watersheds with a thick unsaturated zone under strong anthropogenic impacts: A case study in Haihe River Basin, J. Hydrol., 623, 129765, https://doi.org/10.1016/j.jhydrol.2023.129765, 2023.
Covino, T.: Hydrologic connectivity as a framework for understanding biogeochemical flux through watersheds and along fluvial networks, Geomorphology, 277, 133–144, https://doi.org/10.1016/j.geomorph.2016.09.030, 2017.
Cuo, L., Zhang, Y., Bohn, T. J., Zhao, L., Li, J., Liu, Q., and Zhou, B.: Frozen soil degradation and its effects on surface hydrology in the northern Tibetan Plateau, J. Geophys. Res.-Atmos., 120, 8276–8298, https://doi.org/10.1002/2015JD023193, 2015.
Du, X., Silwal, G., and Faramarzi, M.: Investigating the impacts of glacier melt on stream temperature in a cold-region watershed: Coupling a glacier melt model with a hydrological model, J. Hydrol., 605, 127303, https://doi.org/10.1016/j.jhydrol.2021.127303, 2022.
Duan, Q., Sorooshian, S., and Gupta, V.: Effective and Efficient Global Optimization for Conceptual Rainfall-Runoff Models, Water Resour. Res., 28, 1015–1031, https://doi.org/10.1029/91WR02985, 1992.
Dunne, T. and Black, R.: Runoff Processes During Snowmelt, Water Resour. Res., 7, 1160–1172, https://doi.org/10.1029/WR007i005p01160, 1971.
Fischer, G., Nachtergaele, F., Prieler, S., van Velthuizen, H. T., Verelst, L., and Wiberg, D.: Global Agro-ecological Zones Assessment for Agriculture, IIASA and FAO, Laxenburg, Austria and Rome, Italy, ISBN 978-92-5-134426-2, 2008.
Ford, T. W. and Frauenfeld, O. W.: Surface-Atmosphere Moisture Interactions in the Frozen Ground Regions of Eurasia, Sci. Rep.-UK, 6, 19163, https://doi.org/10.1038/srep19163, 2016.
Fuss, C. B., Driscoll, C. T., Green, M. B., and Groffman, P. M.: Hydrologic flowpaths during snowmelt in forested headwater catchments under differing winter climatic and soil frost regimes, Hydrol. Process., 30, 4617–4632, https://doi.org/10.1002/hyp.10956, 2016.
Gao, B., Yang, D., Qin, Y., Wang, Y., Li, H., Zhang, Y., and Zhang, T.: Change in frozen soils and its effect on regional hydrology, upper Heihe basin, northeastern Qinghai–Tibetan Plateau, The Cryosphere, 12, 657–673, https://doi.org/10.5194/tc-12-657-2018, 2018.
Gao, H., Han, C., Chen, R., Feng, Z., Wang, K., Fenicia, F., and Savenije, H.: Frozen soil hydrological modeling for a mountainous catchment northeast of the Qinghai–Tibet Plateau, Hydrol. Earth Syst. Sci., 26, 4187–4208, https://doi.org/10.5194/hess-26-4187-2022, 2022.
Gao, H., Zhang, Z., Chen, H., Zhang, W., Xu, C., Yi, Y., Liu, J., and Xiao, Z.: Impacts of seasonally frozen soil hydrothermal dynamics on the watershed hydrological processes inferred from a spatially distributed numerical modelling approach, J. Hydrol., 624, 129947, https://doi.org/10.1016/j.jhydrol.2023.129947, 2023.
Ge, S., McKenzie, J., Voss, C., and Wu, Q.: Exchange of groundwater and surface-water mediated by permafrost response to seasonal and long term air temperature variation, Geophys. Res. Lett., 38, L14402, https://doi.org/10.1029/2011GL047911, 2011.
Gisnås, K., Westermann, S., Schuler, T. V., Melvold, K., and Etzelmüller, B.: Small-scale variation of snow in a regional permafrost model, The Cryosphere, 10, 1201–1215, https://doi.org/10.5194/tc-10-1201-2016, 2016.
Goncharova, O. Y., Matyshak, G. V., Epstein, H. E., Sefilian, A. R., and Bobrik, A. A.: Influence of snow cover on soil temperatures: Meso- and micro-scale topographic effects (a case study from the northern West Siberia discontinuous permafrost zone), Catena, 183, 104224, https://doi.org/10.1016/j.catena.2019.104224, 2019.
Groffman, P. M., Driscoll, C. T., Fahey, T. J., Hardy, J. P., Fitzhugh, R. D., and Tierney, G. L.: Colder soils in a warmer world: A snow manipulation study in a northern hardwood forest ecosystem, Biogeochemistry, 56, 135–150, https://doi.org/10.1023/A:1013039830323, 2001.
Guo, L., Huang, K., Wang, G., and Lin, S.: Development and evaluation of temperature-induced variable source area runoff generation model, J. Hydrol., 610, 127894, https://doi.org/10.1016/j.jhydrol.2022.127894, 2022.
Halim, M. A. and Thomas, S. C.: A proxy-year analysis shows reduced soil temperatures with climate warming in boreal forest, Sci. Rep.-UK, 8, 16859, https://doi.org/10.1038/s41598-018-35213-w, 2018.
Hardy, J. P., Groffman, P. M., Fitzhugh, R. D., Henry, K. S., Welman, A. T., Demers, J. D., Fahey, T. J., Driscoll, C. T., Tierney, G. L., and Nolan, S.: Snow depth manipulation and its influence on soil frost and water dynamics in a northern hardwood forest, Biogeochemistry, 56, 151–174, https://doi.org/10.1023/A:1013036803050, 2001.
He, M., Hogue, T. S., Franz, K. J., Margulis, S. A., and Vrugt, J. A.: Characterizing parameter sensitivity and uncertainty for a snow model across hydroclimatic regimes, Adv. Water Resour., 34, 114–127, https://doi.org/10.1016/j.advwatres.2010.10.002, 2011.
Hill, A. F., Williams, M. W., and Chowanski, K.: Controls on snowmelt partitioning to surface and groundwater flow, in: Proceedings of the AGU Fall Meeting 2015, 14–18 December 2015, San Francisco, California, USA, Abstract C23A-0762, https://agu.confex.com/agu/fm15/webprogram/Paper59175.html (last access: 29 July 2025), 2015.
Hinzman, L., Kane, D., Gieck, R., and Everett, K.: Hydrologic and Thermal-Properties of the Active Layer in the Alaskan Arctic, Cold Reg. Sci. Technol., 19, 95–110, https://doi.org/10.1016/0165-232X(91)90001-W, 1991.
Huelsmann, L., Geyer, T., Schweitzer, C., Priess, J., and Karthe, D.: The effect of subarctic conditions on water resources: initial results and limitations of the SWAT model applied to the Kharaa River Basin in Northern Mongolia, Environ. Earth Sci., 73, 581–592, https://doi.org/10.1007/s12665-014-3173-1, 2015.
Immerzeel, W. W., van Beek, L. P. H., and Bierkens, M. F. P.: Climate Change Will Affect the Asian Water Towers, Science, 328, 1382–1385, https://doi.org/10.1126/science.1183188, 2010.
IPCC: Climate Change 2021 – The Physical Science Basis: Working Group I Contribution to the Sixth Assessment Report of the Intergovernmental Panel on Climate Change, Cambridge University Press, Cambridge, https://doi.org/10.1017/9781009157896, 2021.
Ireson, A. M., van der Kamp, G., Ferguson, G., Nachshon, U., and Wheater, H. S.: Hydrogeological processes in seasonally frozen northern latitudes: understanding, gaps and challenges, Hydrogeol. J., 21, 53–66, https://doi.org/10.1007/s10040-012-0916-5, 2013.
Iwata, Y., Yanai, Y., Yazaki, T., and Hirota, T.: Effects of a snow-compaction treatment on soil freezing, snowmelt runoff, and soil nitrate movement: A field-scale paired-plot experiment, J. Hydrol., 567, 280–289, https://doi.org/10.1016/j.jhydrol.2018.10.016, 2018.
Jafarov, E. E., Coon, E. T., Harp, D. R., Wilson, C. J., Painter, S. L., Atchley, A. L., and Romanovsky, V. E.: Modeling the role of preferential snow accumulation in through talik development and hillslope groundwater flow in a transitional permafrost landscape, Environ. Res. Lett., 13, 105006, https://doi.org/10.1088/1748-9326/aadd30, 2018.
Kalantari, Z., Lyon, S. W., Jansson, P.-E., Stolte, J., French, H. K., Folkeson, L., and Sassner, M.: Modeller subjectivity and calibration impacts on hydrological model applications: An event-based comparison for a road-adjacent catchment in south-east Norway, Sci. Total Environ., 502, 315–329, https://doi.org/10.1016/j.scitotenv.2014.09.030, 2015.
Krysanova, V., Bronstert, A., and Muller-Wohlfeil, D. I.: Modelling river discharge for large drainage basins: from lumped to distributed approach, Hydrolog. Sci. J., 44, 313–331, https://doi.org/10.1080/02626669909492224, 1999.
Kurylyk, B. L.: Discussion of “A Simple Thaw-Freeze Algorithm for a Multi-Layered Soil using the Stefan Equation” by Xie and Gough (2013), Permafrost Periglac., 26, 200–206, https://doi.org/10.1002/ppp.1834, 2015.
Lazo, P. X., Mosquera, G. M., McDonnell, J. J., and Crespo, P.: The role of vegetation, soils, and precipitation on water storage and hydrological services in Andean Paramo catchments, J. Hydrol., 572, 805–819, https://doi.org/10.1016/j.jhydrol.2019.03.050, 2019.
Li, C., Su, F., Yang, D., Tong, K., Meng, F., and Kan, B.: Spatiotemporal variation of snow cover over the Tibetan Plateau based on MODIS snow product, 2001–2014, Int. J. Climatol., 38, 708–728, https://doi.org/10.1002/joc.5204, 2018a.
Li, X., Zhang, K., Niu, J., and Liu, L.: A machine learning-based dynamic ensemble selection algorithm for microwave retrieval of surface soil freeze/thaw: A case study across China, GISci. Remote Sens., 59, 1550–1569, https://doi.org/10.1080/15481603.2022.2122117, 2022.
Li, Z., Dong, Z., Liang, Z., and Yang, T.: Flood forecast and flood management of large watersheds, Water Power, 30, 12–15, 2004.
Li, Z., Xu, Z., and Li, Z.: Performance of WASMOD and SWAT on hydrological simulation in Yingluoxia watershed in northwest of China, Hydrol. Process., 25, 2001–2008, https://doi.org/10.1002/hyp.7944, 2011.
Li, Z., Yu, J., Xu, X., Sun, W., Pang, B., and Yue, J.: Multi-model ensemble hydrological simulation using a BP Neural Network for the upper Yalongjiang River Basin, China, Proc. IAHS, 379, 335–341, https://doi.org/10.5194/piahs-379-335-2018, 2018b.
Liang, X., Wood, E. F., and Lettenmaier, D. P.: Surface soil moisture parameterization of the VIC-2L model: Evaluation and modification, Global Planet. Change, 13, 195–206, https://doi.org/10.1016/0921-8181(95)00046-1, 1996.
Maurer, G. E. and Bowling, D. R.: Seasonal snowpack characteristics influence soil temperature and water content at multiple scales in interior western US mountain ecosystems, Water Resour. Res., 50, 5216–5234, https://doi.org/10.1002/2013WR014452, 2014.
New, M., Hulme, M., and Jones, P.: Representing twentieth-century space-time climate variability. Part II: Development of 1901–96 monthly grids of terrestrial surface climate, J. Climate, 13, 2217–2238, https://doi.org/10.1175/1520-0442(2000)013<2217:RTCSTC>2.0.CO;2, 2000.
Peng, X., Zhang, T., Frauenfeld, O. W., Wang, K., Cao, B., Zhong, X., Su, H., and Mu, C.: Response of seasonal soil freeze depth to climate change across China, The Cryosphere, 11, 1059–1073, https://doi.org/10.5194/tc-11-1059-2017, 2017.
Pomeroy, J. W., Gray, D. M., Brown, T., Hedstrom, N. R., Quinton, W. L., Granger, R. J., and Carey, S. K.: The cold regions hydrological process representation and model: a platform for basing model structure on physical evidence, Hydrol. Process., 21, 2650–2667, https://doi.org/10.1002/hyp.6787, 2007.
Potapov, P., Hansen, M. C., Pickens, A., Hernandez-Serna, A., Tyukavina, A., Turubanova, S., Zalles, V., Li, X., Khan, A., Stolle, F., Harris, N., Song, X.-P., Baggett, A., Kommareddy, I., and Kommareddy, A.: The Global 2000–2020 Land Cover and Land Use Change Dataset Derived from the Landsat Archive: First Results, Front. Remote Sens., 3, 856903, https://doi.org/10.3389/frsen.2022.856903, 2022.
Qi, J., Li, S., Li, Q., Xing, Z., Bourque, C. P.-A., and Meng, F.-R.: A new soil-temperature module for SWAT application in regions with seasonal snow cover, J. Hydrol., 538, 863–877, https://doi.org/10.1016/j.jhydrol.2016.05.003, 2016.
Qi, J., Wang, L., Zhou, J., Song, L., Li, X., and Zeng, T.: Coupled Snow and Frozen Ground Physics Improves Cold Region Hydrological Simulations: An Evaluation at the upper Yangtze River Basin (Tibetan Plateau), J. Geophys. Res.-Atmos., 124, 12985–13004, https://doi.org/10.1029/2019JD031622, 2019.
Qin, Y., Yang, D., Gao, B., Wang, T., Chen, J., Chen, Y., Wang, Y., and Zheng, G.: Impacts of climate warming on the frozen ground and eco-hydrology in the Yellow River source region, China, Sci. Total Environ., 605, 830–841, https://doi.org/10.1016/j.scitotenv.2017.06.188, 2017.
Ran, Y., Li, X., Cheng, G., Zhang, T., Wu, Q., Jin, H., and Jin, R.: Distribution of Permafrost in China: An Overview of Existing Permafrost Maps, Permafrost Periglac., 23, 322–333, https://doi.org/10.1002/ppp.1756, 2012.
Ran, Y., Li, X., Cheng, G., Che, J., Aalto, J., Karjalainen, O., Hjort, J., Luoto, M., Jin, H., Obu, J., Hori, M., Yu, Q., and Chang, X.: New high-resolution estimates of the permafrost thermal state and hydrothermal conditions over the Northern Hemisphere, Earth Syst. Sci. Data, 14, 865–884, https://doi.org/10.5194/essd-14-865-2022, 2022.
Rush, M. J. and Rajaram, H.: Influence of Snowpack Cold Content on Seasonally Frozen Ground and Its Hydrologic Consequences: A Case Study From Niwot Ridge, CO, Water Resour. Res., 58, e2021WR031911, https://doi.org/10.1029/2021WR031911, 2022.
Shiklomanov, N. I.: Non-climatic factors and long-term, continental-scale changes in seasonally frozen ground, Environ. Res. Lett., 7, 011003, https://doi.org/10.1088/1748-9326/7/1/011003, 2012.
Song, L., Wang, L., Zhou, J., Luo, D., and Li, X.: Divergent runoff impacts of permafrost and seasonally frozen ground at a large river basin of Tibetan Plateau during 1960–2019, Environ. Res. Lett., 17, 124038, https://doi.org/10.1088/1748-9326/aca4eb, 2022.
Stephens, D. B.: Vadose Zone Hydrology, CRC Press, Boca Raton, Florida, ISBN 9780203734490, 1996.
Streletskiy, D. A., Tananaev, N. I., Opel, T., Shiklomanov, N. I., Nyland, K. E., Streletskaya, I. D., Tokarev, I., and Shiklomanov, A. I.: Permafrost hydrology in changing climatic conditions: seasonal variability of stable isotope composition in rivers in discontinuous permafrost, Environ. Res. Lett., 10, 095003, https://doi.org/10.1088/1748-9326/10/9/095003, 2015.
Thomas, H. R., Cleall, P., Li, Y.-C., Harris, C., and Kern-Luetschg, M.: Modelling of cryogenic processes in permafrost and seasonally frozen soils, Geotechnique, 59, 173–184, https://doi.org/10.1680/geot.2009.59.3.173, 2009.
United States Department of Agriculture: Soil Survey Manual, Agriculture Handbook No. 18, University Press of the Pacific, Honolulu, Hawaii, USA, ISBN 9781410204172, 2003.
Venäläinen, A., Tuomenvirta, H., Heikinheimo, M., Kellomäki, S., Peltola, H., Strandman, H., and Väisänen, H.: Impact of climate change on soil frost under snow cover in a forested landscape, Clim. Res., 17, 63–72, https://doi.org/10.3354/cr017063, 2001.
Walvoord, M. A., Voss, C. I., and Wellman, T. P.: Influence of permafrost distribution on groundwater flow in the context of climate-driven permafrost thaw: Example from Yukon Flats Basin, Alaska, United States, Water Resour. Res., 48, W07524, https://doi.org/10.1029/2011WR011595, 2012.
Walvoord, M. A., Voss, C. I., Ebel, B. A., and Minsley, B. J.: Development of perennial thaw zones in boreal hillslopes enhances potential mobilization of permafrost carbon, Environ. Res. Lett., 14, 015003, https://doi.org/10.1088/1748-9326/aaf0cc, 2019.
Wang, G., Mao, T., Chang, J., Song, C., and Huang, K.: Processes of runoff generation operating during the spring and autumn seasons in a permafrost catchment on semi-arid plateaus, J. Hydrol., 550, 307–317, https://doi.org/10.1016/j.jhydrol.2017.05.020, 2017.
Wang, L., Koike, T., Yang, K., Jackson, T. J., Bindlish, R., and Yang, D.: Development of a distributed biosphere hydrological model and its evaluation with the Southern Great Plains Experiments (SGP97 and SGP99), J. Geophys. Res.-Atmos., 114, D08107, https://doi.org/10.1029/2008JD010800, 2009.
Wang, T., Yang, D., Fang, B., Yang, W., Qin, Y., and Wang, Y.: Data-driven mapping of the spatial distribution and potential changes of frozen ground over the Tibetan Plateau, Sci. Total Environ., 649, 515–525, https://doi.org/10.1016/j.scitotenv.2018.08.369, 2019.
Wang, X. and Chen, R.: Influence of snow cover on soil freeze depth across China, Geoderma, 428, 116195, https://doi.org/10.1016/j.geoderma.2022.116195, 2022.
Wang, Y., Yu, D., and Zhou, Z.: Review of research progress and modeling of hydrological processes in the cold regions of the Qinghai-Xizang Plateau, Journal of Glaciology and Geocryology, 46, 1312–1328, 2024.
Wu, N.: NanWu16/Hydrological-Modeling_matlab: Hydrological-Modeling (v1.0.0), Zenodo [code and data set], https://doi.org/10.5281/zenodo.16560960, 2025 (code and data set also available at: https://github.com/NanWu16/, last access: 29 July 2025).
Wu, N., Zhang, K., Chao, L., Ning, Z., Wang, S., and Jarsjö, J.: Snow cover expansion with contrasting depth thinning in the recent 40 years: Evidence from the Yalong River Basin, South-eastern Tibetan Plateau, J. Hydrol.-Reg. Stud., 53, 101786, https://doi.org/10.1016/j.ejrh.2024.101786, 2024.
Xie, C. and Gough, W. A.: A Simple Thaw-Freeze Algorithm for a Multi-Layered Soil using the Stefan Equation, Permafrost Periglac., 24, 252–260, https://doi.org/10.1002/ppp.1770, 2013.
Yan, D., Ma, N., and Zhang, Y.: Development of a fine-resolution snow depth product based on the snow cover probability for the Tibetan Plateau: Validation and spatial-temporal analyses, J. Hydrol., 604, 127027, https://doi.org/10.1016/j.jhydrol.2021.127027, 2022.
Yang, D., Gao, B., Jiao, Y., Lei, H., Zhang, Y., Yang, H., and Cong, Z.: A distributed scheme developed for eco-hydrological modeling in the upper Heihe River, Sci. China Earth Sci., 58, 36–45, https://doi.org/10.1007/s11430-014-5029-7, 2015.
Yao, C., Li, Z., Bao, H., and Yu, Z.: Application of a Developed Grid-Xinanjiang Model to Chinese Watersheds for Flood Forecasting Purpose, J. Hydrol. Eng., 14, 923–934, https://doi.org/10.1061/(ASCE)HE.1943-5584.0000067, 2009.
Yao, C., Li, Z., Yu, Z., and Zhang, K.: A priori parameter estimates for a distributed, grid-based Xinanjiang model using geographically based information, J. Hydrol., 468–469, 47–62, https://doi.org/10.1016/j.jhydrol.2012.08.025, 2012.
Yao, C., Zhang, K., Yu, Z., Li, Z., and Li, Q.: Improving the flood prediction capability of the Xinanjiang model in ungauged nested catchments by coupling it with the geomorphologic instantaneous unit hydrograph, J. Hydrol., 517, 1035–1048, https://doi.org/10.1016/j.jhydrol.2014.06.037, 2014.
Yao, T., Bolch, T., Chen, D., Gao, J., Immerzeel, W., Piao, S., Su, F., Thompson, L., Wada, Y., Wang, L., Wang, T., Wu, G., Xu, B., Yang, W., Zhang, G., and Zhao, P.: The imbalance of the Asian water tower, Nat. Rev. Earth Environ., 3, 618–632, https://doi.org/10.1038/s43017-022-00299-4, 2022.
Yong, B., Zhang, J., and Wang, G.: Key scientific issues of hydrological forecast in the headwater area of Yellow River, Advances in Water Science, 34, 159–171, https://doi.org/10.14042/j.cnki.32.1309.2023.02.001, 2023.
Yu, L., Zeng, Y., Wen, J., and Su, Z.: Liquid-Vapor-Air Flow in the Frozen Soil, J. Geophys. Res.-Atmos., 123, 7393–7415, https://doi.org/10.1029/2018JD028502, 2018.
Zhang, T., Barry, R. G., Knowles, K., Ling, F., and Armstrong, R. L.: Distribution of seasonally and perennially frozen ground in the Northern Hemisphere, in: Permafrost, Vols. 1 and 2, 8th International Conference on Permafrost, 21–25 July 2003, Zurich, Switzerland, Web of Science ID: WOS:000185049300226, 1289–1294, 2003.
Zhang, Y., Cheng, G., Li, X., Jin, H., Yang, D., Flerchinger, G. N., Chang, X., Bense, V. F., Han, X., and Liang, J.: Influences of Frozen Ground and Climate Change on Hydrological Processes in an Alpine Watershed: A Case Study in the Upstream Area of the Hei'he River, Northwest China, Permafrost Periglac., 28, 420–432, https://doi.org/10.1002/ppp.1928, 2017.
Zhao, R.: Hydrological simulation of watersheds, China Water Power Press, Beijing, 1984.
Zhou, G., Cui, M., Wan, J., and Zhang, S.: A Review on Snowmelt Models: Progress and Prospect, Sustainability-Basel, 13, 11485, https://doi.org/10.3390/su132011485, 2021.
Zou, D., Zhao, L., Wu, T., Wu, X., Pang, Q., and Wang, Z.: Modeling ground surface temperature by means of remote sensing data in high-altitude areas: test in the central Tibetan Plateau with application of moderate-resolution imaging spectroradiometer Terra/Aqua land surface temperature and ground-based infrared radiometer, J. Appl. Remote Sens., 8, 083516, https://doi.org/10.1117/1.JRS.8.083516, 2014.