the Creative Commons Attribution 4.0 License.
the Creative Commons Attribution 4.0 License.
 | 05 Aug 2025
Comparison of BARRA and ERA5 in replicating mean and extreme precipitation over Australia
Kevin K. W. Cheung
Fei Ji
Nidhi Nishant
Jin Teng
James Bennett
De Li Liu
Reanalysis datasets are critical in climate research and weather analysis, offering consistent historical weather and climate data crucial for understanding atmospheric phenomena and validating climate models. However, biases exist in reanalysis datasets that would affect their applications under circumstances. This study evaluates BARRA, which is a high-resolution reanalysis for the Australian region, and ERA5 in simulating mean precipitation and six selected precipitation extremes for their climatology, temporal correlation, coefficient of variation, and trend. Both datasets reproduce daily timescale probability density distributions and spatial patterns of mean precipitation well with minor biases. ERA5 shows stronger temporal correlations, superior inter-annual precipitation accuracy, and lower biases in coefficient of variation compared to BARRA, especially in Northern Australia. However, both models exhibit substantial biases in trend, underestimating increasing trends in Northern Australia. ERA5 underestimates dry days and heavy rainfall, while BARRA tends to overestimate these extremes. Temporal correlations for extreme precipitation indices are weaker compared to mean annual precipitation. Notable differences exist in variability biases, with BARRA showing larger biases, especially for heavy precipitation in inland regions and Northern Australia. While both datasets replicate the main trends, biases persist. Overall, the evaluation results support application of both datasets for climatology analyses, but caution is advised for variability and trend analyses, particularly for specific extremes.
- Article
(13473 KB) - Full-text XML
-
Supplement
(15868 KB) - BibTeX
- EndNote


A reanalysis dataset is created by combining historical observational data from various sources, such as weather stations, satellites, buoys, and more, with modern data assimilation techniques and numerical models (Kalnay et al., 1996; Saha et al., 2010; Dee et al., 2011; Kobayashi et al., 2015; Poli et al., 2016; Hersbach et al., 2020). The fundamental aim of reanalysis is to construct a uniform and coherent historical archive of various atmospheric and environmental parameters, such as temperature, humidity, and wind patterns, on either a regional or a global scale.
These datasets are invaluable for climate studies, weather analysis, and model validation as they provide a uniform representation of historical climate conditions. For instance, Quagraine et al. (2020) used five global reanalysis datasets (European Centre for Medium-Range Weather Forecasts Reanalysis ERA-Interim, Dee et al., 2011; ERA5, Hersbach et al., 2020; JRA-55, Kobayashi et al., 2015); MERRA2 (Gelaro et al., 2017); and NCEP-R2 (Kanamitsu et al., 2002) to investigate the variability of West African summer monsoon precipitation, showing all datasets could represent the average rainfall patterns and seasonal cycle. Dai et al. (2023) utilized ERA5 data to estimate rainfall erosivity on the Chinese Loess Plateau, finding rainfall erosivity derived from ERA5 was highly consistent with those derived from the meteorological stations. Cheung et al. (2023) employed ERA5 to evaluate storm conditions in regional climate simulations, demonstrating that regional climate models can capture climatology of measurements of storm severity over land, including their spatial patterns and seasonality. Numerous studies have used reanalysis datasets as inputs for regional climate models (RCMs) to evaluate the models' capability in replicating observed climatic patterns (Solman et al., 2013; Ji et al., 2016; Fita et al., 2017; Di Virgilio et al., 2019; Capecchi et al., 2023; Di Virgilio et al., 2025; Ji et al., 2024).
While reanalysis datasets provide valuable insights into historical weather and climate conditions, they have limitations and uncertainties given that they are modelled outputs rather than direct observations. Many studies have evaluated reanalysis data across various variables and regions. For instance, Betts et al. (2019) assessed ERA5 biases in near-surface variables over Canada, highlighting its improved performance over ERA-Interim (Dee et al., 2011), though precipitation biases remained significant. Similarly, Hu and Yuan (2021) and Jiang et al. (2021) found that ERA5 precipitation accurately captured rainfall pattern over the Eastern Tibetan Plateau and mainland China, but underestimated intensity. Izadi et al. (2021) found ERA5 performed better at monthly and seasonal timescales in Iran, underestimating coastal summer precipitation and overestimating it in mountains. Jiao et al. (2021) and Qin et al. (2021) found ERA5 overestimated summer precipitation and frequency in China but underestimated intensity during the warm season. Lei et al. (2022) and Shen et al. (2022) noted ERA5's limitations in simulating extreme precipitation events in China, especially for high-end extremes.
Comparisons between reanalysis datasets have also been conducted. Wang et al. (2019) found that both ERA5 and ERA-Interim exhibited warm biases over Arctic Sea ice, with larger biases in cold season than warm season. Lei et al. (2020) showed ERA5 improved cloud cover simulation over eastern China but not over the Tibetan Plateau, when compared to ERA-Interim. Gleixner et al. (2020) found ERA5 reduced biases in temperature and precipitation over East Africa compared to ERA-Interim but still struggled with long-term trends. Song and Wei (2021) found both ERA5 and MERRA-2 (Gelaro et al., 2017) captured night precipitation peaks over North China, but only ERA5 accurately reflected the afternoon peak. Li et al. (2022) concluded that ERA5 performed better than ERA-Interim, JRA55 (Kobayashi et al., 2015), and MERRA-2 in capturing precipitation over the Poyang Lake Basin. A summary of the above literature review can be found in Table S1 in the Supplement.
In Australia, reanalyses like NCEP (Kalnay et al., 1996), JRA-55 (Kobayashi et al., 2015), ERA-Interim (Dee et al., 2011), and ERA5 (Hersbach et al., 2020) are commonly used alongside the Australian Bureau of Meteorology's high-resolution (12 km) BARRA reanalysis. BARRA covers Australia, Aotearoa / New Zealand, and Southeast Asia (Su et al., 2019), while BARRA-C offers even higher-resolution (1.5 km) analysis for four capital cities (Su et al., 2021).
May et al. (2021) found BARRA reliable, though it showed seasonal and diurnal biases. Other studies, like Pirooz et al. (2021), compared BARRA with global reanalyses, concluding BARRA performed better for precipitation and temperature in Aotearoa / New Zealand but lagged behind ERA5 for high gust winds. Du et al. (2023) used BARRA for estimating daily precipitation in ungauged Australian catchments, while Hobeichi et al. (2023) employed BARRA to train statistical models for downscaling. Acharya et al. (2019, 2020) found BARRA's precipitation performance varied by region, with poorer results in tropical areas. Nishant et al. (2022) suggested higher resolution in BARRA-C did not always improve precipitation simulations, while Choudhury et al. (2023) noted ERA5 performed better for mean temperatures than extremes in Australia. These previous studies on BARRA and BARRA-C have also been summarized in Table S1.
However, there is a gap in the existing studies concerning the intercomparison of various reanalyses, such as BARRA and ERA5, specifically in relation to precipitation extremes over Australia. In this study, we aim to bridge this gap by evaluating and comparing the performance of BARRA and ERA5 in capturing precipitation extremes. While the traditional evaluation methods focusing on climatology (long-term mean), here we also include temporal correlation, coefficient of variation, and trend in evaluation to quantify their overall performance, which have not been examined before in previous studies. By assessing climate means and extremes and quantifying their biases, this study provides a valuable reference for selecting appropriate datasets for specific applications and cautions against treating reanalysis data as observations. The paper is organized as follows: Section 2 introduces the reanalysis datasets and observational data used for evaluation. Section 3 outlines the climate extreme indices and evaluation methodology. Results are presented in Sect. 4, followed by further discussion in Sect. 5. Finally, Sect. 6 offers a summary and conclusions.
2.1 ERA5
ERA5 is a global atmospheric reanalysis dataset developed by ECMWF (Hersbach et al., 2020). ERA5 provides hourly estimates of many atmospheric, land, and oceanic climate variables. The data is on a ∼30 km horizontal grid and resolves the atmosphere using 137 levels from the surface up to a height of 0.01 hPa (∼80 km).
ERA5 is constructed upon the foundation of the Integrated Forecasting System (IFS) Cy41r2. This allows ERA5 to benefit from a decade's worth of development in areas such as model physics, core dynamics, and data assimilation techniques. ERA5 is a significant advancement over its predecessors (e.g. ERA-Interim) due to its higher spatial and temporal resolution, improved assimilation techniques, and more sophisticated modelling components. It provides a detailed and accurate representation of various atmospheric variables, such as temperature, humidity, wind speed, pressure, and more. The dataset covers the entire globe and spans from 1940 to the present, making it valuable for various applications in climate research, meteorology, environmental science, and more.
2.2 BARRA
BARRA is a high-resolution regional atmospheric reanalysis dataset developed by the Australian Bureau of Meteorology, which is available from January 1990 to February 2019 (Su et al., 2019). BARRA was constructed based on the Australian Community Climate Earth-System Simulator (ACCESS) model with assimilation of a wide range of observational data to create a coherent and consistent representation of past weather and climate conditions. BARRA covers the Australian continent, Aotearoa / New Zealand, part of Asia, and some Pacific Islands with a horizontal resolution of 12 km and 70 vertical levels from the surface up to a height of 80 km. BARRA specifically focuses on providing detailed information about weather patterns and atmospheric variables over the Australian region, which provides about 100 parameters at hourly intervals.
The ACCESS model, which was applied to generate BARRA, originated from the UKMO's Unified Model (UM), which can be configured in global mode or regional mode. For regional simulations, the global version of ACCESS becomes ACCESS-R. ACCESS-R was initialized by ERA-Interim reanalysis data, which also provides boundary conditions during simulation. A series of observations have been assimilated into BARRA, including land and ship (buoy) synoptic observations, upper-air observations from radiosondes and wind profilers, and satellite derived radiances and winds (Su et al., 2019). However, no precipitation observations were directly assimilated.
2.3 AGCD
The observational data in the study are from the Australian Gridded Climate Dataset (AGCD, Evans et al., 2020). The daily gridded maximum and minimum temperatures and precipitation data has a spatial resolution of 0.05° (∼5 km) and is interpolated from observations at stations across the Australian continent. Most of those stations are in the more heavily populated coastal regions with far fewer stations inland and over high elevation areas. For example, there are very few station observations near the Gibson desert region in Western Australia, making the gridded observations unreliable over that region. Thus, in the following figures that region has been masked and not considered for evaluation. Since observations and reanalyses are not at the same spatial resolutions, we aggregated the observations to the native grid of ERA5 and BARRA respectively for comparison, including the performance of statistical significance tests. For the purpose of comparison, we also interpolated the reanalysis to AGCD grids using the conservative area-weighted re-gridding scheme from the Climate Data Operators (Schulzweida et al., 2006), which will be shown in the Supplement. The states and sub-regions in the Australian region we discuss in the following can be found in Fig. S1 in the Supplement.
3.1 ET-SCI
While extreme climate and weather events are generally multifaceted phenomena, in this study we evaluate climate extremes based on daily precipitation and temperature as defined by Expert Team on Sector-specific Climate Indices (ET-SCI; Herold and Alexander, 2016). We used the ClimPACT version 2 software to calculate the ET-SCI indices (https://climpact-sci.org/, last access: 30 July 2025), focussing on daily precipitation.
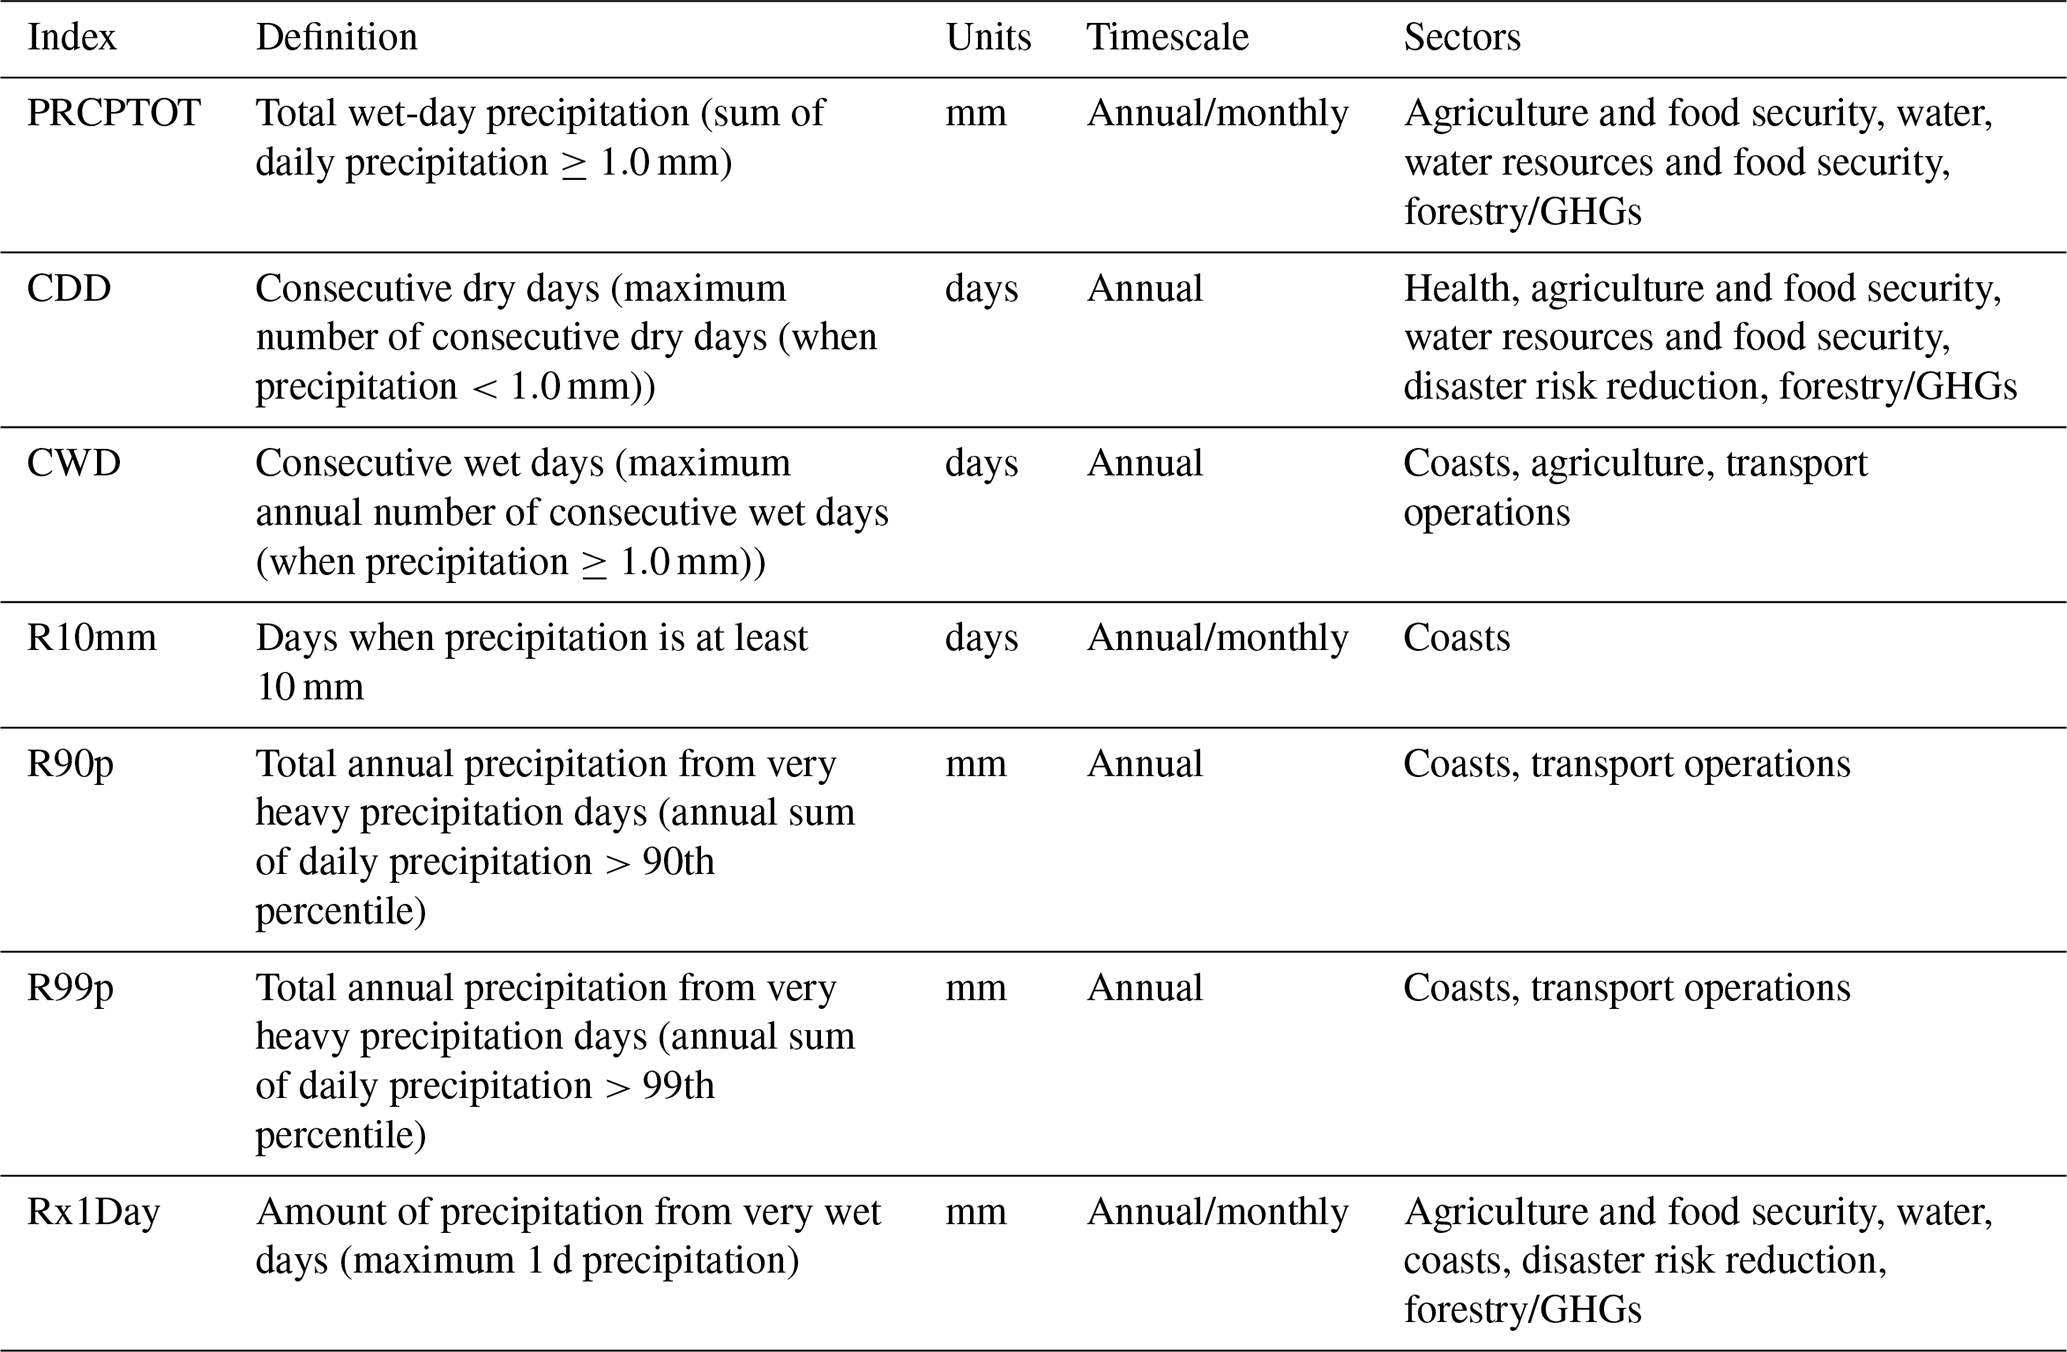
Although ClimPACT generates 14 precipitation-related core indices, we selected seven (Table 1) based on the following considerations: (1) to capture key aspects of climate extremes and (2) to capture extremes which have impacts on society and infrastructure such as agriculture, water resources, and economy (Tabari, 2020; Pei et al., 2021). Accordingly, we include absolute indices such as the maximum 1 d precipitation (Rx1day) and total precipitation (PRCPTOT), a threshold-based index (e.g. number of heavy rain days, R10mm), percentile indices (e.g. total annual precipitation from very heavy rain days, R99p), and duration indices such as the consecutive wet (CWD) and dry days (CDD).
With the above consideration, the seven aforementioned precipitation-related indices were calculated on native reanalysis grids and observation grids. While the availability of AGCD and ERA5 starts much earlier, the analysis period is 1990–2018, which is the duration of BARRA. Since the AGCD observations have the highest resolution, here we mainly show the evaluation on the native grids of the reanalyses (i.e. the 12 km grid of BARRA and 30 km grid of ERA5). The extreme indices calculated from reanalysis data have also been regridded to the 5 km resolution using bilinear interpolation, which are included in the supplementary information to demonstrate that our conclusions are insensitive to the choice of evaluation resolution.
3.2 Evaluation metrics
We evaluated BARRA and ERA5 for their performance in capturing daily precipitation probability density functions (PDFs), climatology (29 years in our case), coefficient of variation (CV), temporal correlation, and trends of seven selected precipitation extreme indices. Each PDF was evaluated using the skill score defined by Perkins et al. (2007), which quantifies the common area between two reanalyses and observations. For each grid, the maximum rainfall range between reanalysis and observation was divided into 200 bins to compute normalized histograms over the same range. The common area was determined by calculating the minimum of the pairwise frequencies, and the standardized overlap area was obtained by summing these minimum frequencies and multiplying by the bin width. The CV is a valuable statistical tool representing the ratio of the (yearly) standard deviation to the mean, allowing for the comparison of variation between different data series, even when their means differ significantly. Temporal correlations, which were computed at an annual time step, of climate extremes measure the similarities between simulations and observations in terms of their inter-annual variabilities, with larger temporal correlations indicating better performance. For trend analyses, we applied simple linear trend line fitting to the yearly time series of climate indices. All the above metrics are computed at each grid point in the datasets' native grids as well as the AGCD grid after re-gridding. Differences between BARRA/ERA5 and AGCD then form the bias maps. After averaging over all grid points, the domain averages will then be discussed in the following.
We used bias and domain-averaged absolute bias to quantify spatial differences between reanalyses and observations. Temporal correlation, coefficient of variation, and trend were used to quantify temporal similarities between reanalyses and observations. The non-parametric Mann–Kendall test was used to assess the statistical significance of differences and trends. Biases were assessed at an annual timescale for all extremes.
4.1 Mean climate
This section evaluates and compares the annual mean of daily precipitation between BARRA and ERA5 against AGCD over Australia.
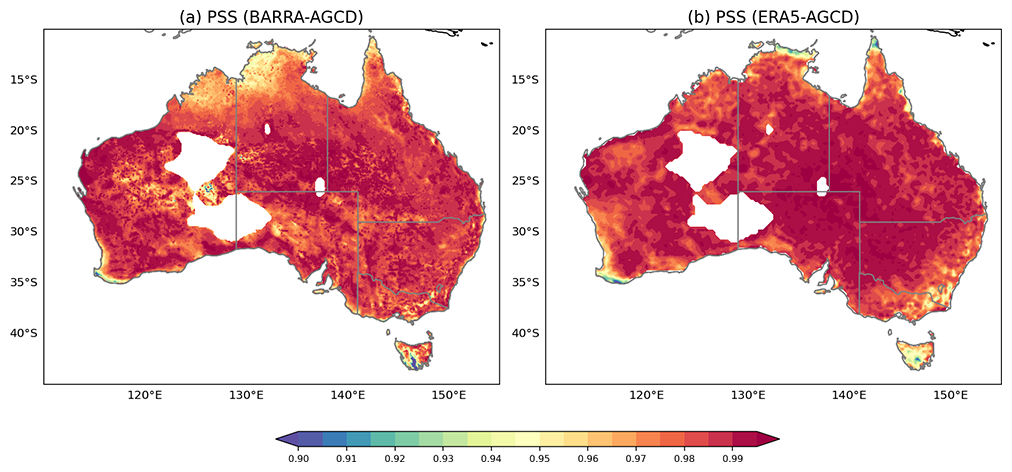
Figure 1Perkins skill score (PSS) of daily precipitation PDF between (a) BARRA and AGCD, and (b) ERA5 and AGCD. The regions with low density of station observations in AGCD has been masked and was not considered in all subsequent evaluation.
4.1.1 Daily precipitation PDF
We first compare the Perkins Score for daily precipitation between BARRA, ERA5, and AGCD (Fig. 1). Both reanalyses generally capture the daily precipitation PDF well, with Perkins Scores exceeding 0.9 across most of Australia, indicating a strong agreement with observations. However, there are regional variations in performance. Scores are relatively lower in northern Australia and Tasmania, suggesting greater discrepancies in these areas. ERA5 exhibits noticeably higher scores inland compared to coastal regions, reflecting its improved representation of precipitation in interior regions. In contrast, BARRA does not show a clear spatial pattern, with more variability across different locations. Overall, ERA5 outperforms BARRA, particularly in inland areas, likely due to its global data assimilation approach. However, BARRA shows better agreement in the southeastern coastal regions, indicating its advantage in capturing local precipitation patterns influenced by complex terrain and coastal effects.
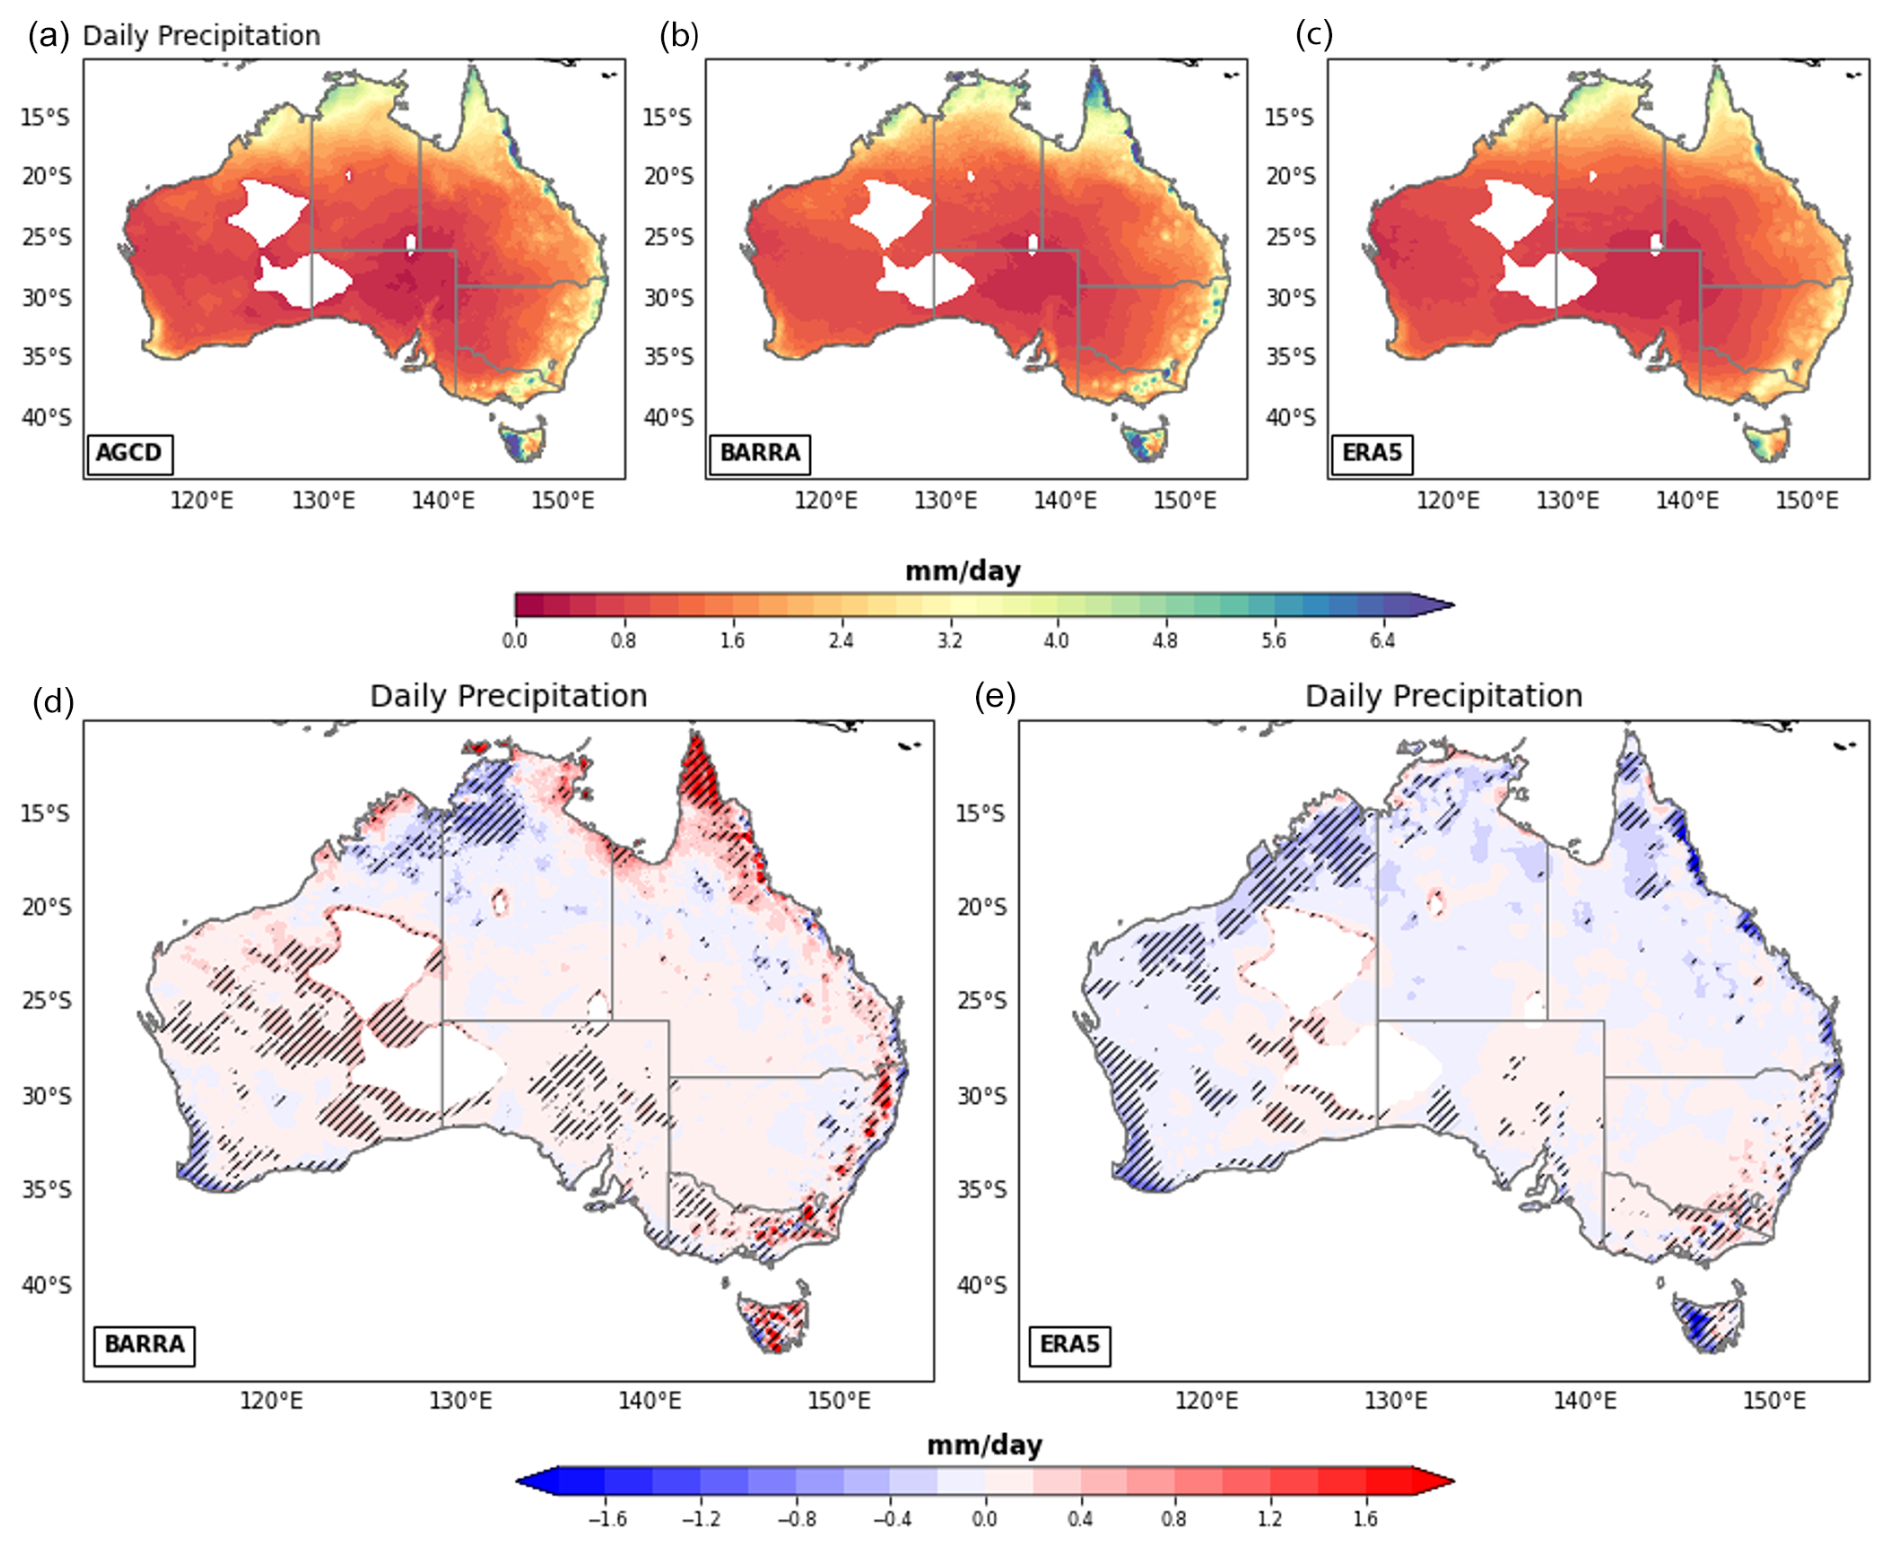
Figure 2Annual mean precipitation of AGCD, BARRA, and ERA5 (a–c) and annual mean biases between BARRA/ERA5 and AGCD (d–e). The regions with low density of station observations in AGCD has been masked and was not considered in all subsequent evaluations. Unit: mm d−1. Stippling indicates areas with biases that are statistically significant at 95 % confidence level.
4.1.2 Bias and temporal correlation
We evaluate precipitation simulated by BARRA and ERA5 against observations (AGCD). The mean annual precipitation from the three datasets and biases in BARRA and ERA5 compared to AGCD are shown in Fig. 2 (and Fig. S2 on the observation grid). Results show that both BARRA and ERA5 simulate the spatial patterns of mean annual precipitation very well with high rainfall in northern Australian, eastern Australia coast, and western Tasmania and low rainfall inland, albeit with clear biases. Compared to AGCD, both BARRA and ERA5 underestimate precipitation up to 20 % for Eastern Australian coast, southwest western Australia, and western Tasmania, but overestimate annual precipitation up to 30 % inland (Fig. S3). Some clear differences in biases between BARRA and ERA5 can be observed in central western Australia and northern Queensland where BARRA overestimate precipitation but ERA5 underestimate it. Domain averaged absolute bias in annual precipitation is about 0.17 mm d−1 (∼12.7 % relative bias with respect to domain average) for BARRA and 0.15 mm d−1 (∼10.5 % relative bias) for ERA5 (Table 2).
Table 2Domain-averaged absolute biases and temporal correlation between BARRA/ERA5 and AGCD for annual precipitation and precipitation extremes.
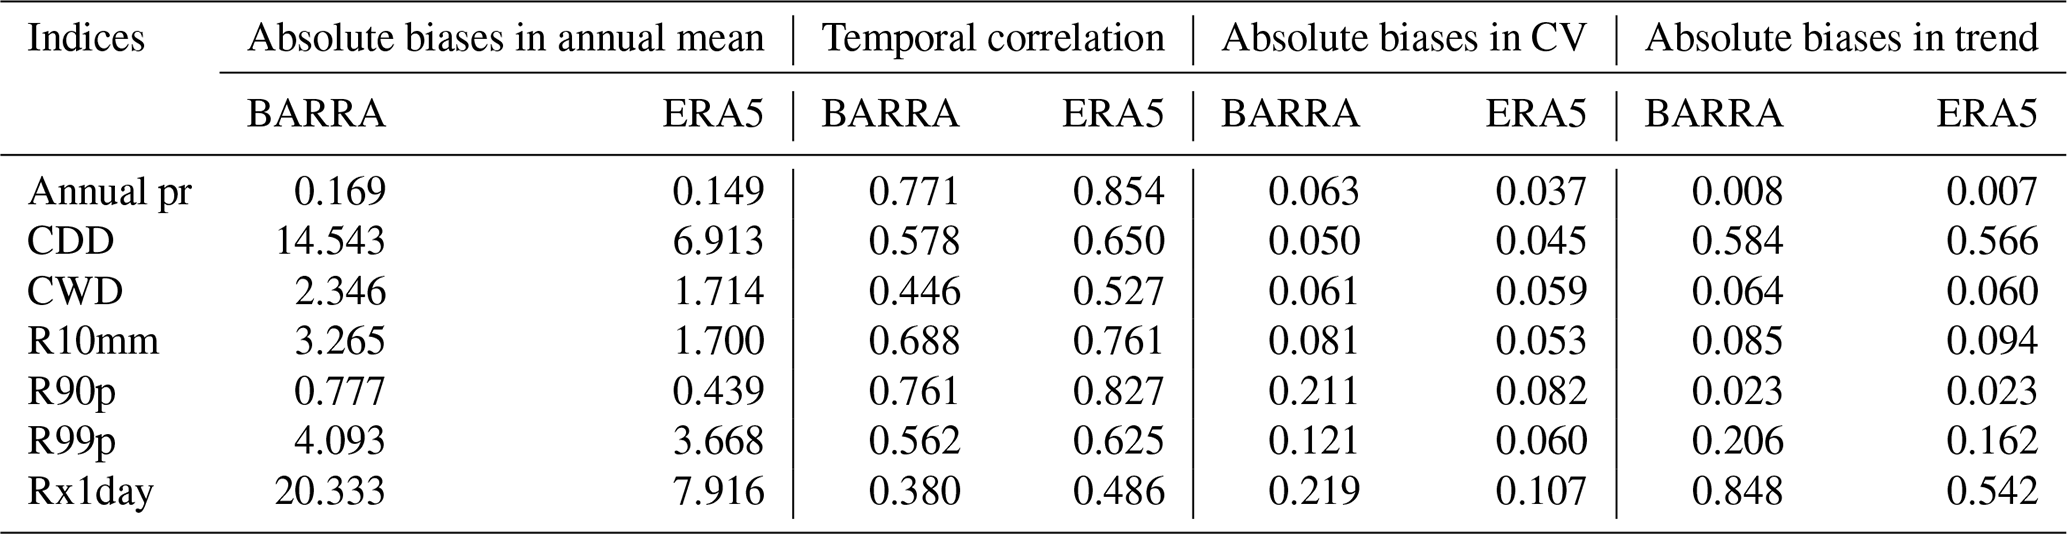
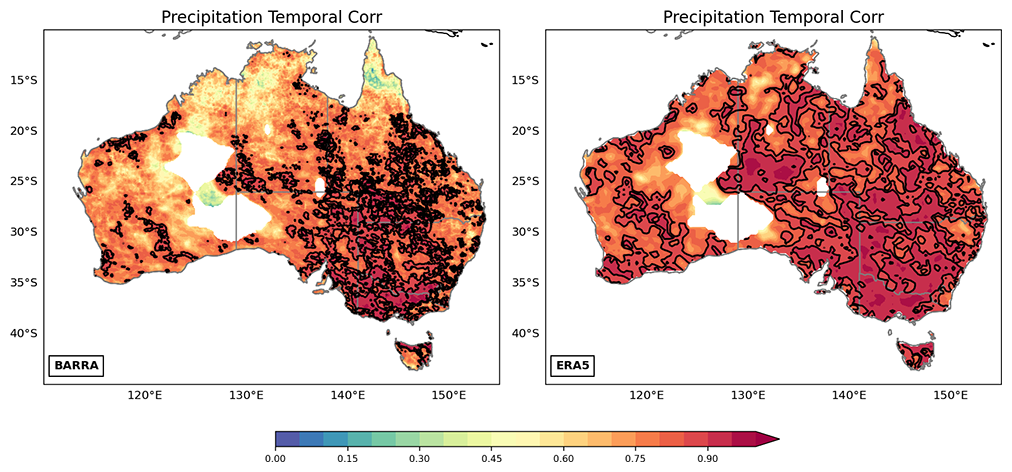
Figure 3Temporal correlation coefficient of annual precipitation between BARRA/ERA5 and AGCD. A black contour at value 0.85 has been added for reference.
The skill of simulated precipitation from BARRA and ERA5 is further demonstrated in the temporal correlations between BARRA/ERA5 and AGCD shown in Fig. 3 (and Fig. S4 on the observation grid). Temporal correlation of annual precipitation is larger in southeast Australia and northern Tasmania for both BARRA and ERA5, which is above 0.85. This indicates inter-annual variability of precipitation is well captured by BARRA and ERA5. In contrast, temporal correlation is weaker for western inland and northern Australia. ERA5 generally has larger temporal correlation when compared with BARRA, especially for northern Australia, where temporal correlation for BARRA is below 0.5. On average, temporal correlation for ERA5 is 0.85, which is larger than 0.77 for BARRA (Table 2).
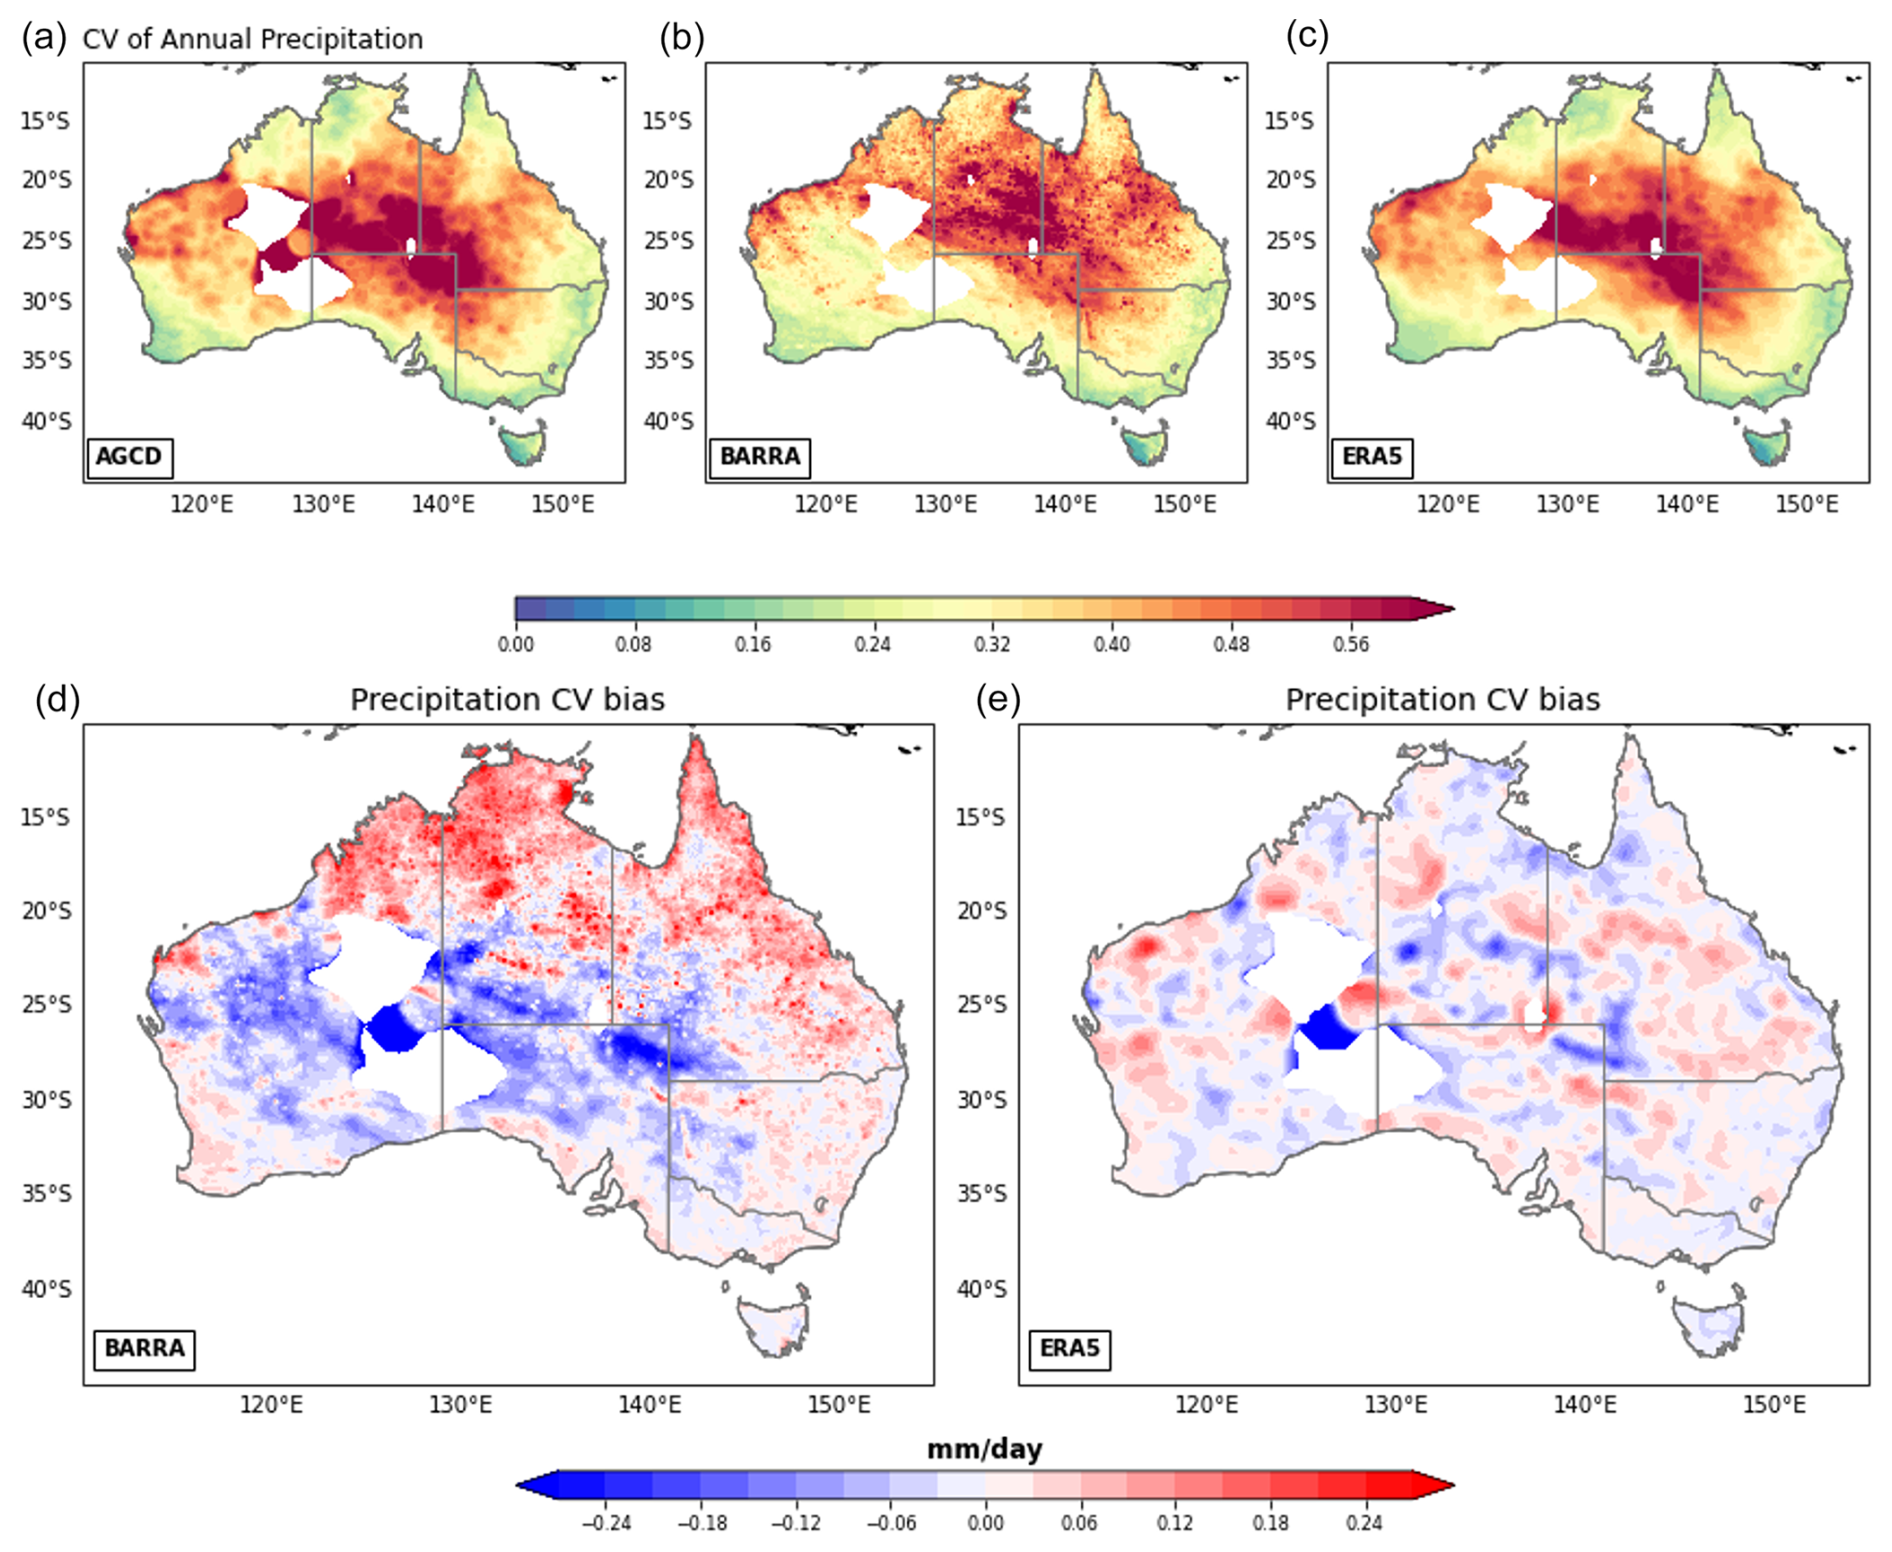
Figure 4CV of annual precipitation for AGCD, BARRA, and ERA5 (a–c) and biases in CV between BARRA/ERA5 and AGCD (d–e).
4.1.3 CV (coefficient of variation) and trend
CV of annual precipitation for AGCD and biases between BARRA/ERA5 and AGCD are presented in Fig. 4 (and Fig. S5 on the observation grid). By its definition, CV helps capture the standard deviation in the dataset relative to its mean. In the observation, CV is generally smaller for coastal regions, including Tasmania but excepting northwest West Australia, than inland Australia, where annual rainfall is much lower than in coastal regions. Alternatively, regions with higher annual precipitation generally have smaller CV. Both BARRA and ERA5 reasonably capture the main feature of CV in observation. However, clear biases can be observed, especially in BARRA that has more than 50 % large positive biases in Northern Australia, up to 20 % positive biases for inland, and relatively smaller biases for southeastern Australia, southwest West Australia, and Tasmania. In contrast, ERA5 does not have a clear bias pattern, and biases are relatively smaller when compared to BARRA.
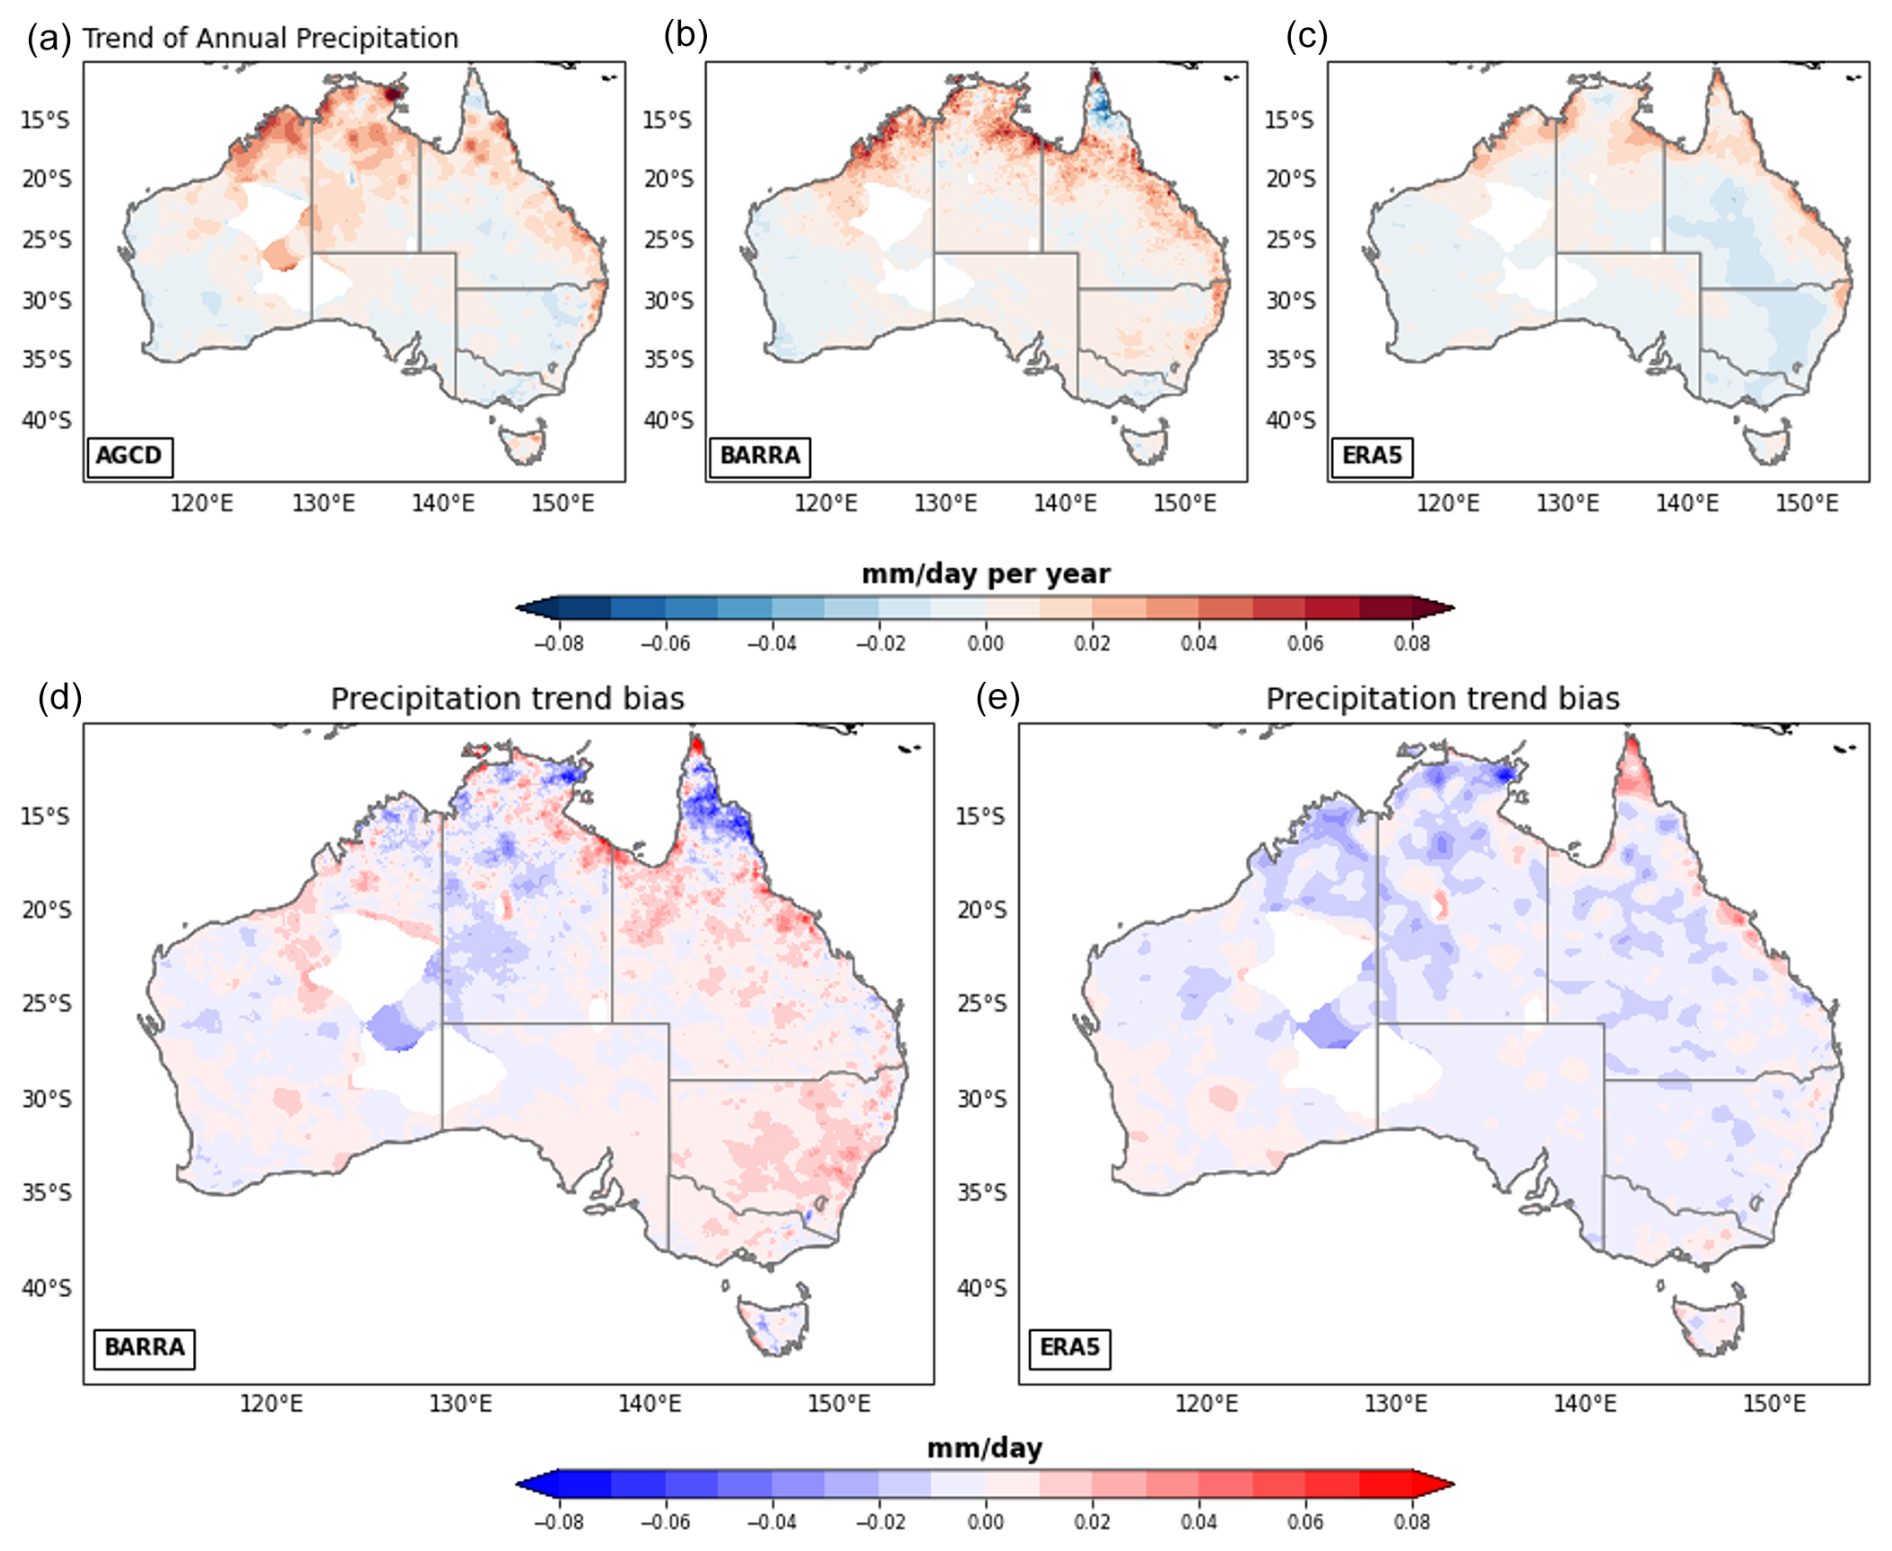
Figure 5Trend of annual precipitation for AGCD, BARRA, and ERA5 (a–c) and biases in trend between BARRA/ERA5 and AGCD (d–e).
To further investigate the variability evident in observations and BARRA/ERA5 simulations, we assess the trends in annual precipitation (Figs. 5 and S6 on the observation grid). AGCD shows strong increasing trends over Northern Australia and Northeast Australia coastal regions but decreasing trends over Northern Queensland, southwestern West Australia, and southern Great Dividing Range (including Victoria), although not all trends are significant. Most inland regions have a relatively small trend in annual precipitation. Both BARRA and ERA5 reproduce the major trend pattern; however clear biases can be observed over Northern Australia where both BARRA and ERA5 underestimate trend more than 100 % (i.e. trend of 0.08 mm d−1 per year with bias of similar magnitude). BARRA overestimated decreasing trend over Northern Queensland but ERA5 underestimate it (even increasing trend instead).
In summary, evaluation of annual mean precipitation indicates both BARRA and ERA5 possess small biases (∼20 %) in the spatial precipitation patterns. ERA5 shows stronger temporal correlations than BARRA, particularly in northern Australia. Overall, ERA5 demonstrates higher accuracy in capturing inter-annual precipitation variability. Both BARRA and ERA5 captured spatial distribution of coefficient of variation reasonably well but with large biases (∼50 %). BARRA shows much larger biases than ERA5 especially for Northern Australia. Both BARRA and ERA5 roughly reproduce the pattern of trend but with very large biases (∼100 %), especially for Northern Australia where both substantially underestimate the increasing trend.
4.2 Climate extremes
This section evaluates the seven selected precipitation extreme indices (Table 1) from BARRA and ERA5 over Australia by comparing them against AGCD. Evaluations are performed primarily using spatial bias maps and temporal correlations. We also assess the interannual variability and trends in the simulated BARRA and ERA5 indices and compare these with AGCD to further investigate any discrepancies.
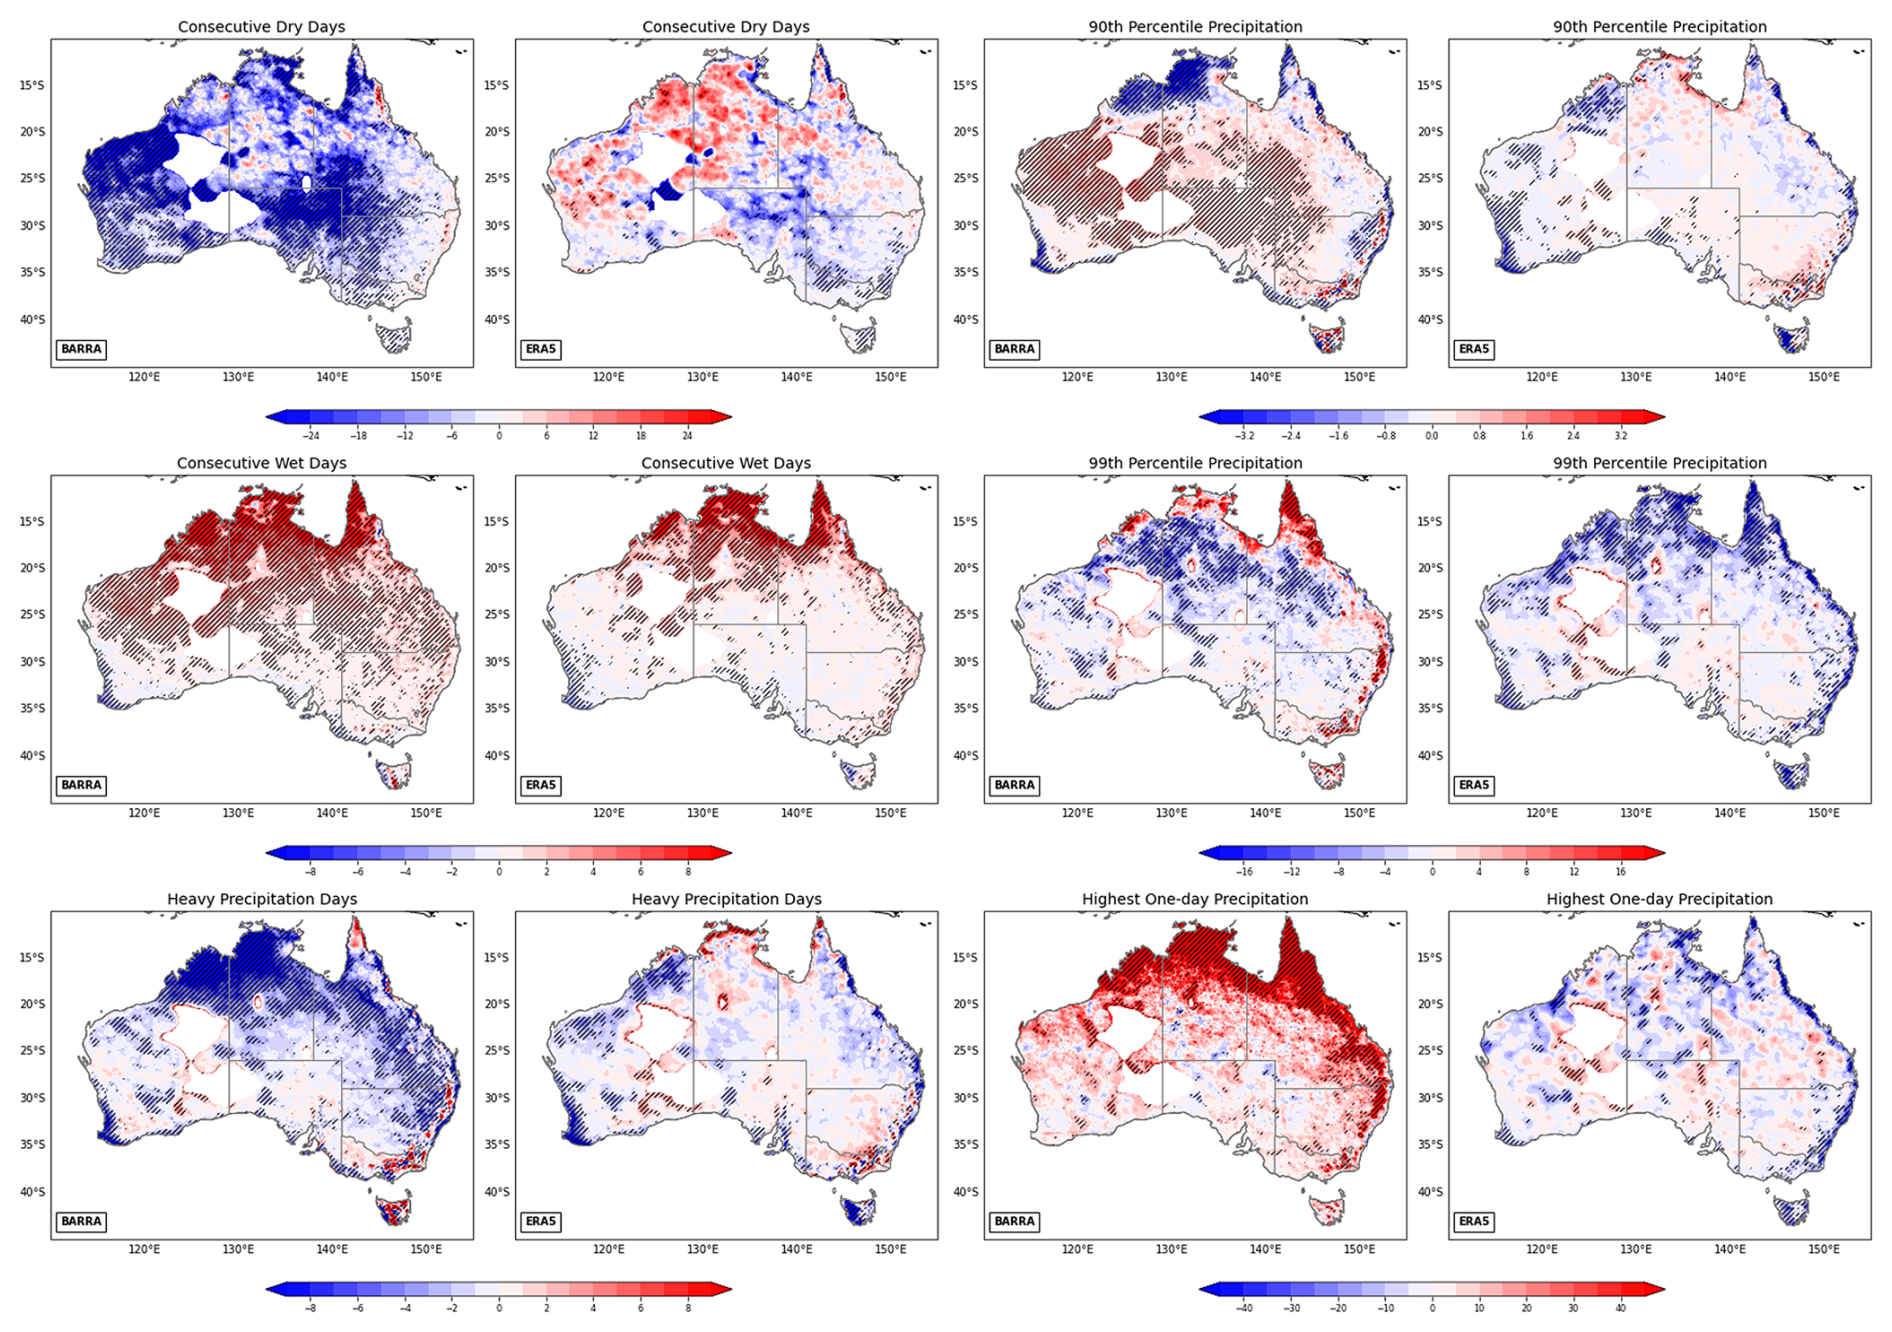
Figure 6Biases in CDD, CWD, R10mm, R90p, R99p, and Rx1Day in BARRA (left column) and ERA5 (right column). Stippling indicates areas with biases that are statistically significant at 95 % confidence level. A black contour at 40 % has been added to the panels for Rx1day (last row) for reference.
4.2.1 Bias and temporal correlation
Annual mean biases in six precipitation extremes are shown in Fig. 6 (and Fig. S8 on the observation grid). For duration-related extremes (CDD and CWD), there is a clear north-to-south gradient in AGCD (Fig. S7) with longer duration of CDD and CWD in northern Australia than southern Australia (CWD also has a clear west-to-east gradient in Tasmania), which is well simulated in BARRA and ERA5 (Fig. S7). While the spatial distributions are well captured, clear biases are evident in them (Fig. 6). BARRA generally underestimates CDD especially for central inland and northwest West Australia where biases are up to 40 %. ERA5 also underestimates CDD for central inland, but in contrast overestimates CDD for most of northwestern Australia. Overall ERA5 has smaller absolute bias in CDD (6.9 d) than BARRA (14.5 d) (Table 2). Both BARRA and ERA5 have a similar bias pattern for CWD, which generally overestimate CWD over most of regions except for southern Australian coast, southwest West Australia, and western Tasmania. The positive biases over Northern Australia may reach 30 %. Overall BARRA has slightly larger biases in CWD (2.3 d) than ERA5 (1.7 d) (Table 2).
For threshold-based extremes (PRCPTOT, R10mm, R90p, R99p, Rx1day), both BARRA and ERA5 also generally match the spatial distribution of heavy precipitation days and R90p (Fig. S7) in AGCD with large values in Northern Australia, eastern seaboard and Australian Great Dividing Range, and western Tasmania. However, clear biases can be observed in BARRA and ERA5 for both R10mm and R90p (Fig. 6). BARRA and ERA5 have large negative biases in R10mm over Northern Australia, eastern seaboard, southwest Western Australia, and western Tasmania, but biases in central inland and northwest West Australia are generally small. Overall, domain averaged absolute bias for ERA5 (1.7 d) is about half of that for BARRA (3.3 d). Both BARRA and ERA5 also have relatively large negative biases in R90p for most of northern Australia, eastern coasts, southwest West Australia, and western Tasmania but small positive biases inland, especially for BARRA. Overall averaged absolute bias is 0.78 mm d−1 for BARRA and 0.44 mm d−1 for ERA5 (Table 2).
BARRA and ERA5 also reasonably captured the spatial patterns of R99p and Rx1day; however, quite large biases are present in BARRA and ERA5 (Fig. 6). BARRA generally overestimate R99p and Rx1day over northern Australia coasts and along the Great Dividing Range. In contrast, ERA5 generally underestimate R99p and Rx1day over northern and eastern coasts, southwest Western Australia, and western Tasmania. The domain averaged bias in R99p is at a similar magnitude for BARRA (4.09 mm d−1) and ERA5 (3.67 mm d−1); however biases in Rx1day are much larger for BARRA (20.3 mm d−1) than ERA5 (7.9 mm d−1) (Table 2).
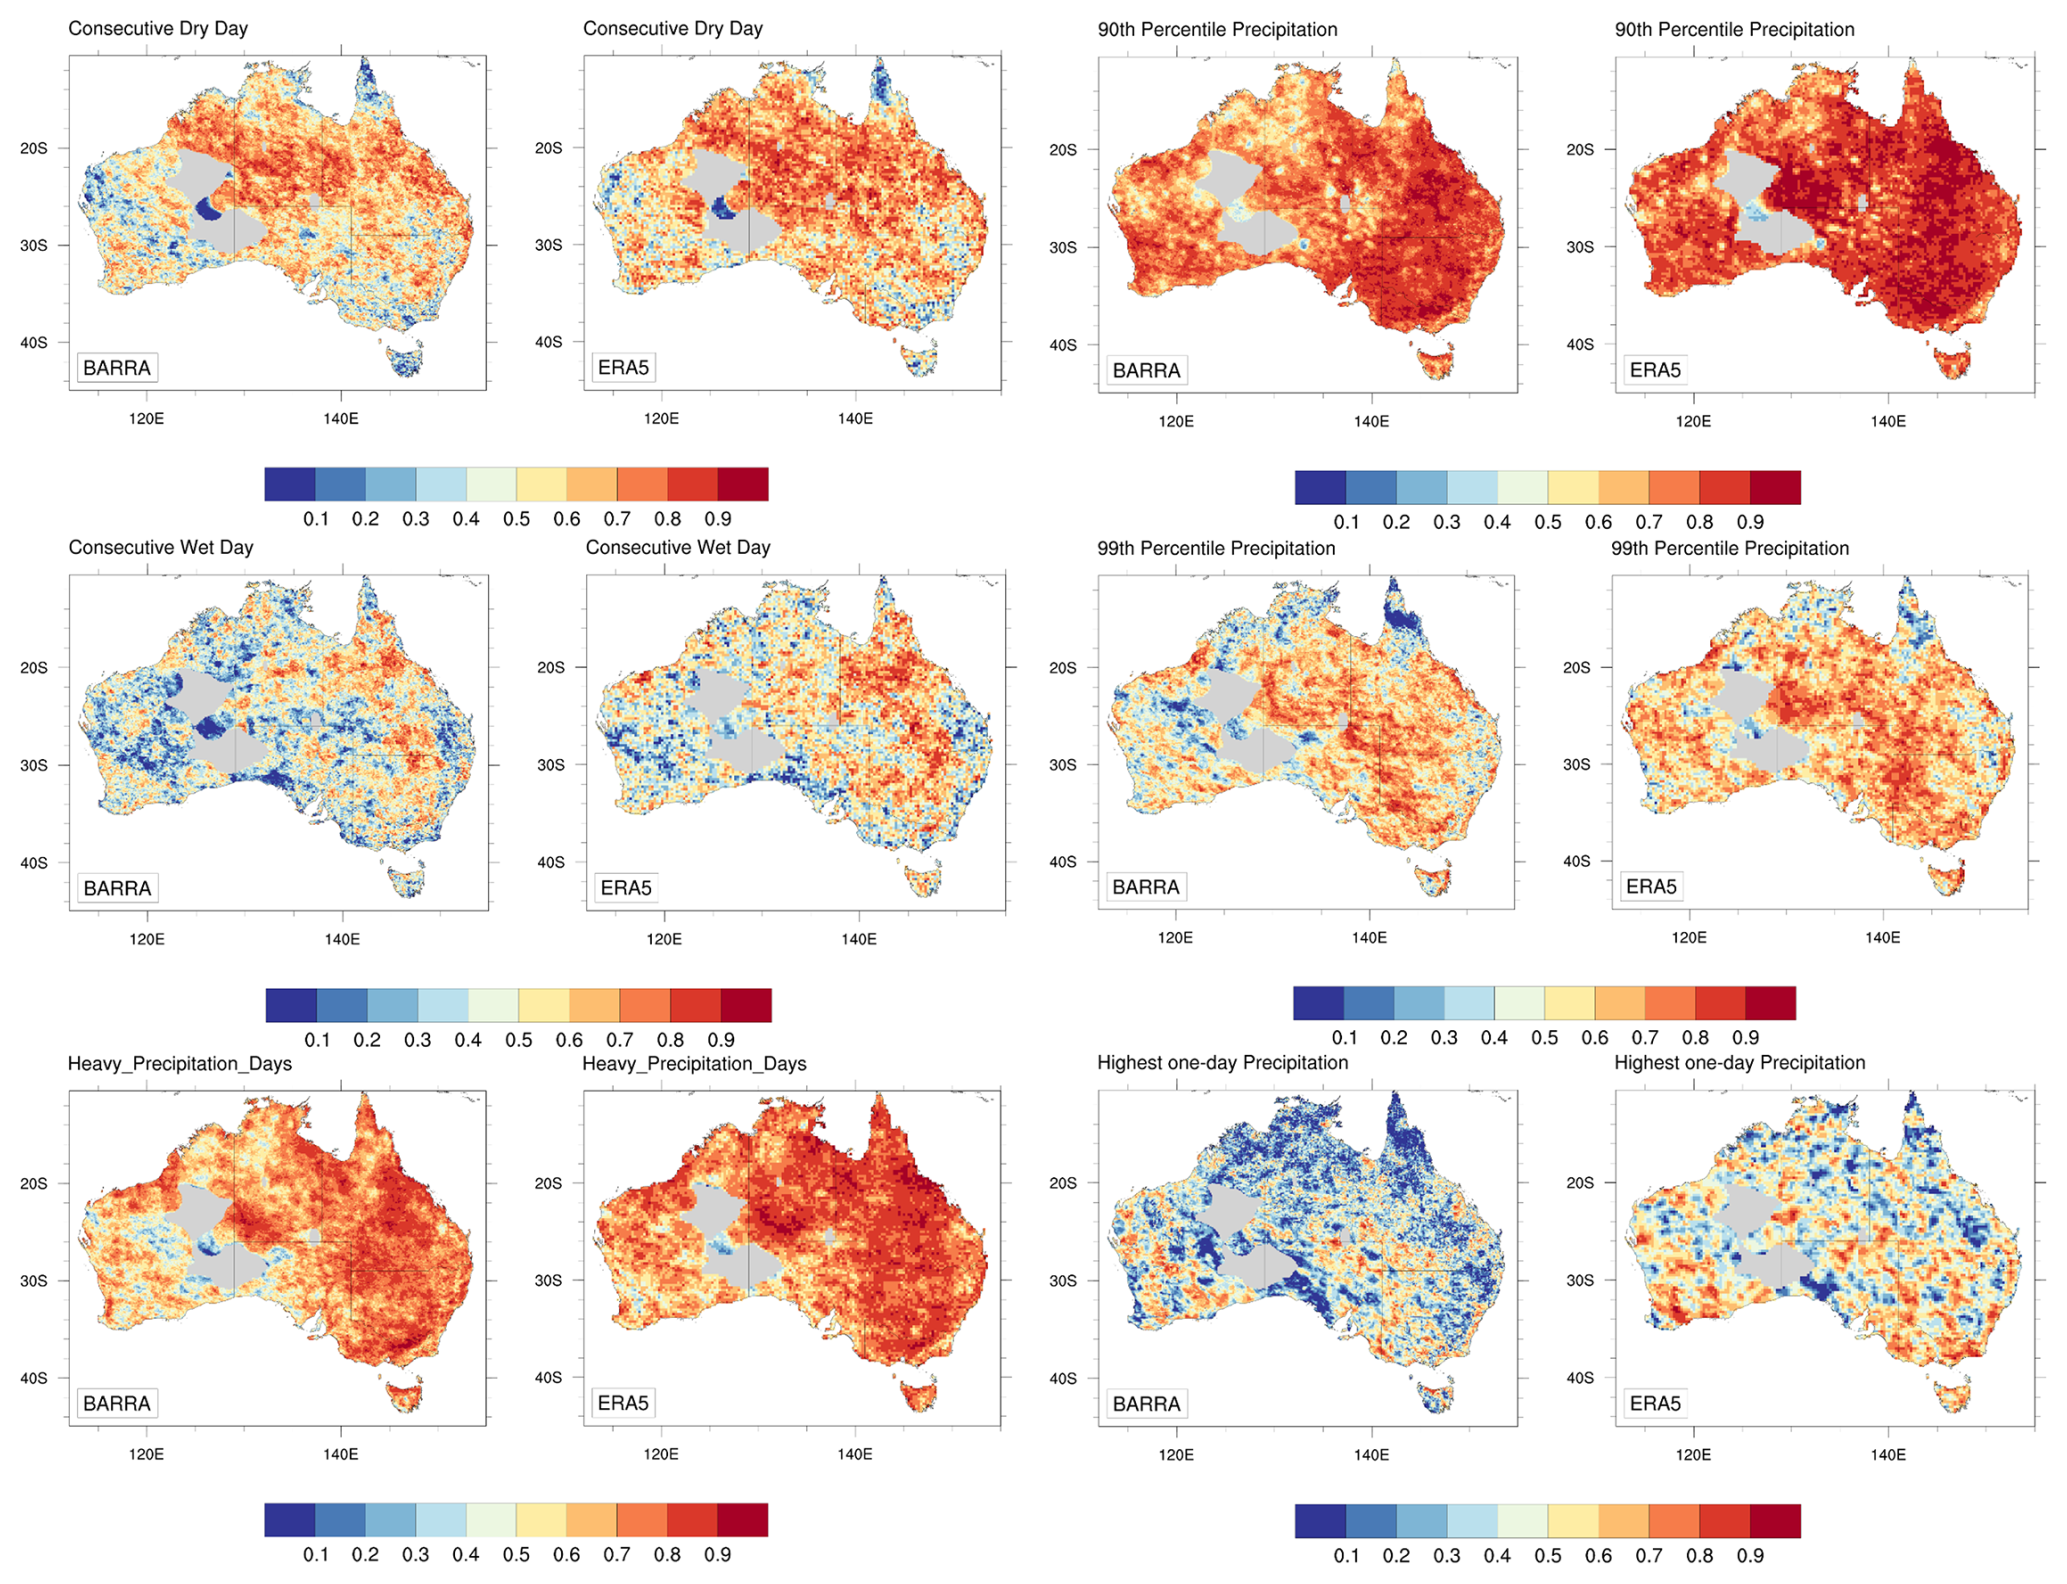
Figure 7Temporal correlation of CDD, CWD, R10mm, R90p, R99p, and Rx1Day between BARRA and AGCD (left column) and between ERA5 and AGCD (right column).
Figure 7 (and Fig. S9 on the observation grid) presents the temporal correlations between BARRA/ERA5 and AGCD for the six precipitation extreme indices. Unlike the strong temporal correlation between BARRA/ERA5 and AGCD for mean annual precipitation (Fig. 3), the temporal correlations for these extreme indices are worse except for R90p (Fig. 7). For extremes like R10mm and R90p, the correlation ranges from reasonably good (above 0.6) to pretty good (above 0.8) between BARRA/ERA5 and AGCD for most of the domain. Temporal correlations for CDD, CWD, and R99p are not as good as R10mm and R99p. CDD has more regions with stronger correlations (0.5–0.6) or above than CWD and Rx1day. For the latter the correlation is about ∼0.5 or less over most of the domain. Compared to BARRA, ERA5 has slightly stronger temporal correlations for those extremes (Table 2).
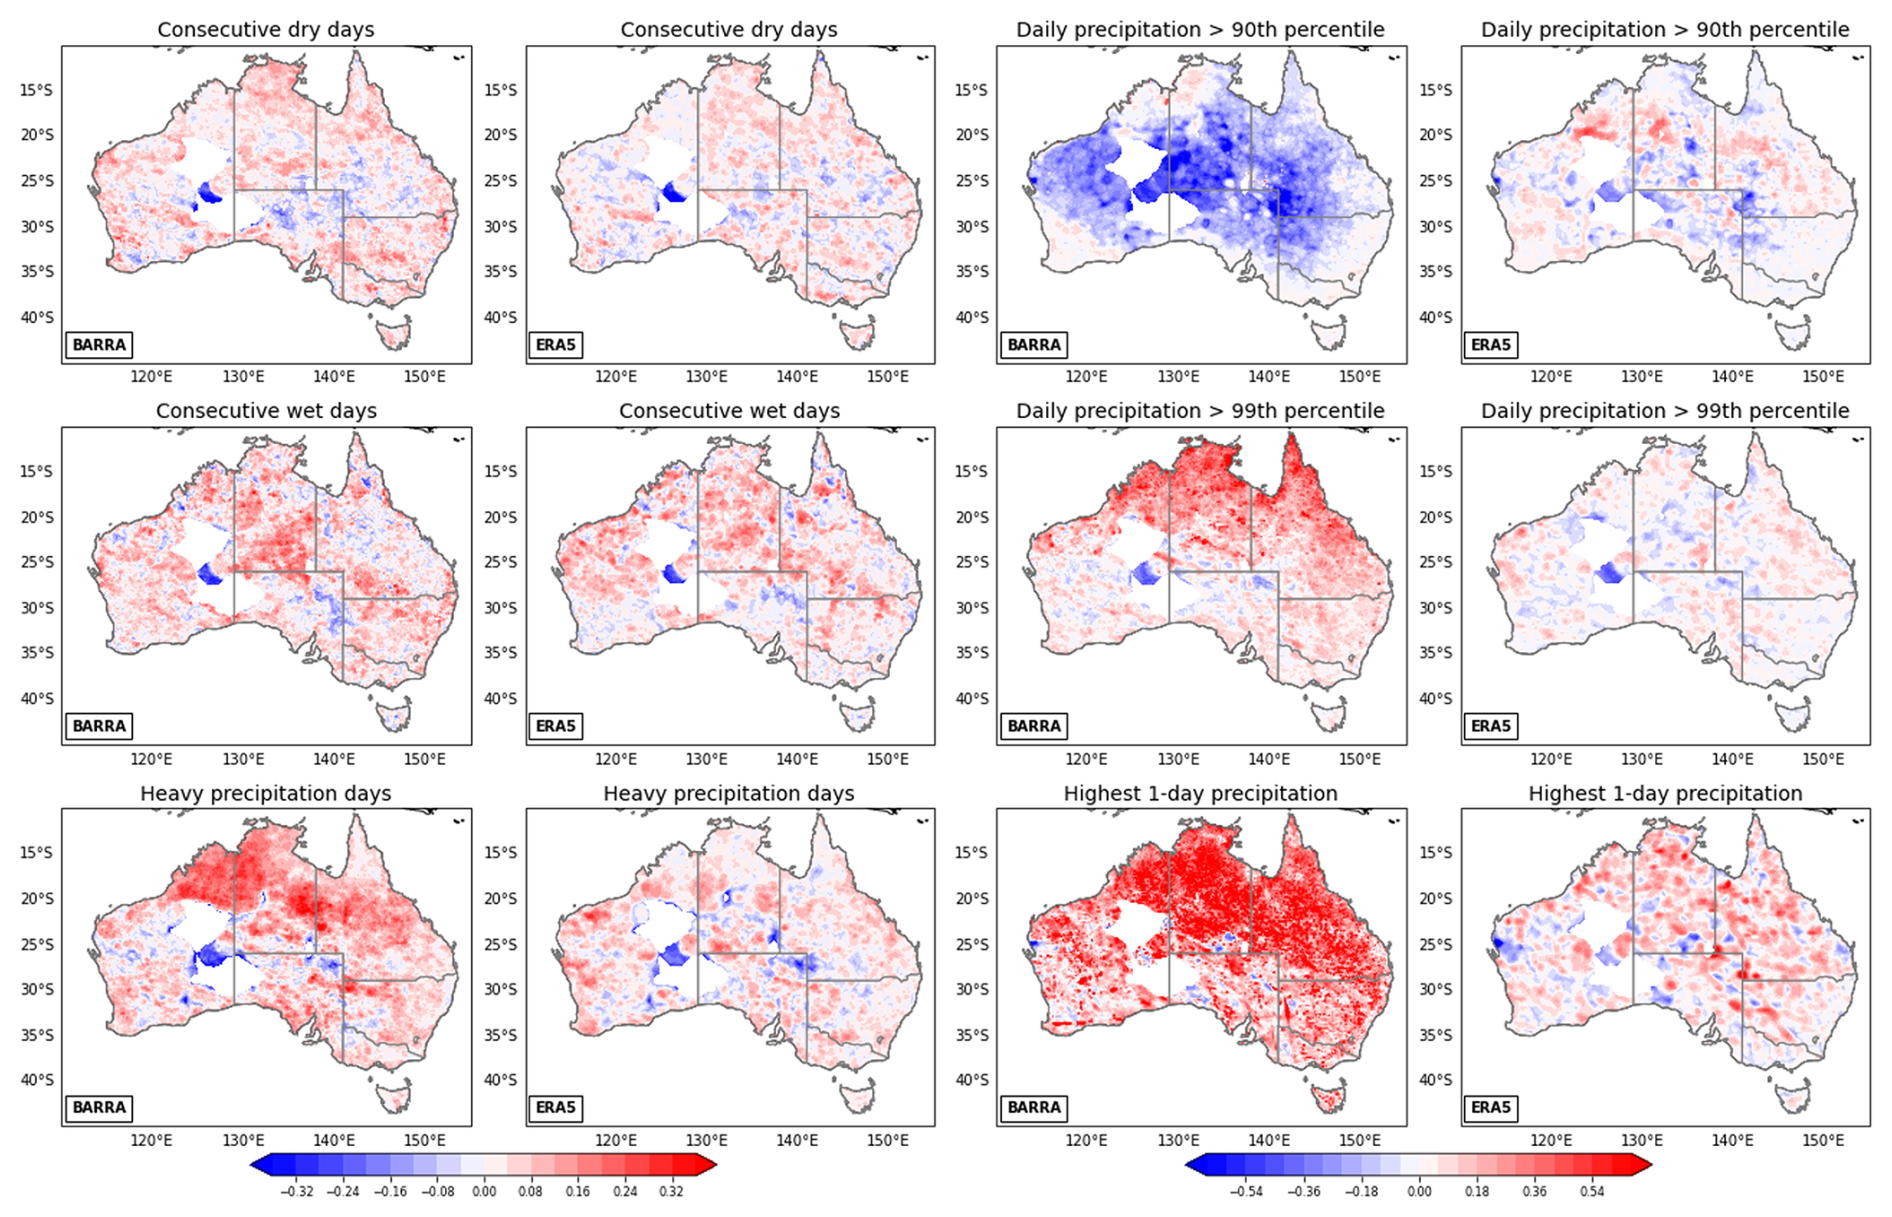
Figure 8Biases in CV of CDD, CWD, R10mm, R90p, R99p and Rx1Day for BARRA (left column) and ERA5 (right column) relative to AGCD.
4.2.2 CV (coefficient of variation) and trend
The observed and simulated CV of precipitation extremes and biases in their CV for BARRA and ERA5 are shown in Figs. S10 and 8 (and Fig. S11 on the observation grid), respectively. Generally, both BARRA and ERA5 have similar CV bias patterns and magnitude for CDD, CWD, and R10mm. In contrast, BARRA is quite different from ERA5 for the other three extremes. BARRA substantially underestimated CV of R90p over most of the inland regions, but ERA5 has much smaller negative biases, even small positive biases, although both have small biases in CV of R90p along most coastal regions and over Tasmania. BARRA systematically overestimate CVs of R99p and Rx1day over northern Australia but ERA5 has relatively small biases for them. Overall, BARRA has more than twice as much as CV biases in ERA5 for R90p, R99p, and Rx1day (Table 2).
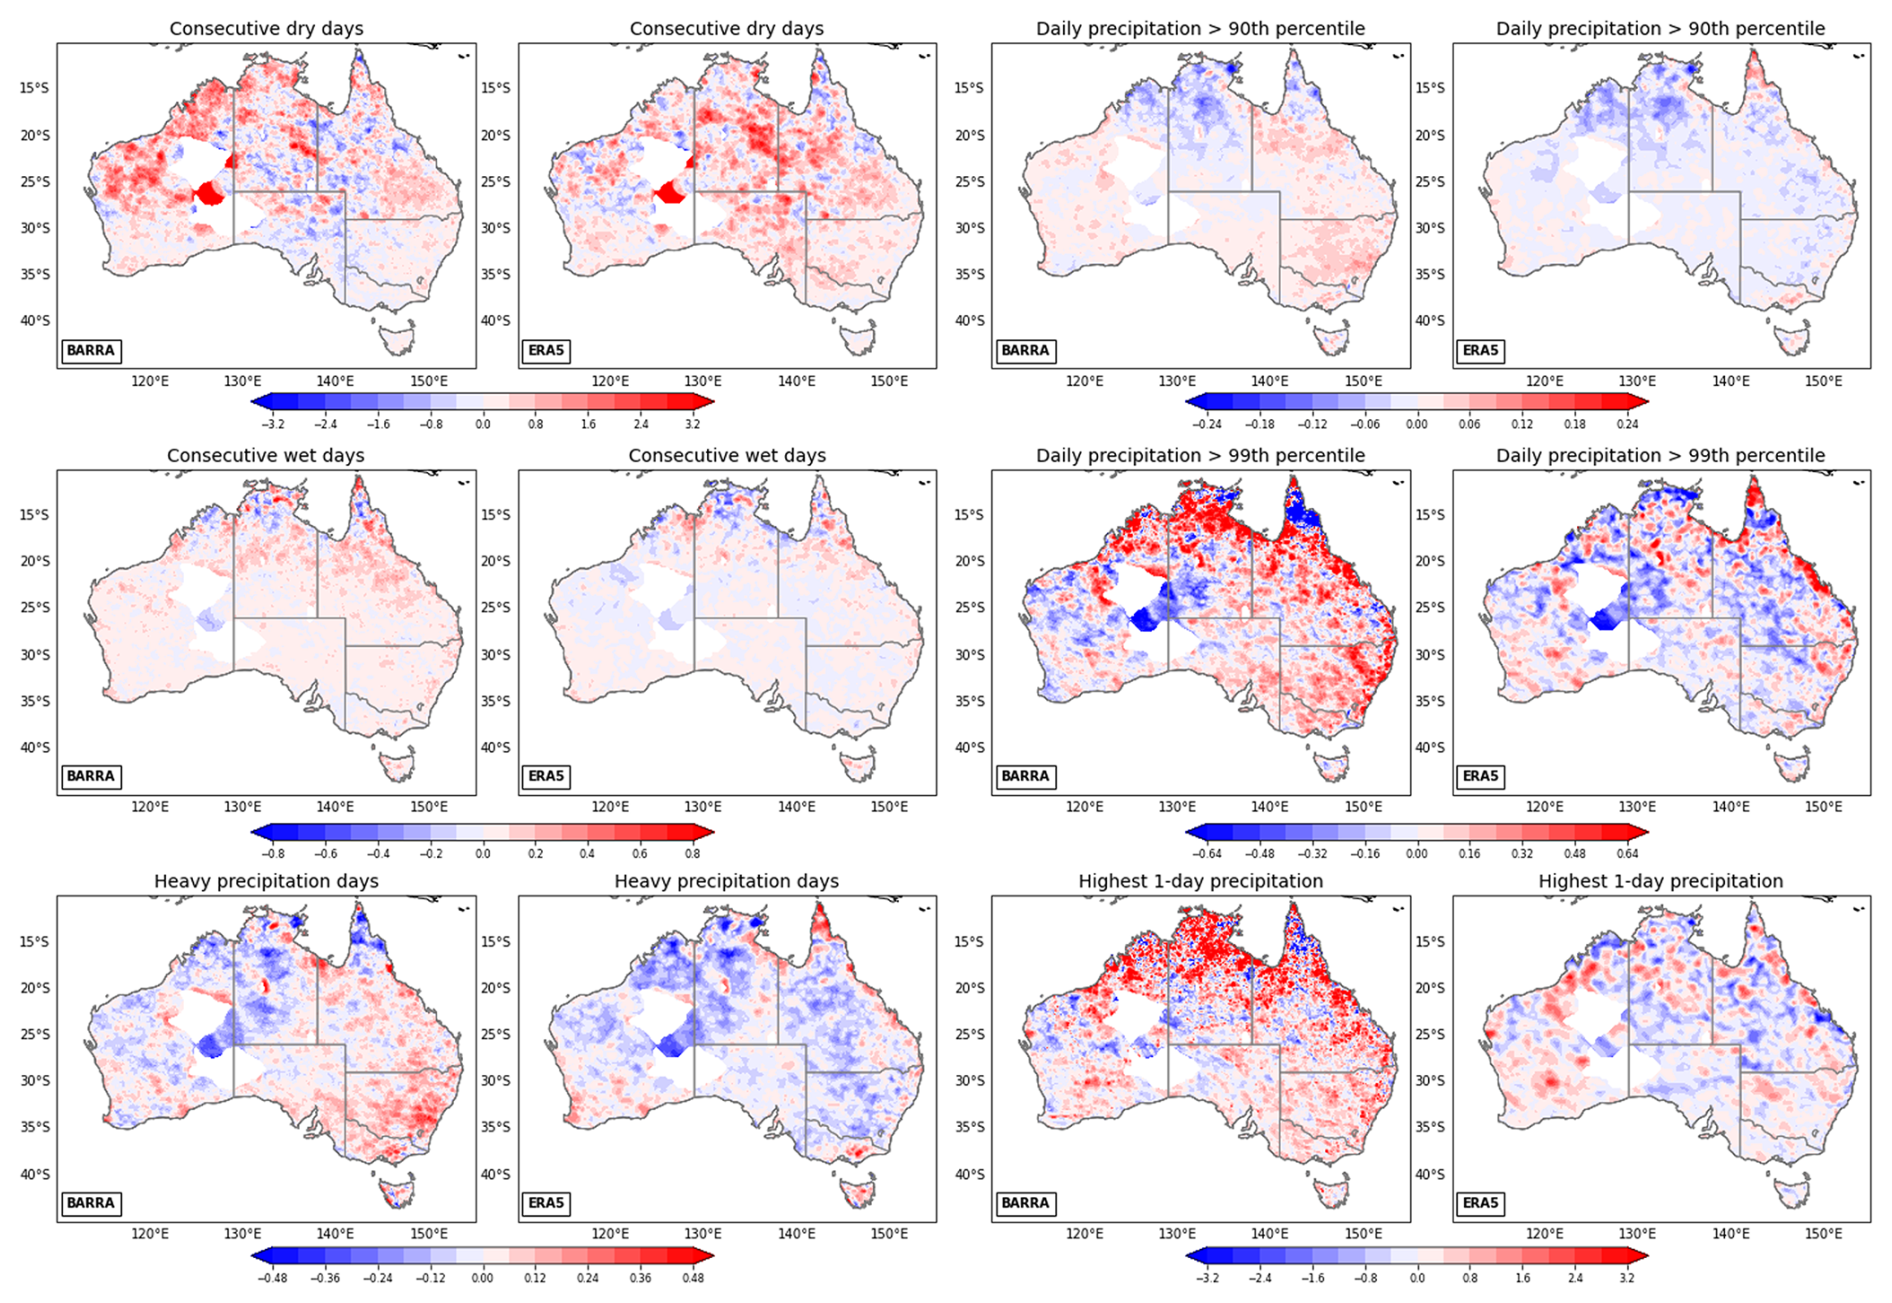
Figure 9Biases in trends of CDD, CWD, R10mm, R90p, R99p, and Rx1Day for BARRA (left column) and ERA5 (right column) relative to AGCD.
Trends of each of the precipitation extreme indices for the three datasets and biases in trend for BARRA and ERA5 are shown in Figs. S12 and 9 (and Fig. S13 on the observation grid), respectively. Generally, both BARRA and ERA5 simulate the main pattern of trends for those extremes but with large biases. BARRA and ERA5 simulated CDD trend well for southern Australia but BARRA generally underestimated trend in CDD over inland Australia and overestimate trend in northwest Australia. ERA5 only has large positive trend biases in northern central Australia. The overall domain averaged biases are similar between BARRA (0.584) and ERA5 (0.566). Both BARRA and ERA5 have small biases in CWD in central and southern Australia but similar biases pattern in Northern Australia. They also have similar overall biases in CWD (0.064 for BARRA and 0.060 for ERA5). Both BARRA and ERA5 underestimated the increasing trend in R10mm in northern Australia, but BARRA overestimated the trend in most of southeast Australia, while ERA5 underestimated it. Overall, ERA5 has slightly larger biases (0.094) than BARRA (0.085). Like R10mm, both BARRA and ERA5 also underestimate the trend of R90p in most of northern Australia but have small biases in central and southern Australia. They have almost the same overall biases in R90p. BARRA/ERA5 have similar bias patterns for R99p and Rx1day but biases for rx1days are much larger. Both BARRA and ERA5 have large biases in R99p and Rx1day but biases in BARRA are generally larger than ERA5.
In summary, both BARRA and ERA5 reproduce spatial patterns of extremes well but display biases. ERA5 underestimates CDD and certain extreme precipitation indices (e.g. Rx1day), while BARRA tends to overestimate these extremes. Both reanalyses show discrepancies in various precipitation indices across different regions, with BARRA generally displaying larger biases compared to ERA5. Temporal correlations between BARRA/ERA5 and observations for extreme precipitation indices are weaker than those for mean annual precipitation, except for a few indices where ERA5 demonstrates slightly stronger correlations compared to BARRA. Both BARRA and ERA5 align in CV patterns and biases for certain extremes (CV, R10mm, R90p) but differ notably in others (PRCPTOT, trend, CDD, R99p, Rx1day). BARRA significantly underestimates very heavy precipitation variability over inland regions, while ERA5 presents smaller biases or even positive biases in these areas. Additionally, BARRA tends to overestimate extreme precipitation variability in Northern Australia compared to ERA5. Overall, BARRA shows more than double the biases in variability compared to ERA5 for specific extreme precipitation indices. Both reanalyses generally simulate the main trend patterns but exhibit considerable biases. BARRA underestimates or overestimates trends in certain regions and indices, while ERA5 demonstrates different biases, including smaller biases overall compared to BARRA across these precipitation extremes.
In this study, we assessed the performance of BARRA and ERA5 in simulating mean precipitation and six selected precipitation extremes. While most previous evaluations have focused on the climatology of precipitation and its extremes, only a few studies have included the coefficient of variation (CV) (Teng et al., 2024). Our evaluation encompassed annual climatology along with temporal correlation, CV, and trend analysis, providing a comprehensive assessment of the performance of these two reanalysis datasets.
The results indicate that both BARRA and ERA5 demonstrate reasonable skill in simulating mean precipitation and certain precipitation extremes (e.g. CWD and R90p). However, they encounter challenges in accurately reproducing temporal correlation, CV, and trends for certain extreme events, highlighting significant uncertainties in their representation of extremes.
While acknowledging the capabilities of these reanalysis datasets, our study also identifies specific limitations and suggests potential directions for future research. A crucial consideration in model evaluation is the accuracy of observational data, which substantially influences evaluation outcomes. In this study, we used the AGCD dataset as the observational benchmark, which is based on interpolating data from in-situ stations (Evans et al., 2020). However, the AGCD dataset presents several limitations: (1) spatial coverage: sparse station coverage in northwest and central Australia, and limited observations in high-elevation areas, result in a concentration of stations in southeastern Australia, southwestern Western Australia, and eastern Tasmania. The arid interior is notably underrepresented. (2) Data completeness and homogeneity: incomplete and inhomogeneous observations due to missing data, changes in observational techniques, or station relocations can affect the consistency of the dataset. (3) Interpolation uncertainties: the interpolation method used in AGCD (splining), instead of the ordinary kriging method used in its predecessor (AWAP), introduces uncertainties, particularly in areas with sparse data coverage for extreme events like heavy rainfall.
These observational uncertainties may contribute to biases in the evaluation results. In particular, the limited number of monitoring sites over the Great Dividing Range and inland areas introduces significant uncertainties in estimated observed precipitation for these regions. Independent studies, such as Chubb et al. (2016), found that daily precipitation is underestimated by at least 15 % in some areas, which could suggest similar underestimation in BARRA and ERA5 for these regions. Similarly, the sparse gauge network in northwestern inland areas might miss localized extreme precipitation events.
Our analysis focused on seven ET-SCI-defined precipitation extreme indices (including mean precipitation), widely used in various evaluation studies (Nishant et al., 2021; Ji et al., 2024). However, recognizing the need for region-specific indices, we suggest future studies extend the analysis to incorporate additional extreme indices tailored to specific regions and applications.
Our findings emphasize that while both BARRA and ERA5 are competent in simulating the climatology of mean climate, temporal correlation, and CV, challenges remain in accurately capturing trends, particularly for certain extremes. Notably, ERA5 shows better overall performance compared to BARRA. Although higher resolution often correlates with better performance, recent studies have shown that increasing resolution alone does not always guarantee improvements (Nishant et al., 2022). Considering the critical role of driving data, model physics, and data assimilation, it may be valuable to update BARRA using the latest ERA5 data along with improved model physics and data assimilation techniques to enhance its performance.
In this study, we evaluated ERA5 and BARRA on both their native resolutions and a common resolution (5 km) to match AGCD. The results showed that the evaluations were consistent across native and common resolutions, suggesting that the performance assessments were not highly sensitive to changes in resolution.
Reanalysis datasets play a crucial role in climate research, weather analysis, and various scientific investigations. Their ability to provide a consistent and comprehensive representation of historical weather and climate conditions makes them invaluable. These datasets are particularly essential for studying long-term climate trends, understanding atmospheric phenomena, and validating climate models.
In this study, we evaluated BARRA and ERA5 for their capabilities to simulate daily precipitation, followed by mean precipitation and six selected precipitation extremes for their climatology, temporal correlation, coefficient of variation (CV), and trend on a monthly timescale to quantify their overall performance. We evaluated BARRA and ERA5 at their native resolutions, as well as at a common resolution (i.e. the observation resolution). Both analyses yielded consistent results, indicating that the evaluation is not sensitive to the remapping process.
Perkins skill score analysis of daily precipitation indicates that both BARRA and ERA5 resemble PDF of AGCD well, with ERA5 slightly outperforms BARRA in inland regions. The assessment of annual mean precipitation reveals that both BARRA and ERA5 adeptly reproduce the spatial precipitation patterns, exhibiting minor biases of around 20 %. Particularly, ERA5 showcases stronger temporal correlations compared to BARRA, which is especially evident in northern Australia. ERA5, overall, demonstrates superior accuracy in capturing inter-annual precipitation variability. However, both models depict the spatial distribution of the coefficient of variation reasonably well but with larger biases, roughly around 50 %. Particularly, BARRA displays significantly higher biases, especially in Northern Australia.
Regarding the replication of trend patterns, both models exhibit substantial biases, reaching approximately 100 %. This is especially notable in Northern Australia, where they both notably underestimate the increasing trend. Furthermore, while both BARRA and ERA5 possess about the right spatial patterns of extremes, biases are evident. ERA5 tends to underestimate consecutive dry days (CDD) and certain heavy rainfall events, while BARRA tends to overestimate these extremes. Discrepancies in various precipitation indices across regions are apparent, with BARRA generally displaying larger biases compared to ERA5.
When examining temporal correlations for extreme precipitation indices compared to mean annual precipitation, both BARRA and ERA5 show weaker correlations, except for a few indices (CDD, R10mm, R90p) where ERA5 slightly outperforms BARRA. While both models align in coefficient of variation patterns and biases for certain extremes, notable differences arise in others. BARRA notably underestimates very heavy precipitation variability over inland regions, whereas ERA5 presents smaller biases or even positive biases in these areas. Moreover, BARRA tends to overestimate extreme precipitation variability in Northern Australia compared to ERA5. Specifically, BARRA showcases more than double the biases in variability compared to ERA5 for specific extreme precipitation indices.
In terms of trend patterns, both models generally replicate the observed trends but exhibit considerable biases. BARRA shows both underestimations and overestimations in certain regions and indices, while ERA5 displays different biases, including overall smaller biases compared to BARRA across these precipitation extremes.
In summary, our findings suggest that both ERA5 and BARRA are reliable for climatological analyses, including mean precipitation and precipitation extremes, and can be confidently used by end-users for such purposes. However, as discussed in the introduction, caution is advised when using these datasets for variability and trend analyses, particularly for specific extreme events like Rx1day. The performance of these reanalyses is regionally dependent and this should be considered when using them as observational references for evaluating other model simulations. Additionally, the biases in the variability and trends of climate extremes present in both datasets must be carefully accounted for when comparing them with other data sources.
Details about AGCD are available at the Australian Bureau of Meteorology website (https://doi.org/10.25914/6009600786063, Evans et al., 2020). The dataset is available on the NCI (National Computational Infrastructure) server in project zv2. Detail on how to access the data can be found at http://climate-cms.wikis.unsw.edu.au/AGCD (University of New South Wales, 2025). ERA5 data is available on the NCI in Project rt52. BARRA data is available on the NCI in project cj37.
The supplement related to this article is available online at https://doi.org/10.5194/hess-29-3527-2025-supplement.
KKWC and FJ conceptualized and implemented the research. KKWC, FJ, and NN performed the data analysis and prepared the figures. KKWC and FJ prepared the draft manuscript. All authors contributed to the discussion of results, editing, and finalization of the manuscript.
The contact author has declared that none of the authors has any competing interests.
Publisher's note: Copernicus Publications remains neutral with regard to jurisdictional claims made in the text, published maps, institutional affiliations, or any other geographical representation in this paper. While Copernicus Publications makes every effort to include appropriate place names, the final responsibility lies with the authors.
The modelling work was undertaken on the National Computational Infrastructure (NCI) high-performance computers in Canberra, Australia, which are supported by the Australian Commonwealth Government. The authors would like to thank the editor and two anonymous reviewers for providing insightful comments and detailed suggestions for us to improve the manuscript.
Kevin K. W. Cheung has been supported by the Startup Foundation for Introducing talent of Nanjing University of Information Science and Technology.
This paper was edited by Frederiek Sperna Weiland and reviewed by two anonymous referees.
Acharya, S. C., Nathan, R., Wang, Q. J., Su, C.-H., and Eizenberg, N.: An evaluation of daily precipitation from a regional atmospheric reanalysis over Australia, Hydrol. Earth Syst. Sci., 23, 3387–3403, https://doi.org/10.5194/hess-23-3387-2019, 2019.
Acharya, S. C., Nathan, R., Wang, Q. J., Su, C.-H., and Eizenberg, N.: Ability of an Australian reanalysis dataset to characterise sub-daily precipitation, Hydrol. Earth Syst. Sci., 24, 2951–2962, https://doi.org/10.5194/hess-24-2951-2020, 2020.
Betts, A. K., Chan, D. Z., and Desjardins, R. L.: Near-Surface Biases in ERA5 Over the Canadian Prairies, Front. Environ. Sci., 7, https://doi.org/10.3389/fenvs.2019.00129, 2019.
Capecchi, V., Pasi, F., Gozzini, B., and Brandini, C.: A convection-permitting and limited-area model hindcast driven by ERA5 data: precipitation performances in Italy, Clim. Dynam., 61, 1411–1437, https://doi.org/10.1007/s00382-022-06633-2 , 2023.
Cheung, K. K. W., Ji, F., Nishant, N., Herold, N., and Cook, K.: Evaluation of Convective Environments in the NARCliM Regional Climate Modeling System for Australia, Atmosphere, 14, 690, https://doi.org/10.3390/atmos14040690, 2023.
Choudhury, D., Ji, F., Nishant, N., and Di Virgilio, G.: Evaluation of ERA5 simulated temperature and its extremes for Australia, Atmosphere, 14, 913, https://doi.org/10.3390/atmos14060913, 2023.
Chubb, T. H., Manton, M. J., Siems, S. T., and Peace, A. D.: Evaluation of the AWAP daily precipitation spatial analysis with an independent gauge network in the Snowy Mountains, J. Southern Hemisphere Earth Systems Science, 66, 55–67, 2016.
Dai, W., Zeng, Y., Jing, T. G., Wang, Z., Zong, R., Ni, L., and Fang, N.: Estimation of rainfall erosivity on the Chinese Loess Plateau: A new combination of the ERA5 dataset and machine learning, J.. Hydrol (Amst.), 624, 129892, https://doi.org/10.1016/j.jhydrol.2023.129892, 2023.
Dee, D. P., Uppala, S. M., Simmons, A. J., Berrisford, P., Poli, P., Kobayashi, S., Andrae, U., Balmaseda, M. A., Balsamo, G., Bauer, P., Bechtold, P., Beljaars, A. C. M., van de Berg L., Bidlot, J., Bormann, N., Delsol, C., Dragani, R., Fuentes, M., Geer, A. J., Haimberger, L., Healy, S. B., Hersbach, H., Hólm, E. V., Isaksen, L., Kållberg, P., Köhler, M., Matricardi, M., McNally, A. P., Monge-Sanz, B. M., Morcrette, J.-J., Park, B.-K., Peubey, C., de Rosnay, P., Tavolato, C., Thépaut, J.-N., and Vitart, F.: The ERA-Interim reanalysis: Configuration and performance of the data assimilation system, Q. J. Roy. Meteor. Soc., 137, 553–597, https://doi.org/10.1002/qj.828, 2011.
Di Virgilio, G., Evans, J. P., Di Luca, A., Olson, R., Argueso, D., Kala, J., Andrys, J., Hoffmann, P., Katzfey, J. J., and Rockel, B.: Evaluating reanalysis driven CORDEX regional climate models over Australia: model performance and errors, Clim. Dynam., 53, 2985–3005, 2019.
Di Virgilio, G., Ji, F., Tam, E., Evans, J. P., Kala, J., Andrys, J., Thomas, C., Choudhury, D., Rocha, C., Li, Y., and Riley, M. L.: Evaluation of CORDEX ERA5-forced NARCliM2.0 regional climate models over Australia using the Weather Research and Forecasting (WRF) model version 4.1.2, Geosci. Model Dev., 18, 703–724, https://doi.org/10.5194/gmd-18-703-2025, 2025.
Du, Y. L., Wang, Q. J., Su, C. H., Wu, W., and Yang, Q.: Estimating daily precipitation climatology by postprocessing high-resolution reanalysis data, Intl. J. Climatol., 43, 4151–4165, https://doi.org/10.1002/joc.8079, 2023.
Evans, A., Jones, D., Smalley, R., and Lellyett, S.: An Enhanced gridded rainfall analysis scheme for Australia, Bureau Research Report No. 41, Bureau of Meteorology [data set], Australia, https://doi.org/10.25914/6009600786063, 2020.
Fita, L., Evans, J. P., Argüeso, D., King, A., and Liu, Y.: Evaluation of the regional climate response in Australia to large-scale climate models in the historical NARCliM simulations, Clim. Dynam., 49, 2815–2829, https://doi.org/10.1007/s00382-016-3484-x, 2017.
Gelaro, R., McCarty, W., Suárez, M. J., Todling, R., Molod, A., Takacs, L., Randles, C. A., Darmenov, A., Bosilovich, M. G., Reichle, R., Wargan, K., Coy, L., Cullather, R., Draper, C., Akella, S., Buchard, V., Conaty, A., da Silva, A. M., Gu, W., Kim, G.-K., Koster, R., Lucchesi, R., Merkova, D., Nielsen, J. E., Partyka, G., Pawson, S., Putman, W., Rienecker, M., Schubert, S. D., Sienkiewicz, M., and Zhao, B.: The Modern-Era Retrospective Analysis for Research and Applications, Version 2 (MERRA-2), J. Climate, 30, 5419–5454, https://doi.org/10.1175/JCLI-D-16-0758.1, 2017.
Gleixner, S., Demissie, T., and Diro, G. T.: Did ERA5 Improve Temperature and Precipitation Reanalysis over East Africa?, Atmosphere (Basel), 11, 996, https://doi.org/10.3390/atmos11090996, 2020.
Herold, N. and Alexander, L.: Climpact 2, https://github.com/ARCCSS-extremes/climpact2 (last access: 30 July 2025), 2016.
Hersbach, H., Bell, B., Berrisford, P., Hirahara, S., Horányi, A., Muñoz-Sabater, J., Nicolas, J., Peubey, C., Radu, R., Schepers, D., Simmons, A., Soci, C., Abdalla, S., Abellan, X., Balsamo, G., Bechtold, P., Biavati, G., Bidlot, J., Bonavita, M., de Chiara, G., Dahlgren, P., Dee, D., Diamantakis, M., Dragani, R., Flemming, J., Forbes, R., Fuentes, M., Geer, A., Haimberger, L., Healy, S., Hogan, R. J., Hólm, E., Janisková, M., Keeley, S., Laloyaux, P., Lopez, P., Lupu, C., Radnoti, G., de Rosnay, P., Rozum, I., Vamborg, F., Villaume, S., and Thépaut, J.-N.: The ERA5 global reanalysis, Q. J. Roy. Meteor. Soc., 146, 1999–2049, https://doi.org/10.1002/qj.3803, 2020.
Hobeichi, S., Nishant, N., Shao, Y. W., Abramowitz, G., Pitman, A., Sherwood, S., Bishop, C., and Green, S.: Using Machine Learning to Cut the Cost of Dynamical Downscaling, Earths Future, 11, e2022EF003291, https://doi.org/10.1029/2022EF003291, 2023.
Hu, X. L. and Yuan, W. H.: Evaluation of ERA5 precipitation over the eastern periphery of the Tibetan plateau from the perspective of regional rainfall events, Int. J. Climatol., 41, 2625–2637, https://doi.org/10.1002/joc.6980, 2021.
Izadi, N., Karakani, E. G., Saadatabadi, A. R., Shamsipour, A., Rattahi, E., and Habibi, M.: Evaluation of ERA5 Precipitation Accuracy Based on Various Time Scales over Iran during 2000–2018, Water (Basel), 13, 2538, https://doi.org/10.3390/w13182538, 2021.
Ji, F., Evans, J. P., Teng, J., Scorgie, Y., Argüeso, D., and Di Luca, A.: Evaluation of long-term precipitation and temperature Weather Research and Forecasting simulations for southeast Australia, Clim. Res., 67, 99–115, 2016.
Ji, F., Di Virgilio, G., Nishant, N., Tam, E., Evans, J. P., Kala, J., Andrys, J., Thomas, C., and Riley, M.: Evaluation of precipitation extremes in ERA5 driven regional climate simulations, Weather Climate Extremes, 44, 100676, https://doi.org/10.1016/j.wace.2024.100676, 2024.
Jiang, Q., Li, W. Y., Fan, Z. D., He, X., Sun, W., Chen, S., Wen, J., Gao, J., and Wang, J.: Evaluation of the ERA5 reanalysis precipitation dataset over Chinese Mainland, J. Hydrol. (Amst.), 595, 125660, https://doi.org/10.1016/j.jhydrol.2020.125660, 2021.
Jiao, D. L., Xu, N. N., Yang, F., and Xu, K.: Evaluation of spatial-temporal variation performance of ERA5 precipitation data in China, Sci. Rep., 11, 17956, https://doi.org/10.1038/s41598-021-97432-y, 2021.
Kalnay, E., Kanamitsu, M., Kistler, R., Collins, W., Deaven, D., Gandin, L., Iredell, M., Saha, S., White, G., Woollen, J., Zhu, Y., Chelliah, M., Ebisuzaki, W., Higgins, W., Janowiak, J., Mo, K. C., Ropelewski, C., Wang, J., Leetmaa, A., Reynolds, R., Jenne, R., and Joseph, D.: The NCEP/NCAR 40-year reanalysis project, B. Am. Meteorol. Soc., 77, 437–472, https://doi.org/10.1175/1520-0477(1996)077<0437:TNYRP>2.0.CO;2, 1996.
Kanamitsu, M., Ebisuzaki, W., Woollen, J., Yang, S., Hnilo, J., Fiorino, M., and Potter, G.: NCEP-DOE AMIP-II Reanalysis (R-2), B. Am. Meteorol. Soc., 83, 1631–1644, https://doi.org/10.1175/BAMS-83-11-1631, 2002.
Kobayashi, S., Ota, Y., Harada, Y., Ebita, A., Moriya, M., Onoda, H., Onogi, K., Kamahori, H., Kobayashi, C., Endo, H., Miyaoka, K., and Takahashi, K.: The JRA-55 Reanalysis: General Specifications and Basic Characteristics, J. Meteorol. Soc. Jpn. Ser. II, 93, 5–48, https://doi.org/10.2151/jmsj.2015-001, 2015.
Lei, X. Y., Xu, W. L., Chen, S. T., Yu, T., Hu, Z., Zhang, M., Jiang, L., Bao, R., Guan, X., Ma, M., Wei, J., Feng, A., and Gao, L.: How Well Does the ERA5 Reanalysis Capture the Extreme Climate Events Over China? Part I: Extreme Precipitation, Front. Environ. Sci., 10, https://doi.org/10.3389/fenvs.2022.921658, 2022.
Lei, Y. H., Letu, H. S., Shang, H. Z., and Shi, J. C.: Cloud cover over the Tibetan Plateau and eastern China: a comparison of ERA5 and ERA-Interim with satellite observations, Clim. Dynam., 54, 2941–2957, https://doi.org/10.1007/s00382-020-05149-x, 2020.
Li, X. X., Qin, X. C., Yang, J., and Zhang, Y. Z.: Evaluation of ERA5, ERA-Interim, JRA55 and MERRA2 reanalysis precipitation datasets over the Poyang Lake Basin in China, Int. J. Climatol., 42, 10435–10450, https://doi.org/10.1002/joc.7915, 2022.
May, P. T., Trewin, B., Su, C. H., and Ostendorf, B.: Verification of moist surface variables over northern Australia in a high-resolution reanalysis (BARRA), J. Southern Hemisphere Earth Systems Science, 71, 194–202, https://doi.org/10.1071/ES21007, 2021.
Nishant, N., Evans, J. P., Di Virgilio, G., Downes, S. M., Ji, F., Cheung, K. K. W., Tam, E., Miller, J., Beyer, K., and Riley, M. L.: Introducing NARCliM1.5: evaluating the performance of regional climate projections for southeast Australia for 1950–2100, Earth's Future, 9, e2020EF001833, https://doi.org/10.1029/2020EF001833, 2021.
Nishant, N., Sherwood, S., Prasad, A., Ji, F., and Singh, A.: Impact of higher spatial resolution on precipitation properties over Australia, Geophys. Res. Lett., 49, e2022GL100717, https://doi.org/10.1029/2022GL100717, 2022.
Pei, F., Zhou, Y., and Xia, Y.: Assessing the Impacts of Extreme Precipitation Change on Vegetation Activity, Agriculture, 11, 487, https://doi.org/10.3390/agriculture11060487, 2021.
Perkins, S. E., Pitman, A.J., Holbrook, N., and McAneney, J.: Evaluation of the AR4 climate models' simulated daily maximum temperature, minimum temperature, and precipitation over Australia using probability density functions, J. Climate, 20, 4356–4376, https://doi.org/10.1175/JCLI4253.1, 2007.
Pirooz, A. A. S., Moore, S., Carey-Smith, T., Turner, R., and Su, C.-H.: Evaluation of global and regional reanalyses performance over New Zealand, Weather Climate, 41, 52–70, https://doi.org/10.2307/27127989, 2021.
Poli, P., Hersbach, H., Dee, D. P., Berrisford, P., Simmons, A. J., Vitart, F., Laloyaux, P., Tan, D. G. H., Peubey, C., Thépaut, J.-N., Trémolet, Y., Hólm, E. V., Bonavita, M., Isaksen, L., and Risher, M.: ERA-20C: An Atmospheric Reanalysis of the Twentieth Century, J. Climate, 29, 4083–4097, https://doi.org/10.1175/jcli-d-15-0556.1, 2016.
Qin, S., Wang, K. C., Wu, G. C., and Ma, Z. S.: Variability of hourly precipitation during the warm season over eastern China using gauge observations and ERA5, Atmos. Res., 264, 105872, https://doi.org/10.1016/j.atmosres.2021.105872, 2021.
Quagraine, K. A., Nkrumah, F., Klein, C., Klutse, N. A. B., and Quagraine, K. T.: West African Summer Monsoon Precipitation Variability as Represented by Reanalysis Datasets, Climate, 8, 111, https://doi.org/10.3390/cli8100111, 2020.
Saha, S., Moorthi, S., Pan, H.-L., Wu, X., Wang, J., Nadiga, S., Tripp, P., Kistler, R., Woollen, J., Behringer, D., Liu, H., Stokes, D., Grumbine, R., Gayno, G., Wang, J., Hou, Y.-T., Chuang, H.-Y., Juang, H.-M. H., Sela, J., Iredell, M., Treadon, R., Kleist, D., van Delst, P., Keyser, D., Derber, J., Ek, M., Meng, J., Wei, H., Yang, R., Lord, S., van den Dool, H., Kumar, A., Wang, W., Long, C., Chelliah, M., Xue, Y., Huang, B., Schemm, J.-K., Ebisuzaki, W., Lin, R., Xie, P., Chen, M., Zhou, S., Higgins, W., Zou, C.-Z., Liu, Q., Chen, Y., Han, Y., Cucurill, L., Reynolds, R. W., Ritledge, G., and Goldberg, M.: The NCEP Climate Forecast System Reanalysis, B. Am. Meteorol. Soc., 91, 1015–1058, https://doi.org/10.1175/2010BAMS3001.1, 2010.
Schulzweida, U., Kornblueh, L., and Quast, R.: CDO user's guide, Climate data operators, Version, 1, 205–209, 2006.
Shen, L. C., Wen, J. H., Zhang, Y. Q., Ullah, S., Meng, X., and Chen, G.: Performance Evaluation of ERA5 Extreme Precipitation in the Yangtze River Delta, China, Atmosphere (Basel) 13, 1416, https://doi.org/10.3390/atmos13091416, 2022.
Solman, S.A., Sanchez, E., Samuelsson, P., da Rocha, R. P., Li, L., Marengo, J., Pessacg, N. L., Remedio, A. R. C., Chou, S. C., Berbery, H., Le Treut, H., de Castro, M., and Jacob, D.: Evaluation of an ensemble of regional climate model simulations over South America driven by the ERA-Interim reanalysis: model performance and uncertainties, Clim. Dynam., 41, 1139–1157, https://doi.org/10.1007/s00382-013-1667-2, 2013.
Song, Y. Y. and Wei, J. F.: Diurnal cycle of summer precipitation over the North China Plain and associated land-atmosphere interactions: Evaluation of ERA5 and MERRA-2, Int. J. Climatol., 41, 6031–6046, https://doi.org/10.1002/joc.7166, 2021.
Su, C.-H., Eizenberg, N., Steinle, P., Jakob, D., Fox-Hughes, P., White, C. J., Rennie, S., Franklin, C., Dharssi, I., and Zhu, H.: BARRA v1.0: the Bureau of Meteorology Atmospheric high-resolution Regional Reanalysis for Australia, Geosci. Model Dev., 12, 2049–2068, https://doi.org/10.5194/gmd-12-2049-2019, 2019.
Su, C.-H., Eizenberg, N., Jakob, D., Fox-Hughes, P., Steinle, P., White, C. J., and Franklin, C.: BARRA v1.0: kilometre-scale downscaling of an Australian regional atmospheric reanalysis over four midlatitude domains, Geosci. Model Dev., 14, 4357–4378, https://doi.org/10.5194/gmd-14-4357-2021, 2021.
Tabari, H.: Climate change impact on flood and extreme precipitation increases with water availability, Sci. Rep., 10, 1–10, 2020.
Teng, J., Bennett, J. C., Charles, S., Chiew, F., Ji, F., Potter, N., Fu, G. B., Thatcher, M., and Remenyi, T.: Trend and variance in regional climate models – validation and hydrological implications, J. Hydrol., 642, 131817, https://doi.org/10.1016/j.jhydrol.2024.131817, 2024.
University of New South Wales: Australian Gridded Climate Data, http://climate-cms.wikis.unsw.edu.au/AGCD, last access: 30 July 2025.
Wang, C., Graham, R. M., Wang, K., Gerland, S., and Granskog, M. A.: Comparison of ERA5 and ERA-Interim near-surface air temperature, snowfall and precipitation over Arctic sea ice: effects on sea ice thermodynamics and evolution, The Cryosphere, 13, 1661–1679, https://doi.org/10.5194/tc-13-1661-2019, 2019.