the Creative Commons Attribution 4.0 License.
the Creative Commons Attribution 4.0 License.
 | 28 Jul 2025
An Atlantic influence on evapotranspiration in the Orinoco and Amazon basins
Nicolás Duque-Gardeazabal
Andrew R. Friedman
Stefan Brönnimann
Tropical South America's hydroclimate is influenced by ocean–atmospheric variability modes (drivers of climate variability). It is still not known which physical mechanisms teleconnect the Atlantic modes of variability with South America's soil moisture, net radiation, and terrestrial evaporation (evapotranspiration). Understanding these mechanisms is essential to predict the response of ecosystems. This study uses composites of reanalysis and satellite data to identify the processes linking land–surface anomalies and ocean–atmospheric modes. It estimates the control soil moisture and net radiation impose on evapotranspiration (categorised as water- or energy-limited regimes). It shows that these two local controllers of evapotranspiration are influenced by the position of the Intertropical Convergence Zone (ITCZ). However, the evapotranspiration anomalies are driven by the phase of each climate mode, which alter water and radiation availability. The Atlantic Meridional Mode (AMM) generates cross-equatorial wind anomalies that affect moisture convergence, which in turn modify the cloud cover, precipitation, soil moisture, radiation availability, and hence evapotranspiration. The anomalies have important geographical differences depending on the season analysed; they migrate from the east in austral autumn towards the central Amazon and western Orinoco in austral spring. The Atlantic Niño Equatorial mode (Atl3) affects evapotranspiration in the Guianas and eastern Orinoco by means of pressure and trade wind variability, which in turn affect local hydrometeorological conditions and evapotranspiration. Both Atlantic modes mainly impact regions different from those impacted by El Niño–Southern Oscillation (ENSO), although northeast Brazil and the Guianas might experience overlapping effects. Therefore, these ocean–atmospheric modes impact the water, energy, and carbon cycles; they might influence regional climate extremes (e.g. droughts and floods); and they are critical for achieving sustainable development goals (SDGs).
- Article
(12773 KB) - Full-text XML
-
Supplement
(41009 KB) - BibTeX
- EndNote


The hydroclimate of tropical South America is strongly influenced by ocean–atmospheric variability modes (climate drivers), for instance, El Niño–Southern Oscillation (ENSO) (Cai et al., 2020; Garreaud et al., 2009; Grimm and Zilli, 2009). Other sources of seasonal variability stem from other ocean basins (e.g. the Atlantic, Indian Ocean) and at other temporal scales, from the Madden–Julian Oscillation, or from local features like topography or land–atmosphere interactions (Pabón and Dorado, 2008; Cai et al., 2019). The modes cause impacts through atmospheric circulation anomalies and thus drive local atmospheric conditions; the latter enforces hydrological variability, which is evidenced by anomalies of precipitation, soil moisture (SM), surface temperature, evapotranspiration, and streamflow. The atmospheric anomalies might also influence extreme events (e.g. droughts and floods) (Merz et al., 2021; Mishra and Singh, 2010), and their consideration in long-term planning is critical for achieving sustainable development.
Among the hydrological fluxes, terrestrial evaporation is key to the water, energy, and carbon cycles (Wang and Dickinson, 2012). This flux mainly consists of evaporation from soil, interception, and plant transpiration (hereafter all jointly referred as evapotranspiration – ET). Limitations of ET influence growth processes and hence carbon uptake; previous studies have linked net primary or biome production variability to SM–atmosphere feedbacks and climate/earth system drivers, e.g. through climate-driven droughts (Nemani et al., 2003; Humphrey et al., 2021; Zhao and Running, 2010). There is evidence that individual extreme-weather events can coerce plant phenology, for instance, flowering, leaf senescence, and plant growth (Ummenhofer and Meehl, 2017). Therefore, to predict ecosystem activity, it is essential to identify the mechanisms of internal climate variability drivers that cause a response in ET. Moreover, estimating the response of ET to climate variability drivers is also necessary to unravel the effects of climate change on hydrology (IPCC, 2021) and to estimate irrigation requirements (Kaune et al., 2019).
In the following, we consider oceanic variability modes in the Pacific and Atlantic as drivers of the climate variability in the Amazon and Orinoco basins (Lübbecke et al., 2018). Some studies statistically looked at the Pacific and Atlantic joint effects on precipitation (Gu and Adler, 2009; Ronchail et al., 2002). Others studied the interannual changes in moisture transport dynamics – imposed by oceanic climatic drivers – and their associated rainfall anomalies over South America (Hoyos et al., 2019; Ruiz-Vásquez et al., 2024). Atlantic trade wind strength and the precipitation anomalies are related to ocean variability modes such as the Tropical North Atlantic mode (TNA) (Arias et al., 2015, 2020; Enfield, 1996), the Atlantic Meridional Mode (AMM) (Chiang et al., 2002; Fernandes et al., 2015; Rodrigues and McPhaden, 2014; Paccini et al., 2021; Drumond et al., 2014), and the Atlantic Niño Equatorial mode (Atl3) (Ruiz-Barradas et al., 2000; Torralba et al., 2015; Vallès‐Casanova et al., 2020). The Atlantic modes tend to be active and peak between the austral autumn and spring – MAM, JJA, and SON (the initial letters of the months) – contrary to ENSO, which peaks at the end of the year (SON and D(0)JF(+1)). These Atlantic modes might have contributed to northeast Brazil droughts and the Magdalena River floods in 2011–2012, as well as the Amazon droughts in 2005 and 2010 (Lopes et al., 2016; Marengo and Espinoza, 2016). Although the Atlantic modes are associated with ENSO through atmospheric bridges or extratropical pathways (Compo and Sardeshmukh, 2010; Martín-Rey et al., 2014; García-Serrano et al., 2017; Casselman et al., 2023), each of them has specific regional impacts on sea level pressure (SLP) and hence on atmospheric circulation.
However, the variability in evapotranspiration has received less attention than precipitation. Previous research has established SM and net radiation (Rn) as the primary local controllers of ET (Seneviratne et al., 2010; Hirschi et al., 2014); consequently, ET is classified into two regimes: water limited or energy limited. The annual cycle and the location of the regimes are not known in South America and are important to understand ET variability. Some studies have statistically investigated the teleconnections of ENSO (Moura et al., 2019; Le and Bae, 2020; Miralles et al., 2014) or other climate drivers with the ET around the world (Martens et al., 2018), but the physical causes of these connections are not known. Specifically, it is not known how the interannual changes in moisture transport impact net radiation. In our paper, we focus on the Atlantic modes, which have received less attention in the literature. Moisture recycling is another factor that can impact surface radiation, but previous studies have focused on its impact on regional and distant precipitation rather than on radiation (Staal et al., 2018; Wang-Erlandsson et al., 2018; Zemp et al., 2014; van der Ent and Savenije, 2011). Other research has looked at the influence of Amazon soil moisture memory on ET (Zanin et al., 2024) or how anomalous moisture transport from the TNA affects SM and vegetation indices (Arias et al., 2020), but other Atlantic modes have been overlooked.
Consequently, it is still not known how the variations in regional atmospheric circulation – driven by the Atlantic modes – alter local continental atmospheric conditions and afterwards affect net surface radiation and soil moisture, the two key local controllers of ET. We refer to the latter as the physical mechanisms of the teleconnection, which consist of a chain of progressive physical processes. Ecological processes respond to the variability in hydrometeorological conditions (Eagleson, 2013); by understanding the mechanisms leading to that variability, the community can increase the potential predictability of ecosystem activity. Therefore, this study aims to investigate the physical causes of the link of the AMM and Atl3 with ET in tropical South America at seasonal scale. Other drivers (the Indian Ocean Dipole mode, the Atlantic Multidecadal Oscillation (AMO), etc.) are excluded from our study (see Sects. 3 and 5). Moisture recycling is only briefly discussed in Sect. 5. We aim to answer the following questions:
-
Where and in which season is the evapotranspiration dominated by a water- or energy-limited regime?
-
How do the Atlantic modes drive anomalous atmospheric circulation and influence the variability in local atmospheric conditions, and how do they then affect the local controllers and thus affect evapotranspiration?
-
Where do the dynamics and, thus, the impacts of the Atlantic modes overlap with those of ENSO in time and space?
This study uses net radiation, soil moisture (SM), and ET, as well as atmospheric circulation variables, such as SLP, winds, moisture transport, convergence, and rainfall. We use those atmospheric variables because ocean–atmospheric modes drive the regional atmospheric circulation, which afterwards influences the local ET controllers. Sea surface temperature anomalies (SSTAs) are used to identify the ocean–atmospheric modes (Sect. 3). All datasets are downloaded at the monthly timescale and used between December 1979 and November 2020 (except for satellite-based soil moisture; details are in Sect. 2.2); they are aggregated at the seasonal scale and are analysed for each season individually and synchronously. The aggregation method for all variables is the average of the three monthly values, except for precipitation and ET, where we use the sums (Duque-Gardeazabal, 2025).
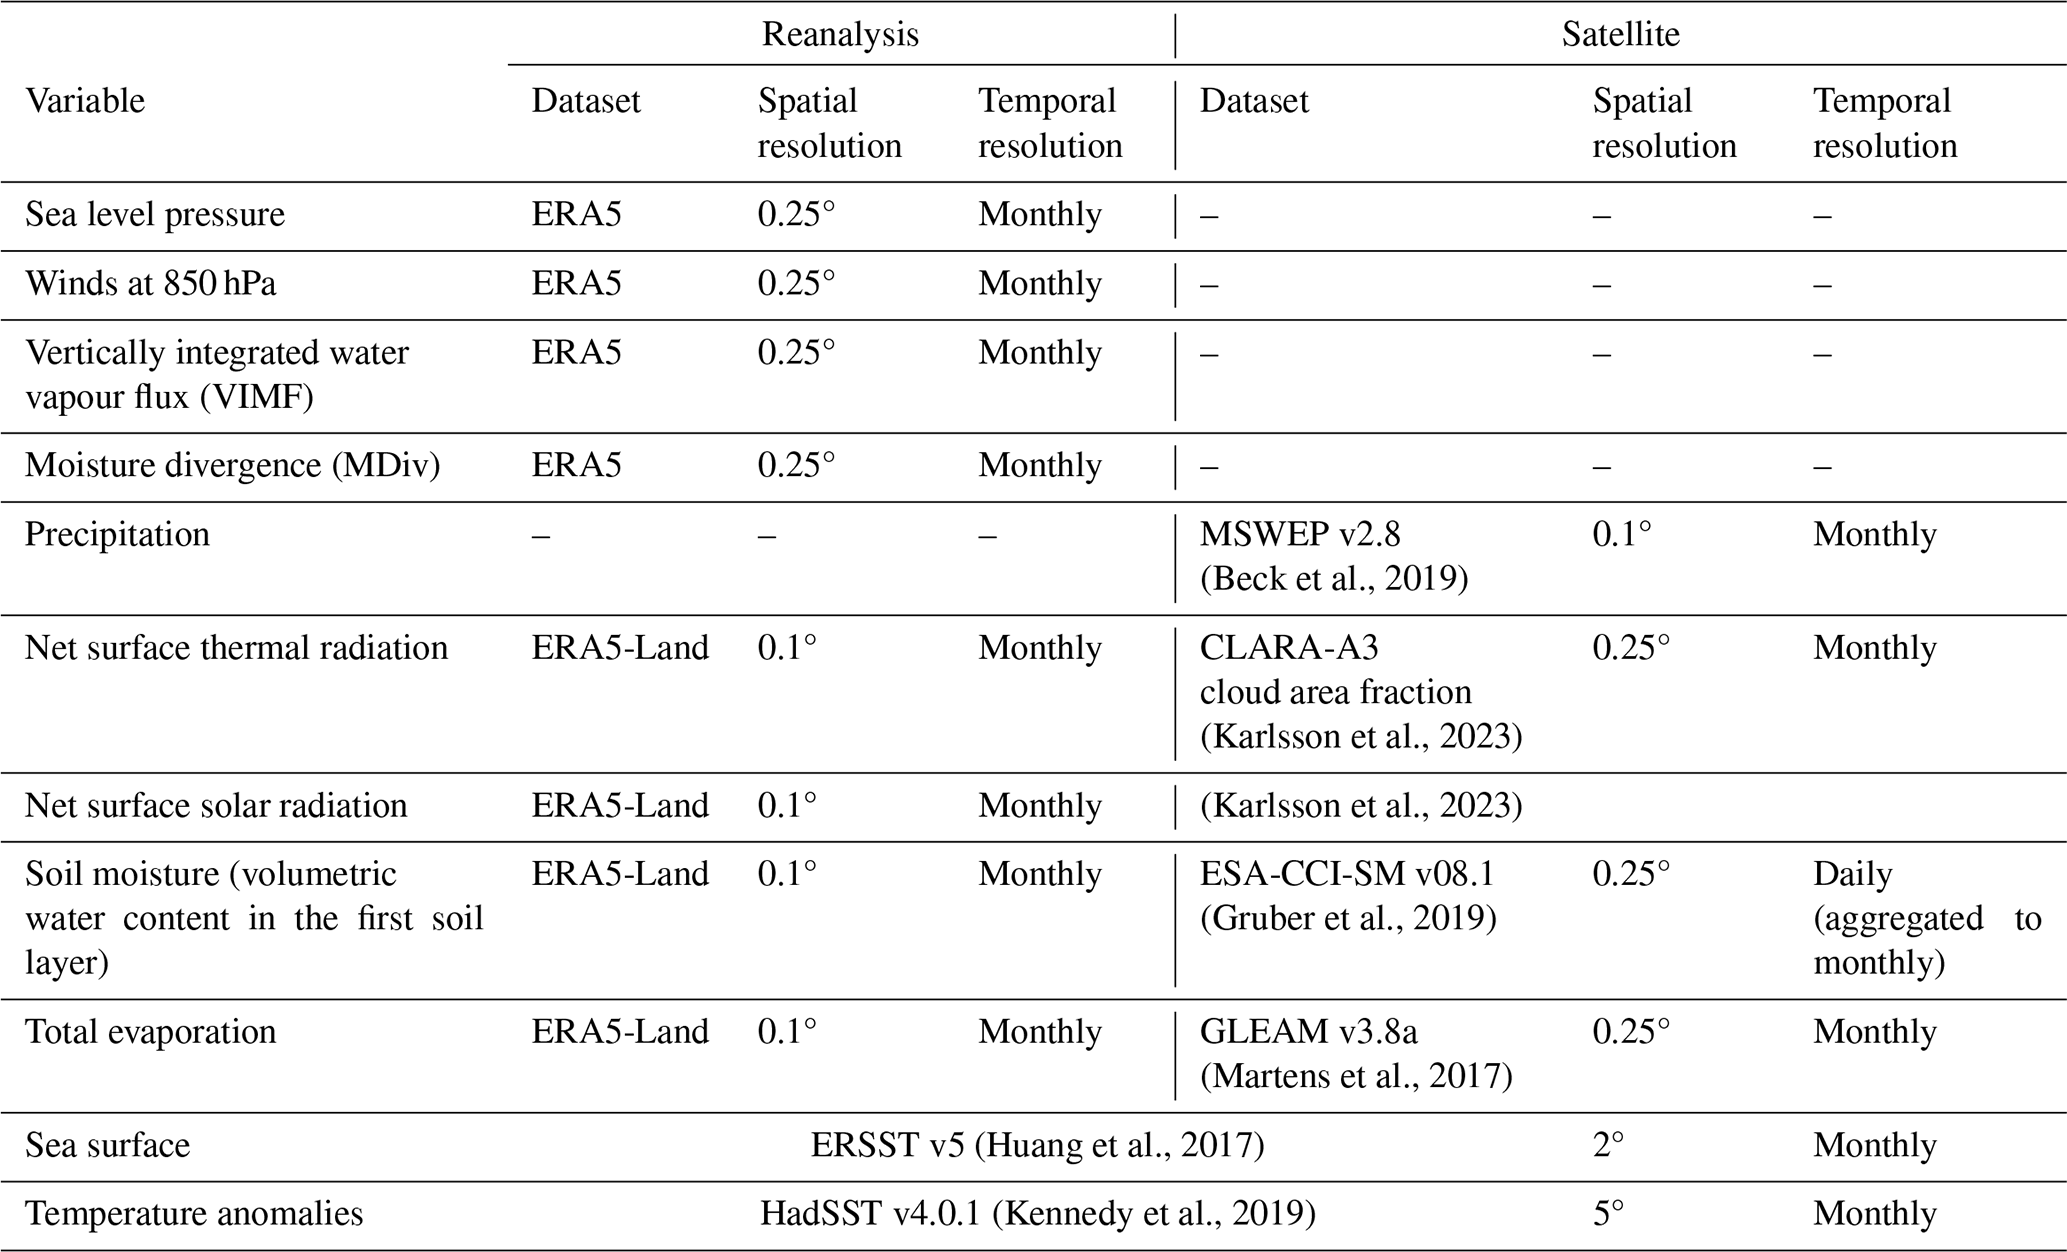
Satellite and reanalysis data sources each have strengths and limitations. Satellite data can provide some of the needed data, mainly over land, but moisture transport is not available from this source. Reanalysis data are considered physically based interpolations of observations and provide atmospheric variables that satellites do not directly acquire. Satellite-based datasets have difficulties measuring soil moisture over densely forested canopies (Beck et al., 2021). Errors in the root zone SM compromise the estimation of plant water stress and, thus, the skill of the ET estimate. On the other hand, simulations of ET that ingest reanalysis outputs might inherit their biases (Gebrechorkos et al., 2024; Valencia et al., 2023). Although the performance of both data sources has improved in recent years (Beck et al., 2021; Xie et al., 2024), their estimates remain uncertain, and confidence in their inter-annual dynamics rests on the fact that the analysed signals are evident in independent datasets. Therefore, we look for consistency in the dynamics of both sources of information; we do not regrid and do not merge any datasets because we do not perform operations between them. We display the datasets conjointly when necessary and analyse the dynamics unfolding in both data sources (Table 1).
We use SSTAs from the Extended Reconstructed SST version 5 (Huang et al., 2017) – which is used as the primary dataset – and the Hadley Center Sea Ice and SST version 4.0.1 (Kennedy et al., 2019). ERSST is at a 2°, and HadSST is at a 5° resolution.
(Beck et al., 2019)(Karlsson et al., 2023)(Karlsson et al., 2023)(Gruber et al., 2019)(Martens et al., 2017)(Huang et al., 2017)(Kennedy et al., 2019)Table 1Overview of the datasets used in this study. ERA5 is described in Hersbach et al. (2020), and ERA5-Land is in Muñoz-Sabater et al. (2021) and ECMWF (2023).
2.1 Reanalysis
The European Centre for Medium-range Weather Forecasting (ECMWF) ERA5 reanalysis provides information on atmospheric variables that influence the local controllers of evapotranspiration and also relate to the dynamics of the coupled ocean–atmospheric modes (Hersbach et al., 2020). Monthly time series of winds, vertically integrated water vapour flux (VIMF), mean SLP, and vertically integrated moisture flux divergence (MDiv) are taken from it. All atmospheric variables from ERA5 have a 0.25° spatial resolution.
ERA5-Land is a land–surface simulation operationally forced by ERA5, which includes detailed modules on infiltration, four-layer physically based soil water storage, plant water uptake, phenology and transpiration, and evaporation from soil and canopy interception (Muñoz-Sabater et al., 2021; ECMWF, 2023). From it, we download or derive the net surface radiation (Rn), the volumetric soil water content in the first soil layer (hereafter soil moisture – SM), and the total evaporation (hereafter also referred to as evapotranspiration – ET). All variables from ERA5-Land have a 0.1° resolution.
2.2 Satellite
This research uses the Multi-Source Weighted-Ensemble Precipitation v2.8 (MSWEP) (Beck et al., 2019) with a spatial resolution of 0.1°. The dataset is created using rain gauge, satellite, and reanalysis data. MSWEP uses ERA5 rainfall estimates mainly in the extratropics, whereas the ingested satellite data are given stronger weight in the tropics.
In addition, we use three satellite-based datasets: the European Space Agency Climate Change Initiative for Soil Moisture v08.1 (ESA-CCI-SM) (Gruber et al., 2019), total evaporation from the Global Land Evaporation Amsterdam Model v3.8a (GLEAM) (Martens et al., 2017), and the EUMETSAT CLARA-A3 cloud area fraction as a proxy for net radiation (Karlsson et al., 2023), all of them at a 0.25° resolution. ESA-CCI-SM was downloaded at a daily resolution and transformed to monthly values by averaging the days within each month as long as the month had at least four values; the remaining spatial gaps were not filled and were excluded from calculations. GLEAM uses a three-layer conceptual root zone soil module from which vegetation can access water (which considers ESA-CCI-SM assimilation where available). It includes a module for plant stress based on SM and vegetation phenology, and it also provides evaporation from interception and bare soil. GLEAM uses the ERA5 radiation as forcing.
Some eddy-covariance towers are located in the Amazon and other places in South America; their measurements are – in general – after 2000. Baker et al. (2021) managed to use records from one tower with 19 years of data (1999–2017) but highlighted the fact that the data from the other towers were only available for a few years (mainly between 1999 and 2006). Other global products based on FLUXNET towers, such as FLUXCOM (Jung et al., 2019), also have data after 2001. The short time series constrains the possibility of registering several events to analyse the effect of the climate modes (few degrees of freedom). The performance of GLEAM and ERA5-Land ET has been evaluated against eddy-covariance towers and has found correlations of around 0.6 and 0.7 for the evergreen broadleaf forest ecoregion (Muñoz-Sabater et al., 2021; Xie et al., 2024). Therefore, we choose not to analyse eddy-covariance data and assume fair performance of the other two sources.
Climate modes and their atmospheric circulation anomalies are expected to impact evapotranspiration through a chain of progressive physical processes. The processes start with anomalies in atmospheric circulation (coupled with SSTAs) and moisture transport (VIMF). Then, the latter changes moisture flux divergence (MDiv), affecting cloud formation, which simultaneously influences precipitation and radiation availability. Precipitation then affects soil moisture, and afterwards, the two local controllers impact evapotranspiration. However, the impacts of the chain are also mediated by the climatological cycle of the ET regime (water limited or energy limited). Consequently, our research starts by determining the annual cycle of the ET regime and of the local controllers (Sect. 3.1). Then, we use composites to show how the chain unfolds, with its final impacts on ET (Sect. 3.2). Finally, we study the joint effects of the Atlantic modes and ENSO (Sect. 3.3) (Duque-Gardeazabal, 2025). Moisture recycling is discussed in Sect. 5.
3.1 Determining the location and annual cycle of local ET controllers
This study explores the two main local controllers of ET (soil moisture and net radiation) (Seneviratne et al., 2010) to afterwards search for the ocean–atmospheric modes that drive those controllers. SM and net radiation are classified by the slope of their multi-linear regression against evapotranspiration, using their seasonally standardised anomalies. This analysis can suggest whether the ET anomalies are associated with water availability or a radiation anomaly (ET regime). The multiple linear regression is then expressed as
where ET is the total evaporation, SM is the volumetric soil water content in the first layer, Rn is the surface net radiation, i refers to a specific longitude, and j refers to a specific latitude. a and b are then the regression slope coefficients and C the intercept.
3.2 Composites
This study uses composite analysis to exemplify the state of the atmosphere and the land surface during the active phase of the Atlantic modes. The composites reveal the physical processes/mechanisms that connect the variables.
Coupled ocean–atmospheric modes are identified by SSTA indices. The SSTAs are first detrended to exclude the effect of climate change from the analysis, using a regression with de-seasonalised CO2 (R2=0.92, p<0.001) (Thoning et al., 1989); the CO2 concentration is used to consider its continuous change in the 20th and 21st century and to avoid subtracting the internal variability. We performed principal component analysis over the detrended Atlantic SSTAs, and the resulting loadings were compared with the literature review (Fernandes et al., 2015; Vallès‐Casanova et al., 2020; Ruiz-Barradas et al., 2000) (Supplement Fig. S8). Correlation analysis between the principal components and hydrological variables revealed which modes possibly have an impact on South America (not shown). Other climate modes, such as the Indian Ocean Dipole or the AMO, unfold over basins that are not close to our study area, and hence, they do not alter tropical South America's atmospheric circulation. Consequently, we discard them from our analysis. We define the Atlantic indices based on SSTA area-average boxes similar to the principal component loadings of the Atlantic SSTs (Fig. S8).
-
The AMM monthly index is defined as the difference between the spatially averaged Tropical North Atlantic (TNA) SSTAs (5–25° N, 70–15° W) and those of the Tropical South Atlantic (TSA) (25–5° S, 40–0° W); the spatial definition of the AMM comprises the TNA.
-
The Atl3 monthly index is identified as the spatial average of eastern equatorial Atlantic SSTAs (3° S–3° N, 20° W–0°).
To define the composite time steps, the phases of each mode are established based on the indices. The positive and negative phases are identified when their indices are above or below ±1 standard deviation, respectively, and otherwise are defined as neutral phase. The latter is defined individually for each season (index time series in Fig. S8). The asymmetric impacts of the modes are assessed by adding both extreme phases (positive plus negative), allowing recognition of the different impacts exerted by each phase. The composite's statistical significance is assessed with the two-sample Student two-tailed t test, testing the positive or negative phase against the neutral. Regarding precipitation, half of the cell's time series has skewed distributions (Shapiro–Wilk test, not shown). Thus, the Mann–Whitney U test is used instead. We did not find a significant correlation between evapotranspiration and CO2. Nevertheless, ET time series are detrended with a linear trend to also exclude global warming (Zhang et al., 2016) before being used in the composites.
ENSO develops in the second semester, and its peak season is DJF. On the other hand, the AMM is more active from February onwards but might last until SON (Yoon and Zeng, 2010), and the Atl3 is more active in JJA (Vallès‐Casanova et al., 2020). In DJF, the AMM-associated anomalies are evident over the Atlantic, but its effect over the continent is diluted (not shown). Therefore, we analyse the influence of the Atlantic modes from March to September.
3.3 Conjoint effect with ENSO
We also perform a grid-wise partial correlation analysis between the two Atlantic indices, the El Niño Longitude Index (ELI) (Williams and Patricola, 2018), and evapotranspiration. The ELI considers the type of ENSO event (east or central Pacific). The purpose of this analysis is to find those regions that are driven by an Atlantic mode but might also have impacts from another mode when it is also active (i.e. simultaneously controlling the analysis by the effect of ENSO and the other Atlantic mode).
4.1 Key local evapotranspiration controllers
The classification of the ET regime follows the migration of the Intertropical Convergence Zone (ITCZ, located in the southern Amazon in DJF and over northern Orinoco in JJA) (Fig. 1). The reason is associated with the heavy rainfall in the ITCZ, which saturates the soils and influences the locations of the energy-limited regime. Panels (a) to (h) in Fig. 1 show the slope coefficients of the regressions, which are then ranked in panels (i) to (l). Values below 0 indicate that the other independent variable is the main controller of ET. In MAM (Fig. 1a, e, i), the northeasterly winds bring moisture from the Atlantic and produce convergence and rainfall over the Amazon in such amounts that the soil saturates (and thus is above the soil's water field capacity), giving the conditions for energy-limited ET. However, the north of the Orinoco basin still behaves like a water-limited environment. As the ITCZ moves northward in JJA (Fig. 1b, f, j), the rainfall recharges SM, changing Orinoco's behaviour to an energy-limited regime, whereas other regions transform from energy- to water-limited regimes, such as northeast Brazil and the southern Amazon. The core of the Amazon rainforest is energy limited throughout the year. In SON (Fig. 1c, g, k), the ITCZ begins to move southward, but the energy-limited regime is concentrated in the west of the Amazon. The east and southeast basins are still in a water-limited regime. The Orinoco still behaves in an energy-limited way even though this is the transition season from wet to dry. In DJF (Fig. 1d, h, l), the ET in the southern Amazon depends on the available energy, as the ITCZ has reached its southern continental location; above-average net radiation (Rn) would produce more ET. The energy-limited regions correspond to those where SM is above the soil's field capacity (ECMWF, 2023) (not shown), and not all of the continent is primarily controlled by variations in energy supply.
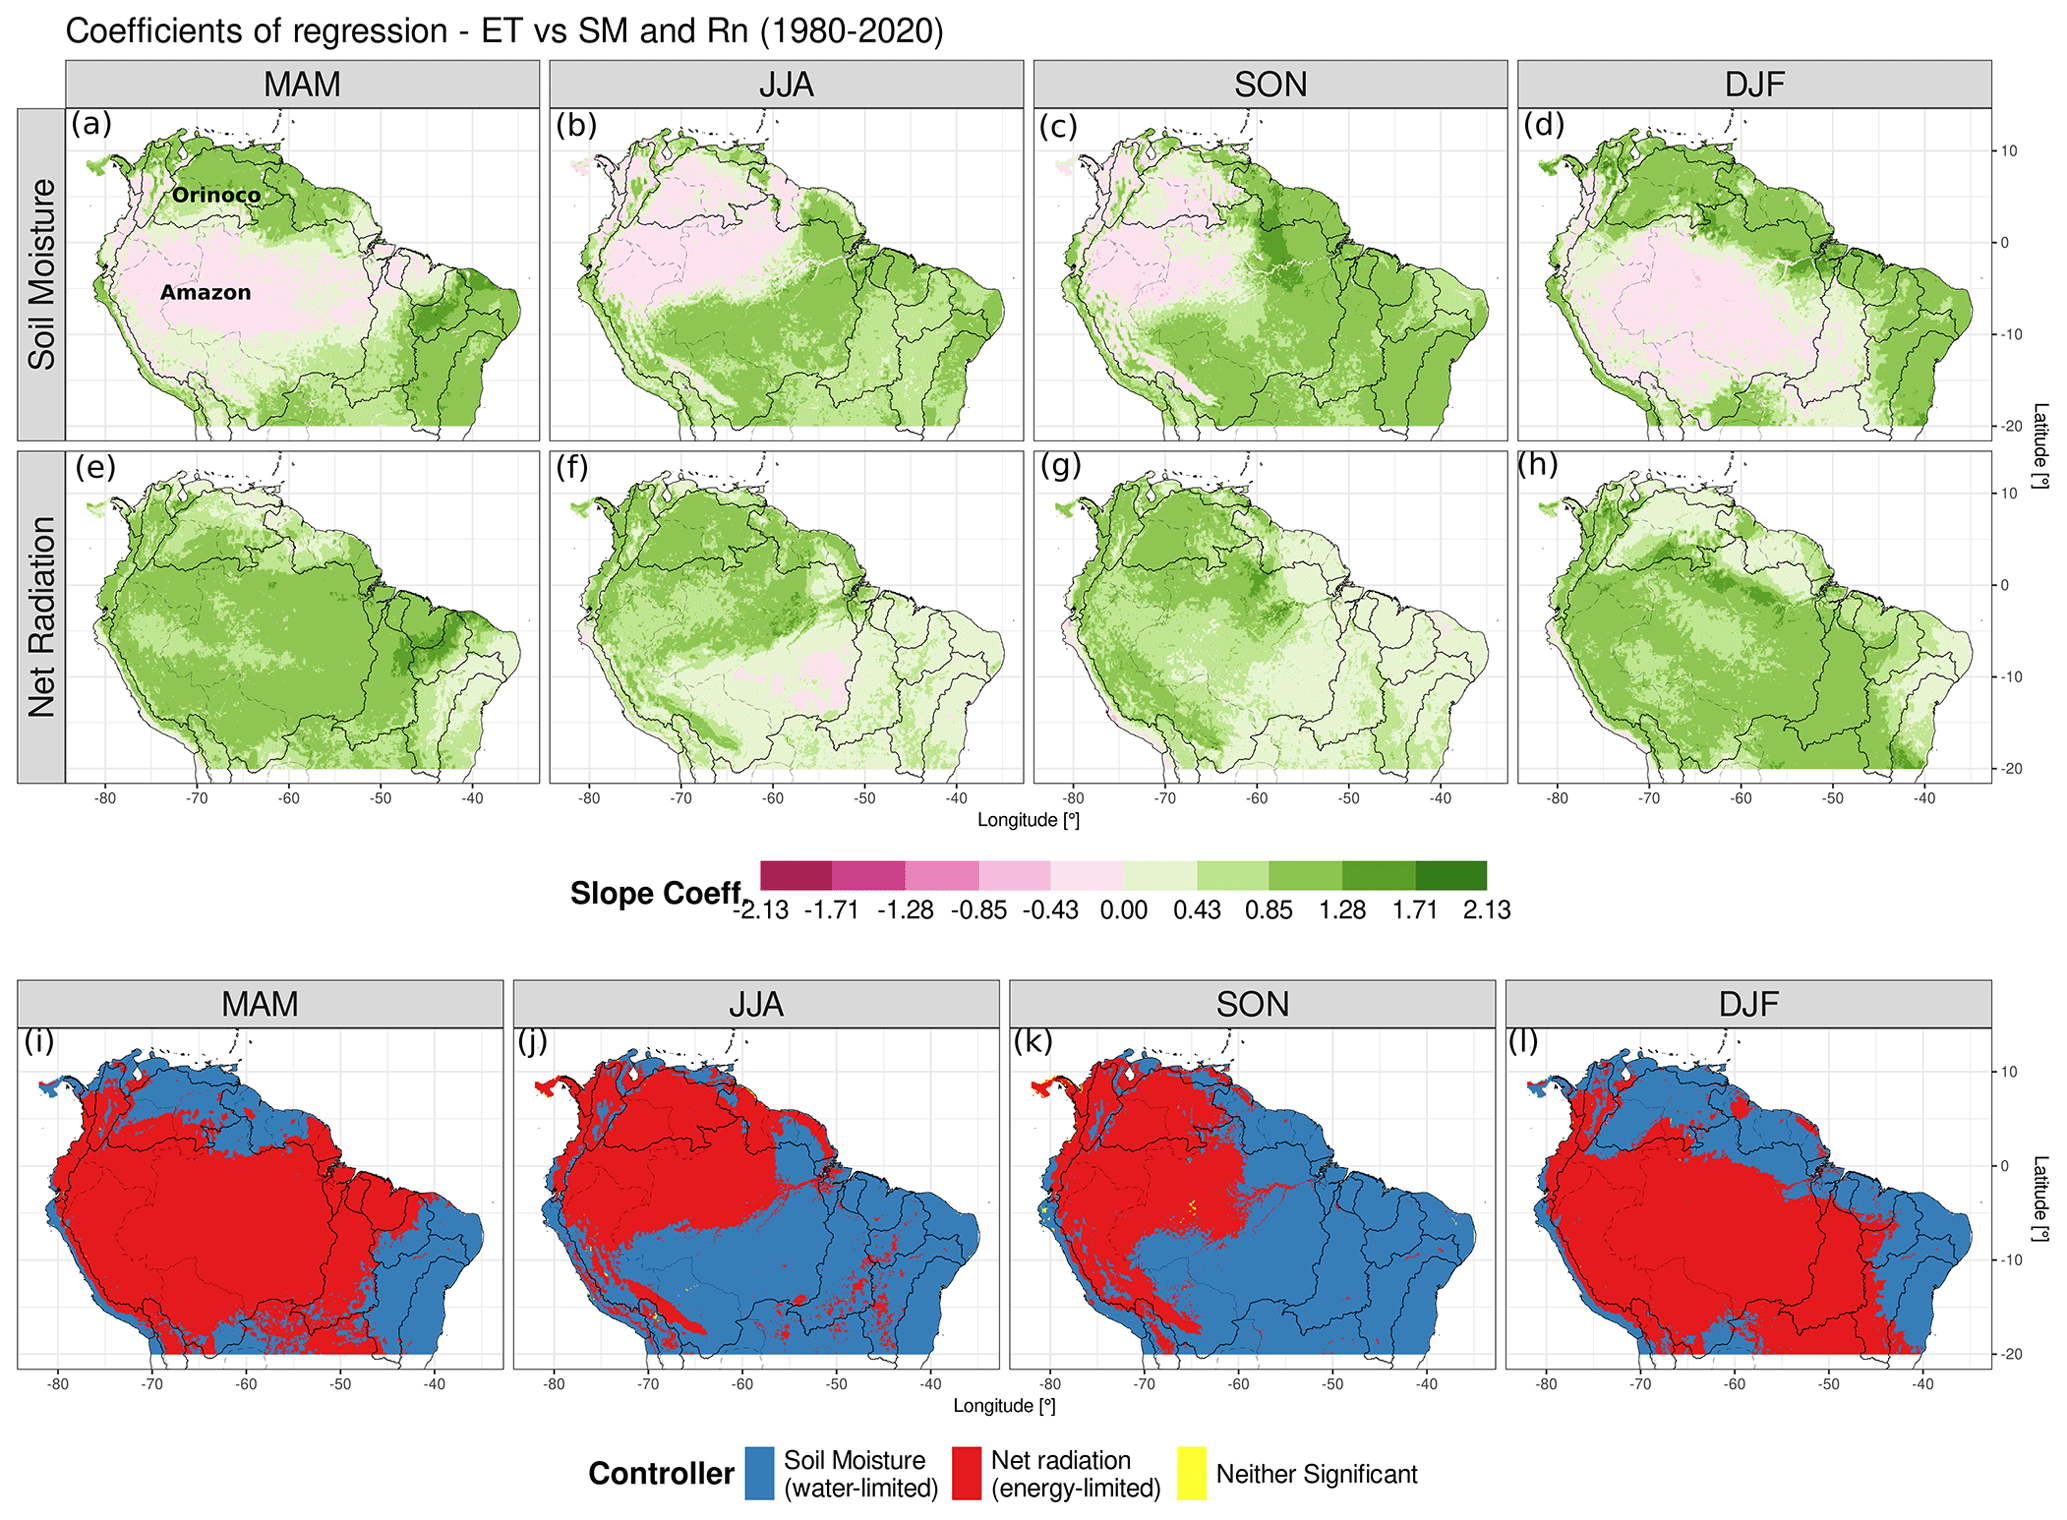
Figure 1Classification of the ERA5-Land evapotranspiration (ET) controller based on regression coefficients for each season. (a–d) Multiple linear regression slope coefficient for soil moisture (SM), (e–h) the slope coefficient for the net radiation (Rn), and (i–l) the variable with the highest significant linear slope coefficient (p≤0.05). Panels are divided by season: panels (a, e, i) for MAM, panels (b, f, j) for JJA, panels (c, g, k) for SON, and panels (d, h, l) for DJF. Black lines delineate the major river basins; the same boundaries are used in the following figures.
4.2 Chain of physical processes between the Atlantic modes and continental evapotranspiration
This section shows the composites of the variables involved in the chain (see Sect. 3). The steps in the chain repeat as long as a mode is active. However, the impacts have important geographical differences depending on the mode and the season analysed.
4.2.1 March–May (MAM): austral autumn
The Atlantic Meridional Mode (AMM) consists of an SST and SLP seesaw between the tropical North and South Atlantic, creating cross-equatorial wind anomalies (see Fig. S1 for SLP and 850 hPa winds composites). In austral autumn, the positive phase redirects and advects moist air northward, towards the Orinoco, where it provokes positive convergence and precipitation anomalies (Fig. 2a). The locations of the satellite precipitation and reanalysed convergence anomalies are consistent in both datasets. The positive convergence creates more clouds that then reduce net surface radiation (Fig. 2c). Soil moisture (SM) is impacted by the anomalous rainfall; Fig. 2e shows that the SM anomalies in northern Orinoco are sensitive to the AMM in the positive phase. ESA-CCI-SM is available for this region and shows similar dynamics (Fig. S2). The western and southern Amazon have SM anomalies lower than a 2 % absolute value, as it is the rainy season and the soil is near saturation.
The evapotranspiration is impacted afterwards. The Orinoco behaves in a water-limited way (Fig. 1i) since this is the transition from the dry to the wet season; then the increase in rainfall and SM causes above-average ET (Fig. 2g). Over northeast Brazil, the positive phase produces divergence anomalies and less cloud cover (Fig. 2a and c). The latter increases radiation but causes higher evapotranspiration than average due to the high SM availability above the soil's field capacity, which allows the region to act in an energy-limited way (Figs. 1i and 2g). GLEAM independently shows similar results over northern Orinoco – a more extended increase in ET – but over northeast Brazil, the area with increased ET is smaller than in ERA5-Land and is surrounded by negative anomalies (Fig. S3). We will examine the box-area-averaged time series in Fig. 6.
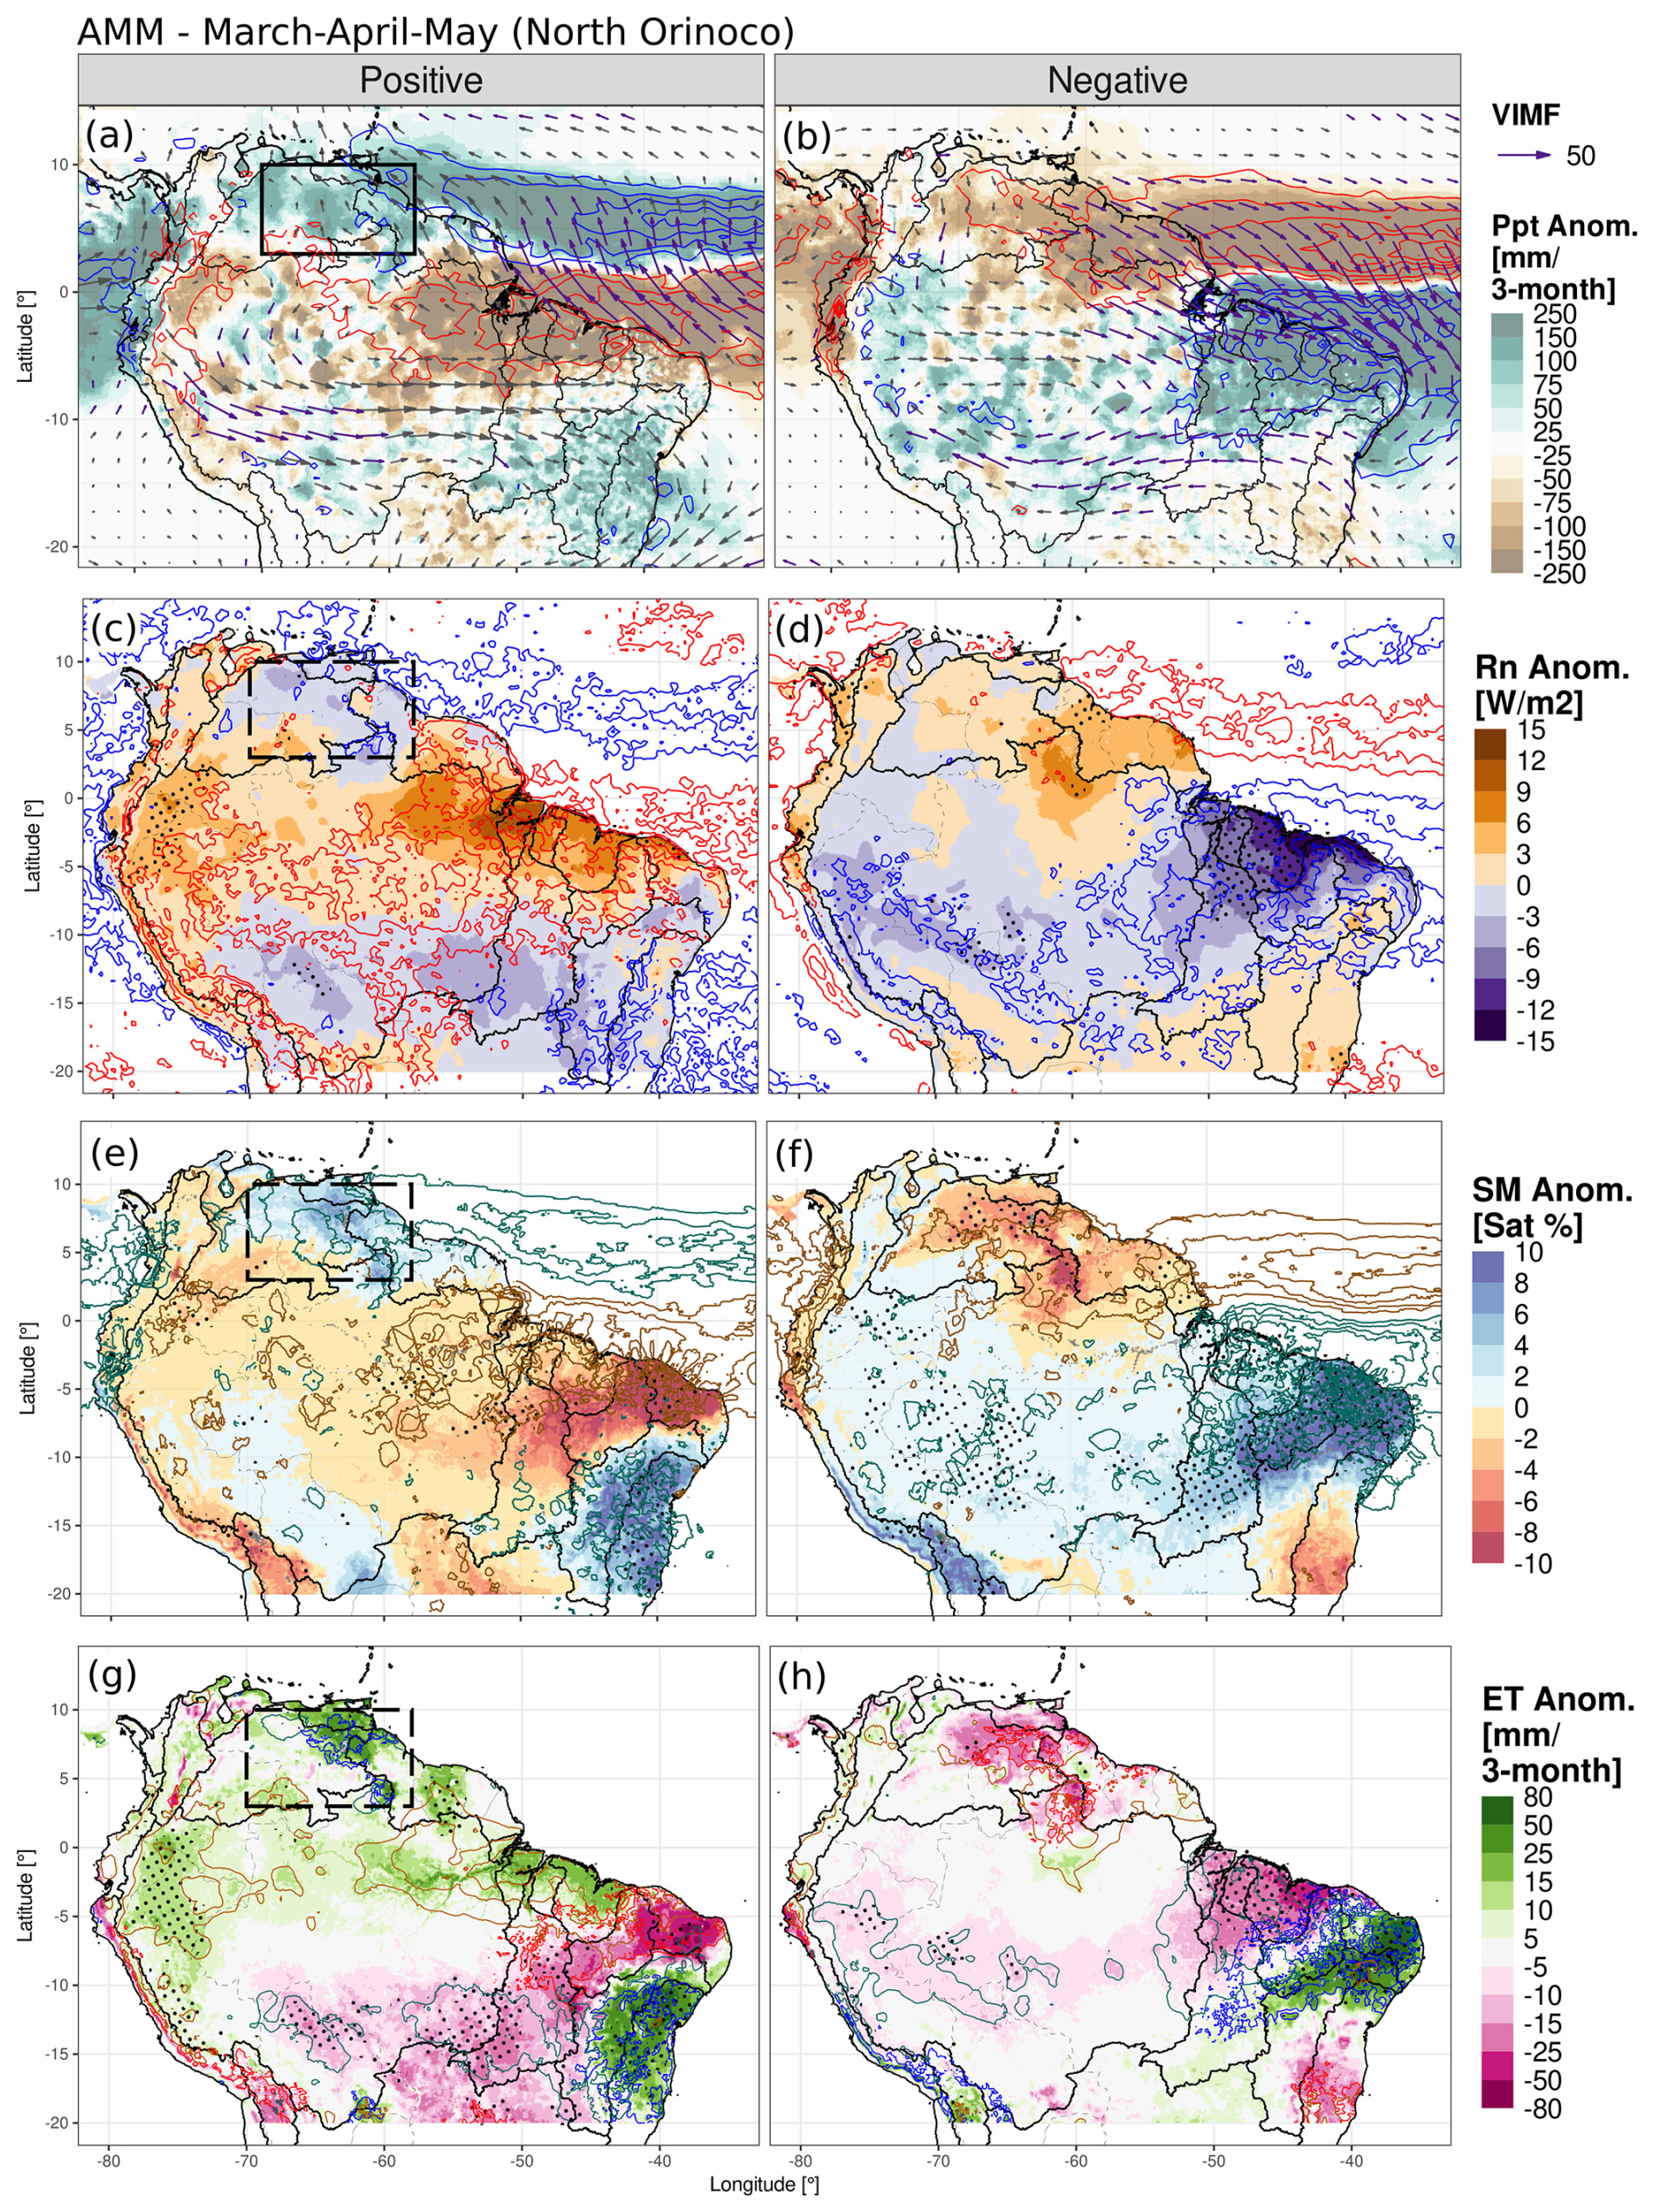
Figure 2Anomaly composites of AMM in MAM for (a) VIMF (arrows), MDiv (contours), and MSWEP precipitation (shading) anomalies in the positive phase; positive MDiv anomalies are in red and negative in blue every 3 kg m−2. VIMF is in kg m−1 s−1; it is depicted in purple when it is statistically significant at a 90 % confidence level and in grey otherwise. The right panels (b, d, f, and h) are the same as the left panels (a, c, e, and g) but for the negative phase. (c, d) ERA5-Land surface net radiation (shading) and satellite CLARA cloud cover anomalies (contours): positive cloud cover anomalies are in blue and negative in red, repeated every 4 %. (e, f) Composites of ERA5-Land soil moisture anomalies in saturation percentage (shading), and MSWEP precipitation anomalies (contours): positive precipitation anomalies are drawn in aquamarine and negative in gold, repeated every 100 mm. (g, h) Composites of ERA5-Land evapotranspiration (shading), Rn anomalies (contours: gold for positive and aquamarine for negative), and SM anomalies (contours: blue for positive and red for negative): Rn anomalies are repeated every 3 W m−2, and SM anomalies are repeated every 5 %. In every panel, black stippling depicts regions where the shaded variable is significantly different from the neutral phase at a 95 % confidence level. Boxed region: northern Orinoco, also applies for the negative phase.
In the negative phase, the AMM redirects the VIMF southward towards northeast Brazil (Fig. 2b). The anomalous winds generate greater moisture convergence, which reduces radiation and then ET over that region (Fig. 2b, d, and h). Over the northern Orinoco, the southward moisture advection causes a reduction in rainfall and below-average SM, further limiting ET. The eastern Amazon evapotranspiration is not affected in the same way as in the positive phase (asymmetry). However, GLEAM estimates show that in northeast Brazil, the impacted area is not as big as in ERA5-Land and does not show ET anomalies where the ESA-CCI-SM was unable to detect values (Figs. S2 and S3).
Comparing positive and negative phases, the mode shows asymmetric atmospheric circulation, with the negative phase being stronger in magnitude for the VIMF (Fig. S7). The latter causes a decrease in SM over the northeast Amazon that is higher than the increase in the positive phase, considering absolute values. Regarding ET, some regions are affected only in one phase of the mode, such as the eastern Amazon and its river delta.
4.2.2 June - August (JJA): austral winter
The Atlantic Niño (Atl3) is characterised by a decrease in SLP and an increase in SST over the equatorial east Atlantic that usually peaks in JJA (Fig. S1). It weakens the trade winds through the Bjerknes feedback, with effects on VIMF and precipitation over the continent (Fig. 3a). SM and evapotranspiration are not extensively impacted by the Atl3 positive phase, as changes in radiation are barely visible (Fig. 3c, e, and g). The Atl3 impacts are not clear in other seasons (SON and DJF), when the AMM and ENSO exert a more discernible influence (not shown).
Conversely, stronger JJA trade winds increase Ekman pumping and mixing over the Atlantic and manifest as colder SST (known as the Atlantic Niña – Atl3 negative phase). The strengthened easterly winds – and VIMF – create negative anomalies of convergence and precipitation in an extended region over the east of the continent (Fig. 3b). However, greater MDiv and radiation increase ET over the eastern Orinoco and the Guianas due to the energy-limited environment, whereas over northeast Brazil and the eastern Amazon, the anomalies are negative, as they behave in a water-limited way, and the SM is also lower than average (Figs. 1j and 3d, f, and h). ESA-CCI-SM is not available over the Guianas and is partially available over northeast Brazil (Fig. S2), and GLEAM shows a similar pattern to that of ERA5-Land, but the signal is weaker over the eastern Orinoco, Amazon delta, and northeast Brazil (Fig. S3). The negative phase is more pronounced due to stronger anomalies in all three variables (Fig. S7 for asymmetric conditions). The ET between the two phases is very asymmetric, as the eastern Orinoco and northeast Brazil are not affected in the positive phase, but they are in the negative (Figs. 3g and h and S7).
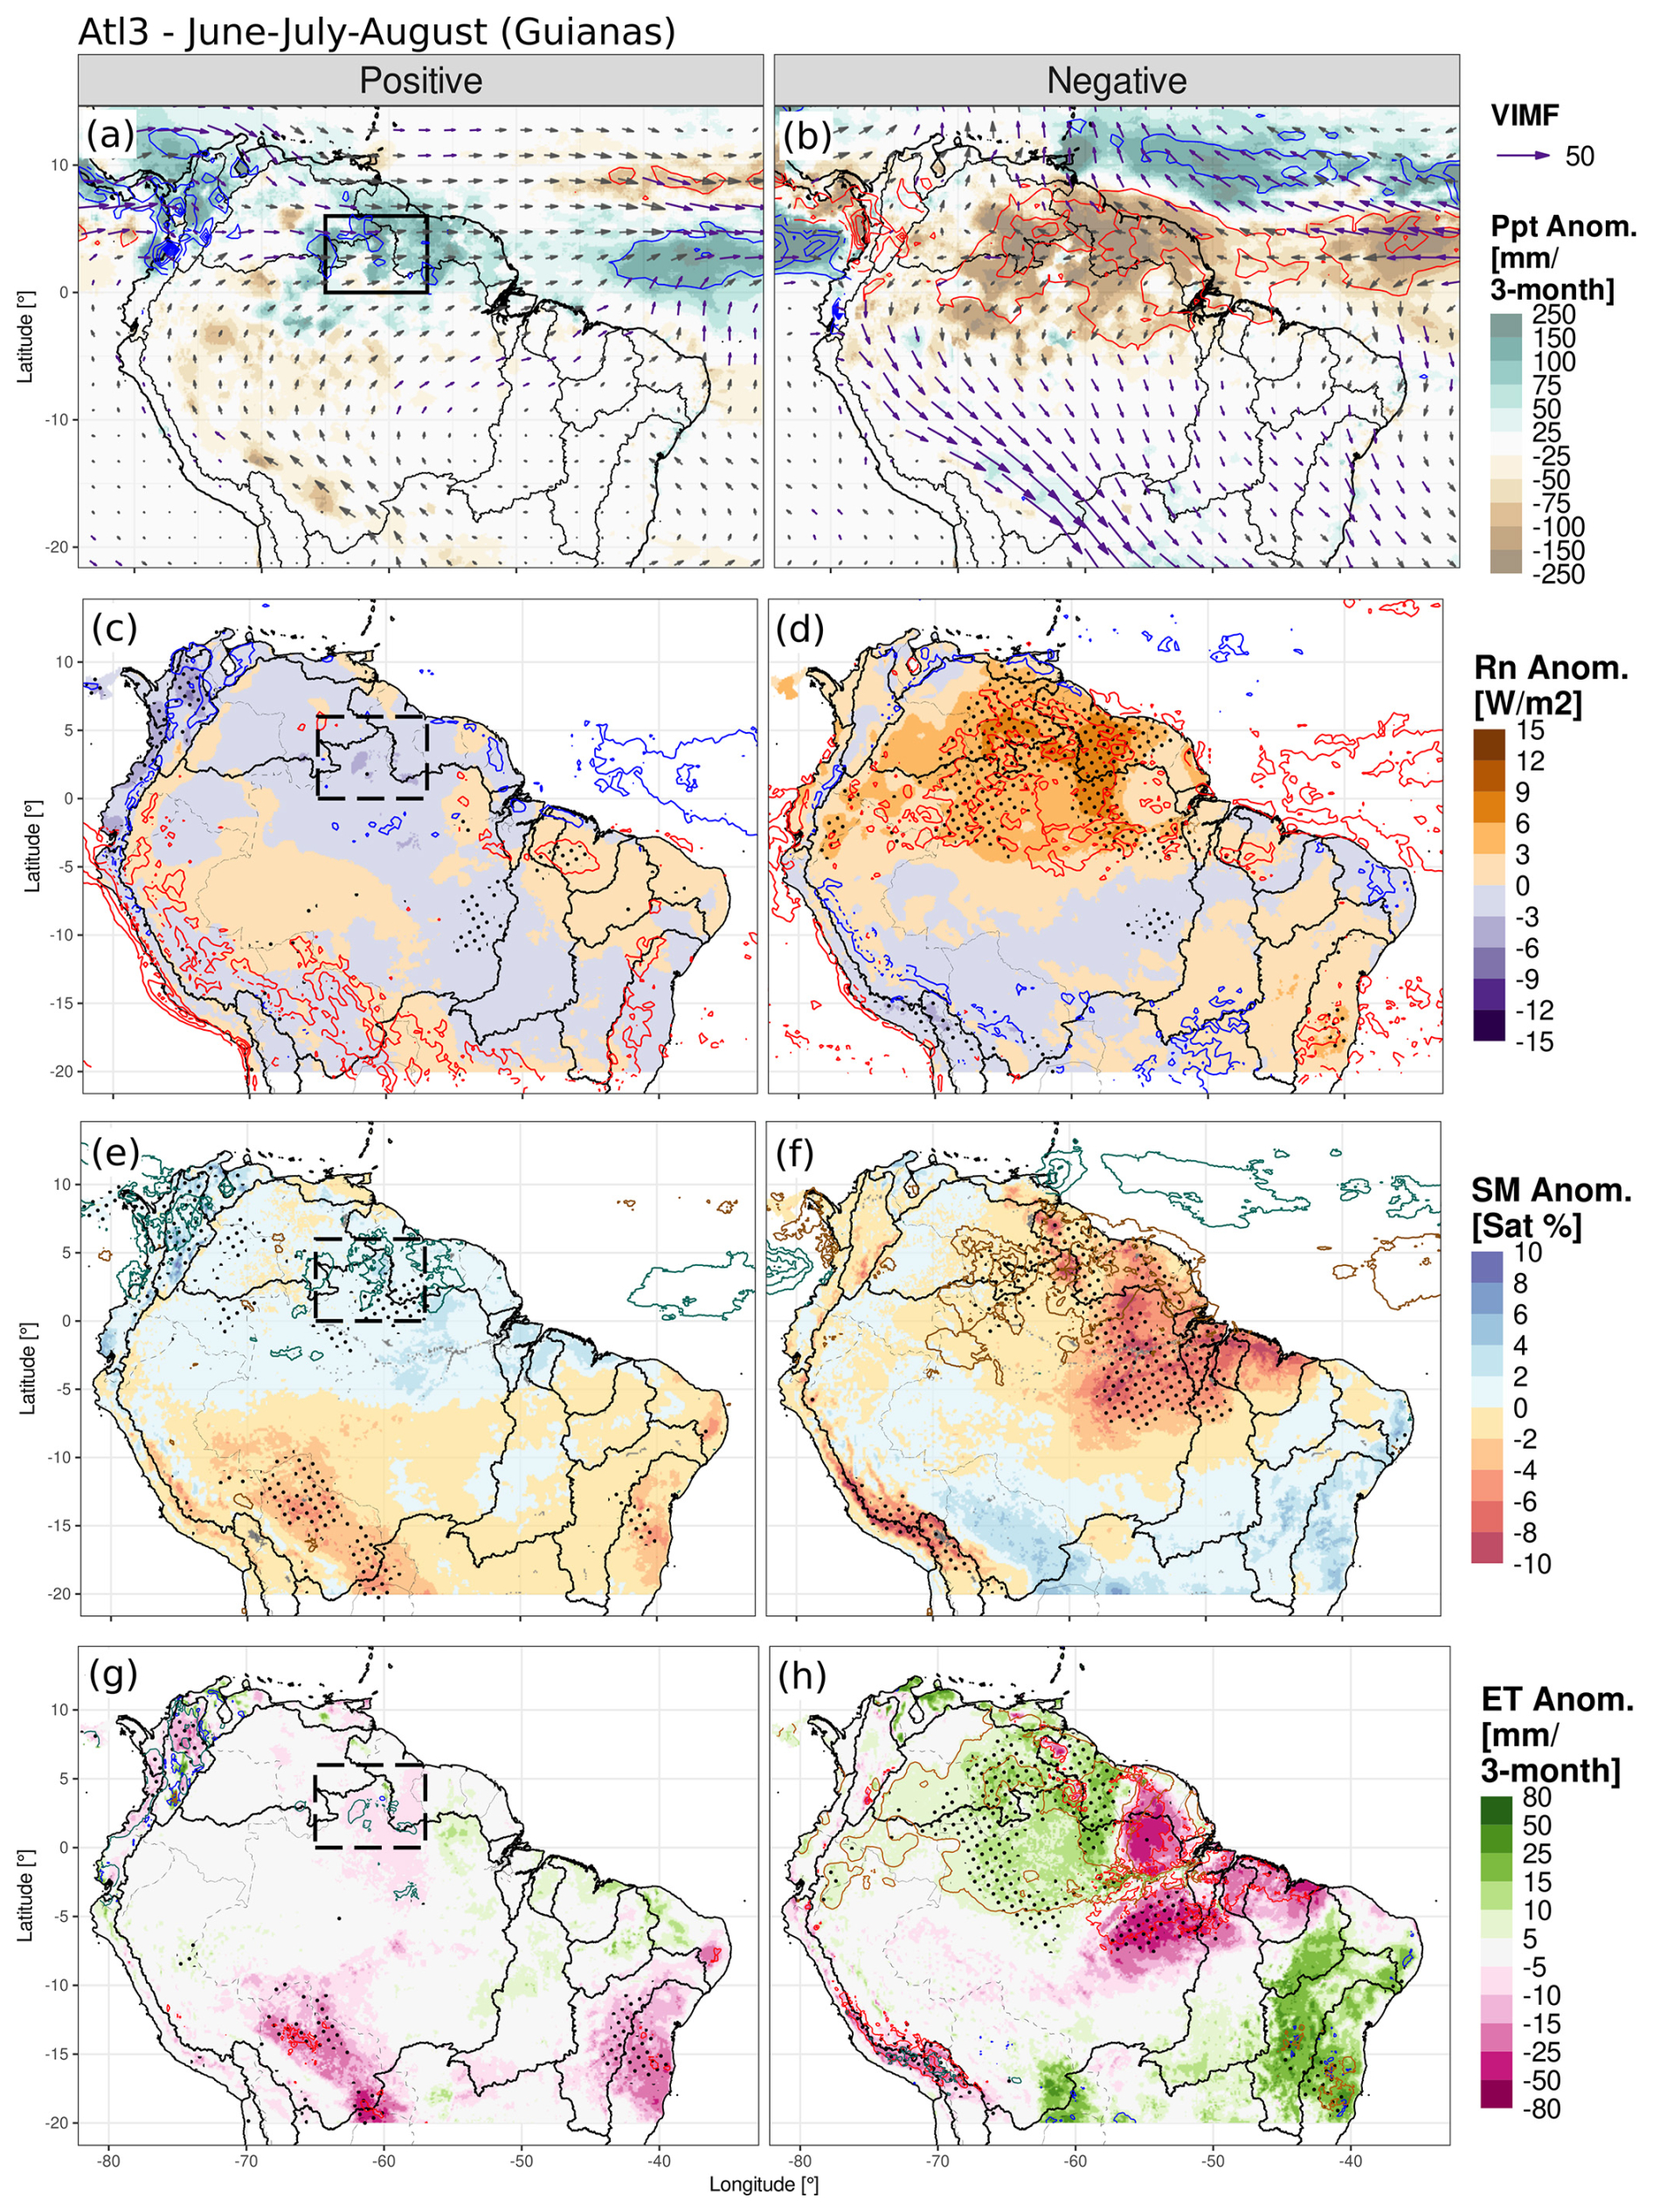
Figure 3As in Fig. 2 but for the Atlantic Niño Equatorial Mode (Atl3) in June to August (JJA). Boxed region: the Guianas, also applies for the negative phase.
Regarding the Atlantic Meridional Mode (AMM) (Fig. 4), the impacted place migrates depending on the season. In JJA, the positive phase redirects the VIMF anomalies northward (Fig. S4). This enhances convergence over the Caribbean and the divergence over the central Amazon and southern Orinoco (the latter having enhanced convergence in the previous season); hence, it reduces clouds and rainfall over the continent (Fig. S4a and c). The SM levels guarantee an energy-limited environment in the northern Amazon (Fig. 1j), and the AMM-related divergence generates above-average radiation, causing higher-than-average ET in the tropical forest (Fig. 4c) but below-average ET over northeast Brazil. The places impacted migrate westward compared to the previous season – MAM (Fig. 4a). In the southern area, the combination of the dry season and below-average SM causes trees to take up water probably just through their deep roots, generating water stress and reduced ET (see Sect. 5, Discussion). However, GLEAM estimates do not show any significant anomaly in the Amazon, where the availability of ESA-CCI-SM estimates are scarce (Figs. S2 and S3). Both ET datasets show similar anomalies over the continental north coast.
In the JJA negative phase, southward moisture flux brings more rainfall to the Orinoco, but it is not clear over the Amazon, an asymmetric condition compared to the positive phase (Fig. S4). Then, the AMM negative phase produces positive but not significant SM and ET anomalies in the southeast (Fig. 4d), although ERA5 suggests enhanced convergence (Fig. S4b). An important difference when comparing JJA to MAM is the westward migration of the divergence anomalies from northeast Brazil to the central Amazon and the effects on SM and ET (Fig. 4a and c).
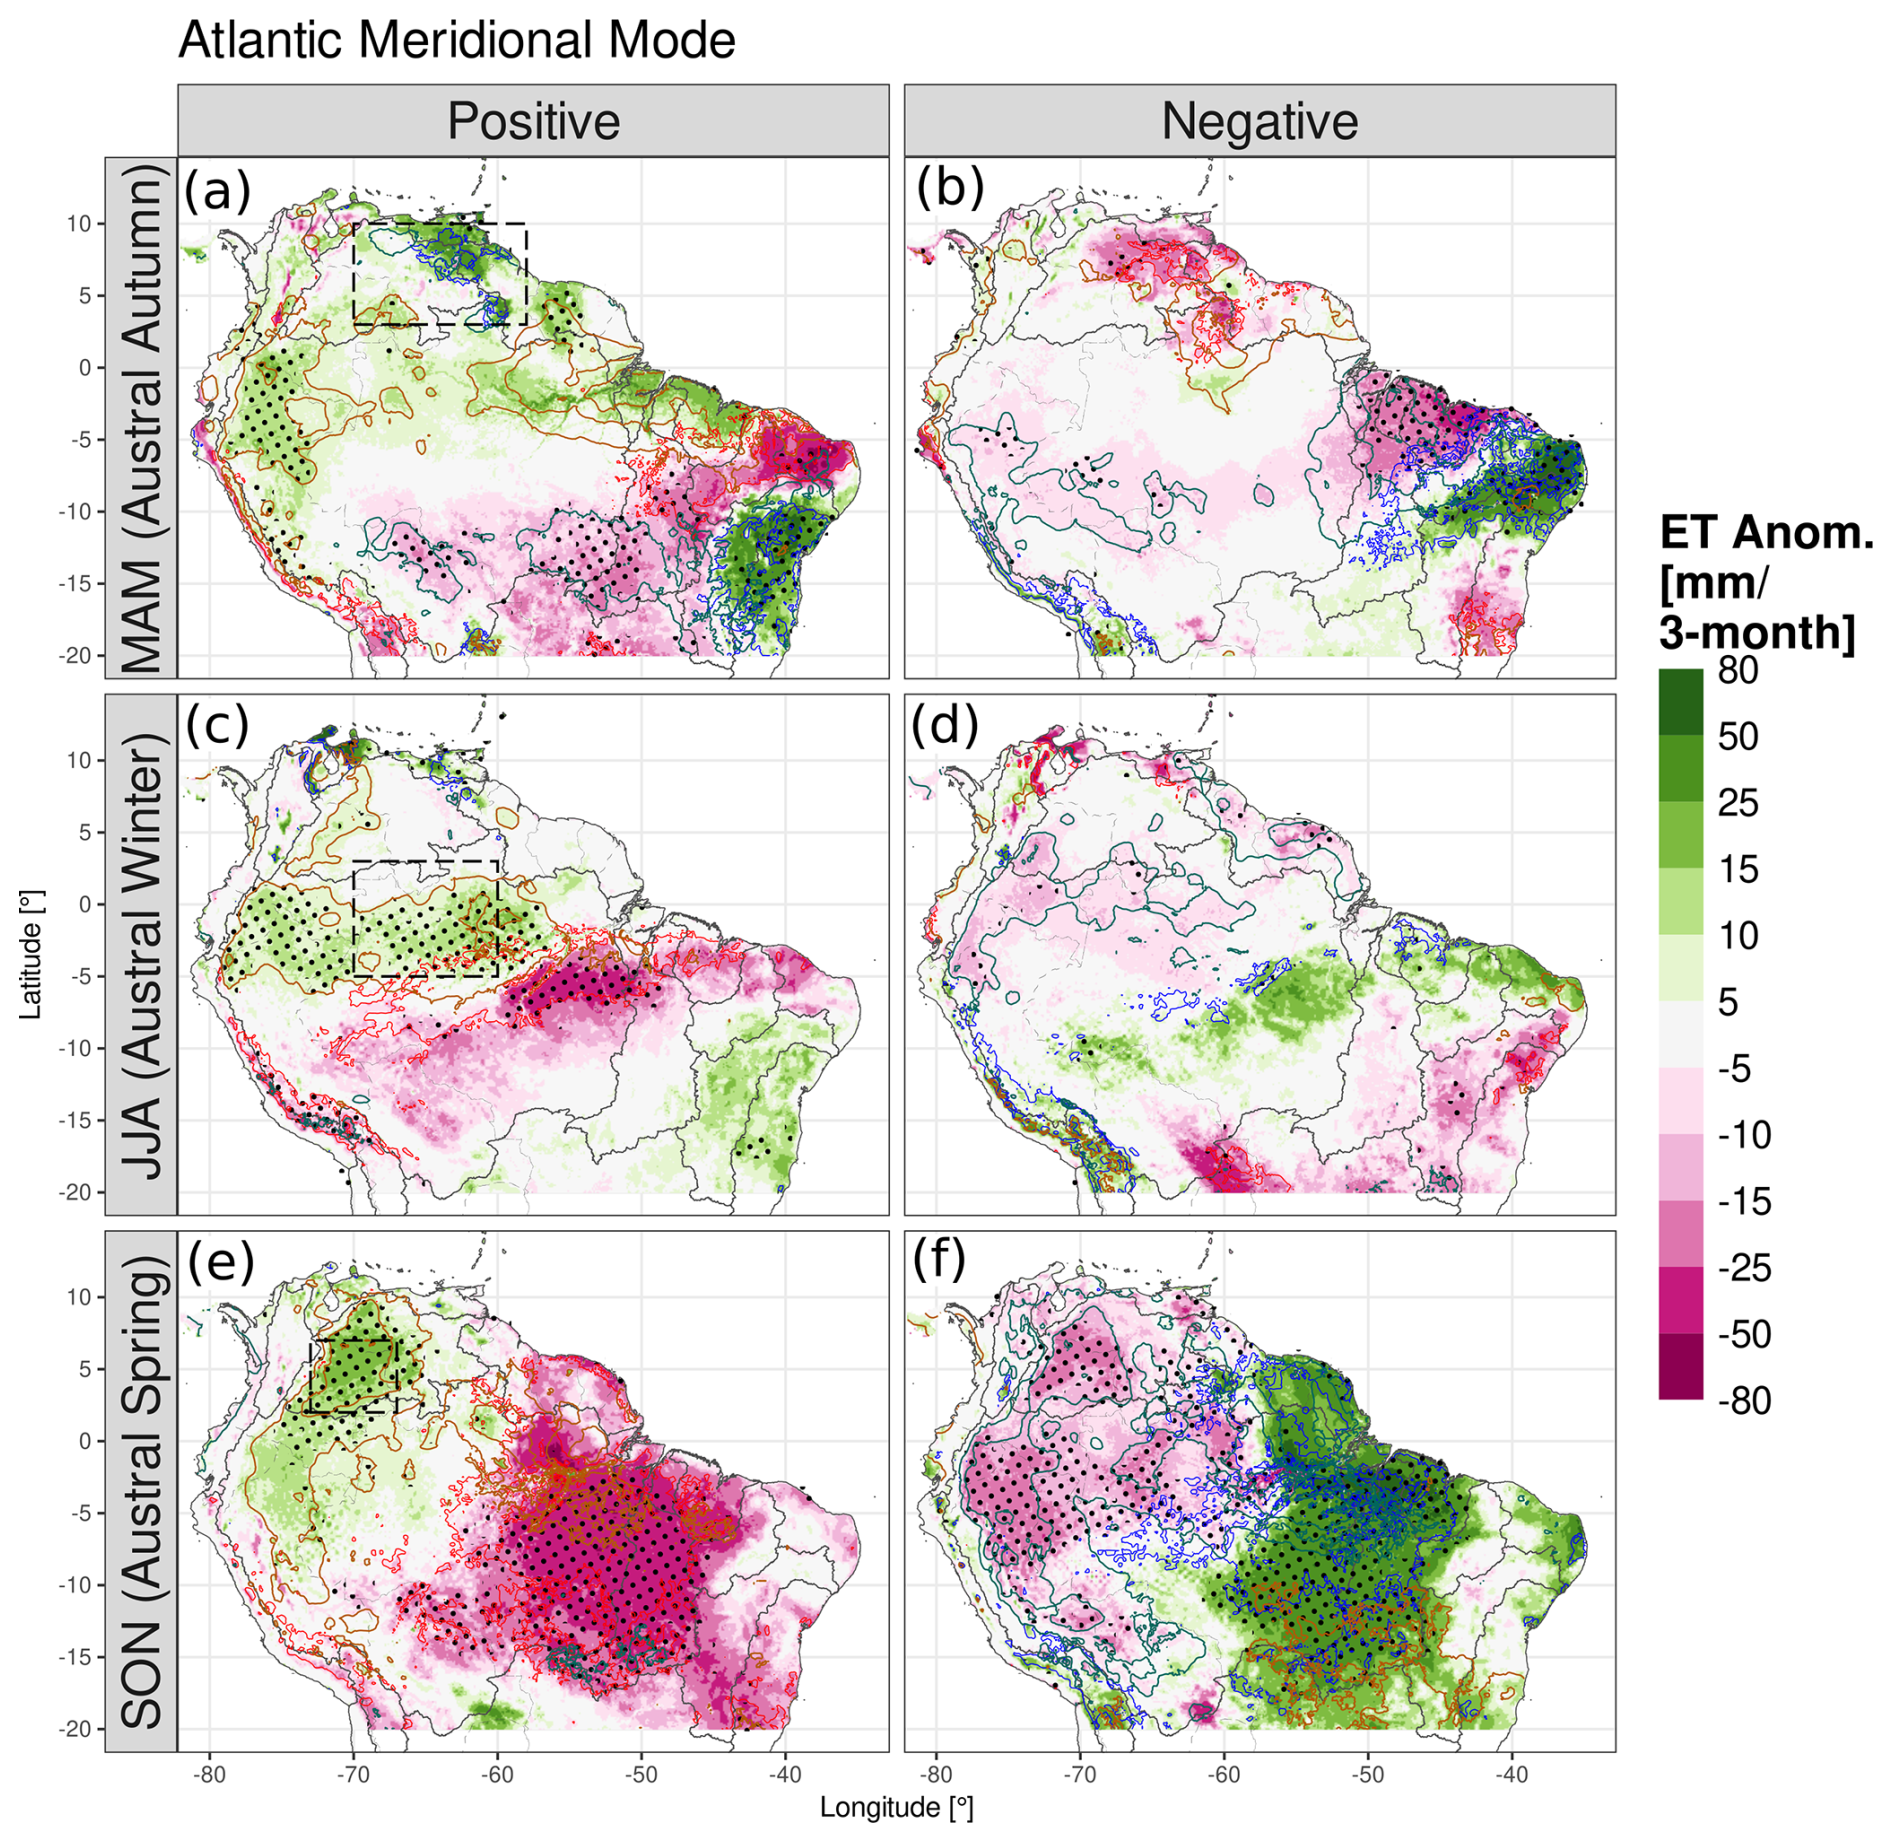
Figure 4Anomalies of ERA5-Land ET (shading) in the positive and negative Atlantic Meridional Mode (AMM) phases for (a, b) March–May, (c, d) June–August, and (e, f) September–November. The positive phase is in panels (a, c, e) and the negative phase in panels (b, d, f). Net surface radiation anomalies are shown in contours (gold for positive and aquamarine for negative), as well as soil moisture anomalies (contours: blue for positive and red for negative): radiation anomalies are repeated every 3 W m−2, and SM anomalies are repeated every 5 %. Black stippling depicts regions where the difference from the neutral phase is statistically significant at a 95 % confidence level. Boxed regions: (a, b) northern Orinoco, (c, d) central Amazon, and (e, f) western Orinoco, also applies for the negative phase. The box-averaged time series for JJA and SON is in Fig. S6.
4.2.3 September–November (SON): austral spring
For this season, the AMM-related anomalies migrate to the western Orinoco and western Amazon since the rainfall is concentrated on the Andes' eastern slope. The reduction in VIMF and convergence in the positive phase lead to high radiation anomalies that interact with the SM, causing above-average ET over the Orinoco (Figs. 4e and S5a, c, e). This is generated by SM remaining high in the region, creating an energy-limited environment, although it is not the core of the rainy season, and the SM anomalies are less than 2 % (Figs. 1k and S5e). Moreover, the positive phase causes a decline in SM and ET over the water-limited southeast due to the reduction in rainfall. There is no significant change in the central northern Amazon, just in the west or in the east.
In the negative phase, the AMM brings extra moisture more strongly than in the positive phase, although in both phases, the southeastern Amazon is impacted (Figs. S5a, b and S7). In the latter region, the SM shows higher-than-average values (Fig. S5e), which grant the land surface the extra moisture to increase ET in the water-limited zone (Fig. 4f). Over the Orinoco, the reduced radiation causes less ET, as well as over the western and northern Amazon (the latter region is not affected in the positive phase, asymmetry in Fig. S7). GLEAM shows similar results except for the central Amazon, again a region where the satellite SM is not assimilated in the model (Figs. S2 and S3).
The interactions between SM availability, plant water uptake, and radiation lead – in some cases – to above-average evapotranspiration during negative precipitation anomalies (reduced moisture convergence and clouds). This behaviour is present in energy-limited regimes, whereas in water-limited environments, negative moisture convergence anomalies bring less rainfall and cause below-average evapotranspiration.
4.3 Connection of the Atlantic modes with ENSO and impacts on evapotranspiration
Both ENSO and the Atlantic modes are connected through tropical and extra-tropical mechanisms, but each of them has effects on the South American hydroclimate. Figures 5 and 6 separate the effects of each mode in the spatial and temporal dimensions, respectively.
ENSO and AMM have impacts on ET at similar locations but also over different locations, depending on the season analysed. Fig. 5a, b, e, and f show the influence of both modes on ET in northeast Brazil in MAM and in JJA, yet ENSO mainly impacts the eastern Amazon, and the AMM impacts the Orinoco (see Sect. 5, Discussion). ENSO usually also induces droughts in the Amazon during El Niño events – mostly during its peak season, DJF – and causes heavy rainfall and floods during La Niña events. Figure 5c, d show the spatial impact of the increased evapotranspiration during ENSO-driven droughts, and Fig. 6c, d display the impacts on rainfall and ET of specific events (e.g. 1983, 1992, 1997, and 2015). However, Figs. 5a, e and 6a, b show that in the northern Orinoco, the ENSO forcing might be superseded by the meridional moisture advection induced by the AMM (e.g. 1983 – an El Niño year but with higher rainfall and ET; 1985 and 1989 – La Niña years but with drought). The correlation of the AMM with rainfall is up to 0.64 and with SM and ET are up to 0.5, all of which are significant. Another period when the AMM superseded ENSO impacts was in 2010 during La Niña, when the central Amazon experienced a prolonged drought (Figs. 5f and S6); the cause was the positive AMM event (see Sect. 5, Discussion). Note also the reduction or increment in ET when SM changes (water-limited regime). For season SON (Fig. 5c and g), the AMM and ENSO tend to impact different regions: ENSO being strong over the Guianas and the AMM over the west and southeast.
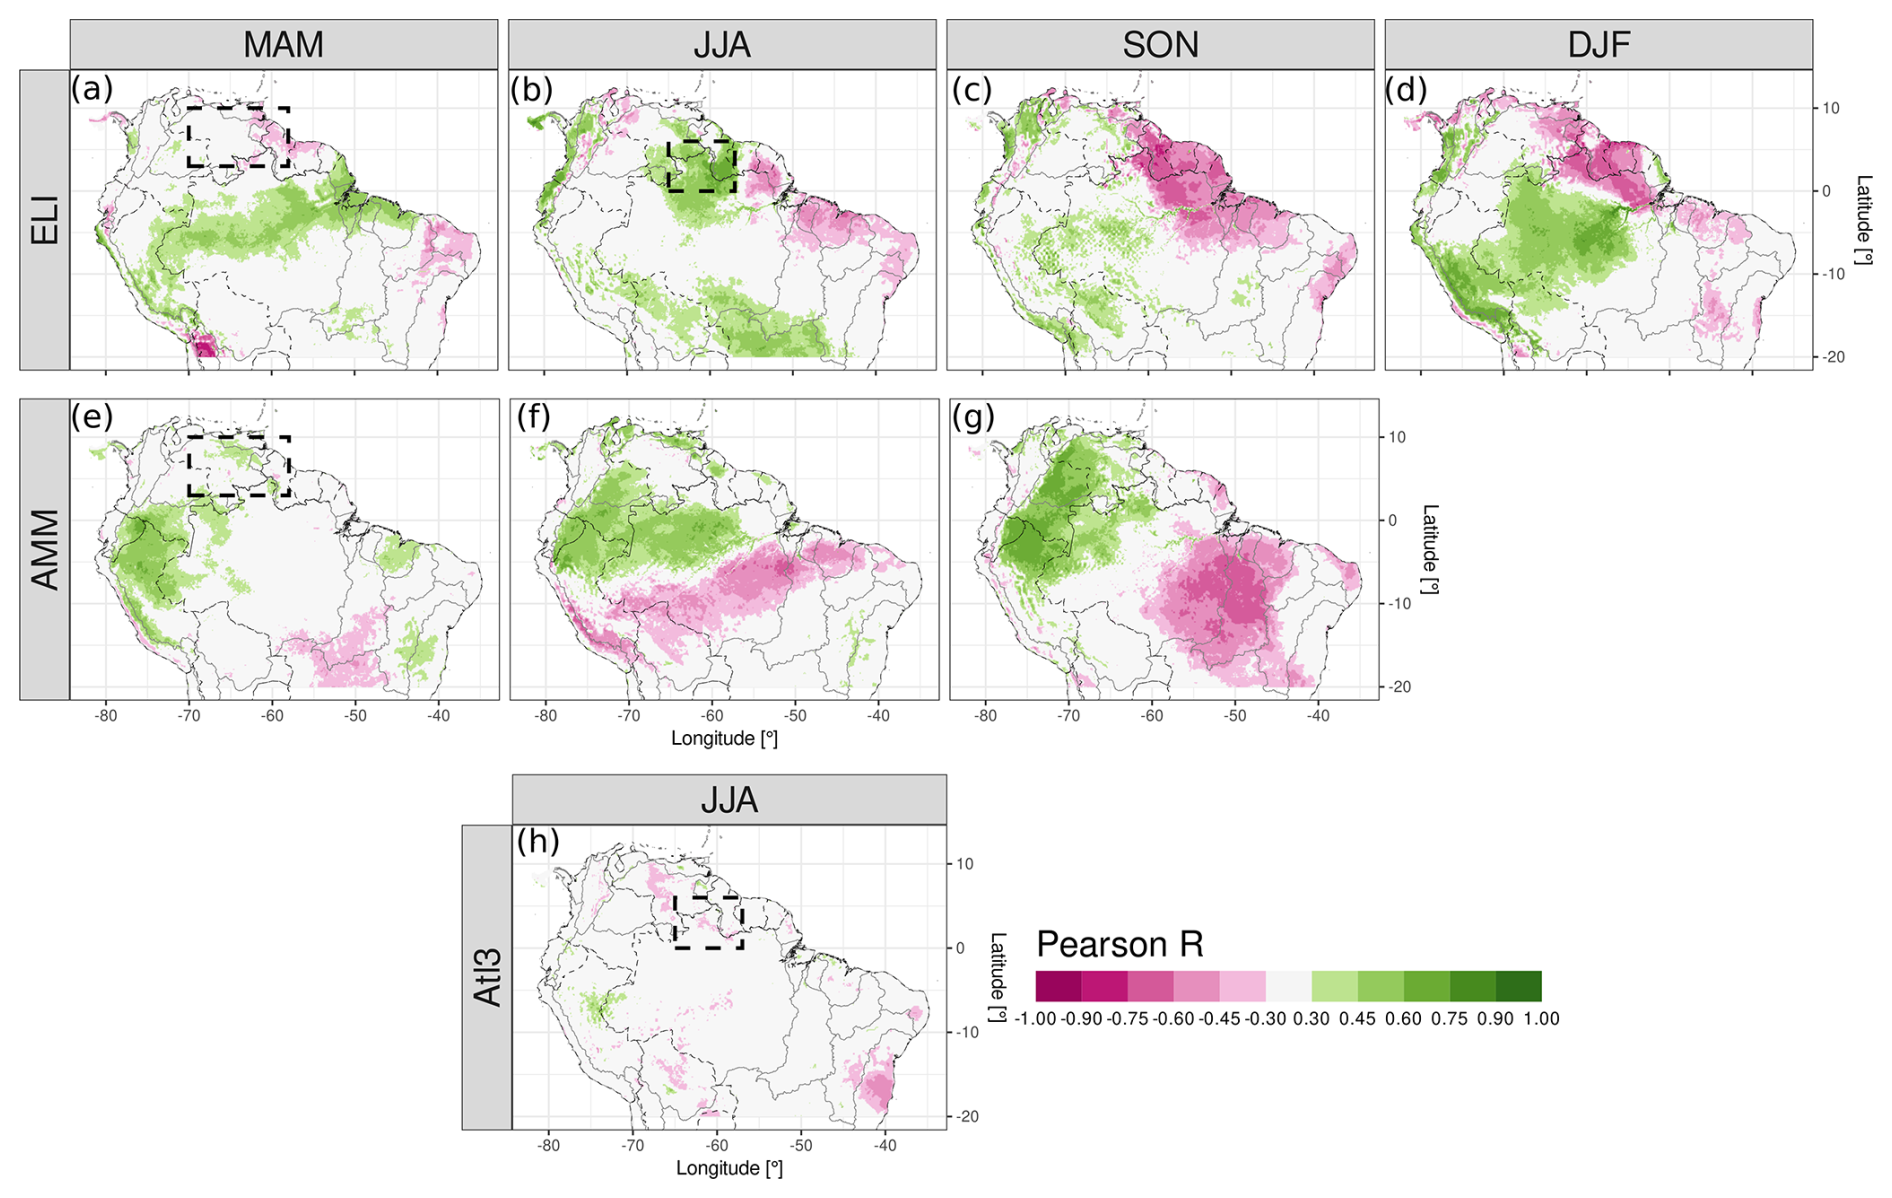
Figure 5Partial correlation of ET from ERA5-Land and the main tropical ocean modes in the Atlantic and Pacific. Panels (a)–(d) are the correlations with ELI for each season, controlled by the two Atlantic indices; panels (e)–(g) are the correlations with the AMM except for DJF, which is controlled by ELI and Atl3; and panel (h) is the correlation with the Atl3, controlled by ELI and the AMM. Only the 95 % confidence level values are shown in colours. Boxed regions: northern Orinoco and the Guianas, the same as in Figs. 2 and 3.
The Atl3 does not seem to strongly correlate with ET over the Guianas, and the ENSO pattern for JJA is very similar to the Atl3 negative-phase composites (Figs. 5b and h and 3h). This indicates some overlapping dynamics between the two modes, which are probably more associated with the atmospheric dynamics of the El Niño phase that has simultaneously unfolded with the Atl3 negative phase (Figs. 6c and d and S8). We discuss the latter in Sect. 5. Figure 6c and d show the droughts over the northeast Amazon and Guianas during Atl3 negative events with the corresponding increase in ET, which are also expected effects of the El Niño phase. The correlation of the Atl3 with the area-average ERA5-Land ET is −0.46 but 0.14 with GLEAM; the index correlates well with SM and also with rainfall. However, only some Atl3 positive events significantly reduced radiation and ET in the region (e.g. 1988, 1999, and 2008); other events kept ET close to the average (1987, 1998, and 2016).
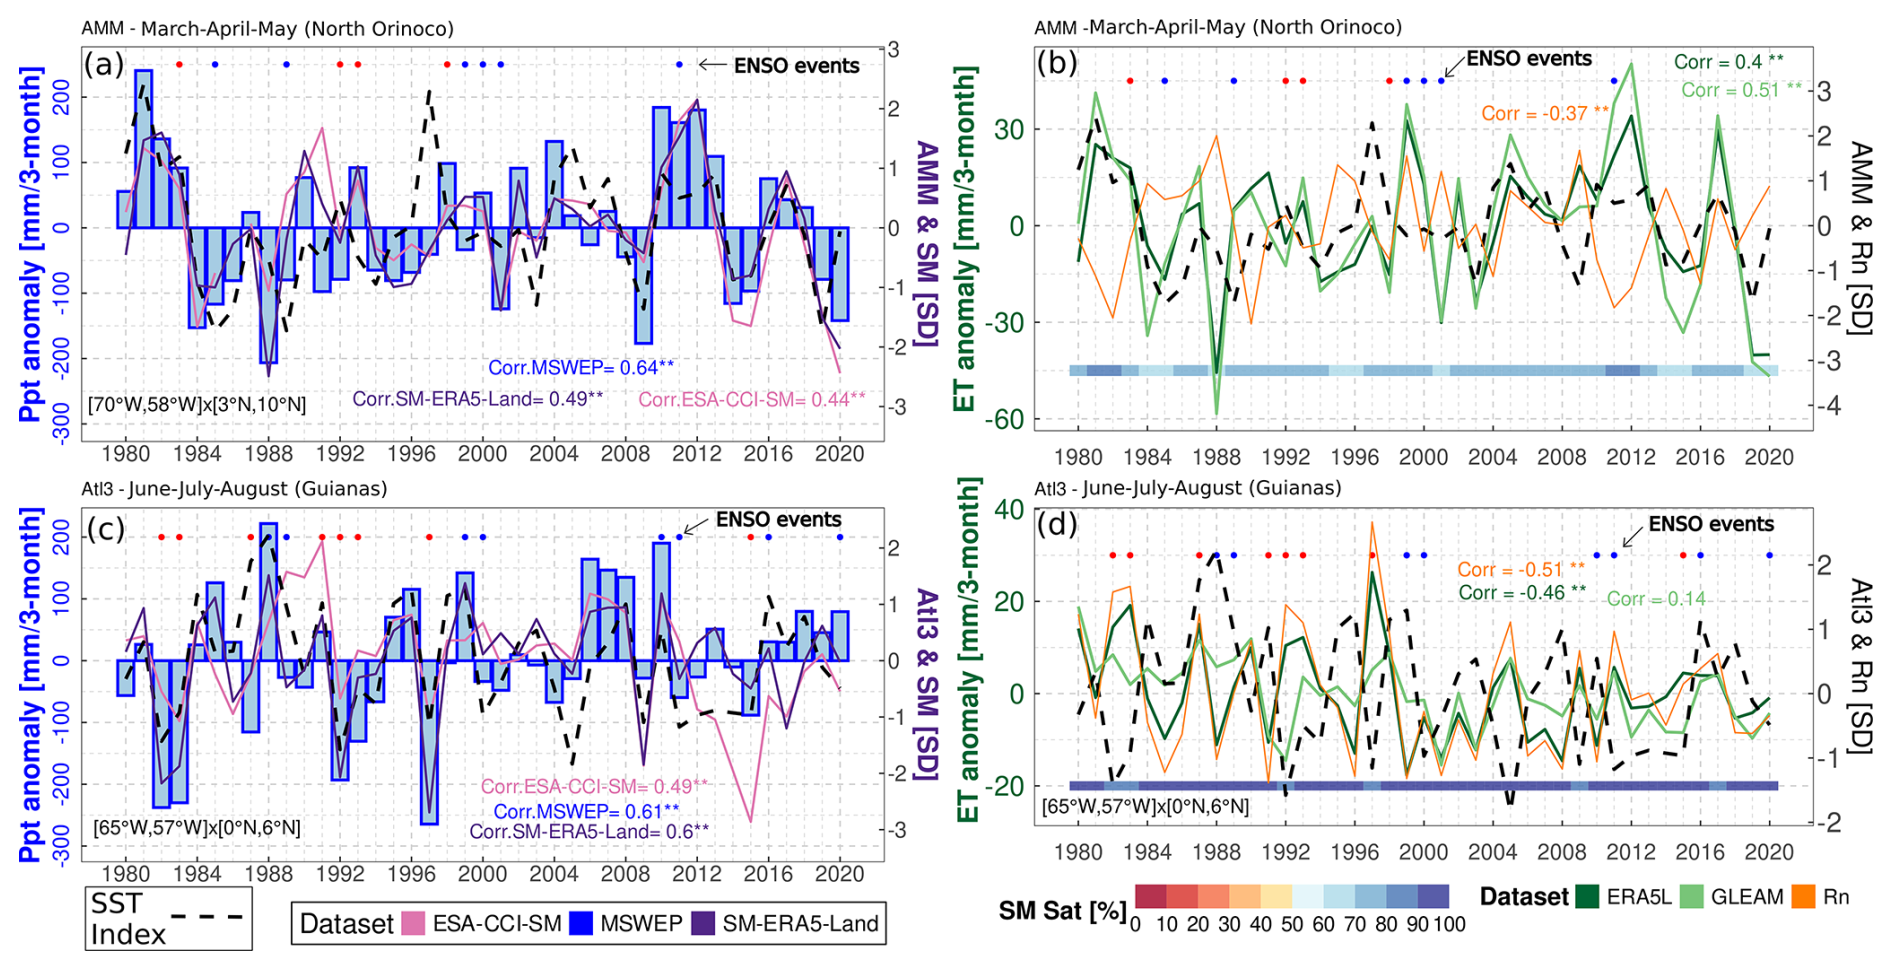
Figure 6(a, c) Area-average precipitation (bars) and SM standardised anomaly time series (lines) for the same boxes in Figs. 2 and 3, respectively; the Atlantic index time series is shown in black dashed lines in standard deviation (right axis), and the top points show ENSO active periods (positive phase in red and negative in blue). (b, d) Area-average evapotranspiration time series (greens), ERA5-Land net surface radiation (orange), standardised Atlantic index (black dashed lines), and ERA5-Land absolute SM in saturation percentage at the bottom of the panel with coloured rectangles. For all panels, Pearson correlations are calculated between the variable – precipitation, SM, Rn, or ET – and the respective Atlantic index; the 95 % confidence level is indicated with **. Boxed regions: northern Orinoco (a and b) and northeast Amazon and the Guianas (c and d).
Much of the research has focused on precipitation variability rather than on evapotranspiration (Arias et al., 2021; Marengo and Espinoza, 2016; Poveda et al., 2006; Espinoza et al., 2011). Regarding ET, Martens et al. (2018) used machine learning to globally estimate the impacts of the AMM – and other modes – finding increased evapotranspiration over northeast Brazil in MAM and in some cells in the central Amazon in JJA. However, our research focused on the modes that alter the atmospheric circulation close to the continent and constitute the physical mechanism causing the teleconnection. Other investigations focused specifically on ENSO's impact on Amazon evapotranspiration and SM (Moura et al., 2019; Poveda et al., 2001). Specifically, Moura et al. (2019) showed the anomalies of evapotranspiration for the southern Amazon's rainy – DJF – and dry seasons during ENSO events, finding the increase in the ET also shown in our correlation analysis in DJF. Our research focuses on the interaction between the atmosphere and the land surface, finding that the impacts migrate from the eastern Amazon to the western Orinoco and that important asymmetries exist between phases. Hasler and Avissar (2007) found an increase in ET in the equatorial Amazon during the dry season related to radiation anomalies, as was found in our ERA5-Land composites. The SM retained above critical values (soil's field capacity) up to the next season might cause positive evapotranspiration anomalies during below-average precipitation and above-average radiation periods (Zanin et al., 2024); this is evident in our results in the transition from the wet to the dry season.
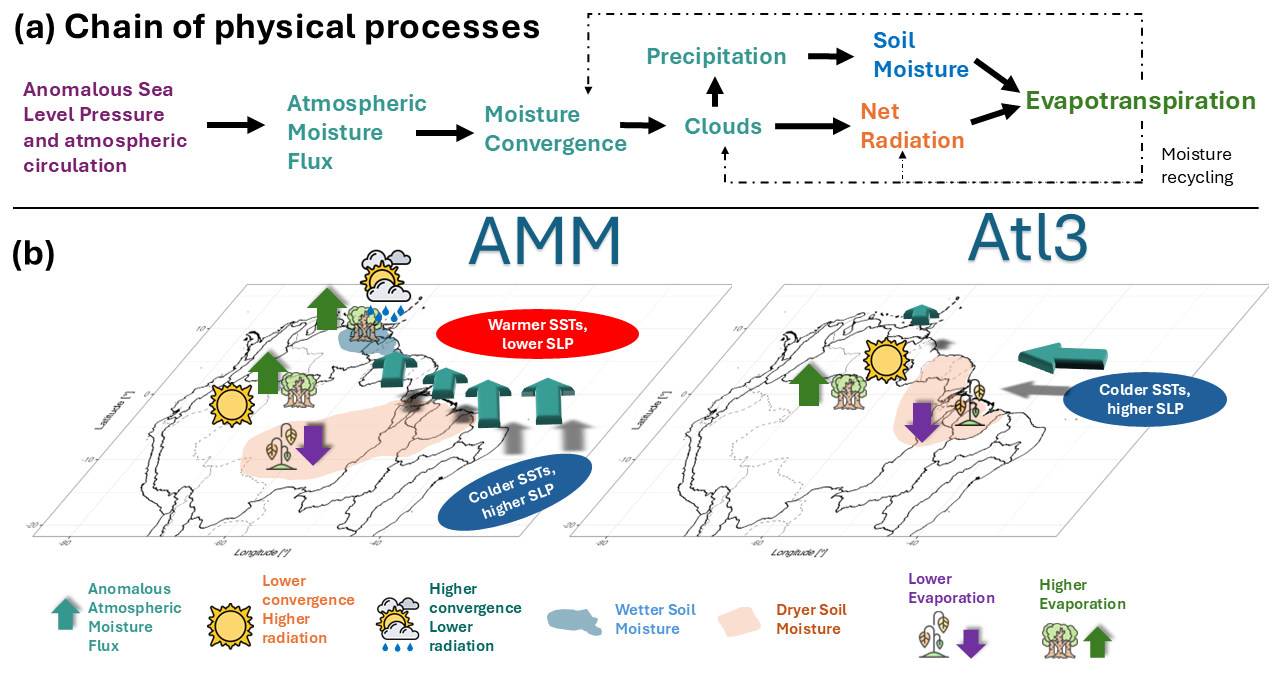
Figure 7Schematic figure of (a) the variables involved in the chain of physical processes in the teleconnection between a climate mode and the evapotranspiration. (b) The geographical location of the processes involved in the connection between the continental evapotranspiration and the Atlantic Meridional Mode (AMM) and the Atlantic Niño Equatorial mode (Atl3).
Differences between GLEAM and ERA5-Land stem from their formulation structures and assimilated data, which are then propagated to the composite analysis. In forested areas, roots deeper than 1.5 m allow water uptake from deep layers as a survival mechanism (Roberts et al., 2005; O'Connor et al., 2019; Jarvis, 1976); the main local controller of ET is most likely the incoming radiation, but trees might still feel water stress (Lian et al., 2024). The latter is partially considered in ERA5-Land, as the depth of the last layer is deeper than 1.5 m, and plants withdraw soil moisture root percentage-wise (ECMWF, 2023), whereas in GLEAM, the depth of the three soil layers is not specified, and plants withdraw water from the wettest layers (Martens et al., 2017). D'Acunha et al. (2024) found low ET rates in cropland and pasture sites inside the southeast Amazon rainforest compared to natural land use; the structure of both datasets in our study considers the grasslands and the other kinds of land cover, with some limitations. The influence of wind speed on evapotranspiration is not considered in GLEAM v3.8, and the soil module and plant physiology are more accurate in ERA5-Land. The problem of assimilating SM due to the scarcity of ESA-CCI-SM data in dense-forest areas might compromise the uncertainty in GLEAM estimates (Baker et al., 2021), e.g. over the northern Amazon and delta, and over the Guianas (Figs. 4d, e and 5d, e). Some studies have compared both datasets against eddy-covariance towers and water-balance approaches and concluded that ERA5-Land estimates are more realistic than those of GLEAM (Muñoz-Sabater et al., 2021; Xie et al., 2024). The bias in ERA5's rainfall might be diverted towards the streamflow (Towner et al., 2021) rather than generating a bias in the SM and the ET. These limitations are probably the main cause of the differences between the composites when using each dataset.
The variability in ET has implications for moisture recycling, mainly for southeastern South America, as pointed out by Drumond et al. (2014). Although moisture recycling inside the Amazon comprises between 25 % and 35 % of rainfall, Dominguez et al. (2022) discovered that it is a short-lifetime phenomenon strongly linked to the diurnal cycle of advected moisture and convection; recycled moisture precipitates quickly. Staal et al. (2018) measured the distance of transpired water before precipitating again over land, finding that for the particles transpired in the Amazon, the distance is below or around 500 km (which is short compared to the size of the Amazon basin). Our results show the places that affect the sources of that moisture recycling due to the seasonal aggregated increments or reductions in ET. Makarieva et al. (2023) determined the influence of ET on moisture convergence, which might potentially influence radiation. It remains to be clarified to what extent moisture recycling influences radiation availability and soil moisture at other locations in South America; this is out of the scope of our research.
The AMM and the Atl3 are influenced by and also have feedback with ENSO (García-Serrano et al., 2017; Martín-Rey et al., 2014; Cai et al., 2019). Our results show that each mode impacts different regions, except for northeast Brazil and the northern Amazon, where they overlap through El Niño enforcing convection inhibition and the AMM producing meridional anomalous moisture advection (for instance, in 2010) (Chiang et al., 2002; Arias et al., 2020); these mechanisms then modify convergence, rainfall, radiation availability, and thus evapotranspiration. The AMM negative phase has been less recurrent in SON in the last decades, associated with a positive phase of the Atlantic Multidecadal Oscillation (AMO) (general interhemispheric temperature gradient) (Brönnimann et al., 2015; Friedman et al., 2020). The latter is apparently related to the reduced aerosol forcing over the Northern Hemisphere and its associated radiation scattering (Hua et al., 2019; He et al., 2023). The Atl3 negative phase has co-occurred with the ENSO positive phase (El Niño) (Münnich and Neelin, 2005), whose impacts are evident in our composites and in the partial-correlation analysis. ENSO causes downward atmospheric movement over the east of the Amazon that hampers convection and precipitation (Cai et al., 2020); simultaneously, the strengthened easterlies – typical of the negative Atl3 – add to the moisture divergence over the Guianas, undermining precipitation. However, the relationship between ENSO and the Atl3 is inconsistent (Chang et al., 2006; Lübbecke and McPhaden, 2012). The interactions between climate modes have implications for their continental impacts (i.e. over the hydrological cycle).
Several ocean–atmospheric drivers have been identified as influences on the hydrometeorology of South America. Rodrigues and McPhaden (2014) analysed the AMM effects on precipitation in northeast Brazil and the Amazon, while others focused on the decadal variations in precipitation and streamflow or the low-atmospheric dynamics (Fernandes et al., 2015; Lopes et al., 2016; Olmo et al., 2022). Our research shows that the chain of events starts with the SSTAs and SLP and transfers to VIMF, MDiv, and precipitation, whose anomalies are linked to the variability in ET. However, we also show that the AMM also affects the Orinoco basin in MAM and JJA and might even extend into SON (Yoon and Zeng, 2010) over not just the Amazon and precipitation but also the SM and the evapotranspiration. There is agreement in the comparison of the location of reanalysed convergence and satellite precipitation; the rainfall anomalies influence the peak river flow, and our results agree with the location of peak river flow reduction during TNA anomalies reported by Towner et al. (2021) – a decrease in the central Amazon in the positive phase. Regarding the Atl3, most of the studies have focused on its statistical relationship with continental precipitation anomalies (Gu and Adler, 2009; Torralba et al., 2015) and the atmospheric dynamics of its development (Vallès‐Casanova et al., 2020).
Although coupled ocean–atmospheric modes are important drivers at the seasonal timescale, as shown here, other sources of variability at other scales – such as those mentioned in Sect. 1 (Introduction) – influence precipitation and might also influence ET (Mariotti et al., 2018). They might affect the transition and migration of the anomalies from one season to the following one. Phenomena with longer frequencies, such as the AMO, have also been discussed here, but the impacts of all those sources on ET deserve further research.
Our results are underpinned by the consistency between independent observations of land–surface and atmospheric variables whose robustness comes from physically based interpolations (reanalysis) or satellite-based observations. Limitations arise from the dataset's uncertainty and satellite retrievals; deforestation dynamics are also not included in the datasets. Nevertheless, the general circulation is still well represented due to the assimilation of atmospheric pressure, and models and measurements are as accurate as possible. Both sources of information show similar impacts but with local differences mostly in densely forested areas where physically based models like ERA5-Land might be more reliable. Longer time series of eddy-covariance towers could help the community confirm the dynamics discovered in our study. All in all, the datasets are accurate enough to analyse interannual variability.
This research advances the current understanding of the physical mechanisms that cause the interannual climate and land–surface variability in tropical South America, focusing on soil moisture (SM), net radiation (Rn), and evapotranspiration (ET). It elucidates the influence of the Atlantic SST modes on the upwind conditions that impact the Orinoco basin and not just northeast Brazil or the Amazon. Ocean–atmospheric interactions in the Atlantic drive moisture convergence anomalies, which in turn modify water and radiation availability that then control the SM, the net radiation, and the ET anomalies. However, the chain of processes is modulated by the annual cycle of the evapotranspiration regimen, which is not completely energy limited throughout the tropical region and throughout the annual cycle. A summarising depiction of the processes can be seen in Fig. 7.
The Atlantic Niño Equatorial mode (Atl3) weakens the trade winds in JJA, producing convergence over the Guianas and eastern Orinoco. However, its effect on the SM, radiation, and ET is not strong. The negative phase – in conjunction with the ENSO warm phase – strengthens the trade winds and produces divergence over an extended region, which significantly changes the SM, Rn, and ET.
The Atlantic Meridional Mode (AMM) creates cross-equatorial SLP anomalies that deflect climatological winds over not just the ocean but also the continent. It sends moisture northward in the positive phase, on occasions increasing and on others reducing convergence, precipitation, and radiation depending on the location and season, thus causing the land–surface anomalies (SM and ET). The negative phase causes the opposite effect but with strong asymmetries. In MAM, the moisture is redirected towards the Orinoco from northeast Brazil, whereas in JJA and SON it is taken from southern Orinoco and northern Amazon (or brought to the same regions in the other phase, with important differences in zonal direction). The changes in moisture transport depend on the annual wind pattern, producing opposite effects when comparing MAM and JJA over the Orinoco. AMM and ENSO jointly affect the breadbasket region of northeast Brazil and the central Amazon, but the AMM affects the western Amazon and Orinoco more.
The regions impacted in each phase might be different. Analysing just one phase might cause misleading estimations of SM, Rn, and ET.
Evapotranspiration is influenced in its regime by not only the ITCZ position but also the phase of the ocean–atmospheric mode. This is related to the fact that SM is not resilient to the activation of the modes, unless it is the rainy season and the soil is saturated regardless of the phase (thus the SM is above the soil's water field capacity, the threshold for energy-limited ET). For instance, evapotranspiration anomalies in the transition season from wet to dry are energy limited, but the sign of the anomaly depends on the phase of the mode that alters radiation and then ET. In the transition season from dry to wet, the ET regime is most likely water limited, and the ET anomaly is influenced by the variability in SM, which depends on the phase of the climate driver through precipitation. The SM saturation percentage closely varies with the ITCZ position.
The phenomena analysed have implications for the relationship between SM and heat extremes, gross primary production, irrigation requirements, and the carbon and energy cycles and can potentially be used to predict the response of ecosystem activity. The chain is mainly – but not exclusively – applicable to other tropical regions worldwide.
We coded scripts in R (https://www.R-project.org/, R Core Team, 2020) to perform the analysis of the datasets (https://doi.org/10.5281/zenodo.15389246, Duque-Gardeazabal, 2025). They can be consulted at https://github.com/nduqueg/ET_var_SAme (last access: March 2025).
The Extended Reconstructed SST version 5 (Huang et al., 2017) is available at https://www.ncei.noaa.gov/pub/data/cmb/ersst/v5/netcdf/. Hadley Center Sea Ice and SST version 4.0.1 (Kennedy et al., 2019) is available at https://www.metoffice.gov.uk/hadobs/hadsst4/data/download.html. Mauna Loa CO2 concentrations are available at https://gml.noaa.gov/ccgg/trends/data.html (Thoning et al., 1989). The ECMWF ERA5 reanalysis (https://doi.org/10.24381/cds.6860a573, Hersbach et al., 2020, 2023) and the ERA5-Land reanalysis (https://doi.org/10.24381/cds.68d2bb30, Muñoz-Sabater et al., 2021; Muñoz Sabater, 2019) data are available from the Copernicus Climate Data Store web portal https://cds.climate.copernicus.eu (last access: March 2025). MSWEP (Beck et al., 2019) is available at http://www.gloh2o.org/mswep/. ESA-CCI-SM (Gruber et al., 2019) is available at https://catalogue.ceda.ac.uk/uuid/ff890589c21f4033803aa550f52c980c. GLEAM (Martens et al., 2017) is available at https://www.gleam.eu/. EUMETSAT CLARA-A3 (Karlsson et al., 2023) is available at https://wui.cmsaf.eu/safira/action/viewProduktDetails?fid=40&eid=22277_22492 (last access: March 2025; DOI: https://doi.org/10.5676/EUM_SAF_CM/CLARA_AVHRR/V003). HydroSHEDS basins are available at https://www.hydrosheds.org/products/hydrobasins (Lehner and Grill, 2013).
The supplement related to this article is available online at https://doi.org/10.5194/hess-29-3277-2025-supplement.
Conceptualisation: NDG and SB. Data curation: NDG, ARF. Formal analysis: NDG. Funding acquisition: NDG, SB. Investigation: NDG, ARF, SB. Methodology: NDG, ARF, SB. Project administration: NDG, SB. Resources: SB. Software: NDG. Supervision: SB. Validation: NDG, ARF, SB. Visualisation: NDG. Writing – original draft: NDG. Writing – review and editing: NDG, ARF, SB.
The contact author has declared that none of the authors has any competing interests.
Publisher's note: Copernicus Publications remains neutral with regard to jurisdictional claims made in the text, published maps, institutional affiliations, or any other geographical representation in this paper. While Copernicus Publications makes every effort to include appropriate place names, the final responsibility lies with the authors.
We thank the anonymous reviewers and the editor for the constructive comments that helped improve the paper. We are grateful to the institutions that gather and freely disseminate the data used in this research and to Noemi Imfeld, Sonia Dupuis, and Adrian Huerta for recommending datasets or coding functions. Nicolás Duque-Gardeazabal thanks Helena Gardeazabal, Joaquin Duque, and friends for the emotional support throughout this research.
Nicolás Duque-Gardeazabal was supported by the Federal Commission for Scholarships for Foreign Students through the Swiss Government Excellence Scholarship (ESKAS no. 2022.0563) for the academic years 2022–2024. Andrew R. Friedman was funded by the European Union's Horizon 2020 research and innovation programme under Marie Skłodowska-Curie grant no. 894064 (AQUATIC). Stefan Brönnimann was funded by the Swiss National Science Foundation (grant no. 10001375).
This paper was edited by Miriam Coenders-Gerrits and reviewed by two anonymous referees.
Arias, P. A., Martínez, J. A., and Vieira, S. C.: Moisture sources to the 2010–2012 anomalous wet season in northern South America, Clim. Dynam., 45, 2861–2884, https://doi.org/10.1007/s00382-015-2511-7, 2015. a
Arias, P. A., Martínez, J. A., Mejía, J. D., Pazos, M. J., Espinoza, J. C., and Wongchuig-Correa, S.: Changes in Normalized Difference Vegetation Index in the Orinoco and Amazon River Basins: Links to Tropical Atlantic Surface Temperatures, J. Climate, 33, 8537–8559, https://doi.org/10.1175/JCLI-D-19-0696.1, 2020. a, b, c
Arias, P. A., Garreaud, R., Poveda, G., Espinoza, J. C., Molina-Carpio, J., Masiokas, M., Viale, M., Scaff, L., and van Oevelen, P. J.: Hydroclimate of the Andes Part II: Hydroclimate Variability and Sub-Continental Patterns, Front. Earth Sci., 8, 1–25, https://doi.org/10.3389/feart.2020.505467, 2021. a
Baker, J. C. A., Garcia-Carreras, L., Gloor, M., Marsham, J. H., Buermann, W., da Rocha, H. R., Nobre, A. D., de Araujo, A. C., and Spracklen, D. V.: Evapotranspiration in the Amazon: spatial patterns, seasonality, and recent trends in observations, reanalysis, and climate models, Hydrol. Earth Syst. Sci., 25, 2279–2300, https://doi.org/10.5194/hess-25-2279-2021, 2021. a, b
Beck, H. E., Wood, E. F., Pan, M., Fisher, C. K., Miralles, D. G., van Dijk, A. I. J. M., McVicar, T. R., and Adler, R. F.: MSWEP V2 Global 3-Hourly 0.1° Precipitation: Methodology and Quantitative Assessment, B. Am. Meteorol. Soc., 100, 473–500, https://doi.org/10.1175/BAMS-D-17-0138.1, 2019 (data available at: http://www.gloh2o.org/mswep/, last access: March 2025). a, b, c
Beck, H. E., Pan, M., Miralles, D. G., Reichle, R. H., Dorigo, W. A., Hahn, S., Sheffield, J., Karthikeyan, L., Balsamo, G., Parinussa, R. M., van Dijk, A. I. J. M., Du, J., Kimball, J. S., Vergopolan, N., and Wood, E. F.: Evaluation of 18 satellite- and model-based soil moisture products using in situ measurements from 826 sensors, Hydrol. Earth Syst. Sci., 25, 17–40, https://doi.org/10.5194/hess-25-17-2021, 2021. a, b
Brönnimann, S., Fischer, A. M., Rozanov, E., Poli, P., Compo, G. P., and Sardeshmukh, P. D.: Southward shift of the northern tropical belt from 1945 to 1980, Nat. Geosci., 8, 969–974, https://doi.org/10.1038/ngeo2568, 2015. a
Cai, W., Wu, L., Lengaigne, M., Li, T., McGregor, S., Kug, J. S., Yu, J. Y., Stuecker, M. F., Santoso, A., Li, X., Ham, Y. G., Chikamoto, Y., Ng, B., McPhaden, M. J., Du, Y., Dommenget, D., Jia, F., Kajtar, J. B., Keenlyside, N., Lin, X., Luo, J. J., Martín-Rey, M., Ruprich-Robert, Y., Wang, G., Xie, S. P., Yang, Y., Kang, S. M., Choi, J. Y., Gan, B., Kim, G. I., Kim, C. E., Kim, S., Kim, J. H., and Chang, P.: Pantropical climate interactions, Science, 363, eaav4236, https://doi.org/10.1126/science.aav4236, 2019. a, b
Cai, W., McPhaden, M. J., Grimm, A. M., Rodrigues, R. R., Taschetto, A. S., Garreaud, R. D., Dewitte, B., Poveda, G., Ham, Y. G., Santoso, A., Ng, B., Anderson, W., Wang, G., Geng, T., Jo, H. S., Marengo, J. A., Alves, L. M., Osman, M., Li, S., Wu, L., Karamperidou, C., Takahashi, K., and Vera, C.: Climate impacts of the El Niño–Southern Oscillation on South America, Nature Reviews Earth and Environment, 1, 215–231, https://doi.org/10.1038/s43017-020-0040-3, 2020. a, b
Casselman, J. W., Lübbecke, J. F., Bayr, T., Huo, W., Wahl, S., and Domeisen, D. I. V.: The teleconnection of extreme El Niño–Southern Oscillation (ENSO) events to the tropical North Atlantic in coupled climate models, Weather Clim. Dynam., 4, 471–487, https://doi.org/10.5194/wcd-4-471-2023, 2023. a
Chang, P., Fang, Y., Saravanan, R., Ji, L., and Seidel, H.: The cause of the fragile relationship between the Pacific El Nĩo and the Atlantic Nĩo, Nature, 443, 324–328, https://doi.org/10.1038/nature05053, 2006. a
Chiang, J. C., Kushnir, Y., and Giannini, A.: Deconstructing Atlantic Intertropical Convergence Zone variability: Influence of the local cross-equatorial sea surface temperature gradient and remote forcing from the Eastern Equatorial Pacific, J. Geophys. Res.-Atmos., 107, https://doi.org/10.1029/2000jd000307, 2002. a, b
Compo, G. P. and Sardeshmukh, P. D.: Removing ENSO-related variations from the climate record, J. Climate, 23, 1957–1978, https://doi.org/10.1175/2009JCLI2735.1, 2010. a
D'Acunha, B., Dalmagro, H., Zanella de Arruda, P., Biudes, M., Lathuillière, M., Uribe, M., Couto, E., Brando, P., Vourlitis, G., and Johnson, M.: Changes in evapotranspiration, transpiration and evaporation across natural and managed landscapes in the Amazon, Cerrado and Pantanal biomes, Agr. Forest Meteorol., 346, 109875, https://doi.org/10.1016/j.agrformet.2023.109875, 2024. a
Dominguez, F., Eiras-Barca, J., Yang, Z., Bock, D., Nieto, R., and Gimeno, L.: Amazonian Moisture Recycling Revisited Using WRF With Water Vapor Tracers, J. Geophys. Res.-Atmos., 127, e2021JD035259, https://doi.org/10.1029/2021JD035259, 2022. a
Drumond, A., Marengo, J., Ambrizzi, T., Nieto, R., Moreira, L., and Gimeno, L.: The role of the Amazon Basin moisture in the atmospheric branch of the hydrological cycle: a Lagrangian analysis, Hydrol. Earth Syst. Sci., 18, 2577–2598, https://doi.org/10.5194/hess-18-2577-2014, 2014. a, b
Duque-Gardeazabal, N.: An Atlantic influence on evaporation in the Orinoco and Amazon basins – codes, Zenodo [code], https://doi.org/10.5281/zenodo.15389246, 2025. a, b, c
Eagleson, P. S.: Ecohydrology: Darwinian expression of vegetation form and function, vol. 53, Cambridge University Press, ISBN 9788578110796, https://doi.org/10.1017/CBO9781107415324.004, 2013. a
ECMWF: IFS Documentation CY48R1 – Part IV: Physical Processes, in: IFS Documentation CY48R1, European Centre for Medium Range Weather Forecast (ECMWF), https://doi.org/10.21957/02054f0fbf, 2023. a, b, c, d
Enfield, D. B.: Relationships of inter-American rainfall to tropical Atlantic and Pacific SST variability, Geophys. Res. Lett., 23, 3305–3308, https://doi.org/10.1029/96GL03231, 1996. a
Espinoza, J. C., Ronchail, J., Guyot, J. L., Junquas, C., Vauchel, P., Lavado, W., Drapeau, G., and Pombosa, R.: Climate variability and extreme drought in the upper Solimões River (western Amazon Basin): Understanding the exceptional 2010 drought, Geophys. Res. Lett., 38, L13406, https://doi.org/10.1029/2011GL047862, 2011. a
Fernandes, K., Giannini, A., Verchot, L., Baethgen, W., and Pinedo‐Vasquez, M.: Decadal covariability of Atlantic SSTs and western Amazon dry‐season hydroclimate in observations and CMIP5 simulations, Geophys. Res. Lett., 42, 6793–6801, https://doi.org/10.1002/2015GL063911, 2015. a, b, c
Friedman, A. R., Hegerl, G. C., Schurer, A. P., Lee, S. Y., Kong, W., Cheng, W., and Chiang, J. C.: Forced and unforced decadal behavior of the interhemispheric SST contrast during the instrumental period (1881–2012): Contextualizing the late 1960s–early 1970s shift, J. Climate, 33, 3487–3509, https://doi.org/10.1175/JCLI-D-19-0102.1, 2020. a
García-Serrano, J., Cassou, C., Douville, H., Giannini, A., and Doblas-Reyes, F. J.: Revisiting the ENSO teleconnection to the tropical North Atlantic, J. Climate, 30, 6945–6957, https://doi.org/10.1175/JCLI-D-16-0641.1, 2017. a, b
Garreaud, R. D., Vuille, M., Compagnucci, R., and Marengo, J.: Present-day South American climate, Palaeogeogr. Palaeocl., 281, 180–195, https://doi.org/10.1016/j.palaeo.2007.10.032, 2009. a
Gebrechorkos, S. H., Leyland, J., Dadson, S. J., Cohen, S., Slater, L., Wortmann, M., Ashworth, P. J., Bennett, G. L., Boothroyd, R., Cloke, H., Delorme, P., Griffith, H., Hardy, R., Hawker, L., McLelland, S., Neal, J., Nicholas, A., Tatem, A. J., Vahidi, E., Liu, Y., Sheffield, J., Parsons, D. R., and Darby, S. E.: Global-scale evaluation of precipitation datasets for hydrological modelling, Hydrol. Earth Syst. Sci., 28, 3099–3118, https://doi.org/10.5194/hess-28-3099-2024, 2024. a
Grimm, A. M. and Zilli, M. T.: Interannual variability and seasonal evolution of summer monsoon rainfall in South America, J. Climate, 22, 2257–2275, https://doi.org/10.1175/2008JCLI2345.1, 2009. a
Gruber, A., Scanlon, T., van der Schalie, R., Wagner, W., and Dorigo, W.: Evolution of the ESA CCI Soil Moisture climate data records and their underlying merging methodology, Earth Syst. Sci. Data, 11, 717–739, https://doi.org/10.5194/essd-11-717-2019, 2019 (data available at: https://catalogue.ceda.ac.uk/uuid/ff890589c21f4033803aa550f52c980c, last access: March 2025). a, b, c
Gu, G. and Adler, R. F.: Interannual variability of boreal summer rainfall in the equatorial Atlantic, Int. J. Climatol., 29, 175–184, https://doi.org/10.1002/joc.1724, 2009. a, b
Hasler, N. and Avissar, R.: What Controls Evapotranspiration in the Amazon Basin?, J. Hydrometeorol., 8, 380–395, https://doi.org/10.1175/JHM587.1, 2007. a
He, C., Clement, A. C., Kramer, S. M., Cane, M. A., Klavans, J. M., Fenske, T. M., and Murphy, L. N.: Tropical Atlantic multidecadal variability is dominated by external forcing, Nature, 622, 521–527, https://doi.org/10.1038/s41586-023-06489-4, 2023. a
Hersbach, H., Bell, B., Berrisford, P., Hirahara, S., Horányi, A., Muñoz-Sabater, J., Nicolas, J., Peubey, C., Radu, R., Schepers, D., Simmons, A., Soci, C., Abdalla, S., Abellan, X., Balsamo, G., Bechtold, P., Biavati, G., Bidlot, J., Bonavita, M., De Chiara, G., Dahlgren, P., Dee, D., Diamantakis, M., Dragani, R., Flemming, J., Forbes, R., Fuentes, M., Geer, A., Haimberger, L., Healy, S., Hogan, R. J., Hólm, E., Janisková, M., Keeley, S., Laloyaux, P., Lopez, P., Lupu, C., Radnoti, G., de Rosnay, P., Rozum, I., Vamborg, F., Villaume, S., and Thépaut, J. N.: The ERA5 global reanalysis, Q. J. Roy. Meteor. Soc., 146, 1999–2049, https://doi.org/10.1002/qj.3803, 2020. a, b, c
Hersbach, H., Bell, B., Berrisford, P., Biavati, G., Horányi, A., Muñoz Sabater, J., Nicolas, J., Peubey, C., Radu, R., Rozum, I., Schepers, D., Simmons, A., Soci, C., Dee, D., and Thépaut, J.-N.: ERA5 monthly averaged data on pressure levels from 1940 to present, Copernicus Climate Change Service (C3S) Climate Data Store (CDS) [data set], https://doi.org/10.24381/cds.6860a573, 2023. a
Hirschi, M., Mueller, B., Dorigo, W., and Seneviratne, S. I.: Using remotely sensed soil moisture for land-atmosphere coupling diagnostics: The role of surface vs. root-zone soil moisture variability, Remote Sens. Environ., 154, 246–252, https://doi.org/10.1016/j.rse.2014.08.030, 2014. a
Hoyos, I., Cañón-Barriga, J., Arenas-Suárez, T., Dominguez, F., and Rodríguez, B. A.: Variability of regional atmospheric moisture over Northern South America: patterns and underlying phenomena, Clim. Dynam., 52, 893–911, https://doi.org/10.1007/s00382-018-4172-9, 2019. a
Hua, W., Dai, A., Zhou, L., Qin, M., and Chen, H.: An Externally Forced Decadal Rainfall Seesaw Pattern Over the Sahel and Southeast Amazon, Geophys. Res. Lett., 46, 923–932, https://doi.org/10.1029/2018GL081406, 2019. a
Huang, B., Thorne, P. W., Banzon, V. F., Boyer, T., Chepurin, G., Lawrimore, J. H., Menne, M. J., Smith, T. M., Vose, R. S., and Zhang, H. M.: Extended reconstructed Sea surface temperature, Version 5 (ERSSTv5): Upgrades, validations, and intercomparisons, J. Climate, 30, 8179–8205, https://doi.org/10.1175/JCLI-D-16-0836.1, 2017 (data available at: https://www.ncei.noaa.gov/pub/data/cmb/ersst/v5/netcdf/, last access: March 2025). a, b, c
Humphrey, V., Berg, A., Ciais, P., Gentine, P., Jung, M., Reichstein, M., Seneviratne, S. I., and Frankenberg, C.: Soil moisture–atmosphere feedback dominates land carbon uptake variability, Nature, 592, 65–69, https://doi.org/10.1038/s41586-021-03325-5, 2021. a
IPCC: Climate Change 2021: The Physical Science Basis, Cambridge University Press, Cambriedge, United Kingdom, ISBN 9781009157896, https://doi.org/10.1017/9781009157896, 2021. a
Jarvis, P.: The interpretation of the variations in leaf water potential and stomatal conductance found in canopies in the field, Philos. T. Roy. Soc. B, 273, 593–610, https://doi.org/10.1098/rstb.1976.0035, 1976. a
Jung, M., Koirala, S., Weber, U., Ichii, K., Gans, F., Camps-Valls, G., Papale, D., Schwalm, C., Tramontana, G., and Reichstein, M.: The FLUXCOM ensemble of global land-atmosphere energy fluxes, Scientific Data, 6, 74, https://doi.org/10.1038/s41597-019-0076-8, 2019. a
Karlsson, K.-G., Riihelä, A., Trentmann, J., Stengel, M., Solodovnik, I., Meirink, J. F., Devasthale, A., Jääskeläinen, E., Kallio-Myers, V., Eliasson, S., Benas, N., Johansson, E., Stein, D., Finkensieper, S., Håkansson, N., Akkermans, T., Clerbaux, N., Selbach, N., Marc, S., and Hollmann, R.: CLARA-A3: CM SAF cLoud, Albedo and surface RAdiation dataset from AVHRR data – Edition 3, Satellite Application Facility on Climate Monitoring [data set], https://doi.org/10.5676/EUM_SAF_CM/CLARA_AVHRR/V003, 2023. a, b, c, d
Kaune, A., Werner, M., López López, P., Rodríguez, E., Karimi, P., and de Fraiture, C.: Can global precipitation datasets benefit the estimation of the area to be cropped in irrigated agriculture?, Hydrol. Earth Syst. Sci., 23, 2351–2368, https://doi.org/10.5194/hess-23-2351-2019, 2019. a
Kennedy, J. J., Rayner, N. A., Atkinson, C. P., and Killick, R. E.: An Ensemble Data Set of Sea Surface Temperature Change From 1850: The Met Office Hadley Centre HadSST.4.0.0.0 Data Set, J. Geophys. Res.-Atmos., 124, 7719–7763, https://doi.org/10.1029/2018JD029867, 2019 (data available at: https://www.metoffice.gov.uk/hadobs/hadsst4/data/download.html, last access: March 2025). a, b, c
Le, T. and Bae, D.-H.: Response of global evaporation to major climate modes in historical and future Coupled Model Intercomparison Project Phase 5 simulations, Hydrol. Earth Syst. Sci., 24, 1131–1143, https://doi.org/10.5194/hess-24-1131-2020, 2020. a
Lehner, B. and Grill, G.: Global river hydrography and network routing: baseline data and new approaches to study the world's large river systems, Hydrol. Process., 27, 2171–2186, https://doi.org/10.1002/hyp.9740, 2013 (data available at: https://www.hydrosheds.org/products/hydrobasins, last access: March 2025). a
Lian, X., Morfopoulos, C., and Gentine, P.: Water deficit and storm disturbances co-regulate Amazon rainforest seasonality, Science Advances, 10, eadk5861, https://doi.org/10.1126/sciadv.adk5861, 2024. a
Lopes, A. V., Chiang, J. C. H., Thompson, S. A., and Dracup, J. A.: Trend and uncertainty in spatial‐temporal patterns of hydrological droughts in the Amazon basin, Geophys. Res. Lett., 43, 3307–3316, https://doi.org/10.1002/2016GL067738, 2016. a, b
Lübbecke, J. F. and McPhaden, M. J.: On the Inconsistent Relationship between Pacific and Atlantic Niños, J. Climate, 25, 4294–4303, https://doi.org/10.1175/JCLI-D-11-00553.1, 2012. a
Lübbecke, J. F., Rodríguez-Fonseca, B., Richter, I., Martín-Rey, M., Losada, T., Polo, I., and Keenlyside, N. S.: Equatorial Atlantic variability – Modes, mechanisms, and global teleconnections, WIRES Clim. Change, 9, e527, https://doi.org/10.1002/wcc.527, 2018. a
Makarieva, A. M., Nefiodov, A. V., Nobre, A. D., Baudena, M., Bardi, U., Sheil, D., Saleska, S. R., Molina, R. D., and Rammig, A.: The role of ecosystem transpiration in creating alternate moisture regimes by influencing atmospheric moisture convergence, Glob. Change Biol., 29, 2536–2556, https://doi.org/10.1111/gcb.16644, 2023. a
Marengo, J. A. and Espinoza, J. C.: Extreme seasonal droughts and floods in Amazonia: Causes, trends and impacts, Int. J. Climatol., 36, 1033–1050, https://doi.org/10.1002/joc.4420, 2016. a, b
Mariotti, A., Ruti, P. M., and Rixen, M.: Progress in subseasonal to seasonal prediction through a joint weather and climate community effort, npj Climate and Atmospheric Science, 1, 2–5, https://doi.org/10.1038/s41612-018-0014-z, 2018. a
Martens, B., Miralles, D. G., Lievens, H., van der Schalie, R., de Jeu, R. A. M., Fernández-Prieto, D., Beck, H. E., Dorigo, W. A., and Verhoest, N. E. C.: GLEAM v3: satellite-based land evaporation and root-zone soil moisture, Geosci. Model Dev., 10, 1903–1925, https://doi.org/10.5194/gmd-10-1903-2017, 2017 (data available at: https://www.gleam.eu/, last access: March 2025). a, b, c, d
Martens, B., Waegeman, W., Dorigo, W. A., Verhoest, N. E. C., and Miralles, D. G.: Terrestrial evaporation response to modes of climate variability, npj Climate and Atmospheric Science, 1, 43, https://doi.org/10.1038/s41612-018-0053-5, 2018. a, b
Martín-Rey, M., Rodríguez-Fonseca, B., Polo, I., and Kucharski, F.: On the Atlantic–Pacific Niños connection: a multidecadal modulated mode, Clim. Dynam., 43, 3163–3178, https://doi.org/10.1007/s00382-014-2305-3, 2014. a, b
Merz, B., Blöschl, G., Vorogushyn, S., Dottori, F., Aerts, J. C., Bates, P., Bertola, M., Kemter, M., Kreibich, H., Lall, U., and Macdonald, E.: Causes, impacts and patterns of disastrous river floods, Nature Reviews Earth and Environment, 2, 592–609, https://doi.org/10.1038/s43017-021-00195-3, 2021. a
Miralles, D. G., Van Den Berg, M. J., Gash, J. H., Parinussa, R. M., De Jeu, R. A., Beck, H. E., Holmes, T. R., Jiménez, C., Verhoest, N. E., Dorigo, W. A., Teuling, A. J., and Johannes Dolman, A.: El Niño-La Niña cycle and recent trends in continental evaporation, Nat. Clim. Change, 4, 122–126, https://doi.org/10.1038/nclimate2068, 2014. a
Mishra, A. K. and Singh, V. P.: A review of drought concepts, J. Hydrol., 391, 202–216, https://doi.org/10.1016/j.jhydrol.2010.07.012, 2010. a
Moura, M. M., dos Santos, A. R., Pezzopane, J. E. M., Alexandre, R. S., da Silva, S. F., Pimentel, S. M., de Andrade, M. S. S., Silva, F. G. R., Branco, E. R. F., Moreira, T. R., da Silva, R. G., and de Carvalho, J. R.: Relation of El Niño and La Niña phenomena to precipitation, evapotranspiration and temperature in the Amazon basin, Sci. Total Environ., 651, 1639–1651, https://doi.org/10.1016/j.scitotenv.2018.09.242, 2019. a, b, c
Münnich, M. and Neelin, J. D.: Seasonal influence of ENSO on the Atlantic ITCZ and equatorial South America, Geophys. Res. Lett., 32, L21709, https://doi.org/10.1029/2005GL023900, 2005. a
Muñoz Sabater, J.: ERA5-Land monthly averaged data from 1950 to present, Copernicus Climate Change Service (C3S) Climate Data Store (CDS) [data set], https://doi.org/10.24381/cds.68d2bb30, 2019. a
Muñoz-Sabater, J., Dutra, E., Agustí-Panareda, A., Albergel, C., Arduini, G., Balsamo, G., Boussetta, S., Choulga, M., Harrigan, S., Hersbach, H., Martens, B., Miralles, D. G., Piles, M., Rodríguez-Fernández, N. J., Zsoter, E., Buontempo, C., and Thépaut, J.-N.: ERA5-Land: a state-of-the-art global reanalysis dataset for land applications, Earth Syst. Sci. Data, 13, 4349–4383, https://doi.org/10.5194/essd-13-4349-2021, 2021. a, b, c, d, e
Nemani, R. R., Keeling, C. D., Hashimoto, H., Jolly, W. M., Piper, S. C., Tucker, C. J., Myneni, R. B., and Running, S. W.: Climate-Driven Increases in Global Terrestrial Net Primary Production from 1982 to 1999, Science, 300, 1560–1563, https://doi.org/10.1126/science.1082750, 2003. a
O'Connor, J., Santos, M. J., Rebel, K. T., and Dekker, S. C.: The influence of water table depth on evapotranspiration in the Amazon arc of deforestation, Hydrol. Earth Syst. Sci., 23, 3917–3931, https://doi.org/10.5194/hess-23-3917-2019, 2019. a
Olmo, M. E., Espinoza, J. C., Bettolli, M. L., Sierra, J. P., Junquas, C., Arias, P. A., Moron, V., and Balmaceda-Huarte, R.: Circulation Patterns and Associated Rainfall Over South Tropical South America: GCMs Evaluation During the Dry-To-Wet Transition Season, J. Geophys. Res.-Atmos., 127, e2022JD036468, https://doi.org/10.1029/2022JD036468, 2022. a
Pabón, J. and Dorado, J.: Intraseasonal Variability of Rainfall over Northern South America and Caribbean Region, Earth Sci. Res. J., 12, 194–212, 2008. a
Paccini, L., Hohenegger, C., and Stevens, B.: Explicit versus Parameterized Convection in Response to the Atlantic Meridional Mode, J. Climate, 34, 3343–3354, https://doi.org/10.1175/JCLI-D-20-0224.1, 2021. a
Poveda, G., Jaramillo, A., Gil, M. M., Quiceno, N., and Mantilla, R. I.: Seasonally in ENSO‐related precipitation, river discharges, soil moisture, and vegetation index in Colombia, Water Resour. Res., 37, 2169–2178, https://doi.org/10.1029/2000WR900395, 2001. a
Poveda, G., Waylen, P. R., and Pulwarty, R. S.: Annual and inter-annual variability of the present climate in northern South America and southern Mesoamerica, Palaeogeogr. Palaeocl., 234, 3–27, https://doi.org/10.1016/j.palaeo.2005.10.031, 2006. a
R Core Team: R: A Language and Environment for Statistical Computing, R Foundation for Statistical Computing [code], https://www.R-project.org/ (last access: March 2025), 2020. a
Roberts, J. M., Gash, J. H. C., Tani, M., and Bruijnzeel, L. A.: Controls on evaporation in lowland tropical rainforest, in: Forests, Water and People in the Humid Tropics, Cambridge University Press, 287–313, https://doi.org/10.1017/CBO9780511535666.019, 2005. a
Rodrigues, R. R. and McPhaden, M. J.: Why did the 2011-2012 La Niña cause a severe drought in the Brazilian Northeast?, Geophys. Res. Lett., 41, 1012–1018, https://doi.org/10.1002/2013GL058703, 2014. a, b
Ronchail, J., Cochonneau, G., Molinier, M., Guyot, J. L., De Miranda Chaves, A. G., Guimarães, V., and De Oliveira, E.: Interannual rainfall variability in the Amazon basin and sea-surface temperatures in the equatorial Pacific and the tropical Atlantic Oceans, Int. J. Climatol., 22, 1663–1686, https://doi.org/10.1002/joc.815, 2002. a
Ruiz-Barradas, A., Carton, J. A., and Nigam, S.: Structure of Interannual-to-Decadal climate variability in the tropical Atlantic sector, J. Climate, 13, 3285–3297, https://doi.org/10.1175/1520-0442(2000)013<3285:SOITDC>2.0.CO;2, 2000. a, b
Ruiz-Vásquez, M., Arias, P. A., and Martínez, J. A.: Enso influence on water vapor transport and thermodynamics over Northwestern South America, Theor. Appl. Climatol., 155, 3771–3789, https://doi.org/10.1007/s00704-024-04848-3, 2024. a
Seneviratne, S. I., Corti, T., Davin, E. L., Hirschi, M., Jaeger, E. B., Lehner, I., Orlowsky, B., and Teuling, A. J.: Investigating soil moisture-climate interactions in a changing climate: A review, Earth-Sci. Rev., 99, 125–161, https://doi.org/10.1016/j.earscirev.2010.02.004, 2010. a, b
Staal, A., Tuinenburg, O. A., Bosmans, J. H. C., Holmgren, M., van Nes, E. H., Scheffer, M., Zemp, D. C., and Dekker, S. C.: Forest-rainfall cascades buffer against drought across the Amazon, Nat. Clim. Change, 8, 539–543, https://doi.org/10.1038/s41558-018-0177-y, 2018. a, b
Thoning, K. W., Tans, P. P., and Komhyr, W. D.: Atmospheric carbon dioxide at Mauna Loa Observatory: 2. Analysis of the NOAA GMCC data, 1974–1985, J. Geophys. Res.-Atmos., 94, 8549–8565, https://doi.org/10.1029/JD094iD06p08549, 1989 (data available at: https://gml.noaa.gov/ccgg/trends/data.html, last access: March 2025). a, b
Torralba, V., Rodríguez-Fonseca, B., Mohino, E., and Losada, T.: The non-stationary influence of the Atlantic and Pacific niños on north Eastern South American rainfall, Front. Earth Sci., 3, 1–10, https://doi.org/10.3389/feart.2015.00055, 2015. a, b
Towner, J., Ficchí, A., Cloke, H. L., Bazo, J., Coughlan de Perez, E., and Stephens, E. M.: Influence of ENSO and tropical Atlantic climate variability on flood characteristics in the Amazon basin, Hydrol. Earth Syst. Sci., 25, 3875–3895, https://doi.org/10.5194/hess-25-3875-2021, 2021. a, b
Ummenhofer, C. C. and Meehl, G. A.: Extreme weather and climate events with ecological relevance: a review, Philos. T. Roy. Soc. B, 372, 20160135, https://doi.org/10.1098/rstb.2016.0135, 2017. a
Valencia, S., Marín, D. E., Gómez, D., Hoyos, N., Salazar, J. F., and Villegas, J. C.: Spatio-temporal assessment of Gridded precipitation products across topographic and climatic gradients in Colombia, Atmos. Res., 285, 106643, https://doi.org/10.1016/j.atmosres.2023.106643, 2023. a
Vallès‐Casanova, I., Lee, S., Foltz, G. R., and Pelegrí, J. L.: On the Spatiotemporal Diversity of Atlantic Niño and Associated Rainfall Variability Over West Africa and South America, Geophys. Res. Lett., 47, e2020GL087108, https://doi.org/10.1029/2020GL087108, 2020. a, b, c, d
van der Ent, R. J. and Savenije, H. H. G.: Length and time scales of atmospheric moisture recycling, Atmos. Chem. Phys., 11, 1853–1863, https://doi.org/10.5194/acp-11-1853-2011, 2011. a
Wang, K. and Dickinson, R. E.: A review of global terrestrial evapotranspiration: Observation, modeling, climatology, and climatic variability, Rev. Geophys., 50, RG2005, https://doi.org/10.1029/2011RG000373, 2012. a
Wang-Erlandsson, L., Fetzer, I., Keys, P. W., van der Ent, R. J., Savenije, H. H. G., and Gordon, L. J.: Remote land use impacts on river flows through atmospheric teleconnections, Hydrol. Earth Syst. Sci., 22, 4311–4328, https://doi.org/10.5194/hess-22-4311-2018, 2018. a
Williams, I. N. and Patricola, C. M.: Diversity of ENSO Events Unified by Convective Threshold Sea Surface Temperature: A Nonlinear ENSO Index, Geophys. Res. Lett., 45, 9236–9244, https://doi.org/10.1029/2018GL079203, 2018. a
Xie, Z., Yao, Y., Tang, Q., Liu, M., Fisher, J. B., Chen, J., Zhang, X., Jia, K., Li, Y., Shang, K., Jiang, B., Yang, J., Yu, R., Zhang, X., Guo, X., Liu, L., Ning, J., Fan, J., and Zhang, L.: Evaluation of seven satellite-based and two reanalysis global terrestrial evapotranspiration products, J. Hydrol., 630, 130649, https://doi.org/10.1016/j.jhydrol.2024.130649, 2024. a, b, c
Yoon, J. H. and Zeng, N.: An Atlantic influence on Amazon rainfall, Clim. Dynam., 34, 249–264, https://doi.org/10.1007/s00382-009-0551-6, 2010. a, b
Zanin, P. R., Pareja-Quispe, D., and Espinoza, J.-C.: Evapotranspiration in the Amazon Basin: Couplings, hydrological memory and water feedback, Agr. Forest Meteorol., 352, 110040, https://doi.org/10.1016/j.agrformet.2024.110040, 2024. a, b
Zemp, D. C., Schleussner, C.-F., Barbosa, H. M. J., van der Ent, R. J., Donges, J. F., Heinke, J., Sampaio, G., and Rammig, A.: On the importance of cascading moisture recycling in South America, Atmos. Chem. Phys., 14, 13337–13359, https://doi.org/10.5194/acp-14-13337-2014, 2014. a
Zhang, Y., Peña-Arancibia, J. L., McVicar, T. R., Chiew, F. H., Vaze, J., Liu, C., Lu, X., Zheng, H., Wang, Y., Liu, Y. Y., Miralles, D. G., and Pan, M.: Multi-decadal trends in global terrestrial evapotranspiration and its components, Scientific Reports, 6, 19124, https://doi.org/10.1038/srep19124, 2016. a
Zhao, M. and Running, S. W.: Drought-Induced Reduction in Global Terrestrial Net Primary Production from 2000 Through 2009, Science, 329, 940–943, https://doi.org/10.1126/science.1192666, 2010. a