the Creative Commons Attribution 4.0 License.
the Creative Commons Attribution 4.0 License.
 | 03 Jun 2025
Analysis of past and future droughts causing clay shrinkage in France
Sophie Barthelemy
Bertrand Bonan
Miquel Tomas-Burguera
Gilles Grandjean
Séverine Bernardie
Jean-Philippe Naulin
Patrick Le Moigne
Aaron Boone
Jean-Christophe Calvet
Clay-shrinkage-induced subsidence can cause permanent damage to buildings if the drying extends below the foundations. Clay soils and damage are widespread in France. The causes of clay shrinkage are understood at the micro-scale, but the same reasoning cannot be applied at the large spatial scales that are critical for land management because the phenomenon depends on very local parameters. In this study, clay shrinkage occurrence factors are characterized and the global number of insurance claims is statistically quantified, without considering the risk of damage for each house. A drought index specifically designed for clay shrinkage is used to analyze past and future soil moisture droughts that may cause subsidence by calculating annual drought magnitudes for France. The index is based on Interactions between Soil, Biosphere, and Atmosphere (ISBA) land surface model simulations. It is calculated for several vegetation types. A comparison of the annual values of this index with the number of insurance claims for subsidence shows that the presence of trees near individual houses must be taken into account. Historical and projected simulations are performed, with the main difference being the meteorological forcing provided to ISBA. The historical simulation covers the years 2000–2022 and uses the SAFRAN atmospheric reanalysis. The projected simulation covers the years 2006–2065 and uses an ensemble of climate models under Representative Concentration Pathways (RCPs) 4.5 and 8.5. The historical simulation shows particularly widespread droughts in France in 2003, 2018, 2019, 2020, and 2022. In 2022, particularly high drought index values are observed throughout the country. Projections show that drought conditions are expected to worsen in the future, especially under RCP 8.5 compared to RCP 4.5. The projections diverge significantly after 2046, and both the north and south of the country are equally affected.
- Article
(8015 KB) - Full-text XML
-
Supplement
(1975 KB) - BibTeX
- EndNote


Dry soils can cause shrinkage due to soil particles losing their adsorbed water molecules. This volume change is specific to clay minerals such as smectite, vermiculite, and montmorillonite, which are formed by weathering and found in surface deposits that are inherently heterogeneous. Soil shrinkage can cause irreversible damage to buildings when differential displacements occur between the dry clay soil and the soil beneath the foundation, resulting in cracks in walls as evidence of deformation. This phenomenon is known as clay-shrinkage-induced subsidence. It is a global issue, as described by Barthelemy et al. (2024), and has been extensively studied (Meisina et al., 2006; Vincent et al., 2009; Soubeyroux et al., 2011; Hawkins, 2013; Gourdier and Plat, 2018; Mostafiz et al., 2021; Tzampoglou et al., 2022). In France, this phenomenon affects 48 % of the territory to a moderate or strong degree (MTES, 2021). The “CatNat” (NatCat) scheme is a system under which the French state compensates for damages caused by natural disasters, including droughts that cause clay shrinkage. According to CCR (2023b), this hazard cost 2.9 billion euros in compensations for 2022, while a total of 20.8 billion euros has been spent since 1989. The cost of damages has reached an unprecedented level since 2017.
Increasing atmospheric CO2 concentrations are already causing significant climate changes globally (Lashof and Ahuja, 1990; Solomon et al., 2009; Hansen et al., 2013). An analysis of past conditions in Europe indicates changes in both precipitation and temperature patterns. Northern Europe is experiencing more precipitation, while southern Europe is becoming drier (Gudmundsson and Seneviratne, 2015). An increase in temperature has led to more dry and hot events in recent years compared to the second half of the 20th century (Manning et al., 2019). Climate projections also suggest drier meteorological conditions in Europe in the future (Spinoni et al., 2018). Some studies specifically examined changes in soil moisture trends. According to Samaniego et al. (2018), extreme agricultural drought events are expected to become more frequent, in line with precipitation and temperature projections. Despite its location between the wet north and the dry south, France is projected to experience drying trends in terms of both climatic conditions (Spinoni et al., 2018) and soil moisture (Vidal et al., 2012; Dayon et al., 2018; Soubeyroux et al., 2023). The most severe scenarios are expected to have larger impacts (Dayon et al., 2018).
Several estimates of the impact of climate change on the costs associated with subsidence due to clay shrinkage have been made for France (Gourdier and Plat, 2018; André and Marteau, 2022; CCR, 2023a). These estimates are based on damage models, which are statistical models used operationally by the insurance industry to estimate losses following a disaster. In cases of subsidence due to clay shrinkage, inputs such as precipitation, temperature, and soil moisture may serve as proxies for weather conditions. Inputs such as clay content may serve as proxies for soil properties. All estimates agree that costs increase as desiccation increases in response to climate warming. The accuracy of these predictions depends on the quality of the inputs.
Clay shrinkage is well understood but depends on very local context parameter values that remain poorly understood at large spatial scales due to the building structure, the complex soil moisture dynamics, and the heterogeneity of clayey soils. Research is currently underway to better understand the drivers of clay shrinkage in order to assist public authorities and the insurance industry. In a previous study (Barthelemy et al., 2023), a yearly drought magnitude index (YDMI) was developed specifically for this hazard, based on soil moisture simulations from the Interactions between Soil, Biosphere, and Atmosphere (ISBA) land surface model. The YDMI quantifies daily soil moisture anomalies summed over 1 year based on a soil layer at a depth of 0.80 to 1 m. Its characteristics were adjusted by comparison with a sample of insurance claims data.
The objective of this work is to improve the characterization of clay shrinkage occurrence factors and to statistically quantify the global number of insurance claims. The aim is not to determine the risk of damage for each house. A retrospective analysis of droughts in France since 2000 is presented. An insight into the climate-warming-induced trends of the YDMI is also given. The YDMI is first computed for a historical period (2000–2022) by forcing ISBA with the SAFRAN atmospheric reanalysis. YDMI trends through 2065 in response to global warming are then assessed by forcing ISBA with the outputs of six different climate models under Representative Concentration Pathways (RCPs) 4.5 and 8.5.
Section 2 presents the data used in this study, including the ISBA land surface model and historical and projected forcing, and the methods employed for index calculation and result analysis. The results are presented and described in Sect. 3, followed by a discussion and comparison with other works in Sect. 4. Finally, conclusions are drawn in Sect. 5.
This section describes the various surface simulations used and the concept of drought magnitude. The present analysis is summarized as a flowchart in Fig. 1.
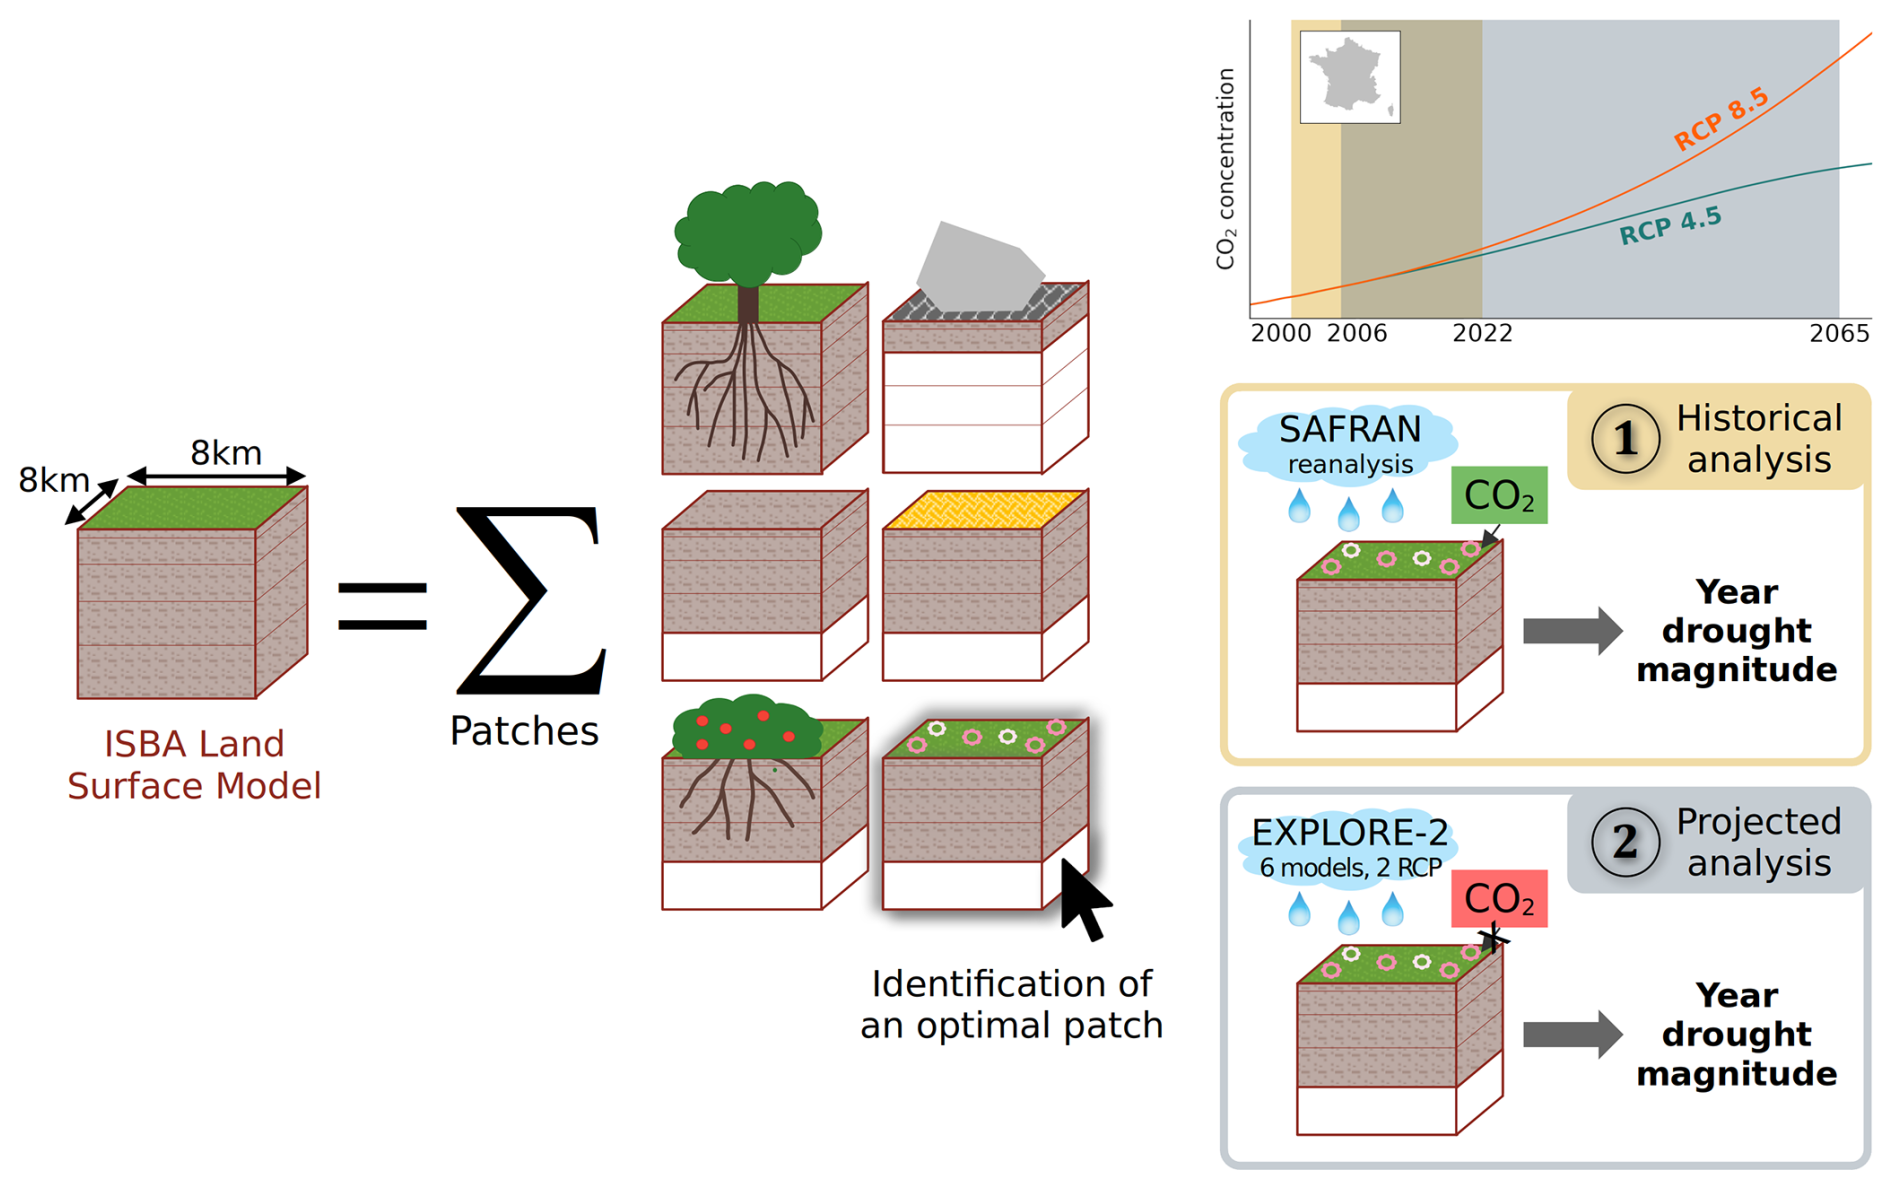
Figure 1Flowchart of the methodology deployed in this study with focus on vegetation patch selection and historical vs. projected analyses.
2.1 The ISBA land surface model
In this study, soil moisture is simulated by ISBA within version 8.1 of the SURFace Externalisée (SURFEX) modeling platform for numerical weather prediction and climate modeling (Masson et al., 2013; Le Moigne et al., 2020). The ISBA model calculates surface water and energy budgets in response to an atmospheric forcing. Soil moisture at a specific time is determined by the balance between water inflows from precipitation and outflows through runoff, infiltration, and evapotranspiration (Noilhan and Planton, 1989; Noilhan and Mahfouf, 1996). The ISBA model covers the entire French metropolitan area on an 8 km grid, totaling 8925 grid points. The SAFRAN–ISBA–MODCOU (SIM) hydrological suite (Habets et al., 2008) is used operationally to monitor water resources, along with a meteorological analysis and a hydrogeological model. In this case, ISBA is used offline, meaning there is no feedback from the surface to the atmosphere. SAFRAN is a mesoscale analysis of near-surface atmospheric variables, including air temperature, air humidity, wind speed, solid and liquid precipitation, and incident solar and infrared radiation fields. It combines surface observations and atmospheric model simulations (Quintana-Seguí et al., 2008; Vidal et al., 2010).
In this study, we employ a multilayer version of ISBA, ISBA-DIF (Boone et al., 2000; Decharme et al., 2011), which uses a diffusive scheme. To account for surface conditions, ISBA is based on the Richards equation (Richards, 1931) for modeling water transfer in unsaturated soils. Application of this equation requires knowledge of the matric potential. This variable can be derived from soil moisture through the soil water characteristic curve (SWCC), for which several equations exist in the literature. In particular, the Campbell (1974) equation used in ISBA requires knowledge of the soil moisture at saturation and the matric potential at saturation. These two properties are derived from the soil texture based on Clapp and Hornberger (1978). Therefore, ISBA simulates water flow in unsaturated soils but requires values of the parameters at saturation. The soil column is divided into layers, with increasing thicknesses at greater depths, to better represent hydrological processes and the plant root water uptake. This is necessary due to significant water and temperature gradients at the surface, which require a finer mesh. The number of layers considered is proportional to the rooting depth of the vegetation, with a maximum of 10 layers (adding up to 2 m depth) for trees. The definition of multiple layers at different depths is relevant because moisture variations depend on both the distance to the surface and the plant root density.
The ISBA model takes into account the influence of soil texture on moisture variations, as described by Decharme et al. (2011), using empirical pedotransfer functions. These functions establish a connection between parameters such as porosity, matric potential at saturation, and saturated hydraulic conductivity with sand and clay fractions. Specifically, the relationships derived from Clapp and Hornberger (1978) by Noilhan and Lacarrère (1995) are used. In this study, soil texture is (1) represented by the clay, sand, and silt contents derived from the Harmonized World Soil Database (HWSD) version 1.2 (Nachtergaele et al., 2012) at a kilometer resolution and is (2) assumed to be uniform throughout the soil column at each grid point.
To account for variability in land cover within a grid cell, ISBA runs separately for 12 patches. These patches include bare soil, rock, permanent snow, and nine generic plant functional types: deciduous broadleaf trees, evergreen broadleaf trees, coniferous trees, C3 crops, C4 crops, irrigated C4 crops, grassland, tropical grassland, and wetlands (C3 and C4 corresponding to different photosynthetic pathways). The separate runs can be aggregated by averaging the output variables and weighting each patch by its respective fraction in the grid cell. The depth of soil in a patch is determined by the rooting depth of the corresponding vegetation type and may vary from patch to patch. The geographic distribution of the patches and land surface parameters are derived from the ECOCLIMAP-II database at kilometer resolution (Faroux et al., 2013).
The ISBA model includes a representation of photosynthesis using a CO2-responsive stomatal conductance scheme, ISBA-A-gs (Calvet et al., 1998), because vegetation plays a critical role in near-surface soil moisture variations. This scheme has been improved over time to account for specific plant responses to drought (Calvet, 2000; Calvet et al., 2004). For each plant functional type, the ISBA-A-gs configuration simulates leaf area index (LAI) from modeled leaf biomass, considering the mass-based leaf nitrogen concentration (Calvet and Soussana, 2001). Phenology is driven by photosynthesis, which is affected by soil moisture, leaf temperature, solar radiation, and air humidity. Therefore, all environmental conditions can influence the simulated LAI. The LAI is updated daily. The simulated LAI has been validated at global (Gibelin et al., 2006), continental (Szczypta et al., 2014), and regional (Brut et al., 2009) scales. The ISBA model does not require calibration. Instead, its concept is to adjust the values of the parameters used in the different modeling steps based on the literature. As an example, the different values of the parameters used to model photosynthesis are detailed in Table 2 of Delire et al. (2020). ISBA has been compared with other land surface models as part of the International Land Model Benchmarking (ILAMB) system (Collier et al., 2018). Some results, available in Appendix B3 of Friedlingstein et al. (2022), indicate that the performance of ISBA is reasonable compared to other models. In particular, a higher skill is found for modeling vegetation leaf area index (LAI), which is crucial for estimating soil moisture. Peano et al. (2021) also show that ISBA is able to achieve good skill in representing plant phenology compared to other LSMs.
2.2 Historical and projected simulations
For this study, two different runs of ISBA were conducted, differing mainly in atmospheric forcing: (1) a historical simulation and (2) a projected simulation.
The historical simulation used the SAFRAN reanalysis to force ISBA with atmospheric data from 2000–2022. The atmospheric variables are available hourly on a regular 8 km grid. In this article, we refer to SAFRAN as a reference for the past climate.
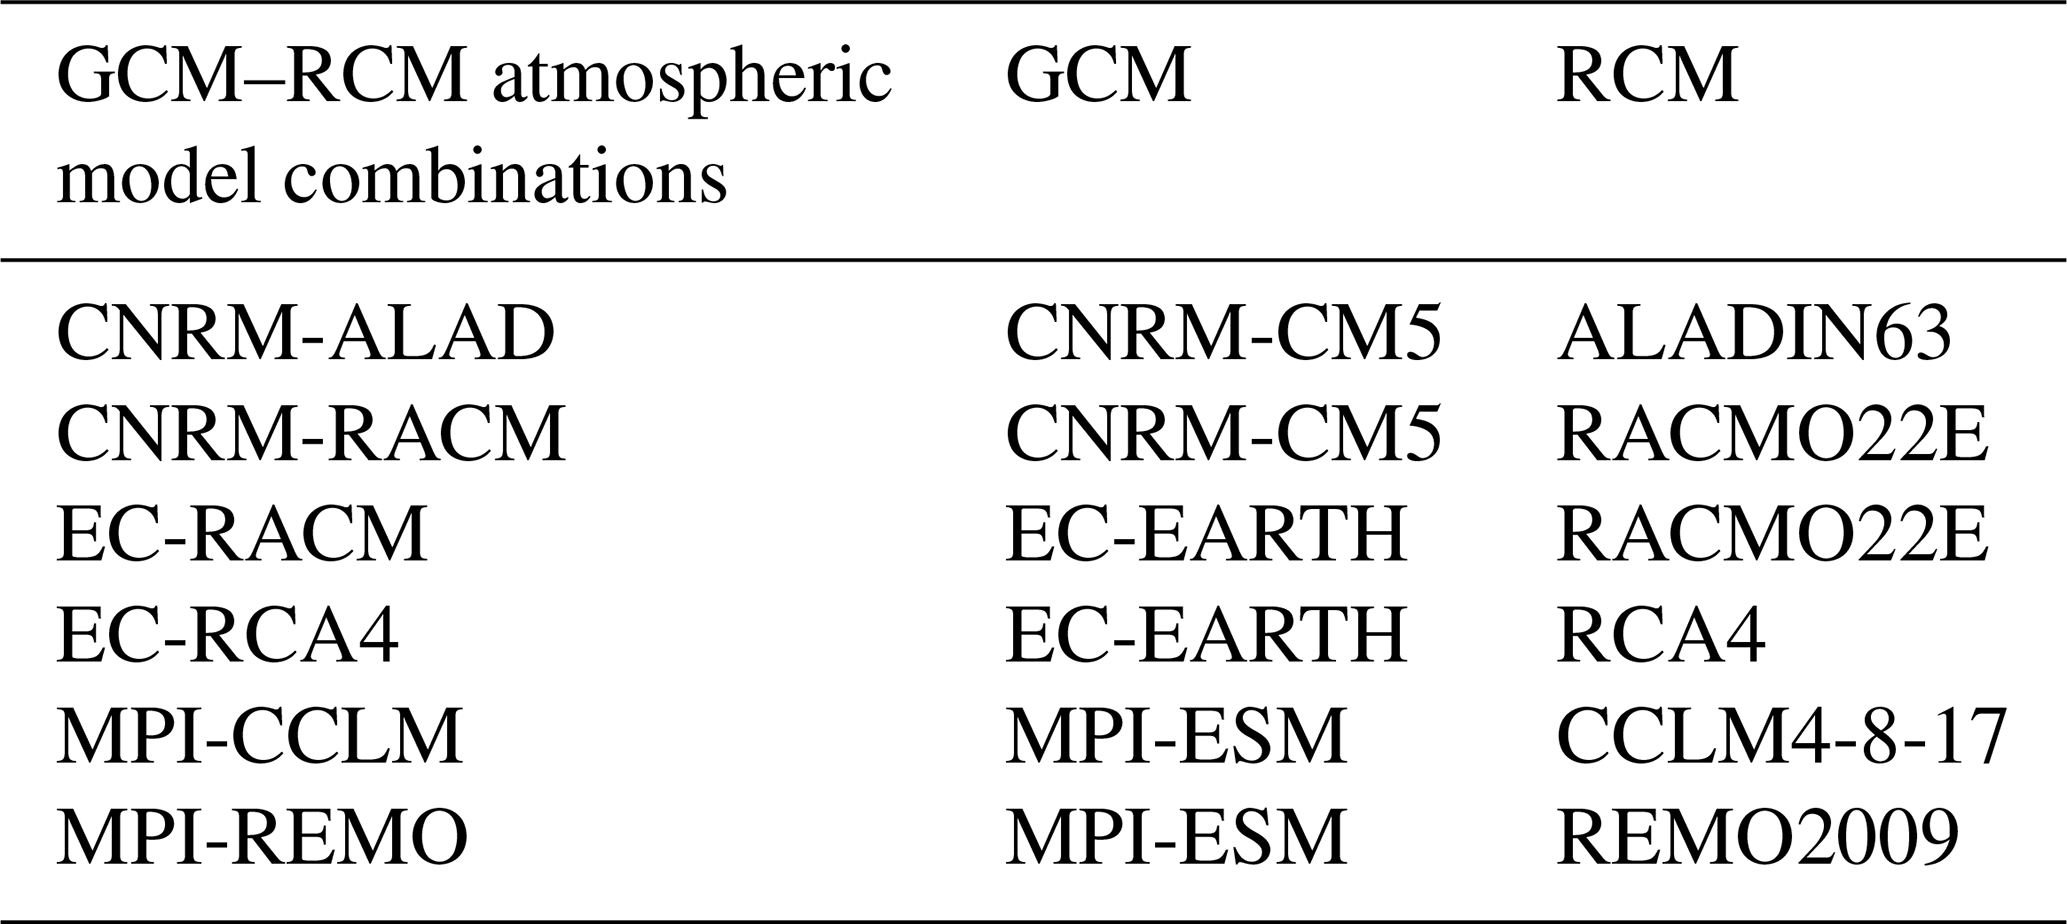
The projected simulation experiment was conducted by forcing ISBA with projected atmospheric forcing developed in the framework of the Explore2 project (Explore2 – des futurs de l'eau, 2024). The dataset was generated in several steps. Projected greenhouse gas (GHG) concentrations were fed into a selection of global climate models (GCMs) which were coupled to regional climate models (RCMs) through dynamical downscaling, yielding atmospheric variables over a future period. The data were corrected for bias by their comparison with the SAFRAN historical reference reanalysis, using the ADAMONT method (Verfaillie et al., 2017). The GHG trajectories selected were Representative Concentration Pathways (RCPs) 2.6, 4.5, and 8.5 (Moss et al., 2010), and the RCM selection was based on the EURO-CORDEX works (Jacob et al., 2014, 2020; Kotlarski et al., 2014). These simulations cover the period from 2006 to 2100. For this study, we have chosen to use the RCP 4.5 and 8.5 scenarios applied to a set of six GCM–RCM combinations (detailed in Table 1), which we will refer to as models. This amounts to a total of 12 simulations, providing a range of estimates. In Explore2, GCM–RCM selection is based on several criteria: availability for several RCPs, realistic behavior over Europe, absence of known errors, consistency of physical processes between GCM and RCM, and conservation of the dispersion modeled by EURO-CORDEX (Robin et al., 2023). The six GCM–RCM couples used in this study are a subset of the 12 couples that make up the DRIAS-2020 dataset, which is based on CMIP5 simulations (https://www.drias-climat.fr, last access: 26 May 2025). Our motivation for further reducing the ensemble size to 6 couples is related to limited computational resources. The choice is based on the dispersion of precipitation and temperature changes during the summer season (Figs. S8–9). The summer season is of particular importance for the phenomenon under study.
Table 1Six GCM–RCM atmospheric model combinations selected as forcing for the projected YDMI derived from the simulations of the ISBA land surface model.
As we deal with rising atmospheric concentrations of CO2, it is important to consider the conflicting effects of CO2 on vegetation growth. On the one hand, increased CO2 content stimulates photosynthetic activity by increasing the availability of its main substrate, resulting in increased leaf area and plant transpiration. On the other hand, elevated CO2 also causes stomatal closure, reducing leaf conductance to atmospheric gases and limiting transpiration. Climate change has been shown to have a significant impact on vegetation, as demonstrated by Laanaia et al. (2016), who predicted earlier leaf onset and peak LAI in the future. To reduce uncertainties, we disabled the effect of CO2 on vegetation in ISBA for the projected simulation experiment. We only considered data up to 2065, even though the projected forcing was available up to 2100, in order to limit uncertainties. For this experiment, we conducted 12 ISBA runs spanning 2006 to 2065, divided into three time horizons: near future (2006–2025), future (2026–2045), and distant future (2046–2065).
Both experiments provide hourly volumetric soil moisture data for all patches and layers. Volumetric soil moisture is defined as the water content of the soil, expressed in units of volume of water per unit of volume of soil (m3 m−3). Given our focus on long-term drought events, the data's hourly periodicity is unnecessary. Therefore, we can average the hourly soil moisture values to obtain daily values. Local factors such as the presence of trees around the buildings can play a significant role in the subsidence phenomenon during droughts (Freeman et al., 1992; Hawkins, 2013; Page, 1998). The impact of the local land cover variability can be reduced by the selection of a single vegetation patch. To conduct a nationwide analysis, we require a patch that exists throughout the entire territory. This limits our options to bare soil, rocks, deciduous broadleaf trees, C3 crops, C4 crops, and grassland patches. The patch selection was made by comparing YDMI simulations to insurance subsidence claims using the method developed by Barthelemy et al. (2023), which resulted in a choice of the deciduous broadleaf tree patch. The analysis also revealed the highest correlations for deep model layers, leading us to focus on the moisture variations in model soil layer 8 (at a depth between 0.8 and 1.0 m), as described in Barthelemy et al. (2023). In fact, deep soil moisture is less affected by the rapid succession of rainfall and drought experienced by surface soil moisture. The slower changes in deep soil moisture values are more consistent with the slow kinetics of clay shrinkage. More information on the methodology and results can be found in the Supplement (see Fig. S1).
Therefore, this work will analyze ISBA outputs for the single deciduous broadleaf tree patch configuration, specifically for the eighth model soil layer located at a depth between 0.8 and 1.0 m. For the present analysis, we have chosen to exclude mountainous areas. The reliability of ISBA simulations in mountainous areas may be lower due to the coarse spatial resolution. Weather conditions can change rapidly in rugged terrain, such as from one valley to another. Additionally, there is a major drawback to applying our method in a mountainous context. The YDMI is calculated from the liquid water content of the soil, which decreases in winter as soil temperatures fall below the freezing level. Liquid soil moisture distributions are biased by this phenomenon, which also affects the index computations. In mainland France, at a depth between 0.8 and 1.0 m, this phenomenon is only present in mountainous areas. These areas are identified by considering a threshold of 1100 m for the grid cell average altitude. We selected this value after analyzing ISBA soil ice patterns. A total of 567 grid cells (6.4 %) meeting this condition were filtered out of the 8925 grid points.
2.3 The YDMI
The YDMI is used to characterize drought patterns based on soil moisture variations (Barthelemy et al., 2023). This index calculates the average integral of daily soil moisture in 1 year under threshold values ranging from the first to the fifth percentiles of the empirical distribution. Although originally designed to characterize clay-shrinkage-triggering conditions, it can be used more generally to identify long-term drought trends in soils. No fitting to a known statistical law is necessary, and this avoids assumptions about the distribution of soil moisture and its stability under a fluctuating climate.
The two sets of YDMI values are referred to as historical and projected magnitudes. The drought threshold values for the projected simulations are determined by the percentiles of the daily soil moisture distribution for the near-future time horizon of 2006–2025 only. The percentiles that define the thresholds are computed separately for each simulation (1 historical and 12 projected simulations), ensuring that droughts that occur with equal frequency are identified, even if the models are biased (Fig. S2). The statement that the longer the period, the more robust the distribution is not applicable in this context due to the hypothesis of a stable soil moisture distribution being irrelevant in the context of climate change. Additionally, basing the reference on the first 20 years allows the identification of emerging trends during this period. Assuming a fixed definition of drought based on past values implies no adaptation and unchanged vulnerability of assets to drought conditions. This assumption is relevant in the context of clay-shrinkage-induced subsidence, which mainly affects homes already built.
The YDMI result is classified into four classes ranging from no drought (class 0) to extreme drought conditions (class 3). The methodology proposed by Barthelemy et al. (2023) for defining the classes involves sorting all positive YDMI values into three groups of equal size to form classes 1, 2, and 3 of increasing YDMI values, while all null values are assigned to class 0. The zoning of the classes is defined based on the historical YDMI set to ensure consistency between the two experiments.
2.4 Statistical analysis
The analysis focuses on the YDMI values obtained from historical and projected experiments. In Sect. 3.1, we describe the spatial patterns of the historical YDMI by commenting on individual maps for each year. Subsequently, we investigate differences in the historical and projected YDMI in Sect. 3.2. Firstly, we provide a preliminary assessment by comparing their distributions while separating them by RCP scenario, model, and time horizon. To investigate trends for each model and scenario, we performed a non-parametric Mann–Kendall test (Wilks, 2011). The null hypothesis associated with this test is the absence of trend, and the resulting p value indicates the probability of obtaining such an outcome if the null hypothesis were correct. These results provide insight into the statistical significance of patterns in our data. After conducting this model-wise assessment, we compare in each point the third quartile (75th percentile) of the YDMI between historical and projected sets, separated by RCP and time horizon. The third quartile was chosen as an indicator because it allows the characterization of upper trends and because it is more robust than the maximum. This provides spatialized and robust information on future drought trends. Finally, we assess trends in drought spatial extent by comparing the distribution of model grid cells in each YDMI class annually for each set, RCP scenario, and time horizon. Due to the expected opposite precipitation trends in northern (wetting) and southern (drying) Europe with global warming (Spinoni et al., 2018), we conducted an analysis at the national scale and for the two French regions, Grand Est and Occitanie, located in the north and south of the country, respectively.
2.5 NatCat regime
The national natural disaster compensation scheme in France is called “CatNat” (NatCat). It covers major natural disasters, including subsidence caused by clay shrinkage. Homeowners can only be compensated if their municipality is recognized as being in a state of natural disaster with respect to a specific hazard. Municipalities are the smallest French administrative units (there were 34 955 municipalities as of 1 January 2022). This recognition is done through the publication of an official decree for a given year. The criteria for recognition are based on exceptional events, with a return period of more than 10 years, that cause claims to be selected. One of these criteria relies on ISBA simulations based on a simplified version of the model (Barthelemy et al., 2023). The CCR website has the details of each decree, including the municipalities that have made the demand and the final decision. These details are available online (https://catastrophes-naturelles.ccr.fr/les-arretes, last access: 26 May 2025). This paper compares the historical YDMI with NatCat recognition requests. The latter are used as a proxy for drought-induced clay shrinkage.
3.1 Historical drought magnitudes
Figure 2 shows the YDMI values for the years 2000 to 2022, computed from the ISBA historical simulation. Similar maps, which plot YDMI classes and dominant drought months, are available as Figs. S3 and S4 in the Supplement. The years 2003, 2018, 2019, 2020, and 2022 stand out for their high YDMI values. The 2022 drought event is the most remarkable of the 23-year series, in terms of both its geographic extent and its intensity. The southwestern region was the most affected. The year 2003 ranked second in terms of impact, affecting the northeastern to southwestern zones of the country and Brittany. In contrast, the events of 2018 and 2020 were more localized, mainly affecting the central to northeastern regions and, in 2020, the Rhône corridor. In 2019, a central to southwestern area was affected, except for the Cévennes. In addition to these large, widespread droughts, there were also several more localized events, such as the one in Brittany in 2006 and the one in the southeast and Corsica in 2017. This historical analysis allows us to identify 2003, 2018, 2019, 2020, and 2022 as significant drought years and provides a reference for assessing future droughts.
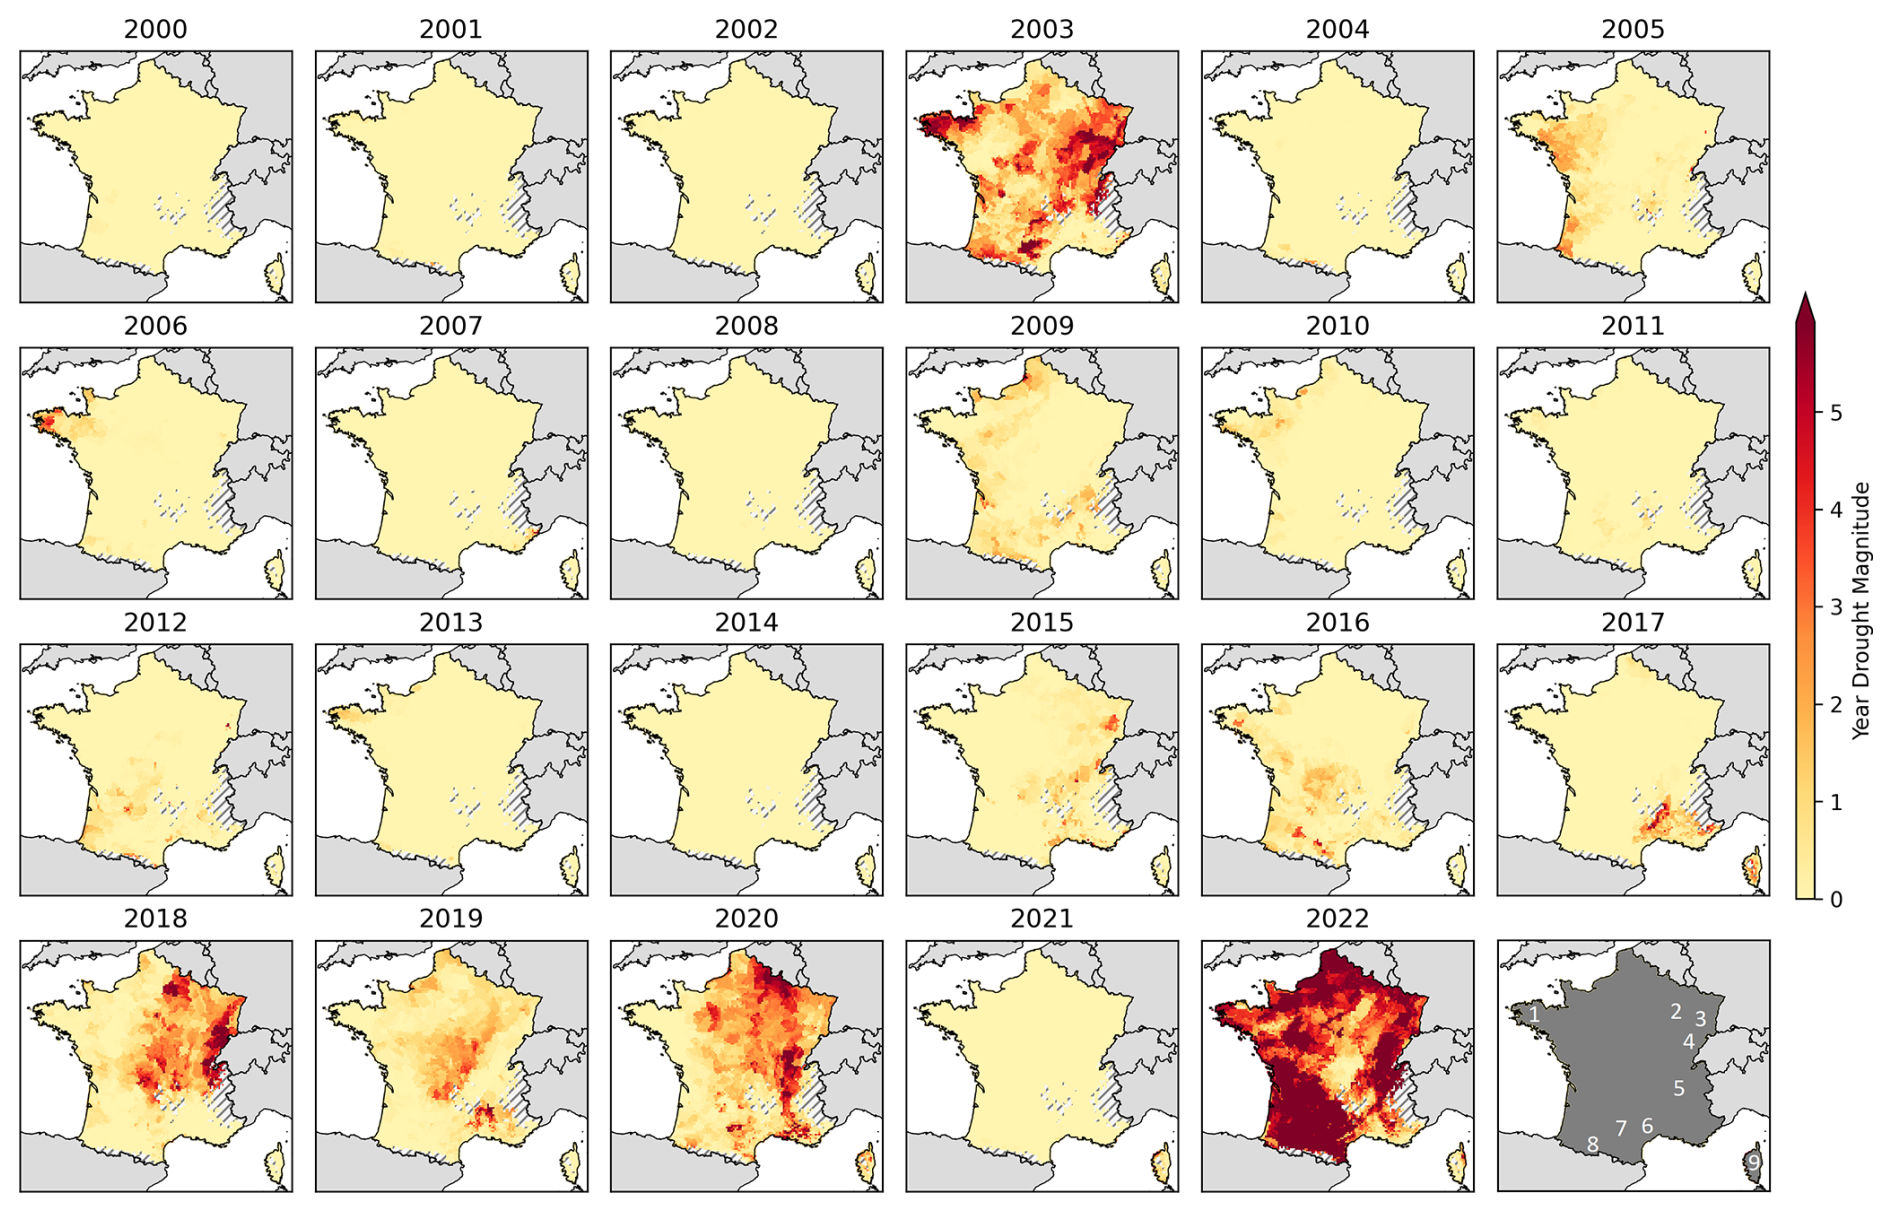
Figure 2Drought magnitudes for the years 2000 to 2022, computed over France in each grid cell from the ISBA historical simulation. Areas with gray hatching correspond to filtered mountain areas (average altitude > 1100 m). In the bottom-right subfigure, the following areas are indicated by numbers from 1 to 9: Brittany (1), Grand Est (2; see also Fig. 6), Vosges (3), Jura (4), Rhône corridor (5), Cévennes (6), Occitanie (7; see also Fig. 6), Pyrenees (8), and Corsica (9).
3.2 Projected drought magnitudes
Figure 3 presents the projected distributions of the YDMI for different RCP scenarios, models, and time horizons. The gray box encompasses all models. The distribution of the historical YDMI is represented by the yellow box labeled 2000–2022. Table 2 provides the values of the third quartile (75th percentile). For the first time horizon (2006–2025) and both RCPs, there are minimal differences between models and historical YDMI values. The results show a divergence with increasing time horizons. Although the distributions vary considerably for each model, the combination of all models indicates an upward trend over time. This effect is more pronounced for RCP 8.5 than for RCP 4.5. Specifically, the third quartile of the YDMI is multiplied by 2 (0.2 to 0.40) for RCP 4.5 and by 3 (0.21 to 0.62) for RCP 8.5 from the near future to the distant future, considering all models together.
Table 2Third quartile (75th percentile) of historical and projected YDMI statistical distribution for RCP 4.5 and RCP 8.5, separating time horizons and atmospheric models. YDMI values larger than or equal to 0.4 are in bold.
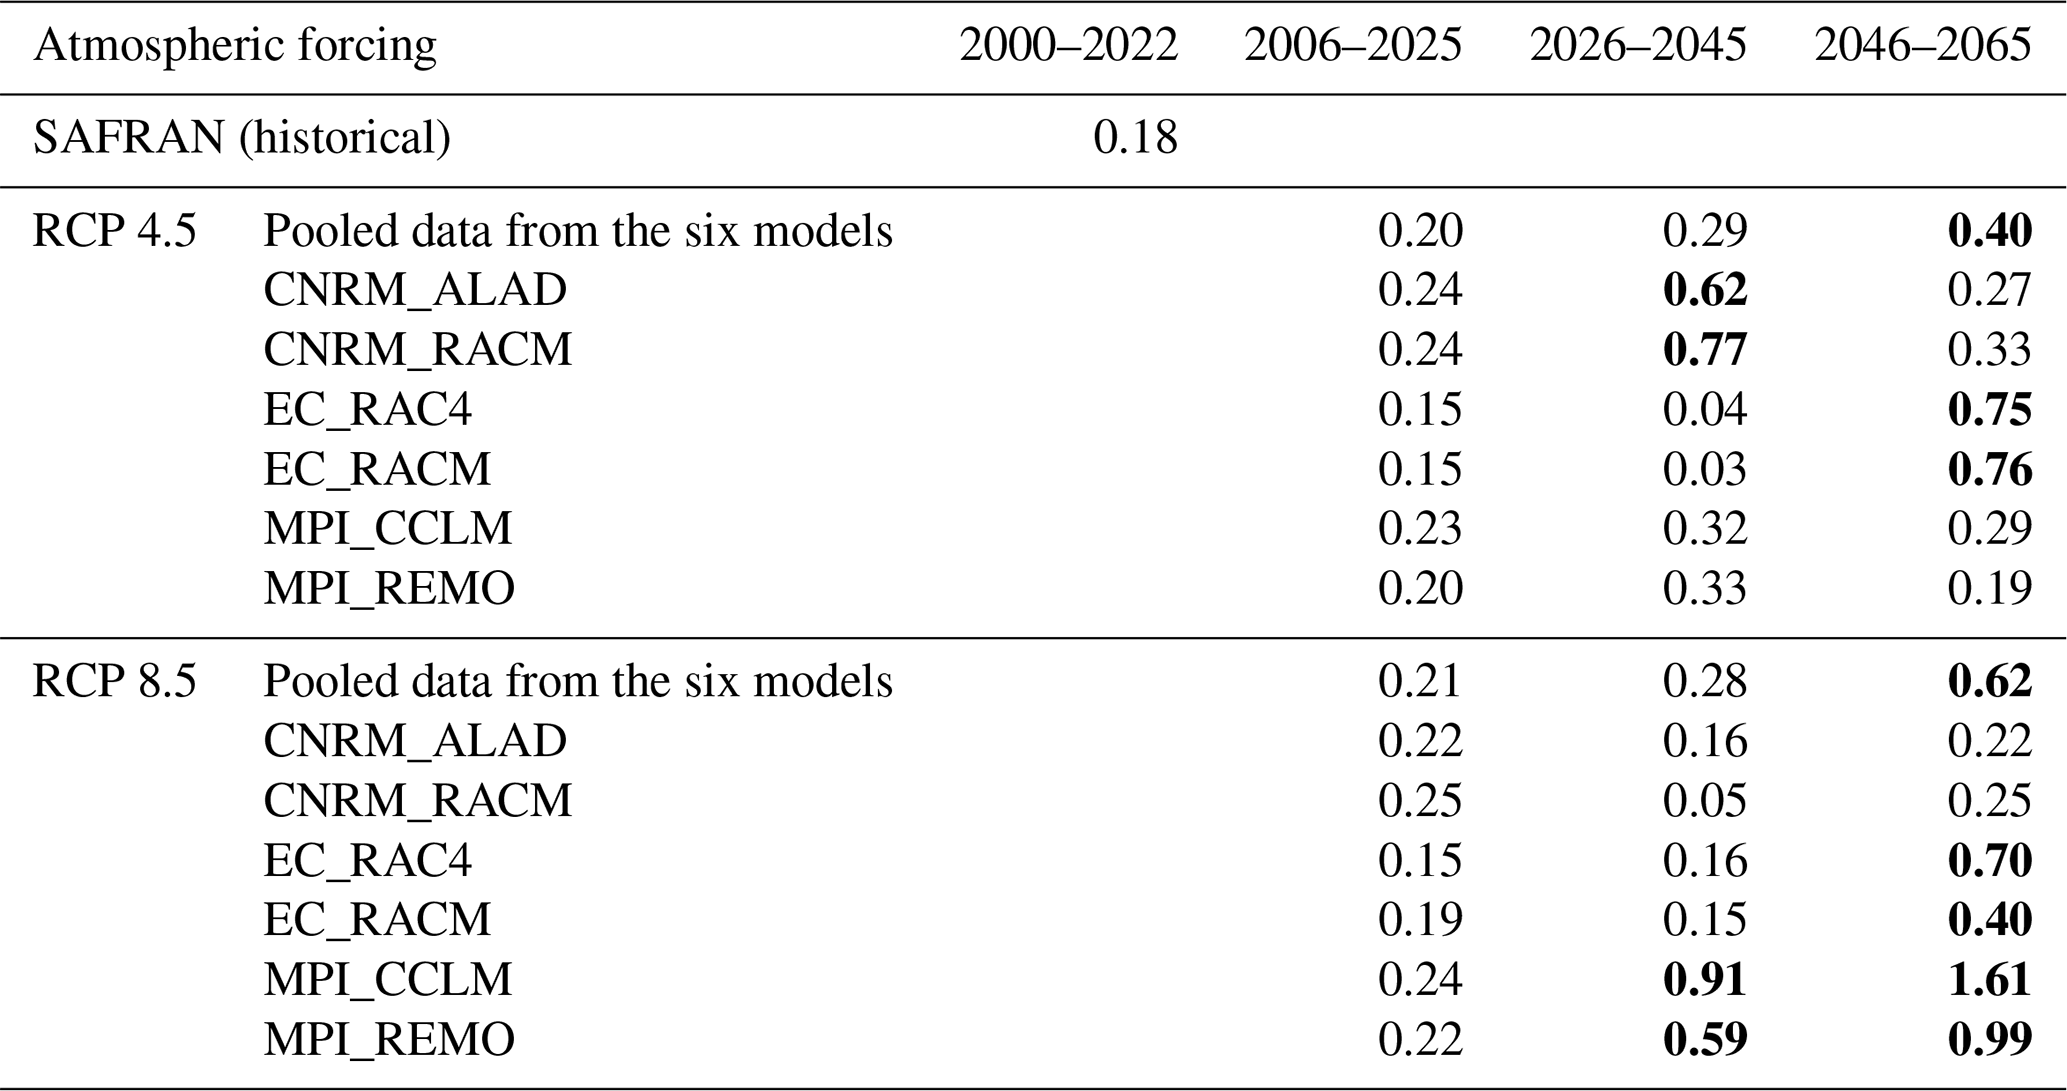
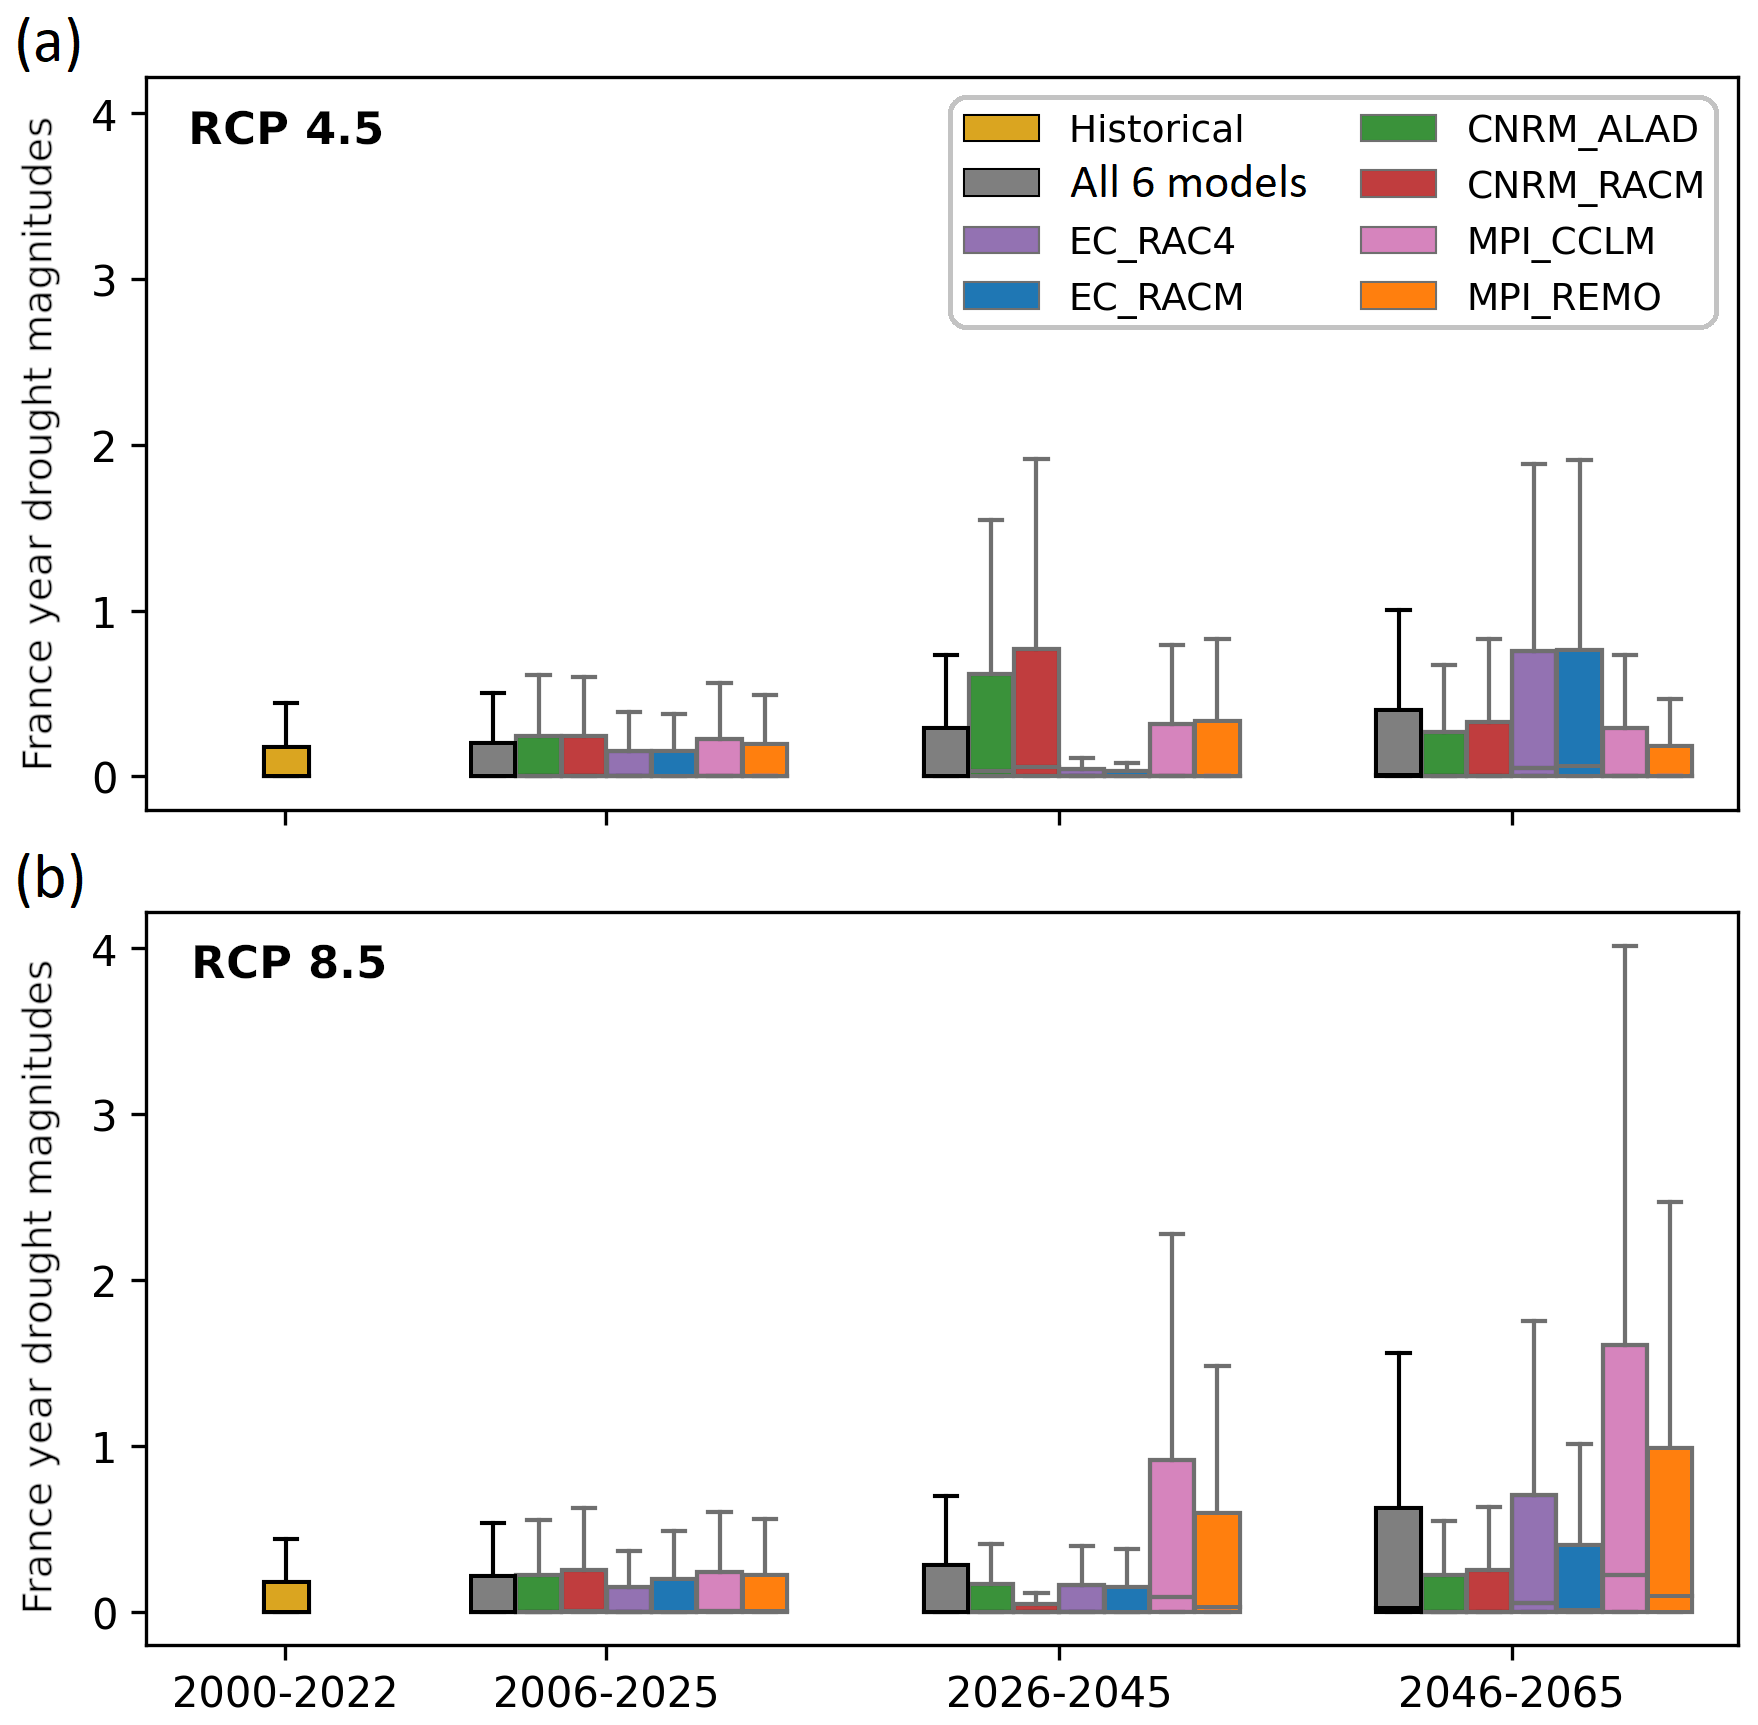
Figure 3Projected YDMI distributions for (a) RCP 4.5 and (b) RCP 8.5, separating time horizons and models. The gray box corresponds to the distribution of all models combined. The distribution of historical magnitudes is plotted as well (yellow box) for comparison. The box edges and center correspond to the 25th, 75th, and 50th percentiles. Whiskers extend to 1.5 times the interquartile range, equal to the difference between the 75th and 25th percentiles. Outliers are not displayed.
Figure 4 displays the trends in the YDMI identified by the Mann–Kendall test for each of the 12 projected simulations processed separately. The different models present contrasting results for both RCPs. Although some punctual decreasing trends are identified, more in RCP 4.5 than in RCP 8.5, patterns of increasing YDMI dominate with higher confidence levels. This is particularly true for the EC-RCA4 and EC-RACM models in RCP 4.5 and for models EC_RCA4, MPI_CCLM, and MPI_REMO in RCP 8.5. For RCP 4.5, most models identify an increase in the southwestern region of the country, although the affected ISBA grid points rarely overlap between models. For RCP 8.5, four out of six models identify a more widespread increase in the same area, with half of them having higher levels of confidence. In three of the models, the increase extends as far as the northeast, and, for MPI-CCLM, it is maximal in the west.
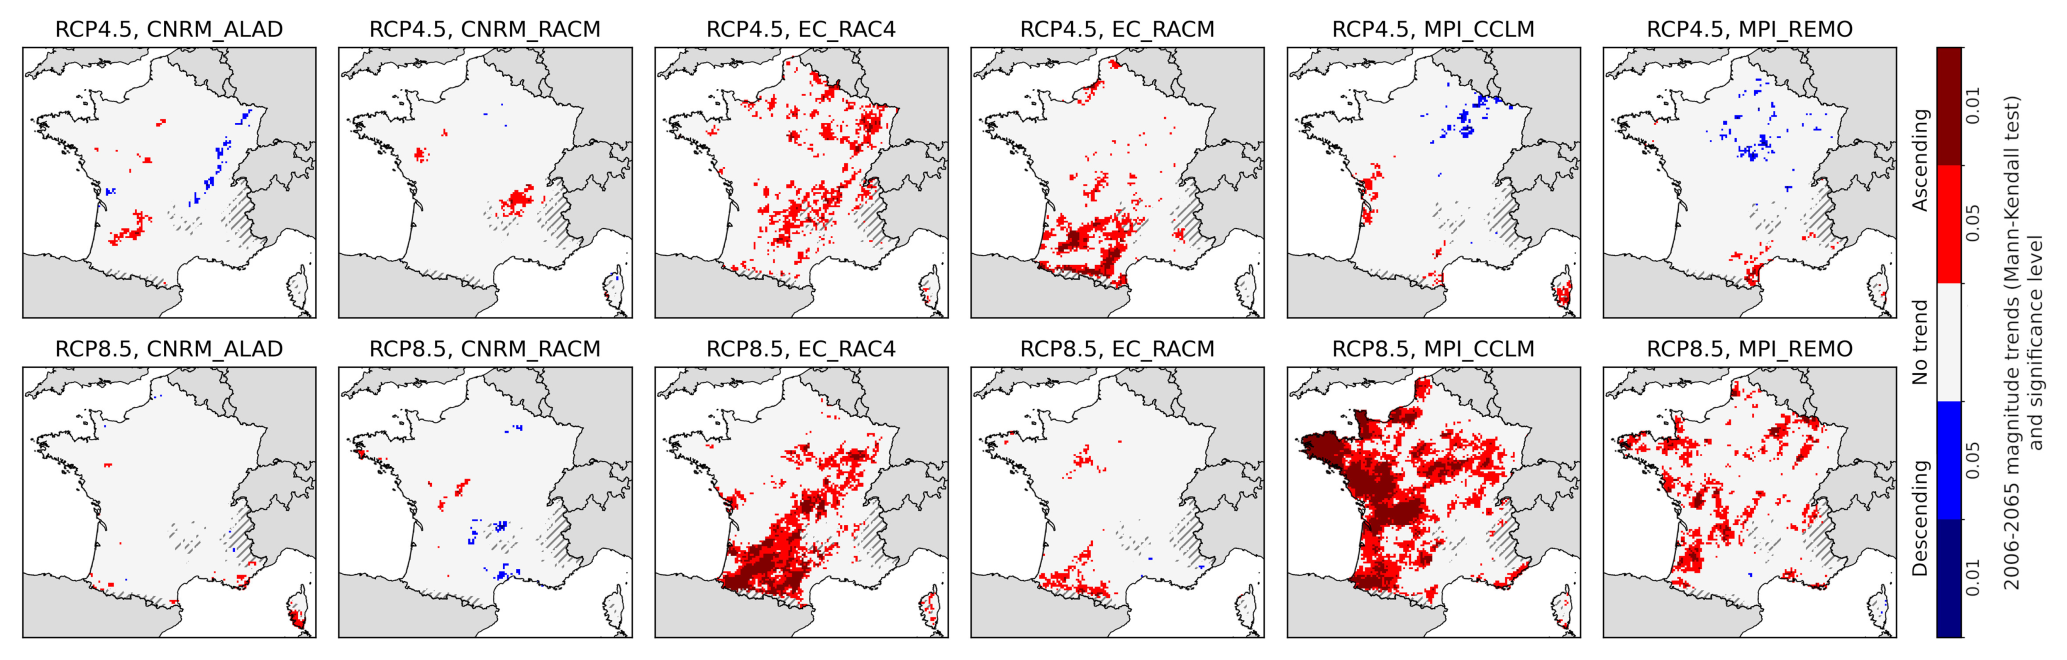
Figure 4Results of the Mann–Kendall trend test applied to YDMI values from the 12 projected simulations, over the period 2006–2065. The ascending trends are marked in red, while the descending trends are marked in blue. The darker the color, the higher (smaller) the statistical significance (p value). The two rows correspond to the two RCPs, and the six columns correspond to the six models. Areas with gray hatching correspond to filtered mountain areas (average altitude > 1100 m).
Figure 5 displays the third quartile (75th percentile) of the YDMI in each grid cell, combining all models and separating time horizons and RCP. Focusing on the third quartile allows a more robust analysis of trends in the highest YDMI values of the dataset compared to the maximum. The historical subplot indicates that the southwest and center of France have been the most affected by the high YDMI, as observed on the individual maps. There is an observed trend of increasing YDMI over time, as seen across all models. Projections for both scenarios are similar up to 2045 but diverge in the final time horizon of 2046–2065, with RCP 8.5 showing a more significant increase. The two scenarios agree on an increase, but on different scales, in southwestern France bordering the Pyrenees and in eastern France from the Jura to the Vosges. Although we did not anticipate any differences between the YDMI projected for the historical period (2000–2022) and the near-future period (2006–2025), we did observe higher YDMI values in the former.
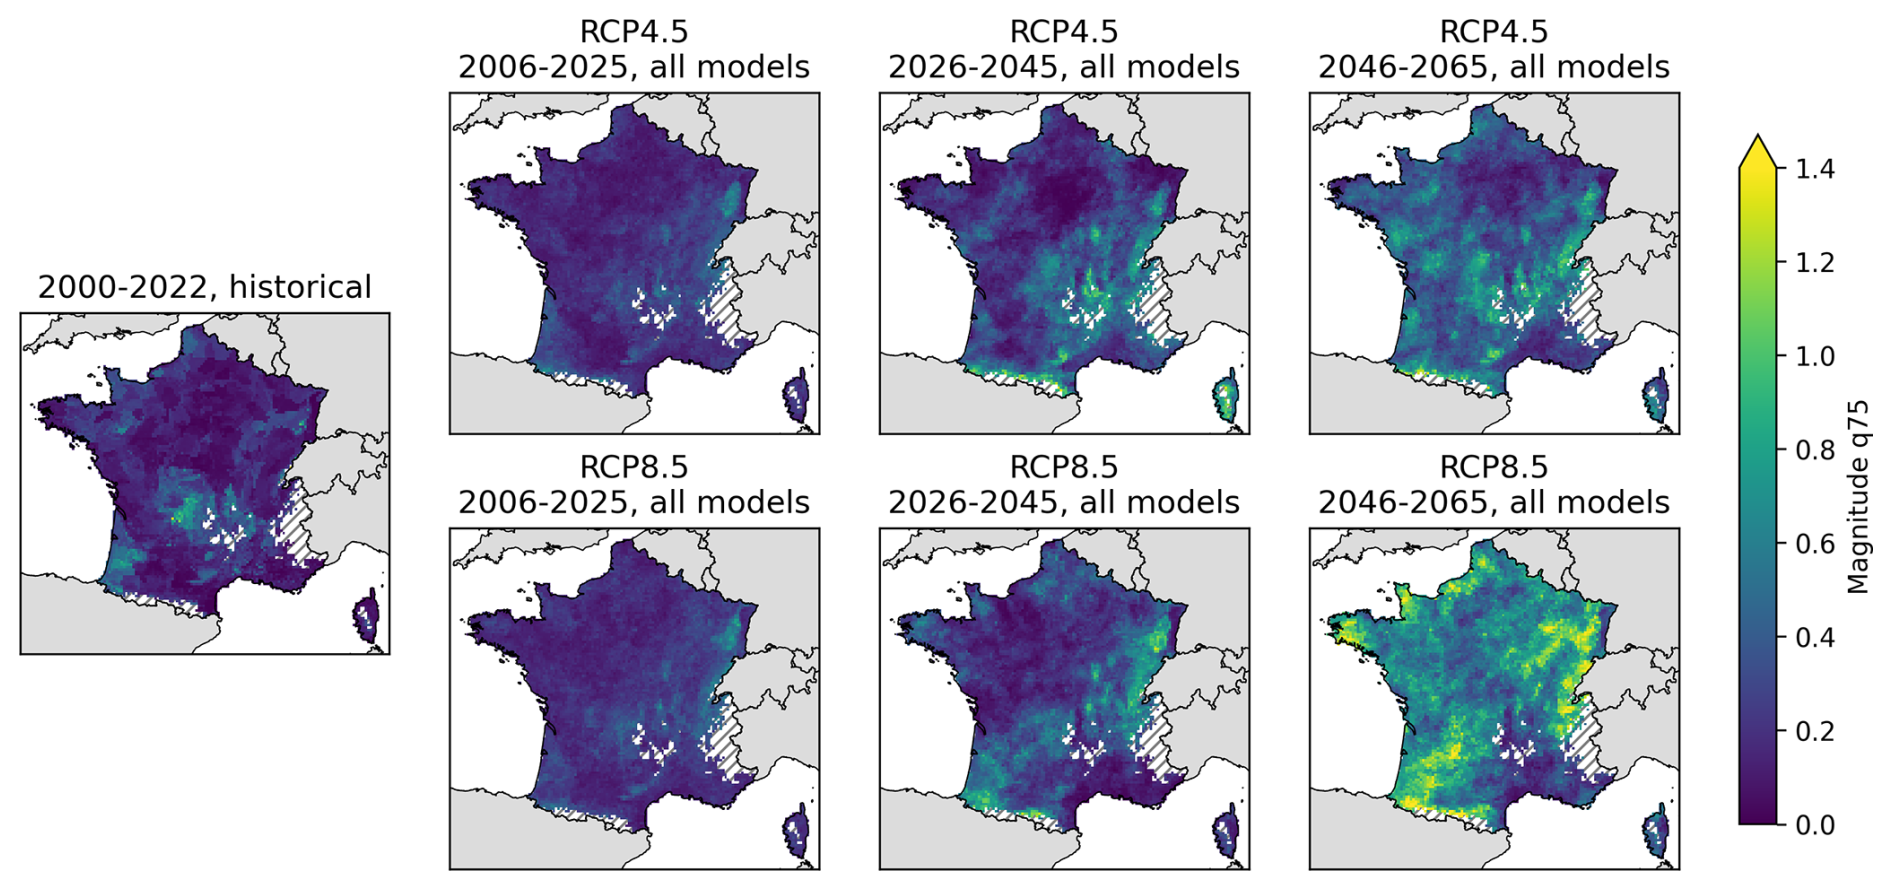
Figure 5Third quartile (75th percentile) of the YDMI, separating time horizon and RCP. Areas with gray hatching correspond to filtered mountain areas (average altitude > 1100 m).
Figure 6 displays the YDMI class fractional area for each YDMI class, separated by time horizon and RCP scenario, for France and for the Grand Est and Occitanie regions. It is observed that the proportion of drought-free years tends to decrease with time for both scenarios for France, with the average percentage of grid cells per year in class 0 decreasing from 60 % for 2000–2022 to 40 % for 2046–2065 in RCP 8.5. Compared to class 0, the percentage of cells with nonzero YDMI values (classes 1, 2, and 3) increases, particularly for RCP 8.5. Class 3 is the only category defined solely by a lower bound criterion; therefore it concentrates extreme events, resulting in a high number of outliers. Sect. 3.1 identifies 5 notable drought years for the period 2000–2022, which stand out as class 3 outliers: 2022 (with 90 % of France in class 3), 2003 (60 %), 2020 (50 %), 2018 (35 %), and 2019 (20 %). It is worth noting that the historical year 2022 remains unmatched in terms of drought, all models and scenarios considered. The projected class 3 outliers are biased downward compared to the other historical class 3 outlier years (2003, 2020, 2018, 2019). In addition to the observed inconsistency, there are significant differences in the distributions of historical and near-future YDMI values. This finding was unexpected, given the large time overlap (2000–2022 vs. 2006–2025). A higher proportion of null YDMI and a lower proportion of nonzero YDMI were found for the historical experiment compared to the projected experiment, which is related to the outlier difference mentioned above. Similar conclusions can be drawn for the Grand Est region (Fig. 6b) and Occitanie (Fig. 6c). During the historical period, Grand Est experienced fewer droughts than Occitanie. However, both regions are projected to experience a drying pattern. This indicates that the differences between the historical and projected YDMI are greater for Grand Est than for Occitanie.
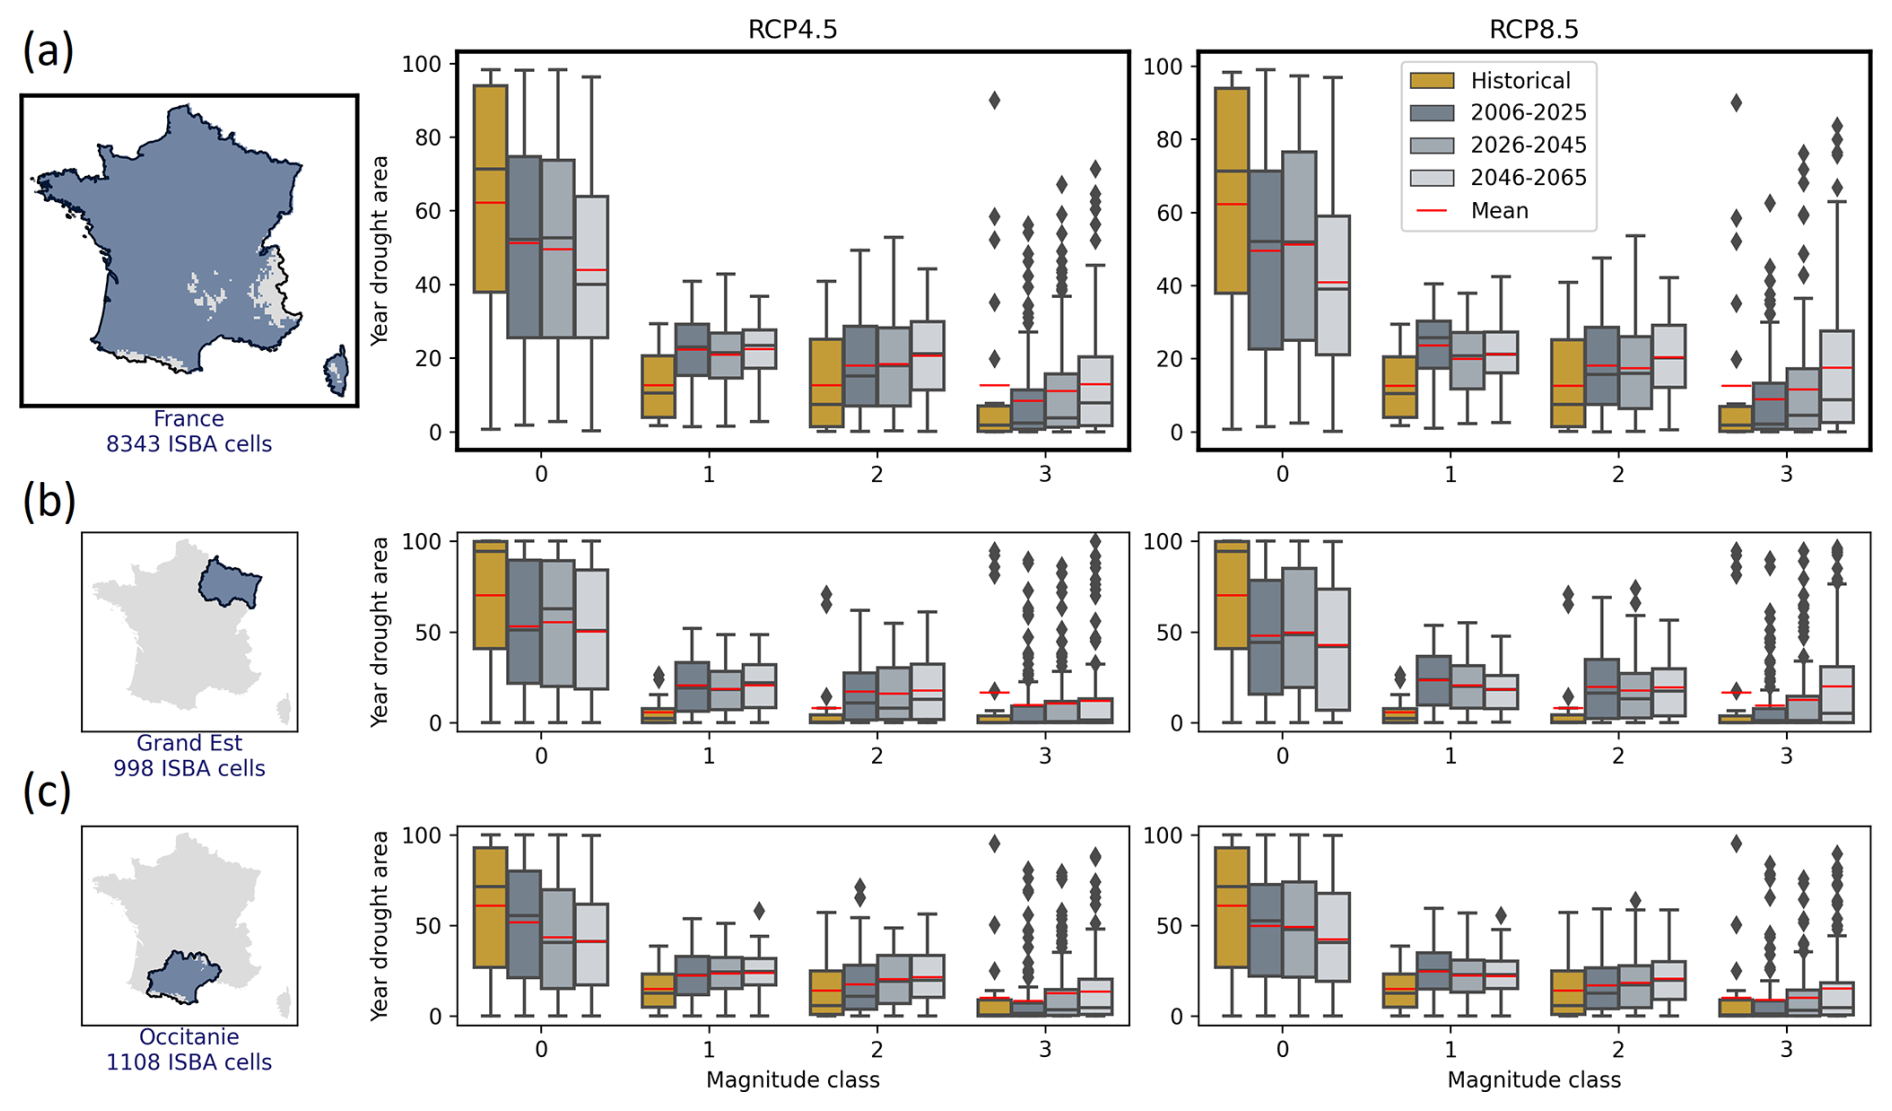
Figure 6YDMI class fractional area expressed as a percentage of model grid cells, separating the time horizon and the RCP scenario, for (a) France, (b) the Grand Est region, and (c) the Occitanie region. Whiskers extend either to the maximum or to 1.5*, the interquartile range, equal to the difference between the 75th and 25th percentiles, if inferior to the maximum. Means and outliers are shown as red features and black diamonds, respectively.
The objective of this work is to describe drought trends in France, in both the past and future periods. In the previous section, we presented a retrospective analysis of droughts in France between 2000 and 2022 by calculating the YDMI using ISBA and the SAFRAN reanalysis. There are 5 years that stand out (in order of importance): 2022, 2003, 2020, 2018, and 2019. We then analyzed future YDMI trends until 2065 under RCP 4.5 and RCP 8.5. All models indicate that drought characteristics will worsen in the future, particularly under RCP 8.5. We discovered unexpected differences between historical and near-future YDMI values. In this section, we will discuss these findings in relation to other studies.
4.1 Is the historical YDMI consistent with external sources of information?
To evaluate the significance of the YDMI in monitoring clay-shrinkage-induced subsidence, we compare the retrospective index with the history of issued NatCat recognition requests. Figure 7 compares the distribution of the YDMI in France for each year, sorted into four classes, with the number of NatCat requests issued. It is important to note that drought is not the only factor causing clay shrinkage. The presence of clay mineral is necessary, and the level of damage is also highly dependent on the structure of the building (weight, stiffness, foundations). Therefore, we do not anticipate a perfect correlation between the index and the requests. However, it is the most significant factor that changes over time, making year-to-year comparisons relevant. It is important to note that the comparison is made using the total number of requests, not just the accepted ones that led to a decree, as one of the recognition criteria is based on ISBA. As explained in the previous section and illustrated in Fig. 7a and b, the YDMI identifies 2022, 2003, 2020, 2018, and 2019 as significant drought years in order of importance. Figure 7c shows that the highest numbers of requests are concentrated in these years. Specifically, in 2003 and 2022, there were more than 7500 requests, which is over 20 % of all French municipalities. However, it is important to note that there is a bias in the NatCat dataset, as the number of requests issued each year increases with time. For instance, there were no requests in only 2 years: 2000 and 2001. Similar drought conditions occurred later in the record (2002, 2004, 2007, 2008, 2014, 2021), but this time they were associated with requests. This phenomenon is widely recognized in the insurance industry. Although the conditions remain the same, the number of requests increases over time due to two reasons: (1) an increase in awareness of the issue and (2) some municipalities repeating the process each year after their initial request is denied.
The European Drought Observatory (EDO) is a service provided by the Joint Research Center (JRC) of the European Commission. Since 2011, it has been reporting on significant drought events in Europe. Each report provides detailed information on the characteristics of the drought event at different levels, including temperature, precipitation, soil moisture, and vegetation. The assessment of soil moisture is based on simulations performed by the JRC hydrological model LISFLOOD. To ensure objectivity, we compared our YDMI retrospective with independent reports. Météo-France also conducts similar studies, but they are based on ISBA simulations. For the period 2011–2022, we collected five reports on the years 2015, 2018, 2019, 2020, and 2022. The 2015 report by Micale et al. (2015) indicates that France, particularly its eastern region, experienced a significant soil moisture deficit during the summer, surpassing that of 2003. In 2018, France experienced a drought that began in September in the northeast and spread to the rest of the country by the end of the month (Masante et al., 2018). The 2019 report by Masante et al. (2019) describes an event that mainly affected central France. In 2020, the drought episode centered on France throughout the summer, with the northern half of the country being the most affected (Barbosa et al., 2020). The 2022 report by Toreti et al. (2022) describes significant soil moisture anomalies throughout the country, which is consistent with our findings. All these works highlight the same drought years, except for 2015. The location of the event also matches, such as central France in 2020 or the entire country in 2022. However, YDMI values in 2015 do not correspond to the EDO report. The event may have gone undetected due to the drought not propagating in depth this year.
4.2 How can differences between the historical and the projected YDMI be explained?
Section 3.2 describes the differences between the historical and the 2006–2025 projected YDMI. These differences were unexpected because of the time overlap and the weak divergence of CO2 concentrations in the projected near future. The projected simulations are more pessimistic in the median and more optimistic at the extremes than the historical simulations. The gap in the data can be attributed to differences in climate forcing between reanalysis and climate models, specifically in temperature or precipitation fields. A comparison of the precipitation and temperature fields of the SAFRAN reanalysis and the climate projections over their common period (2006–2022) is presented in the Supplement (Figs. S5–7). The climate projections tend to underestimate the median daily mean temperatures by less than 1 °C and to overestimate the higher daily maximum temperatures by more than 1 °C. The majority of models are in agreement on these two points. The analysis of precipitation in Fig. S5 shows that annual precipitation is underestimated in the northwest and overestimated in the southeast of France. Interestingly, all models are affected by this bias. This shows that differences in climate forcing could indeed contribute to the explanation of the discrepancy between the historical and the projected YDMI. A recent study by Vautard et al. (2023) demonstrated that CMIP6 climate models had difficulty simulating temperature extremes in western Europe. Underestimation of high temperatures results in the underestimation of drought, as high temperatures drive evaporative fluxes. The reason for the difference may also be found deeper in the modeling process, specifically in the land surface model. The only variation between the simulations is the CO2 feedback on vegetation, which is enabled for the historical simulation and disabled for the projected simulation. This could lead to a dissimilar vegetation response for the same CO2 levels. Berg and Sheffield (2018) suggest that failing to account for the impact of CO2 on plant water use could result in a significant bias in soil moisture fluctuations. Although we previously identified two opposing effects of CO2 on plant transpiration (Sect. 2.2), reduced stomatal conductance may dominate, resulting in limited transpiration and thus limited soil desiccation.
4.3 What are the sources of uncertainty?
The study's findings are the result of a lengthy modeling process. It is important to interpret them with care, considering the uncertainties associated with each step. These uncertainties are listed below.
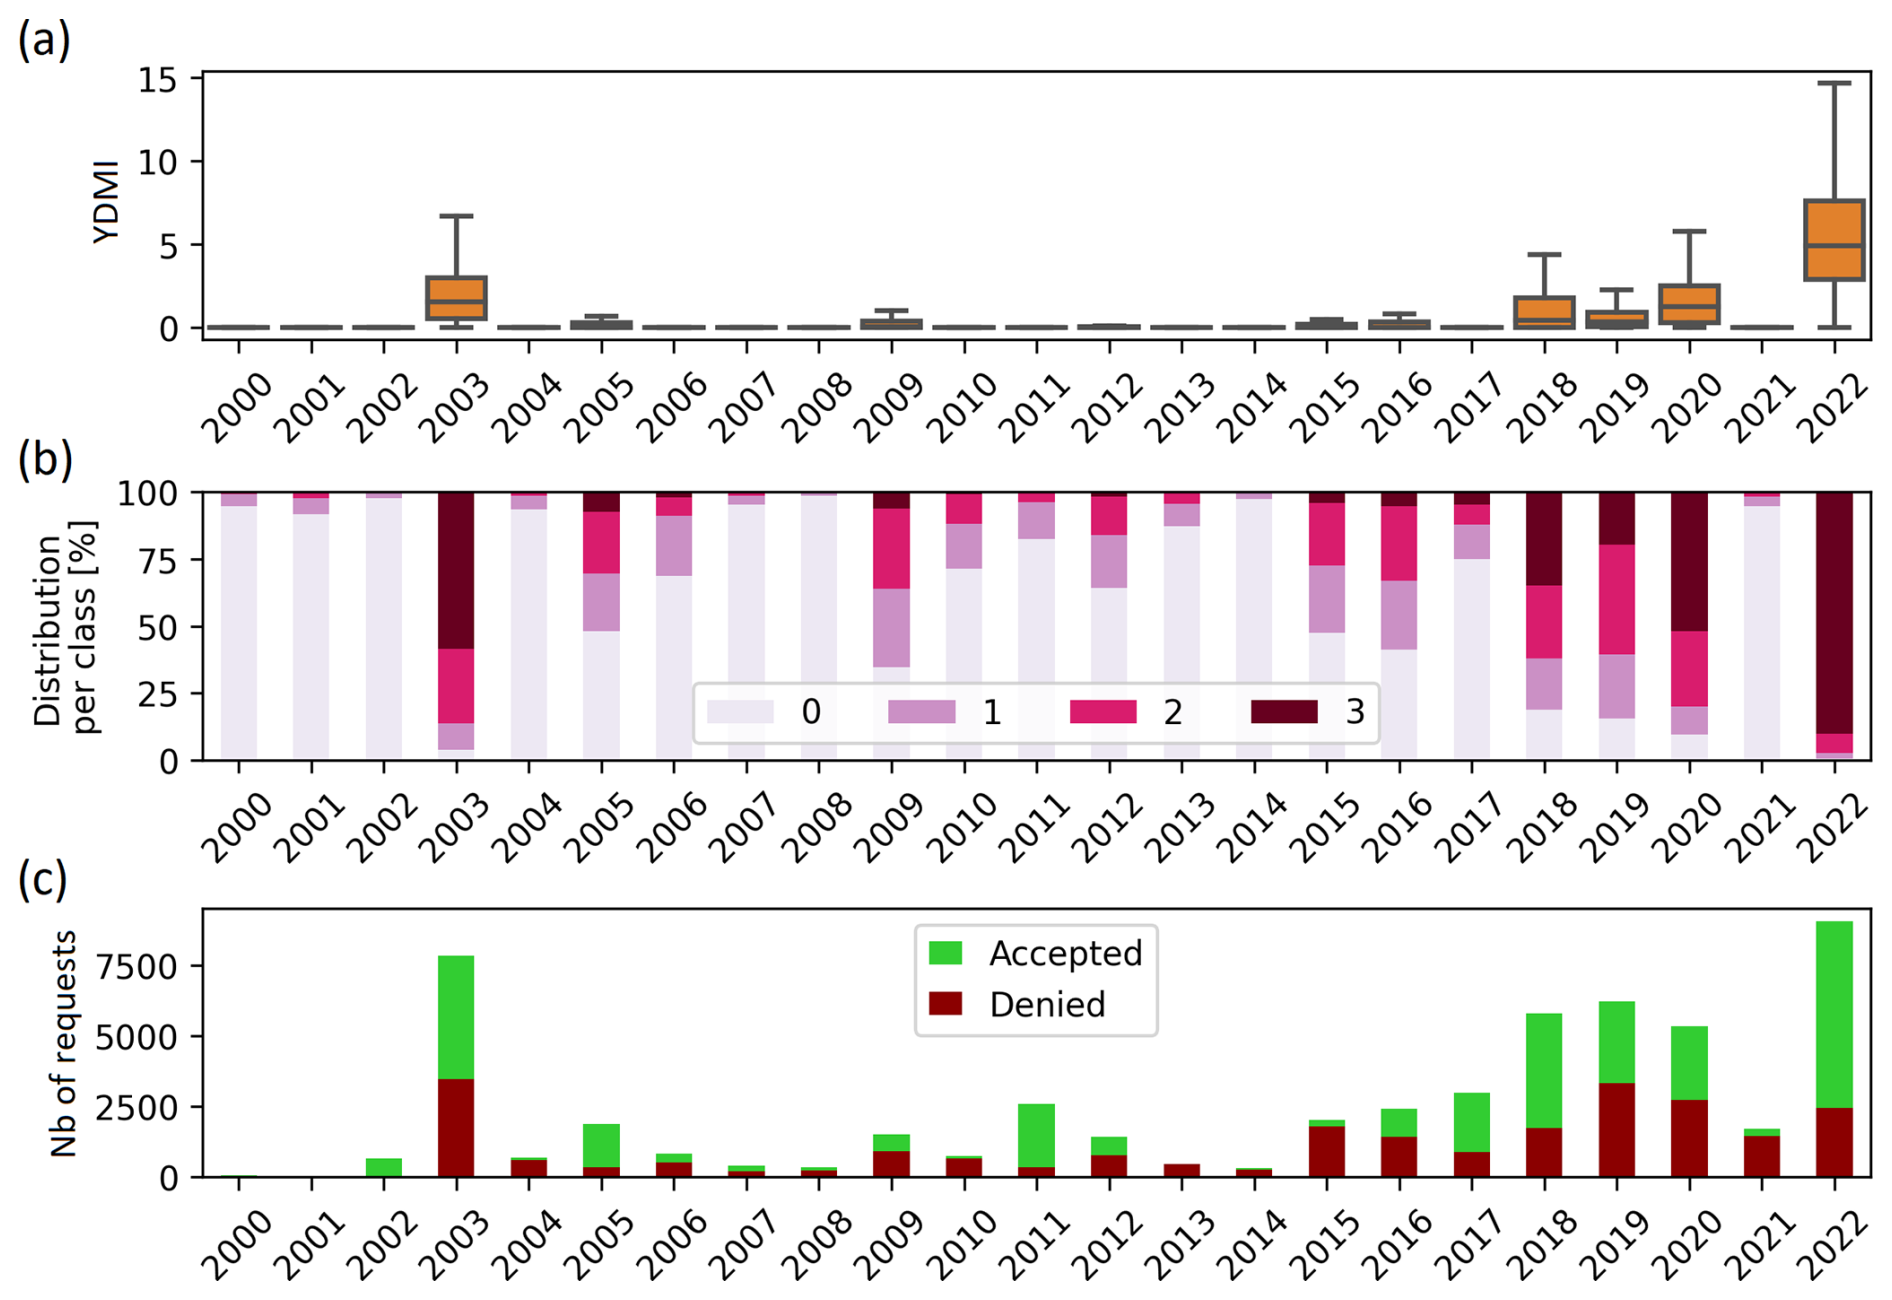
Figure 7Year by year (a) statistical distribution of YDMI values, (b) fraction of YDMI classes (from 0 to 3), and (c) number of NatCat recognition requests for France from 2000–2022. In panel (a), the box edges and center correspond to the 25th, 75th, and 50th percentiles. Whiskers extend to 1.5 times the interquartile range, equal to the difference between the 75th and 25th percentiles. Outliers are not displayed.
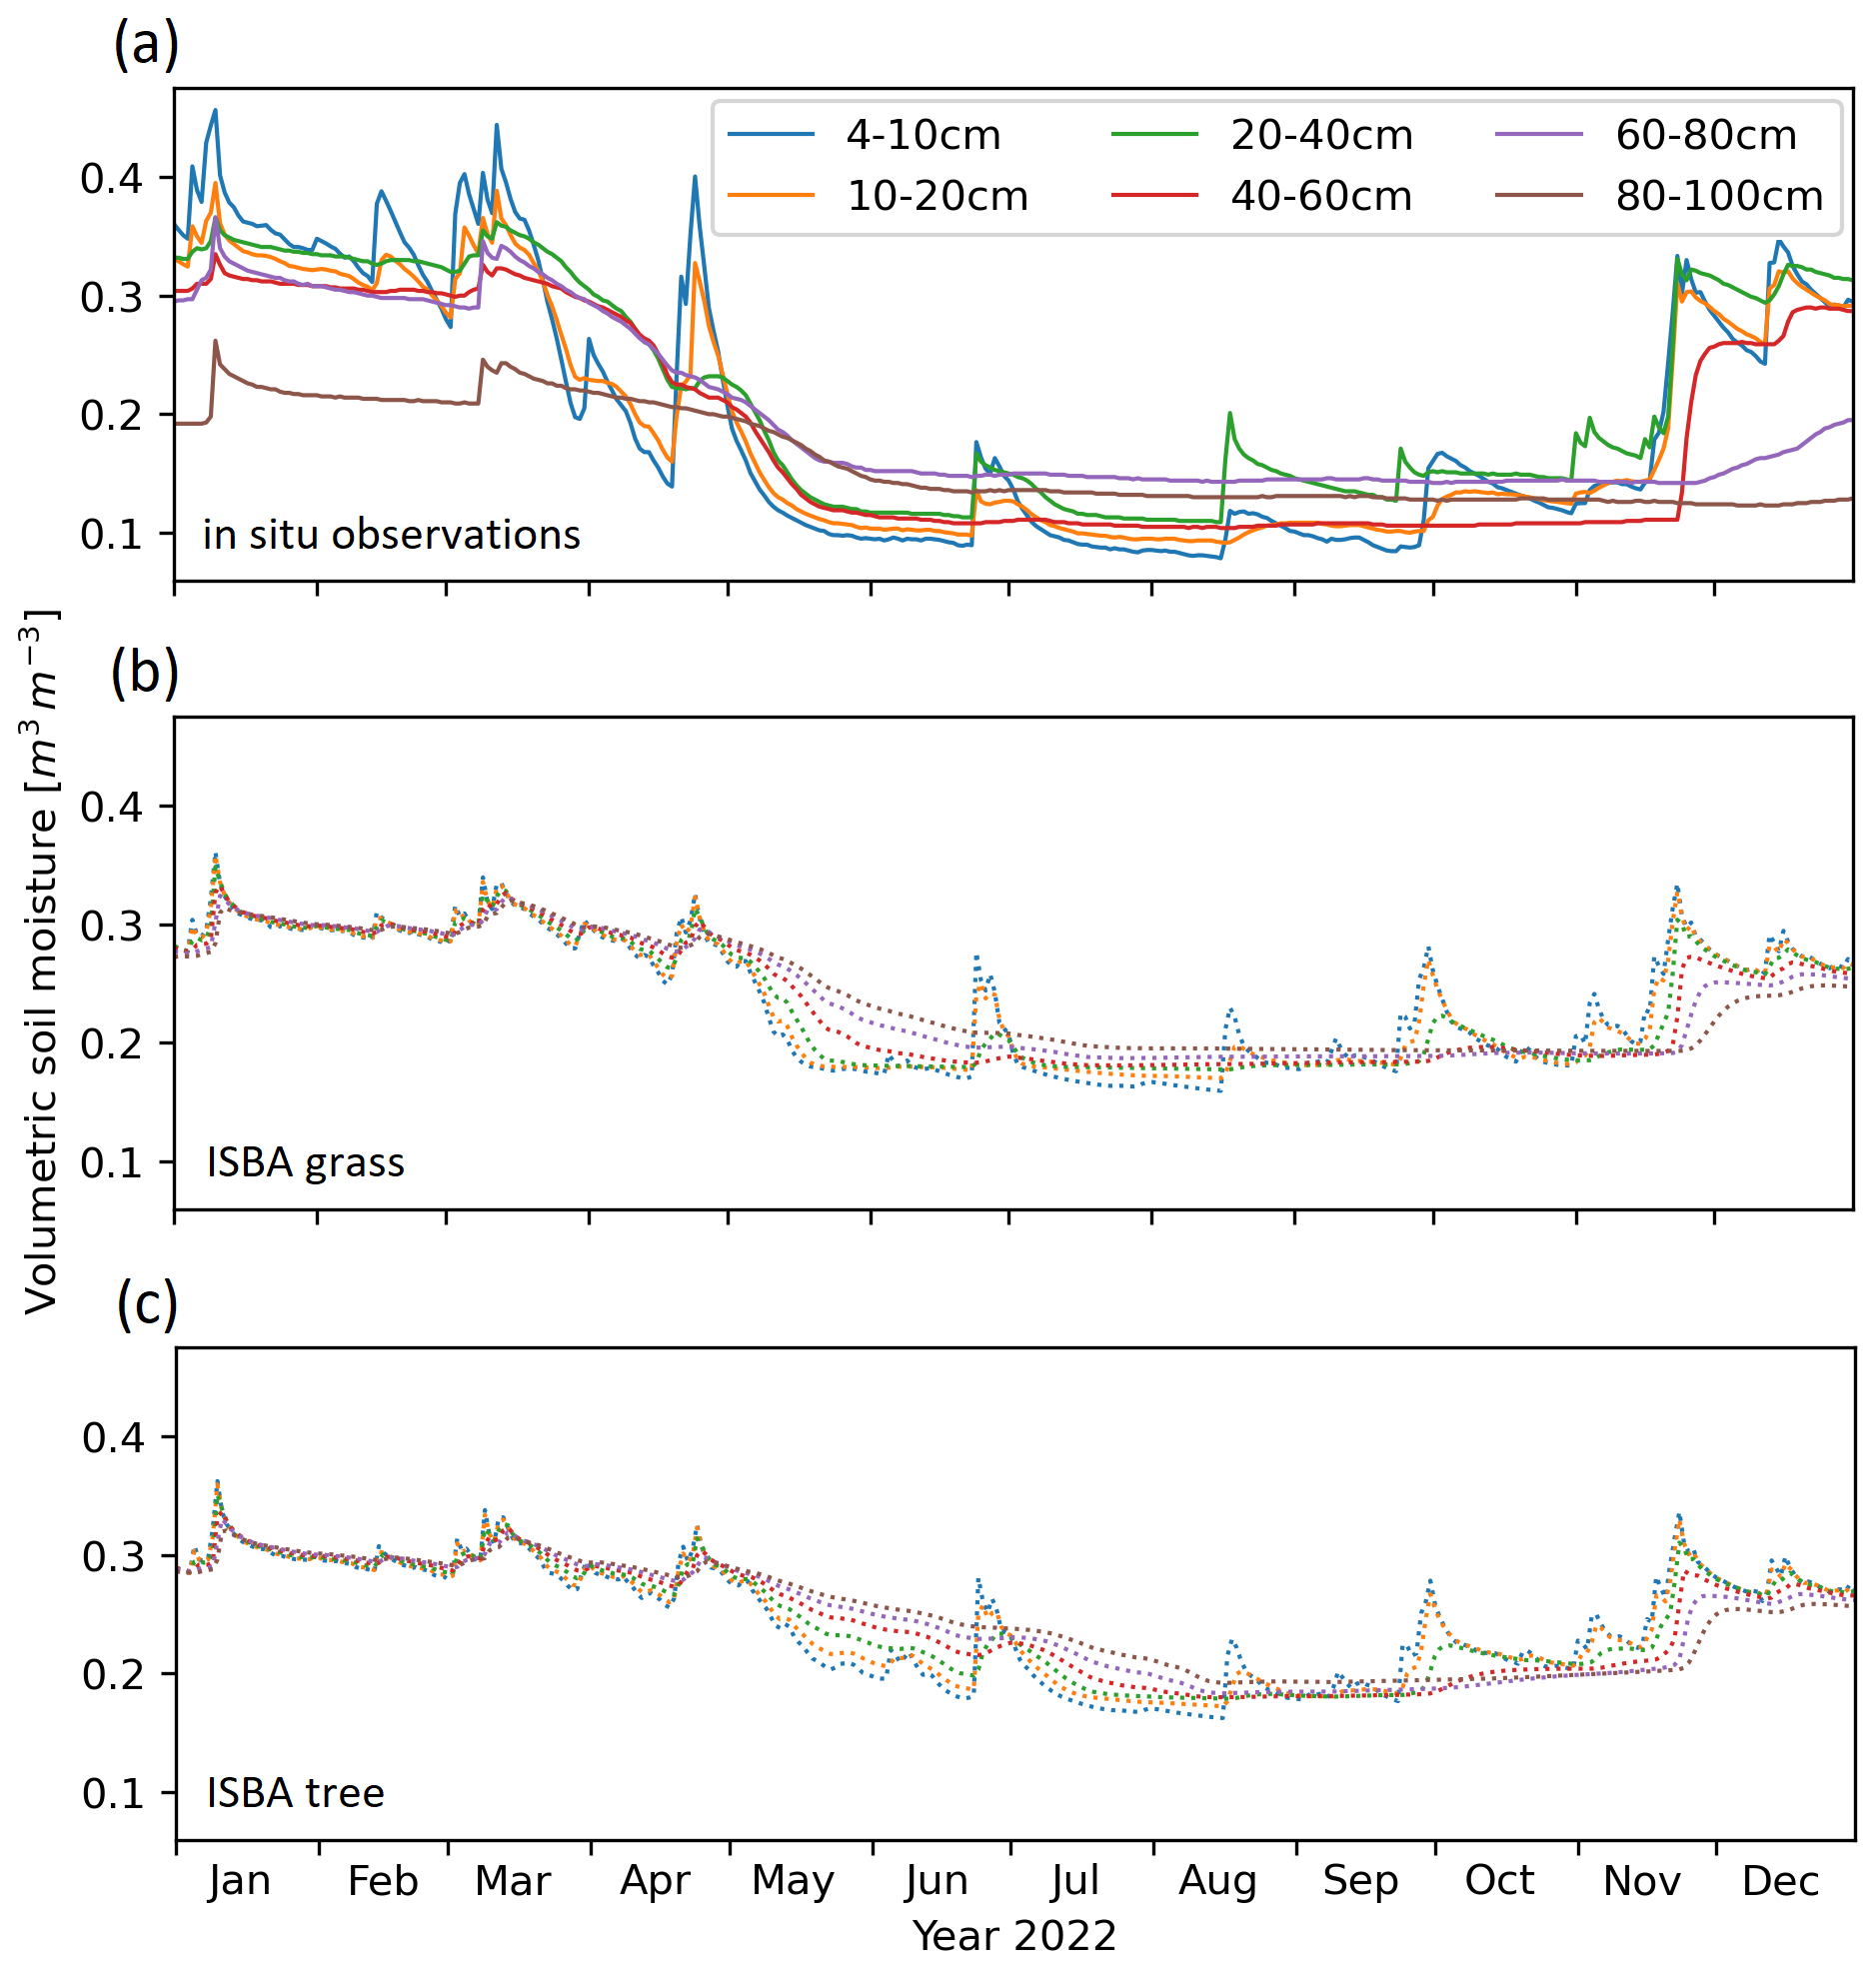
Figure 8Comparison of ISBA soil moisture profile simulations with in situ observations in the city of Toulouse in 2022, using data from the grassland FR-Tou ICOS site (Calvet et al., 2024) for a model grid cell (43.567° N, 1.397° E) covering this site, for six soil layers (0.04–0.1, 0.1–0.2, 0.2–0.4, 0.4–0.6, 0.6–0.8, 0.8–1.0 m): (a) in situ observations for grass, (b) simulation for grass, (c) simulation for deciduous broadleaf trees.
4.3.1 Atmospheric forcing errors
The SAFRAN reanalysis utilized as the historical forcing combines observations and model data. Consequently, it may be subject to both observational and meteorological model bias and bias due to the coarse grid resolution. Similar limitations can be listed for the projected forcing. It is important to note the individual biases of each GCM and RCM. Theoretically, these biases tend to cancel each other out when using an ensemble of simulations. The ensemble we use has only six members. Adding more members, such as GCMs and RCMs and multiple realizations of the same GCMs and RCMs to explore internal variability, would increase the robustness and reliability of the results. The weighting of each model contribution to the ensemble mean could also be considered (Ribes et al., 2021; Ribes et al., 2022). Model-to-model comparisons (as described in Sect. 3.2) have identified trends of varying statistical significance. The climate modeling framework adopted here involves feeding the same CO2 trajectory into a set of models and assessing their response over time. RCPs consist of projections of greenhouse gas concentrations, whose increase causes the atmosphere to warm. However, models can warm at different rates depending on the modeling choices, resulting in different temperature increases for the same time horizon. For this reason, one might suggest characterizing the conditions that trigger clay shrinkage as a function of warming rather than time. This is the approach developed by Samaniego et al. (2018).
4.3.2 Model shortcomings
There are several sources of uncertainty associated with ISBA. The coarse model resolution of 8 km × 8 km is the first limitation, as clay shrinkage occurs on a local scale. ISBA provides an averaged meteorological forcing to a grid cell, resulting in model outputs that are correct on average but do not cover the range of possible values found within a real 64 km2 square. The patch concept addresses the sub-grid land cover variability by generating as many outputs as there are vegetation types, and a single vegetation patch is used in this study. While vegetation type is a relevant factor contributing to heterogeneity, it is not the only one. At the grid cell scale, there may be several vegetation species of the same type, along with different soil textures in various vertical combinations. To improve the approach, simulations could be repeated for a wider range of soil and vegetation parameters to better reflect reality. Changes in soil hydromechanical parameters with depth could also be implemented. Several databases, such as SoilGrids (ISRIC, 2020), already provide such information on vertical texture variations. A disadvantage of ISBA is that its hydromechanical soil parameters remain stationary and do not change with time. However, the literature has shown that pore structure is affected by both drying–wetting and freeze–thaw cycles (Zhao et al., 2021). This oversimplification misrepresents the actual water content. Additionally, the lack of CO2 feedback in the projected experiment, mentioned in the previous subsection, contributes to uncertainty. Although ISBA has been extensively validated against field data from several study sites, measured, for example, by frequency domain reflectometry (FDR) probes (Decharme et al., 2011) or lysimeters (Sobaga et al., 2023), it relies on simplifying assumptions that introduce bias. These assumptions are specific to each model and result from choices made during the design phase. To compensate for individual biases, it would be appropriate to base drought assessments on simulations from multiple land surface models, as done by Samaniego et al. (2018). Also, observations of soil moisture at a depth of 0.8–1.0 m are scarce, and such comparisons are therefore not applicable on a national scale. Because the 2022 drought was exceptional, it is particularly important to validate the historical simulations for that particular year. Figure 8 shows a comparison of ISBA soil moisture profile simulations with in situ observations at the edge of the city of Toulouse, using data from the grassland FR-Tou ICOS site (Calvet et al., 2024). Across all individual soil layers, the Pearson correlation coefficient (R) is larger than 0.92 and the unbiased root mean square deviation (ubRMSD) is smaller than 0.063 m3 m−3. The best results are obtained for deep soil layers. For the 0.8–1.0 soil layer, R= 0.95 and ubRMSD = 0.015 m3 m−3. Figure 8 also illustrates the difference between local volumetric soil moisture values and the large-scale simulations. These differences are due to the fact that vertical heterogeneities of soil properties are not described in the model and that local soil properties are highly variable. Therefore, the YDMI calculation is based on a unitless soil moisture index (Barthelemy et al., 2024). Finally, Fig. 8 shows that the soil moisture simulations are significantly affected by the type of vegetation considered. For deciduous broadleaf trees, deep soil moisture changes are smoother than for grasses in relation to the thicker root zone layer and the contrasting responses to soil water stress.
4.3.3 The lack of representativeness of the drought index
Finally, uncertainty arises from the method used to calculate the drought index. The YDMI is an annual index, chosen to give it an operational focus, particularly towards the insurance industry, which mostly operates on a calendar year scale. This approach is consistent with soil moisture variations, as soil moisture periodically decreases each year during the summer season. However, this choice sacrifices our ability to identify and characterize multi-year drought events, which are expected to become more frequent with global warming (Hari et al., 2020). We define drought as occurring when the daily soil moisture value falls within the lowest 1 to 5 % relative to a given period. In contrast to the historical experiment, the drought threshold for the projected experiment is defined over the first 20 years (2006–2025). Implicitly, this means that a drought event will always have the same impact, whether it occurs in 2006 or 2065. Regarding clay shrinkage, this hypothesis is realistic because most exposed assets already exist and are at risk. However, it is a particularly pessimistic view that completely ignores the impact of prevention. Preventive measures have recently been implemented to establish rules for the construction of new buildings (Légifrance, 2018). In the meantime, research initiatives are being undertaken to prevent subsidence damage using various strategies. For instance, some aim to limit shrinkage by injecting resin (Al-Atroush et al., 2021), while others propose maintaining soil hydration during drought events (Ighil Ameur, 2021).
4.4 What are the limitations and possible applications of this work?
One limitation of this analysis is that mountainous areas were removed, which resulted in spatial gaps where clay-shrinkage-induced subsidence may occur in limited locations. To address this, soil moisture calculations could be based on total water content instead of just liquid water content, which would allow these areas to be considered. However, the coarse resolution of ISBA is still a problem when dealing with rugged terrain and local biophysical processes.
In spite of these limitations, calculating the YDMI can help characterize the conditions that cause clay shrinkage and add to our understanding of the phenomenon. This information is critical for policymakers and the insurance industry to better anticipate and manage the consequences of extreme drought events. The projected assessment is particularly relevant in the context of global warming. However, the YDMI alone cannot be used for this purpose. The YDMI is only a proxy for soil moisture conditions and does not integrate soil susceptibility to shrinkage and swelling or building characteristics. Therefore, the relationship between the YDMI and damage is not straightforward. For a complete assessment, triggering factors must be combined with the soil predisposing factor. The predisposing factor is the soil's ability to shrink, which is called susceptibility. Previous studies have provided an analysis of the susceptibility to the shrinkage–swell phenomenon (e.g., Olive et al., 1989) based on the combination of several predisposing factors, such as the proportion of clay material, the heterogeneity of the layers, the proportion of minerals susceptible to swelling, the swelling–shrinkage intensity of the clay, the layer thickness, and the preferential water paths. Future improvements will involve combining the current drought index with the regional susceptibility maps of the Bureau de Recherches Géologiques et Minières (BRGM). However, there are several challenges to overcome, particularly the spatial heterogeneity of clay deposits at large scales (Georisques, 2019).
This paper analyzes past and future drought events in France from 2000–2065 that are likely to cause clay shrinkage, using an adapted index. For the first time, historical and projected triggering conditions for clay shrinkage are assessed and compared on a national scale for France using a specially developed drought index (YDMI). The YDMI is based on soil moisture simulations from the ISBA land surface model, which is successively forced by an atmospheric reanalysis and an ensemble of six climate models. The index characteristics were adjusted in a previous study (Barthelemy et al., 2023) by comparison with insurance data. The results are as follows:
-
Significant soil moisture drought events occurred in France in 2003, 2018, 2019, 2020, and 2022. In 2022, high index values were observed throughout the country.
-
Drought characteristics are expected to worsen in the future, particularly under RCP8.5. The scenarios diverge significantly after 2046, and both the north and south of the country will be affected.
-
Differences were found between historical and projected indices (projections are more pessimistic on average and more optimistic regarding extreme events). These differences may be due to either the climate forcing or the vegetation response of the land surface scheme.
Finally, the YDMI quantifies drought on an annual scale for deciduous broadleaf tree vegetation, making it applicable in agricultural or forest management contexts beyond this specific example. This methodology can be applied to other countries, as clay-shrinkage-induced subsidence is not unique to France. The SURFEX modeling platform that supports ISBA is applicable anywhere, provided that high-resolution atmospheric forcing is available.
The analysis was carried out with Python codes that can be made available upon request. SURFEX can be downloaded freely at http://www.umr-cnrm.fr/surfex/data/OPEN-SURFEX/open_surfex_v8_1_20210914.tar.gz (CNRM, 2016). It is provided under a CECILL-C license (French equivalent to the LGPL license).
The data presented in the Figures are available online at https://figshare.com/s/61c73ec14ed0b876641e (Barthelemy, 2025).
The supplement related to this article is available online at https://doi.org/10.5194/hess-29-2321-2025-supplement.
SoB and JCC designed the experiments. SoB performed the investigation, did the formal analysis, and wrote the paper. BB performed the historical simulations, and MTB performed the projected simulations. All co-authors participated in the interpretation of the results and the revision of the paper.
The contact author has declared that none of the authors has any competing interests.
Publisher's note: Copernicus Publications remains neutral with regard to jurisdictional claims made in the text, published maps, institutional affiliations, or any other geographical representation in this paper. While Copernicus Publications makes every effort to include appropriate place names, the final responsibility lies with the authors.
This article is part of the special issue “Drought, society, and ecosystems (NHESS/BG/GC/HESS inter-journal SI)”. It is not associated with a conference.
The authors would like to thank the operational services of Météo-France (DCSC).
The PhD thesis work of Sophie Barthelemy was co-funded by the Bureau de Recherches Géologiques et Minières (BRGM), Caisse Centrale de Réassurance (CCR), and Météo-France.
This paper was edited by Mana Gharun and reviewed by two anonymous referees.
Al-Atroush, M. E., Shabbir, O., Almeshari, B., Waly, M., and Sebaey, T. A.: A Novel Application of the Hydrophobic Polyurethane Foam: Expansive Soil Stabilization, Polymers, 13, 1335, https://doi.org/10.3390/polym13081335, 2021.
André, G. and Marteau, R.: Changement climatique et Assurance: Quelles conséquences sur la sinistralité à horizon 2050?, Livre Blanc Covéa, https://www.covea.com/sites/default/files/2023-11/202202_Livre_Blanc_Covéa_Risques_Climatiques.pdf (last access: 26 May 2025), 2022.
Barbosa, P., Masante, D., Arias Muños, C., Cammalleri, C., de Jager, A., Magni, D., Mazzeschi, M., McCormick, N., Naumann, G., Spinoni, J., and Vogt, J.: Drought in Europe September 2020, Publications Office of the European Union, https://doi.org/10.2760/415204 (last access 26 May 2025), 2020.
Barthelemy, S.: Analyzing past and future droughts that induce clay shrinkage in France using an index based on water budget simulation for trees – article data, Figshare [data set], https://figshare.com/s/61c73ec14ed0b876641e (last access: 26 May 2025), 2025.
Barthelemy, S., Bonan, B., Calvet, J.-C., Grandjean, G., Moncoulon, D., Kapsambelis, D., and Bernardie, S.: A new approach for drought index adjustment to clay-shrinkage-induced subsidence over France: advantages of the interactive leaf area index, Nat. Hazards Earth Syst. Sci., 24, 999–1016, https://doi.org/10.5194/nhess-24-999-2024, 2024.
Berg, A. and Sheffield, J.: Climate Change and Drought: the Soil Moisture Perspective, Curr. Clim. Change Rep., 4, 180–191, https://doi.org/10.1007/s40641-018-0095-0, 2018.
Boone, A., Masson, V., Meyers, T., and Noilhan, J.: The Influence of the Inclusion of Soil Freezing on Simulations by a Soil–Vegetation–Atmosphere Transfer Scheme, J. Appl. Meteorol., 39, 1544–1569, https://doi.org/10.1175/1520-0450(2000)039<1544:TIOTIO>2.0.CO;2, 2000.
Brut, A., Rüdiger, C., Lafont, S., Roujean, J. L., Calvet, J. C., Jarlan, L., Gibelin, A. L., Albergel, C., Le Moigne, P., Soussana, J. F., Klumpp, K., Guyon, D., Wigneron, J. P., and Ceschia, E.: Modelling LAI at a regional scale with ISBA-A-gs: Comparison with satellite-derived LAI over southwestern France, Biogeosciences, 6, 1389–1404, https://doi.org/10.5194/bg-6-1389-2009, 2009.
Calvet, J.-C.: Investigating soil and atmospheric plant water stress using physiological and micrometeorological data, Agr. Forest Meteorol., 103, 229–247, https://doi.org/10.1016/S0168-1923(00)00130-1, 2000.
Calvet, J.-C. and Soussana, J.-F.: Modelling CO2-enrichment effects using an interactive vegetation SVAT scheme, Agr. Forest Meteorol., 108, 129–152, https://doi.org/10.1016/S0168-1923(01)00235-0, 2001.
Calvet, J.-C., Noilhan, J., Roujean, J.-L., Bessemoulin, P., Cabelguenne, M., Olioso, A., and Wigneron, J.-P.: An interactive vegetation SVAT model tested against data from six contrasting sites, Agr. Forest Meteorol., 92, 73–95, https://doi.org/10.1016/S0168-1923(98)00091-4, 1998.
Calvet, J.-C., Rivalland, V., Picon-Cochard, C., and Guehl, J.-M.: Modelling forest transpiration and CO2 fluxes – response to soil moisture stress, Agr. Forest Meteorol., 124, 143–156, https://doi.org/10.1016/j.agrformet.2004.01.007, 2004.
Calvet, J.-C., Canut-Rocafort, G., Bonan, B., Meurey, C., Corchia, T., and Etienne, J.-C.: Year-round daily Meteopole-Flux weather, energy, carbon and soil-plant variables, Toulouse, CNRM [data set], https://doi.org/10.57932/5223fd82-10ce-490c-a4b0-1106b5511554, 2024.
Campbell, G. S.: A simple method for determining unsaturated conductivity from moisture retention data, Soil Sci., 117, 311–314, https://doi.org/10.1097/00010694-197406000-00001, 1974.
CCR: Conséquences du changement climatique sur le coût des catastrophes naturelles en France à horizon 2050, https://www.ccr.fr/documents/35794/1255983/CCR+Etude+climat+BAG+23102023+page+22mo.pdf/68b95f6e-8238-4dcc-6c56-025fa410257b?t=1698161402128 (last access: 27 February 2024), 2023a.
CCR: Les Catastrophes Naturelles en France Bilan 1982–2022, https://catastrophes-naturelles.ccr.fr/documents/148935/368920/BILAN+Cat+Nat+2022_HD_12062023.pdf/5b5397f0-2118-2252-608f-76ece6e195a1?t=1686731142230 (last access: 27 February 2024), 2023b.
Clapp, R. B. and Hornberger, G. M.: Empirical equations for some soil hydraulic properties, Water Resour. Res., 14, 601–604, https://doi.org/10.1029/WR014i004p00601, 1978.
CNRM: SURFEX code, CNRM [code], http://www.umr-cnrm.fr/surfex/data/OPEN-SURFEX/open_surfex_v8_1_20210914.tar.gz (last access: 26 May 2025), 2016.
Dayon, G., Boé, J., Martin, É., and Gailhard, J.: Impacts of climate change on the hydrological cycle over France and associated uncertainties, Comptes. Rendus.-Geosci., 350, 141–153, https://doi.org/10.1016/j.crte.2018.03.001, 2018.
Collier, N., Hoffman, F. M., Lawrence, D. M., Keppel-Aleks, G., Koven, C. D., Riley, W. J., Mu, M., and Randerson, J. T.: The International Land Model Benchmarking (ILAMB) System: Design, Theory, and Implementation, J. Adv. Model. Earth Sy., 10, 2731–2754, https://doi.org/10.1029/2018MS001354, 2018.
Decharme, B., Boone, A., Delire, C., and Noilhan, J.: Local evaluation of the Interaction between Soil Biosphere Atmosphere soil multilayer diffusion scheme using four pedotransfer functions, J. Geophys. Res.-Atmos., 116, 1–29, https://doi.org/10.1029/2011JD016002, 2011.
Delire, C., Séférian R., Decharme B., Alkama R., Calvet J.-C., Carrer D., Gibelin A.-L., Joetzjer E., Morel X., Rocher M., and Tzanos D.: The global land carbon cycle simulated with ISBA-CTRIP: improvements over the last decade, J. Adv. Model. Earth Sy., 12, e2019MS001886, https://doi.org/10.1029/2019MS001886, 2020.
Explore2 – des futurs de l'eau: https://professionnels.ofb.fr/fr/node/1244, last access: 27 February 2024.
Faroux, S., Kaptué Tchuenté, A. T., Roujean, J.-L., Masson, V., Martin, E., and Le Moigne, P.: ECOCLIMAP-II/Europe: a twofold database of ecosystems and surface parameters at 1 km resolution based on satellite information for use in land surface, meteorological and climate models, Geosci. Model Dev., 6, 563–582, https://doi.org/10.5194/gmd-6-563-2013, 2013.
Freeman, T. J., Burford, D., and Crilly, M. S.: Seasonal foundation movements in London Clay, in: Proceedings of the 4th International Conference on Ground Movements and Structures, Cardiff, UK, 8–11 July 1991, 485–501, 1992.
Friedlingstein, P., Jones, M. W., O'Sullivan, M., Andrew, R. M., Bakker, D. C. E., Hauck, J., Le Quéré, C., Peters, G. P., Peters, W., Pongratz, J., Sitch, S., Canadell, J. G., Ciais, P., Jackson, R. B., Alin, S. R., Anthoni, P., Bates, N. R., Becker, M., Bellouin, N., Bopp, L., Chau, T. T. T., Chevallier, F., Chini, L. P., Cronin, M., Currie, K. I., Decharme, B., Djeutchouang, L. M., Dou, X., Evans, W., Feely, R. A., Feng, L., Gasser, T., Gilfillan, D., Gkritzalis, T., Grassi, G., Gregor, L., Gruber, N., Gürses, Ö., Harris, I., Houghton, R. A., Hurtt, G. C., Iida, Y., Ilyina, T., Luijkx, I. T., Jain, A., Jones, S. D., Kato, E., Kennedy, D., Klein Goldewijk, K., Knauer, J., Korsbakken, J. I., Körtzinger, A., Landschützer, P., Lauvset, S. K., Lefèvre, N., Lienert, S., Liu, J., Marland, G., McGuire, P. C., Melton, J. R., Munro, D. R., Nabel, J. E. M. S., Nakaoka, S.-I., Niwa, Y., Ono, T., Pierrot, D., Poulter, B., Rehder, G., Resplandy, L., Robertson, E., Rödenbeck, C., Rosan, T. M., Schwinger, J., Schwingshackl, C., Séférian, R., Sutton, A. J., Sweeney, C., Tanhua, T., Tans, P. P., Tian, H., Tilbrook, B., Tubiello, F., van der Werf, G. R., Vuichard, N., Wada, C., Wanninkhof, R., Watson, A. J., Willis, D., Wiltshire, A. J., Yuan, W., Yue, C., Yue, X., Zaehle, S., and Zeng, J.: Global Carbon Budget 2021, Earth Syst. Sci. Data, 14, 1917–2005, https://doi.org/10.5194/essd-14-1917-2022, 2022.
Georisques: Dossier expert sur le retrait-gonflement des argiles – Exposition du territoire au phénomène, https://www.georisques.gouv.fr/articles-risques/retrait-gonflement-des-argiles/exposition-du-territoire-au-phenomene (last access: 2 April 2024), 2019.
Gibelin, A. L., Calvet, J. C., Roujean, J. L., Jarlan, L., and Los, S. O.: Ability of the land surface model ISBA-A-gs to simulate leaf area index at the global scale: Comparison with satellites products, J. Geophys. Res.-Atmos, 111, D18102, https://doi.org/10.1029/2005JD006691, 2006.
Gourdier, S. and Plat, E.: Impact du changement climatique sur la sinistralité due au retrait-gonflement des argiles. Journées Nationales de Géotechnique et Géologie de l'Ingénieur (JNGG), Champs-sur-Marne, France, https://brgm.hal.science/hal-01768395/ (last access: 27 February 2024), 2018.
Gudmundsson, L. and Seneviratne, S. I.: European drought trends, Proc. IAHS, 369, 75–79, https://doi.org/10.5194/piahs-369-75-2015, 2015.
Habets, F., Boone, A., Champeaux, J. L., Etchevers, P., Franchistéguy, L., Leblois, E., Ledoux, E., Le Moigne, P., Martin, E., Morel, S., Noilhan, J., Seguí, P. Q., Rousset-Regimbeau, F., and Viennot, P.: The SAFRAN-ISBA-MODCOU hydrometeorological model applied over France, J. Geophys. Res.-Atmos., 113, 1–18, https://doi.org/10.1029/2007JD00854, 2008.
Hansen, J., Kharecha, P., Sato, M., Masson-Delmotte, V., Ackerman, F., Beerling, D. J., Hearty, P. J., Hoegh-Guldberg, O., Hsu, S.-L., and Parmesan, C.: Assessing “dangerous climate change”: required reduction of carbon emissions to protect young people, future generations and nature, PLoS ONE, 8, e81648, https://doi.org/10.1371/journal.pone.0081648, 2013.
Hari, V., Rakovec, O., Markonis, Y., Hanel, M., and Kumar, R.: Increased future occurrences of the exceptional 2018–2019 Central European drought under global warming, Sci. Rep., 10, 12207, https://doi.org/10.1038/s41598-020-68872-9, 2020.
Hawkins, A. B.: Some engineering geological effects of drought: Examples from the UK, Bull. Eng. Geol. Environ., 72, 37–59, https://doi.org/10.1007/s10064-013-0458-7, 2013.
Ighil Ameur, L.: Experimental Analysis of Shrinkage-swelling Phenomenon of Clays Application to an Individual House Affected by Drought Under Climate Change Effects, ASCE EMI/PMC, https://www.researchgate.net/publication/356284599 (last access: 27 February 2024), 2021.
ISRIC: SoilGrids – global gridded soil information, https://www.isric.org/explore/soilgrids (last access: 2 April 2024), 2020.
Jacob, D., Petersen, J., Eggert, B., Alias, A., Christensen, O. B., Bouwer, L. M., Braun, A., Colette, A., Déqué, M., Georgievski, G., Georgopoulou, E., Gobiet, A., Menut, L., Nikulin, G., Haensler, A., Hempelmann, N., Jones, C., Keuler, K., Kovats, S., Kröner, N., Kotlarski, S., Kriegsmann, A., Martin, E., van Meijgaard, E., Moseley, C., Pfeifer, S., Preuschmann, S., Radermacher, C., Radtke, K., Rechid, D., Rounsevell, M., Samuelsson, P., Somot, S., Soussana, J.-F., Teichmann, C., Valentini, R., Vautard, R., Weber, B., and Yiou, P.: EURO-CORDEX: new high-resolution climate change projections for European impact research, Reg. Environ. Change, 14, 563–578, https://doi.org/10.1007/s10113-013-0499-2, 2014.
Jacob, D., Teichmann, C., Sobolowski, S., Katragkou, E., Anders, I., Belda, M., Benestad, R., Boberg, F., Buonomo, E., Cardoso, R. M., Casanueva, A., Christensen, O. B., Christensen, J. H., Coppola, E., De Cruz, L., Davin, E. L., Dobler, A., Domínguez, M., Fealy, R., Fernandez, J., Gaertner, M. A., García-Díez, M., Giorgi, F., Gobiet, A., Goergen, K., Gómez-Navarro, J. J., Alemán, J. J. G., Gutiérrez, C., Gutiérrez, J. M., Güttler, I., Haensler, A., Halenka, T., Jerez, S., Jiménez-Guerrero, P., Jones, R. G., Keuler, K., Kjellström, E., Knist, S., Kotlarski, S., Maraun, D., van Meijgaard, E., Mercogliano, P., Montávez, J. P., Navarra, A., Nikulin, G., de Noblet-Ducoudré, N., Panitz, H.-J., Pfeifer, S., Piazza, M., Pichelli, E., Pietikäinen, J.-P., Prein, A. F., Preuschmann, S., Rechid, D., Rockel, B., Romera, R., Sánchez, E., Sieck, K., Soares, P. M. M., Somot, S., Srnec, L., Sørland, S. L., Termonia, P., Truhetz, H., Vautard, R., Warrach-Sagi, K., and Wulfmeyer, V.: Regional climate downscaling over Europe: perspectives from the EURO-CORDEX community, Reg. Environ. Change, 20, 51, https://doi.org/10.1007/s10113-020-01606-9, 2020.
Kotlarski, S., Keuler, K., Christensen, O. B., Colette, A., Déqué, M., Gobiet, A., Goergen, K., Jacob, D., Lüthi, D., van Meijgaard, E., Nikulin, G., Schär, C., Teichmann, C., Vautard, R., Warrach-Sagi, K., and Wulfmeyer, V.: Regional climate modeling on European scales: a joint standard evaluation of the EURO-CORDEX RCM ensemble, Geosci. Model Dev., 7, 1297–1333, https://doi.org/10.5194/gmd-7-1297-2014, 2014.
Laanaia, N., Carrer, D., Calvet, J.-C., and Pagé, C.: How will climate change affect the vegetation cycle over France? A generic modeling approach, Clim. Risk Manag., 13, 31–42, https://doi.org/10.1016/j.crm.2016.06.001, 2016.
Lashof, D. A. and Ahuja, D. R.: Relative contributions of greenhouse gas emissions to global warming, Nature, 344, 529–531, https://doi.org/10.1038/344529a0, 1990.
Le Moigne, P., Besson, F., Martin, E., Boé, J., Boone, A., Decharme, B., Etchevers, P., Faroux, S., Habets, F., Lafaysse, M., Leroux, D., and Rousset-Regimbeau, F.: The latest improvements with SURFEX v8.0 of the Safran-Isba-Modcou hydrometeorological model for France, Geosci. Model Dev., 13, 3925–3946, https://doi.org/10.5194/gmd-13-3925-2020, 2020.
Légifrance: Loi no. 2018-1021 du 23 novembre 2018 portant évolution du logement, de l'aménagement et du numérique, 2018–1021, https://www.legifrance.gouv.fr/loda/id/JORFTEXT000037639478 (last access: 2 April 2024), 2018.
Manning, C., Widmann, M., Bevacqua, E., Van Loon, A. F., Maraun, D., and Vrac, M.: Increased probability of compound long-duration dry and hot events in Europe during summer (1950–2013), Environ. Res. Lett., 14, 094006, https://doi.org/10.1088/1748-9326/ab23bf, 2019.
Masante, D., Vogt, J., Cammalleri, C., Spinoni, J., and Barbosa, P.: Drought in Central-Northern Europe – September 2018, Publications Office of the European Union, https://drought.emergency.copernicus.eu/data/reports/old/EDODroughtNews201809_Central_North_Europe.pdf (last access: 26 May 2025) 2018.
Masante, D., Barbosa, P., and Magni, D.: Drought in Europe August 2019, Publications Office of the European Union, https://drought.emergency.copernicus.eu/data/reports/old/EDODroughtNews201908_Europe.pdf (last access: 26 May 2025) 2019.
Masson, V., Le Moigne, P., Martin, E., Faroux, S., Alias, A., Alkama, R., Belamari, S., Barbu, A., Boone, A., Bouyssel, F., Brousseau, P., Brun, E., Calvet, J. C., Carrer, D., Decharme, B., Delire, C., Donier, S., Essaouini, K., Gibelin, A. L., Giordani, H., Habets, F., Jidane, M., Kerdraon, G., Kourzeneva, E., Lafaysse, M., Lafont, S., Lebeaupin Brossier, C., Lemonsu, A., Mahfouf, J. F., Marguinaud, P., Mokhtari, M., Morin, S., Pigeon, G., Salgado, R., Seity, Y., Taillefer, F., Tanguy, G., Tulet, P., Vincendon, B., Vionnet, V., and Voldoire, A.: The SURFEXv7.2 land and ocean surface platform for coupled or offline simulation of earth surface variables and fluxes, Geosci. Model Dev., 6, 929–960, https://doi.org/10.5194/gmd-6-929-2013, 2013.
Meisina, C., Zucca, F., Fossati, D., Ceriani, M., and Allievi, J.: Ground deformation monitoring by using the Permanent Scatterers Technique: The example of the Oltrepo Pavese (Lombardia, Italy), Eng. Geol., 88, 240–259, https://doi.org/10.1016/j.enggeo.2006.09.010, 2006.
Micale, F., Vogt, J., and Cammalleri, C.: European Drought Observatory (EDO) Drought News August 2015, Publications Office of the European Union, https://drought.emergency.copernicus.eu/data/reports/old/EDODroughtNews201508.pdf (last access: 25 May 2025) 2015.
Moss, R. H., Edmonds, J. A., Hibbard, K. A., Manning, M. R., Rose, S. K., van Vuuren, D. P., Carter, T. R., Emori, S., Kainuma, M., Kram, T., Meehl, G. A., Mitchell, J. F. B., Nakicenovic, N., Riahi, K., Smith, S. J., Stouffer, R. J., Thomson, A. M., Weyant, J. P., and Wilbanks, T. J.: The next generation of scenarios for climate change research and assessment, Nature, 463, 747–756, https://doi.org/10.1038/nature08823, 2010.
Mostafiz, R. B., Friedland, C. J., Rohli, R. V., Bushra, N., and Held, C. L.: Property Risk Assessment for Expansive Soils in Louisiana, Front. Built Environ., 7, 1–10, https://doi.org/10.3389/fbuil.2021.754761, 2021.
MTES: Cartographie de l'exposition des maisons individuelles au retrait-gonflement des argiles, https://www.statistiques.developpement-durable.gouv.fr/ (last access: 27 February 2024), 2021.
Nachtergaele, F., Velthuizen, H., Verelst, L., and Wiberg, D.: Harmonized World Soil Database Version 1.2, https://esdac.jrc.ec.europa.eu/ (last access: 27 February 2024), 2012.
Noilhan, J. and Lacarrère, P.: GCM Grid-Scale Evaporation from Mesoscale Modeling, J. Clim., 8, 206–223, https://doi.org/10.1175/1520-0442(1995)008<0206:GGSEFM>2.0.CO;2, 1995.
Noilhan, J. and Mahfouf, J.-F.: The ISBA land surface parameterisation scheme, Global Planet. Change, 13, 145–159, https://doi.org/10.1016/0921-8181(95)00043-7, 1996.
Noilhan, J. and Planton, S.: A simple parameterization of land surface processes for meteorological models, Mon. Weather Rev., 117, 536–549, 1989.
Olive, W. W., Chleborad, A. F., Frahme, C. W., Schlocker, J., Schneider, R. R., and Schuster, R. L.: Swelling clays map of the conterminous United States, https://doi.org/10.3133/i1940, 1989.
Page, R. C. J.: Reducing the cost of subsidence damage despite global warming, Struct. Surv., 16, 67–75, https://doi.org/10.1108/02630809810219641, 1998.
Peano, D., Hemming, D., Materia, S., Delire, C., Fan, Y., Joetzjer, E., Lee, H., Nabel, J. E. M. S., Park, T., Peylin, P., Wårlind, D., Wiltshire, A., and Zaehle, S.: Plant phenology evaluation of CRESCENDO land surface models – Part 1: Start and end of the growing season, Biogeosciences, 18, 2405–2428, https://doi.org/10.5194/bg-18-2405-2021, 2021.
Ribes, A., Boé, J., Qasmi, S., Dubuisson, B., Douville, H., and Terray, L.: An updated assessment of past and future warming over France based on a regional observational constraint, Earth Syst. Dynam., 13, 1397–1415, https://doi.org/10.5194/esd-13-1397-2022, 2022.
Ribes, A., Qasmi S., and Gillett N. P.: Making climate projections conditional on historical observations, Sci. Adv., 7, eabc0671, https://doi.org/10.1126/sciadv.abc0671, 2021.
Richards, L. A.: Capillary conduction of liquids through porous mediums, Physics, 1, 318–333, https://doi.org/10.1063/1.1745010, 1931.
Robin, Y., Corre, L., Marson, P., Bernus, S., Vrac, M., and Thao, S.: Projections climatiques régionalisées: correction de biais et changements futurs, https://doi.org/10.57745/KXRB5B (last access: 26 May 2025), 2023.
Quintana-Seguí, P., Le Moigne, P., Durand, Y., Martin, E., Habets, F., Baillon, M., Canellas, C., Franchisteguy, L., and Morel, S.: Analysis of near-surface atmospheric variables: Validation of the SAFRAN analysis over France, J. Appl. Meteorol. Climatol., 47, 92–107, https://doi.org/10.1175/2007JAMC1636.1, 2008.
Samaniego, L., Thober, S., Kumar, R., Wanders, N., Rakovec, O., Pan, M., Zink, M., Sheffield, J., Wood, E. F., and Marx, A.: Anthropogenic warming exacerbates European soil moisture droughts, Nat. Clim. Change, 8, 421–426, https://doi.org/10.1038/s41558-018-0138-5, 2018.
Sobaga, A., Decharme, B., Habets, F., Delire, C., Enjelvin, N., Redon, P.-O., Faure-Catteloin, P., and Le Moigne, P.: Assessment of the interactions between soil–biosphere–atmosphere (ISBA) land surface model soil hydrology, using four closed-form soil water relationships and several lysimeters, Hydrol. Earth Syst. Sci., 27, 2437–2461, https://doi.org/10.5194/hess-27-2437-2023, 2023.
Solomon, S., Plattner, G.-K., Knutti, R., and Friedlingstein, P.: Irreversible climate change due to carbon dioxide emissions, P. Natl. Acad. Sci. USA, 106, 1704–1709, https://doi.org/10.1073/pnas.0812721106, 2009.
Soubeyroux, M., Grigis, L., Rousset, F., Corre, L., and Boe, J.: Evolution des sécheresses météorologiques et agricoles en France en contexte de changement climatique, 36th Conference of the International Association of Climatology, https://drive.google.com/file/d/1Fw18eT6FZz756wwla0vh5Rhxy6XwpNYt/view (last access: 27 February 2024), 2023.
Soubeyroux, J.-M., Vidal, J.-P., Najac, J., Kitova, N., Blanchard, M., Dandin, P., Martin, E., Pagé, C., and Habets, F.: Projet ClimSec : Impact du changement climatique en France sur la sécheresse et l'eau du sol, Rapport final du projet, https://www.drias-climat.fr/public/shared/rapport_final_CLIMSEC.pdf (last access: 26 May 2025), 2011.
Spinoni, J., Vogt, J. V., Naumann, G., Barbosa, P., and Dosio, A.: Will drought events become more frequent and severe in Europe?, Int. J. Climatol., 38, 1718–1736, https://doi.org/10.1002/joc.5291, 2018.
Szczypta, C., Calvet, J. C., Maignan, F., Dorigo, W., Baret, F., and Ciais, P.: Suitability of modelled and remotely sensed essential climate variables for monitoring Euro-Mediterranean droughts, Geosci. Model Dev., 7, 931–946, https://doi.org/10.5194/gmd-7-931-2014, 2014.
Toreti, A., Bavera, D., Acosta Navarro, J., Cammalleri, C., de Jager, A., Di Ciollo, C. I., Hrast Essenfelder, A., Maetens, W., Masante, D., Magni, D., Mazzeschi, M., and Spinoni, J.: Drought in Europe – August 2022, JRC Global Drought Observatory, https://doi.org/10.2760/264241, 2022.
Tzampoglou, P., Loukidis, D., and Koulermou, N.: Seasonal Ground Movement Due to Swelling/Shrinkage of Nicosia Marl, Remote Sens., 14, 1440, https://doi.org/10.3390/rs14061440, 2022.
Vautard, R., Cattiaux, J., Happé, T., Singh, J., Bonnet, R., Cassou, C., Coumou, D., D'Andrea, F., Faranda, D., Fischer, E., Ribes, A., Sippel, S., and Yiou, P.: Heat extremes in Western Europe increasing faster than simulated due to atmospheric circulation trends, Nat. Commun., 14, 6803, https://doi.org/10.1038/s41467-023-42143-3, 2023.
Verfaillie, D., Déqué, M., Morin, S., and Lafaysse, M.: The method ADAMONT v1.0 for statistical adjustment of climate projections applicable to energy balance land surface models, Geosci. Model Dev., 10, 4257–4283, https://doi.org/10.5194/gmd-10-4257-2017, 2017.
Vidal, J.-P., Martin, E., Franchistéguy, L., Baillon, M., and Soubeyroux, J.-M.: A 50-year high-resolution atmospheric reanalysis over France with the Safran system, Int. J. Climatol., 30, 1627–1644, https://doi.org/10.1002/joc.2003, 2010.
Vidal, J.-P., Martin, E., Kitova, N., Najac, J., and Soubeyroux, J.-M.: Evolution of spatio-temporal drought characteristics: validation, projections and effect of adaptation scenarios, Hydrol. Earth Syst. Sci., 16, 2935–2955, https://doi.org/10.5194/hess-16-2935-2012, 2012.
Vincent, M., Cojean, R., Fleureau, J.-M., Cui, Y. J., Jacquard, C., Kazmierczak, J.-B., Masrouri, F., Tessier, D., Alimi-Ichola, I., Magnan, J.-P., Blanchard, M., Fabre, D., Pantet, A., Audiguier, M., Plat, E., Souli, H., Taibi, S., Tang, A.-M., Morlock, C., Maison, T., Mrad, M., Bréda, N., Djeran-Maigre, I., Duc, M., Soubeyroux, J.-M., Denis, A., Proust, D., Geremew, Z., Le Roy, S., Dumont, M., Hemmati, S., Nowamooz, H., Coquet, Y., Pothier, C., Makki, L., Chrétien, M., and Fontaine, C.: Rapport de synthèse final du projet ARGIC (Analyse du retrait-gonflement et de ses Incidences sur les Constructions), Projet ANR-05-PRGCU-005, BRGM/RP-57011-FR report, http://infoterre.brgm.fr/rapports/RP-57011-FR.pdf (last access: 27 February 2024), 2009.
Wilks, D. S.: Statistical methods in the atmospheric sciences, 3rd Edn., Elsevier/Academic Press, Amsterdam; Boston, 676 pp., ISBN 13: 978-0-12-751966-1, 2011.
Zhao, G., Zou, W., Han, Z., Wang, D., and Wang, X.: Evolution of soil-water and shrinkage characteristics of an expansive clay during freeze-thaw and drying-wetting cycles, Cold Reg. Sci. Technol., 186, 103275, https://doi.org/10.1016/j.coldregions.2021.103275, 2021.