the Creative Commons Attribution 4.0 License.
the Creative Commons Attribution 4.0 License.
 | 26 May 2025
Technical note: A weighing forest floor grid lysimeter
Heinke Paulsen
Markus Weiler
The forest floor (FF) is dominated by plant litter and its decomposition products, whereby it differs significantly from mineral soil. Because of its wider range of pore sizes and overall high porosity, it has a large capacity to retain water and thus plays an important role in redistributing water to the mineral soil beneath. Until now, most studies have focused on the behaviour of the organic layer when wetted and dried in a laboratory setting. Alternatively, fresh field samples were collected to determine water storage potential. We present a novel low-cost grid lysimeter designed specifically for the FF but that is also suitable for other organic soil layers. It can continuously measure all water balance components of the FF. The lysimeter detects precipitation with an accuracy of 0.03 mm, outperforming most rain gauges. The developed setup allows for further customization of in situ water quality measurements. This technical note describes the setup of the lysimeter and presents performance metrics from laboratory results and initial field data.
- Article
(3963 KB) - Full-text XML
-
Supplement
(742 KB) - BibTeX
- EndNote


The forest floor (FF) is hydrologically highly relevant but is only partially explored (Floriancic et al., 2023). This organic layer covering forest soils offers a huge potential to store and retain water and also plays an important role in the redistribution of water to deeper soil horizons. Consequently, it affects infiltration patterns and might also reduce runoff generation. For example, FF interception has a large influence on the water balance as it alters the water amount available for soil infiltration and runoff (Guevara-Escobar et al., 2007). Just like the canopy, the FF affects the temporal and spatial distribution as well as the chemical composition of soil water recharge.
The FF can reduce the amount of water reaching the soil and how much depends on the physical features of the FF and rainfall characteristics. Several studies revealed that the storage capacity of the FF is proportional to mass and thickness (Putuhena and Cordery, 1996; Zagyvai-Kiss et al., 2019), while the capacity of broadleaves to intercept water is greater than that of needle litter due to a higher surface area / weight ratio (Li et al., 2020; Walsh and Voigt, 1977; Zhao et al., 2022). The studies investigated the behaviour of the organic layer under wetting and drying conditions in laboratory settings, utilizing rainfall simulator experiments or collected field samples after rainfall events, subsequently oven-drying them to assess the water storage potential.
Currently, there are limited data regarding the potential dynamics of the FF contribution to the forest water cycle. The first approaches were undertaken by Gerrits et al. (2007), who developed a simple weighing device, similar to a lysimeter, to directly measure evaporation from the FF in the field. Floriancic et al. (2023) conducted a comparative analysis of soil moisture dynamics with and without FF coverage. They found that FF interception can reach up to 20 %–50 % of the total precipitation (Gerrits et al., 2007) and that it retains water for up to 2 d or longer (Floriancic et al., 2023). The results indicate that neglecting FF interception in modelling (alongside canopy interception) or treating it as a static percentage may lead to significant overestimations of recharge and transpiration rates in water balance assessments.
Our objective was to develop a device for investigating the dynamics of the water balance components of a FF. Weighing lysimeters are a well-established method for measuring water fluxes in agricultural contexts (von Unold and Fank, 2008). They allow for direct assessment of all water balance components, including various forms of precipitation (like rain, dew, and rime), drainage, evapotranspiration, and storage (Reth et al., 2021). Since lysimeters provide measurements at ground level, their results are close to the “true” precipitation as the precipitation measurements are unaffected by wind or precipitation intensity, unlike traditional rain gauges (Schnepper et al., 2023). Based on this, we developed a cost-effective forest floor grid lysimeter (FFGL), a weighing lysimeter with limited depth (covering only the organic layer plus the uppermost mineral soil) facilitating the deployment of multiple devices across various locations. In contrast to existing devices, the FFGL is adaptable to slopes, which allows for surface alignment even on steep hillslopes. With its smaller surface area (one-fourth of the device developed by Gerrits et al., 2007) and the separation into four grids and individual percolation measurements, it allows for exploration of the heterogeneity of water fluxes at an even smaller spatial scale. With the combination of 3D-printed parts and a customized microcontroller board, the costs could be reduced, allowing comparative observations between many sites. Additionally, the FFGL allows for later adaptation to measure water quality parameters like electrical conductivity or concentrations of dissolved organic carbon (DOC).
2.1 General setup
The FFGL was designed to generate data with high temporal resolution across multiple locations and varying spatial scales. Therefore, a low-cost setup to install multiple lysimeters at several study sites was necessary. To explore the small-scale heterogeneity of infiltration patterns, we partitioned the lysimeter into four grids, facilitating a typical grid lysimeter approach that enables the observation of outflow from each grid independently. Figure 1 illustrates the FFGL, comprising three main parts: a weighted container (1) containing the FF, a frame (2) supporting the measurement equipment and securing the system in the soil, and the control unit (3). The FFGL covers an area of 25 cm × 100 cm. In our case it is filled with the forest floor, but it could contain variable fillings, depending on the application (e.g. plants or deadwood). The FFGL quantifies the main water fluxes of the FF: precipitation (throughfall when beneath the canopy), evaporation (evapotranspiration in the case of ground vegetation), interception of the FF (storage), and percolation to the mineral soil (generally equivalent to infiltration into the soil).
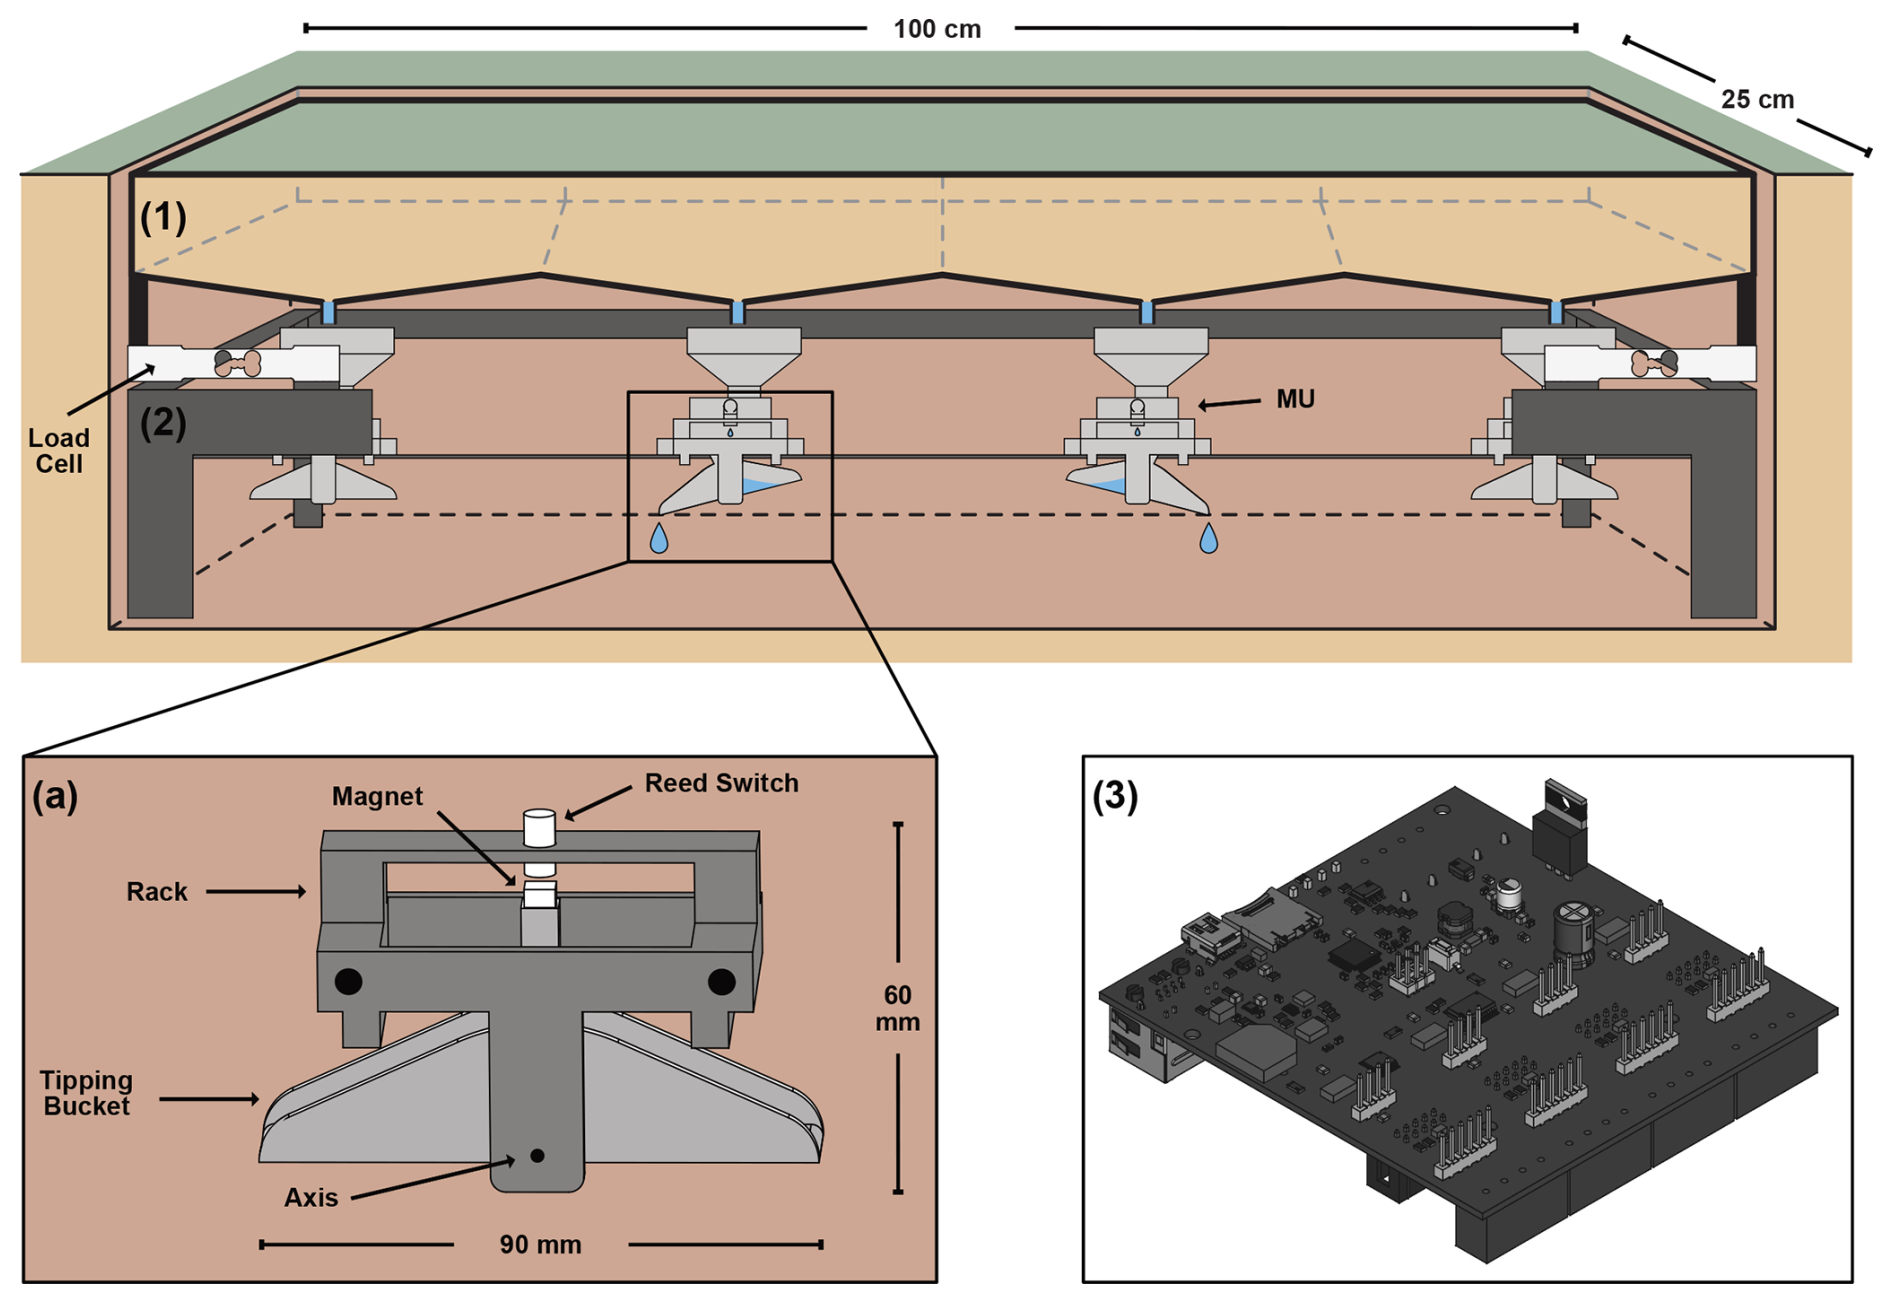
Figure 1Schematic drawing of the lysimeter setup. (1) The container and (2) the frame holding the load cells and (a) tipping buckets. (3) The customized microcontroller board.
The container is constructed of stainless steel and has a height of 25 cm and a maximum volume of 62.5 L. The bottom plate of the box is inclined, resulting in the formation of four grids, each draining through distinct openings. Additionally, these four grids are divided by plastic partition walls that can easily be cut for adjustment to different slopes in the field. On top of these dividing walls lies a perforated metal sheet wrapped with a geotextile to retain the forest floor material, which is placed on top. In this way there is no disruption of the FF, and we can potentially show redistribution of water induced by the FF layer. The container is placed on the load cells, which are fixed to the frame.
The frame supports the measurement equipment. The container rests on four load cells (LCs) mounted in the corners of the frame. Thereby the weight of the lysimeter can be measured continuously. Water is collected by a funnel into a measurement unit (MU) beneath each grid hole. This unit controls the intensity of water flow into tipping buckets (TBs), thereby enhancing the measurement accuracy. Additionally, the MU allows for adaptation to also measure water quality parameters like temperature and electrical conductivity (EC). The TBs measure the amount of draining water. Some lysimeters were equipped with a water collector at the bottom for subsequent laboratory analysis, while others were designed to allow water to infiltrate freely.
The control unit will be explained in the next section.
2.2 Control unit
2.2.1 Hardware
The electronics of the lysimeter were designed to meet user-friendly and economic criteria. Therefore, we used cost-effective hardware and a microcontroller compatible with Arduino IDE. The objective was to achieve high energy efficiency, since the lysimeters are located far from a power source and must autonomously measure continuously for at least 1 month. The computing unit must efficiently perform floating-point calculations to directly process the measurements. We opted for commercially available micro-SD cards for data storage. A real-time clock (RTC) was incorporated to associate the measurements with a time stamp. In environmental applications, the use of SDI-12 sensors is very common, since they use a common digital protocol for interconnection of sensors and data loggers and are characterized by low energy consumption. This is why we incorporated this feature into our board to enable the use of the FFGL as an SDI-12 sensor. System-relevant parameters such as the SDI-12 bus address are stored on the board.
The connectivity of the circuit board includes the following ports: for lysimeter measurements, there are
-
4× load cell inputs,
-
4× temperature measurements,
-
4× EC analogue inputs, and
-
4× pulse inputs for reed contacts of the tipping buckets.
For control and data output, there are
-
1× SDI-12 sensor,
-
1× USB,
-
1× SD slot, and
-
1× RTC.
2.2.2 Microcontroller, Arduino IDE, and software
To accelerate the development process, we decided to use Arduino IDE and its supported hardware. This platform is broadly used in environmental monitoring and supports various microcontrollers (MCUs). After testing various microcontrollers supported by the Arduino platform, ATSAMD21G18A-48 proved to be the most suitable and cost-effective option. The microcontroller, produced by AVR/Microchip, incorporates a M0+ processor along with adequate flash memory and RAM. The advantage of this microcontroller is its high compatibility with old Arduino libraries while offering many new features with its Cortex architecture. This MCU operates at 3.3 V with a clock speed of 48 MHz and 32 bits, allowing for fast and energy-efficient evaluation of measured values. The ADC has a high resolution at 12 bits. The controller is used in some official Arduino boards like Arduino Zero or the industrial series Arduino MKR. However, since these boards do not fulfil our specifications, we have created our own board that accommodates the controller along with the necessary peripherals. To program our board, we simply flash the bootloader of MKR Zero and program it like MKR Zero but with the advantages of our own hardware peripherals. The board was created using the Altium Designer layout and schematic software.
The microcontroller was programmed using Arduino IDE due to its user-friendly interface, ease of learning, open-source nature, and compatibility with various hardware components. We developed a program that reads the sensors in defined time steps. In combination with event-based programming, and depending on the electrical power supply, data can be collected more often (i.e. every minute) during rain events and less often (i.e. every 10 min) during drier periods. This contributes to energy conservation. Program code and .stl files for printing and board design can be found at https://github.com/HeinkePaulsen/Forest-Floor-Grid-Lysimeter (last access: 5 March 2025).
2.3 Load cells
For the mass measurement of the FFGL container, we used four H10A LCs from BOSCHE with a single weighing range of 15 kg together with HX711 load-cell amplifiers. These LCs operate with strain gauges. They transform forces, in our case pressure, into an electrical output that can be measured and standardized. The change in resistance of the strain gauges can be quantified as voltage. This change in voltage is proportional to the amount of force applied to the cell, and thus the mass of the FF can be calculated from the LC output.
Each LC was calibrated individually to attain high accuracy by applying a known mass and averaging five analogue readings. To obtain the calibration factor that needs to be put into the program, the known weight is divided by this analogue value. We performed precision tests to assess the accuracy and resolution of mass measurements for the lysimeter container. Therefore, we placed masses ranging from 0 to 10 000 g in the centre of the lysimeter. Additionally, we performed some tests where we placed the mass in the four different grids of the lysimeter.
2.4 Tipping bucket
The TB consists of a 3D-printed bucket and frame. These parts are connected with a metal pin. Additional parts include a magnet and a reed switch. The TB can easily accommodate larger or smaller tipping volumes by replacing the tipping bucket with differently scaled TBs without further changes to the overall setup. The principle of a tipping bucket is straightforward. The water accumulates in one chamber of the bucket until it reaches the weight that induces tipping, subsequently allowing the other chamber to fill. The tipping is recorded when the magnet closes the reed switch during tipping.
We used either Bambulab P1P or a Prusa MK2 for our 3D-printing process. To guarantee high stability and long-term robustness in the environment, we used PETG (polyethylene terephthalate glycol) filament, which delivers a significant chemical resistance, durability, and formability and shows no interference with water quality measurements. Since we want to achieve a very small tipping volume, it is important to use the “ironing” feature for 3D-printing of the tipping buckets. This ensures a smooth surface and reduces adhesion of water to the material. To avoid back-bouncing of the TB against the frame whilst tipping – which generates erroneous double tips – small shock absorbers made from hot glue were added at the frame contacts.
Various experiments were conducted for the static calibration of the tipping buckets. Continuous dripping was done with a pipette for 20 and 50 g. As is typical for TBs, the tip volume depends on the water intensity flowing into the TB. However, since in our lysimeter the water has to pass through the forest floor, we assume dripping water rather than high flow rates into the TB. Also, the MU is created to have a rather small outlet, which restricts the intensity to a specific level, thereby enhancing the system's accuracy. Due to the aggregation of tips in the measurement interval, we neglect the degradation in precision that results from this restriction. The outflow still allows for correct measurement in a 10 min interval of 3 L, which would be equivalent to 48 mm water depth and which is typically much higher than extreme 10 min precipitation events.
2.5 Filling of lysimeters and location or positioning in the field
The FFGL boxes were filled during the summer of 2023 (August to October). The objective was to fill the lysimeters with FF material that was as undisturbed as possible and to recreate the soil layers to prevent big rocks and roots from redirecting water fluxes. We decided to fill the boxes with the upper 15 cm of material from the surface, accommodating litterfall in autumn. First, we sliced off the FF layer (typical moder) in one piece and put it aside. The soil below was put into boxes in 5 cm layers to a depth of 15 cm for subsequent reconstruction. The perforated metal sheet in the container was aligned with the actual surface slope in the field using the separating plastic walls. On top, we laid a water-permeable geotextile on which we reconstructed the soil layer by layer within the box. The undisturbed O layer was placed on top (Fig. 2).
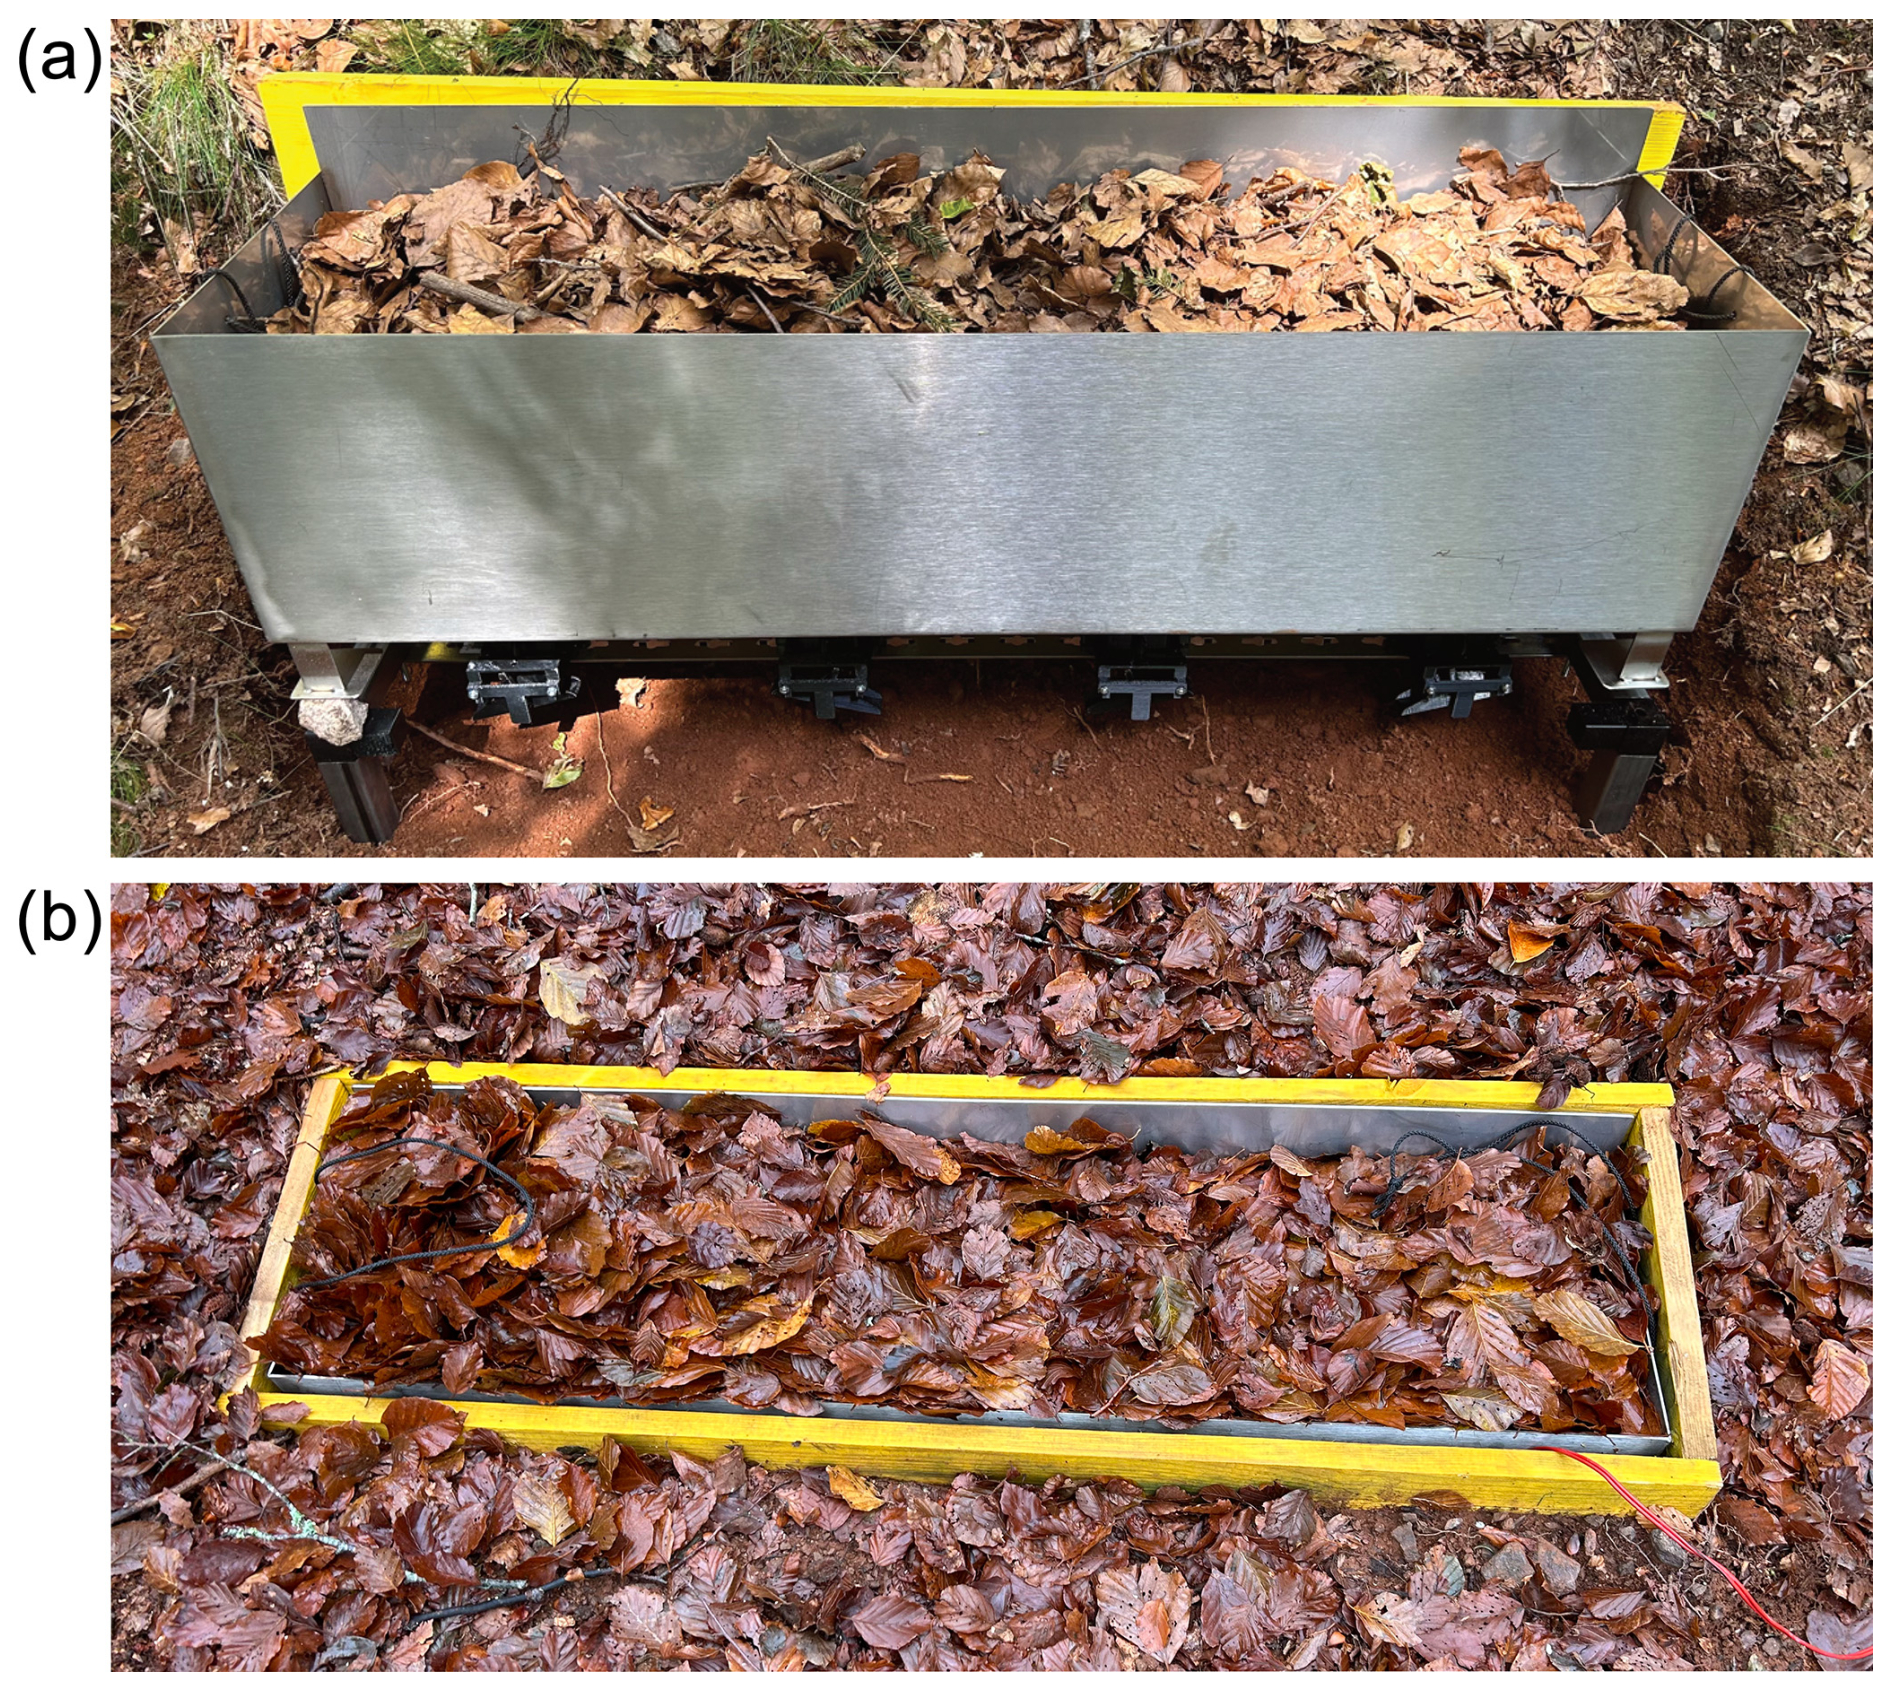
Figure 2(a) Lysimeter container on the frame. (b) Fully installed FFGL aligned with the location.
To fit the lysimeter frame and box into the location where we removed the FF, the excavation pit was enlarged to 50 cm depth and widened slightly, ensuring that the surface of the lysimeter aligns with the surrounding FF. The excavation hole walls were reinforced with wooden plates to prevent contact between the lysimeter walls and the surrounding soil. Then the frame was inserted and aligned for balance. The electronics were connected and the box inserted. Lifting the container onto the frame from the top allows for easy access for cleaning purposes and maintenance. A lysimeter container used for testing in the laboratory was filled equally and then transported to the laboratory for functionality tests.
2.6 Water balance calculation
The measurements of a weighing lysimeter can be used to determine the water balance of the FF for each observed time step. The amount of water percolating to the deeper soil D can be determined by multiplying the number of tipping bucket tips n by the tipping volume. With an average tipping volume of 2.1 cm3 and the area covered by each lysimeter grid, we reach a resolution of 0.03 mm for the draining water.
The load cells continuously measure the storage S and, consequently, the mass of the lysimeter. If there is no drainage and the weight change is negative, we know that this change is due to evaporation E from the FF.
A positive storage change is a signal for precipitation in our case canopy throughfall (PTF). Under the assumption that there is no evaporation during a precipitation event, this precipitation–canopy throughfall can be calculated as
3.1 Mass quantification with load cells
To evaluate the accuracy of the mass quantification, we filled the container with known masses ranging between 0 and 10 kg in 500 g steps and conducted 20 measurements. The mass measurement accuracy achieved is 0.3 %. A second test was conducted to confirm this, in which a fixed mass of 1000 g was placed in various positions within the container, specifically at the centre of each grid and at the overall centre of the container (Fig. 3a). This test yields an overall precision and standard deviation of 2.0 g, corresponding to 0.008 mm of precipitation. Figure 3a also shows that the position of the mass in the lysimeter has an influence on the measured mass. Therefore, the mass of the filled container should be distributed quite evenly in all four LCs to ensure accurate results.
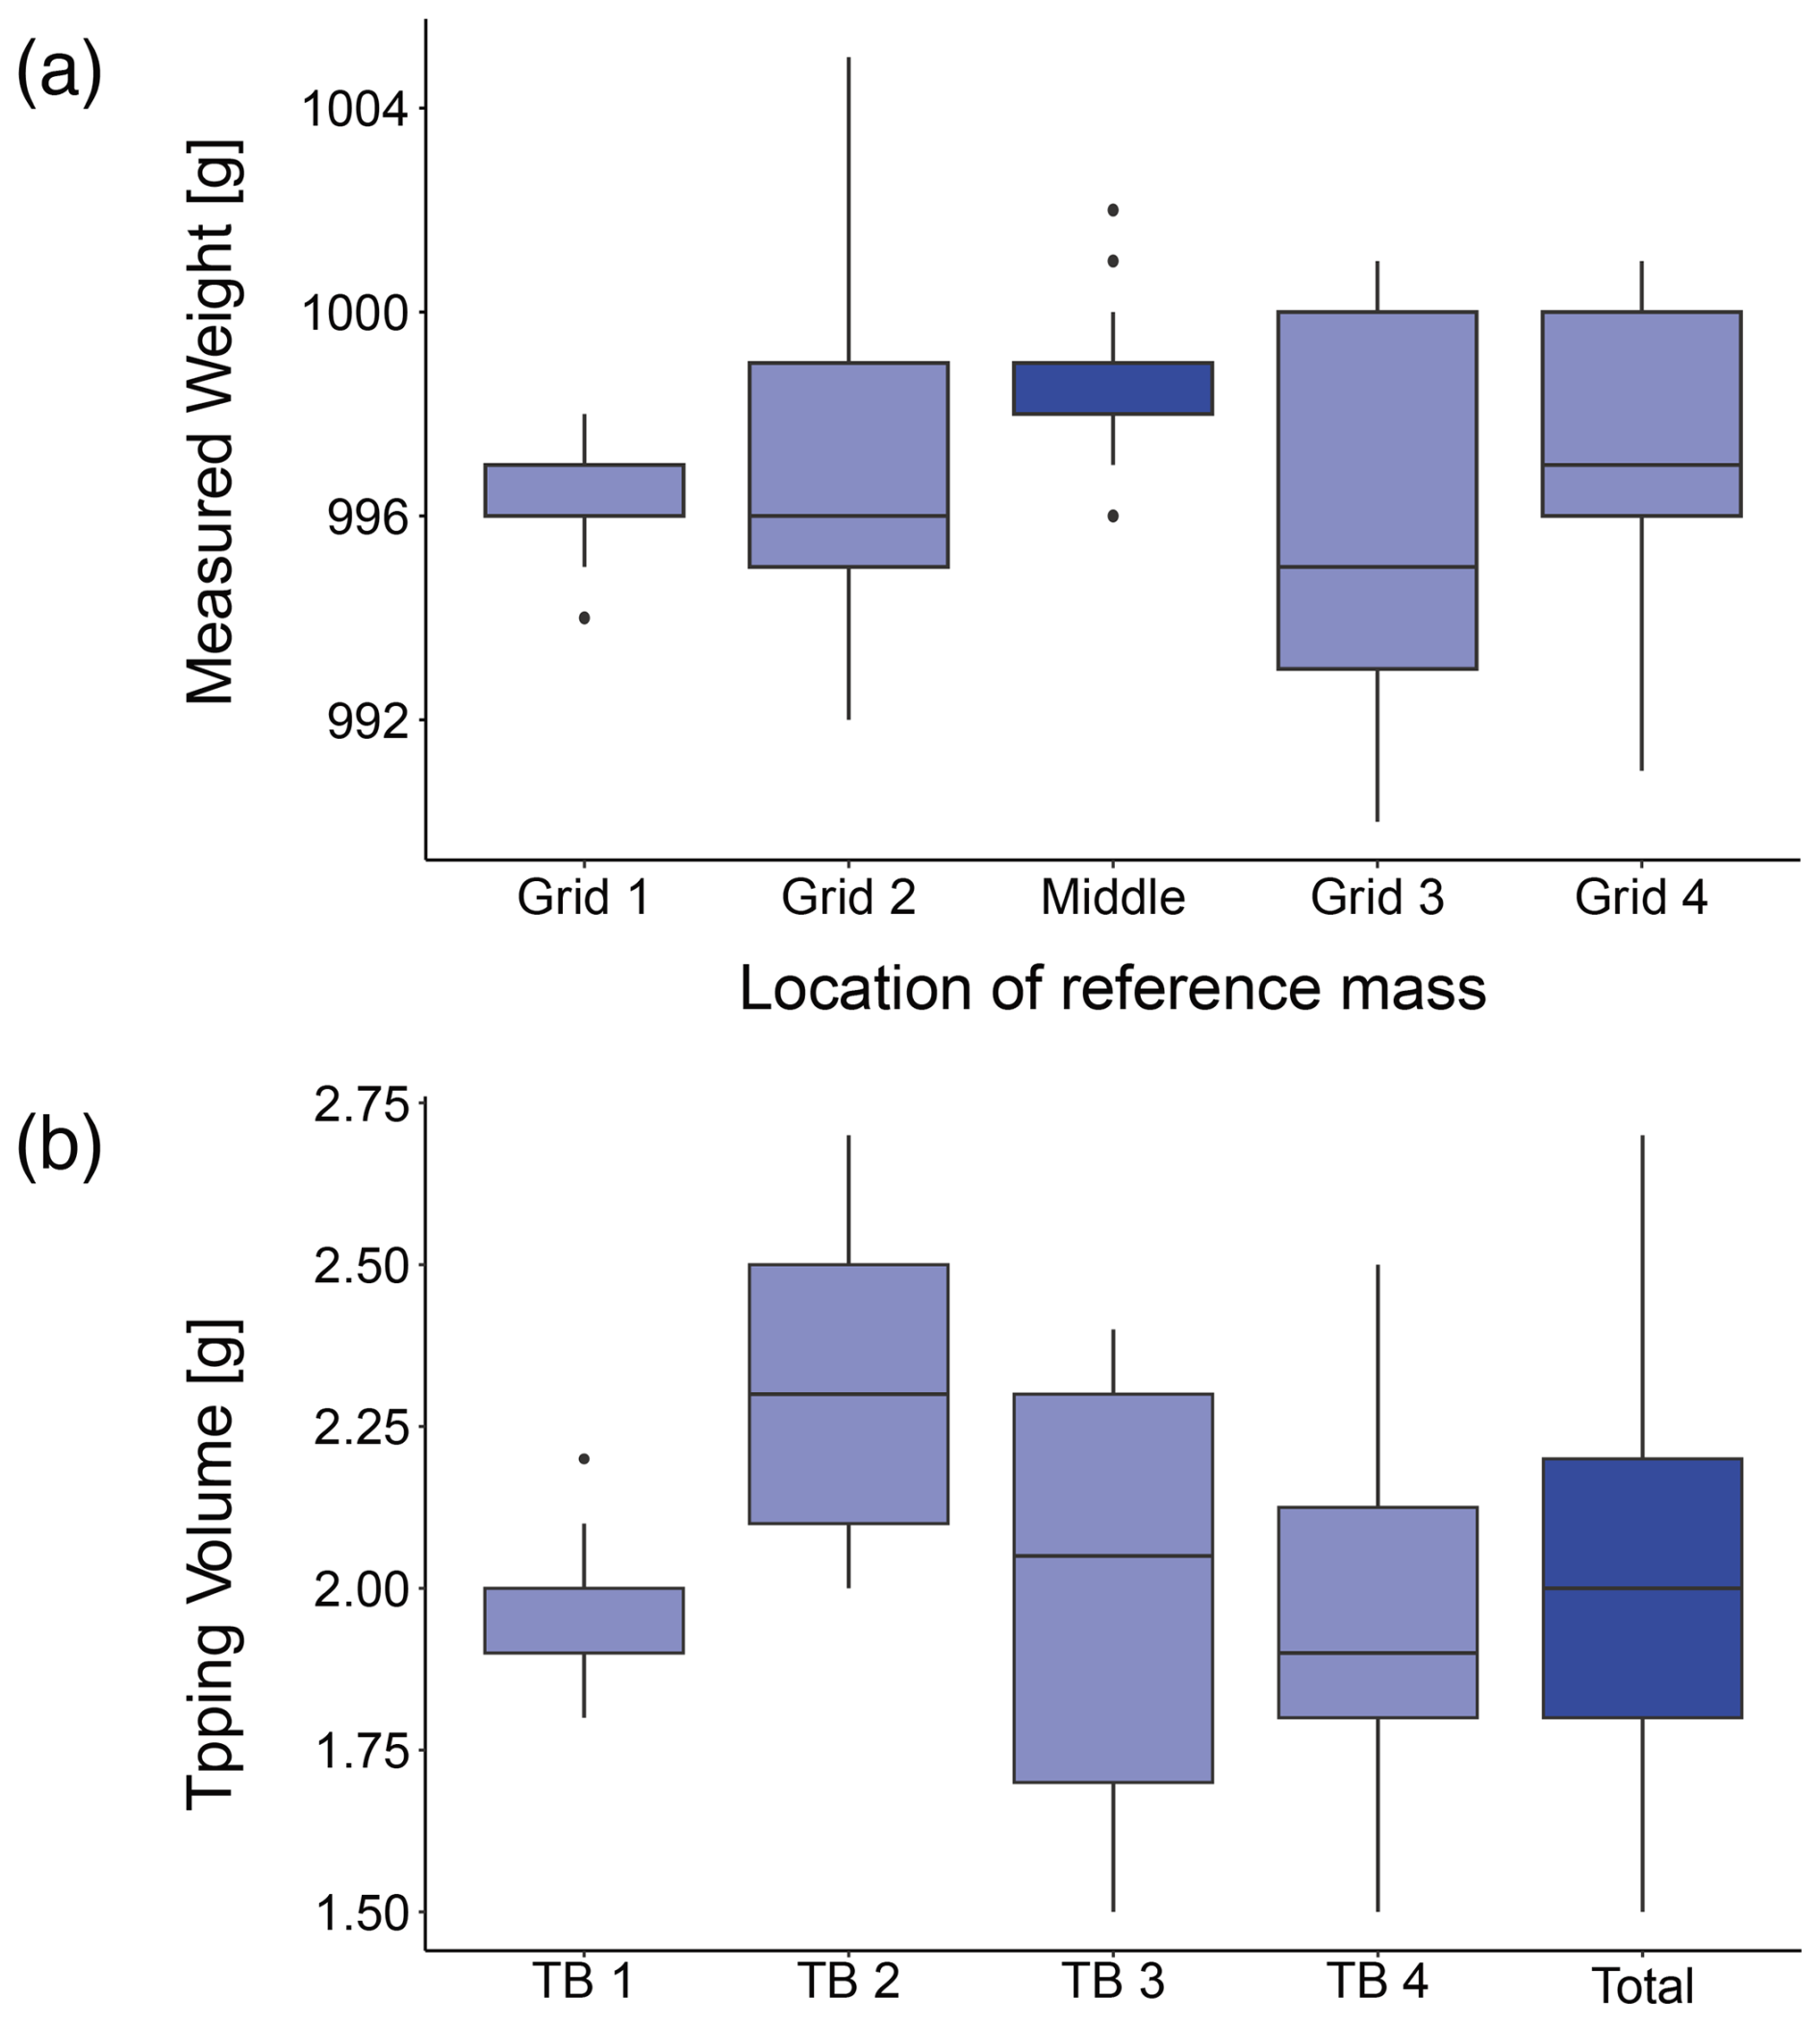
Figure 3(a) Weighing precision of load cells, depending on the location of the reference mass (1000 g) in the container. (b) Tipping volume of four single tipping buckets below one lysimeter.
3.2 Quantification of percolating water with tipping buckets
The calibration of the TBs yields a mean tipping volume of 2.1 mL (Fig. 3b), corresponding to a drainage resolution of 0.03 mm per grid (25 × 25 cm). The standard deviation lies at 0.3 mL, equivalent to 0.0048 mm. The error is 2 %. We also show here the differences between different tipping buckets. For the four tested TBs, the mean tipping volumes lie between 1.9 and 2.3 mL, equivalent to 0.031 and 0.037 mm. The observed minor differences are probably caused by the printing accuracy of the 3D printer. The resolution is comparable and acceptable when compared to other TBs mounted in rain gauges. For example, the commercially available HOBO Raingauge Data Logger RG3 has a resolution of 0.1 mm with an error of 1 %, and the tipping bucket rain gauge from ecoTech also has a resolution of 0.1 mm. Lysimeters employed in Ruth et al. (2018) quantify draining water with a 50 mL tipping bucket, and they yield a resolution of approximately 0.016 mm. With a mini-lysimeter the resolution was 0.5 g, corresponding to a water column of approximately 0.007 mm.
3.3 Irrigation experiment
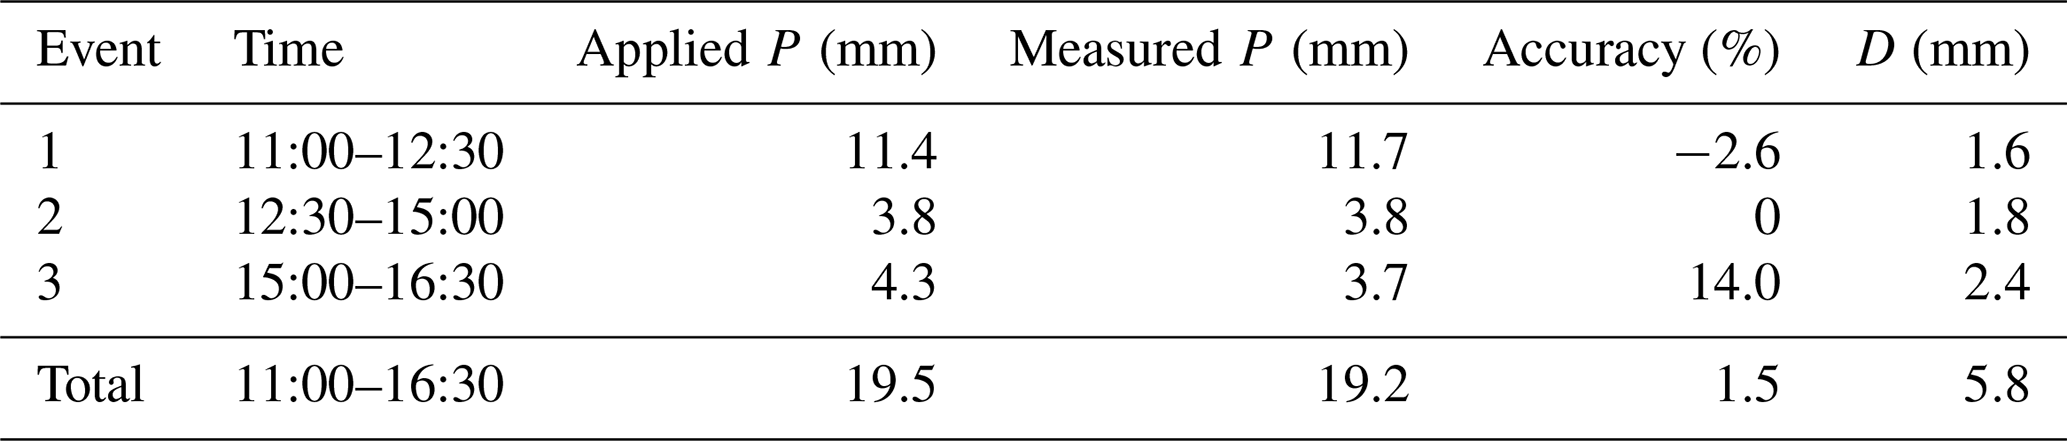
We performed an irrigation experiment in the laboratory to test the performance and accuracy of the whole lysimeter setup under controlled conditions. The results are presented in Table 1. The mass of the empty box is 13.5 kg. We filled it with 21 kg of the FF consisting of mineral soil and organic layers. We irrigated a total amount of 4875 mL, corresponding to 19.5 mm of precipitation. We separated the irrigation into three artificial events.
In Fig. 4 we plotted the amount of measured precipitation and draining water as well as the cumulative fluxes during the irrigation in 10 min increments. Due to the dried-out material, drainage started after 16 min and 8.6 mm of water applied. For the second and third events, the drainage occurred much more quickly (3 min, with 0.5 and 0.2 mm of water applied) due to the higher initial water content. Also, during these two events a larger part of the irrigated water drained from the box.
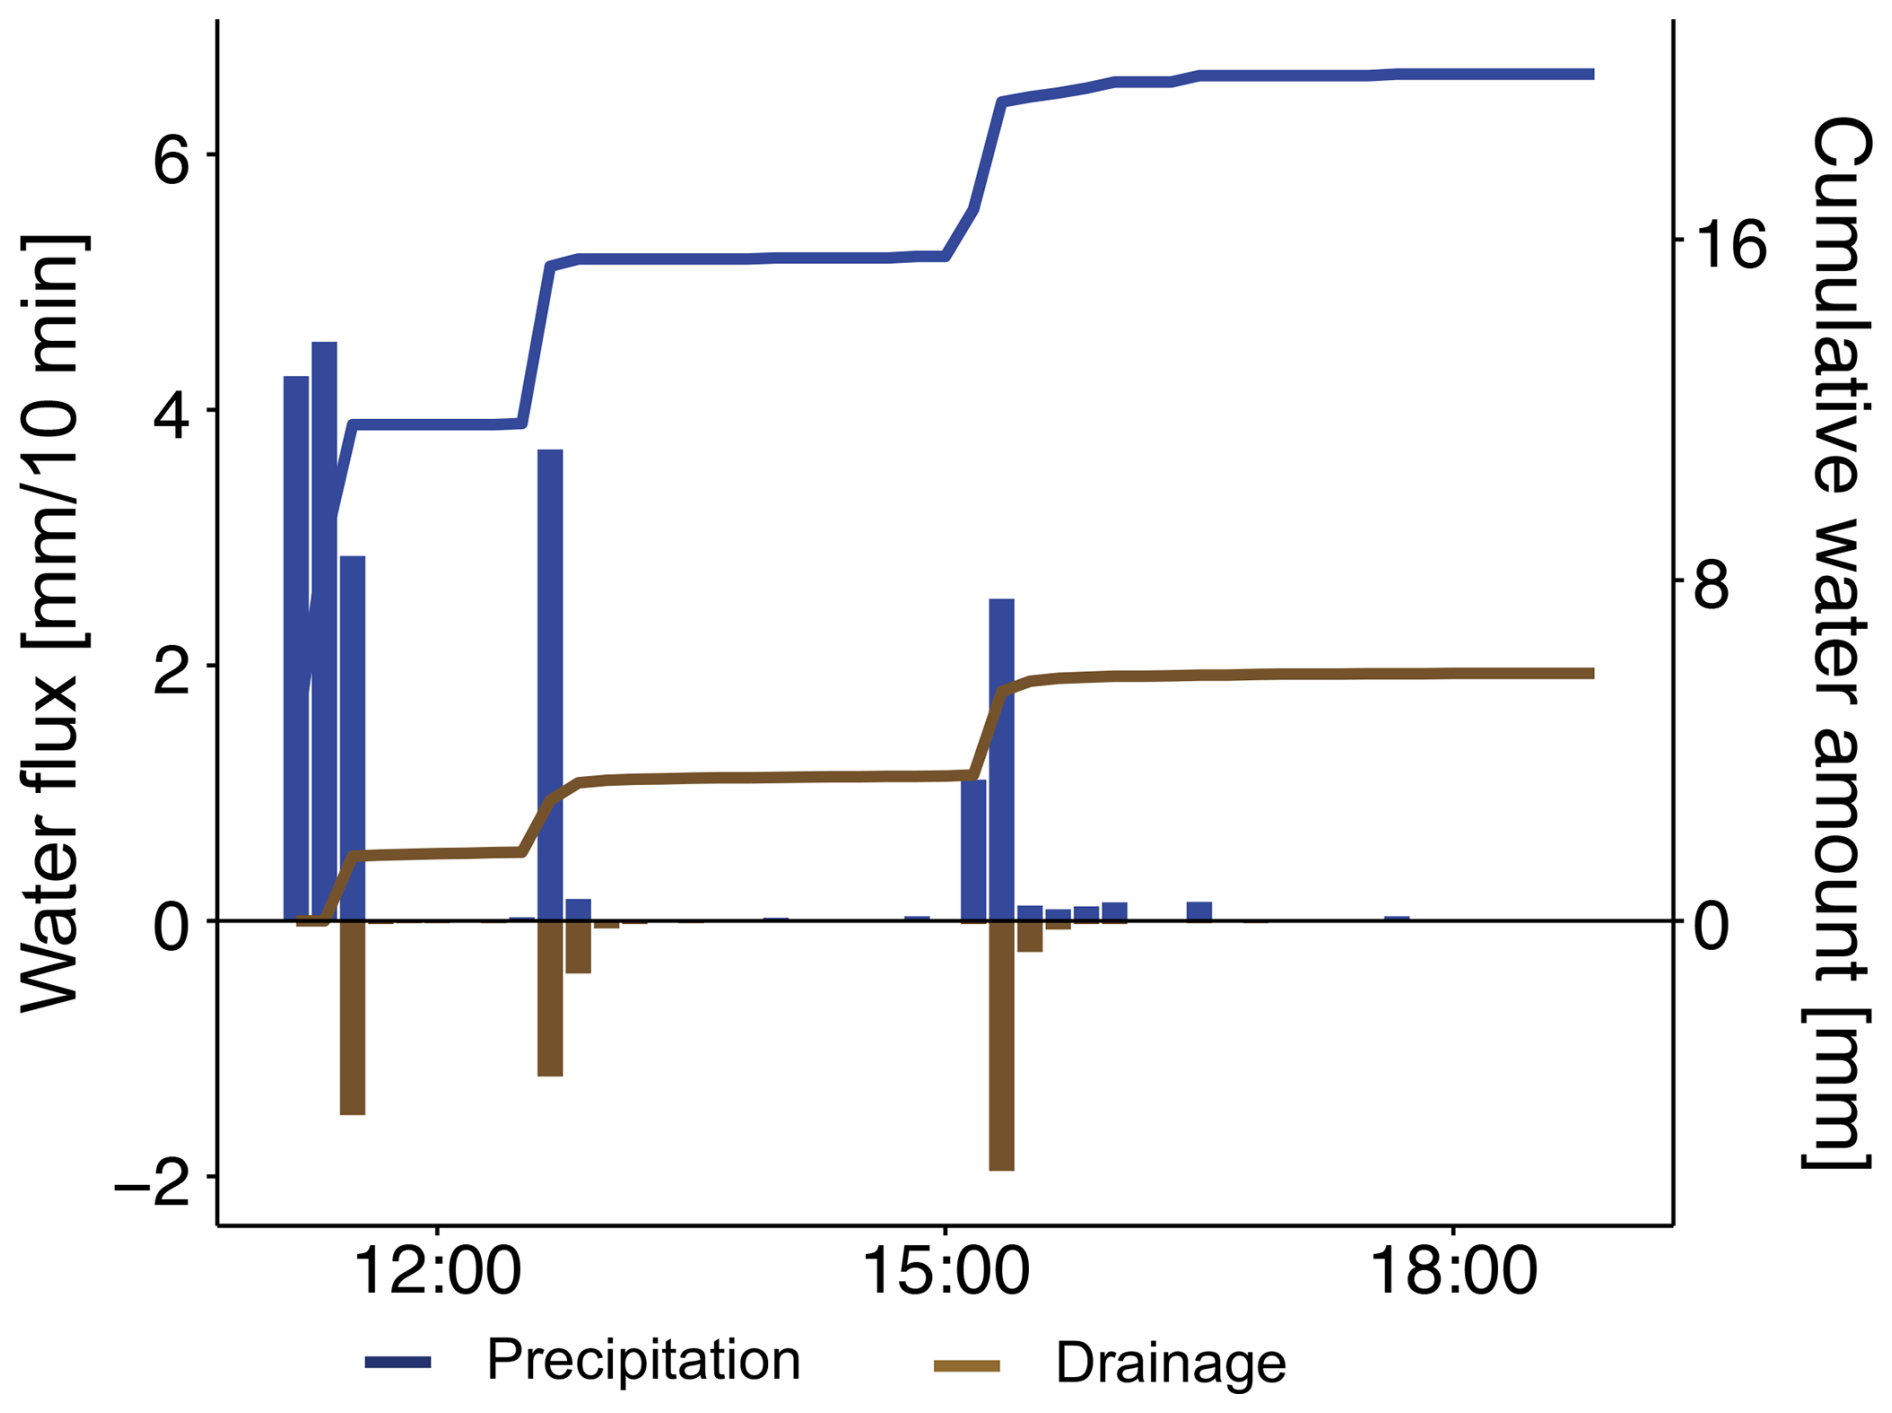
Figure 4Results of the irrigation experiment: water fluxes (bars) and accumulated fluxes (lines) in 10 min time steps.
Comparing the cumulative fluxes, a major part of the irrigated water (70.1 %) remained stored in the FF and did not percolate. The overall statistics reveal that we applied 19.5 mm of water, but the lysimeter only measured 19.2 mm, resulting in a 1.5 % divergence from the applied amount. This difference could be explained by evaporation during the irrigation which cannot be measured due to the measuring principle of the lysimeter and water missing the lysimeter due to an imprecise nozzle of the irrigation device. In the 10 h following the last TB tip, we could observe a further decline in mass without any further water drainage. Based on this, we can deduce that approximately 1.8 mm of water was evaporated from the lysimeter container, accounting for 13 % of the irrigated water.
3.4 Initial field results
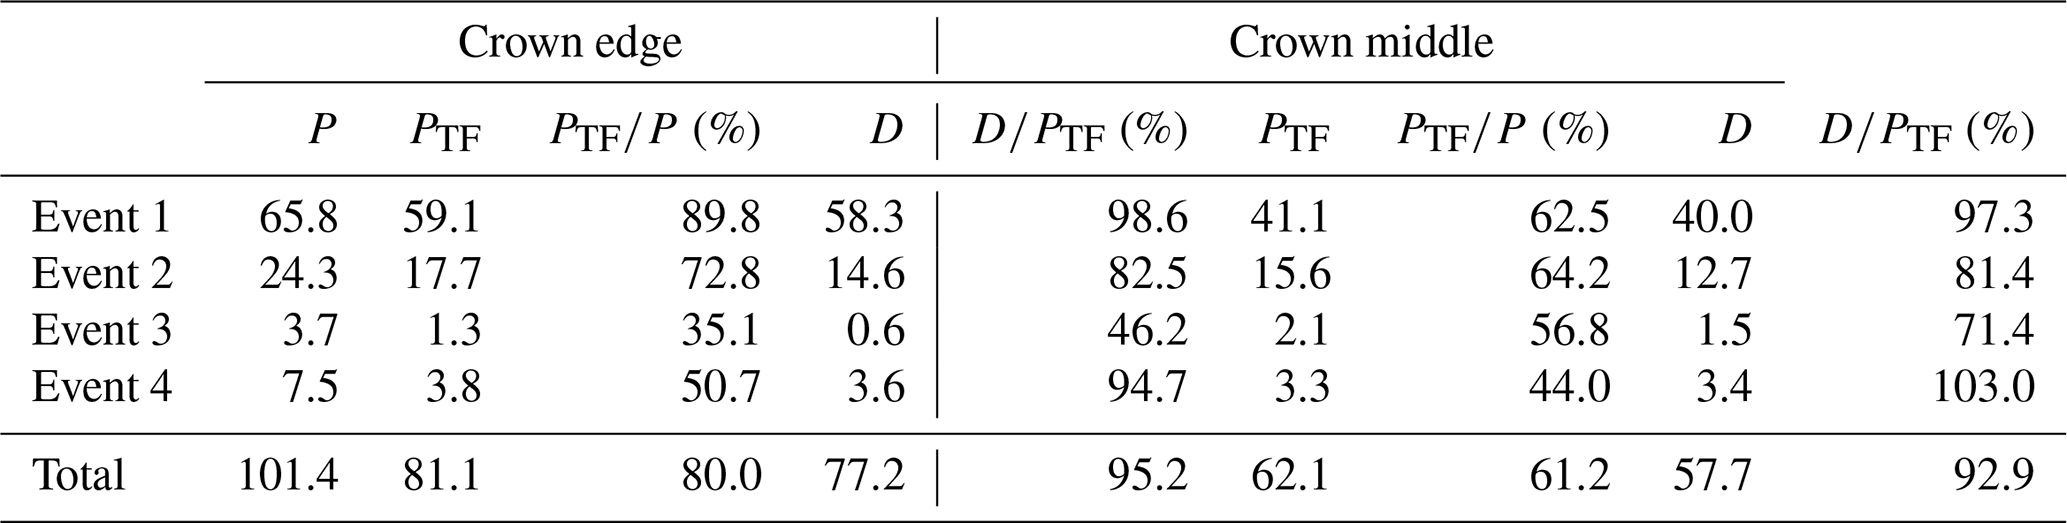
To demonstrate the performance of the FFGL under field conditions, we provide the results of two lysimeters located in the Conventwald, an experimental site in a mixed forest stand of the University of Freiburg in the Black Forest, over a 10 d period. The site is located 20 km east of Freiburg at 840 m a.s.l. and has a mean annual precipitation of 1749 mm. The occurring humus form is a typical moder. More site characteristics can be found in Rinderer et al. (2021). We positioned the FFGLs under two spruce trees – one under the crown edge (SCE) and one in the crown middle (SCM) – 1.5 m apart from each other. In Fig. 5 we compare the lysimeter data to the above-canopy precipitation. The total amount of above-canopy rainfall (P) during the observed time period was 101.4 mm. We split it into four separate rainfall events (Table 2). With the lysimeters at the two locations SCE and SCM, we measured 81.1 and 62.1 mm in total throughfall (PTF). This equals canopy interception losses of 20.0 % and 38.8 % for the two locations, which is comparable to other studies. For example, Gerrits et al. (2010) observed losses of 18 % in broadleaf stands, while Andreasen et al. (2023) observed a 35 % loss in broadleaf stands and a 44 % loss in coniferous forest stands.
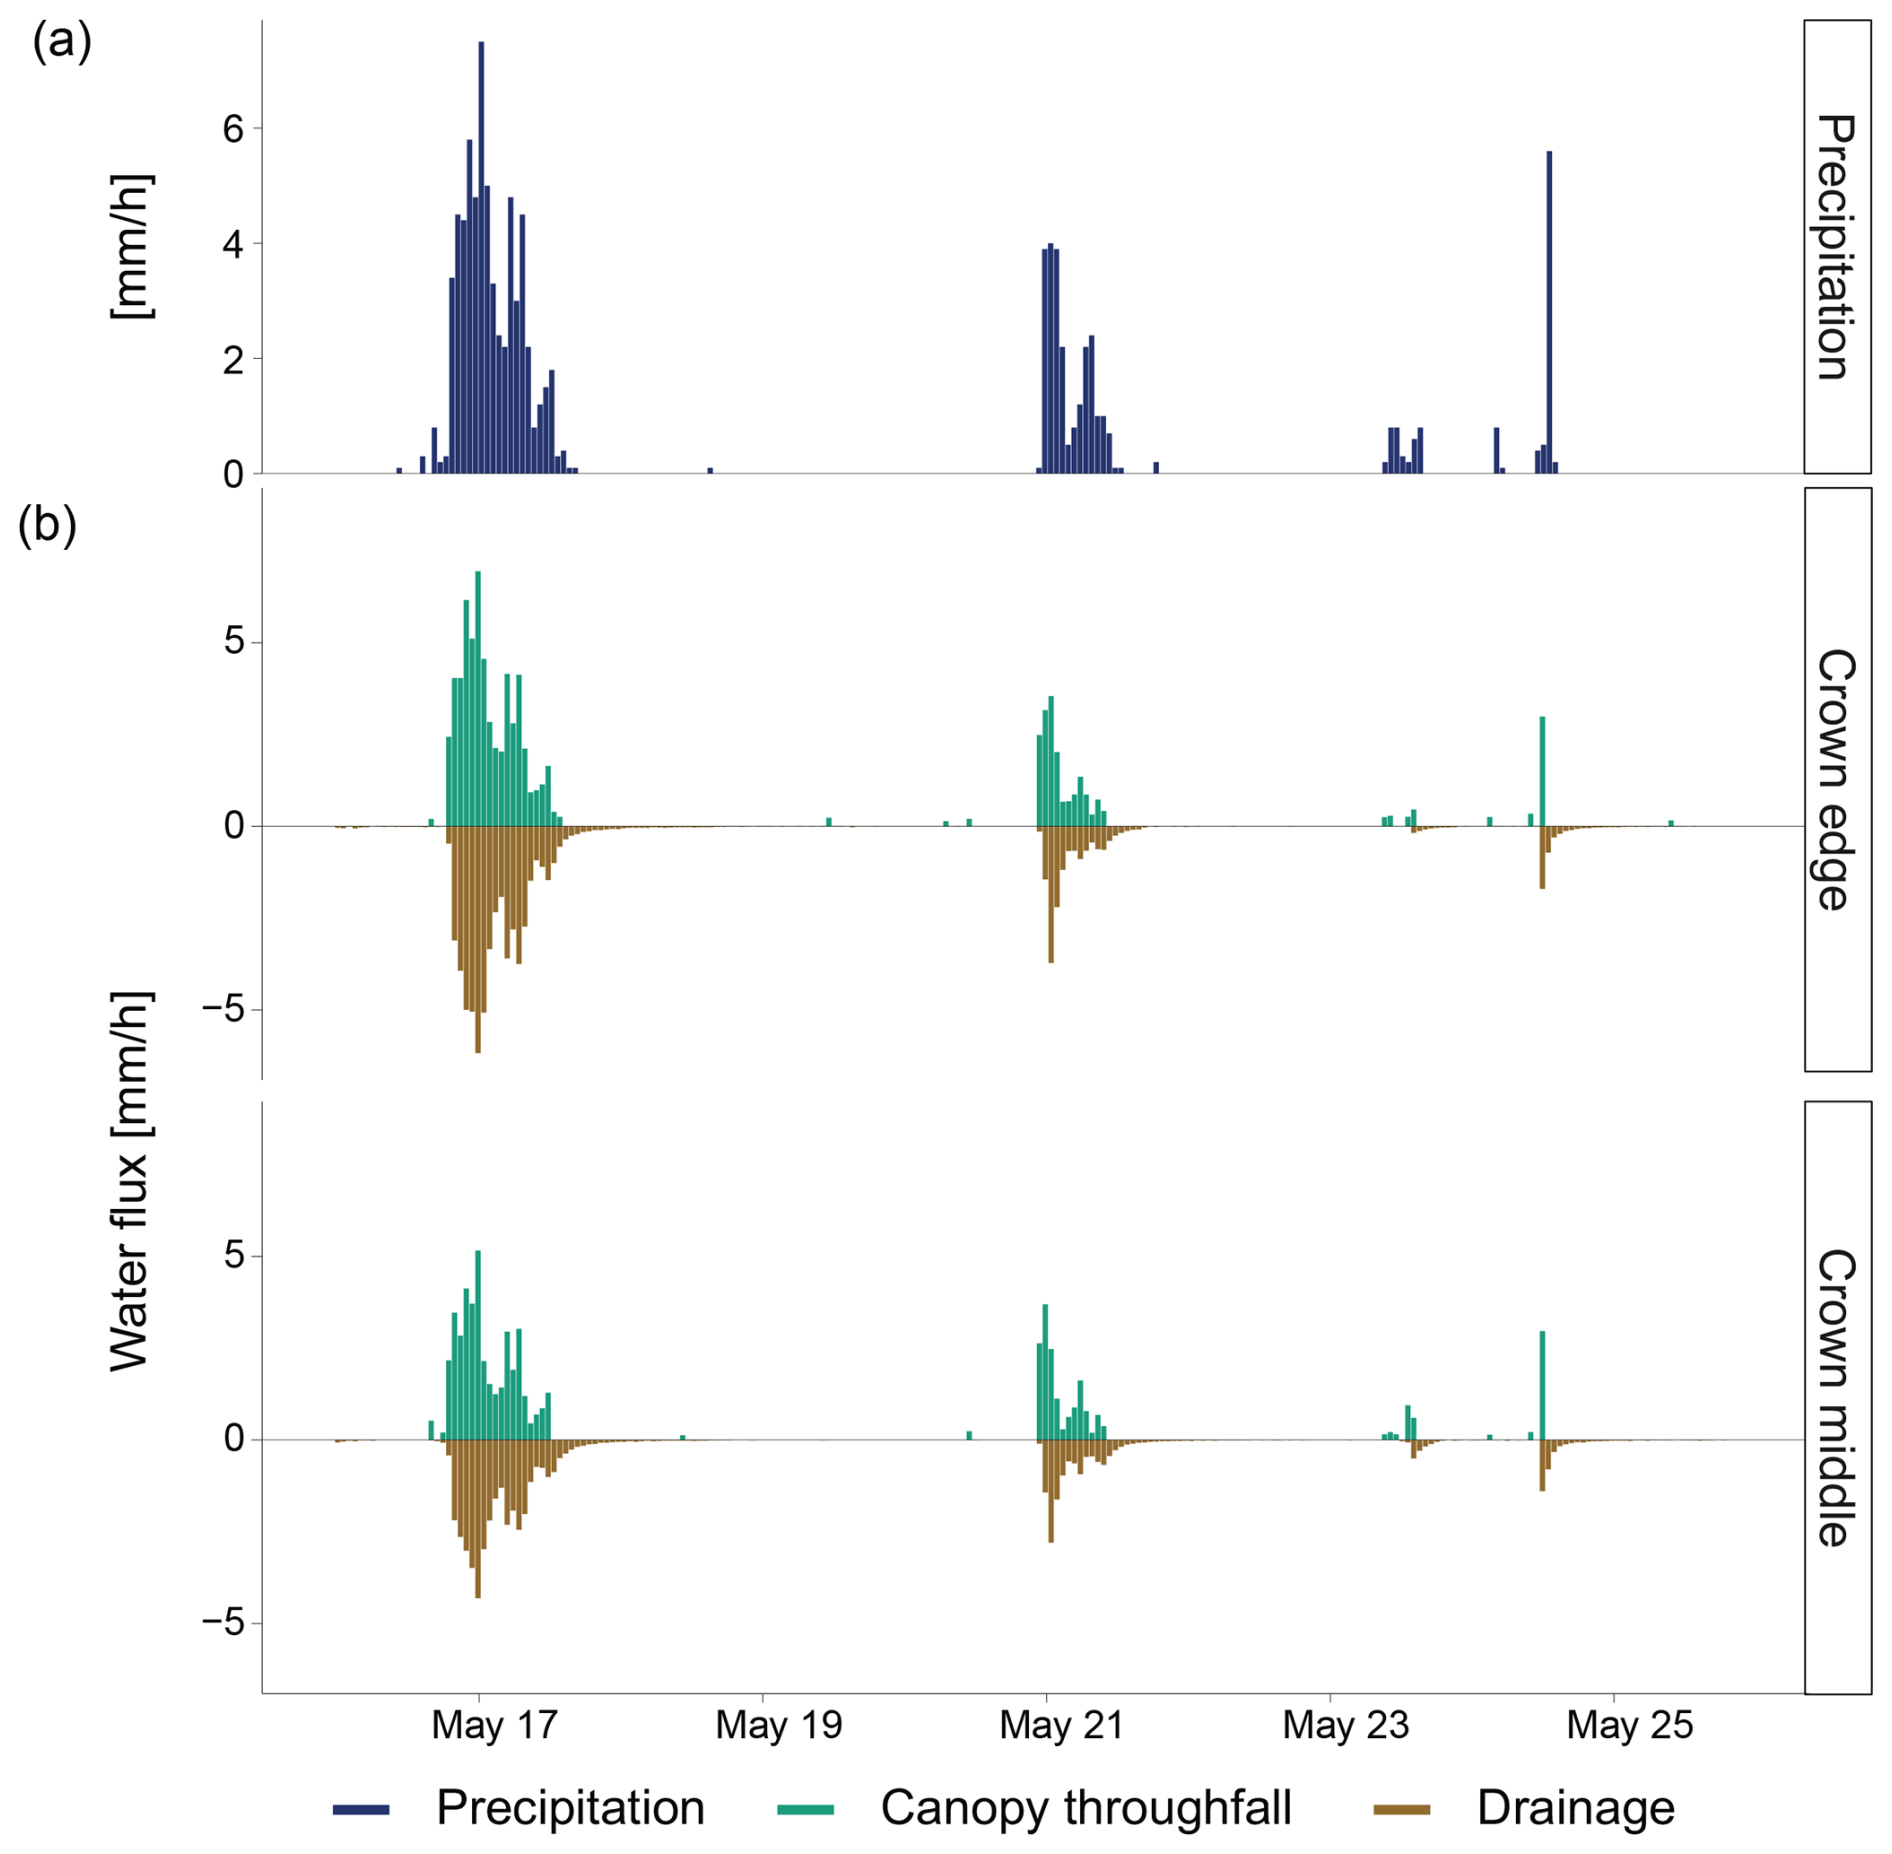
Figure 5(a) Hourly precipitation (P) measured above the canopy and (b) canopy throughfall (PTF) and drainage (D) measured by the two lysimeters below the crown edge and crown middle of a spruce tree.
Looking at the individual events (Table 2), it becomes evident that the fraction of rainfall reaching the ground is highly dependent on both the event and the position of the lysimeter. The fraction of the PTF reaching a lysimeter fluctuates between 35 % and 90 % during the analysed time period due to the shape of the crown and varying rainfall conditions (wind speed, drop size, and wind direction). Smaller rainfall events cause a smaller partitioning of canopy throughfall, resulting in less percolation to deeper soil horizons.
Table 2Observed water fluxes (P: precipitation, PTF: canopy throughfall, and D: drainage) in millimetres and the proportion of throughfall to precipitation (). The proportion of drainage to canopy throughfall () (%) for the two lysimeters during the 10 d period is sectioned into four events.
Drainage occurs with a delay to the start of each precipitation event, showing that it needs time for the water to flow through the FF. The cumulative fluxes in Fig. 6 show that there is a divergence in both time and amount. Only 95.2 % and 92.9 % of PTF become D. Not all of the P reaching the ground infiltrates to deeper soil horizons, but it is stored in the FF and might later evaporate. In the study period only 3.3 and 1.5 mm evaporated, accounting for 4.1 % and 2.4 % of PTF. Evaporation could be higher in drier and warmer seasons when potential evaporation rates are higher.
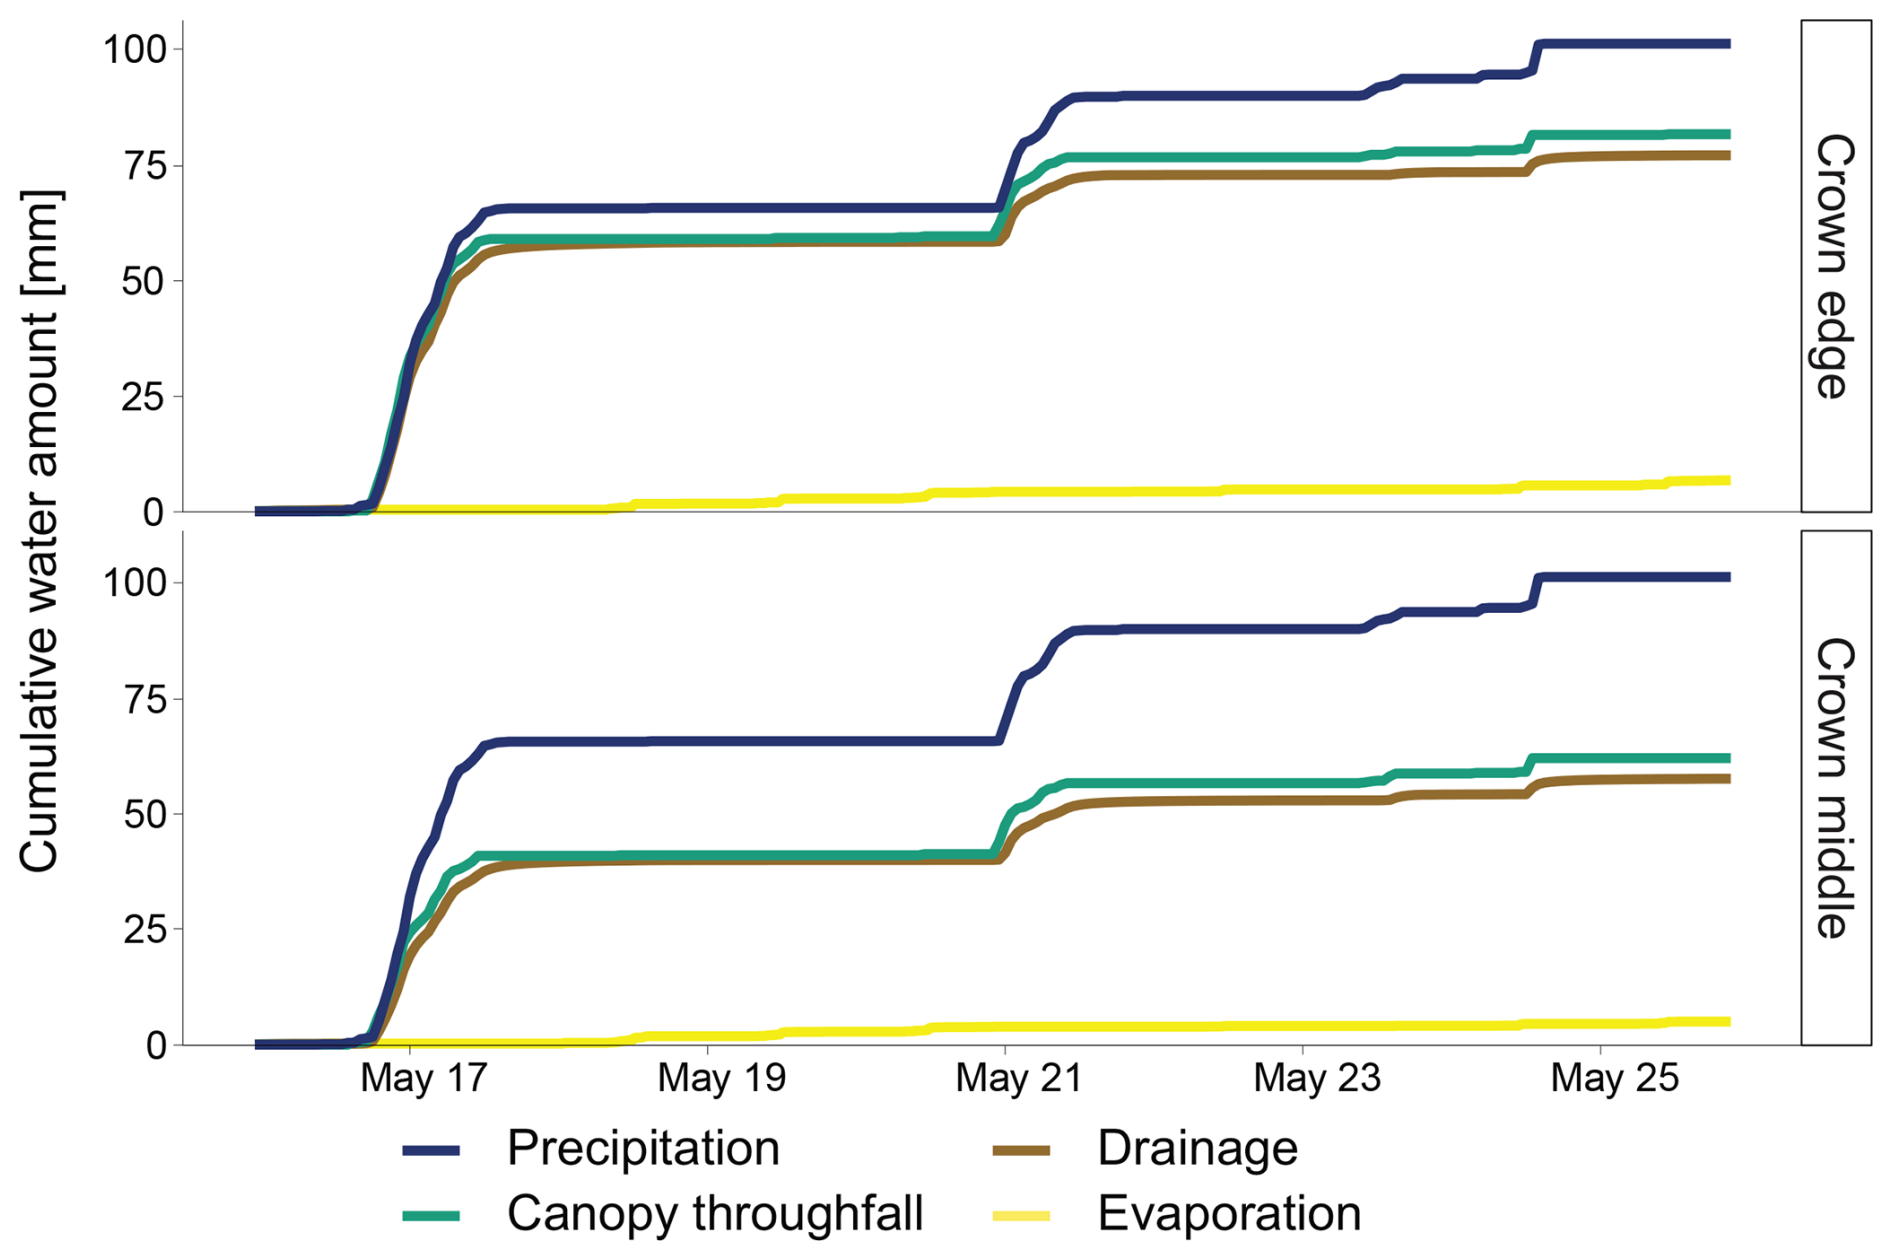
Figure 6Cumulative water amounts, including precipitation above the canopy (P), canopy throughfall (PTF), drainage (D), and evaporation (E) measured by the two lysimeters during the 10 d period.
PTF accounts for a major part of P and might depend on the position of the lysimeter under the trees. In addition, due to the spatial heterogeneity in the throughfall, the FF further influences infiltration pathways. This becomes clear when looking at the percentage of drainage through the various lysimeter outflows. It becomes clear that some of the grids have much higher amounts of drainage than others (Fig. 7). For example, during the study period, the outermost right grid (TB 4) of SCM received over 50 % of the draining water, while TB 3 had only 5 %. One could state that this occurs due to spatial heterogeneity in PTF, but since the mass gain in all four LCs was similar, we conclude that this deviation in infiltration must be due to rerouting pathways in the FF itself.
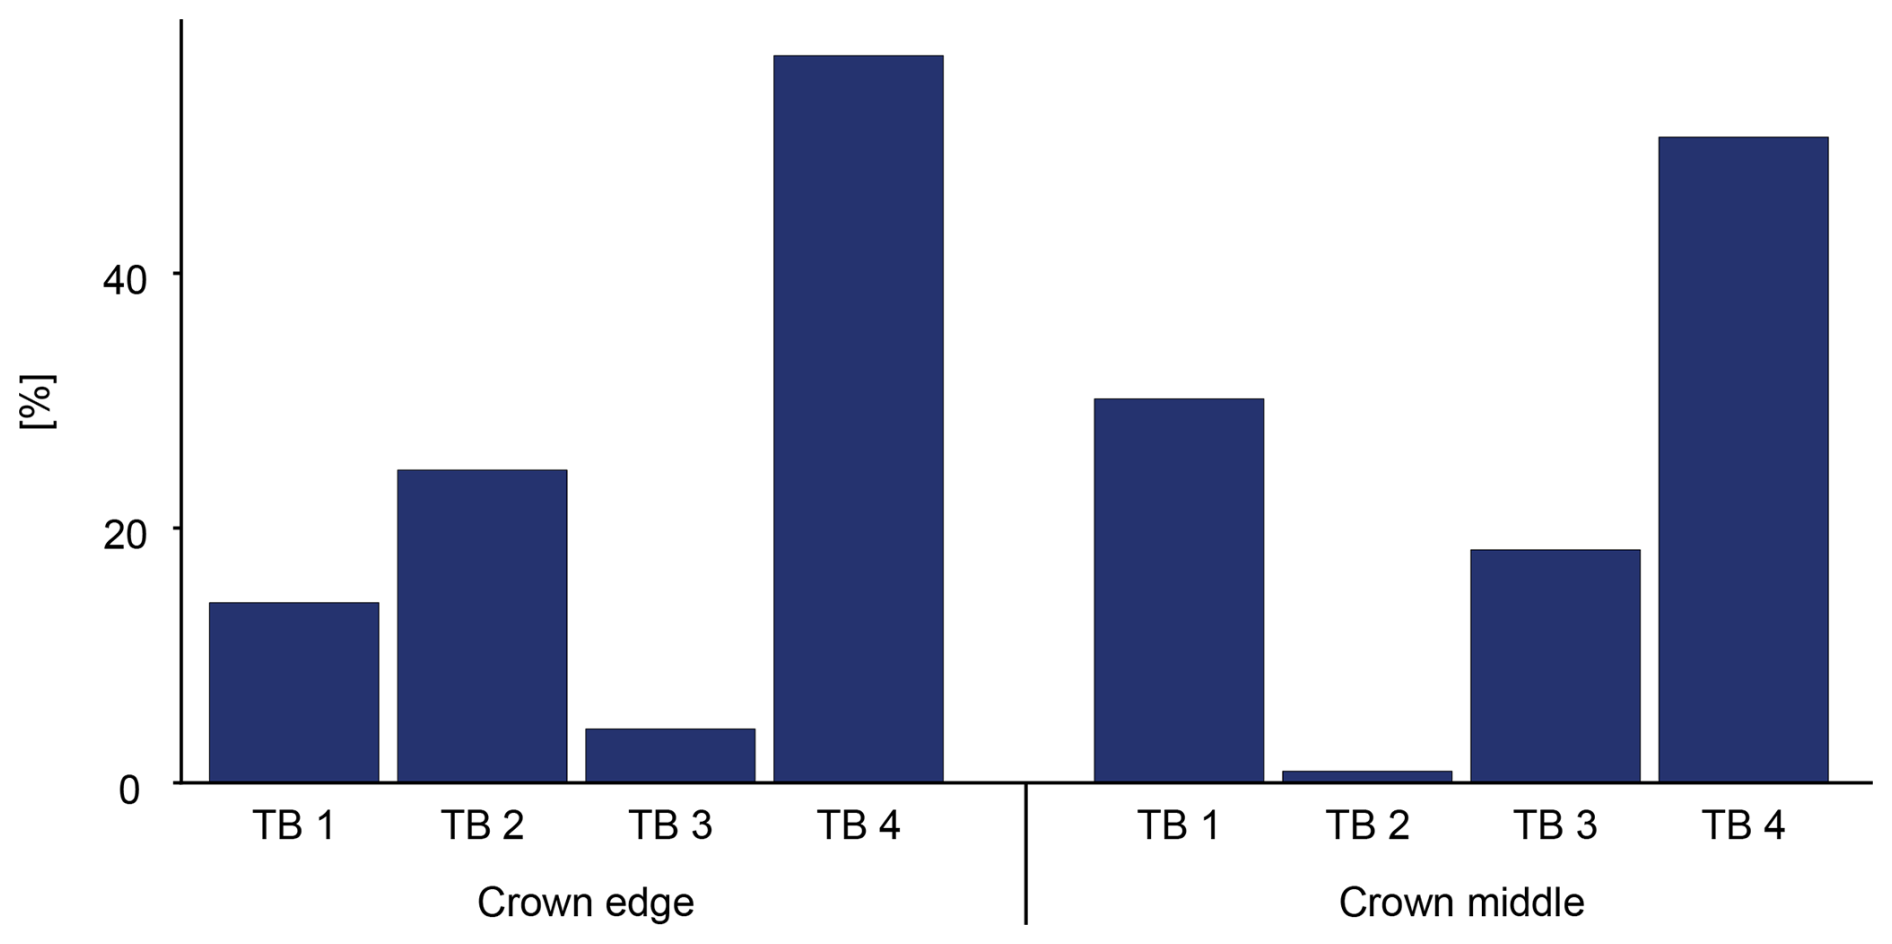
Figure 7Percentage share of percolation to the soil through the different grids of the two lysimeters. TB 1 to TB 4 indicate the four grids from left to right.
Figure 8 compares the soil moisture data collected by the SMT100, measured 50 cm upslope of the lysimeters at depths of 5 and 15 cm, to the water stored in the lysimeter container. An increase in stored water of 5 mm compares to an increase in soil moisture of approximately 10 %. Soil moisture and storage are higher at the crown edge compared to the crown middle. The storage dynamics measured in the lysimeters are more pronounced compared to the more dampened signal of the soil moisture readings.
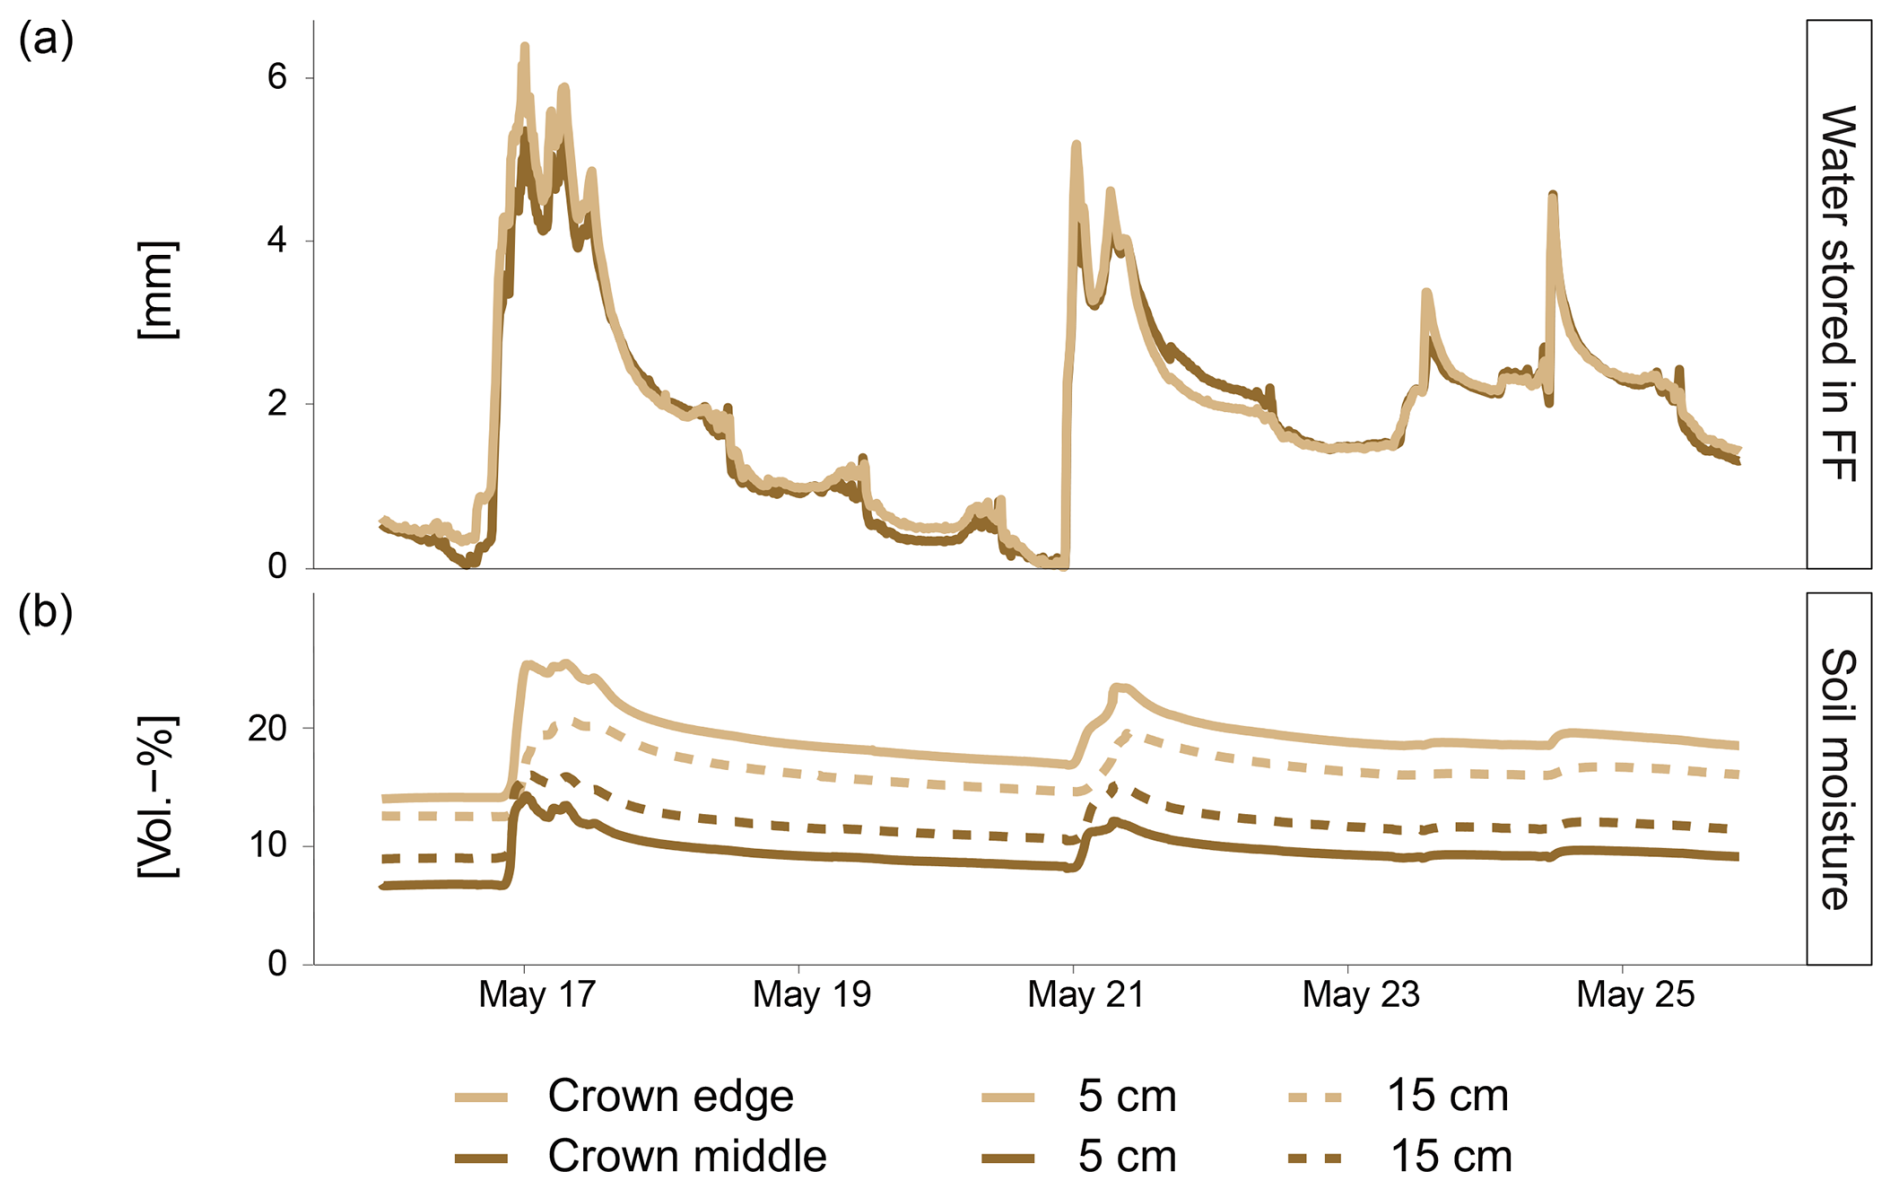
Figure 8(a) Relative amount of water in millimetres stored in the FF and observed during the 10 d period quantified by the lysimeters. (b) Soil moisture content (vol %) next to the lysimeters.
The lysimeter data prove to be a very valuable addition to existing approaches such as grab sampling or rainfall simulator experiments (Li et al., 2020; Putuhena and Cordery, 1996; Walsh and Voigt, 1977; Zhao et al., 2022). Evaporation, retention, and storage processes are assessed in actual field conditions, while environmental factors like climatic conditions, pre-wetness, canopy structure, litter composition, and soil structure stay incorporated. Still, data need quality and plausibility checks and validation by supplementary measurements or data from the site. For example, during long-term observations it is important to consider the weight loss of the decomposing FF material. Weight increases may result from the relocation of material caused by falling branches, leaves, and other debris being moved in and out of the box by wind. The typical factors of these lysimeters were described previously by Gerrits et al. (2007). They stated that many factors can influence the accuracy and errors of a forest floor lysimeter, like evaporation during a rainfall event, measurement noise, falling branches or leaves, small animals, dew, and heterogeneity of throughfall. Another disadvantage of lysimeters is that only one specific surface and one volume are taken into account, which might not cover the overall heterogeneity at different spatial scales (von Unold and Fank, 2008). We installed multiple lysimeters for direct comparison among the FFGLs at each site and for validation with above-canopy precipitation. So, we can make sure that a sudden storage change might not be caused by precipitation but rather by some form of disturbance.
Even smaller spatial heterogeneity, with a spatial scale of 0.0125 m2, will be displayed through the grids of the lysimeter. When incoming precipitation is evenly distributed over the lysimeter area, which becomes evident in similar weight changes in the single LCs, diverging portions of drainage in the TBs are a sign of redistribution by the FF. Our initial data indicate that, even on a small scale, there are significant differences in drainage, with one grid exhibiting over 50 % of the total drainage and another only 5 %.
Usually lysimeters are very costly and intensive to construct and install. Bello and Van Rensburg (2017) conducted a review of small lysimeter costs, which ranged from USD 1000 to USD 5500. Initial efforts are being made to create low-cost lysimeters. Bello and Van Rensburg (2017) built a lysimeter for USD 520, and Dong and Hansen (2023) built a lysimeter station including four separate lysimeters for USD 1310. Due to specific requirements for our lysimeter, including grids for spatial heterogeneity, shallow depth to cover only the upper field capacity, and adaptability for steep research sites, we opted to explore a DIY low-cost setup, as customized lysimeters are typically costly. The manufacturing price of our FFGL is currently USD 750, with the stainless-steel container accounting for USD 550 of this cost. Utilizing an alternative material for the container could significantly reduce costs.
The results presented show that water flux measurements with the FFGL are very precise. We achieve a total resolution of 0.03 mm for precipitation detection, with a standard deviation of 0.0048 mm and an error of 2 %, when we combine the measurements by the LCs and the TBs. Low precipitation (rime, fog, and dew) that does not produce drainage from the lysimeter and evaporation can be measured with a resolution of 0.008 mm. This is comparable to other lysimeter studies. Bello and Van Rensburg (2017) developed a small lysimeter with a resolution of 0.123 mm, Dong and Hansen (2023) achieved a resolution of 0.3 mm, and Ruth et al. (2018) used lysimeters with a resolution of approximately 0.016 mm and a mini-lysimeter with a resolution of 0.5 g, equivalent to a water column of approximately 0.007 mm. Seuntjens et al. (2001) conducted a comparison of the precision across various lysimeter studies, revealing that the precision for lysimeters with a cross-sectional area of less than 1 m2 varied between 0.025 and 0.5 mm. It needs to be taken into account that lysimeters with a smaller surface area show more dominant edge effects. The overall size of 0.25 m2 in our setup was selected in order to install the lysimeter in differently sloped terrain, so we decided on a compromise. Additionally, our goal was to develop a low-cost setup that was not too big in size and weight and that could still be handled by a maximum of two people for maintenance.
To enhance future measurements, we will include specific calibrations for each TB and not use one mean tipping volume for all TBs. Segovia-Cardozo et al. (2021) discuss issues related to tipping bucket results, including heterogeneity in bucket manufacturing, the initial wetness or dryness of the bucket, and the tension between the reed switch and magnet. Since we found a temperature effect in our field weight measurements, we performed some temperature and stability tests of our LCs (Fig. S1). The change in weight did not occur then, showing that the effect in our data was caused by shifting of the lysimeter container due to thermal expansion and sub-optimal force application to the LC because of wrong positioning of the box. For future measurements, we adapted the setup. Additionally, it is necessary to test the long-term stability of load cells. We do this by repeatedly placing a known weight on the lysimeters during maintenance to test the long-term stability in the field. These adjustments will help to improve measurements and also make it possible to precisely measure evaporation and detect non-rainfall precipitation such as dew and rime.
This technical note describes the development of a low-cost weighing forest floor grid lysimeter (FFGL). We present accuracy tests for the different water flux quantifications, infiltration measured with the 3D-printed tipping buckets, and storage weight measurements, resulting in a total resolution of 0.03 mm for precipitation detection with a standard deviation of 0.0048 mm and an error of 2 %. The separately draining grids without walls between the compartments dividing the FF allow for quantification of redistribution induced by the FF.
The FFGL underwent successful field testing and will now be installed at various sites and in different positions relative to trees. The objective is to gather data on the effects of climatic conditions, tree species, crown position, and FF composition on the water balance of the FF. Additionally, we aim to investigate the variability of infiltration patterns resulting from throughfall patterns and FF composition. The tested setup facilitates the future integration of water quality measurements into the existing measurement units. The development of automated in situ measurements for water temperature, electrical conductivity (EC), and dissolved organic carbon (DOC) in the grid lysimeter is currently underway.
The program code and .stl files for printing and board design can be found at https://github.com/HeinkePaulsen/Forest-Floor-Grid-Lysimeter (last access: 5 March 2025; DOI: https://doi.org/10.5281/zenodo.15462111, Paulsen, 2025).
The data are available from Forstliche Versuchs- und Forschungsanstalt, Abt. Boden und Umwelt (Forest Research Institute Baden-Württemberg, Dept. Soil and Environment).
The supplement related to this article is available online at https://doi.org/10.5194/hess-29-2309-2025-supplement.
MW and HP designed the setup. HP developed the lysimeter setup. HP prepared the manuscript with contributions from all the co-authors.
At least one of the (co-)authors is a member of the editorial board of Hydrology and Earth System Sciences. The peer-review process was guided by an independent editor, and the authors also have no other competing interests to declare.
Publisher’s note: Copernicus Publications remains neutral with regard to jurisdictional claims made in the text, published maps, institutional affiliations, or any other geographical representation in this paper. While Copernicus Publications makes every effort to include appropriate place names, the final responsibility lies with the authors.
This project was carried out in the framework of Research Unit 5315 “Forest Floor: Functioning, Dynamics, and Vulnerability in a Changing World” funded by the Deutsche Forschungsgemeinschaft (DFG).
This research was supported by the Deutsche Forschungsgemeinschaft (grant no. 457330647).
This open-access publication was funded by the University of Freiburg.
This paper was edited by Miriam Coenders-Gerrits and reviewed by two anonymous referees.
Andreasen, M., Christiansen, J. R., Sonnenborg, T. O., Stisen, S., and Looms, M. C.: Seasonal dynamics of canopy interception loss within a deciduous and a coniferous forest, Hydrol. Process., 37, e14828, https://doi.org/10.1002/hyp.14828, 2023.
Bello, Z. A. and Van Rensburg, L. D.: Development, calibration and testing of a low-cost small lysimeter for monitoring evaporation and transpiration: Development, calibration and testing of a low cost small lysimeter, Irrig. Drain., 66, 263–272, https://doi.org/10.1002/ird.2095, 2017.
Dong, Y. and Hansen, H.: Development and design of an affordable field scale weighing lysimeter using a microcontroller system, Smart Agric. Technol., 4, 100147, https://doi.org/10.1016/j.atech.2022.100147, 2023.
Floriancic, M. G., Allen, S. T., Meier, R., Truniger, L., Kirchner, J. W., and Molnar, P.: Potential for significant precipitation cycling by forest-floor litter and deadwood, Ecohydrology, 16, e2493, https://doi.org/10.1002/eco.2493, 2023.
Gerrits, A. M. J., Savenije, H. H. G., Hoffmann, L., and Pfister, L.: New technique to measure forest floor interception – an application in a beech forest in Luxembourg, Hydrol. Earth Syst. Sci., 11, 695–701, https://doi.org/10.5194/hess-11-695-2007, 2007.
Gerrits, A. M. J., Pfister, L., and Savenije, H. H. G.: Spatial and temporal variability of canopy and forest floor interception in a beech forest, Hydrol. Process., 24, 3011–3025, https://doi.org/10.1002/hyp.7712, 2010.
Guevara-Escobar, A., Gonzalez-Sosa, E., Ramos-Salinas, M., and Hernandez-Delgado, G. D.: Experimental analysis of drainage and water storage of litter layers, Hydrol. Earth Syst. Sci., 11, 1703–1716, https://doi.org/10.5194/hess-11-1703-2007, 2007.
Li, Q., Lee, Y. E., and Im, S.: Characterizing the Interception Capacity of Floor Litter with Rainfall Simulation Experiments, Water, 12, 3145, https://doi.org/10.3390/w12113145, 2020.
Paulsen, H.: HeinkePaulsen/Forest-Floor-Grid-Lysimeter: Forest-Floor-Grid-Lysimeter v.1.0 (Lysimeter), Zenodo [code], https://doi.org/10.5281/zenodo.15462111, 2025.
Putuhena, W. M. and Cordery, I.: Estimation of interception capacity of the forest floor, J. Hydrol., 180, 283–299, https://doi.org/10.1016/0022-1694(95)02883-8, 1996.
Reth, S., Perez-Priego, O., Coners, H., and Nolz, R.: Lysimeter, in: Springer Handbook of Atmospheric Measurements, edited by: Foken, T., Springer International Publishing, Cham, 1569–1584, https://doi.org/10.1007/978-3-030-52171-4_58, 2021.
Rinderer, M., Krüger, J., Lang, F., Puhlmann, H., and Weiler, M.: Subsurface flow and phosphorus dynamics in beech forest hillslopes during sprinkling experiments: how fast is phosphorus replenished?, Biogeosciences, 18, 1009–1027, https://doi.org/10.5194/bg-18-1009-2021, 2021.
Ruth, C. E., Michel, D., Hirschi, M., and Seneviratne, S. I.: Comparative Study of a Long-Established Large Weighing Lysimeter and a State-of-the-Art Mini-lysimeter, Vadose Zone J., 17, 1–10, https://doi.org/10.2136/vzj2017.01.0026, 2018.
Schnepper, T., Groh, J., Gerke, H. H., Reichert, B., and Pütz, T.: Evaluation of precipitation measurement methods using data from a precision lysimeter network, Hydrol. Earth Syst. Sci., 27, 3265–3292, https://doi.org/10.5194/hess-27-3265-2023, 2023.
Segovia-Cardozo, D. A., Rodríguez-Sinobas, L., Díez-Herrero, A., Zubelzu, S., and Canales-Ide, F.: Understanding the Mechanical Biases of Tipping-Bucket Rain Gauges: A Semi-Analytical Calibration Approach, Water, 13, 2285, https://doi.org/10.3390/w13162285, 2021.
Seuntjens, P., Mallants, D., Toride, N., Cornelis, C., and Geuzens, P.: Grid lysimeter study of steady state chloride transport in two Spodosol types using TDR and wick samplers, J. Contam. Hydrol., 51, 13–39, https://doi.org/10.1016/S0169-7722(01)00120-6, 2001.
von Unold, G. and Fank, J.: Modular Design of Field Lysimeters for Specific Application Needs, Water Air Soil Pollut. Focus, 8, 233–242, https://doi.org/10.1007/s11267-007-9172-4, 2008.
Walsh, R. P. D. and Voigt, P. J.: Vegetation Litter: An Underestimated Variable in Hydrology and Geomorphology, J. Biogeogr., 4, 253, https://doi.org/10.2307/3038060, 1977.
Zagyvai-Kiss, K. A., Kalicz, P., Szilágyi, J., and Gribovszki, Z.: On the Specific Water Holding Capacity of Litter for Three Forest Ecosystems in the Eastern Foothills of the Alps, Agr. Forest Meteorol., 278, 107656, https://doi.org/10.1016/j.agrformet.2019.107656, 2019.
Zhao, L., Meng, P., Zhang, J., Zhang, J., Sun, S., and He, C.: Effect of slopes on rainfall interception by leaf litter under simulated rainfall conditions, Hydrol. Process., 36, e14659, https://doi.org/10.1002/hyp.14659, 2022.