the Creative Commons Attribution 4.0 License.
the Creative Commons Attribution 4.0 License.
 | 15 Apr 2025
Assessing the value of high-resolution rainfall and streamflow data for hydrological modeling: an analysis based on 63 catchments in southeast China
Mahmut Tudaji
Fuqiang Tian
The temporal resolution of forcing and calibration data substantially influences the performance of hydrological models. This impact varies among regions according to the climatic and landscape characteristics of the watersheds. In this study, we evaluate the benefits of using high-resolution rainfall and streamflow data in hydrological modeling across 63 small-to-medium-scale catchments in southeast China. We applied rainfall and streamflow data at various resolutions ranging from 1 to 24 h to drive and calibrate a well-established hydrological model. Our findings reveal that (1) utilizing sub-daily rainfall data significantly enhances the accuracy of daily streamflow forecasts, with notable improvements observed when models transition from daily to sub-daily resolutions; (2) forcing and calibrating the model by rainfall and streamflow data with sub-daily resolution data markedly improve hourly streamflow forecasts compared to daily data, but the enhancements become negligible when the resolution exceeds 6 h; and (3) the advantages of sub-daily resolution data are more pronounced in catchments characterized by a smaller drainage area, significant diurnal streamflow variability, and greater number of rain gauges. These findings provide basis for a more efficient rainfall and streamflow data acquisition.
- Article
(5774 KB) - Full-text XML
- Companion paper
- BibTeX
- EndNote


Hydrological models are vital for understanding and predicting the dynamics of water resources as well as occurrences of floods and droughts. The effectiveness of these models heavily depends on the quality and resolution of the data, especially the rainfall used for forcing and measured streamflow for calibration. Traditionally, hydrological modeling has utilized daily or even coarser-resolution data, which limits its application for shorter time steps required in scenarios such as flash flood forecasting. To address this limitation, data are often artificially disaggregated from raw time series using mass curves (Blöschl and Sivapalan, 1995) or complex stochastic generators (Creutin and Obled, 1980). However, models based on coarsely resolved or artificially refined data can introduce biases, particularly when forecasting at finer temporal scales, as they may not accurately capture the variability and magnitude of hydrological variables (Younis et al., 2008; Huang et al., 2019).
Rainfall is crucial in driving high-frequency responses in catchments in contrast to the more gradual changes caused by evapotranspiration (Oudin et al., 2006). The temporal distribution of rainfall profoundly affects runoff patterns, influencing both peak discharge rates (Gabellani et al., 2007) and total runoff volume (Viglione et al., 2010). These effects are primarily due to the nonlinear dynamics of infiltration and runoff generation processes, which typically occur over a timescale of minutes (Blöschl and Sivapalan, 1995; Kandel et al., 2005). Previous studies indicated that models incorporating sub-daily time steps more effectively capture the complexities of infiltration-excess and surface runoff, highlighting the importance of peak rainfall rates in accurate rainfall–runoff modeling (Kandel et al., 2004, 2005; Socolofsky et al., 2001; Yu et al., 1998). Additionally, streamflow measurement, a vital component for model calibration, ensures that the quality of calibration data significantly impacts model parameters. Parameters governing slower dynamics exhibit considerable stability across various timescales, whereas those associated with faster dynamics achieve greater accuracy and stability as data resolution improves (Kavetski et al., 2011).
Recent advancements in measurement technologies, including high-frequency automated rain/streamflow gauges and phased array rain radars, have enabled access to high-resolution rainfall and runoff datasets. Despite these technological advances, the quantitative benefits of high-resolution data in enhancing hydrological model performance remain unclear. For instance, studies on the impact of rainfall data resolution on hydrological models have produced inconsistent results. Research such as that of Jeong et al. (2011) suggested that finer temporal resolution significantly improves model simulations, whereas other studies (Kannan et al., 2007; Ficchì et al., 2016) found that greater data resolution does not necessarily lead to better model performance. These variances could be due to factors like process descriptions in the models, watershed characteristics, and scale of data aggregation, yet there is a lack of comprehensive research investigating these elements.
This study seeks to enhance our understanding of the value of fine-time-step hydro-climatic data for hydrological model performance. We designed two experiments focusing on the most common hydrological forecasting timescales – daily and hourly. The impact of high-resolution rainfall and streamflow data is assessed across 63 small-to-medium-scale catchments in southeastern China using data resolutions ranging from 1 to 24 h to drive and calibrate the hydrological models. In addition, we explored factors that influence model performance and evaluate the benefits of high-resolution data from the perspective of watershed characteristics. Specifically, we aim to answer three key questions:
-
To what extent can sub-daily rainfall data improve daily streamflow simulations?
-
What is the coarsest resolution of rainfall and streamflow data possible to provide reliable hourly streamflow simulations?
-
What factors influence model performance and the value of high-resolution data?
The structure of the remainder of this paper is as follows: Sect. 2 details the methodology and experimental design, including the selection of the 63 catchments, the hydrological model employed, and the techniques used to quantify the benefits of high-resolution data and to identify influential factors. Section 3 presents the results, offering a comparison of model performance at different temporal resolutions across the selected catchments. We investigate performance variations and discuss possible explanations for these differences. Section 4 examines the implications of measuring rainfall and streamflow and addresses the limitations of this study. Finally, Sect. 5 provides the concluding remarks.
2.1 Catchment set and data
In this study, we utilized a set of 63 small–medium-scale catchments located in southeastern China (Fig. 1). The catchment outlets are geographically dispersed, ranging from 102 to 119° E longitude and 21 to 33° N latitude. Predominantly, most of these catchments (57 out of 63) fall within the Yangtze River Basin, while four are situated in the Pearl River Basin and two in the Southeast Basin. Table 1 presents the statistical summaries of the catchment attributes. The drainage areas of these catchments vary considerably, ranging from 91.5 to 5266 km2, with an average area of 1528 km2. These catchments exhibit significant diversity in climatic conditions and rainfall–runoff relationships, highlighted by a wide range of mean annual rainfall (647 to 2593 mm) and runoff ratios (0.31 to 0.96).
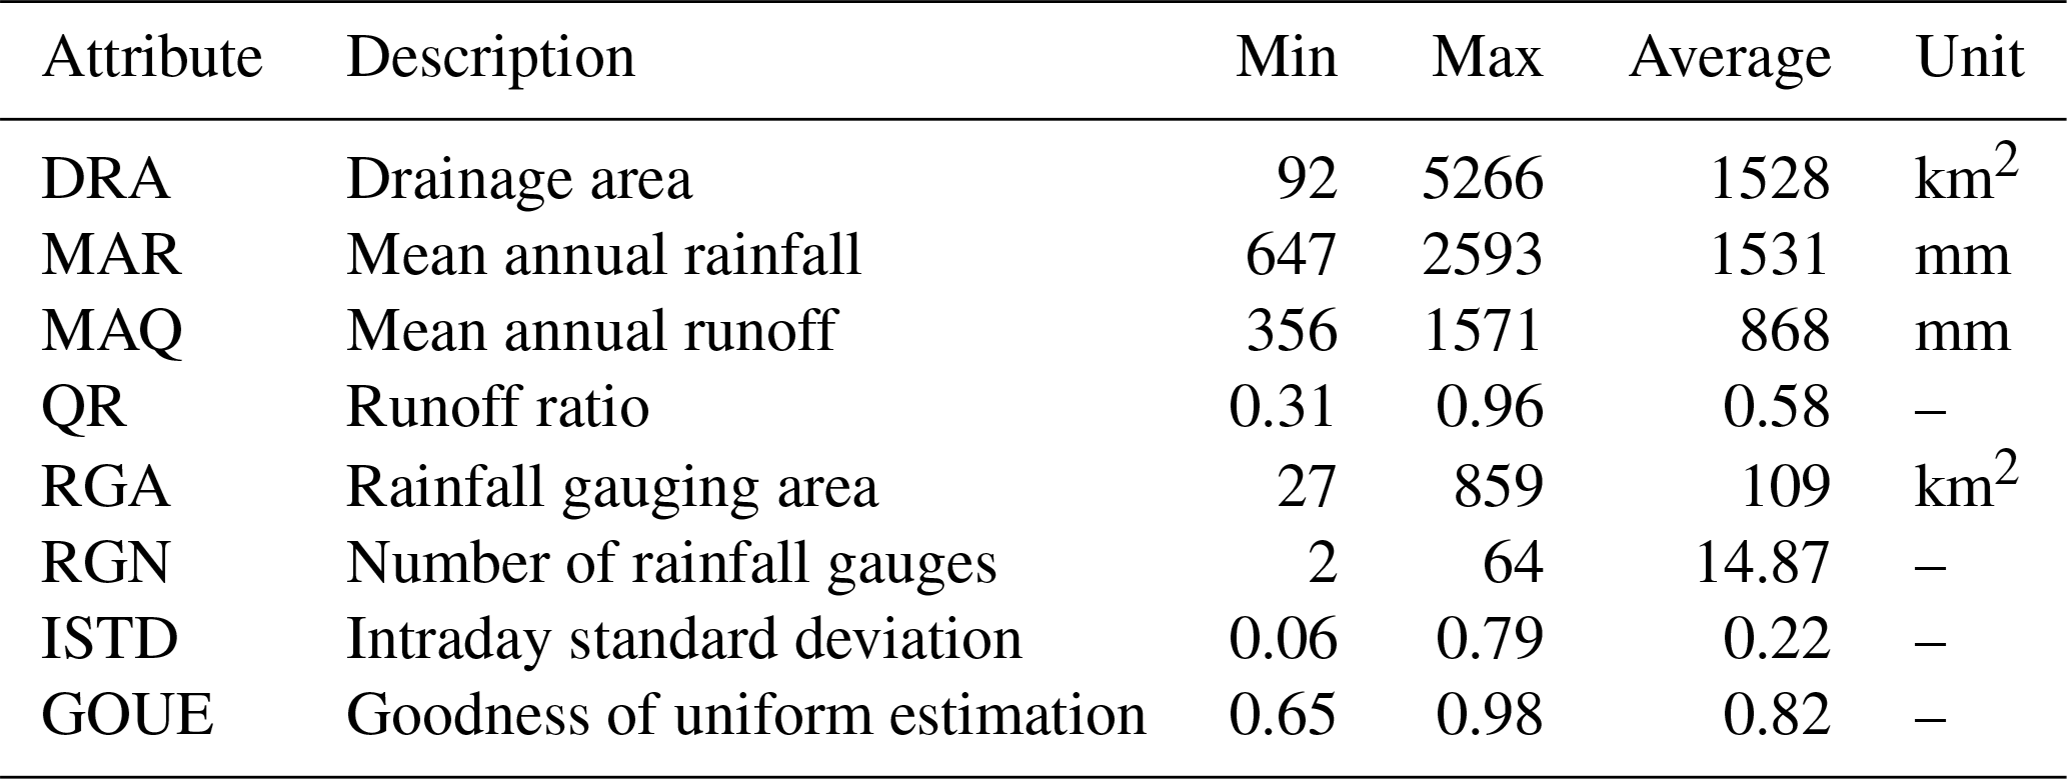
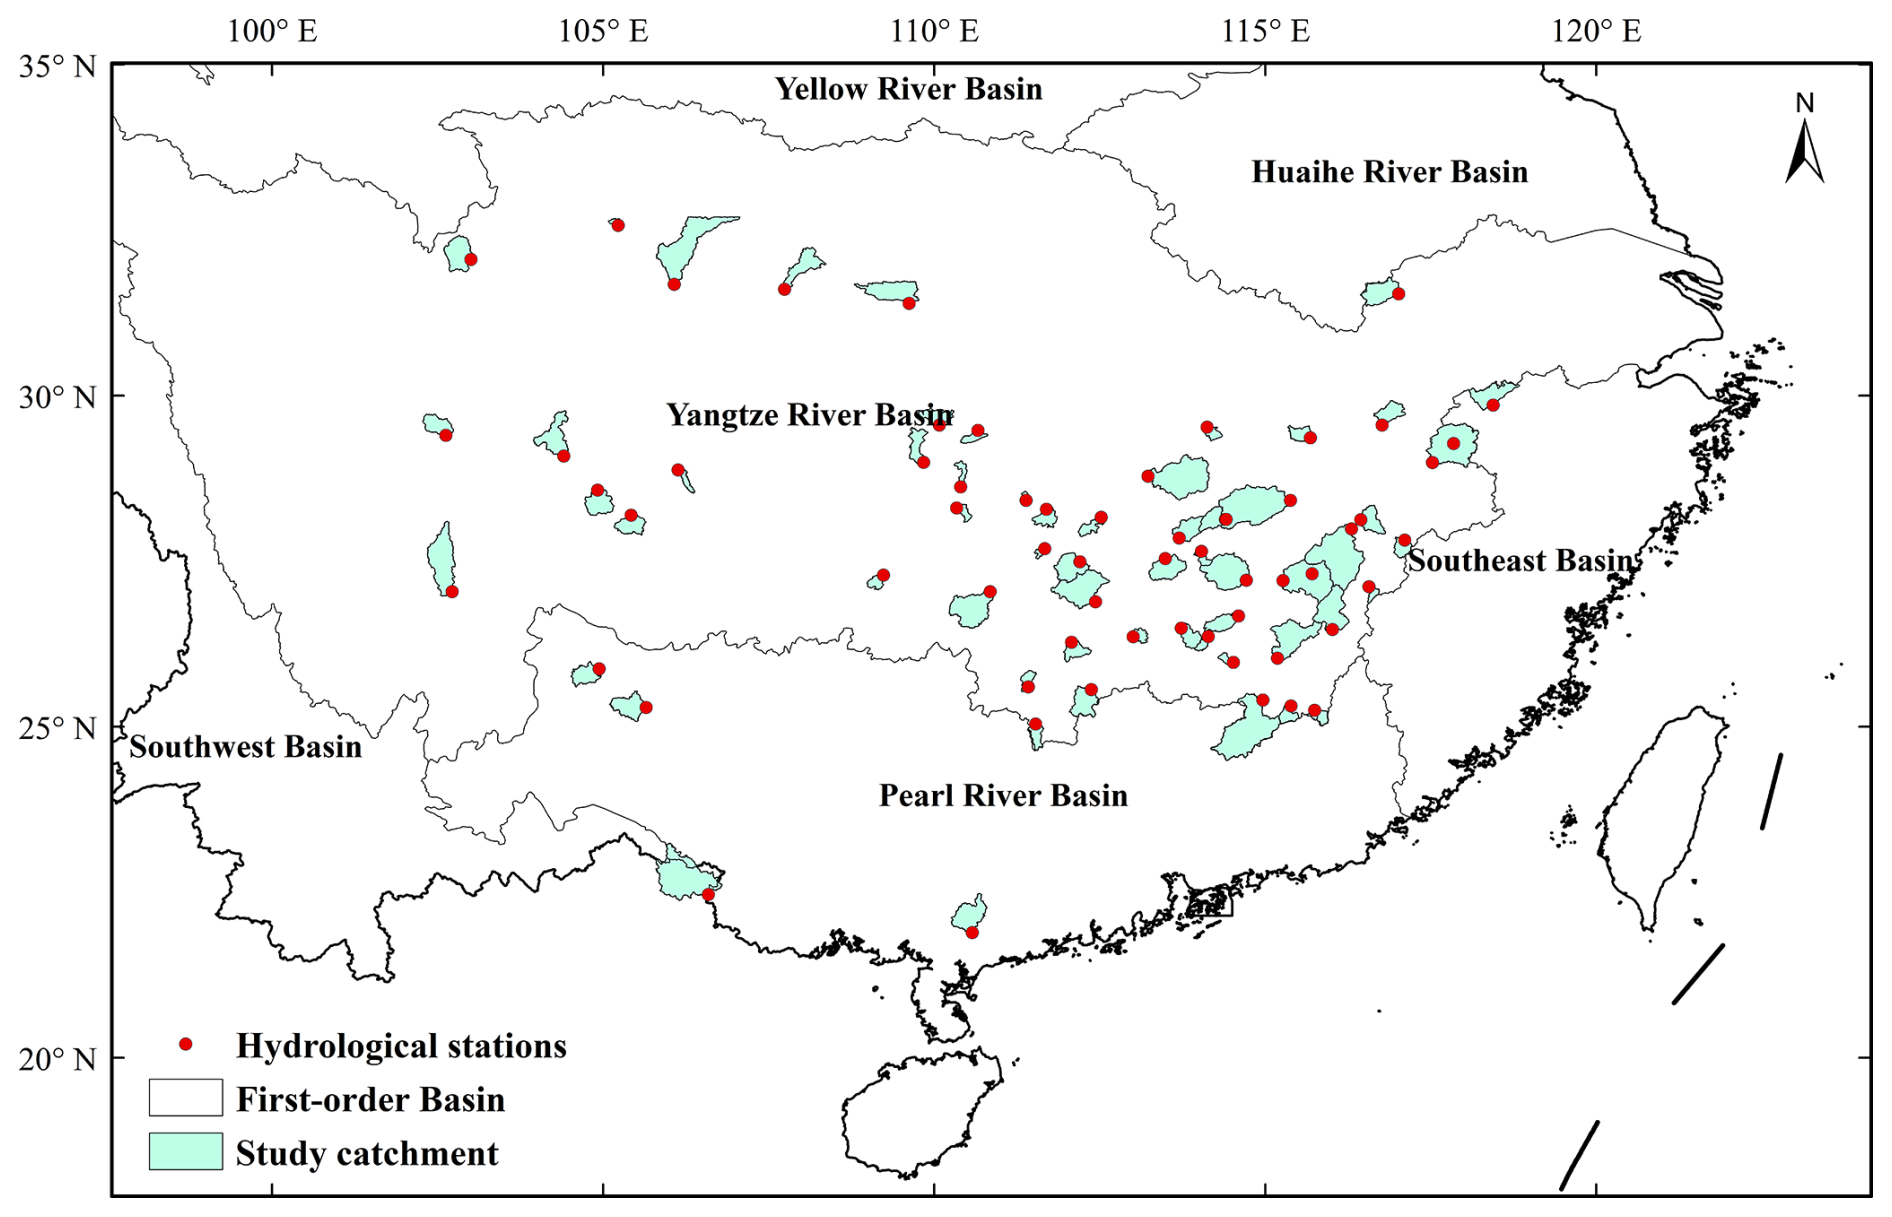
Figure 1Geographic distribution of catchments spanning across southeastern China. Publisher's remark: please note that the above figure contains disputed territories.
Hydrometeorological data spanning from 1 January 2014 to 31 December 2015 were sourced from the National Rainfall and Hydrological Database, curated by the Information Center of the Ministry of Water Resources (http://xxfb.mwr.cn/sq_dtcx.html, last access: 10 December 2023). The selection criteria for hydrological stations were established based on several key factors:
-
Catchment size. The focus is on the sub-daily variation of streamflow, which is crucial in small-scale and mesoscale catchments, and only those with a drainage area of less than 6000 km2 were selected.
-
Temporal resolution. The original data varied in resolution from 5 min to more than 1 d. Given the scarcity of stations with complete and continuous time series data, we chose stations with an average resolution – defined by the ratio of the length of the time period to the number of measurements – that exceeded 3650 s. This resolution threshold, slightly over 1 h, was designed to minimize gaps in hourly time series data.
-
Water level and discharge relationship. The database includes both water level and discharge data. Notably, water level data tend to be more complete and more continuous.
We utilized the relationship between water level and discharge to infer discharge values for periods only covered by water level data. Stations were chosen based on their provision of discharge data for more than 80 % of the time steps that also had water level data and a determination coefficient (R2) of the water level–discharge relationship exceeding 0.95, ensuring the accuracy of these calculations.
The criteria for selecting rainfall data were similar to those for streamflow data. We identified 63 high-quality stations situated within the study catchments from the original database, characterized by an average temporal resolution of slightly over 1 h. To generate the areal rainfall data for each catchment, we employed the Thiessen polygon method (Han and Bray, 2006). The number of rainfall gauges per catchment varied from 2 to 64, averaging 15 stations. Additionally, the rainfall gauging area – calculated as the catchment area divided by the number of stations – ranged from 27 to 859 km2, with an average of 109 km2.
Besides, the DEM in this study was from the MERIT digital elevation model (Yamazaki et al., 2017) with a spatial resolution of 90 m. Temperature and potential evapotranspiration data were sourced from ERA5-Land (Muñoz Sabater, 2019). The 8 d leaf area index (LAI) and the 16 d normalized difference vegetation index (NDVI) data, both with a spatial resolution of 500 m, were downloaded from the MODIS product, MOD15A2H (Myneni et al., 2021) and MOD13A1 (Didan, 2021), respectively.
2.2 Hydrological model: THREW
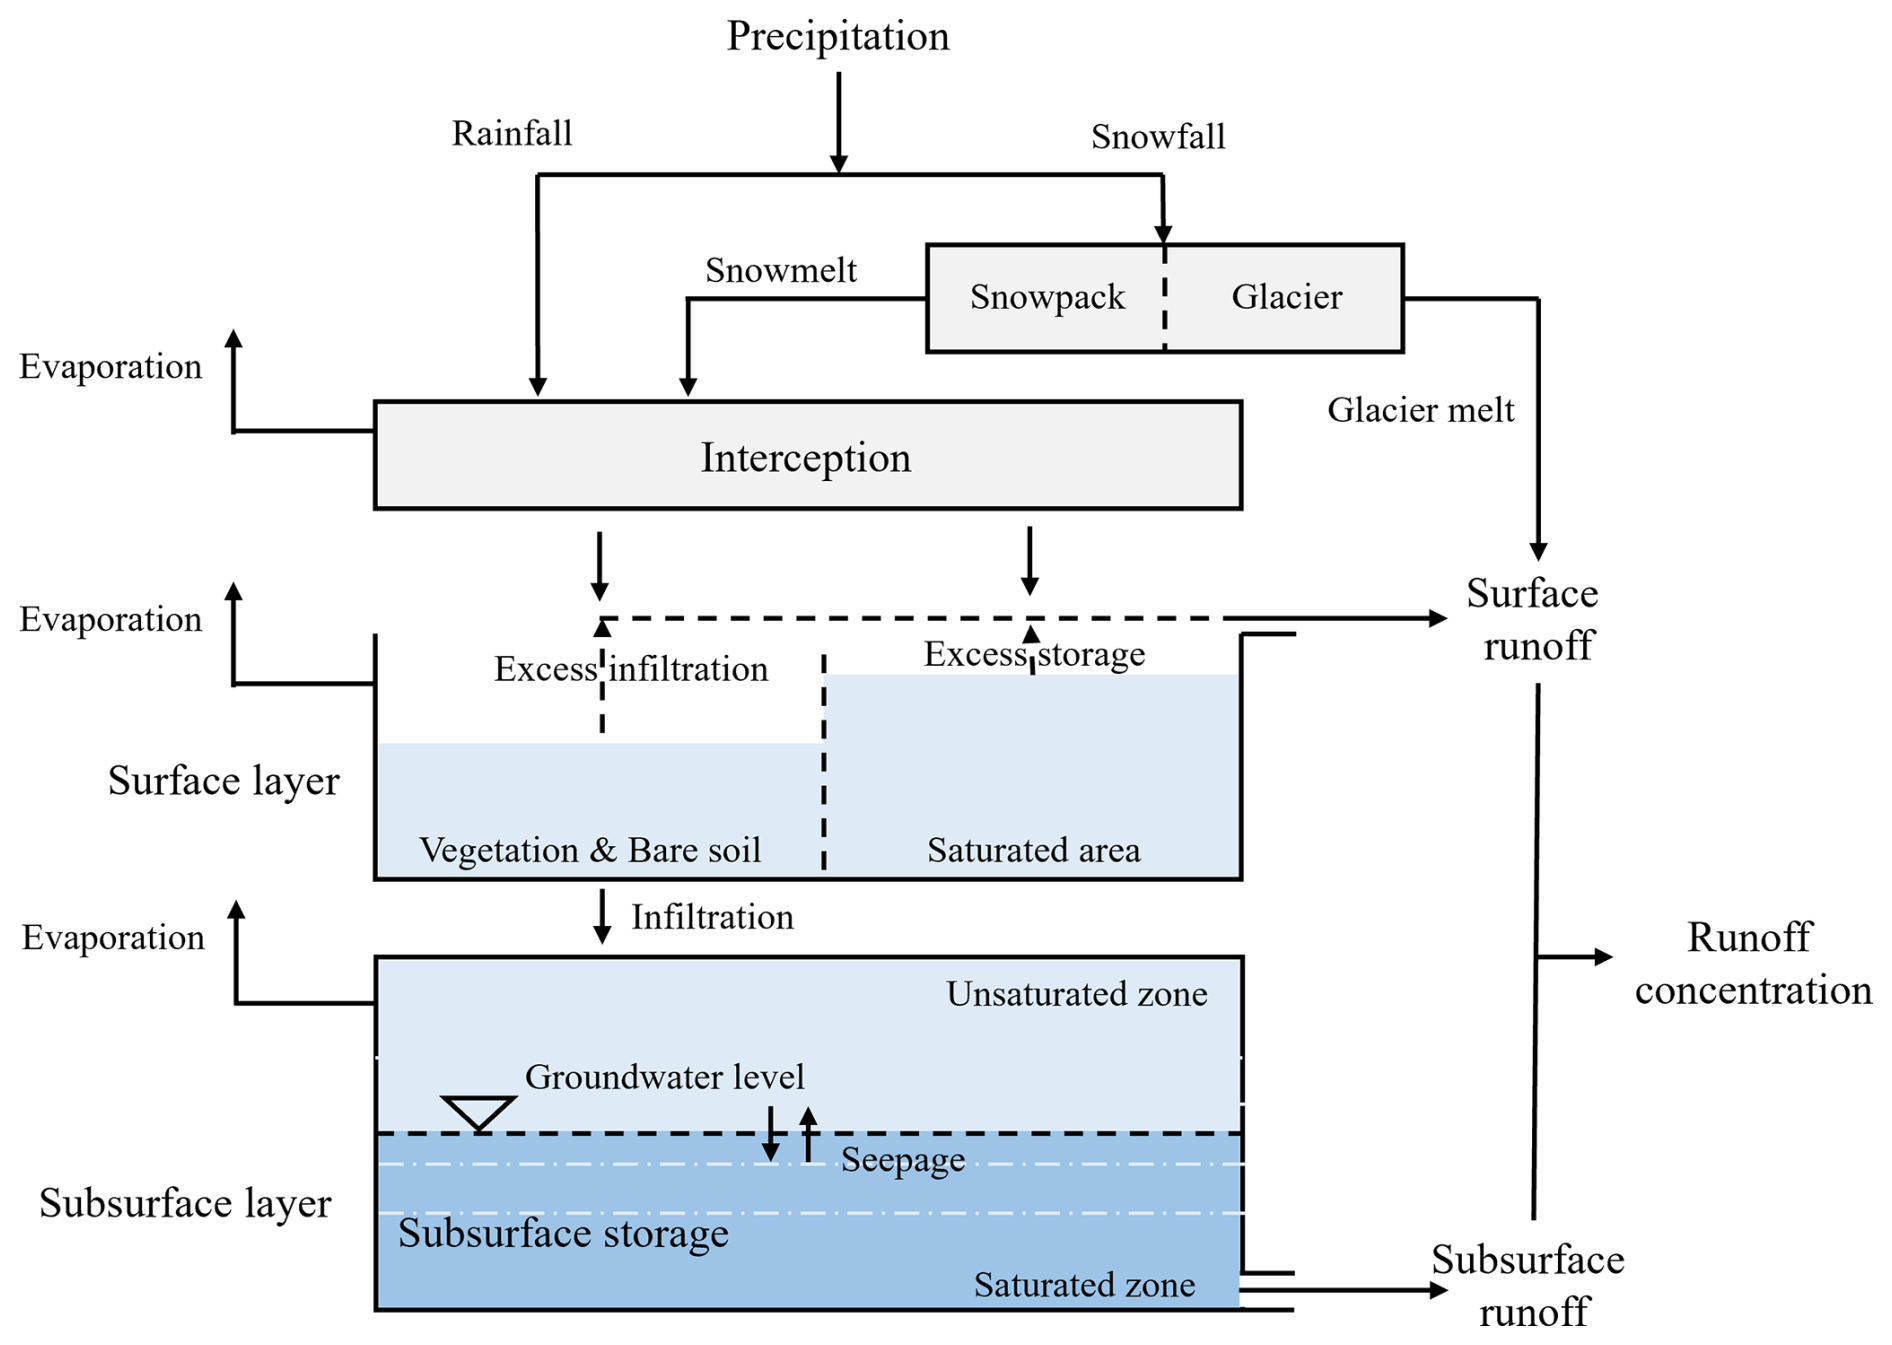
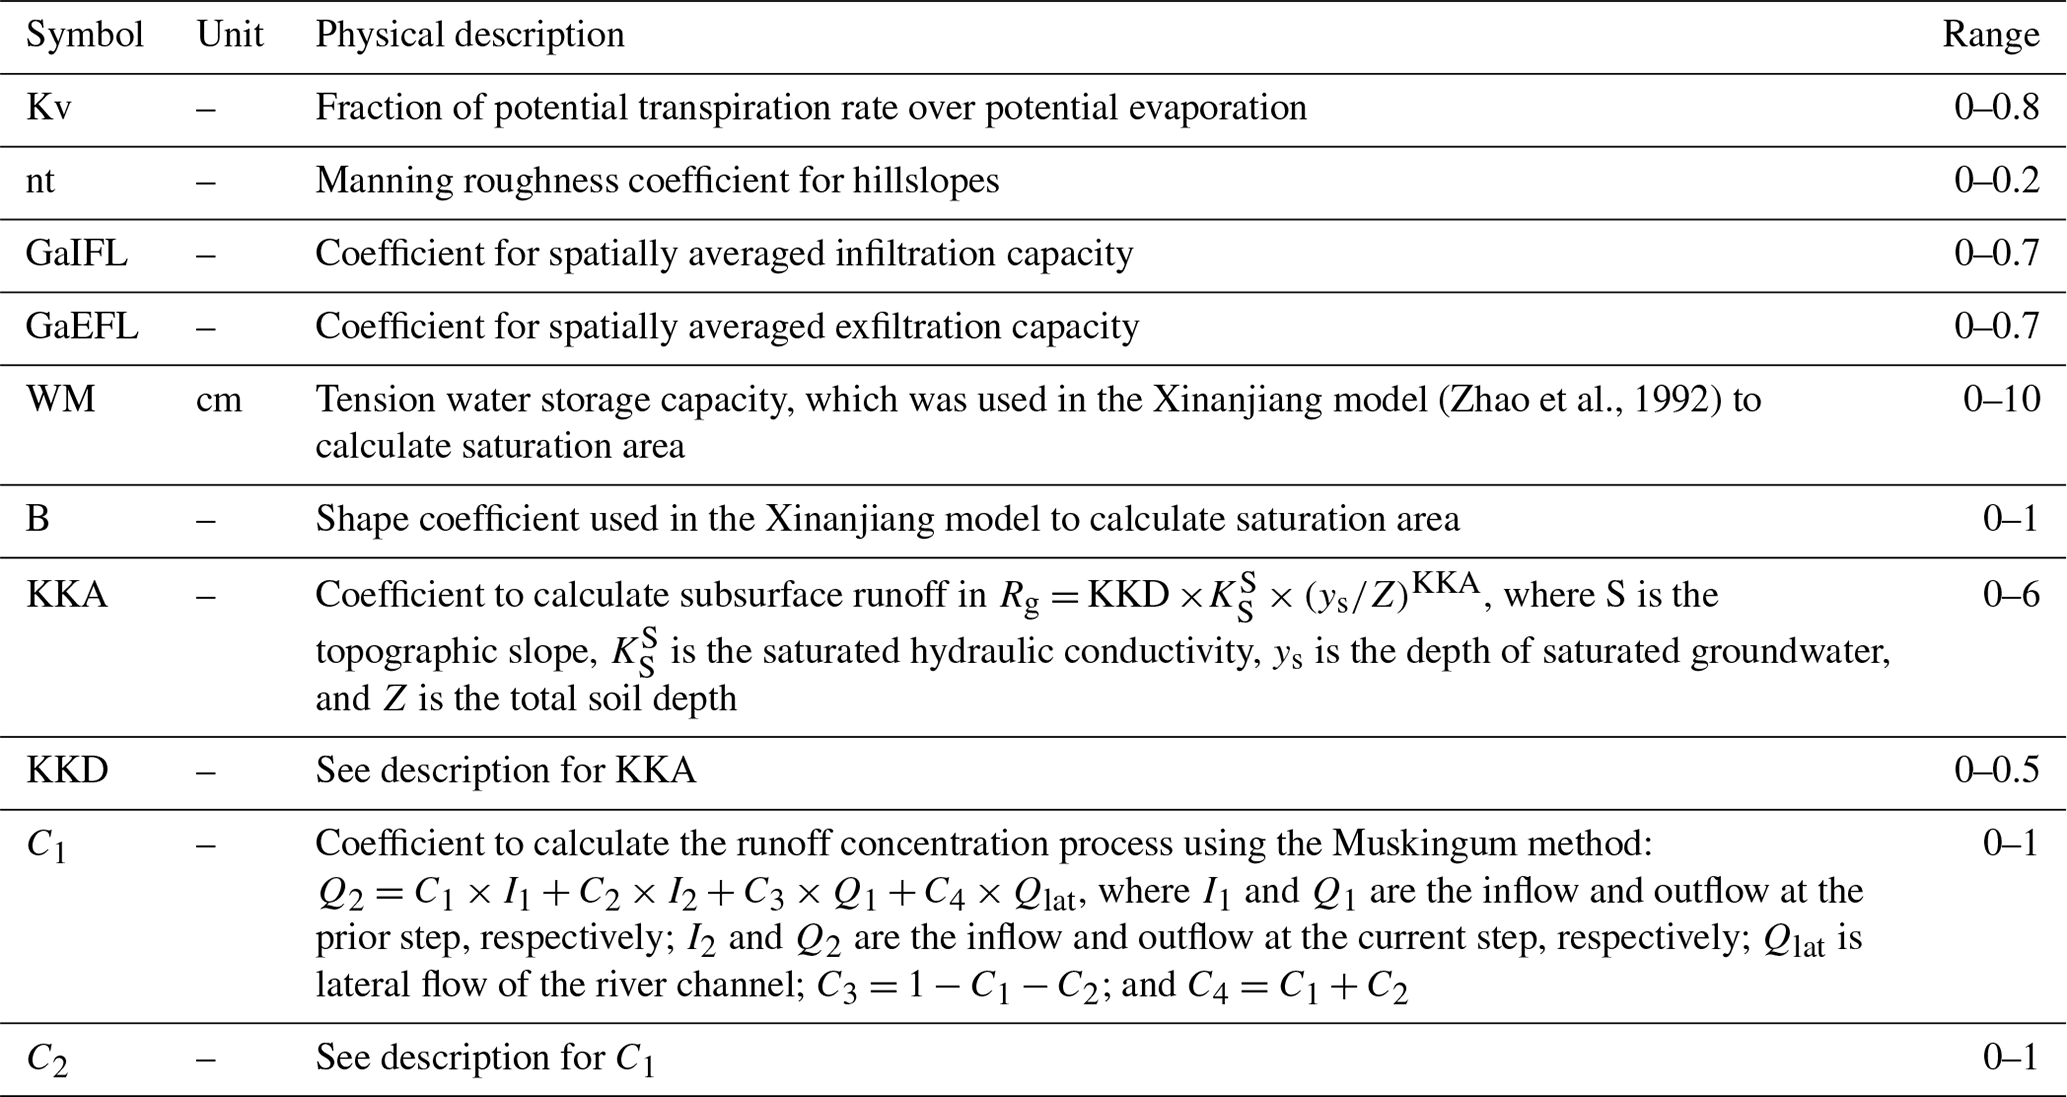
The hydrological model employed in this study is the Tsinghua Hydrological Model based on Representative Elementary Watershed (THREW) developed by Tian et al. (2006). THREW integrates a set of equilibrium equations for mass, momentum, energy, and entropy, along with constitutive relationships governing various fluxes between representative units and sub-regions within units. In the THREW model, the REW is separated into two layers, i.e., surface layer and the subsurface layer. Six sub-regions (or zones), i.e., the bare soil zone (b zone), vegetated zone (v zone), snow-covered zone (n zone), glacier-covered zone (g-zone), sub-stream network (t zone), and main channel reach (r zone), are defined within the surface layer, and two sub-regions, i.e., the unsaturated zone (u zone) and the saturated zone (s zone), are defined within the subsurface layer (Fig. 2). And so the principal landscape types can be explicitly treated in the REW approach (Tian et al., 2008). The primary parameters utilized and to be calibrated in the THREW model are presented in Table 2. This model has demonstrated versatility across watersheds with diverse climates and geological conditions, such as the Han River basin (Sun et al., 2014; Li et al., 2018), where many basins in this study are located, and other basins such as the Yarlung Tsangpo–Brahmaputra River basin (Xu et al., 2019; Nan et al., 2021; Cui et al., 2023) and the Ürümqi River basin (Mou et al., 2009).
2.3 Model experimental design
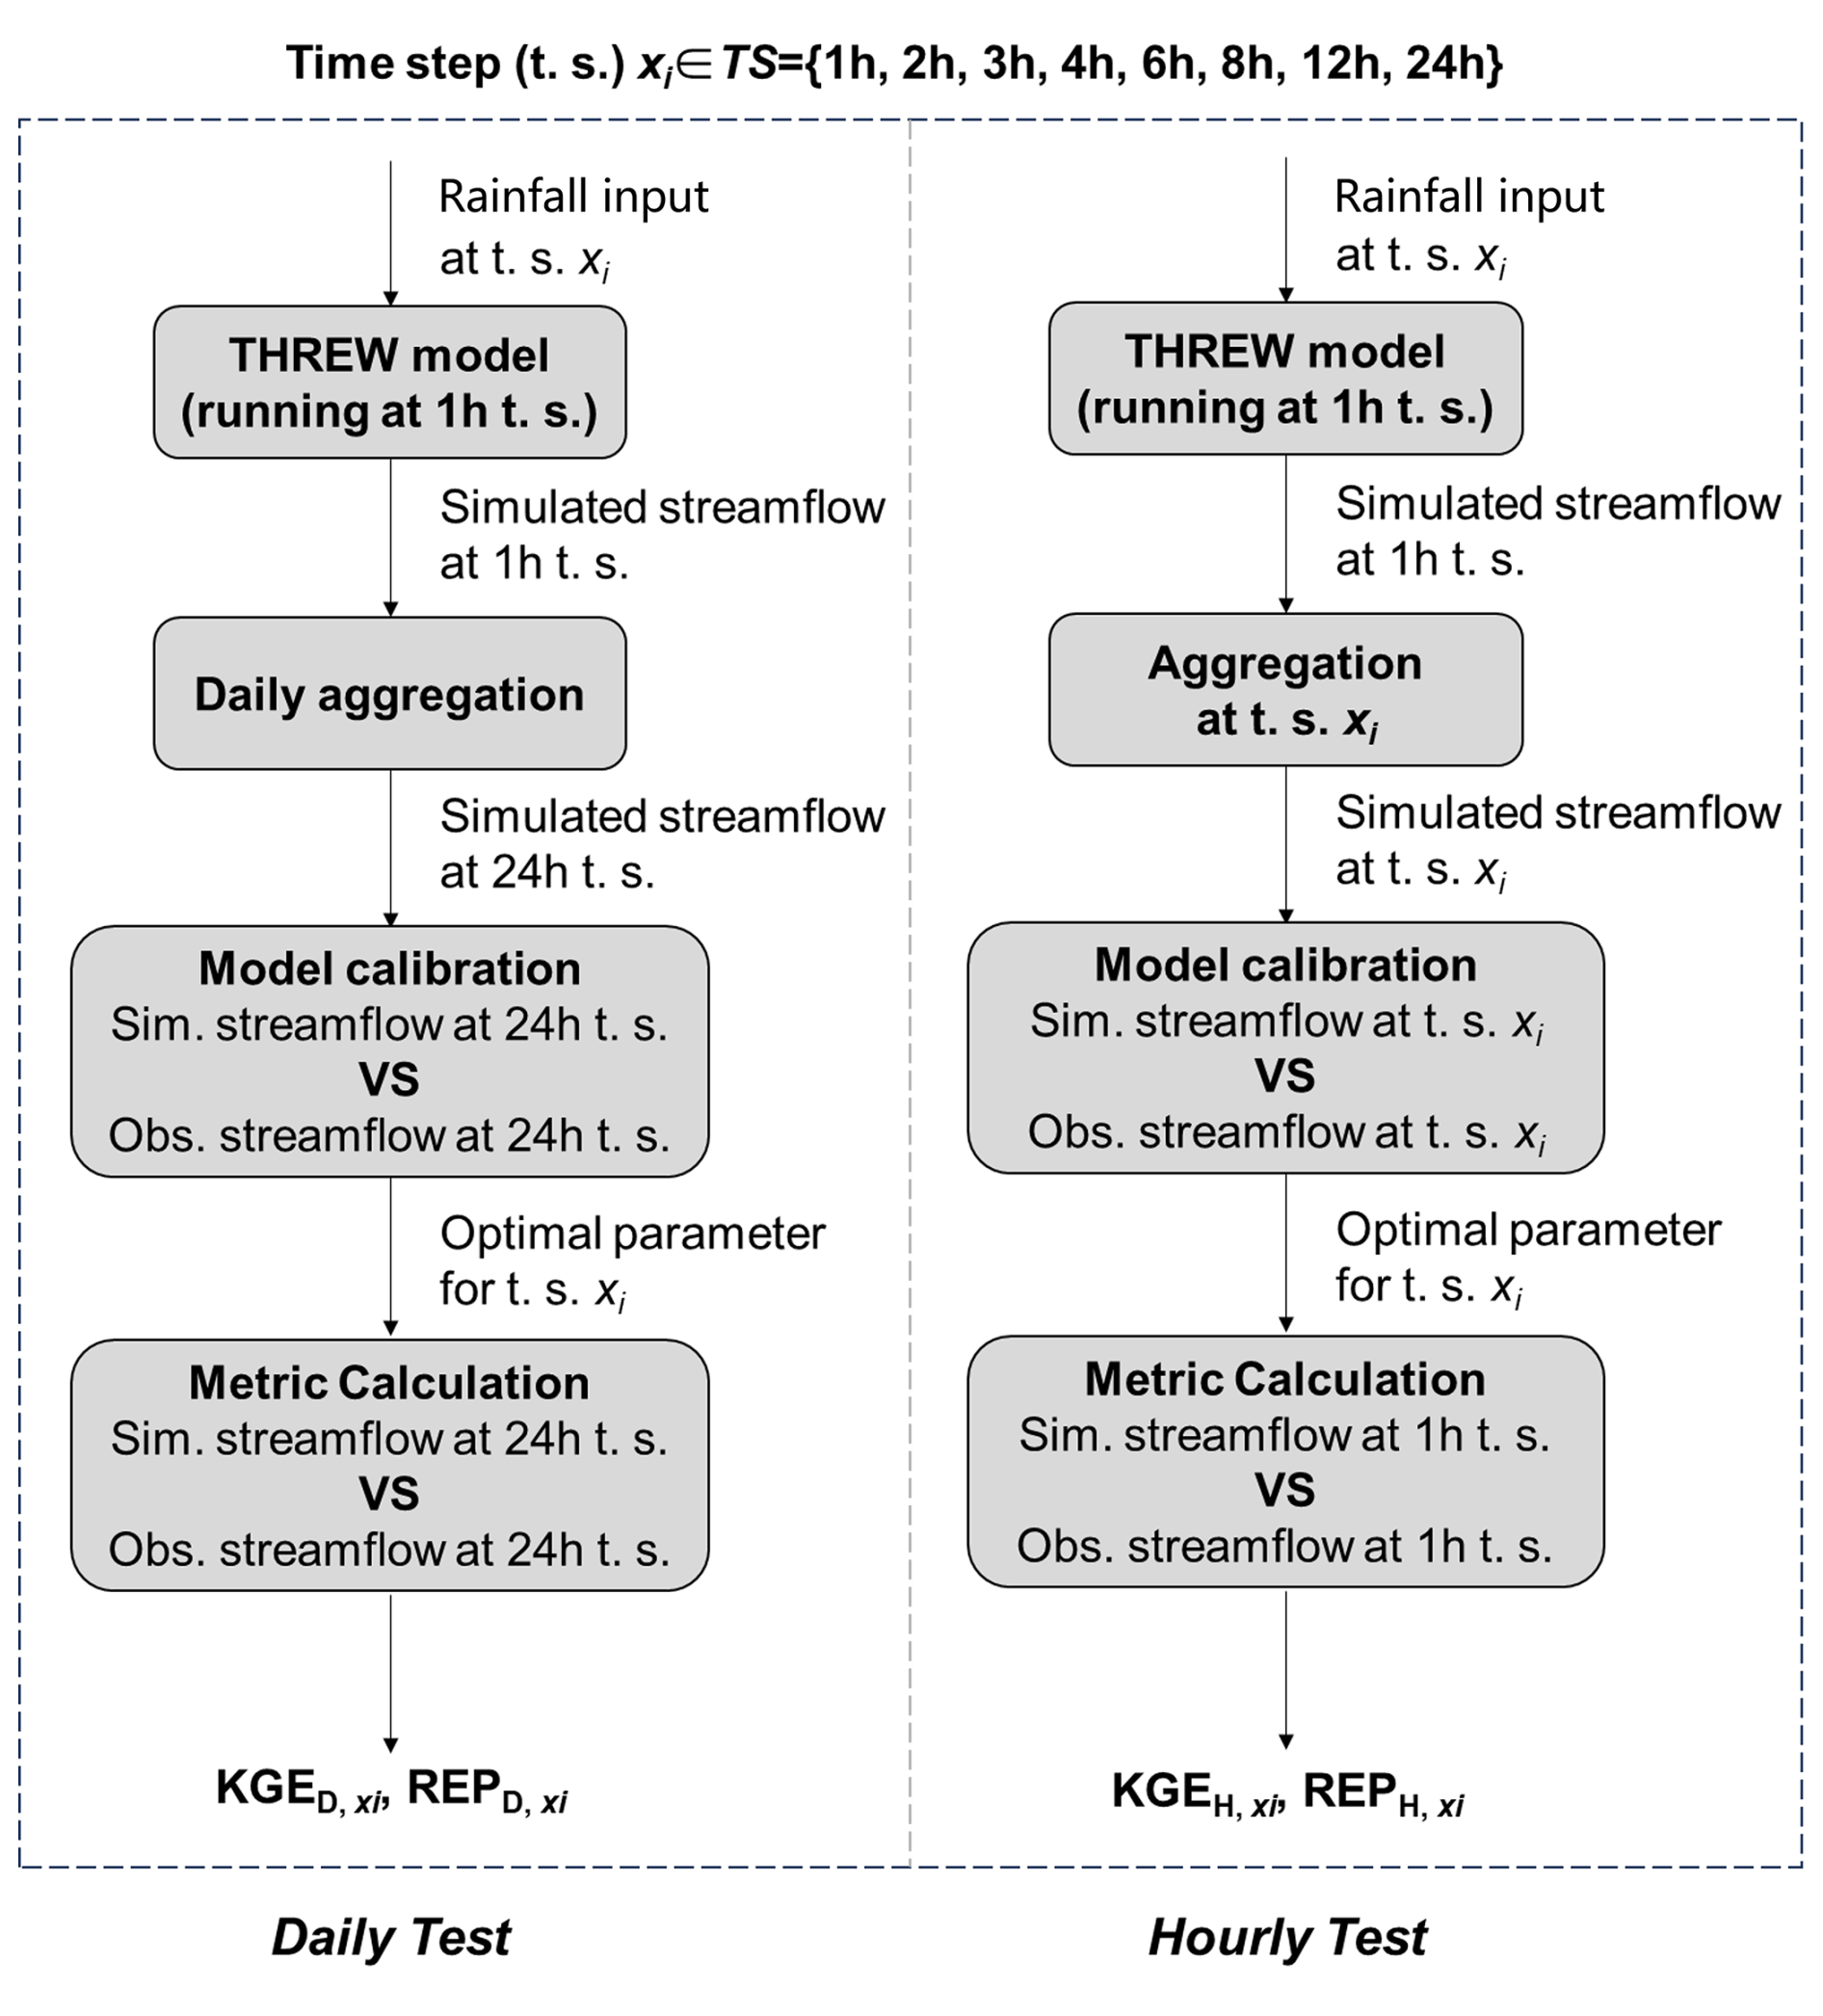
To examine the influence of rainfall and runoff data at different resolutions on streamflow simulation, we designed two specific experiments: the daily test and the hourly test. The flowchart of the experimental tests, which is described as follows, is shown in Fig. 3:
-
Daily test. This experiment was designed to investigate the impact of high-resolution rainfall data on daily streamflow simulations. The model was driven by rainfall data at various resolutions and calibrated using daily resolution streamflow data. This approach allowed us to assess whether (and to what extent) sub-daily rainfall data can enhance daily streamflow simulation, addressing the first question raised in the introduction.
-
Hourly test. This experiment was designed to investigate the impact of high-resolution rainfall and streamflow data on hourly streamflow simulation. In this test, the temporal resolutions of rainfall data and measured streamflow data for calibration were the same, both set to various resolutions. The model was calibrated using streamflow data with the given temporal resolution, and then the hourly streamflow simulated by the calibrated model was evaluated based on the hourly measured data. This setup aimed to determine the necessary data resolution for providing reliable hourly streamflow forecasts, thereby addressing the second question introduced earlier.
These experiments were designed to explore how data resolution impacts the accuracy and reliability of the model's performance at different temporal scales. The computational time step of the model is also one of the factors impacting the model's performance (Jie et al., 2018; Reynolds et al., 2017). To minimize any bias associated with varying computational time steps, the computational time step of hydrological simulations was consistently set to 1 h. This standardization was maintained regardless of the actual temporal resolution of the input data. All input data besides rainfall were resampled to the hourly resolution through averaging prior to simulation. As a result, the output, specifically the simulated runoff data, was consistently produced at an hourly scale.
In the daily test, rainfall data at various temporal resolutions were fed into the hydrological model to generate simulated hourly streamflow. These hourly data were then aggregated to a daily scale for direct comparison with observed daily streamflow data. Through this process, model parameters were calibrated by aligning the simulated outcomes with observed data, thus optimizing the parameters for different resolutions of rainfall data. An automatic optimization algorithm, Python Surrogate Optimization Toolbox (pySOT, Eriksson et al., 2019), was employed for model calibration, with the objective of maximizing Kling–Gupta efficiency (KGE). The pySOT algorithm utilizes radial basis functions (RBFs) as surrogate models to approximate simulations, thereby reducing the runtime for each model iteration. During a single optimization process, the optimization algorithm iteratively generates new parameters via the symmetric Latin hypercube design (SLHD) method. The optimization ceases when the optimization objective converges or the number of iterations reaches a predetermined threshold (set at 3000). In this study, the pySOT algorithm was repeated 100 times, and the final parameter set was determined based on the optimal objective (maximum KGE). After calibration, another performance metric, relative error of peak flow (REP), was calculated. These metrics are calculated as follows:
where r represents the Pearson correlation coefficient between simulated and observed values, α is the ratio of the mean of simulated values to the mean of observed values, β is the ratio of the standard deviation of simulated values to the standard deviation of observed values, and Qsim,p and Qobs,p are the simulated and observed peak flow, respectively.
The hourly test followed a similar procedure to the daily test, inputting rainfall data at various temporal resolutions into the hydrological model to produce simulated hourly streamflow. This output was aggregated to match the resolution of the input data and compared with the corresponding observed data for calibration. The performance of calibrated model on simulating hourly streamflow was then assessed by calculating KGE and REP, based on the hourly simulated and observed streamflow data.
The flowchart of the experimental tests is illustrated in Fig. 3, where D and H refer to the daily and hourly tests, and xi is each member of the time step (t.s.) set (TS), which consists of 1, 2, 3, 4, 6, 12, and 24 h. and are the KGE of and REP of daily streamflow forced by rainfall at the time step of xi. Similarly, and denote the KGE and REP for hourly streamflow at time step of xi. To quantify the different model abilities on streamflow simulations at hourly and daily scales, rKGE and ΔREP are calculated as in Eqs. (3) and (4). Generally, rKGE is greater than 1, and ΔREP is positive because it is easier for models to achieve good performance on the streamflow simulation at coarse temporal resolutions. A rKGE close to 1 indicates that the model performs equally well at the hourly scale as it does at the daily scale, suggesting its applicability across different temporal scales and providing comparable reliability. A ΔREP approaching 0 has a similar implication. In addition to the metric calculated for different temporal resolutions, The average KGE and REP in the daily and hourly test, aggregating these metrics across temporal scales, are calculated to provide an average performance measure for the model within each catchment. The average KGE in the daily test and hourly test are calculated as in Eqs. (5) and (6), and the average relative error REPD,ave and REPH,ave are calculated in a similar way. The average rKGE and ΔREP are calculated as in Eqs. (7) and (8).
2.4 Quantifying the value of high-resolution data
The paired two-sample t test, a widely used statistical method to determine whether the means of two related groups of samples are significantly different (e.g., Xu et al., 2017), was adopted to test whether the performance of the hydrological model based on high-resolution data significantly improved. Furthermore, the improvement index (IMP) was proposed to quantify this performance improvement. The IMP is calculated as follows:
IMPD and IMPH represent the highest degree of improvement of the sub-daily-scale data relative to the daily scale data in the daily test and the hourly test, respectively. It should be noted that although IMP and rKGE have similar equations, they reflect different issues: the rKGE represents the difference in model ability on streamflow simulation at daily and hourly scales, while the IMP indexes quantify the value of the sub-daily-scale dataset on hydrological models.
2.5 Analyzing the influence factors of model performances
In order to identify potential factors affecting the performance of the model and determine which catchments benefit more from high-resolution data, correlation analyses were performed between catchment attributes and model performance metrics. The model performance metrics are described in the previous section. The following catchment attributes were selected as potential factors: (1) drainage area (DRA); (2) mean annual rainfall (MAR); (3) mean annual runoff (MAQ); (4) runoff coefficient (QR); and (5) goodness of uniform estimation (GOUE) for streamflow, which is the Nash–Sutcliffe efficiency coefficient (NSE) of hourly streamflow based on daily streamflow assuming a uniform intraday streamflow, revealing the intraday streamflow variation (Andréassian et al., 2001). The equation for GOUE is shown by Eq. (11), where n is the length of the time series of the streamflow, Qh is the actual hourly streamflow, is the mean of the Qh, and QDh is the hourly streamflow based on daily streamflow assuming a uniform intraday streamflow. A larger GOUE indicates a smaller difference between daily and hourly streamflow, and a smaller intraday streamflow variation. Finally, there are the (6) intraday standard deviation (ISTD) of the streamflow relative to the average streamflow and (7) rainfall gauge area (RGA), which is the catchment area divided by the number of rainfall stations in the catchment. Subsequently, correlation analyses were conducted between evaluation metrics (including KGED,ave, KGEH,ave, rKGEave, REPD,ave, REPH,ave, ΔREPave, IMPD, and IMPH) and the above seven potential influencing factors. Statistical summaries of these attributes across the study catchments are presented in Table 1.
3.1 Model performance at different timescales
The results of the daily and hourly tests are shown in Fig. 4 and detailed in Table 3. Considering the performance metrics obtained by various resolutions (ranging from 1–24 h) of data, in the daily test, the average KGE varied in the range of 0.84–0.87. The model performed the worst when using the 24 h resolution data, but even so, KGE exceeded 0.8 in over 76 % of the catchments. At the 1 h resolution, this proportion rose to 86 %. As for REP, its average value at various data resolutions ranged between −16 % and −24 % indicating the general underestimation on peak flow. In the hourly test, the metrics got slightly worse compared with the daily test, with average KGE 0.03 lower and average REP 10 % larger than that of the daily test. The average KGE at various data resolutions varied in the range of 0.79–0.84, and the model produced a KGE higher than 0.8 in over 75 % of the catchments when using 1 h rainfall and streamflow data. The average REP varied in the range ranges between −24 % and −38 %. The average rKGE and ΔREP varied within the ranges of 1.04–1.07 and 7.8 %–14 %, respectively. Furthermore, with the increasing temporal resolution, both rKGE and ΔREP exhibited a decline trend, suggesting that the discrepancy in the model's performance between hourly and daily scales diminished as the data resolution improved. In brief, at all data resolutions in both daily and hourly tests, the average KGE was consistently greater than 0.8, and the absolute value of average bias was consistently lower than 25 %, respectively.
Besides, considering the metrics aggregated across different temporal scales for each catchment, the spatial patterns of average KGE and REP are shown in Fig. 5 and detailed in the last column in Table 3. In most catchments, the average KGE exceeded 0.8 in both the daily and hourly experiments. The average absolute value of REP was less than 20 % in the daily test and less than 30 % in the hourly test. These results demonstrated the high performance and reliability of the THREW model in these catchments, with a high KGE and low REP.
The evaluation metrics improved when using input and calibration data with higher temporal resolutions. Particularly, there was an obvious improvement in model performance when transitioning from daily to sub-daily resolution. In the daily test, the average KGE and REP obtained for 1 h data were 0.03 % and 8 % higher, respectively, compared to those obtained under 24 h data driving. In hourly testing, the difference in KGE and REP between 1 h data- and 24 h data-driven results were 0.05 % and 14 %, respectively. Figure 4c and f show that the differences between daily and hourly metrics got smaller when higher-resolution input data were used. Transitioning from 24 to 1 h intervals in input data resolution resulted in a decrease in rKGE from 1.07 to 1.04 and a decrease in ΔREP from 14.1 % to 7.76 %. This signified a close proximity in the model's performance between forecasting hourly and daily streamflow when utilizing 1 h resolution data.
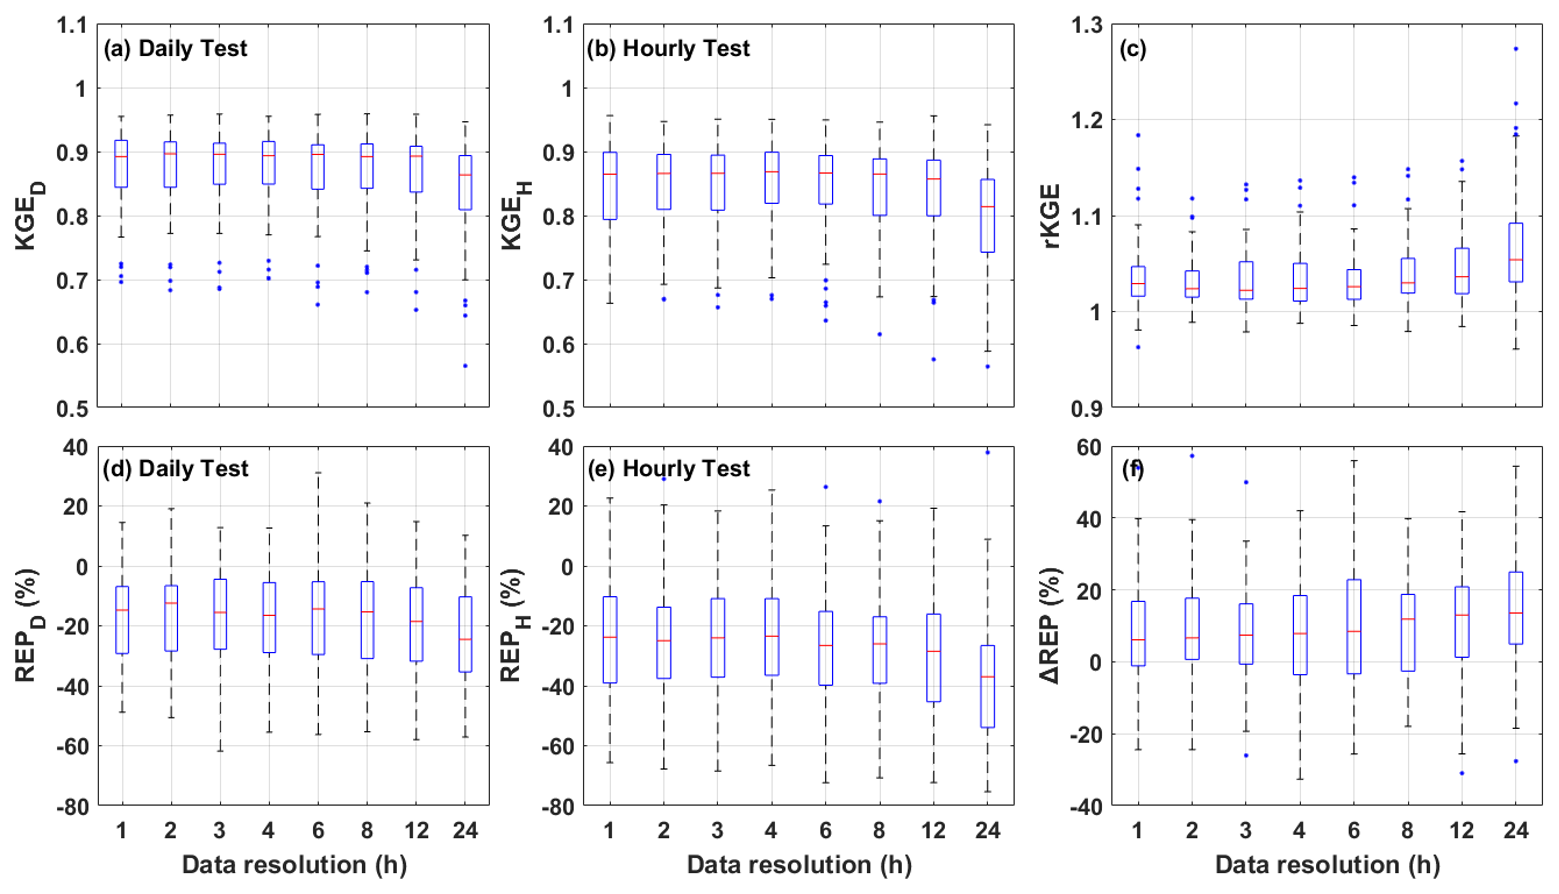
Table 3The characteristic values of KGE, REP, rKGE, and ΔREP obtained by data with different temporal resolutions based on experiments across 63 catchments.
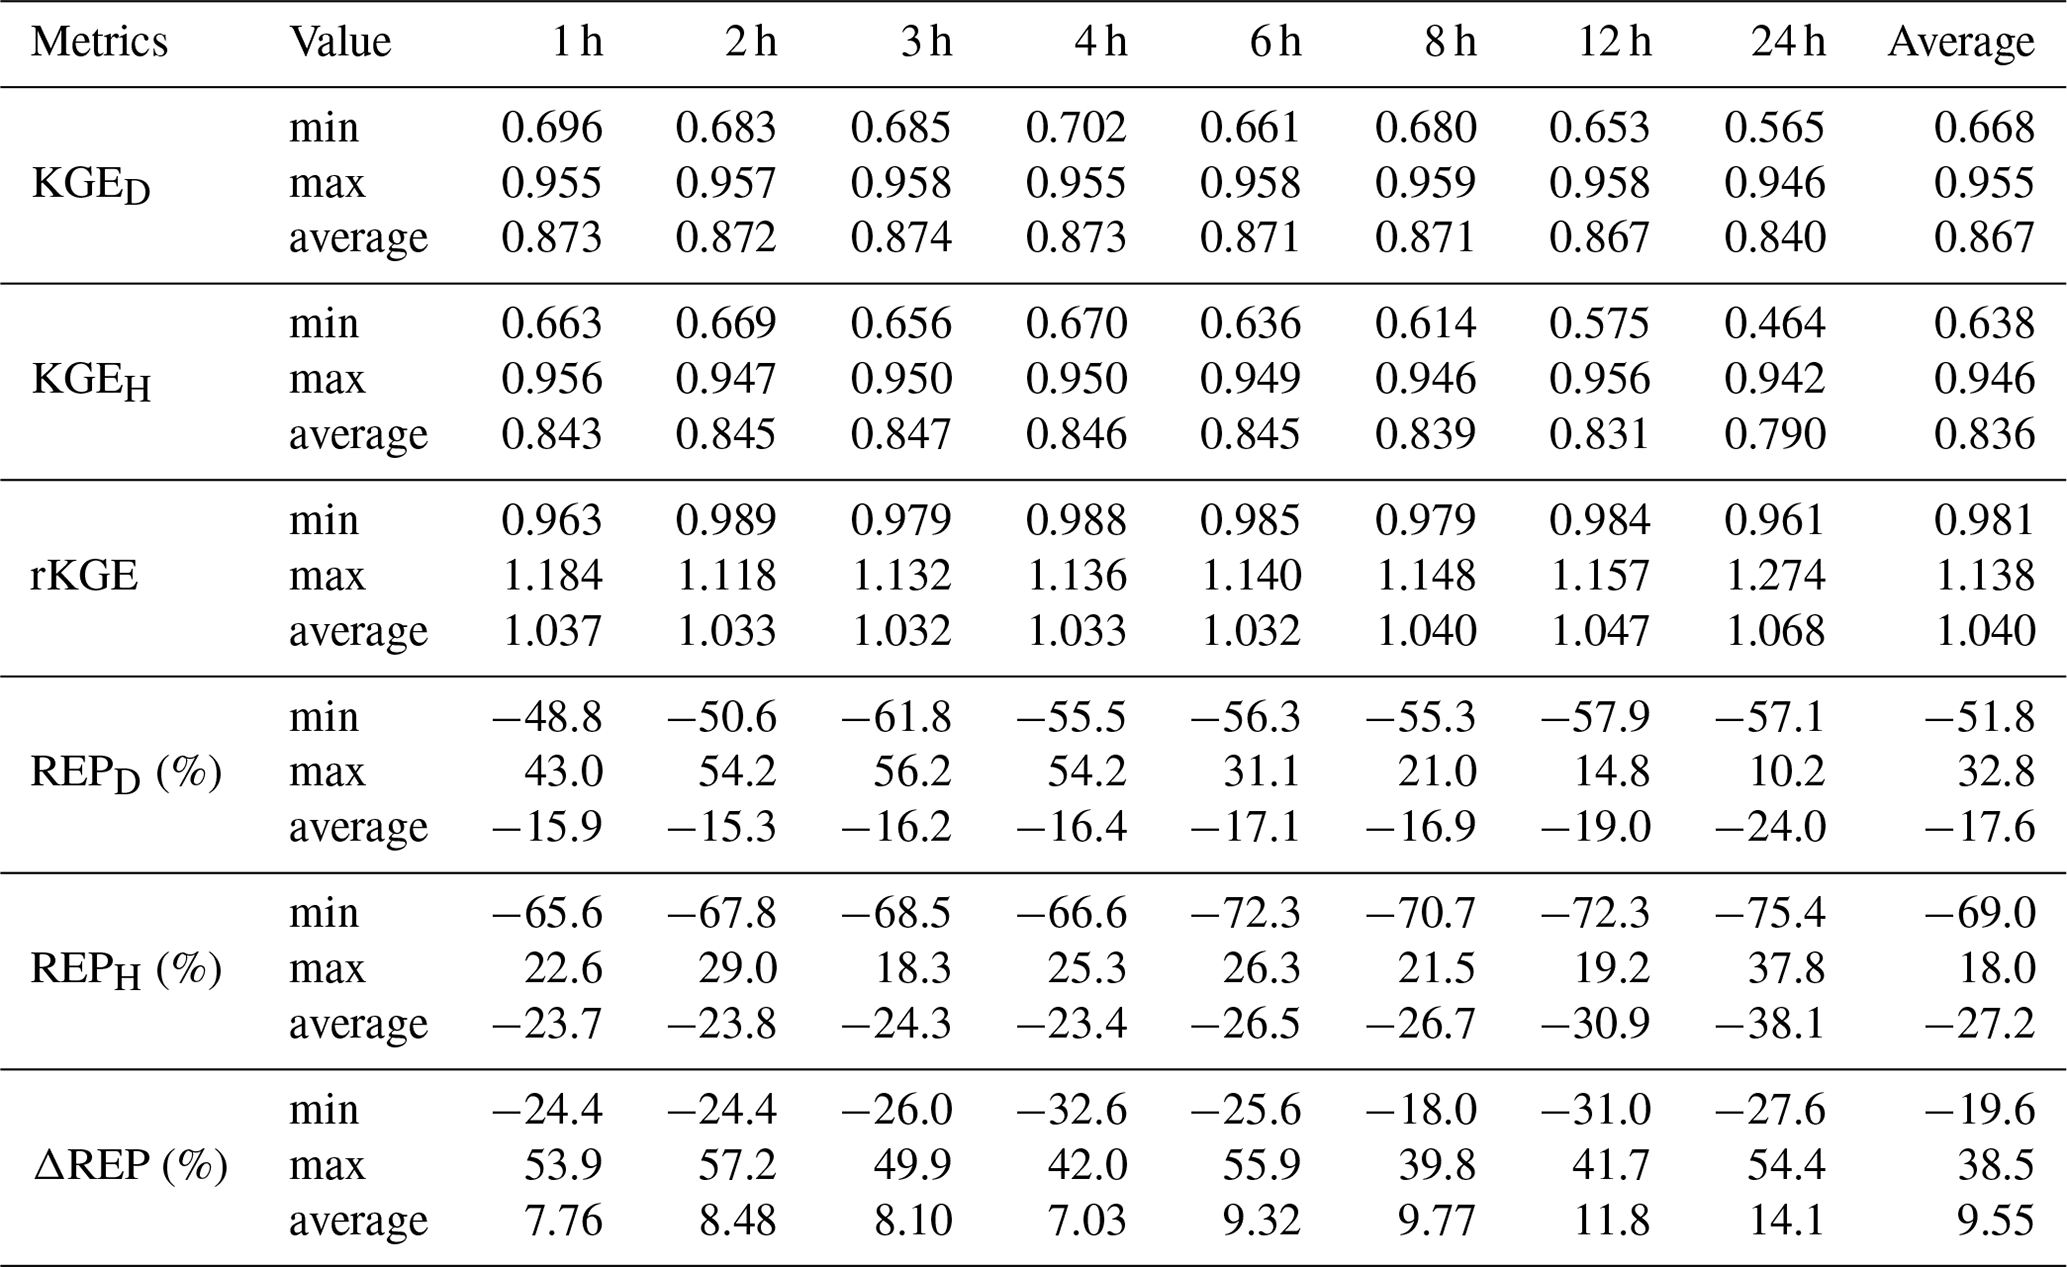
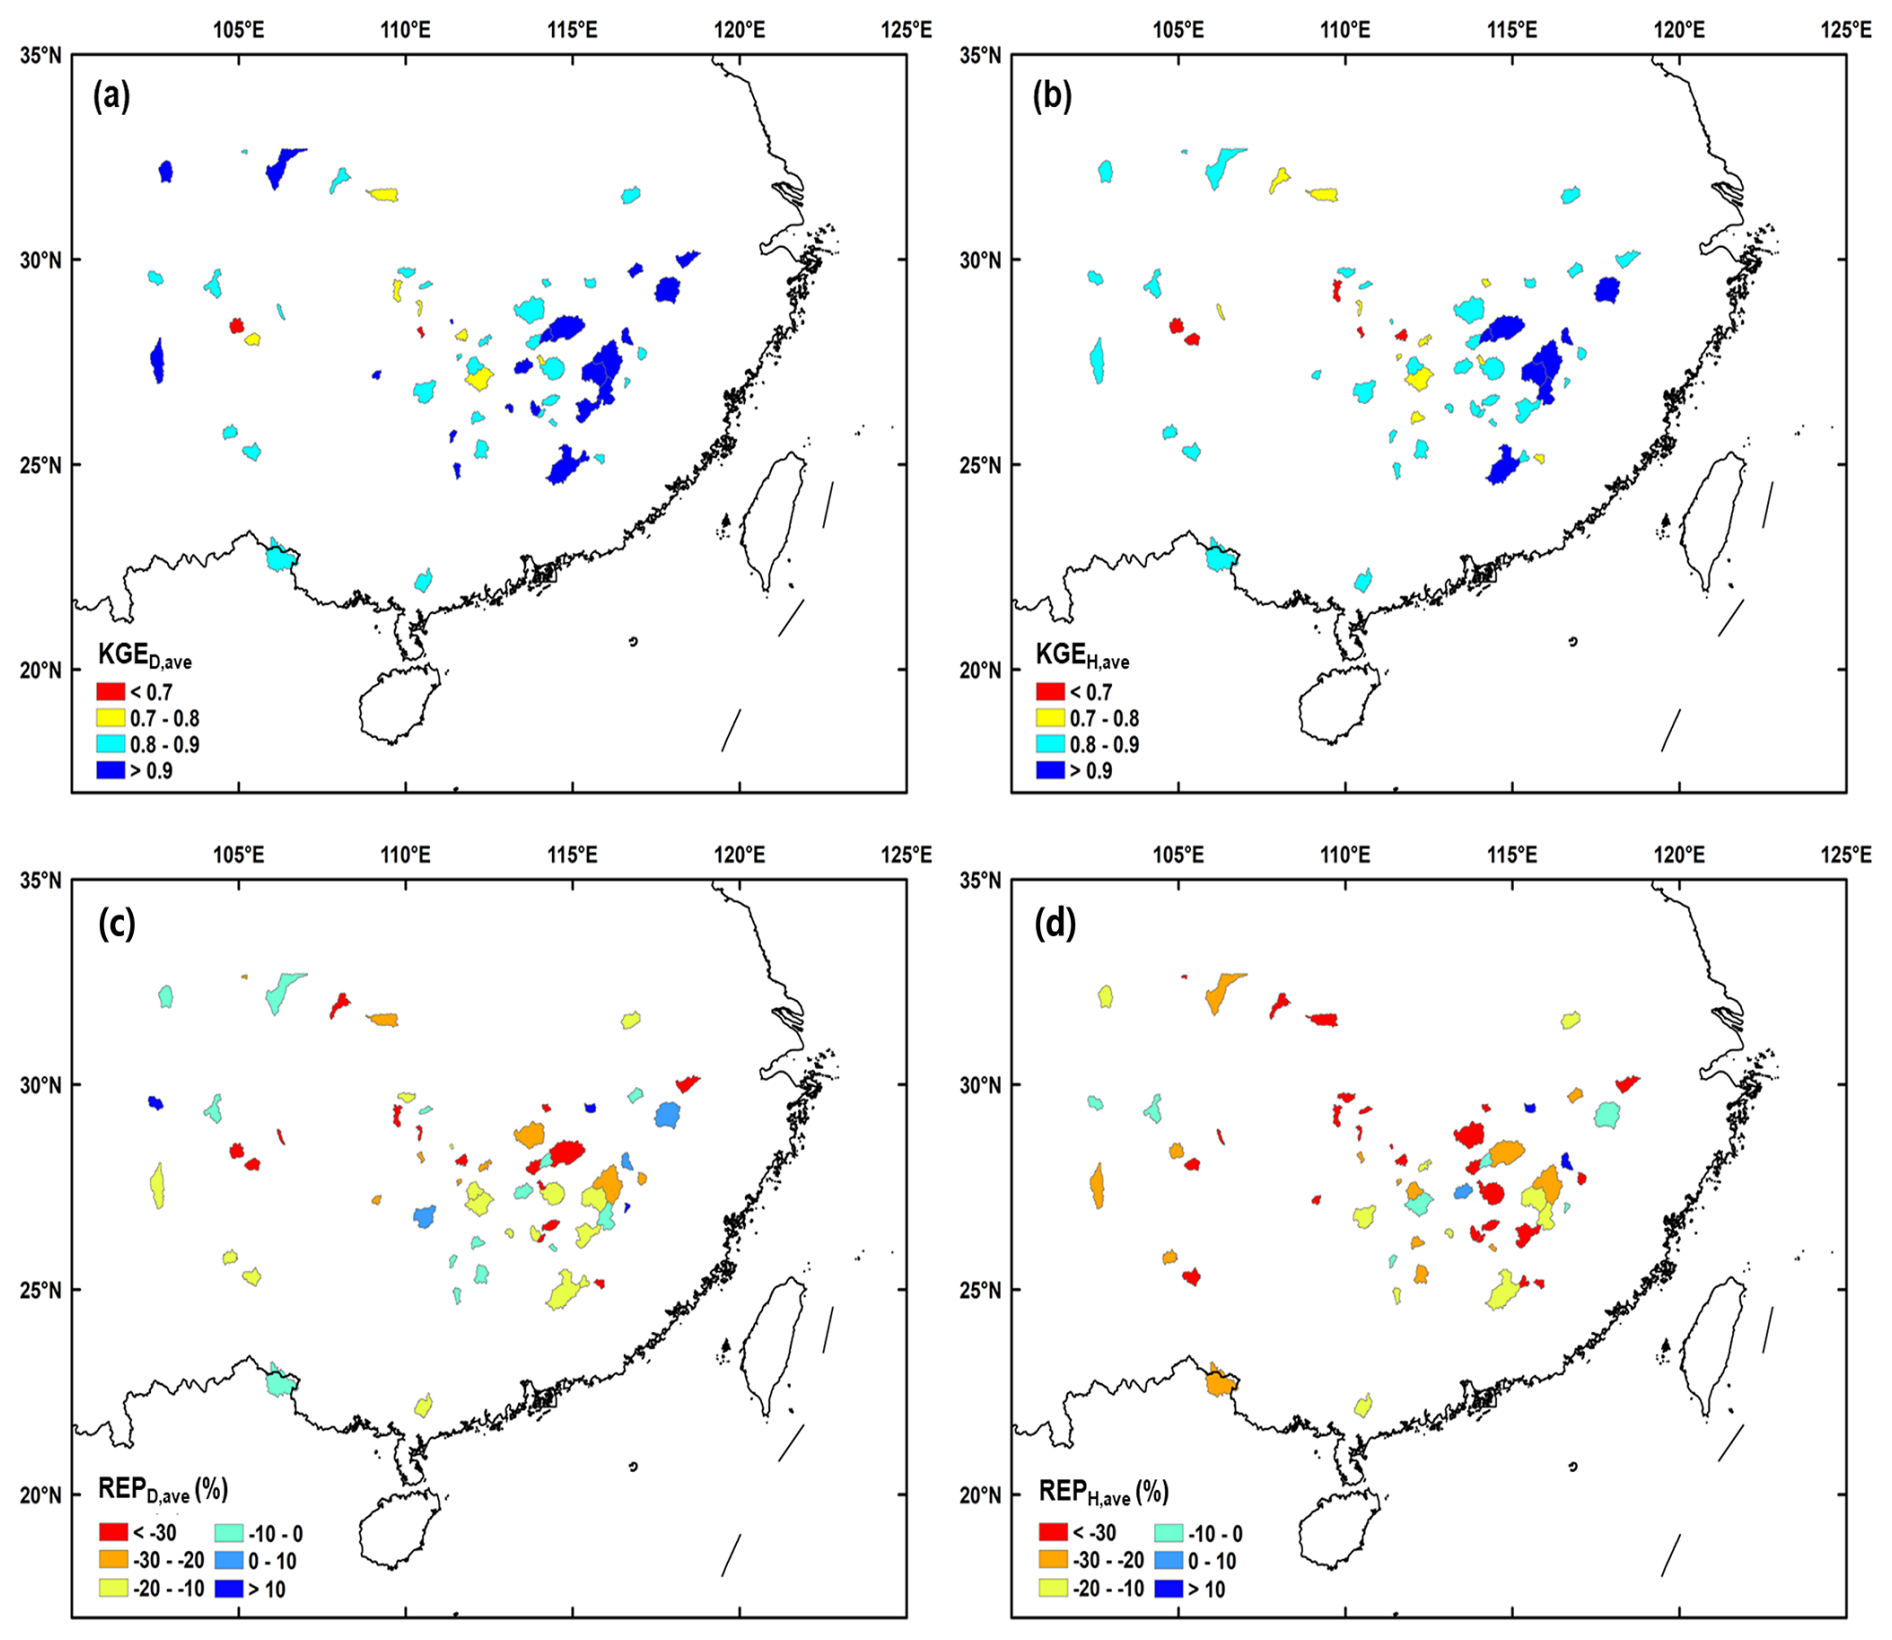
Figure 5Spatial pattern of KGE and REP. Publisher's remark: please note that the above figure contains disputed territories.
3.2 Influence of data temporal resolution on model performance
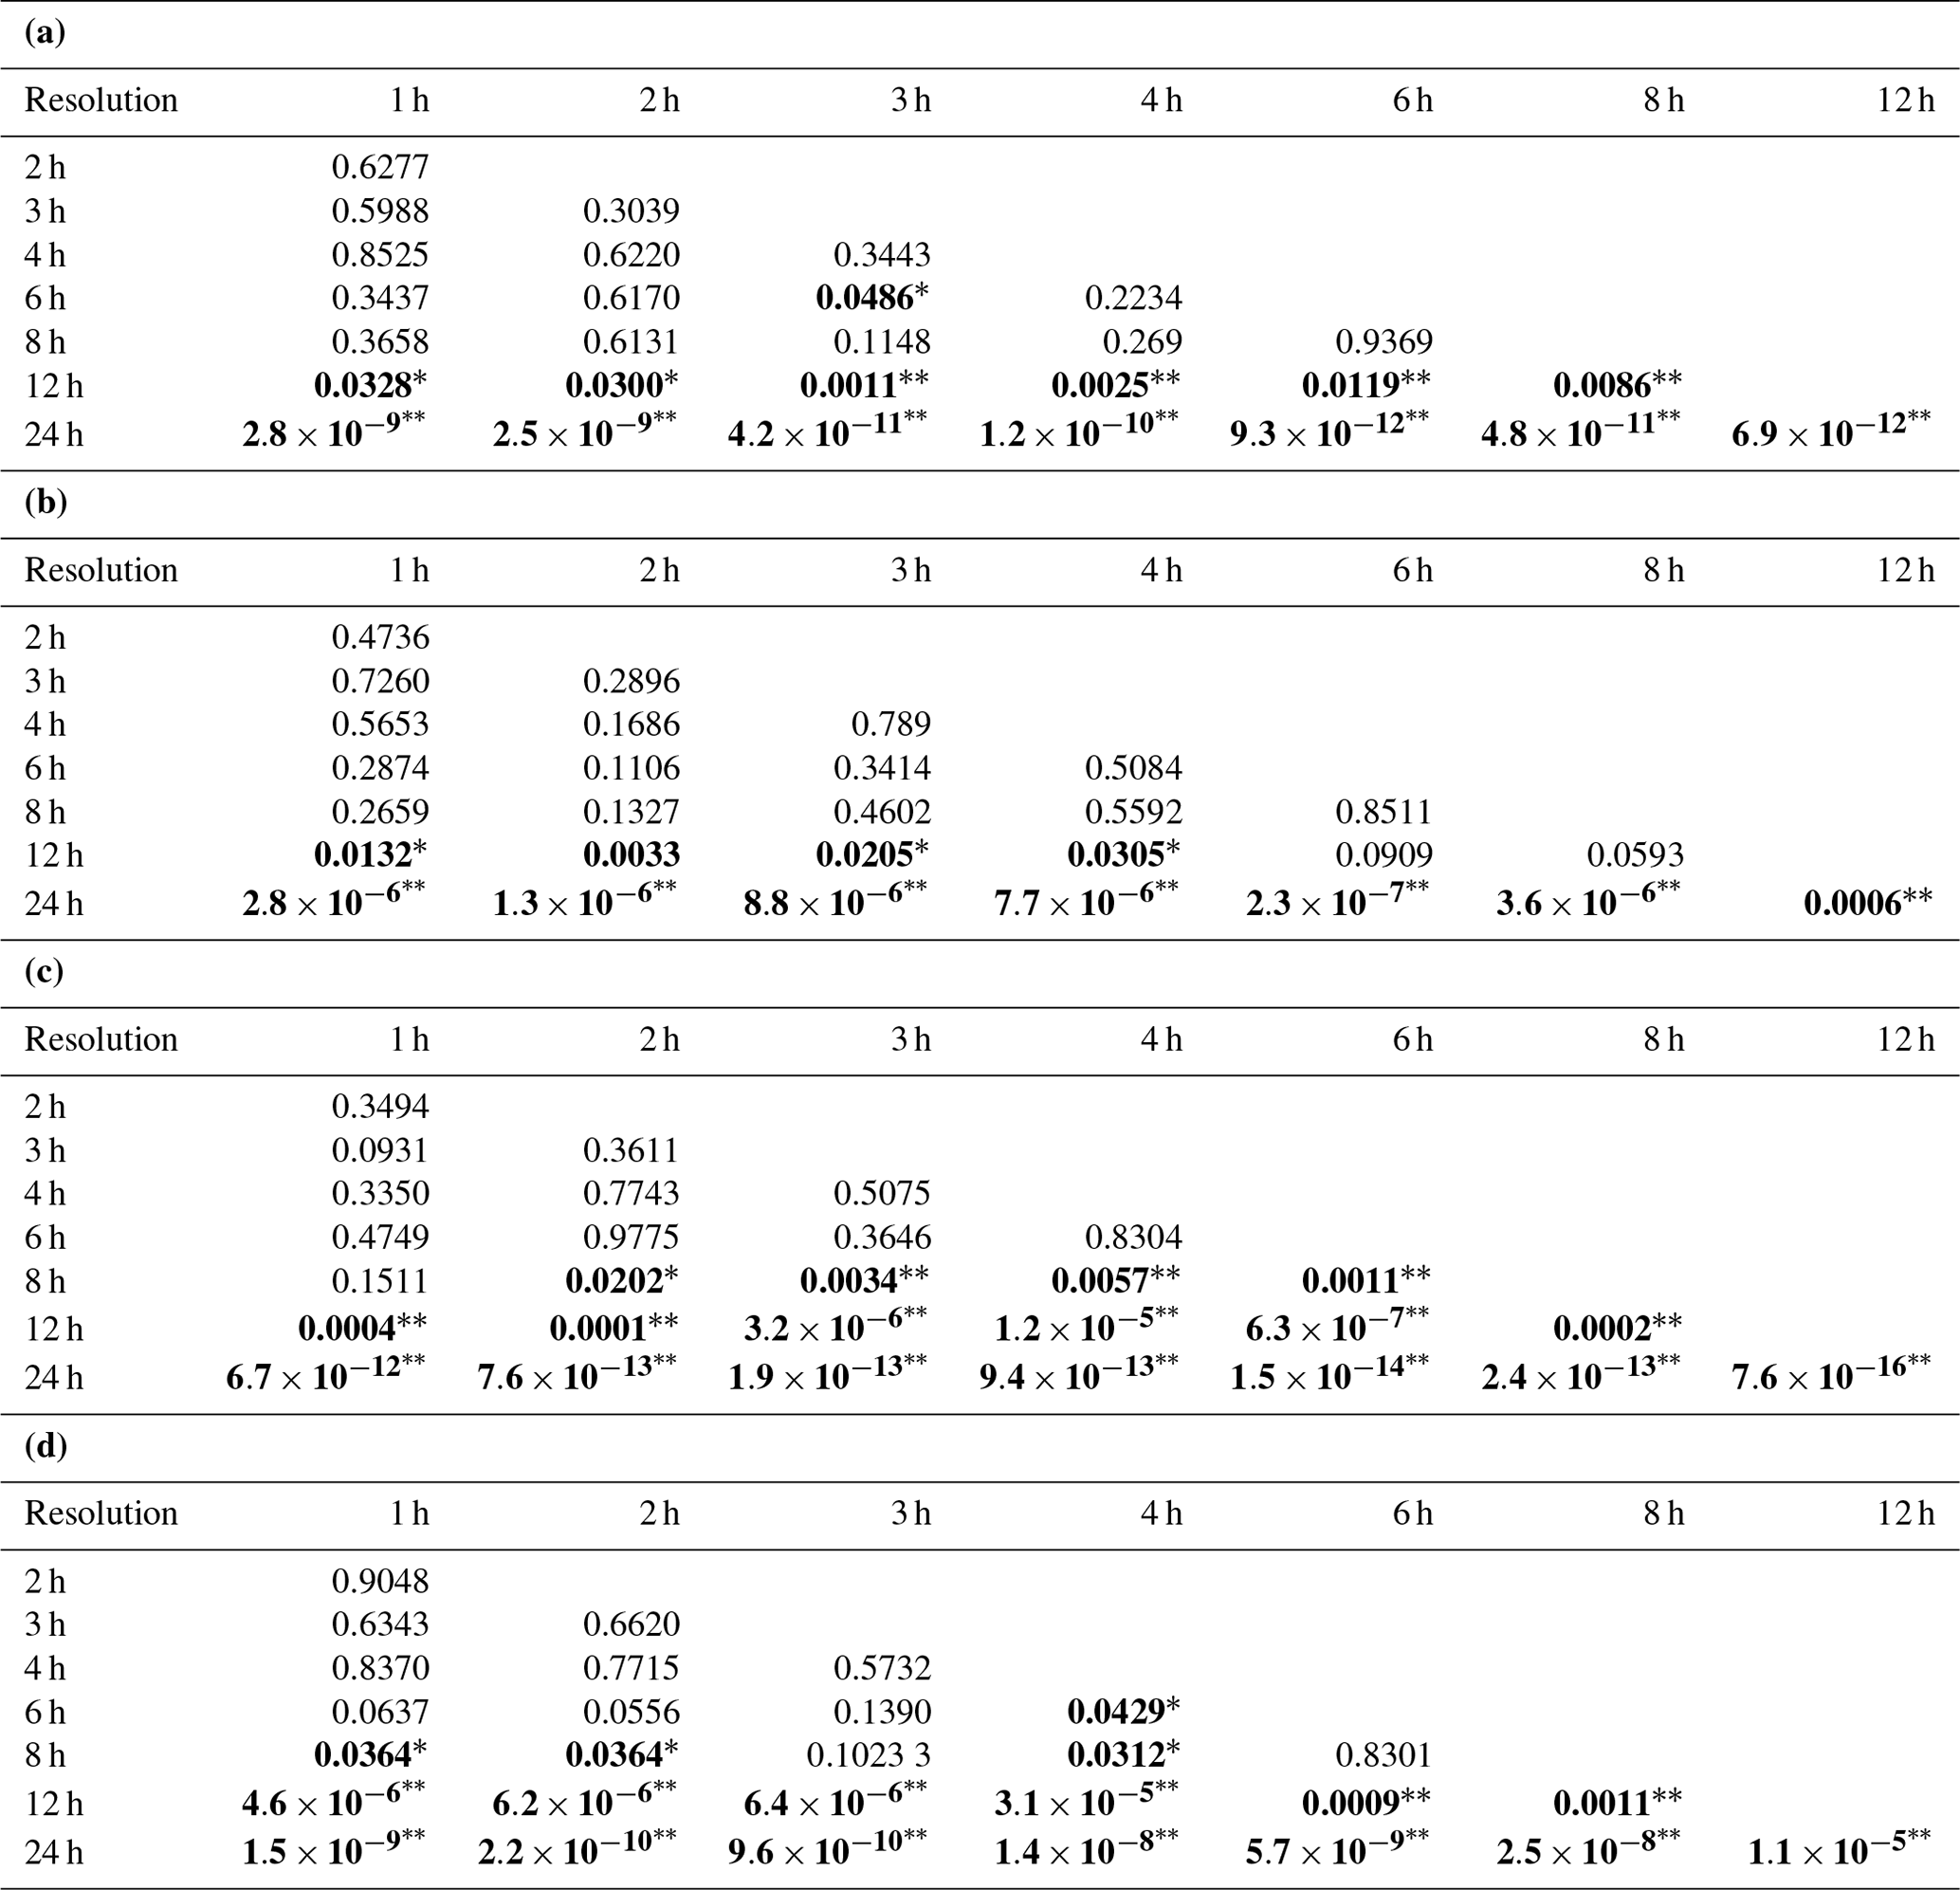
In both the daily and the hourly test, there was an obvious improvement in model performance when the rainfall/streamflow data resolution increased from daily to sub-daily. For instance, in the daily test, when the data resolution shifted from 24 h to sub-daily 12 h, the average KGE increased from 0.84 to 0.87, and the average REP decreased from −24 % to −19 %. But such improvements got increasingly limited as the resolution further increased (Fig. 4). To quantify the difference in the model performances when adopting data with different resolutions, paired two-sample t tests were conducted, and the results are shown in Table 4. In the daily test, significant improvement (at 0.01 significance level) in the streamflow simulation was brought by sub-daily-resolution rainfall data compared to the daily data, as indicated by the low p values in the bottom rows of Table 4a and b. At least at the 0.05 significance level, there were significant differences in KGE obtained at 6 and 8 h resolutions compared to that obtained at 12 h resolution, but the difference in REP was not significant. The KGE obtained at 6 and 3 h resolutions also showed significant differences, but the p value was very close to 0.05. Meanwhile, it is noteworthy to mention that the differences among evaluation metrics were insignificant at the 0.05 level when the resolution of rainfall data was higher than 8 h. This suggested that for daily streamflow forecasting, continuously increasing the rainfall data resolution beyond the 8 h threshold did not bring significant improvements to model performance. That is, the simulated daily streamflow obtained from a model driven by 8 h rainfall input had comparable reliability to that forced by 1 h data, and the effect of rainfall data with a temporal resolution exceeding 8 h on enhancing daily forecasted flow was negligible.
Similar results were observed in the hourly test (Table 4c and d). Compared to resolutions of 24 and 12 h, utilizing higher-resolution data effectively enhanced the model's forecasting performance for hourly streamflow. Taking KGE as the performance metric, significant differences existed between the performance of the model when using 8 h resolution data and that when using 2–6 h resolution data. Notably, there were no statistical differences between the KGEs obtained at 8 and 1 h resolutions, indicating that there was a decrease in KGE when the resolution increased to 1 h from 2–6 h. Yet, from the perspective of the average KGE (Fig. 4), this decrease was very slight, reaching 0.004 at most. The difference between REP obtained by the 3 and 6 h resolutions and that obtained by 8 h resolution was not significant. When the temporal resolution of data used for forcing and calibrating models exceeded 6 h, there was no significant improvement in the model's performance. Although the REP obtained at 6 and 4 h resolutions exhibited significant differences, the p value was very close to 0.05. Consequently, simulated hourly streamflow obtained by a model driven and calibrated by 6 h data was comparably accurate to that driven and calibrated with 1 h data, and there was no significant added value brought by data with a resolution higher than 6 h.
Table 4P values of the paired two-sample t tests for each metric. Sub-tables (a) and (b) represent the p values of the paired two-sample t test for KGE and REP in the daily test, respectively; sub-tables (c) and (d) represent the p values of the paired two-sample t test for KGE and REP in the hourly test, respectively. Bold values indicate p<0.05, with * representing 0.01≤p<0.05 and representing p<0.01.
To further quantify the benefits from higher-resolution data to hydrological simulation, the IMP indexes were calculated and are shown in Fig. 6. In the daily test, the improvement in the daily KGE brought by sub-daily rainfall input data ranged from −1.6 % to 24.1 % (5.3 % on average). Specifically, higher-resolution rainfall data caused a slight decrease in daily streamflow simulation efficiency in two catchments, and the increase in daily KGE was lower than 5 % in more than half of the catchments (40 of 63). In the hourly test, the improvement brought from sub-daily-resolution data was significantly correlated to that in the daily test (R2=0.72, p<0.01), and the improvement was more pronounced. The model performance was improved by the sub-daily rainfall and streamflow data in all the catchments, with the increase in hourly KGE ranging from 0.1 % to 52.9 % (9.3 % on average). The IMP had no significant spatial distribution pattern, but it was likely larger in smaller catchments (also shown in Fig. 7).
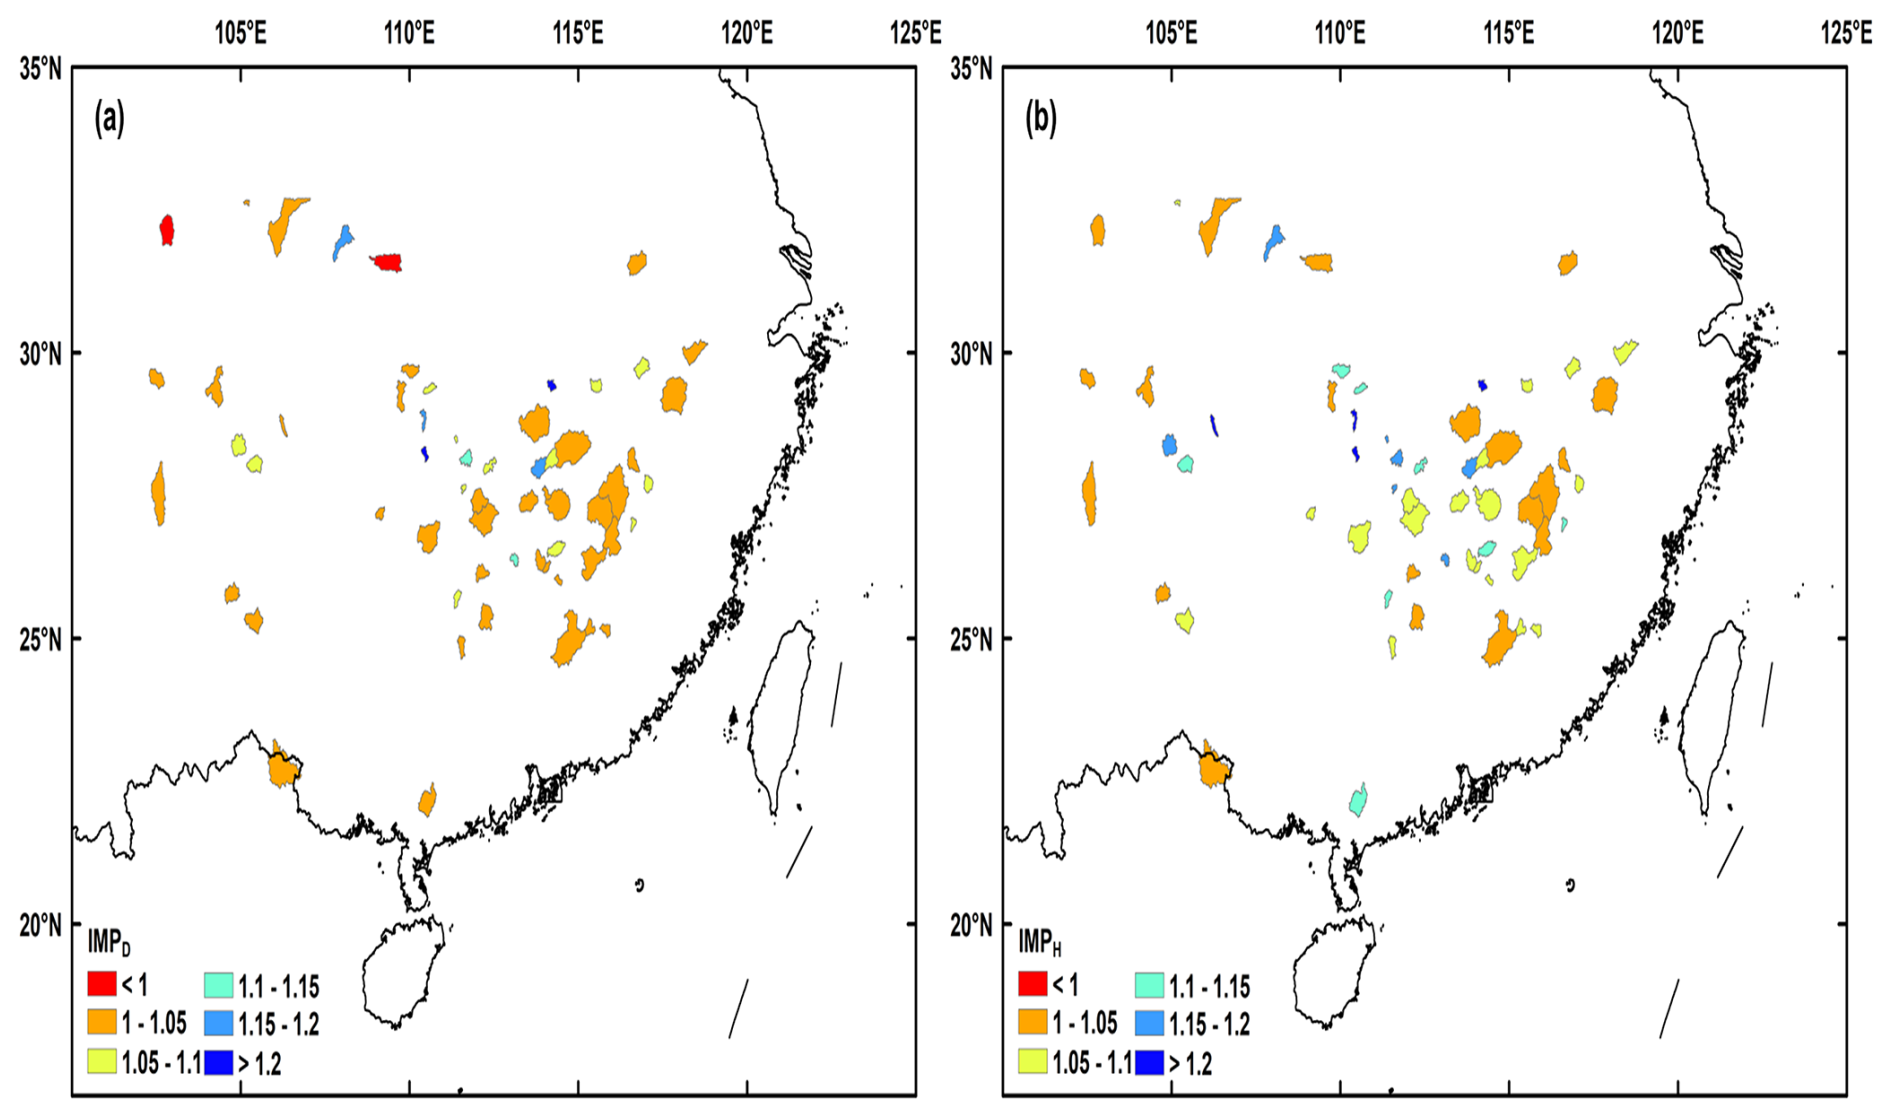
Figure 6Spatial pattern of the benefit from higher-resolution data. (a) IMP in the daily test; (b) IMP in the hourly test. Publisher's remark: please note that the above figure contains disputed territories.
3.3 Influence factors of model performance and the improvement brought by high-resolution data
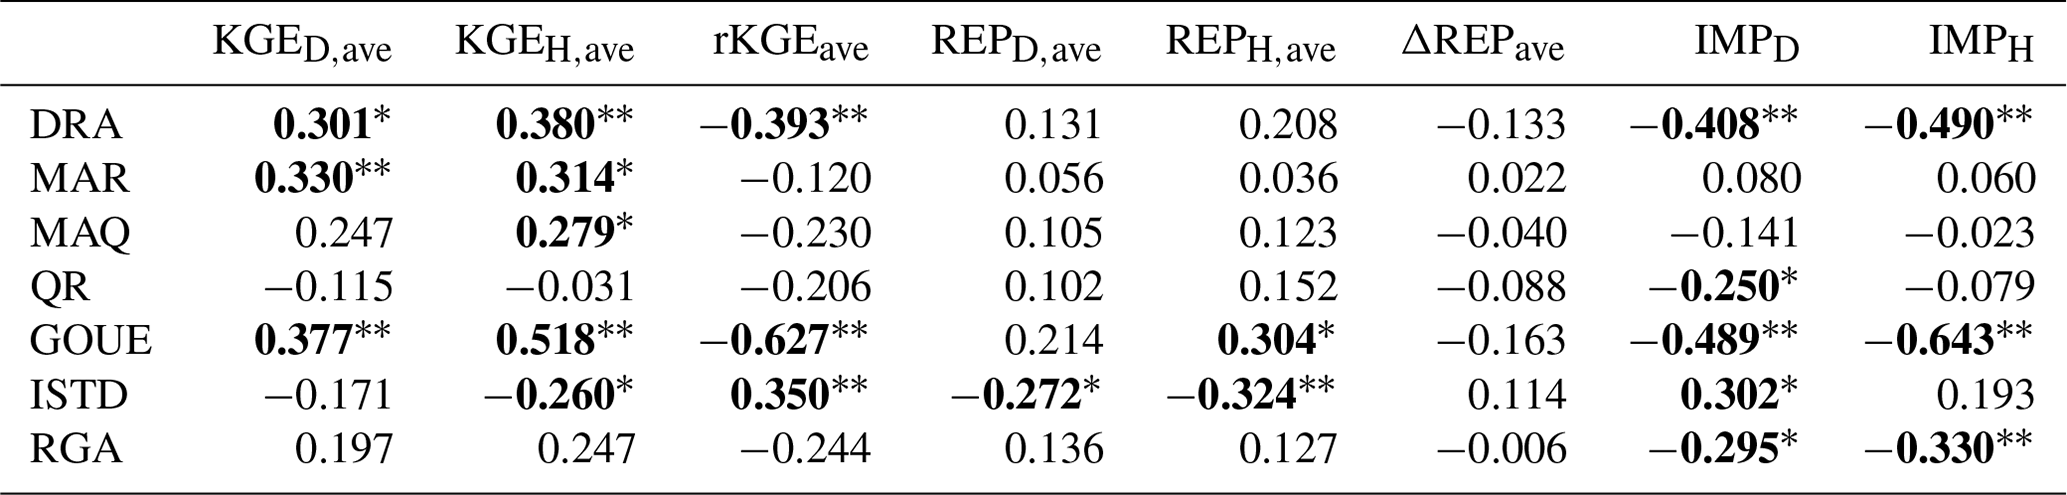
In order to identify the potential factors affecting model performance and improvement, a correlation analysis was carried out between catchment attributes and model performance metrics, and the results are shown in Table 5. Overall, GOUE was the strongest predictor among the influence factors with the highest correlation coefficient for most model performance and improvement metrics except for the two metrics evaluating peak simulation. In both daily and hourly tests, KGE was significantly positively correlated with DRA, MAR, and GOUE (detailed in Fig. 7), indicating that the model performed better in daily and hourly streamflow simulations in catchments with a larger drainage area, more rainfall, and higher goodness of uniform estimation (lower intraday streamflow variation). This could be attributed to the general fact that larger watershed areas tend to exhibit relatively stable and slower changes in streamflow and the generally stronger correlation between rainfall and runoff in catchments with wetter conditions resulting in more predictable streamflow. In addition, the KGE for hourly streamflow was positively correlated with MAQ (r=0.279, p<0.05) and negatively correlated with ISTD (, p<0.05), indicating that the model performed better in catchments with larger runoff and less intraday streamflow variation. In arid regions and areas with significant diurnal flow fluctuations, streamflow forecasting at fine temporal scales poses greater challenges. REP was significantly negatively correlated with ISTD at both the daily (, p=0.031) and the hourly scale (, p<0.01), indicating that the model performed better in peak flow simulations in catchments with less intraday streamflow variation (Fig. 8). Predicting peaks accurately is more challenging in data sequences with larger fluctuations. rKGE was negatively correlated with DRA (, p<0.01) and GOUE (, p<0.01) and positively correlated with ISTD (r=0.350, p<0.01), indicating that the model exhibited a closer performance between daily and hourly scales in catchments with a larger drainage area and lower diurnal streamflow variability (Fig. 9).
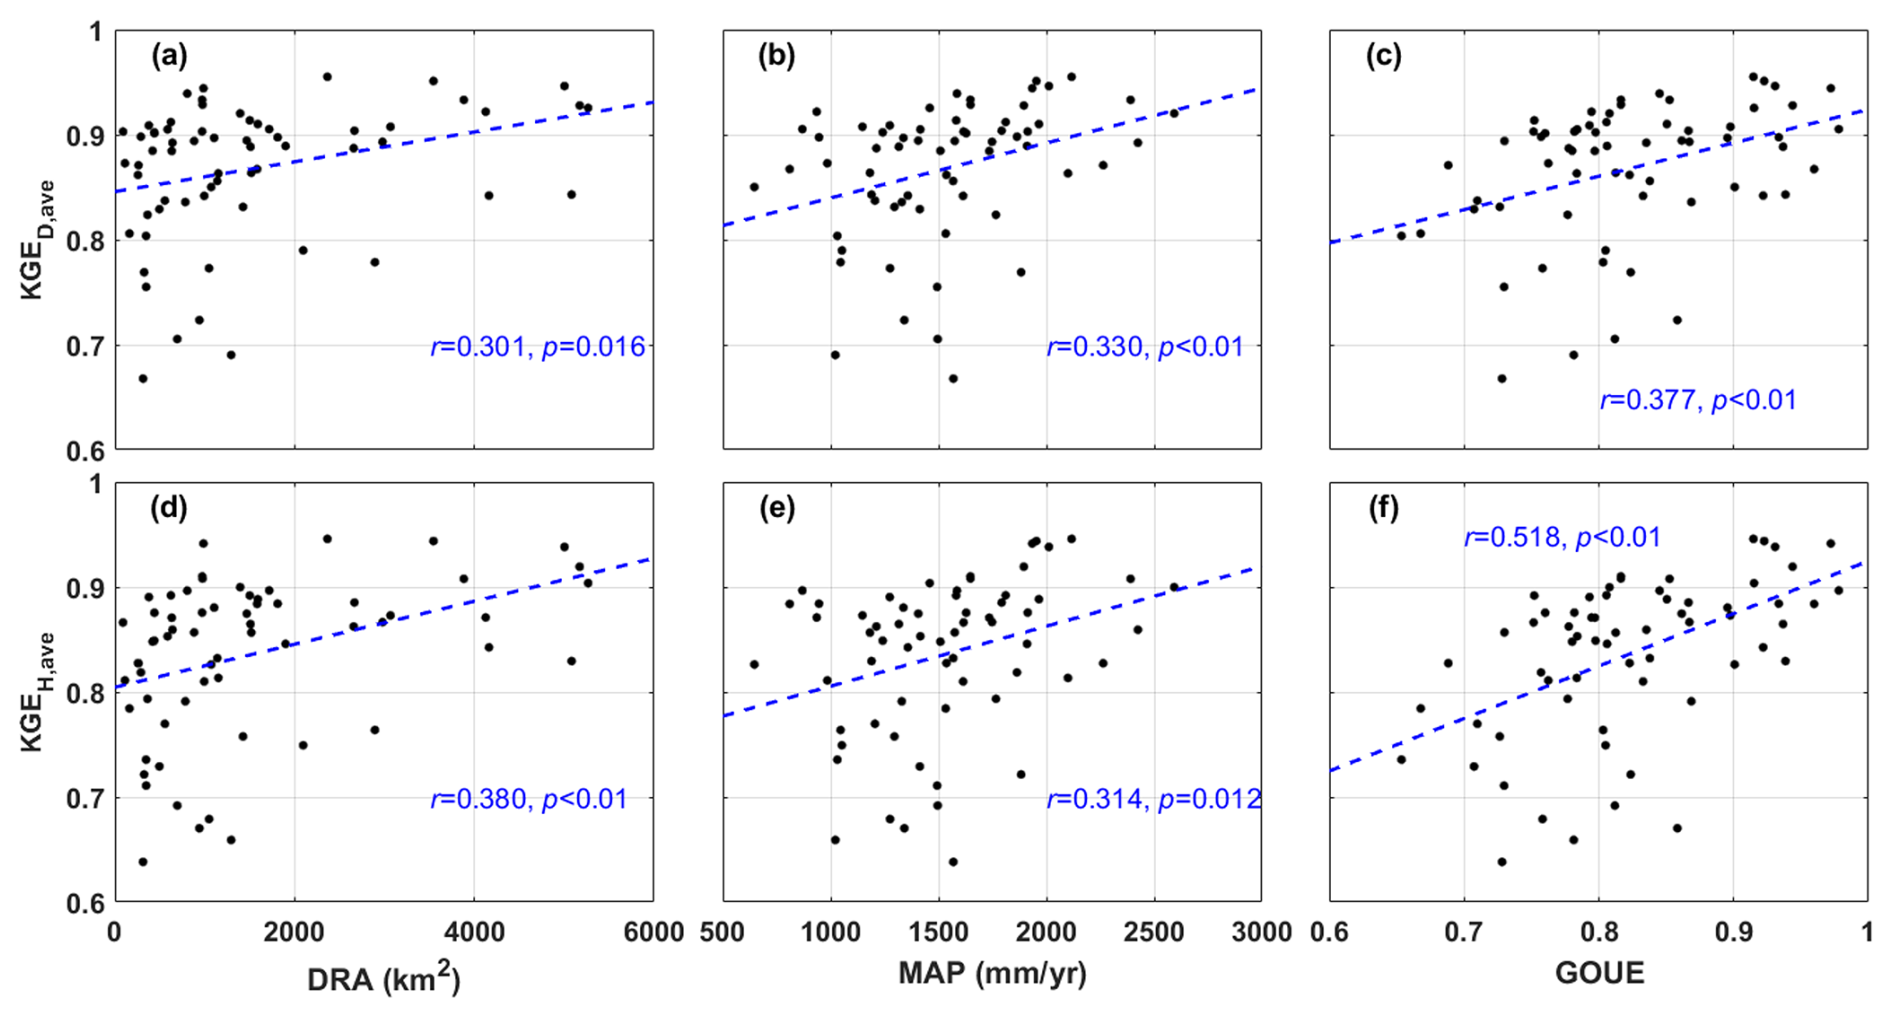
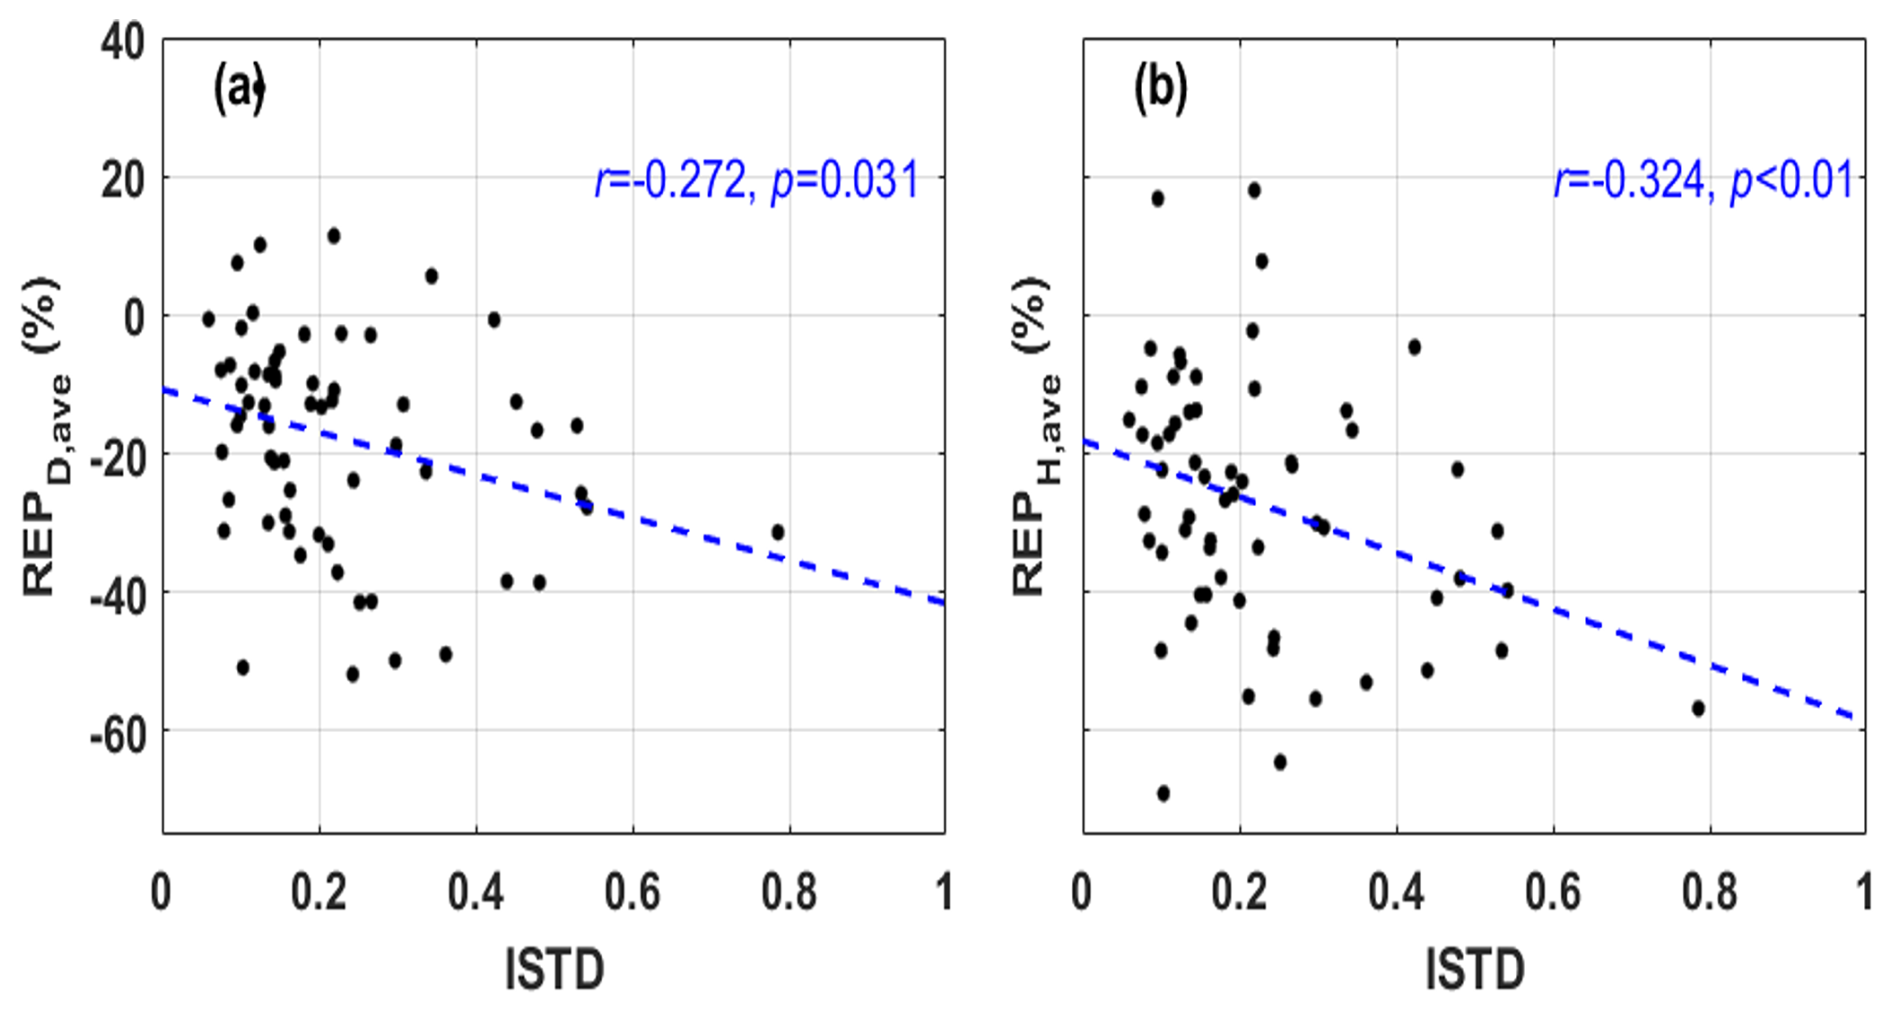
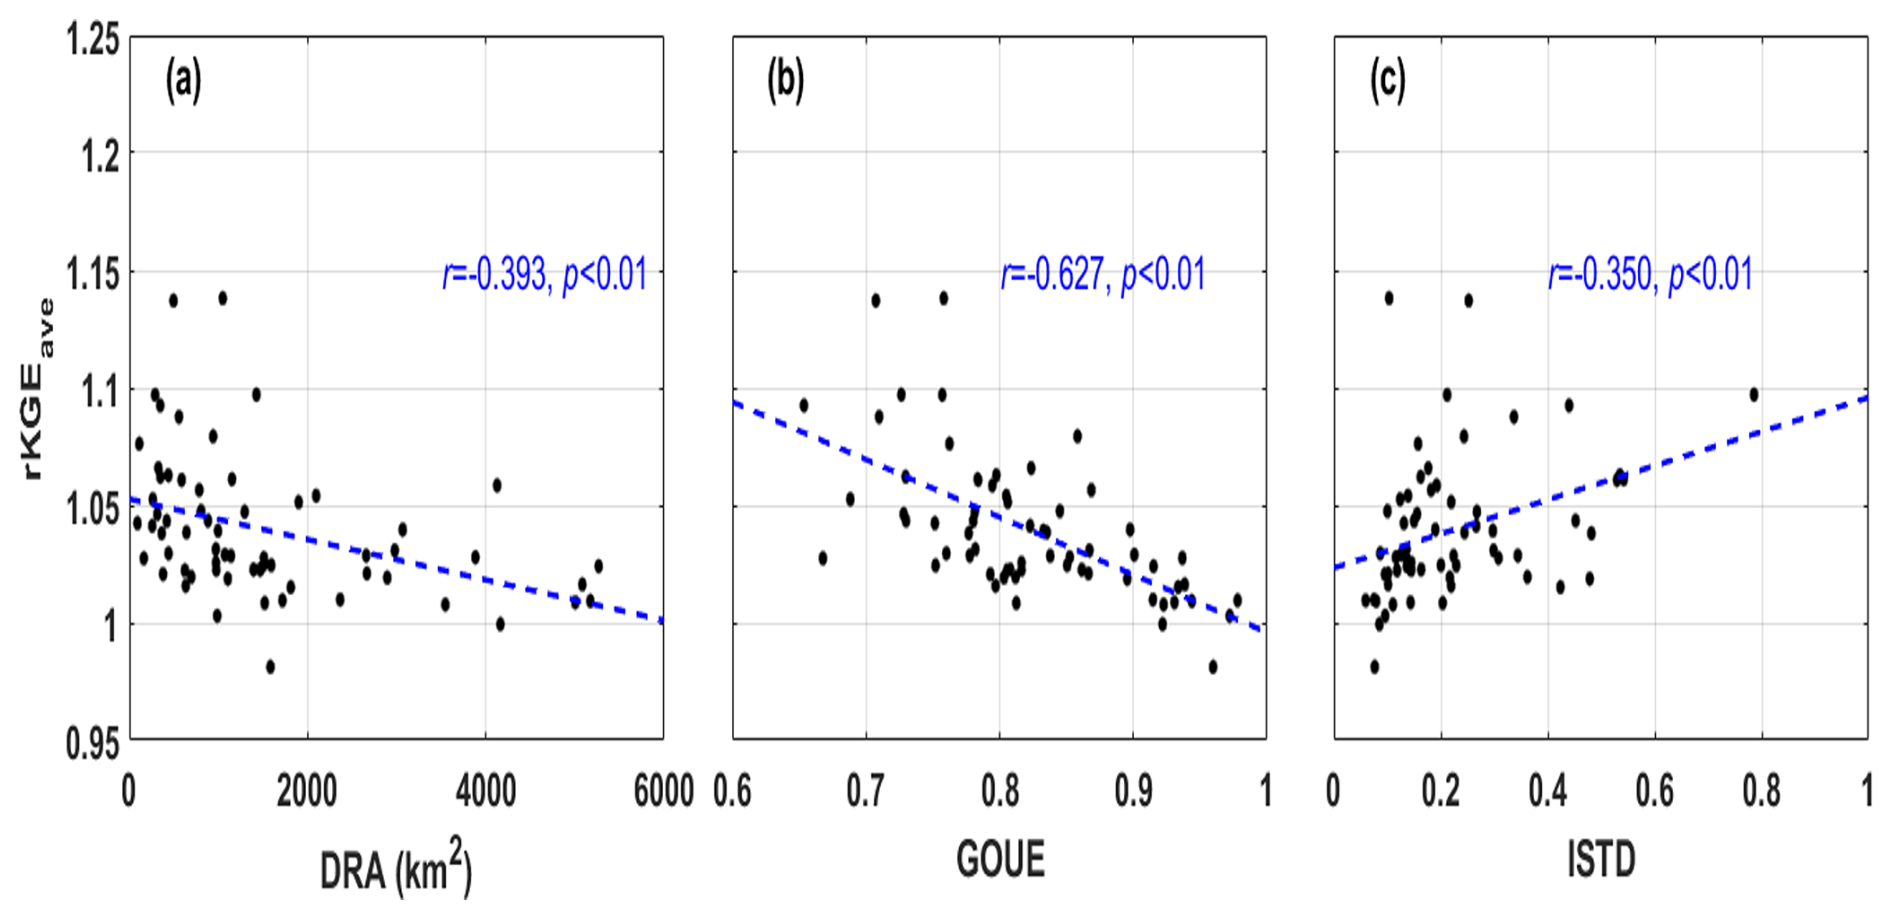
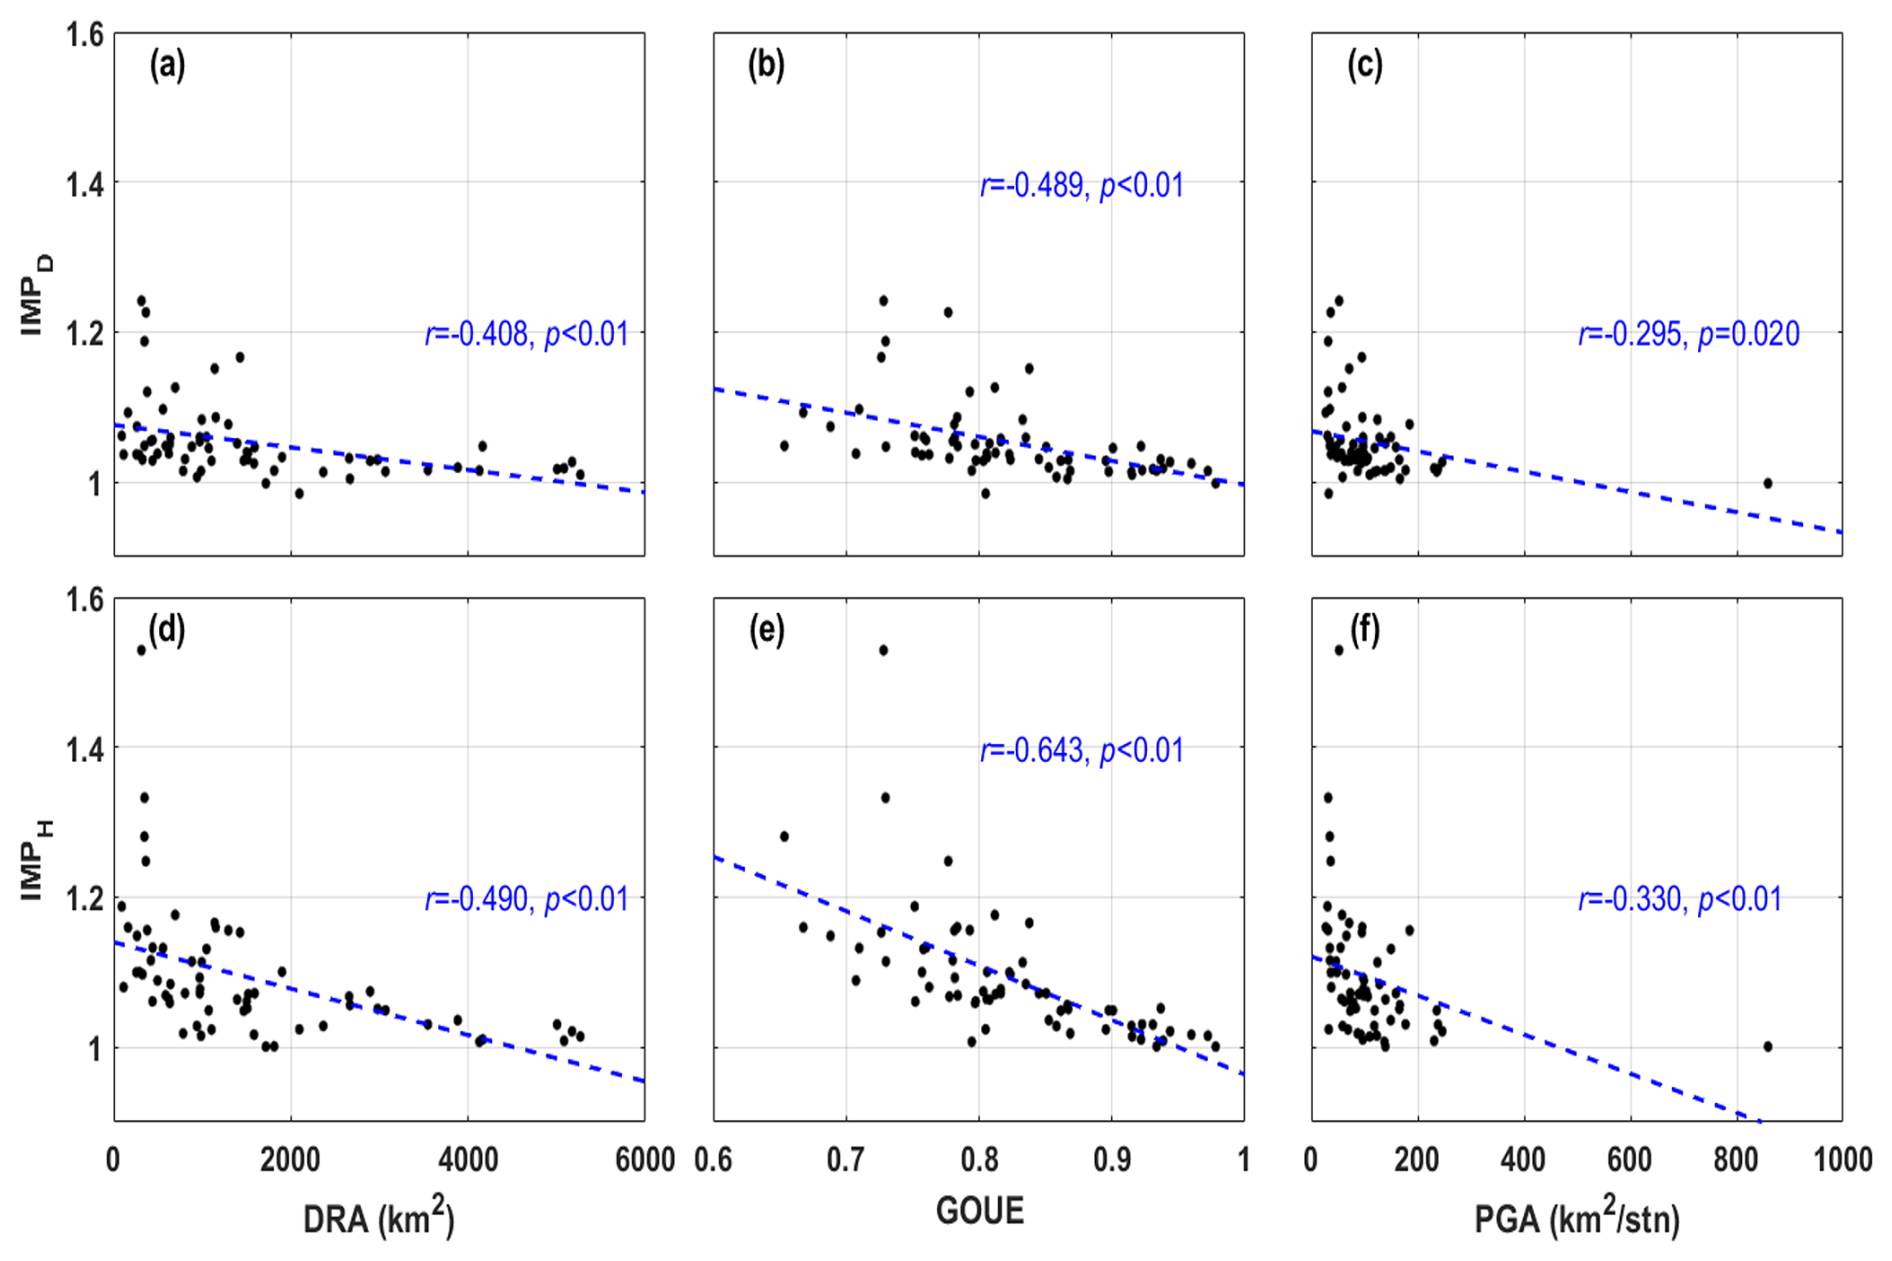
Figure 10 shows the relationship between IMP and the significant influence factors. First, the IMP was negatively correlated with DRA (8 and −0.490 for the daily and hourly tests, p<0.01 for both), indicating that the benefit of sub-daily rainfall and streamflow data was more significant in smaller catchments. This could be attributed to the fast rainfall–runoff response in smaller catchments leading to sharp streamflow variations. The model forced and calibrated by the higher-temporal-resolution data contained more fine-grained information, consequently being more likely to produce a realistic description of hydrological processes and capture the streamflow variations. Second, the IMP was negatively correlated with GOUE ( and −0.643 for daily and hourly tests, p<0.01 for both), and the reason was similar to that of the negative relation between IMP and DRA. Last, the IMP was negatively correlated with RGA (, p=0.020, and , p<0.01 for the daily and hourly tests), indicating that the benefit from higher-resolution data was more significant in catchments with more rain stations, which could provide more detailed and refined rainfall input data and consequently improve model performance.
Table 5Correlation coefficient among evaluation metrics and catchment attributions. Bold values indicate p<0.05, with * denoting 0.01≤p<0.05 and denoting p<0.01.
3.4 Specific insights from representative cases
To further analyze how rainfall and streamflow data at different resolutions specifically influence the hydrological simulation results, we selected three representative catchments based on the hourly test results (IMPH) and sensitive factors such as DRA, GOUE, and RGA, which were identified as having a significant impact on IMPH. These catchments were chosen as representative examples specifically due to their following typical characteristics and the distinct patterns they exhibit in hydrological simulation results, providing valuable insights into the influence of data resolution on model performance:
-
Catchment 1 (Tiantangyan). This catchment, characterized by relatively small DRA, GOUE, and RGA values, showed a significant improvement in simulation results with increased data resolution, as reflected by a large IMP.
-
Catchment 2 (Saitang). With medium values for DRA, GOUE, and RGA, this catchment demonstrated a gradual improvement in KGE as resolution increased, though the gains were less substantial.
-
Catchment 3 (Gaoan). As one of the largest catchments in terms of DRA, with relatively large GOUE and RGA, Gaoan exhibited limited improvement in performance with higher-resolution data, as indicated by a smaller IMP.
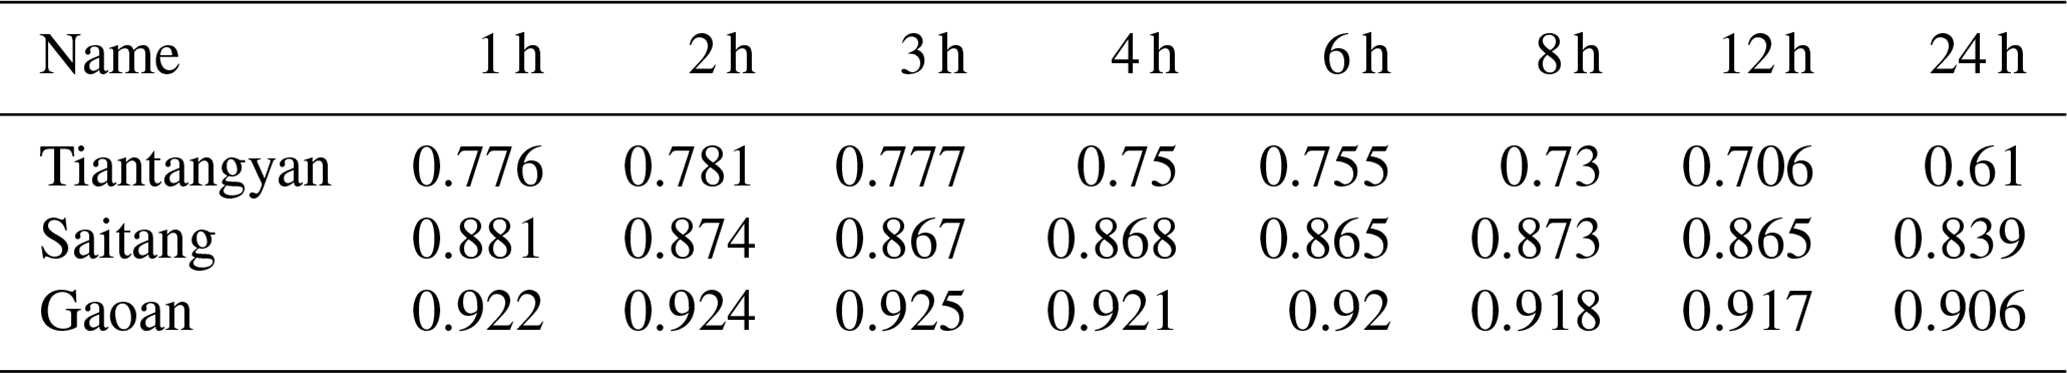
The attributes of these representative catchments are listed in Table 6 (catchment names correspond to the names of the hydrological stations at their respective outlets). The KGE values obtained from data of different resolutions are shown in Table 7.
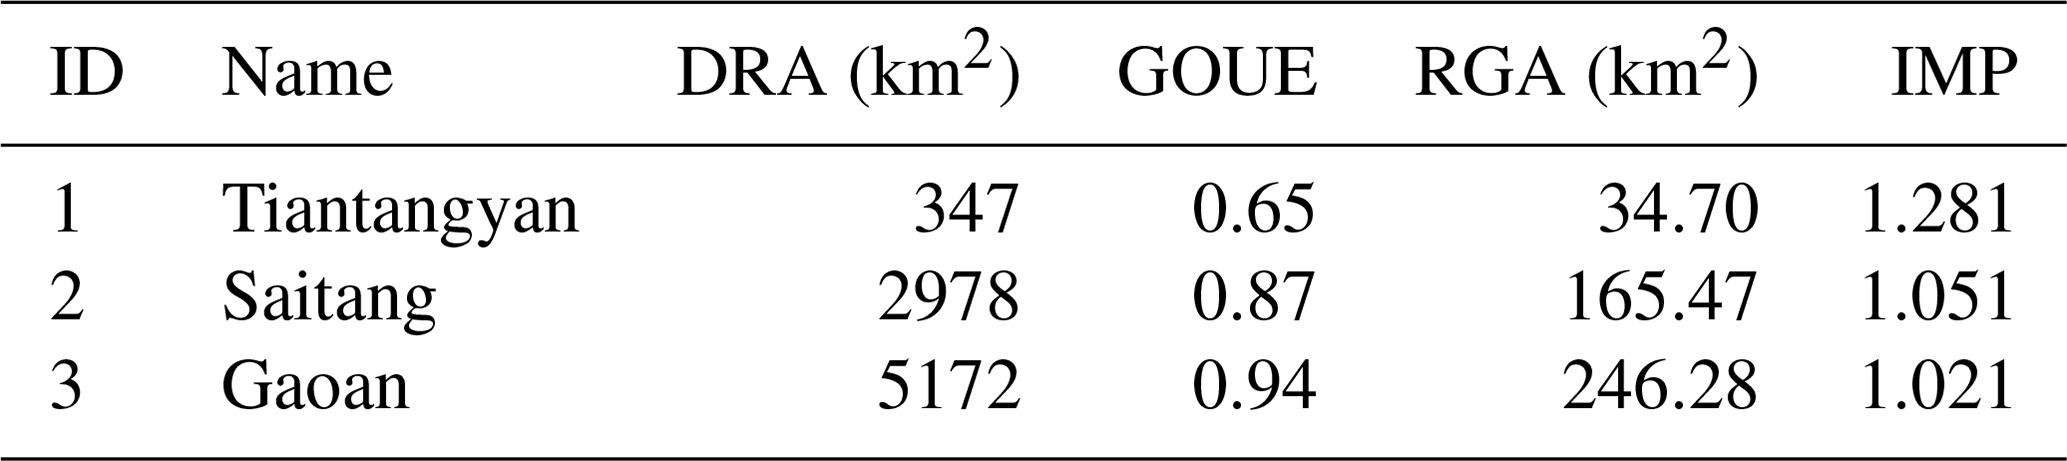
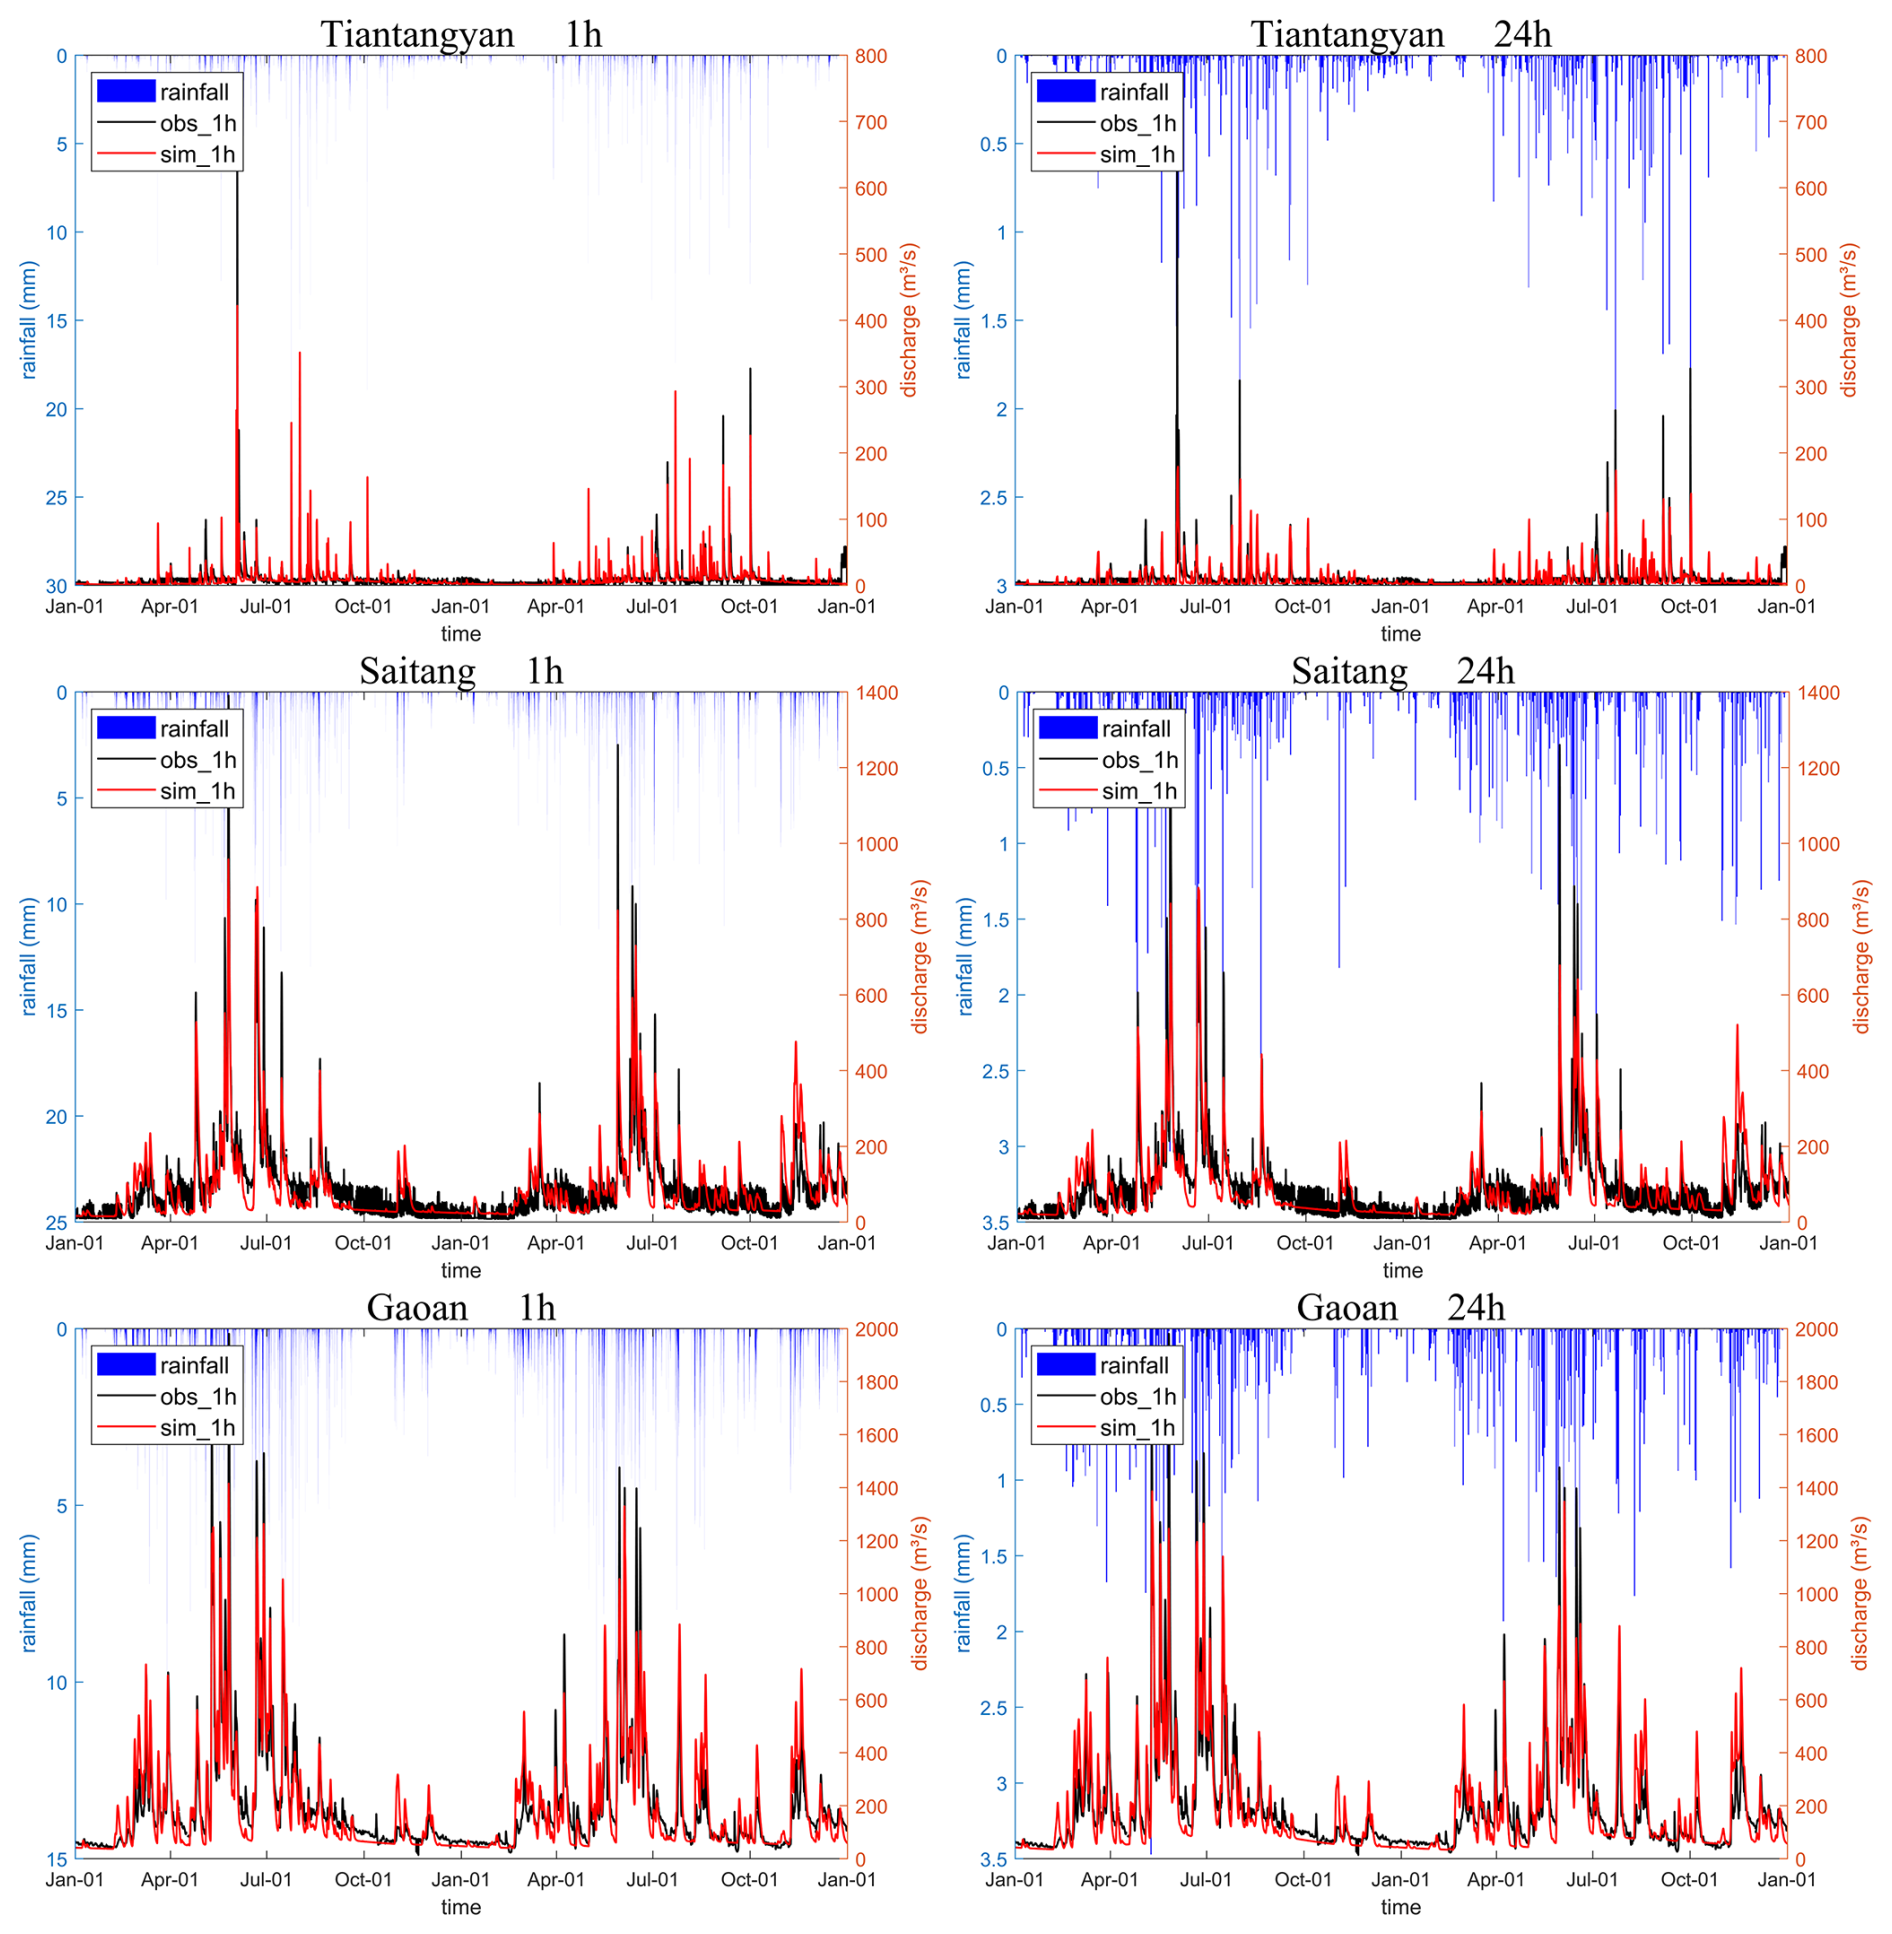
Figure 11Hourly time series of rainfall, simulated flow and observed flow for the representative catchments under 1 and 24 h resolution data for the entire study period (2014–2015). Note that when the original data resolution is 24 h, the rainfall is averaged and resampled to an hourly resolution.
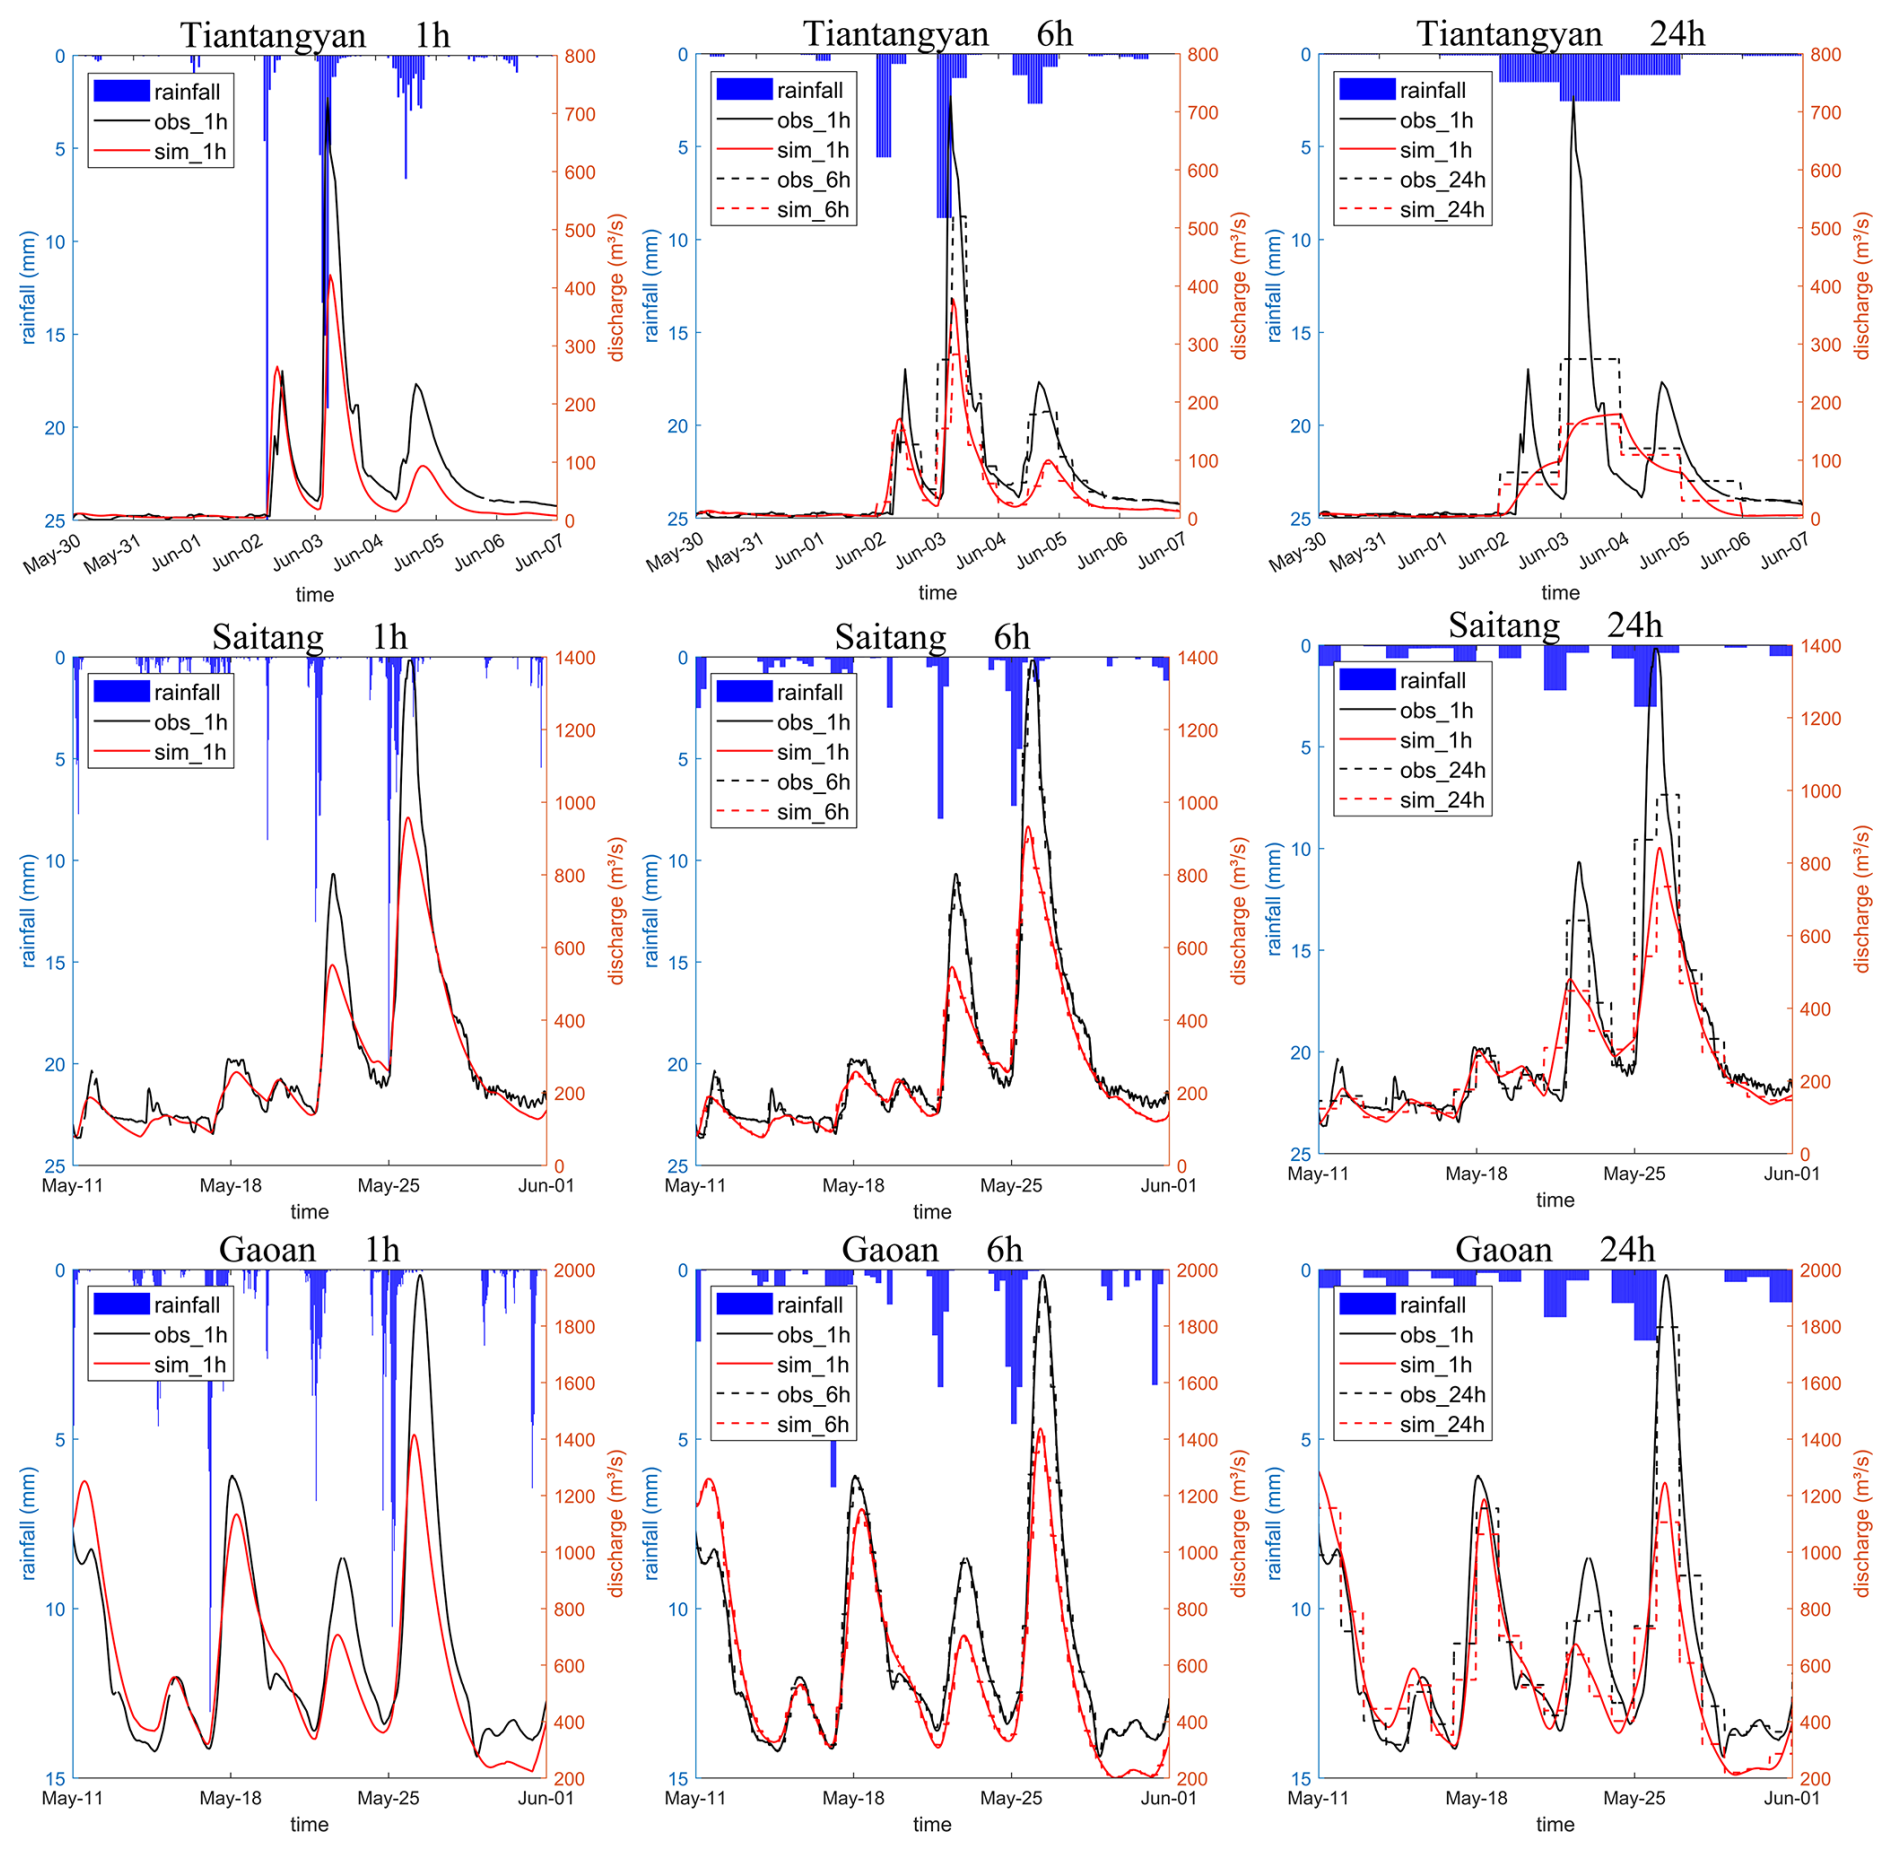
Figure 12Hourly time series of rainfall, simulated flow and observed flow for the representative flood events under 1, 6, and 24 h resolutions. The blue bars indicate the resampled hourly average precipitation for the catchment (used by the model during simulation). The solid red line indicates the hourly simulated flow output from the model. The dashed red line represents the simulated flow aggregated to other time resolutions (6 h or 12 h). The solid black line shows the actual hourly observed flow, and the dashed black line represents the observed flow aggregated to other time resolutions.
Table 7KGE of each representative catchment obtained from data of different resolutions in the hourly test.
The hourly time series of rainfall, simulated flow, and observed flow for the representative catchments under 1 and 24 h resolution data for the entire study period (2014–2015) are shown in Fig. 11. Across all representative catchments and data resolutions, the model successfully simulated the majority of flood events and baseflow. Furthermore, to gain more specific and clear insights into the issue, the flood event with the highest peak flow during the study period was selected as the representative case, and the hydrological time series for 1 or 3 weeks before and after these events are shown in Fig. 12. In particular, the results at 6 h resolution have been added to the figure, as this has been identified as a threshold resolution.
In the case of the Tiantangyan catchment, data at 1 h resolution show that there were three distinct rainfall and corresponding flood events within the period. The streamflow changed rapidly, with each flood lasting less than 1 d, while floods in other basins typically span several days. When using 24 h resolution, it is difficult to distinguish between the three independent rainfall events, resulting in a single flood event lasting 3 d in the simulation. With 6 h resolution, despite some peak discrepancies, both the rainfall and the observed streamflow data closely capture the real rainfall–runoff process, significantly improving simulation accuracy. At 1 h resolution, there is some improvement in peak simulation for the first flood event, with no notable changes in other events.
In the case of the Saitang catchment, the observed flow data at 24 h resolution have large errors compared to the actual 1 h resolution, whereas the measured flows at 6 and 1 h resolutions are very close. Thus, improving the resolution from 24 to 6 h enhanced simulation accuracy significantly, but further increasing it to 1 h offered no substantial improvement as no additional effective information is introduced.
In the case of the Gaoan catchment, the streamflow changes more smoothly in this larger catchment. The observed flow at 24 h resolution already closely approximates actual flow, with the relative error in peak flow being only −8.8 % compared to −62.3 % and −28.9 % for the peak flow errors in the other two catchments. Furthermore, when the resolution of the observed flow is increased to 6 h, it exhibits negligible discrepancy when compared to the data at 1 h resolution. Thus, when using 24 h resolution data, the model performs well on an hourly scale, and continuous improvement in resolution did not lead to a notable increase in simulation accuracy.
4.1 Implication on the measurement of rainfall and streamflow
This study assesses the value of high-resolution rainfall and streamflow data on hydrological modeling. In terms of streamflow simulation at a daily scale, results indicate that increasing the temporal resolution of rainfall data from daily to sub-daily intervals significantly improved the simulation accuracy, aligning with the general expectation of the role of high-resolution data in enhancing predictive performance. However, the improvement in daily streamflow simulation brought by rainfall input data with resolution higher than 8 h was limited. A similar phenomenon was observed in the test of hourly streamflow simulations, and the resolution threshold above which higher resolution brought negligible improvement was 6 h. These findings seemed to contradict intuitive expectations that higher-resolution data consistently benefit hydrological models, but similar results were reported in previous articles across different catchments using various models. For instance, Ficchì et al. (2016) conducted a study of 240 French catchments, utilizing the GR4 rainfall–runoff model forced by rainfall inputs at eight different time steps ranging from 6 min to 1 d, to investigate the extent to which the performance of hydrological modeling is improved by short time step data. Their conclusion is that, on average and within their set of catchments, using shorter model time steps provides no additional value for reference time steps equal to or shorter than 6 h (when evaluating outputs aggregated at the reference timescales). Reynolds et al. (2017) examined the relationship between model performance and the transferability of parameter sets calibrated at various temporal resolutions in two small catchments in Central America, employing the HBV model. They found that parameters calibrated at daily resolution provided peak flow simulations almost as good as parameters calibrated at sub-daily resolutions. Tudaji et al. (2024) investigated the impact of different input data resolutions using a four-source hydrological model in seven catchments in northern China and found that for daily streamflow simulations, improvements in model performance become negligible when the resolution exceeds 12 h. As for hourly streamflow simulations, improvements in overall flood process accuracy become negligible when the resolution of input exceeds 6 h, while higher resolutions further enhance the precision of peak flow simulations.
Although the involved catchments and models differed among different studies, the findings were fundamentally consistent: higher-resolution data did not necessarily guarantee better model performance. There are several reasons that may constrain the additional benefits of higher-resolution data. From a data-driven perspective, first and foremost, due to the spatial and temporal autocorrelation of data such as rainfall and runoff, further increases in resolution beyond a certain threshold may not necessarily yield additional valuable information. The fundamental value of high-resolution data lies in its capacity to introduce novel, accurate, and valuable information, which is essential for enhancing model performance. In this study, the GOUE metric was employed to partially quantify the additional information contributed by high-resolution data. Specifically, GOUE reflects the informational gain of actual hourly resolution data compared to data obtained by uniformly resampling daily-resolution data to an hourly scale. Among various basin characteristics, GOUE exhibited the strongest correlation with IMP, suggesting that basins with greater streamflow variability benefit more from increased data resolution as it introduces more detailed and novel information. This is further supported by the case studies of three representative basins, which vividly demonstrate that the ability of higher-resolution data to provide additional, accurate, and effective information is crucial for realizing its potential to enhance model performance. Secondly, the model's input data, particularly rainfall, might exhibit a lower signal-to-noise ratio at shorter timescales, owing to challenges in data validation and increased uncertainty in areal averaged rainfalls (Obled et al., 2009). Thirdly and specifically in our study, we focus on the value of rainfall and streamflow data, while the resolution of other auxiliary data used in the model is fixed and relatively coarse. The resolution of other driving data, especially for the processes with significant diurnal variations, such as evapotranspiration (currently at daily resolution), could be a factor constraining the model's ability to improve the model's performance at finer temporal scales.
From the perspective of model structure, the model itself may not be well suited to capture the increased complexity of processes at shorter time steps. A real watershed acts as a low-pass filter, smoothing out short-term variability in input data and reducing the sensitivity of runoff to rapid changes (Ficchì et al., 2016). In contrast, hydrological models are simplified representations of actual runoff processes and often lack mechanisms to accurately replicate this natural filtering effect, such as dynamic re-infiltration or flow routing. When high-temporal-resolution data are used to drive these models, the simulated streamflow may exhibit excessive variability because the models directly reflect the rapid fluctuations present in the input data without the smoothing effects inherent in natural systems. This excessive variability can lead to discrepancies between simulated and observed streamflow, ultimately reducing the model's performance. For instance, localized short-duration heavy rainfall may cause infiltration-excess runoff, but during the surface flow routing process over the hillslope, re-infiltration can occur, leading to slower runoff variations (Li et al., 2022; Zhang et al., 2020). Although the hydrological model does not explicitly account for re-infiltration, the use of coarse-resolution data effectively performs a buffering function, which can result in comparable or even better performance than when using high-resolution data. Additionally, Melsen et al. (2016) argued that the calibration and validation time interval should keep up the pace with the increase in spatial resolution in order to resolve the processes that are relevant at the applied spatial resolution. Some simple empirical formulas within the model may not be applicable at shorter timescales.
Considering the limited enhancement in model performance from high-resolution data, which varies across watersheds with different characteristics, this sheds light on the measurement of rainfall and streamflow. As stated by Seibert et al. (2024), “balancing the information content of additional measurements with their costs allows one to allocate resources efficiently, ensuring that you get your money's worth”. When planning new monitoring facilities, it is essential to conduct a preliminary assessment of the value of current monitoring capabilities for building hydrological models and conducting hydrological forecasts based on the forecast objectives, precision requirements, and accuracy of existing data. This assessment can verify the necessity of monitoring and determine the areas where monitoring efforts should be increased based on model and watershed characteristics. For instance, in our study catchments, the benefits of sub-daily resolution data were more pronounced in catchments with a smaller drainage area, stronger intraday streamflow variation, and more existing rainfall gauges. Thus, when conducting hourly hydrological forecasts using the THREW model in this region, it is advisable to increase monitoring efforts and enhance monitoring frequency in catchments with smaller drainage areas or stronger intraday streamflow variation. However, in catchments where the temporal resolutions of rainfall and streamflow data are already higher than 6 h, investing more costs in further increasing measurement resolution may not bring significant improvements to model efficiency. Additionally, the negative correlation between IMP and RGA also offers the implication that when upgrading the model which is based on coarse-temporal-resolution inputs to those with higher temporal resolution, such as switching from daily to hourly data, concurrently increasing rain gauge density can help enhance model performance.
4.2 Limitations
Despite this study employing extensive catchment data and multiple evaluation metrics to derive general conclusions, some potential limitations warrant further consideration. First, this study adopted a specific model, and the selected catchments were mainly distributed in southeastern China with similar climate types due to data availability. The applicability of the conclusions to other climatic regions and models requires further verification. Second, results show that the benefit of high-resolution rainfall/streamflow data for daily and hourly streamflow simulation is negligible when the temporal resolution is higher than a threshold (8 and 6 h for daily and hourly simulation), and the possible mechanism of such a phenomenon is primarily discussed. However, a deeper analysis and validation of such a threshold effect are still lacking, which needs further investigation, such as comparative studies using distributed hydrological models with stronger physical mechanisms and higher resolution. Lastly, the time of the model run during the calibration procedure was limited. Although it proved to be enough to produce a good simulation based on our previous modeling and calibration practice (e.g., Nan and Tian, 2024a, b), it cannot ensure that the globally optimal result could be found. Consequently, it is difficult to determine whether the slightly decreasing model performance in some catchments is caused by high-resolution data or local optimal results.
This study evaluates the impact of high-resolution rainfall and streamflow data on hydrological modeling across 63 small-to-medium-scale catchments in southeastern China. The models utilize data with resolutions ranging from 1 to 24 h for both forcing and calibration, and the influence factors of model performance and improvements brought by high-resolution data are analyzed. Key findings are summarized as follows:
-
Resolution impact on daily simulation. Increasing the resolution of the rainfall from daily (24 h) to sub-daily (12 h) resolution significantly enhanced daily streamflow forecasts, bringing 3 % and 5 % improvement to average KGE and peak flow simulation, respectively. However, rainfall input data with resolutions finer than 8 h showed negligible improvement.
-
Resolution impact on hourly simulation. While sub-daily rainfall and streamflow data significantly improved hourly streamflow simulation compared to daily data, improvements were minimal when the data resolution was finer than 6 h. For the studied catchments, data with a 6 h resolution generally provided adequate confidence for hourly simulations as hourly data.
-
Model performance in varied conditions. Drainage area and intraday streamflow variation are significant influence factors on model performance and benefit of high-resolution data. To specify, the THREW model showed enhanced performance in catchments with larger drainage areas, higher rainfall, and less intraday streamflow variation. Sub-daily resolution data brought greater benefits in catchments with a smaller drainage area, more pronounced intraday flow variation, and higher number of rain gauges.
The data and the code of the THREW model used in this study are available by contacting the authors.
YN and FT conceived the idea; MT and YN conducted the analysis; FT provided comments on the analysis; and all the authors contributed to writing and revisions.
At least one of the (co-)authors is a member of the editorial board of Hydrology and Earth System Sciences. The peer-review process was guided by an independent editor, and the authors also have no other competing interests to declare.
Publisher’s note: Copernicus Publications remains neutral with regard to jurisdictional claims made in the text, published maps, institutional affiliations, or any other geographical representation in this paper. While Copernicus Publications makes every effort to include appropriate place names, the final responsibility lies with the authors.
The authors extend their sincere gratitude to the editor and reviewers for their thoughtful comments, constructive feedback, and guidance throughout the peer-review process, which significantly improved the quality of this paper. We also acknowledge with appreciation the financial support received from the foundations and programs listed below.
This research has been supported by the Fund Program of State Key Laboratory of Hydroscience and Engineering (grant no. sklhseTD-2024-C01), the National Key Research and Development Program of China (grant no. 2022YFC3002900), the National Natural Science Foundation of China (grant no. 52309023), and the Shuimu Tsinghua Scholar Program.
This paper was edited by Yongping Wei and reviewed by four anonymous referees.
Andréassian, V., Perrin, C., Michel, C., Usart-Sanchez, I., and Lavabre, J.: Impact of imperfect rainfall knowledge on the efficiency and the parameters of watershed models, J. Hydrol., 250, 206–223, https://doi.org/10.1016/s0022-1694(01)00437-1, 2001.
Blöschl, G. and Sivapalan, M.: Scale issues in hydrological modelling: A review, Hydrol. Process., 9, 251–290, https://doi.org/10.1002/hyp.3360090305, 1995.
Creutin, J. and Obled, C.: Modelling spatial and temporal characteristics of rainfall as input to a flood forecasting model, IAHS-AISH Publication (129), 41–49, Oxford, Eng., IAHS, 1980.
Cui, T., Li, Y., Yang, L., Nan, Y., Li, K., Tudaji, M., Hu, H., Long, D., Shahid, M., Mubeen, A., He, Z., Yong, B., Lu, H., Li, C., Ni, G., Hu, C., and Tian, F.: Non-monotonic changes in Asian Water Towers' streamflow at increasing warming levels, Nat. Commun., 14, 1176, https://doi.org/10.1038/s41467-023-36804-6, 2023.
Didan, K.: MODIS/Terra Vegetation Indices 16-Day L3 Global 500m SIN Grid V061 [data set], https://doi.org/10.5067/MODIS/MOD13A1.061, 2021.
Eriksson, D., Bindel, D., and Shoemaker, C. A.: pySOT and POAP: An event-driven asynchronous framework for surrogate optimization, arXiv [preprint], https://doi.org/10.48550/arXiv.1908.00420, 2019.
Ficchì, A., Perrin, C., and Andréassian, V.: Impact of temporal resolution of inputs on hydrological model performance: An analysis based on 2400 flood events, J. Hydrol., 538, 454–470, https://doi.org/10.1016/j.jhydrol.2016.04.016, 2016.
Gabellani, S., Boni, G., Ferraris, L., von Hardenberg, J., and Provenzale, A.: Propagation of uncertainty from rainfall to runoff: A case study with a stochastic rainfall generator, Adv. Water Resour., 30, 2061-2071, https://doi.org/10.1016/j.advwatres.2006.11.015, 2007.
Han, D. and Bray, M.: Automated Thiessen polygon generation, Water Resour. Res., 42, https://doi.org/10.1029/2005WR004365, 2006.
Huang, Y., Bárdossy, A., and Zhang, K.: Sensitivity of hydrological models to temporal and spatial resolutions of rainfall data, Hydrol. Earth Syst. Sci., 23, 2647–2663, https://doi.org/10.5194/hess-23-2647-2019, 2019.
Jeong, J., Kannan, N., Arnold, J. G., Glick, R., Gosselink, L., Srinivasan, R., and Harmel, R. D.: Development of sub-daily erosion and sediment transport algorithms for swat, T. Asabe, 54, 1685–1691, https://doi.org/10.13031/2013.39841, 2011.
Jie, M.-X., Chen, H., Xu, C.-Y., Zeng, Q., Chen, J., Kim, J.-S., Guo, S.-L., and Guo, F.-Q.: Transferability of Conceptual Hydrological Models Across Temporal Resolutions: Approach and Application, Water Resour. Manag., 32, 1367–1381, https://doi.org/10.1007/s11269-017-1874-4, 2018.
Kandel, D. D., Western, A. W., and Grayson, R. B.: Scaling from process timescales to daily time steps: A distribution function approach, Water Resour. Res., 41, W02003, https://doi.org/10.1029/2004wr003380, 2005.
Kandel, D. D., Western, A. W., Grayson, R. B., and Turra, H. N.: Process parameterization and temporal scaling in surface runoff and erosion modelling, Hydrol. Process., 18, 1423–1446, https://doi.org/10.1002/hyp.1421, 2004.
Kannan, N., White, S. M., Worrall, F., and Whelan, M. J.: Sensitivity analysis and identification of the best evapotranspiration and runoff options for hydrological modelling in SWAT-2000, J. Hydrol., 332, 456–466, https://doi.org/10.1016/j.jhydrol.2006.08.001, 2007.
Kavetski, D., Fenicia, F., and Clark, M. P.: Impact of temporal data resolution on parameter inference and model identification in conceptual hydrological modeling: Insights from an experimental catchment, Water Resour. Res., 47, W05501, https://doi.org/10.1029/2010wr009525, 2011.
Li, Y., Jiang, Y., Lei, X., Tian, F., Duan, H., and Lu, H.: Comparison of Precipitation and Streamflow Correcting for Ensemble Streamflow Forecasts, Water, 10, 177, https://doi.org/10.3390/w10020177, 2018.
Li, Z., Chen, M., Gao, S., Wen, Y., Gourley, J. J., Yang, T., Kolar, R., and Hong, Y.: Can re-infiltration process be ignored for flood inundation mapping and prediction during extreme storms? A case study in Texas Gulf Coast region, Environ. Modell. Softw., 155, 105450, https://doi.org/10.1016/j.envsoft.2022.105450, 2022.
Melsen, L. A., Teuling, A. J., Torfs, P. J. J. F., Uijlenhoet, R., Mizukami, N., and Clark, M. P.: HESS Opinions: The need for process-based evaluation of large-domain hyper-resolution models, Hydrol. Earth Syst. Sci., 20, 1069–1079, https://doi.org/10.5194/hess-20-1069-2016, 2016.
Mou, L., Tian, F., and Hu, H.: Artificial neural network model of runoff prediction in high and cold mountainous regions: A case study in the source drainage area of Urumqi River, J. Hydroel. Eng., 62–67, https://caod.oriprobe.com/articles/15688549/Artificial_neural_network_model_of_runoff_prediction_in_high_and_cold_.htm (last access: 15 March 2024), 2009.
Muñoz Sabater, J.: ERA5-Land monthly averaged data from 1981 to present, Copernicus Climate Change Service (C3S) Climate Data Store (CDS), https://doi.org/10.24381/cds.68d2bb30, 2019.
Myneni, R., Knyazikhin, Y., and Park, T.: MODIS/Terra Leaf Area Index/FPAR 8-Day L4 Global 500m SIN Grid V061, NASA EOSDIS Land Processes Distributed Active Archive Center [data set], Doi10.5067/MODIS/MOD15A2H.061, 2021.
Nan, Y. and Tian, F.: Glaciers determine the sensitivity of hydrological processes to perturbed climate in a large mountainous basin on the Tibetan Plateau, Hydrol. Earth Syst. Sci., 28, 669–689, https://doi.org/10.5194/hess-28-669-2024, 2024a.
Nan, Y. and Tian, F.: Isotope data-constrained hydrological model improves soil moisture simulation and runoff source apportionment, J. Hydrol., 633, 131006, https://doi.org/10.1016/j.jhydrol.2024.131006, 2024b.
Nan, Y., Tian, L., He, Z., Tian, F., and Shao, L.: The value of water isotope data on improving process understanding in a glacierized catchment on the Tibetan Plateau, Hydrol. Earth Syst. Sci., 25, 3653–3673, https://doi.org/10.5194/hess-25-3653-2021, 2021.
Obled, C., Zin, I., and Hingray, B.: Choix des pas de temps et d'espace pour des modélisations parcimonieuses en hydrologie des crues, La Houille Blanche, 81–87, https://doi.org/10.1051/lhb/2009059, 2009.
Oudin, L., Perrin, C., Mathevet, T., Andréassian, V., and Michel, C.: Impact of biased and randomly corrupted inputs on the efficiency and the parameters of watershed models, J. Hydrol., 320, 62–83, https://doi.org/10.1016/j.jhydrol.2005.07.016, 2006.
Reynolds, J. E., Halldin, S., Xu, C. Y., Seibert, J., and Kauffeldt, A.: Sub-daily runoff predictions using parameters calibrated on the basis of data with a daily temporal resolution, J. Hydrol., 550, 399–411, https://doi.org/10.1016/j.jhydrol.2017.05.012, 2017.
Seibert, J., Clerc-Schwarzenbach, F. M., and van Meerveld, H. J.: Getting your money's worth: Testing the value of data for hydrological model calibration, Hydrol. Process., 38, e15094, https://doi.org/10.1002/hyp.15094, 2024.
Socolofsky, S., Adams, E., and Entekhabi, D.: Disaggregation of daily rainfall for continuous watershed modeling, J. Hydrol. Eng., 6, 300–309, https://doi.org/10.1061/(asce)1084-0699(2001)6:4(300), 2001.
Sun, Y., Tian, F., Yang, L., and Hu, H.: Exploring the spatial variability of contributions from climate variation and change in catchment properties to streamflow decrease in a mesoscale basin by three different methods, J. Hydrol., 508, 170–180, https://doi.org/10.1016/j.jhydrol.2013.11.004, 2014.
Tian, F., Hu, H., Lei, Z., and Sivapalan, M.: Extension of the Representative Elementary Watershed approach for cold regions via explicit treatment of energy related processes, Hydrol. Earth Syst. Sci., 10, 619–644, https://doi.org/10.5194/hess-10-619-2006, 2006.
Tian, F., Hu, H., and Lei, Z.: Thermodynamic watershed hydrological model: Constitutive relationship, Sci. China Ser. E, 51, 1353–1369, https://doi.org/10.1007/s11431-008-0147-0, 2008.
Tudaji, M., Nan, Y., and Tian, F.: Assesing the Value of High-Resolution Data and Parameters Transferability Across Temporal Scales in Hydrological Modeling: A Case Study in Northern China, EGUsphere [preprint], https://doi.org/10.5194/egusphere-2024-2966, 2024.
Viglione, A., Chirico, G. B., Komma, J., Woods, R., Borga, M., and Bloschl, G.: Quantifying space-time dynamics of flood event types, J. Hydrol., 394, 213–229, https://doi.org/10.1016/j.jhydrol.2010.05.041, 2010.
Xu, M., Fralick, D., Zheng, J. Z., Wang, B., Tu, X. M., and Feng, C.: The differences and similarities between two-sample t-test and paired t-test, Shanghai Archives of Psychiatry, 29, 184–188, https://doi.org/10.11919/j.issn.1002-0829.217070, 2017.
Xu, R., Hu, H., Tian, F., Li, C., and Khan, M. Y. A.: Projected climate change impacts on future streamflow of the Yarlung Tsangpo-Brahmaputra River, Glob. Planet. Change, 175, 144–159, https://doi.org/10.1016/j.gloplacha.2019.01.012, 2019.
Yamazaki, D., Ikeshima, D., Tawatari, R., Yamaguchi, T., O'Loughlin, F., Neal, J. C., Sampson, C. C., Kanae, S., and Bates, P. D.: A high-accuracy map of global terrain elevations, Geophys. Res. Lett., 44, 5844–5853, https://doi.org/10.1002/2017GL072874, 2017.
Younis, J., Anquetin, S., and Thielen, J.: The benefit of high-resolution operational weather forecasts for flash flood warning, Hydrol. Earth Syst. Sci., 12, 1039–1051, https://doi.org/10.5194/hess-12-1039-2008, 2008.
Yu, B., Cakurs, U., and Rose, C. W.: An assessment of methods for estimating runoff rates at the plot scale, T. ASABE, 41, 653–661, https://doi.org/10.13031/2013.17233, 1998.
Zhang, J., Lin, P., Gao, S., and Fang, Z.: Understanding the re-infiltration process to simulating streamflow in North Central Texas using the WRF-hydro modeling system, J. Hydrol., 587, 124902, https://doi.org/10.1016/j.jhydrol.2020.124902, 2020.
Zhao, R., Wang, P., and Hu, F.: Relations between parameter values and corresponding natural conditions of Xinanjiang Model, Journal of Hohai University, 20, 52–59, 1992.