the Creative Commons Attribution 4.0 License.
the Creative Commons Attribution 4.0 License.
 | 15 Apr 2025
Can large-scale tree cover change negate climate change impacts on future water availability?
Anne J. Hoek van Dijke
Caspar T. J. Roebroek
The availability of fresh water over land may become increasingly scarce under climate change (CC), and natural and human-induced tree cover changes can further enhance or negate the water scarcity. Previous studies showed that global tree cover change can have large impacts on water availability under current climate conditions, but they did not touch upon the implications of global tree cover change under climate change. Here, we study the hydrological impacts of large-scale tree cover change (climate-induced changes in combination with large-scale afforestation) in a future climate (SSP3-7.0) following an interdisciplinary approach. By combining data from five Coupled Model Intercomparison Project phase 6 (CMIP6) climate models with a future potential tree cover dataset, six Budyko models, and the UTrack moisture recycling dataset, we can disentangle the impacts of climate change and future tree cover change on evapotranspiration, precipitation, and runoff. We quantify per grid cell and for five selected river basins (Yukon, Mississippi, Amazon, Danube, and Murray–Darling) if tree cover changes can enhance or counteract the climate-driven changes in runoff due to their impact on evapotranspiration and moisture recycling. Globally averaged, the impacts of climate change and large-scale tree cover change on runoff can be of similar magnitude with opposite signs. While climate change may increase global runoff, we estimate that tree cover change could reverse this effect, which may result in a limited net impact on global runoff relative to the present climate and current tree cover. Nevertheless, the local changes in runoff due to tree cover change and climate change can be substantial, with increases and decreases of more than 100 mm yr−1. We show that, for approximately 16 % of the land surface, tree cover change can increase the water availability significantly. However, for 14 % of the land surface, both tree cover change and climate change could decrease water availability by more than 5 mm yr−1. For each of the selected catchments, the direction and magnitude of the impacts of climate change and tree cover change can vary, with dominating climate change impacts in all basins except the Mississippi River basin. Our results show that ecosystem restoration projects targeting an altered tree cover should consider the corresponding hydrological impacts to limit unwanted (non-)local reductions in water availability.
- Article
(6096 KB) - Full-text XML
- BibTeX
- EndNote


Forests play an important role in, among others, the conservation of biodiversity, the reduction in soil erosion, and the mitigation of climate change (CC) (Herrick et al., 2019). Therefore, there have been many local and global initiatives to increase tree cover, such as the Bonn Challenge, Grain for Green, the 20×20 Initiative, the Billion Tree Campaign, and AFR100. Climate change, especially climatic drying, has consequences for the ability to restore forests. At the same time, large-scale forest restoration has major impacts for local and global water availability and can reduce water availability in water-scarce regions (Hoek van Dijke et al., 2022).
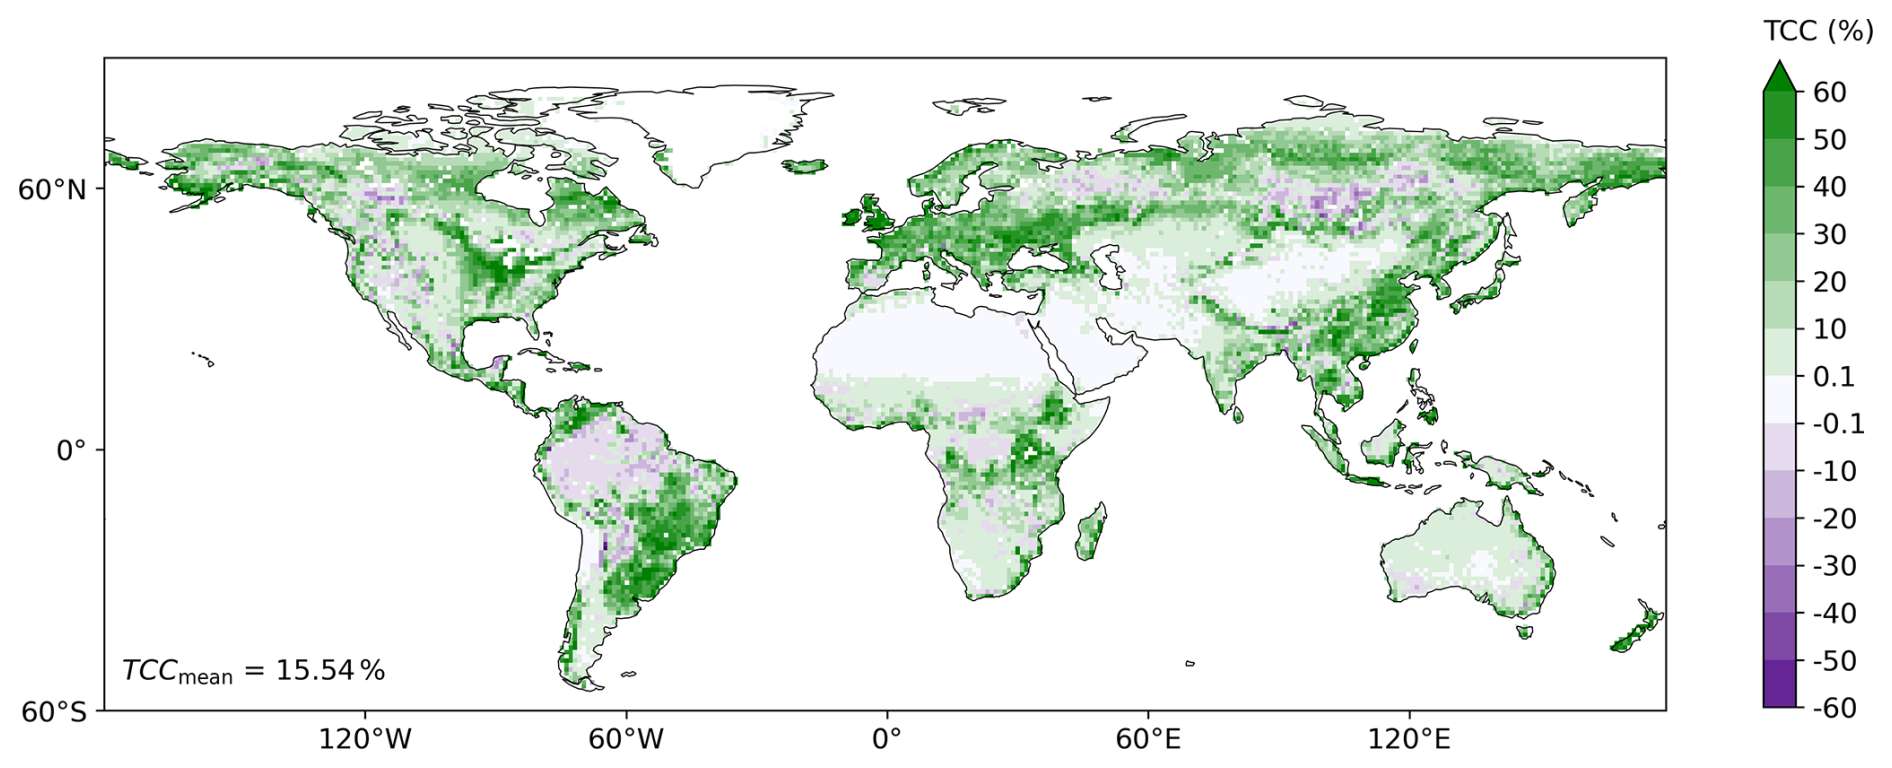
Figure 1Tree cover change (TCC) in percentages; the TCC is defined as the difference between the potential tree cover in a future climate (2041–2060) and the tree cover in a present climate (2000). For the future potential tree cover, we use the average potential tree cover data based on bioclimatic variables, derived from the outputs of five CMIP6 models (CMCC-ESM2, INM-CM5-0, IPSL-CM6A-LR, MIROC6, and UKESM1-0-LL) under climate change pathway SSP3-7.0.
Over the past decades, both climate warming and land cover changes have impacted global freshwater availability by changing evaporation and precipitation (Fahrländer et al., 2024). While recent climate warming likely enhanced global evaporation and precipitation over land (Douville et al., 2021), the simultaneous changes in land cover showed contrasting impacts on evaporation. For example, land cover changes that occurred between 1950 and 2000 decreased evaporation by 5 % (Sterling et al., 2013), whereas, from the 1980s onwards, global vegetation greening increased evaporation by 3.7 % (Yang et al., 2023). Teuling et al. (2019) showed that both climate warming and land cover changes impacted evaporation over Europe with large regional differences. For instance, while evaporation increased by more than 15 % between 1960 and 2010, it decreased for parts of southern Europe (Teuling et al., 2019). Furthermore, the greening of vegetation in China enhanced the yearly precipitation due to an increase in convective precipitation (Yu et al., 2020). These changes in evaporation and precipitation have impacted streamflow globally (Sterling et al., 2013; Teuling et al., 2019; Piao et al., 2007; Wang-Erlandsson et al., 2018) and have thereby affected the occurrence of floods and droughts, the production of hydropower, and the availability of drinking and irrigation water. However, the projected increases in climate warming and land cover changes in the (near) future could impact the water fluxes and availability even further.
Since climate warming can increase the energy available for evaporation and enhances the moisture-holding capacity of air, these effects are expected to further increase evaporation, mean precipitation, and extreme precipitation events (Trenberth, 2011). At the same time, the future holds longer periods of dry spells and droughts in many regions (Milly and Dunne, 2016); therefore water scarcity will likely increase for a growing fraction of land, impacting many lives and ecosystems (Caretta et al., 2022).
The combination of climate warming and human interventions, such as afforestation and deforestation, can affect the global tree cover in a future climate. Roebroek et al. (2025) recently calculated a future potential tree cover, representing the maximum number of trees that could grow on Earth given the climate and soil characteristics, for different climate pathways. The study found that a warmer climate can support tree growth in the colder high latitudes, whereas increasing aridity is expected to reduce the forest cover in the American and African tropics (see Fig. 1, showing the differences between the present and future potential tree covers). At the same time, there is a strong global incentive to increase tree cover due to the benefits for climate mitigation, ecosystem restoration, and conservation of species (Bastin et al., 2019; Griscom et al., 2017). Roebroek et al. (2025) showed that global climate change decreases the overall global potential for tree restoration; however, the tree-carrying capacity is 55 % above the current tree cover. This estimation of potential tree cover change under climate change allows us to study the combined effects of future global warming and tree cover change on water availability. In this study, the term “water availability” refers to the remaining precipitation water after evapotranspiration takes place, i.e. the water available for (human) consumption purposes, on a yearly basis.
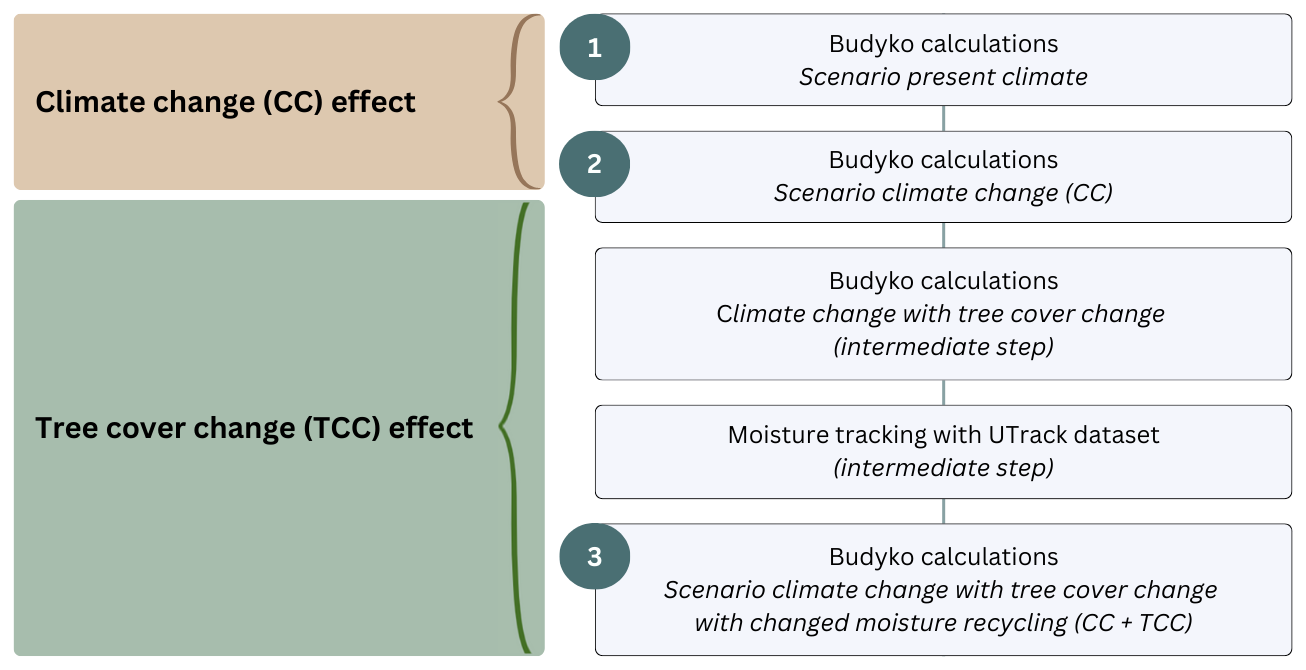
Figure 2Simplified overview of the research methodology. This figure shows the research scenarios – (1) scenario present climate, (2) scenario climate change (CC), and (3) scenario climate change with tree cover change with changed moisture recycling (CC + TCC) – and the intermediate research steps. A detailed overview of the input and output data for each research step can be found in Table 1.
Changes in tree cover impact local and regional water availability through their effect on evapotranspiration and precipitation (Ellison et al., 2017; Hoek van Dijke et al., 2022; King et al., 2024; Zhang et al., 2022a). Forest evapotranspiration is higher compared to evapotranspiration from short vegetation and bare land (Zhang et al., 2001), since trees increase the availability of energy (through albedo) and water (through their deep rooting systems) for evapotranspiration and increase the aerodynamic conductance. In addition, trees can impact precipitation directly by locally increasing convection and turbulence in the atmosphere, while trees can also affect precipitation indirectly by enhancing the recycling of evaporated moisture both locally and regionally (Meier et al., 2021; Ellison et al., 2017; De Hertog et al., 2023; Wang-Erlandsson et al., 2018). Therefore, future forest restoration projects can potentially be used to increase water availability in water-scarce regions (Staal et al., 2024b).
The previous literature has already explored the effects of climate change and large-scale tree cover change; nevertheless, uncertainty persists regarding the separate and combined impacts on global water availability in a future climate. Tuinenburg et al. (2022) analysed how the current potential tree cover on a global scale could mitigate future drying trends; however, this study only focused on global precipitation and did not consider an altered potential tree cover in a future climate. King et al. (2024) applied a global forestation scenario in one Earth system model and found regional reductions in water availability up to 15 %. More local studies showed that, in mountainous catchment areas, climate-driven changes in vegetation could mitigate or reverse the climate-driven increases in runoff (Rasouli et al., 2019). Another example is that, in northern China, the soil water availability decreased before 2000 and increased afterwards due to climate change and vegetation greening, although the effect of vegetation greening was minor compared to the climate change effect (Douville et al., 2021). Given the remaining uncertainties, a global comprehensive analysis regarding the impacts of tree cover and climate change, and their separate contributions, is needed to help to secure freshwater availability in the future and to support strategic tree restoration planning.
Here, we study the combined and separate impacts of climate change and large-scale tree cover change on terrestrial evaporation, precipitation, and runoff worldwide. We take a data-driven interdisciplinary approach, by combining tree cover maps with Budyko models and projected climate data from the Coupled Model Intercomparison Project phase 6 (CMIP6), to calculate present and future water fluxes. The future climate data are obtained for the Shared Socioeconomic Pathway (SSP) with an intermediate to strong climate change signal (SSP3-7.0). This climate pathway involves high greenhouse gas emissions which result in an average increase in global surface air temperature of 1.4° for 2041–2060 relative to 1995–2014 (Lee et al., 2021). Our implemented tree cover change scenario represents the tree cover carrying capacity under climate pathway SSP3-7.0 and includes natural changes in tree cover and human-induced large-scale tree planting. In this study, we compare the impacts of climate change and tree cover change on water fluxes over land and analyse where these effects can enhance or counteract each other on the grid cell level and at catchment scale. For five selected catchments, we provide insight on whether climate or large-scale tree cover change can be a dominant driver of water availability change in a future climate.
Table 1Detailed overview of the research methodology showing the input and output data for each of the research steps. The abbreviations are as follows. P: precipitation from CMIP6; Ep: potential evapotranspiration from CMIP6; E: evapotranspiration; Q: runoff. Furthermore, “mean” refers to the mean flux over the CMIP6–Budyko models, and “SD” refers to the standard deviation of the flux over the CMIP6–Budyko models. Note that five CMIP6 models and six Budyko models result in 30 CMIP6–Budyko combinations for E and Q. The general research methodology is adopted from Hoek van Dijke et al. (2022). For more information about the datasets and their sources, Table A1 provides an overview of the datasets used within our study.
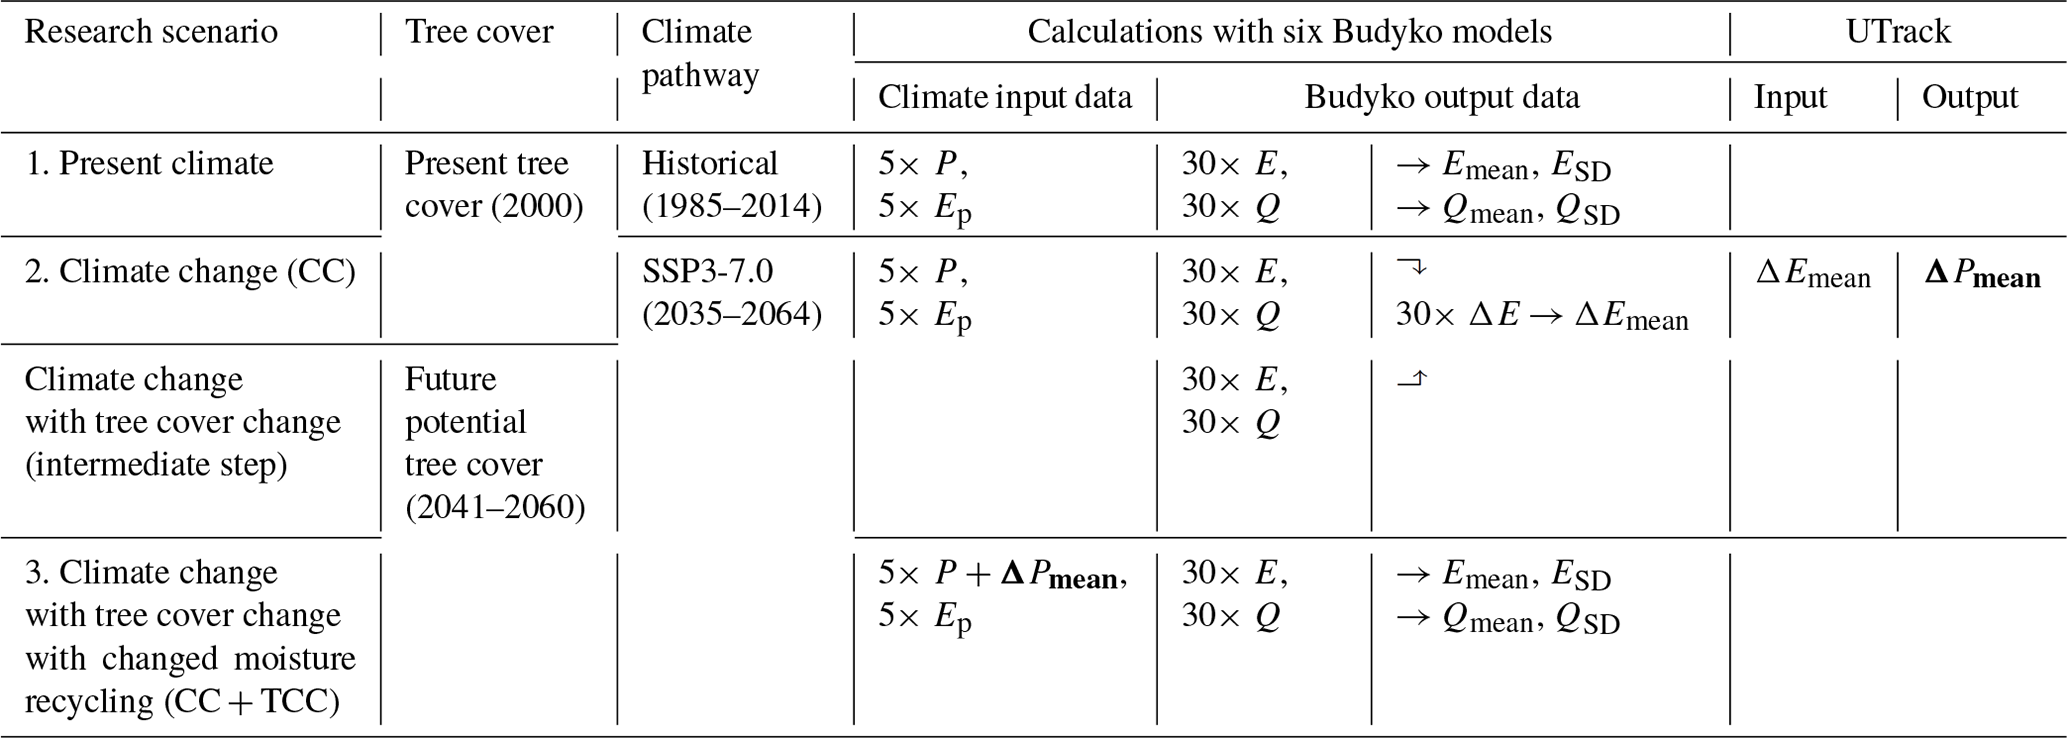
There are three research scenarios that guide this work to investigate the impact of climate change and tree cover change on the hydrological fluxes precipitation (P), evapotranspiration (E), and runoff (Q; also referred to as water availability). These three scenarios are (1) scenario present climate, (2) scenario climate change (CC), and (3) scenario climate change with tree cover change and moisture recycling change (CC + TCC) (Fig. 2, Table 1). We calculate the effects of climate change as the difference between scenario present climate and scenario CC, and we calculate the effects of tree cover change as the difference between scenario CC and scenario CC + TCC (Fig. 2). For each research scenario, we use P and potential evapotranspiration (Ep) datasets from five CMIP6 climate models (Sect. 2.1), along with a tree cover dataset (Sect. 2.2), as input for the Budyko model calculations (Sect. 2.3) to generate E and Q fluxes. Furthermore, scenario CC + TCC includes the (non-)local indirect effects of changes in E and P by accounting for an altered moisture recycling, obtained with the moisture-tracking dataset UTrack (Sect. 2.4). We therefore build on the general research methodology from Hoek van Dijke et al. (2022), extending their approach to assess the hydrological effects of climate and tree cover change under future climate conditions. All datasets in our study are reprojected to a spatial resolution of 1° × 1° to ensure compatibility with the spatial resolution of the UTrack dataset. In addition, datasets with a time dimension are aggregated to yearly averaged data for the use of the Budyko models. A simplified overview of the main research steps is illustrated in Fig. 2, and a detailed research overview is shown in Table 1. The analyses in this study are performed at a global scale and for five river basins: the Yukon River basin, the Mississippi River basin, the Amazon River basin, the Danube River basin, and the Murray–Darling River basin.
2.1 Climate input data from CMIP6 climate models
Five global climate model simulations from CMIP6 are selected to provide P and Ep datasets for the different research scenarios in this study. For the present climate scenario, climate data are obtained from historical CMIP6 simulations for the time interval 1985–2014, and, for the future climate scenarios, data are used from ScenarioMIP simulations under climate change pathway SSP3-7.0 for 2035–2064 (Table 1) (O'Neill et al., 2016). The P datasets are retrieved directly from the CMIP6 models; however, due to the limited availability of global Ep output from CMIP6 models for climate pathway SSP3-7.0, we use the Ep datasets provided by Bjarke et al. (2023a). Bjarke et al. (2023a) calculated Ep with the Priestley–Taylor method (Priestley and Taylor, 1972) based on the sensible and latent heat fluxes, mean surface air temperature, and surface air pressure for which data were directly retrieved from selected CMIP6 climate models for both the historical and ScenarioMIP simulations.
Lovato et al. (2022)Volodin et al. (2017)Boucher et al. (2020)Tatebe et al. (2019)Sellar et al. (2019)Table 2Overview of the models from phase 6 of the Coupled Model Intercomparison Project (CMIP6) from which climate data for precipitation (P) and potential evapotranspiration (Ep) were used in this study. The climate data are obtained for variant label “r1i1p1f1” for all models, except for UKESM1-0-LL, for which “r1i1p1f2” is used due to data availability restrictions, meaning that a different forcing dataset was used for this model simulation in UKESM1. The long × lat resolution in the table refers to the horizontal resolution for the longitude and latitude dimensions within the global dataset.
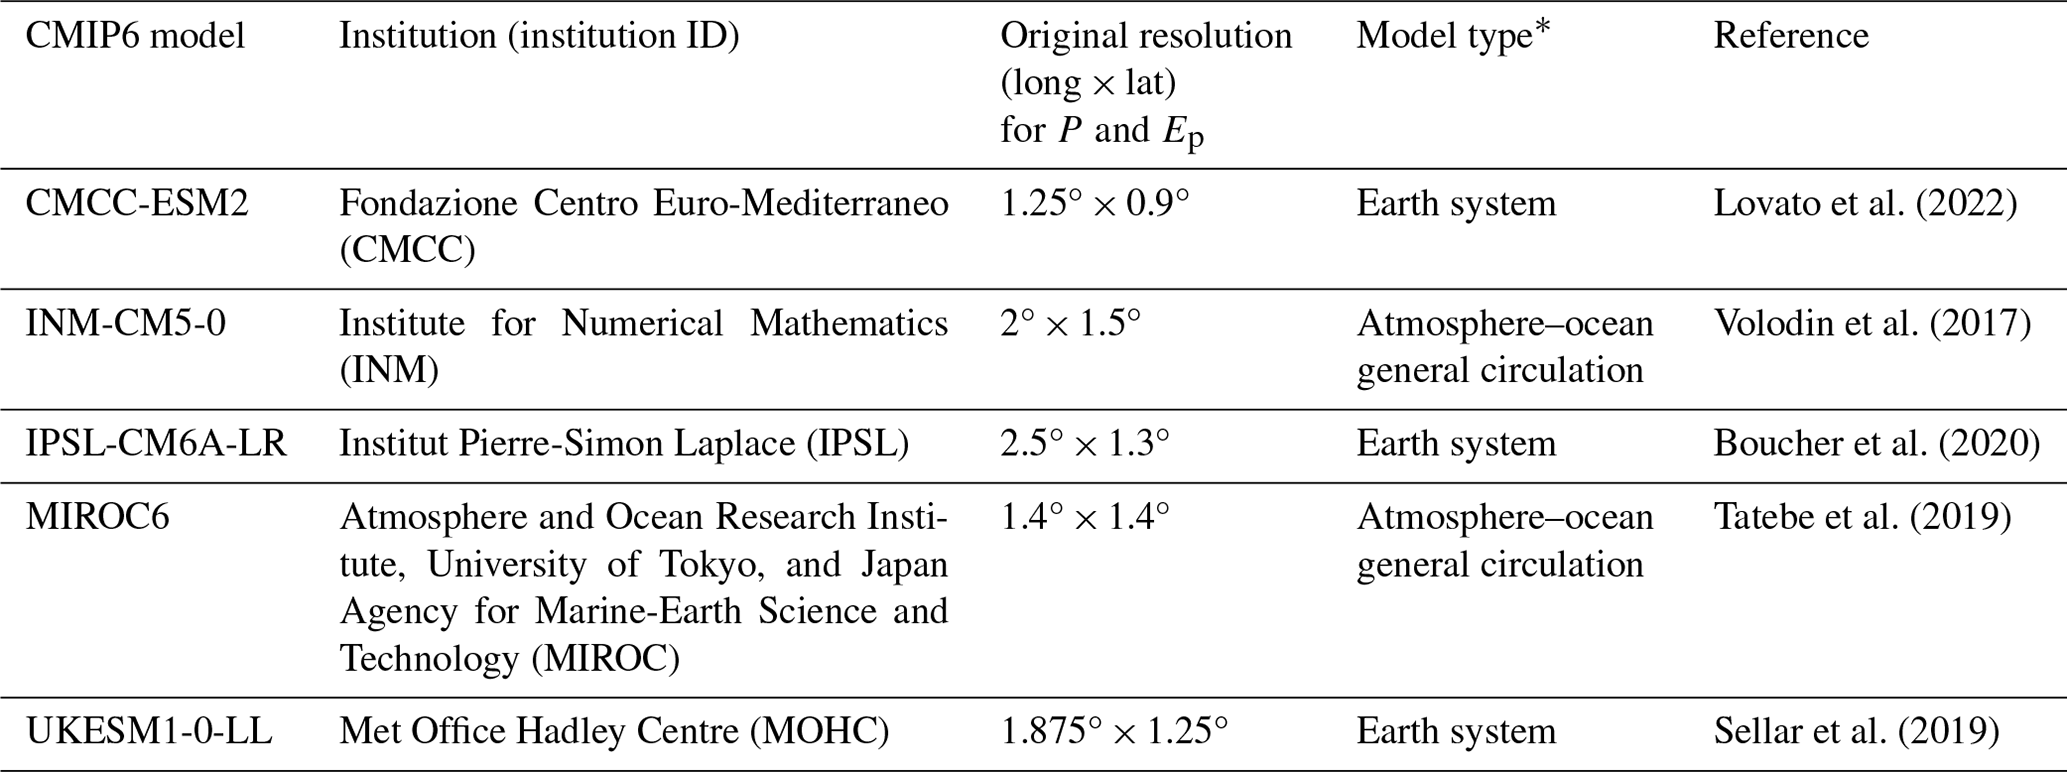
∗ As classified by Kuma et al. (2023).
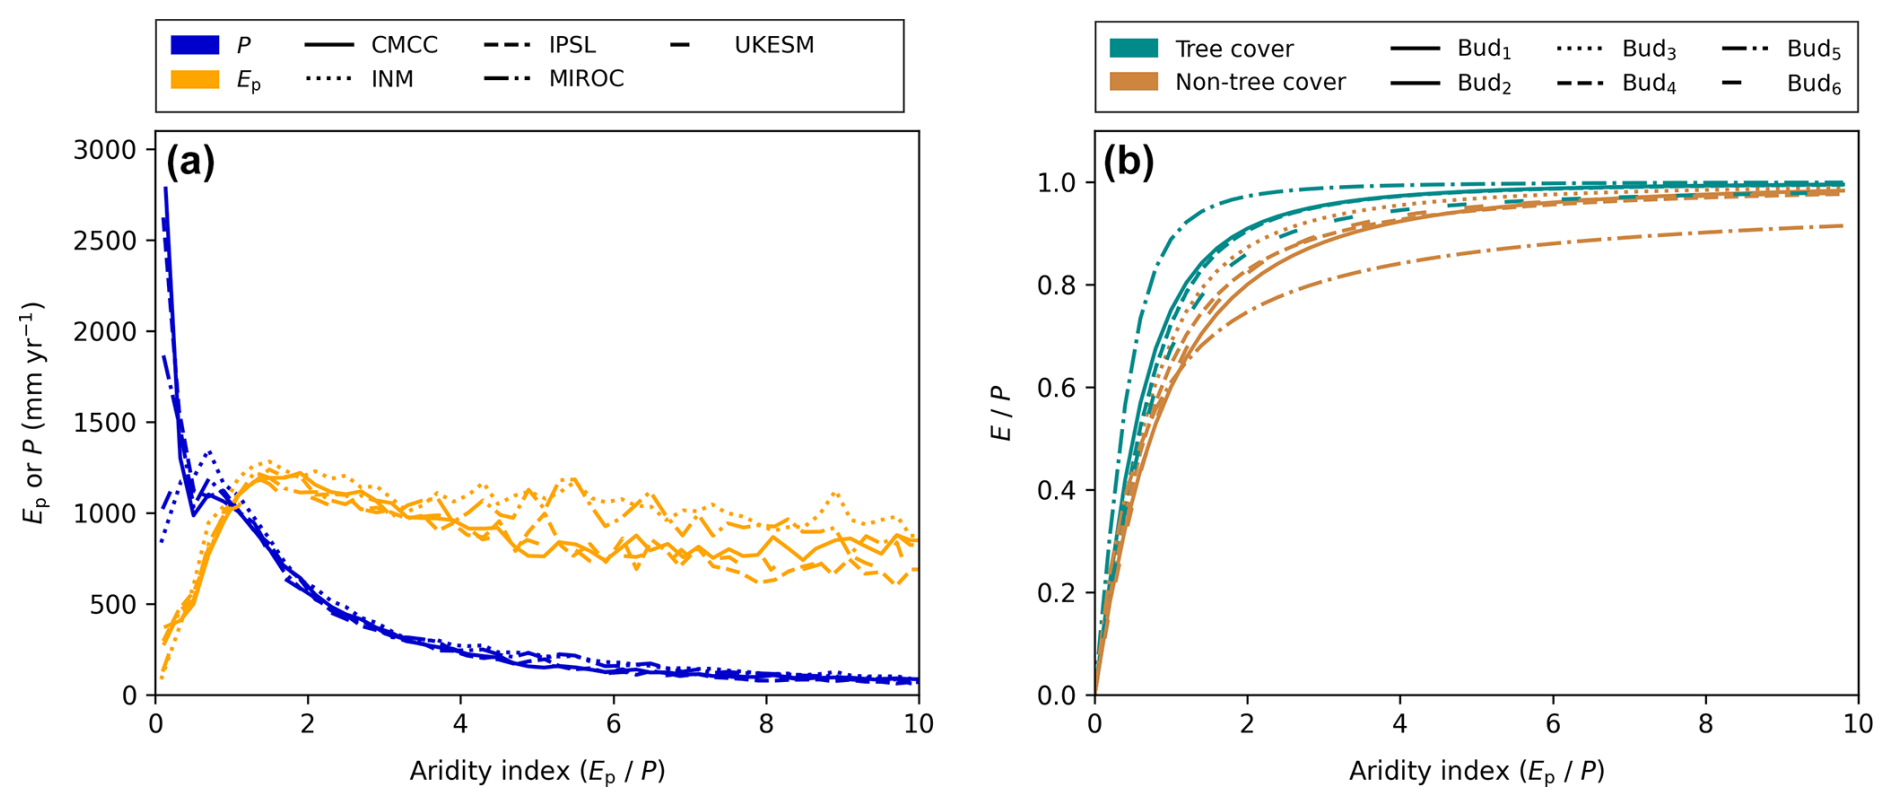
Figure 3Illustration of variability over the CMIP6 and Budyko models in relation to the aridity index (). (a) Variability in terrestrial precipitation (P) and potential evapotranspiration (Ep) fluxes for five CMIP6 models (CMCC-ESM2, INM-CM5-0, IPSL-CM6A-LR, MIROC6, and UKESM1-0-LL) under climate change pathway SSP3-7.0. (b) Variability in the evapotranspiration over precipitation ratio () for tree cover and non-tree cover for six Budyko (Bud) models; the numbering of these models is consistent with the numbering in Table A2.
The five CMIP6 models in this study are selected based on the following criteria: (1) the model should have Ep output provided by Bjarke et al. (2023a) and a future tree cover dataset for ScenarioMIP SSP3-7.0 from Roebroek et al. (2025) (Sect. 2.2); (2) the spatial resolution of the CMIP6 model data should be close to the 1° × 1° spatial resolution used in this study; (3) the absolute percentual bias of the calculated historical Ep compared to the ERA5Land dataset, as provided in Table 2 from Bjarke et al. (2023a), should be smaller than 10 %; and (4) from each institute, only one CMIP6 model is selected. The aforementioned criteria result in the selection of five CMIP6 models (CMCC-ESM2, INM-CM5-0, IPSL-CM6A-LR, MIROC6, and UKESM1-0-LL), for which an overview is provided in Table 2.
The monthly P () and Ep (mm d−1) datasets are aggregated to yearly data and averaged over a 30-year period (mm yr−1) as indicated in Table 1. These yearly mean P and Ep datasets are used as input for the Budyko calculations (Table 1 and Sect. 2.3). Note that large water bodies, the Antarctic region, and most of Greenland are masked out.
To gain insight into the differences between the five climate models, Fig. 3a shows Ep and P over land in relation to the aridity index () for a future climate. The variability between the models is highest for terrestrial P over humid regions, ranging from 837 mm yr−1 in the INM model to 2782 mm yr−1 in the CMCC model (Fig. 3a). The high variability in P between CMIP6 models over wet regions is also underlined by Yazdandoost et al. (2021) for historical data. The model spread for humid regions is also present for Ep; however, the largest variability for Ep is found over arid regions.
2.2 Tree cover datasets
In this study, two tree cover datasets are applied: (1) a present tree cover dataset used for scenario present climate and scenario CC and (2) a future potential tree cover dataset, representing the maximum tree-carrying capacity under the studied climate pathway, which is used for scenario CC + TCC (Table 1). For the present tree cover, we use the global tree cover dataset for the year 2000 provided by Hansen et al. (2013), which is generated with Landsat satellite data. For the future potential tree cover dataset, we use a dataset by Roebroek et al. (2025) that predicts the tree cover carrying capacity for different climate scenarios and is adjusted for the natural occurrence of disturbances (e.g. forest fires, windthrow, insect outbreaks). These tree cover data, here referred to as “future potential tree cover” for simplicity, are created by integrating the previously mentioned tree cover (Hansen et al., 2013) and climate characterisations from the WorldClim V2 dataset (Fick and Hijmans, 2017) in a machine learning framework. Note that the dataset represents the natural capacity of the Earth to support trees and would thus allow tree restoration on agricultural or urban land. In this study, we retrieved the future potential tree cover datasets for the time range 2041–2060 under climate pathway SSP3-7.0 for each of the five selected CMIP6 models (Sect. 2.1) to create an averaged future potential tree cover dataset for scenario CC + TCC. The future potential tree cover maps represent a shorter time period (20 years) than the climatological data (30 years), as the future potential tree cover maps are only available for 20-year periods (Roebroek et al., 2025). We assume that the tree cover datasets for both the present and the future time period consist of mature trees.
The tree cover change illustrates the differences between the two tree cover datasets, which is calculated by subtracting the present tree cover from the future potential tree cover (Fig. 1). Globally, there is an average increase in tree cover of 15.5 %. Decreases in tree cover are found over the Amazon, in northwestern North America, and in middle northern Eurasia.
2.3 Budyko model calculation
For each research scenario, yearly mean E and Q are calculated using the Budyko framework (Budyko, 1974), following the approach used by Hoek van Dijke et al. (2022) and Teuling et al. (2019). This approach was tested by Hoek van Dijke et al. (2022), whereby the mean streamflow (Q) obtained with Budyko model calculations for the present climate was validated with observational data for 19 large river basins. A Budyko model describes the long-term mean partitioning of P into E and Q as a function of aridity (Fig. 3b) and has a general form such as
where is the fraction of precipitation partitioned into evaporation, is the aridity index, and ω is a model parameter. Previous studies have shown that ω is closely related to vegetation type (e.g. Zhang et al., 2001). In our study, we use an ensemble of six different Budyko models that have a different model formulation but represent a similar curve (Fig. 3, with model equations in Table A2; Zhang et al., 2001, 2004; Zhou et al., 2015; Teuling et al., 2019; Oudin et al., 2008). Each of these Budyko models was calibrated with lysimeter or streamflow data originating from different river basins, thereby representing different vegetation types (e.g. plantation/natural vegetation or deciduous/evergreen forest) and climate conditions. Therefore, we include multiple Budyko models for our global-scale calculations to represent the spread between different models and minimise potential biases related to, for example, climate conditions. After calculating the fraction with a Budyko model, the fraction is obtained by rewriting a simplified water balance for a multi-year timescale () to . In this study, E and Q are calculated by using P and Ep datasets from the five CMIP6 models in combination with the fractional tree cover from the present and the future potential tree cover datasets following Table 1. For each grid cell, values for E and Q are calculated as a fraction of tree-covered and non-tree-covered surfaces relative to their occurrence in the grid cell.
Figure 3b shows the variability between the six Budyko models for a theoretical fraction in relation to a theoretical aridity index () for (non-)tree-covered surfaces. The figure shows that there can be pronounced variability between the different Budyko models; however, it is also shown that, for all models, a larger fraction of P is evaporated for tree-covered surfaces compared to non-tree-covered surfaces. The combined variability in the climate input data from the CMIP6 models (Fig. 3a) and the variability between the Budyko models (Fig. 3b) provide an uncertainty estimate for the calculated E and Q in this study.
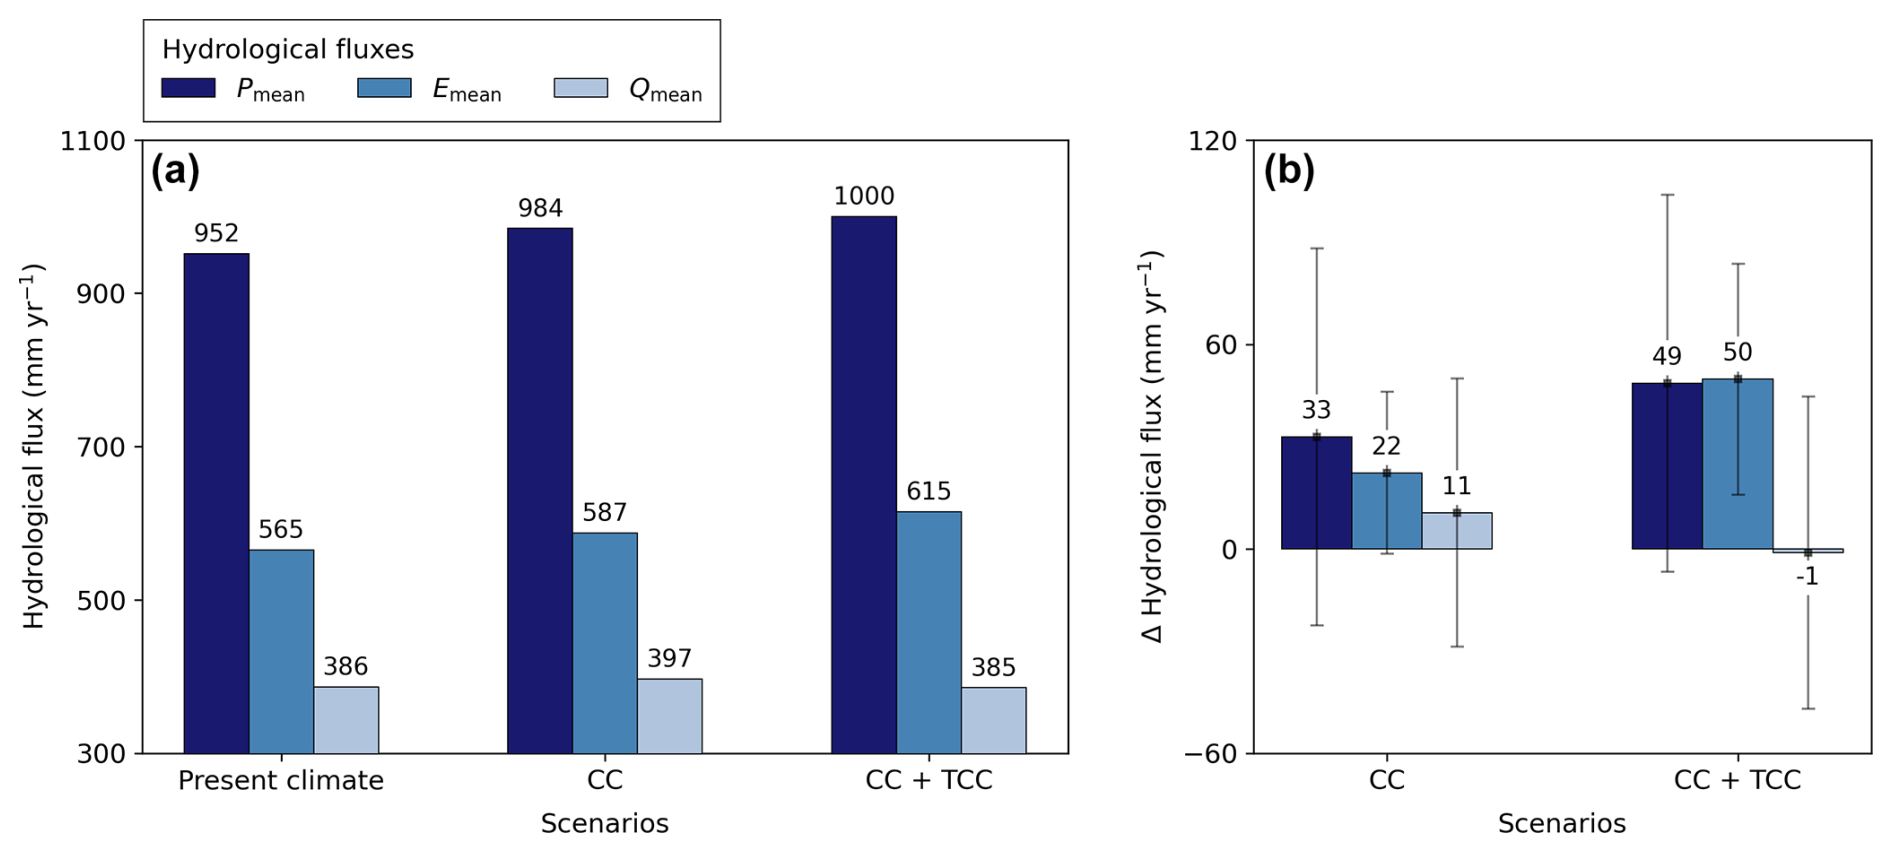
Figure 4Overview of the terrestrial hydrological fluxes precipitation (P), evapotranspiration (E), and runoff (Q) for the scenarios of present climate, climate change (CC), and climate change with tree cover change (CC + TCC). (a) Average fluxes over land for each scenario, averaged over the CMIP6/CMIP6–Budyko models, in mm yr−1. (b) Average change (Δ) in flux for each scenario relative to the present climate in mm yr−1. The corresponding standard deviations display the variability over the CMIP6/CMIP6–Budyko models. The E and Q flux changes were calculated for each of the 30 CMIP6–Budyko model combinations, generating 30 Δflux values for each land grid cell from which the mean and standard deviation were computed. Note that this figure shows the weighted averages over the total land surface area and that these averages are displayed as rounded values (for more details, see Table A3).
2.4 UTrack moisture-tracking dataset
Following large-scale tree cover change, the increase in terrestrial E will increase the (terrestrial) P both locally and remotely through moisture recycling. In scenario CC + TCC we account for this local and remote change in P by using the UTrack dataset, created by Tuinenburg et al. (2020a), in which the moisture recycling is quantified per grid cell (please note that there is a potential issue with the water balance, as noted by De Petrillo et al., 2024). This dataset is generated by combining ERA5 reanalysis data with UTrack, a Lagrangian model that tracks the transport of moisture through the atmosphere (Tuinenburg and Staal, 2020). The UTrack dataset contains atmospheric moisture trajectories, averaged over 2008–2017 (Tuinenburg et al., 2020a), that show the transport of evaporated moisture from a source location to precipitated moisture at a target location. The UTrack datasets are available at 0.5° and 1° spatial resolutions; however, we utilise the coarser spatial resolution of 1° × 1°, as the datasets of the selected CMIP6 models in our study are only available at relatively coarse spatial resolutions (Table 2). We retrieved the data for each month of the year and aggregated these monthly moisture trajectories to the yearly timescale. The yearly average moisture trajectories were used to calculate how the mean tree-cover-driven change in E affects the global P flux (Table 1). The use of yearly trajectories was preferred over monthly trajectories, since the Budyko approach is only valid on multi-year timescales. Hoek van Dijke et al. (2022) showed that temporal aggregation of UTrack, rather than temporal disaggregation of Budyko, resulted in similar patterns for moisture recycling. It should be noted that altering the tree cover creates a feedback loop where a change in terrestrial E can in turn affect the (terrestrial) P, which again impacts E, although the impact on both fluxes becomes increasingly smaller for each cycle. In this study, the changed moisture recycling is calculated twice for scenario CC + TCC, and the impacts of the changed moisture recycling on the P, E, and Q fluxes are relatively small after the UTrack dataset is applied the second time (Tables A3 and A4).
We underline that the UTrack dataset represents current atmospheric conditions (Tuinenburg et al., 2020a); therefore, this study does not account for possible changes in moisture recycling due to changes in circulation which result from climate change. The UTrack dataset also does not include the feedbacks of an altered tree cover, even though tree cover change can impact the atmospheric conditions and circulation (De Hertog et al., 2023; Portmann et al., 2022; Davin and de Noblet-Ducoudré, 2010; Duveiller et al., 2018). Nevertheless, most moisture-tracking models that are currently available rely on meteorological reanalysis data; thus these models are only valid under current climate and land cover conditions. Hence, given the unavailability of a moisture-tracking dataset for a future climate and the approach of combining climate datasets instead of actively running a global climate model, this study relies on the UTrack dataset for the future moisture recycling. The implications of this approach are further discussed in Sect. 4.
3.1 Global mean impact of climate change and future tree cover change on hydrological fluxes
Firstly, we compare our global mean hydrological fluxes over land for the present climate with multi-model outcomes from CMIP6, after which we discuss the impacts of the climate change (CC) and climate change with tree cover change (CC + TCC) scenarios. For the present climate scenario, the mean fluxes in this study are 565 mm yr−1 for E over land and 386 mm yr−1 for Q (Fig. 4a). Our mean value of E exceeds the 90 % confidence range for the multi-model averages over land by IPCC of 482–544 mm yr−1, obtained with 32 CMIP6 models for 1995–2014, whereas our mean Q value is consistent with its corresponding range of 179–460 mm yr−1 (Douville et al., 2021). Note that our mean terrestrial P flux of 952 mm yr−1 also slightly exceeds the multi-model range of 723–942 mm yr−1 by Douville et al. (2021). This indicates that the hydrological fluxes for our present climate scenario (1985–2014) for the five selected CMIP6 models in this study are at the higher end of the multi-model range.
Under climate change (scenario CC), the terrestrial P increases by 33 ± 55 mm yr−1 and terrestrial E increases by 22 ± 24 mm yr−1, resulting in an average increase for Q of 11 ± 39 mm yr−1 (Fig. 4b, Table A3). The E and Q flux differences relative to the present climate were calculated for each of the 30 CMIP6–Budyko model combinations, generating 30 Δflux values for each land grid cell, after which the mean and standard deviation were computed for each grid cell. Although the mean changes for the hydrological fluxes are consistent with the climate change impacts described by Douville et al. (2021), in which 32 CMIP6 models are compared, our study shows larger corresponding standard deviations. These high standard deviations arise from deviations in both the climate input data and the use of six different Budyko models (Fig. 3). The Q flux especially shows a relatively large variability compared to the other hydrological fluxes, which is also mentioned by Li and Li (2022) for SSP1-2.6, SSP2-4.5, and SSP5-8.5.
Implementing the future potential tree cover scenario by Roebroek et al. (2025) in a future climate (scenario CC + TCC) can generate mean hydrological impacts that are of similar magnitude to the effects of climate change (scenario CC). We estimate the mean global E to enhance by 28 ± 19 mm yr−1 (4.7 %) relative to scenario CC following an average increase of 15.5 % in global potential tree cover. This increase in E includes both the direct and indirect tree cover change effects, of which the latter relates to the altered P flux. The enhanced E affects P over both land and ocean surfaces (Fig. A1), which could enhance P by 16 mm yr−1 over land. Please note that the standard deviation for the altered P remains unchanged across scenarios CC and CC + TCC, since this standard deviation only shows the (constant) variability over the CMIP6 models. We find that approximately 60 % of the additional evaporated moisture precipitates over land in scenario CC + TCC. In addition, the projected change in tree cover can generate a shift in Q from a climate-driven net increase to a slight net decrease. Therefore, on a global scale, the contrasting effects of climate change and large-scale forestation may result in a limited net effect on Q (Fig. 4b). Rasouli et al. (2019) also showed that the impacts of future vegetation change and climate change on regional Q can be of similar magnitude for mountainous catchments in North America, although the net effects vary among catchments. Contrary to our study, Wang-Erlandsson et al. (2018) concluded that the impact of global land use change on Q is much smaller than the global effects of CC. However, note that this study analysed a different land use change scenario compared to our study, focusing on human-induced conversion of land cover to urban areas, pastures, or cropland. In our study, the climate- and tree-cover-driven impacts on the Q flux can differ on a regional level and can therefore deviate substantially from the global effect, as further discussed in Sects. 3.2 and 3.3.
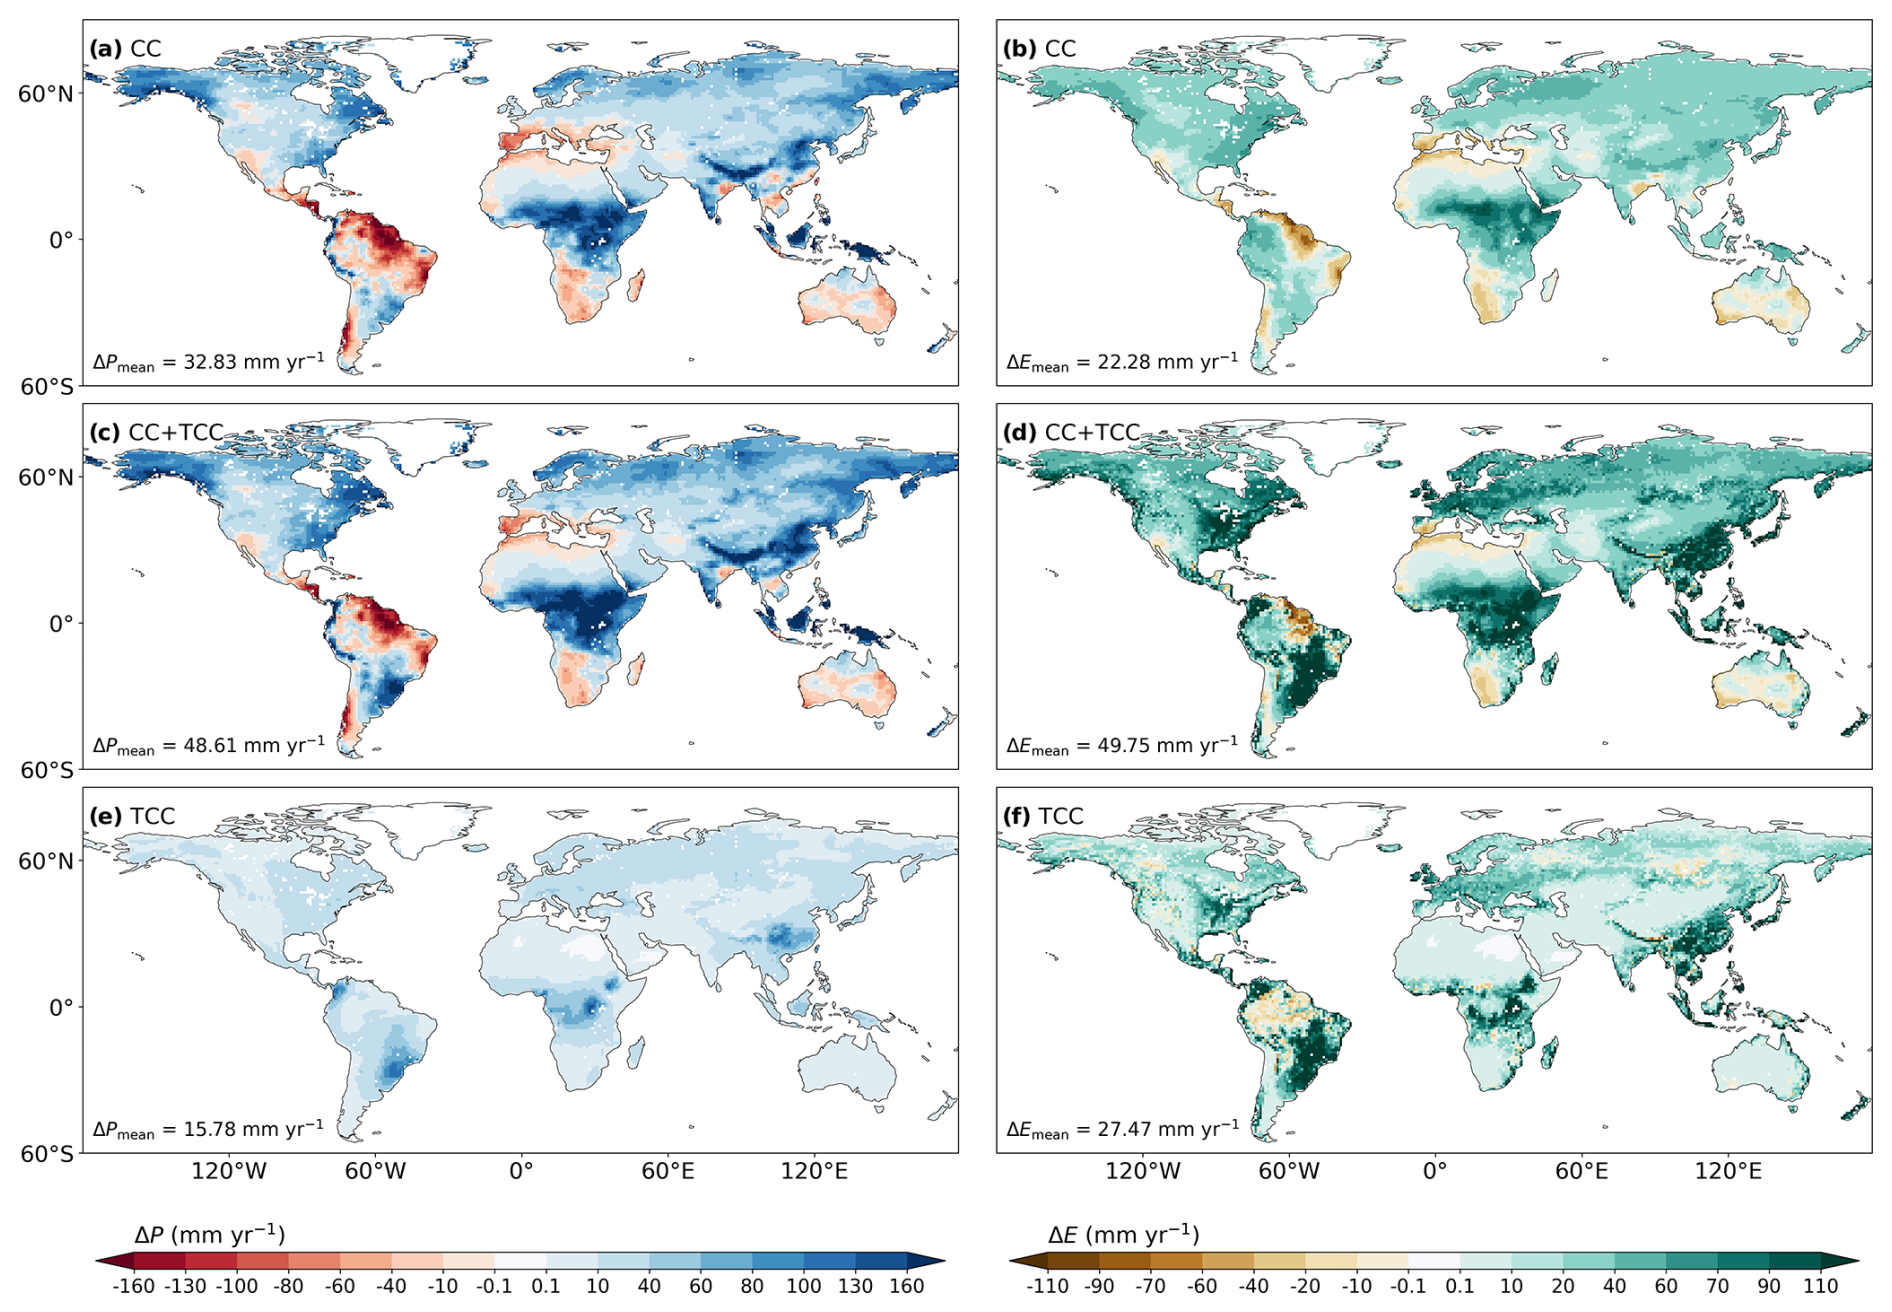
Figure 5Average precipitation change (ΔP; a, c, and e) and evapotranspiration change (ΔE; b, d, and f) in a future climate due to the impact of climate change (CC; a and b) and the combined impacts of climate change and tree cover change (CC + TCC; c and d). The hydrological changes in these figures are relative to the present climate. Panels (e) and (f) only display the impact of tree cover change (TCC; difference between CC and CC + TCC).
3.2 Spatial impact of climate change and future tree cover change on hydrological fluxes
Under climate change, our study shows general increases in P and E fluxes over land; however, there are also regions in, for example, South America, southern Europe, Africa, and Australia where decreases in both P and E are found (Fig. 5a and b). We find that P and E can experience pronounced climate-driven absolute changes in the tropical belt, but note that the magnitude of relative changes can be comparatively smaller in these regions (not shown). These spatial trends for P and E over land agree with the multi-model ensemble projections for climate pathways SSP2-4.5 and SSP5-8.5 (Zhao and Dai, 2021; Li and Li, 2022). When including the potential changes in tree cover, the patterns for tree cover change (Fig. 1) are mirrored in the tree-cover-driven changes in E (Fig. 5f); hence an increase in tree cover enhances E and a decrease in tree cover reduces E. This causal relationship for large-scale tree cover increase and E is also shown under present climate conditions (Tuinenburg et al., 2022; De Hertog et al., 2023). The change in E per change in tree cover is largest in wet regions, which is why we find a large increase in E over southeastern Asia, tropical Africa, and eastern South America. Since only a small part of the recycled moisture generally precipitates within 100 km of the evaporation source (Cui et al., 2022; Theeuwen et al., 2023), a change in local E will mainly affect the downwind P at regional (or larger) spatial scales. Therefore, the tree cover change patterns are less distinguishable for the change in P, which is, for example, illustrated with the absence of negative P change over land despite the negative tree cover changes (Fig. 5e). This absence of negative P could be attributed to a compensation effect where small negative local P changes are compensated by increased P originating from other (upwind) areas, as also indicated by Tuinenburg et al. (2022).
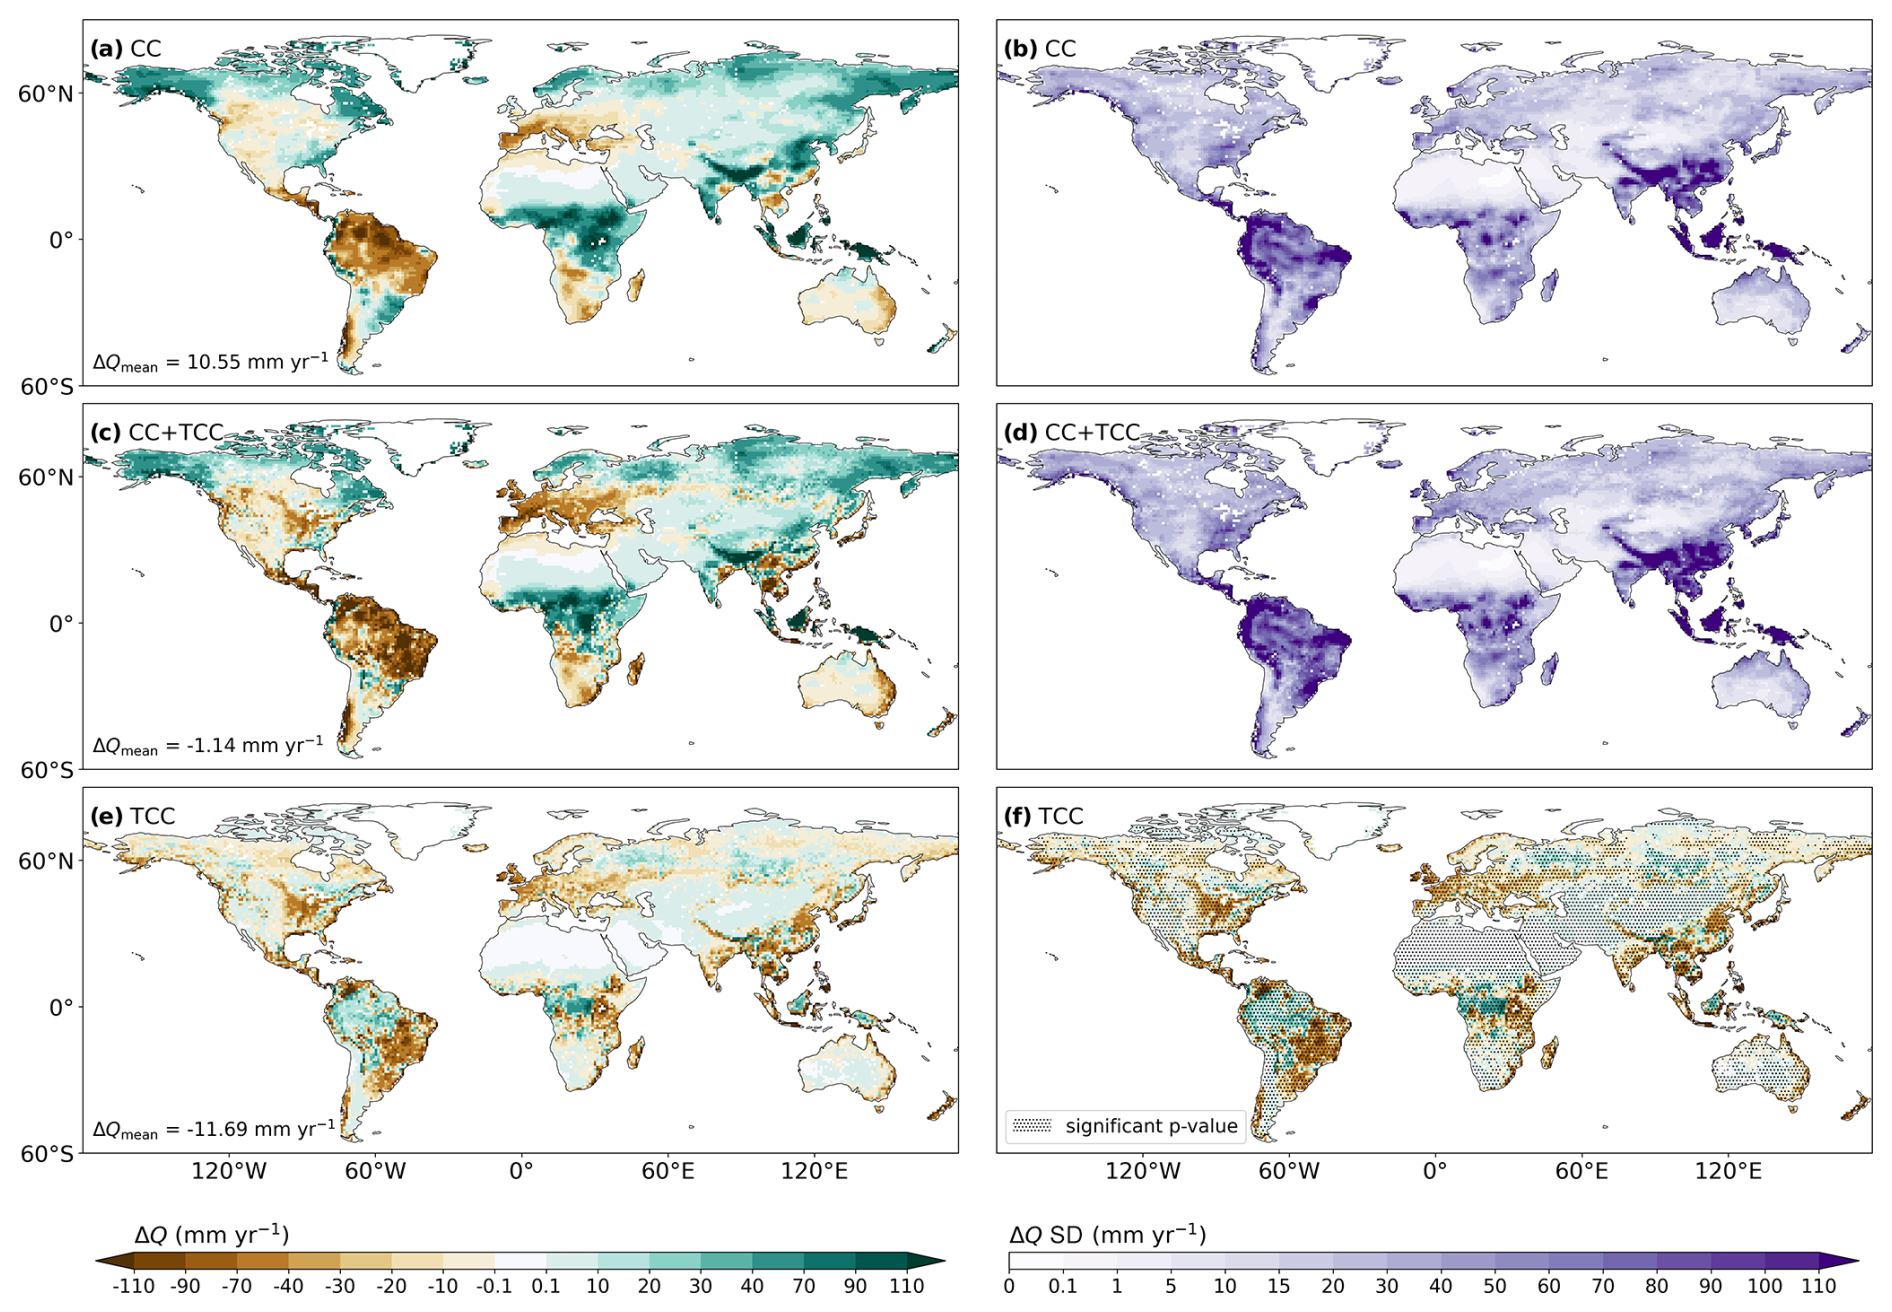
Figure 6Average runoff change (ΔQ: a, c, e, and f) and the corresponding standard deviation (b, d) in a future climate due to the impact of climate change (CC; a and b) and the combined impacts of climate change and tree cover change (CC + TCC; c and d). The hydrological changes in these figures are relative to the present climate. Panels (e) and (f) both display the impact of tree cover change (TCC; difference between CC and CC + TCC), whereby panel (f) illustrates the spatial significance for ΔQ due to TCC. The spatial significance is obtained by applying a Wilcoxon signed-rank test to every land grid cell, and the stippling in the figure indicates which grid cells have a significant p value (< 0.05).
For the Q flux, we find that the spatial changes in Q due to climate change (Fig. 6a) are roughly consistent with the multi-model trends for SSP5-8.5 by Wang et al. (2022) and Li and Li (2022) and that the changes in Q typically follow the trends for P. However, in certain regions, such as in parts of Europe and northern South America, the climate-driven decrease in Q seems to be more pronounced than the limited change in P, as was also shown by Cook et al. (2020) for SSP3-7.0. The difference between the P and Q trends in these areas could be attributed to the climate-driven increase in E. Analysing the impacts of large-scale global forestation on Q (Fig. 6e) shows an apparent inverse relationship between Q and tree cover change, whereby an increased (decreased) tree cover generally results in a decreased (increased) Q because of an enhanced (reduced) E. However, the extent to which tree cover change can impact Q may vary locally due to the corresponding indirect effects (altered moisture recycling). Note that, for both scenario CC and scenario CC + TCC, the variability between the CMIP6–Budyko models regarding the change in Q is most pronounced in areas that experience larger flux changes. As the high model variability is mainly concentrated in the wet lower latitudes, the variability for these areas could be (partly) explained by the large spread in P for very wet climate regions, as seen in Fig. 3a. Li and Li (2022) also show a higher uncertainty in Q for the regions around the Equator for SSP1-2.6, SSP2-4.5, and SSP5-8.5.
To analyse the spatial significance of the Q change due to a changing tree cover, we use the Wilcoxon signed-rank test (Wilcoxon, 1945) (i.e. a non-parametric version of the paired samples Student's t test) for every land grid cell with a p-value threshold of 0.05. For most of the land surface, the significant changes in Q are associated with changes in potential tree cover (Fig. 6f); however, in some regions, such as the Sahara, very small absolute changes in Q are also marked as significant. By setting a minimal flux change threshold of 5 mm yr−1 to exclude such regions, we find that tree cover change under climate change can significantly increase Q by more than 5 mm yr−1 for 16 % of the land surface.
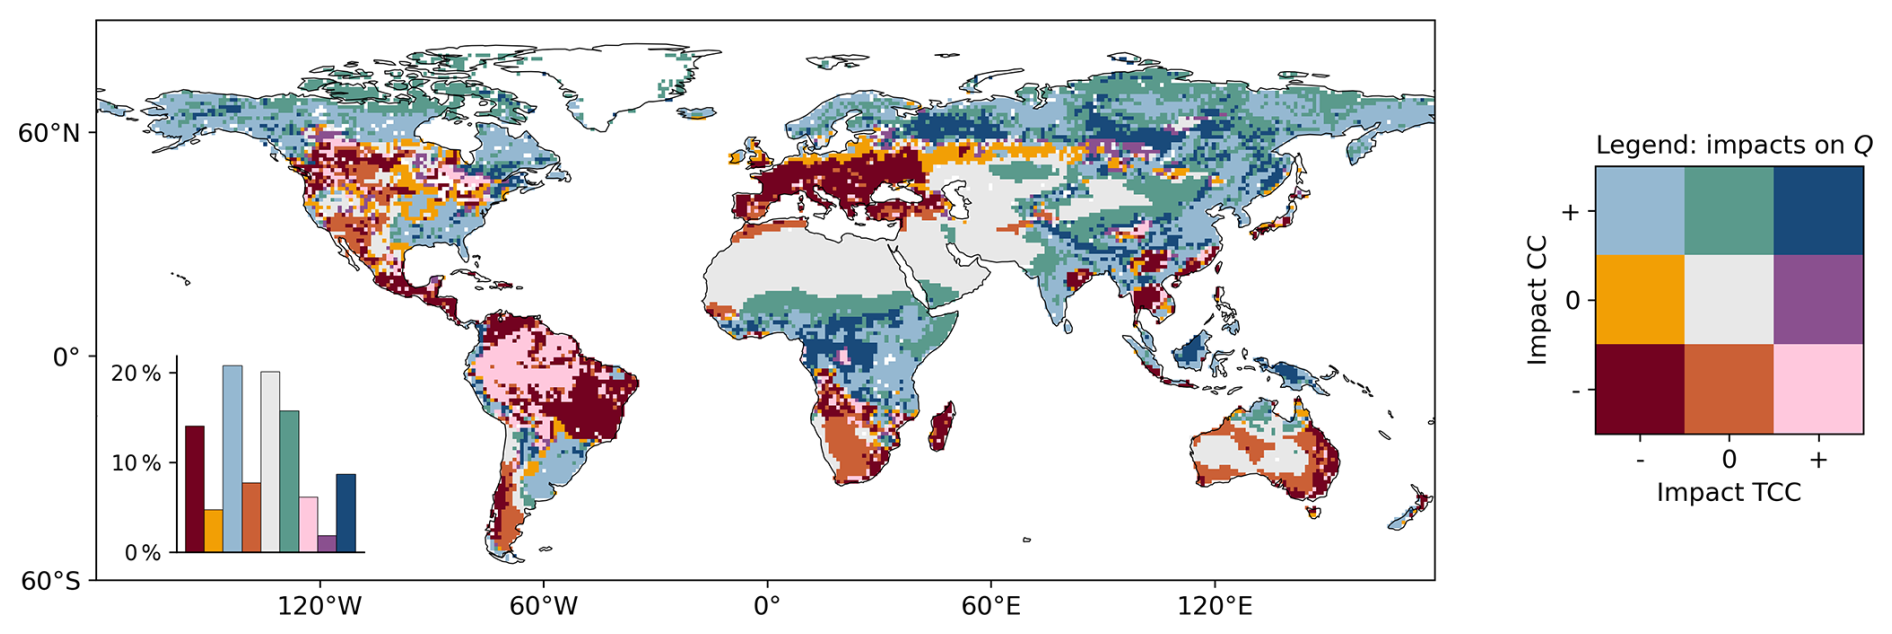
Figure 7Global overview for the changes in runoff (Q) due to climate change (CC) and tree cover change (TCC). The sign of change for Q due to CC and TCC effects can be contradictory or complementary depending on the region. The symbols “+” and “−” in the legend correspond to a positive and negative change in Q, respectively, where these changes exceed the specified absolute threshold of 5 mm yr−1. The “0” in the legend represents small changes in runoff in the absolute range of 0 to 5 mm yr−1. The legend should be read as the following; when there is “+” for TCC and “−” for CC, this means that the TCC increases the Q flux, whereas CC reduces the Q flux; thus the TCC can mitigate the negative CC effect on Q. The bar graph inside the figure shows the percentages of land surface taken up by each of the CC and TCC combinations.
As the impacts of tree cover change can amplify, mitigate, or even reverse the effects of climate change, Fig. 7 shows the spatial distribution of the separate impacts of tree cover change and climate change on Q. The figure includes nine different colour combinations, illustrating whether the sign of change due to a changing tree cover aligns with or contradicts the climate change effect on Q. In addition, we use a threshold of 5 mm yr−1 in the figure to indicate regions with a low absolute change in Q. For approximately 6 % of the land surface, Q decreases by more than 5 mm yr−1 due to climate change and increases by more than 5 mm yr−1 following our large-scale tree cover change scenario (pink areas in Fig. 7). Hence, for only a relatively small fraction of the land surface, the change in tree cover can mitigate the drying trend under climate change. In contrast, it appears to be more common for tree restoration to mitigate the climate-driven increase in water availability, as this occurs for approximately 21 % of the land surface (light-blue areas in Fig. 7). Although the altered tree cover can counteract climate change impacts in certain regions, we also estimate that part of the land surface (14 %) experiences a decrease in water availability as a result of both climate change and tree cover change effects, such as in southern Europe and eastern South America. For the higher latitudes of the Northern Hemisphere (around 60° latitude), our study shows a clear climate-driven increase in Q, whereas the effects of tree cover change vary. We find that most areas that experience an increasing (decreasing) Q with both climate change and tree cover change are situated in areas where there is a potential decrease (increase) in tree cover.
So far, we show that analysing hydrological changes on a grid cell level can provide insights about the impact patterns of climate change and tree cover change on the global water fluxes and water availability. However, as impact patterns can differ extensively on a local level, the overall impact on the hydrological fluxes in a catchment remains unclear. By aggregating the results to catchment level (Sect. 3.3), we can also obtain insights about the changes in water availability, e.g. for communities, shipping, and agriculture.
Table 3Characteristics of the five chosen catchments in this study. The climate classification is according to Köppen (1936).
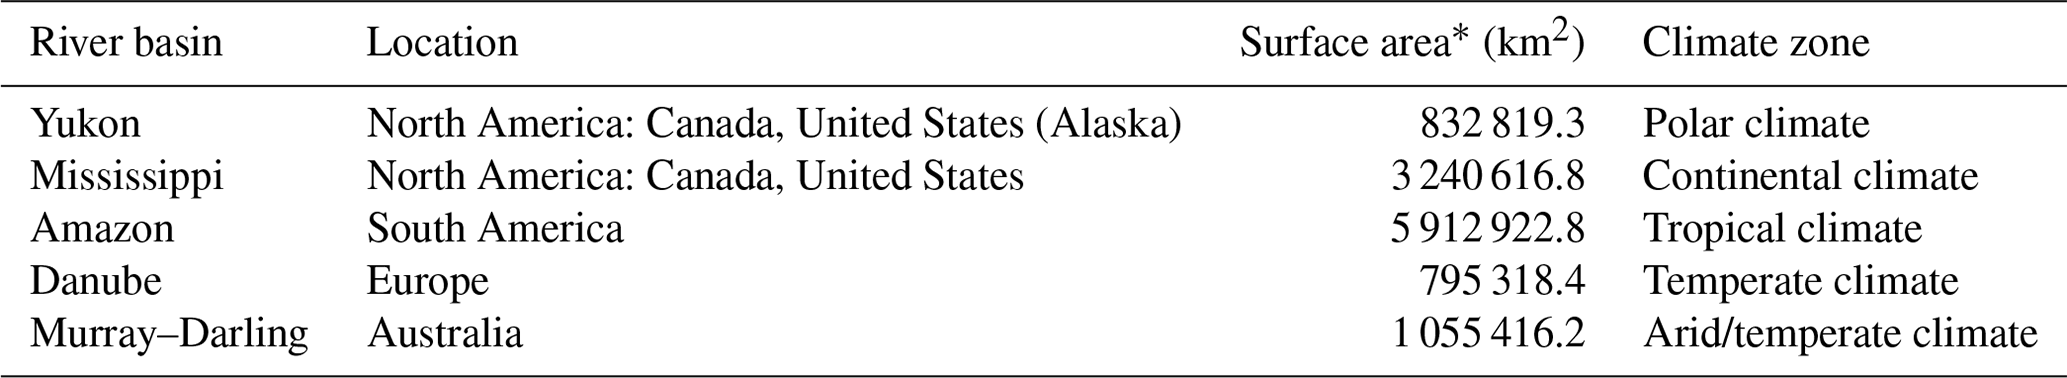
∗ According to the catchment shapefiles retrieved from https://www.hydrosheds.org/products/hydrobasins (last access: 3 November 2023).
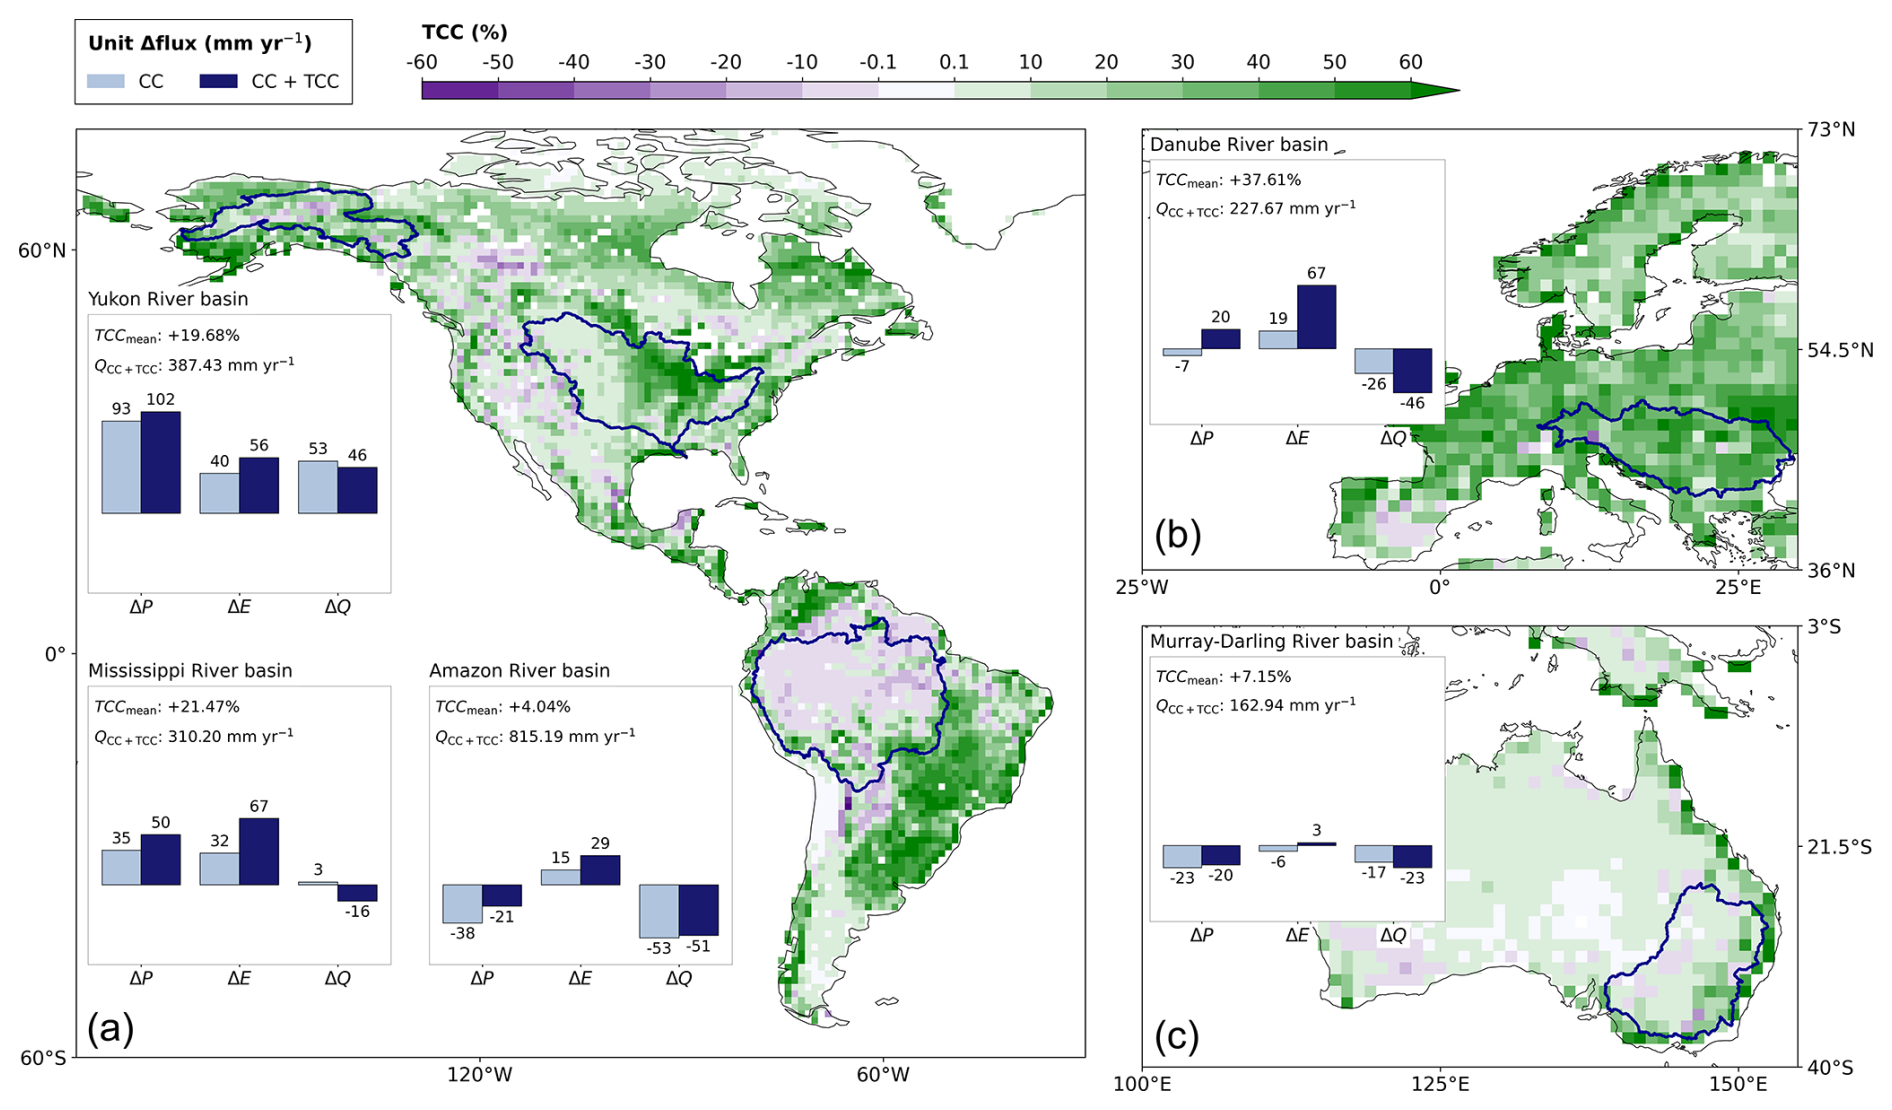
Figure 8Mean change for the hydrological fluxes precipitation (P), evapotranspiration (E), and runoff (Q) due to climate change (CC) and climate change with tree cover change (CC + TCC), relative to the present climate. The changes are in mm yr−1. On the left (a), the Yukon River (North America: Canada, United States (Alaska)), Mississippi River (North America: Canada, United States), and Amazon River (South America) basins are displayed with the corresponding flux changes, and, on the right, the (b) Danube River (Europe) and (c) Murray–Darling River (Australia) basins are shown with the corresponding flux changes. The river basins are indicated with a dark-blue line. The TCCmean value in the upper left of each bar plot shows the average tree cover change in the catchments, and the QCC + TCC shows the total Q in the catchment for research scenario CC + TCC. Note that the values presented in the bar graphs are rounded; for more details, see Table A4.
3.3 Catchment responses to climate change and future tree cover change
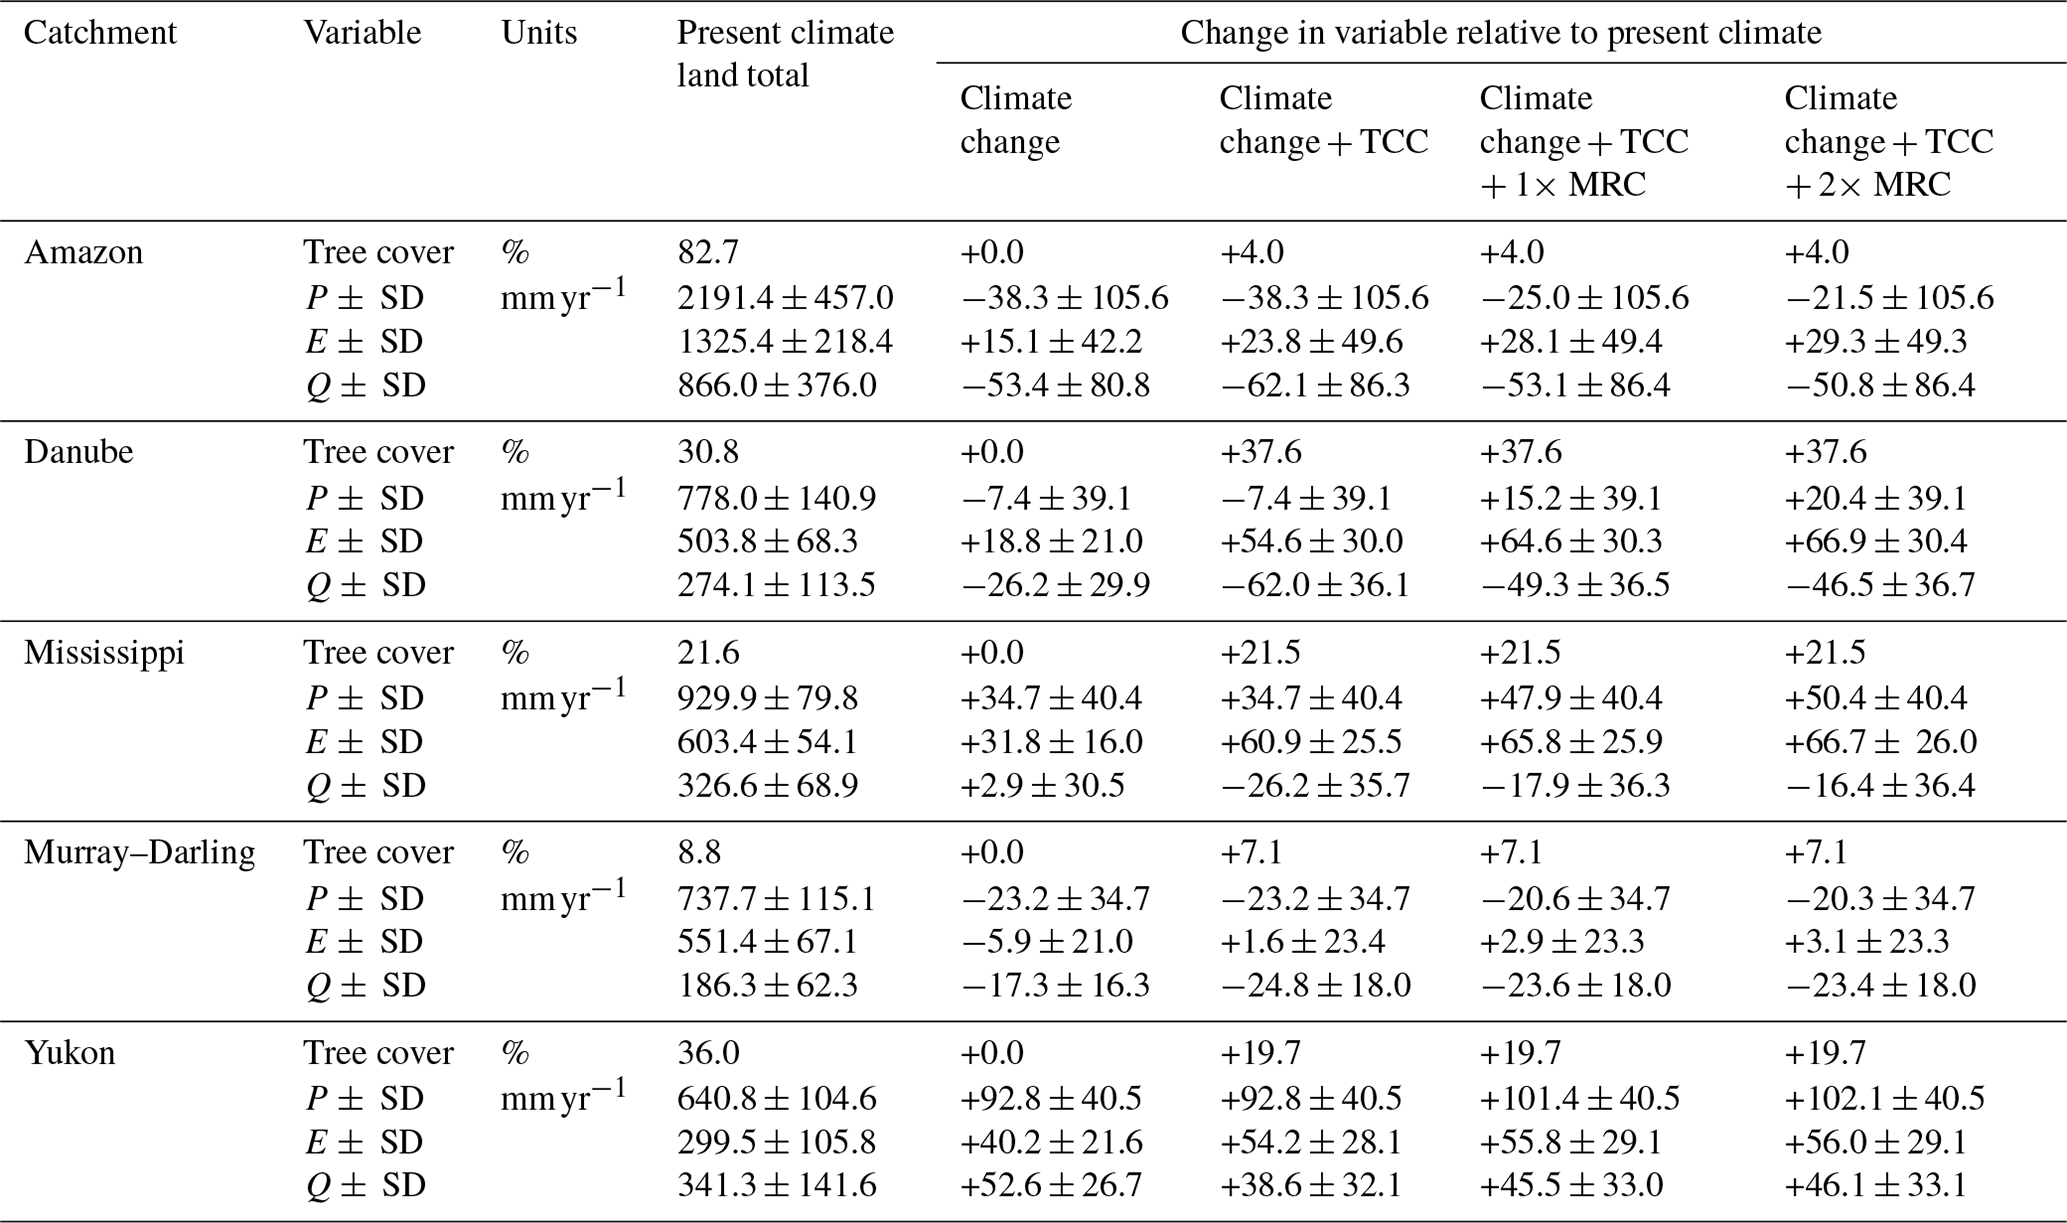
We zoom in on five catchments to take a closer look at the impacts of climate change and tree cover change on integrated hydrological fluxes. The following five catchments are selected: the Yukon River basin, the Mississippi River basin, the Amazon River basin, the Danube River basin, and the Murray–Darling River basin. These river basins are chosen because they are situated in different climate zones (Table 3) and because the catchments have a large surface area (Table 3) which is suitable for the coarse spatial resolution of our analyses. Furthermore, all basins encounter different impacts on Q due to changes in tree cover and climate (Fig. 8).
Focusing only on the climate change effects, the Yukon River basin can experience an increase in P of approximately 93 mm yr−1 (+14.5 %) relative to the present climate, which would be the largest climate-driven change in P among the five river basins (Fig. 8, Table A4). The pronounced increase in yearly P under climate change for this catchment agrees with the projections of Hay and McCabe (2010) and Bush and Lemmen (2019), and it can lead to a relatively larger increase for Q compared to E (Hay and McCabe, 2010), which is in line with our results. This larger impact on annual Q can be attributed to a smaller increase in E under climate change, as temperatures remain relatively cold for this region (Hay and McCabe, 2010). We find that an overall increase in tree cover of 19.7 % could enhance E (directly) and P (indirectly) within the river basin, thereby amplifying the climate change effect for these two fluxes. The higher tree cover means that a slightly larger fraction of P can evaporate, which subsequently reduces Q and thus partly counteracts the climate-driven increase in Q. For the Wolf Creek basin, located within the Yukon catchment region, Rasouli et al. (2019) also showed that future vegetation increase can mitigate the climate-driven increase in Q. In this smaller basin, the vegetation effects could even largely offset the climate change impacts, as the climate and vegetation effects were found to be of similar magnitude (Rasouli et al., 2019). In contrast, our study suggests that, for the larger catchment, climate change impacts on water availability are dominant over the impacts of a changing tree cover within the Yukon River basin.
Similarly to the Yukon River basin, the hydrological fluxes in the Mississippi River basin can increase under climate change, although the extent of increase is much smaller for the latter. However, contrasting with the Yukon basin, the Mississippi catchment shows a more substantial climate-driven increase in E compared to Q, which could be attributed to the different dominant driving factors for E in both regions. As the E flux in the Mississippi River basin is primarily water-limited (Li et al., 2022a), the majority of the additional P resulting from climate change can evaporate; therefore we estimate only a small increase of 3 mm yr−1 for Q (Fig. 8, Table A4). For this catchment, the dominating terrestrial moisture sources for P are situated within or to the southwest of the catchment (Benedict et al., 2020), both of which experience an increase in tree cover under scenario CC + TCC and subsequently an increase in E. Hence, by accounting for the estimated increase in tree cover, the P flux received by the basin is further enhanced. Since more moisture would be “lost” from the catchment through increased E than “gained” through enhanced P following tree restoration, the overall Q may shift to a decrease of 16 mm yr−1 (−5 %) relative to the present climate. Therefore, our results indicate that tree-cover-driven impacts are generally dominant over the impacts of climate change in the Mississippi River basin when focusing solely on the water availability.
For the Amazon River basin, the climate change effects deviate from those in the previously discussed catchments, as there can be a decrease in P under pathway SSP3-7.0, in line with Almazroui et al. (2021) and Cook et al. (2020). In most of the Amazon region, E is limited by the available energy (Li et al., 2022a); therefore the strong increase in temperature for this region under SSP3-7.0 (Almazroui et al., 2021) can enhance E. Under scenario CC + TCC, the Amazon River basin experiences a widespread (slight) decrease in potential tree cover due to reduced water availability and extended periods of drought, leading to higher tree mortality (Tavares et al., 2023; Wey et al., 2022). However, there are also areas with increasing potential tree cover in the Amazon, for example, along the southern catchment boundary, that offset the decreases on a catchment scale, resulting in an estimated net increase of +4 % in tree cover (Fig. 8). This compensation effect on catchment scale seems to occur for E as well, since we find an overall tree-cover-driven increase in E regardless of the widespread reduction following tree cover change (Fig. 5f). According to Tuinenburg et al. (2020a), the Amazon River basin has the highest local moisture recycling of our five selected catchments, with 63 % of the locally evaporated moisture raining out within the basin. Hence, the increasing tree cover within (and upwind of) the Amazon basin can enhance E (directly) and P (indirectly) on a catchment level, thereby amplifying and mitigating the climate change impacts on these fluxes, respectively. We estimate that the slight increase in tree cover can enhance Q by +2 mm yr−1 (+0.3 %) in the basin. According to Guimberteau et al. (2017), deforestation effects in a future climate could substantially mitigate the climate-driven decreases for Q at a sub-basin scale in the Amazon. In contrast, we find only a limited net impact of tree cover change on Q in the Amazon River basin, suggesting that climate change has a more pronounced influence on water availability compared to tree cover change in this region.
In the Danube River basin, the hydrological trends under climate change mirror those shown for the Amazon River basin, as both catchments can experience a decreasing P and Q, while E increases (Fig. 8). Interestingly, the decreasing P and Q that we find in the Danube basin contrast with the enhanced P and subsequently increased Q under climate pathways RCP2.6 and RCP8.5, as shown by Probst and Mauser (2023). This difference could be partly attributed to the large uncertainties in the projections of future P both in the study of Probst and Mauser (2023) and in our study (Table A4). The Danube River basin has an estimated potential for a tree cover increase of +37.6 % and thus has the largest tree restoration potential across the five selected river basins. In addition, the dominant terrestrial moisture sources of the Danube basin (central and eastern Europe and the catchment itself; Ciric et al., 2016) also have a high forestation potential. Under scenario CC + TCC, the P flux received by the catchment could therefore increase (indirectly) and consequently shift the climate-driven P decrease to an overall increase. Following the enhanced tree cover, a larger fraction (71.5 %) of the incoming P can evaporate; thus a smaller P fraction ends up in the Q flux, which contributes to an amplification of the negative climate change effect on Q. Overall, we find that the impacts of climate change and tree restoration on water availability can be of similar magnitude for the Danube River basin.
Finally, focusing on the Murray–Darling River basin, we find that climate change can decrease all three hydrological fluxes, which is in contrast with the previously discussed catchments and could be attributed to the more arid climate conditions within the basin (Table 3). Since E in this catchment is constrained by water availability (Li et al., 2022a), the climate-driven decrease in P can subsequently reduce E (Fig. 8). Accounting for the (limited) increase in potential tree cover (scenario CC + TCC) can shift E in the Murray–Darling River basin from a climate-driven decrease to a small increase. However, the incoming P can enhance only slightly, since the region shows a relatively low moisture recycling, whereby only 11 % of the locally evaporated moisture precipitates in the basin (Tuinenburg et al., 2020a). In addition, the catchment receives little precipitation recycled from upwind terrestrial regions (Holgate et al., 2020), indicating that upwind changes in tree cover have minimal impact on the P received by this catchment. We find that the small increase in P due to a locally enhanced tree cover cannot compensate for the additional moisture “loss” from the basin through enhanced E, thereby amplifying the impact of climate change on Q. Hence, our results suggest that the climate change impacts can be dominant over the effects of tree restoration for the water availability in the Murray–Darling River basin.
In conclusion, we show for five large catchments distributed over different climate zones that the impacts of climate change and potential future tree restoration can deviate substantially on a regional scale. These results provide insights into how climate-driven changes in tree cover or tree restoration measures can enhance or offset unwanted climate change effects in each catchment. However, it should be kept in mind that these results correspond with noteworthy uncertainties due to divergent CMIP6 model projections, uncertainties in our methodology, and the use of various Budyko models.
This study provides a first estimate of the impacts of tree cover change under climate change on global hydrological fluxes over land. To study the combined and separate impacts of tree cover change under climate change, we took an interdisciplinary approach combining state-of-the-art datasets and methods following the methodology from Hoek van Dijke et al. (2022), adapted for future climate scenarios. We would like to stress that other studies also applied the Budyko method and UTrack dataset under different climate and land cover scenarios (Kazemi et al., 2019; Tuinenburg et al., 2022; Teuling et al., 2019; Li et al., 2022a). In the discussion below, we reflect on the implications of the methodological constraints and their potential impacts on the results.
4.1 Study limitations related to the SSP3-7.0 pathway, tree cover change map, and Budyko method
The SSP3-7.0 climate pathway was selected because it enabled us to study strong climate change effects without stretching our methods too much towards unknown conditions. Both the tree cover map and the Budyko models rely on the change for time principle: in a warmer climate, we would find a similar distribution of trees to that in the current climate but in a different spatial region. For a stronger climate change scenario, more frequent extrapolation outside of current conditions would introduce uncertainties in the future potential tree cover map and make the use of the Budyko framework more uncertain. However, some uncertainties and limitations remain.
The SSP3-7.0 pathway describes a resource-intensive world with, unlike the other SSP scenarios, a strong reduction in tree cover in the coming decades (Hurtt et al., 2020; Shiogama et al., 2023). The land use changes corresponding to SSP3-7.0 can affect temperature and precipitation extremes, whereby the land cover impacts may be more pronounced on a regional level compared to on a global level (Hong et al., 2022). In our study, we do not distinguish between the SSP3-7.0 impacts of land use (which can vary across CMIP6 models) and the impacts of climate change, thus attributing the effects only to climate change. This assumption may therefore result in the under- or overestimation of climate change effects on a regional level. For example, the large-scale deforestation in tropical regions presented in SSP3-7.0 could decrease the regional mean and extreme precipitation (Hong et al., 2022). Hence, the precipitation increase in tropical Africa, which we attribute solely to climate change, may actually consist of a stronger increase driven by climate change combined with a decrease driven by deforestation, meaning that, for this region, the climate change effects could be underestimated.
To create the future potential tree cover map for SSP3-7.0 (Roebroek et al., 2025), no feedbacks between changing tree cover and the climate in SSP3-7.0 were included. By using the potential tree cover map for SSP3-7.0 and assuming large-scale tree cover change, we deviate from this climate pathway, which subsequently should alter climate characteristics and therefore the future potential tree cover. Additionally, the potential tree cover map describes the tree cover that could be established given certain climate conditions. However, 3 decades would not suffice to reach this level of tree cover everywhere, especially in areas that currently do not contain trees. We also assume a static tree cover and do not consider temporal variability in water fluxes that result, for example, from forest disturbance and forest succession stages (Goeking and Tarboton, 2020; Teuling and Hoek van Dijke, 2020). To explicitly model all feedbacks between climate, tree cover, and tree growth, one would need a fully integrated Earth system model.
It should be kept in mind that, although our study is hypothetical, the realisation of the potential tree cover in a future climate can have widespread consequences for biodiversity and agricultural production. For example, tree planting based on the future potential tree cover map could negatively impact biodiversity, as the map permits afforestation in grassy biomes, for example, in the Mississippi River basin. These regions can naturally support trees but host very different species; therefore afforestation would lead to large losses in biodiversity (Veldman et al., 2015). In addition, the future potential tree cover map shows a high potential for tree cover changes on agricultural (and urban) land (Sect. 2.2), while actual reforestation in these areas is likely limited to maintain agricultural production (Roebroek et al., 2025).
The Budyko models used were calibrated under current climate conditions, but the evapotranspiration-to-precipitation ratio () could change in the future. The parameterisation of the models reflects the catchment-integrated effects of differences in interception, plant available water, evaporation, water use efficiency, and soil water storage capacity. Some of those characteristics could potentially change the evapotranspiration-to-precipitation ratio () under future climate conditions. For example, the Budyko models do not take into account the CO2 fertilisation effect on reduced surface conductance and increased vegetation greenness (Zhu et al., 2016), which changes the albedo and water use efficiency (Bala et al., 2006). Although these opposing effects are of similar importance on a global scale, the regional effect can be highly positive or negative (Zhang et al., 2022b); therefore, the Budyko parameters and our calculation of evapotranspiration will be non-uniformly affected. Also, the Budyko vegetation parameters are sensitive for, among others, tree species and short vegetation coverage (Chen et al., 2021; Liu et al., 2018; Ding et al., 2022), and the hydrological impacts of forest restoration are therefore highly dependent on the characteristics of forest restoration, e.g. (monoculture) plantations versus natural regrowth of vegetation and coniferous tree species versus deciduous species.
4.2 Implications of missing the feedback of climate change and tree cover change on recycling
The UTrack dataset used in this study is based on ERA5 reanalysis data and thus represents moisture recycling for current climate and land cover characteristics. However, in this study, we apply the UTrack dataset for a future climate; therefore we do not account for the impact of climate change and tree cover change on moisture recycling. There are no moisture-tracking datasets available for an Earth with high tree cover and/or climate change, which is why the current UTrack moisture recycling dataset is used. Below, we describe the feedbacks that were omitted and the effect that this has on our results. This research does not account for the feedbacks of tree cover change on moisture recycling via changes in, for example, the surface albedo, cloud cover, atmospheric carbon dioxide concentrations, surface temperatures, length of moisture transport pathways, and global circulation. These feedbacks can impact the energy balance; e.g. increased tree cover can lower the surface albedo and subsequently enhance the surface temperature, and it can impact global atmospheric circulation and moisture transport (Portmann et al., 2022). However, these feedbacks are complex and can be contrasting, depending on the location of the land use change. De Hertog et al. (2023) studied the impact of land cover change on atmospheric moisture recycling. They found trends of general wetting and increased local moisture recycling following afforestation in two Earth system models (De Hertog et al., 2023). This indicates that regions with increased evapotranspiration due to an enhanced tree cover will receive more precipitation than currently estimated, thus limiting the decrease in local water availability. The afforestation impacts found by De Hertog et al. (2023) are opposite to the effect of climate change decreasing the local recycling; however, those opposite effects are not quantified.
Findell et al. (2019) and Staal et al. (2024a) determined moisture recycling ratios globally in a future climate, both for one climate model, and found that continental moisture recycling ratios decrease by 2 %–3 % for each degree of warming (or, differently said, the land-to-land water vapour transport decreases). This signal is explained by the fact that evapotranspiration over land is moisture-limited, allowing oceans to have a relatively larger role in the hydrological cycle. Although included in the analyses, Findell et al. (2019) and Staal et al. (2024a) did not discuss in detail the impacts of changes in future circulation on moisture recycling. There are clear indications that climate warming impacts atmospheric circulation, possibly resulting in a poleward shift in the Hadley cells and storm tracks (Shaw, 2019; Francis and Skific, 2015; Vecchi et al., 2006). Future studies applying moisture tracking on future climate simulations could provide regional insights on the impact of shifting weather patterns on moisture recycling. Projecting the reported decrease in future recycling in this study would mean that less precipitation due to additional evapotranspiration (due to tree cover change) would return over land, thus decreasing the water availability. This indicates that, under climate change and tree cover change (scenario CC + TCC), the runoff and water availability may become lower compared to the results in our study. Findell et al. (2019) also show that, under climate change, the contribution of oceanic evaporation to precipitation over land is larger, as was confirmed for the Mississippi River basin by Benedict et al. (2020). It should be noted that the higher evaporation rates over the ocean and the resulting feedback of increased precipitation over land are part of the CMIP6 datasets for a future climate; thus these climate change effects are included in this study.
To conclude, the approach of this study allows us to disentangle the impacts of climate change and future tree cover change on hydrological fluxes, but it does not include all feedbacks in the Earth system in a future climate. To include all those feedbacks, one would need to run coupled Earth system models including tree cover change, such as those done for current climate by Portmann et al. (2022) and De Hertog et al. (2023). Similar model simulations would be needed for future climate conditions and future potential tree cover, ideally for multiple Earth system models that actively couple the biosphere and atmosphere, but such simulations are not yet widely available. King et al. (2024) performed a global analysis using one Earth system model, and Buechel et al. (2024) ran a regional simulation for the UK using one convection-permitting model. Besides, previous research shows that coupled models do not agree on the implementation of land–atmosphere processes in Earth system models, resulting in uncertainty in the sensitivity of vegetation to changing water availability (Denissen et al., 2022; Li et al., 2022b; Baker et al., 2021). Overall, Earth system model studies and data-driven studies, like this one, face different sources of uncertainty and therefore have specific strengths and shortcomings. We believe that our study complements Earth system model studies by contributing to the diversity of methodological approaches presented in the scientific literature. Different approaches can improve our understanding of uncertainties and thus enable the most robust scientific progress, which is important when advising society and policymakers. Given the constraints mentioned above, our study provides a first estimate of water availability under climate change and future tree cover change.
In this study we analyse the impacts of climate change and global tree cover change on terrestrial precipitation, evapotranspiration, and runoff. To do so, we took an interdisciplinary approach and combined multiple datasets and models. The hydrological fluxes under climate change and future tree cover change were compared with present climate fluxes to analyse the magnitude and direction of changes in water availability.
Our findings show that, globally averaged, climate change and large-scale tree restoration can exert similar absolute impacts on runoff but with opposite signs. Namely, under climate change, the overall increase in precipitation could exceed that of evapotranspiration over land, resulting in enhanced runoff. In contrast, accounting for large-scale tree restoration (15.5%; see Fig. 1), the increase in evapotranspiration over land could exceed that of the recycled precipitation (which partly rains out over water bodies), thus decreasing the runoff. Hence, we find a limited net effect of climate and tree cover changes on the global runoff relative to the present climate.
Although the average impact on global runoff can be limited, the effects of tree cover change and climate change on runoff can be substantial on a regional scale, resulting in enhanced and decreased trends in local runoff up to 100 mm yr−1. For example, the Amazon region could experience a strong climate-driven decrease in runoff, whereas the related reduction in tree cover could potentially mitigate these impacts. We also find a drying trend under climate change for southern Europe; however, in this region, the natural or human-induced forestation would exacerbate rather than mitigate the drying. We estimate that 14 % of the global land area could experience a pronounced decrease in water availability due to both climate change and tree cover change. In contrast, the higher latitudes in the Northern Hemisphere (around 60° latitude) show climate-driven increases in runoff and varying effects of tree cover change. Overall, for approximately 16 % of the land surface, changes in tree cover could increase water availability (in)directly by more than 5 mm yr−1. The five river basins (Yukon, Mississippi, Amazon, Danube, and Murray–Darling) analysed in this study show that the effects of climate change and tree cover change can diverge substantially per catchment, whereby these basins (except for the Mississippi basin) could encounter dominant impacts of climate change on the regional water availability.
This is the first study to disentangle the effects of climate change and large-scale tree cover change on the future water availability on a global scale and for selected river catchments. We show that climate-driven or human-induced changes in tree cover can both mitigate and exacerbate climate-induced drying or wetting trends. Ecosystem restoration projects should consider these long-term hydrological effects to limit unintended reductions for local, downstream, and downwind water availability. However, in our study, there are many potential sources of uncertainty due to the omission of important feedbacks. As a next step, we therefore recommend the use of local coupled modelling studies whereby, for example, different afforestation scenarios can be implemented in a regional weather model under future climate conditions, such as Buechel et al. (2024) for the UK. Such studies would enable the analysis of direct local feedbacks and sensitivities of tree cover changes to evaporation and precipitation, based on local atmospheric conditions. Hence, these local studies could address and verify the hydrological responses that we find in our study. By following a diversity of approaches to study the effects of climate change and tree cover change, we can make the most robust scientific progress, which is needed to inform society and policymakers.
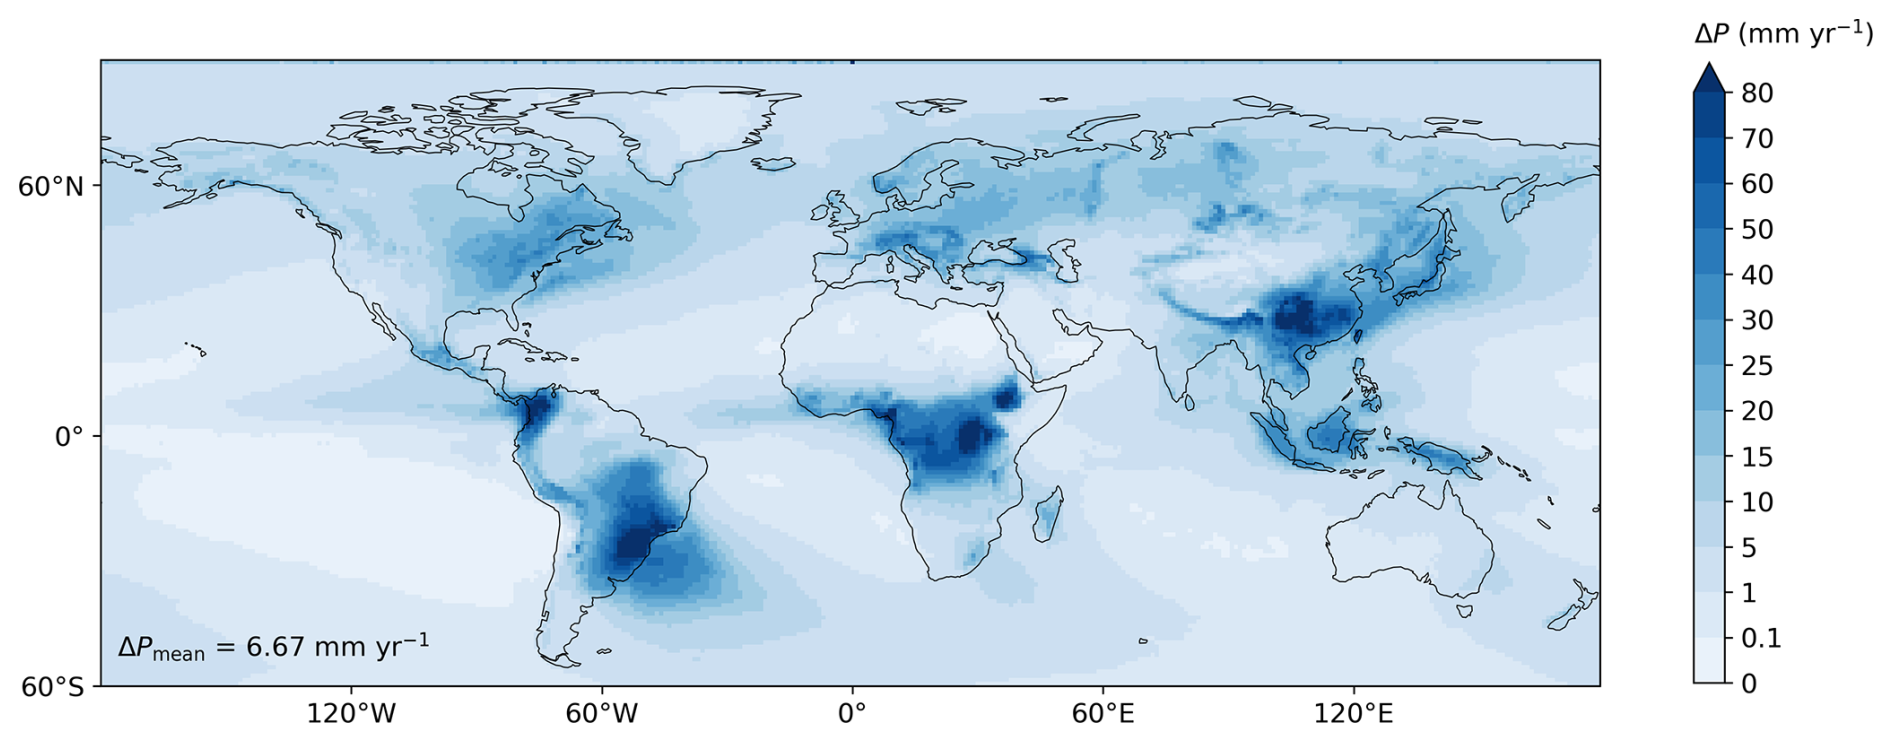
Figure A1Average global change in precipitation (ΔP) in a future climate (2041–2060) due to the indirect impacts of a changing tree cover which affects the moisture recycling. This figure shows the ΔP averaged over the CMIP6–Budyko model combinations, and the moisture recycling change was applied twice.
Table A1Datasets used in this study with corresponding characteristics and the sources from which these datasets can be obtained. The datasets with an asterisk symbol (∗) were retrieved for five models selected from phase 6 of the Coupled Model Intercomparison Project (CMIP6). The datasets were used in the following scenarios: present climate, climate change, climate change with tree cover change (TCC), climate change with TCC and moisture recycling change (MRC) applied once, and climate change with TCC and MRC applied twice. Note that scenario “climate change” is presented as the “CC” scenario outside of the Appendix, while “climate change + TCC + 2× MRC” is presented as the “CC + TCC” scenario.
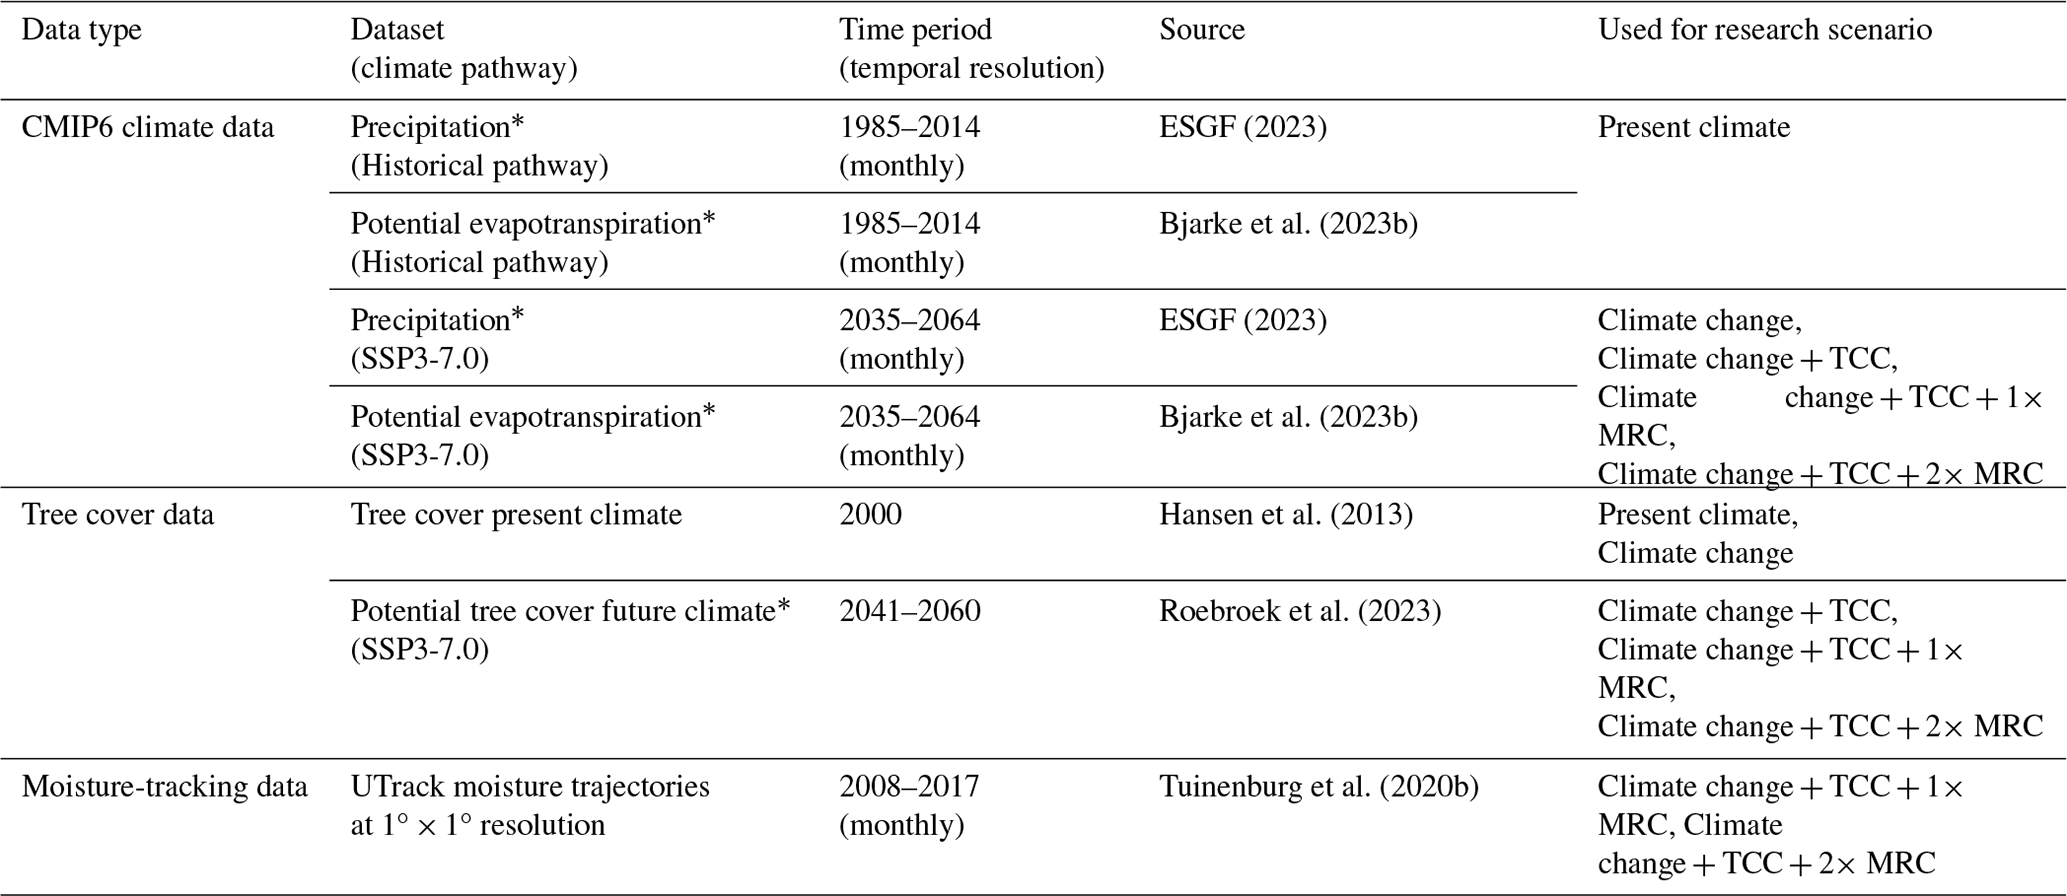
∗ The datasets are retrieved for five selected CMIP6 models: CMCC-ESM2, INM-CM5-0, IPSL-CM6A-LR, MIROC6, and UKESM1-0-LL.
Table A2The six Budyko models used in this study for which the evapotranspiration (E) and runoff (Q) fluxes are calculated from the CMIP6 precipitation (P) and potential evapotranspiration (Ep) datasets. The ω for these models is calibrated for forest and non-forest vegetation, based on yearly mean streamflow or lysimeter data from various climatic regions. Streamflow Q is calculated as .
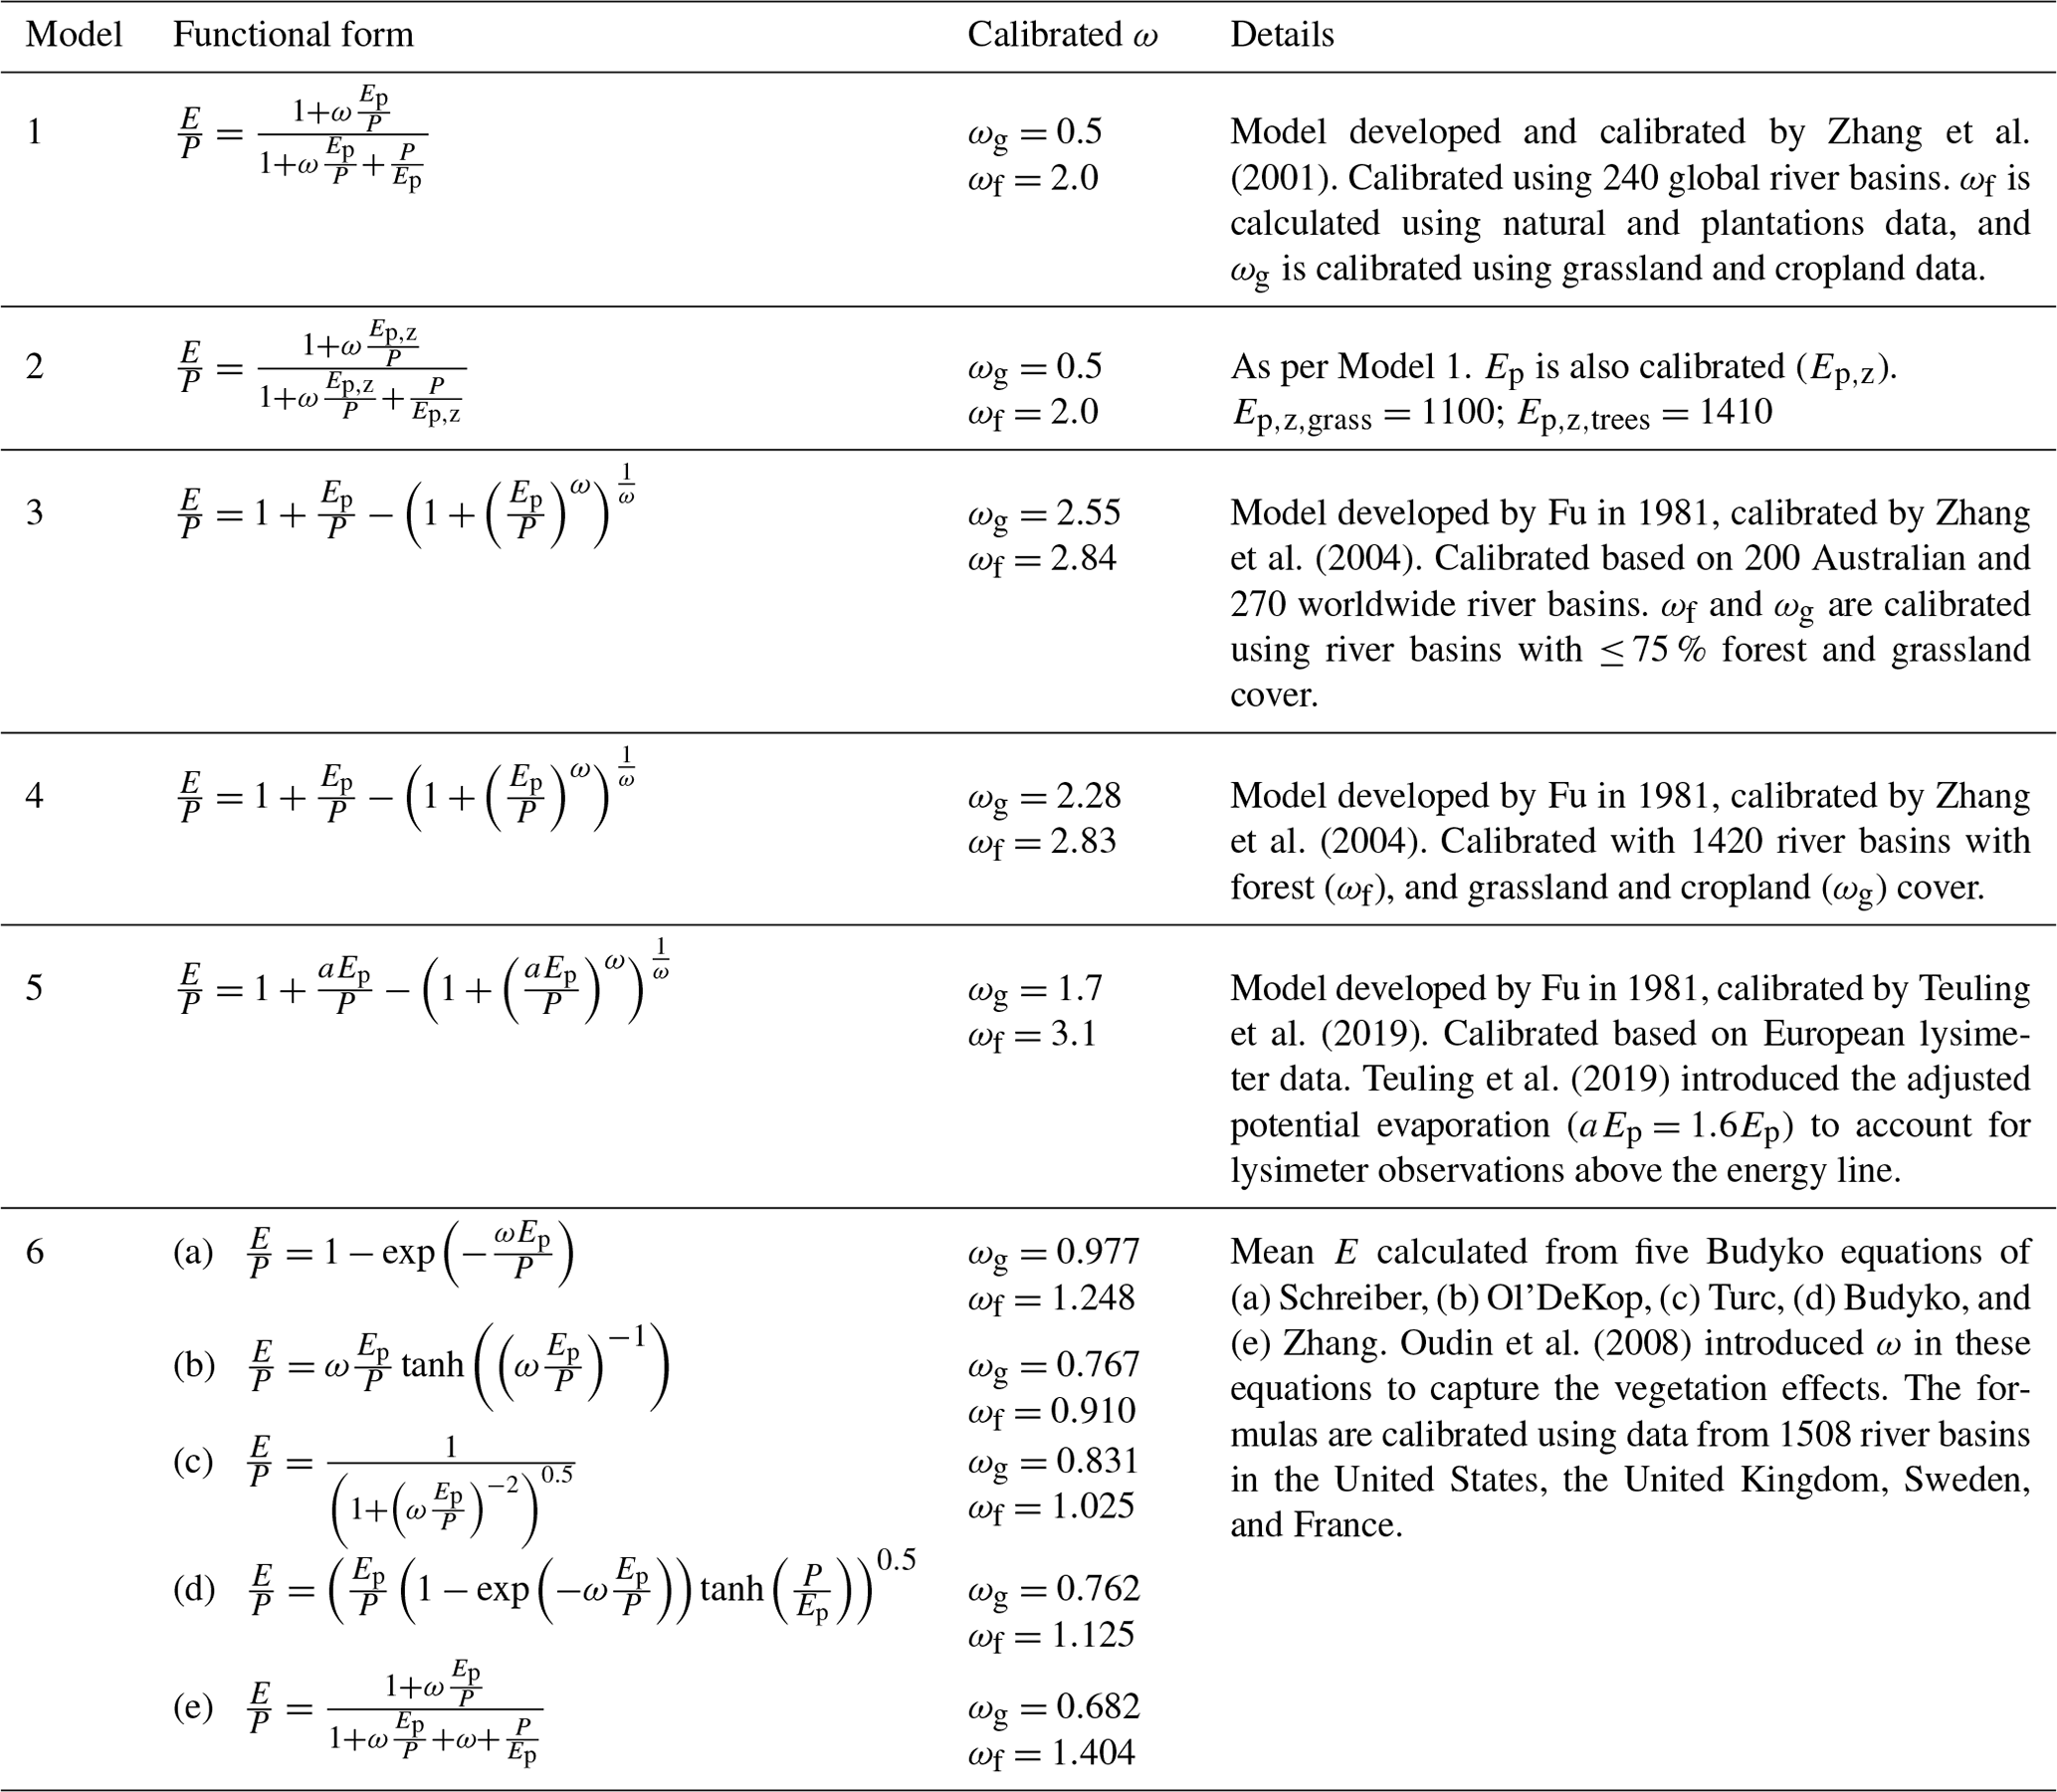
Table A3Overview of the global terrestrial hydrological flux values for precipitation (P), evapotranspiration (E), and runoff (Q) for the following scenarios: present climate, climate change, climate change with tree cover change (TCC), climate change with TCC and moisture recycling change (MRC) applied once, and climate change with TCC and MRC applied twice. The mean of the variables represents the mean over the CMIP6/CMIP6–Budyko models, and the corresponding standard deviations (SDs) display the variability over the CMIP6/CMIP6–Budyko models. Note that scenario “climate change” is presented as the “CC” scenario outside of the Appendix, while “climate change + TCC + 2× MRC” is presented as the “CC + TCC” scenario.
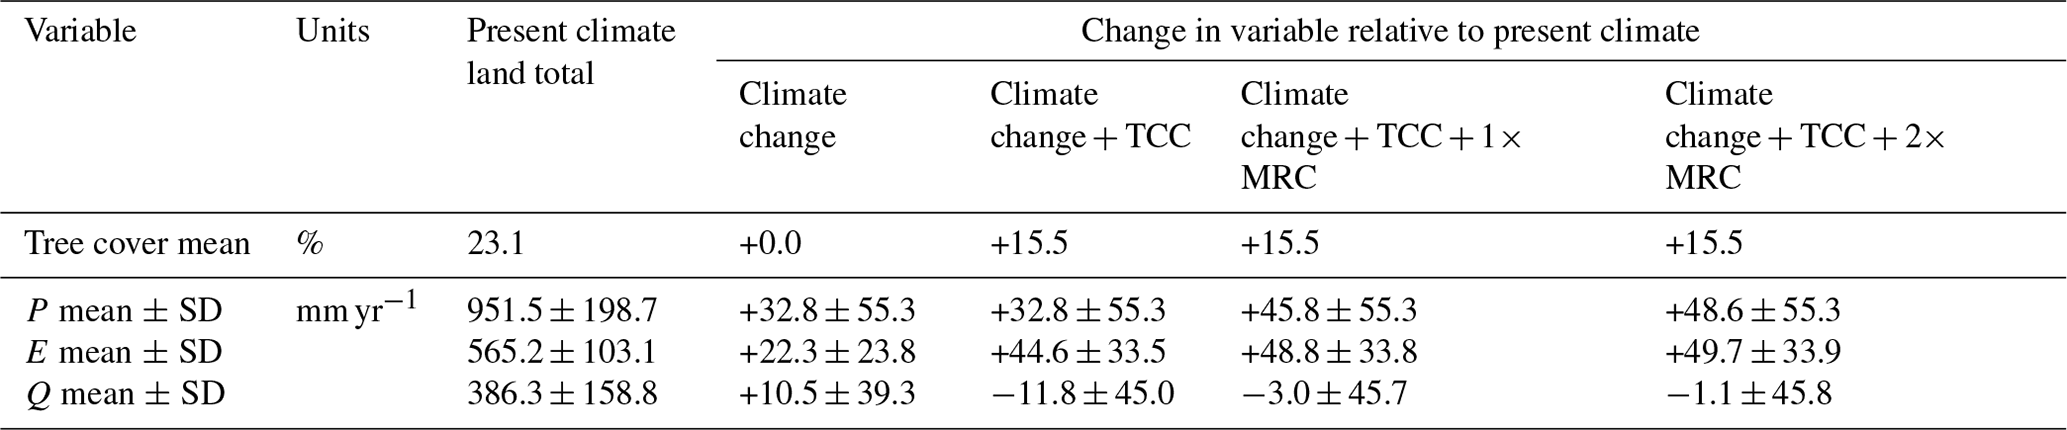
Table A4Overview of the catchment hydrological flux values for precipitation (P), evapotranspiration (E), and runoff (Q) for the following scenarios: present climate, climate change, climate change with tree cover change (TCC), climate change with TCC and moisture recycling change (MRC) applied once, and climate change with TCC and MRC applied twice. The values of the variables represent the mean over the CMIP6/CMIP6–Budyko models and the corresponding standard deviations (SDs), the latter of which display the variability over the CMIP6/CMIP6–Budyko models. Note that scenario “climate change” is presented as the “CC” scenario outside of the Appendix, while “climate change + TCC + 2× MRC” is presented as the “CC + TCC” scenario.
The CMIP6 climate simulations are publicly available from https://esgf-node.llnl.gov/search/cmip6/ (ESGF, 2023). Potential evapotranspiration (Ep) data derived from the CMIP6 simulations are provided by Bjarke et al. (2023b) (https://doi.org/10.5281/zenodo.7789759). The UTrack dataset is publicly available at https://doi.org/10.1594/PANGAEA.912710 (Tuinenburg et al., 2020b). The tree cover dataset for the present climate is provided by Hansen et al. (2013), and the future potential tree cover datasets are provided by Roebroek et al. (2023) (https://doi.org/10.3929/ethz-b-000637086).
FE carried out the study and created all the figures. The idea of this study was conceived by IB and AJHvD. FE, IB, and AJHvD wrote the first draft of the paper. All authors interpreted the results, contributed to the discussion, and were involved in writing the final paper.
The contact author has declared that none of the authors has any competing interests.
Publisher's note: Copernicus Publications remains neutral with regard to jurisdictional claims made in the text, published maps, institutional affiliations, or any other geographical representation in this paper. While Copernicus Publications makes every effort to include appropriate place names, the final responsibility lies with the authors.
We would like to thank Michael Roderick and all anonymous reviewers for their feedback comments on this article.
This research has been supported by the Deutsche Forschungsgemeinschaft (Emmy Noether Grant (grant no. 391059971)).
This paper was edited by Markus Hrachowitz and reviewed by Michael Roderick and three anonymous referees.
Almazroui, M., Ashfaq, M., Islam, M. N., Rashid, I. U., Kamil, S., Abid, M. A., O'Brien, E., Ismail, M., Reboita, M. S., Sörensson, A. A., Arias, P. A., Alves, L. M., Tippett, M. K., Saeed, S., Haarsma, R., Doblas-Reyes, F. J., Saeed, F., Kucharski, F., Nadeem, I., Silva-Vidal, Y., Rivera, J. A., Ehsan, M. A., Martínez-Castro, D., Muñoz, Á. G., Ali, M. A., Coppola, E., and Sylla, M. B.: Assessment of CMIP6 Performance and Projected Temperature and Precipitation Changes Over South America, Earth Systems and Environment, 5, 155–183, https://doi.org/10.1007/s41748-021-00233-6, 2021. a, b
Baker, J., Garcia-Carreras, L., Buermann, W., De Souza, D. C., Marsham, J., Kubota, P., Gloor, M., Coelho, C., and Spracklen, D.: Robust Amazon precipitation projections in climate models that capture realistic land–atmosphere interactions, Environ. Res. Lett., 16, 074002, https://doi.org/10.1088/1748-9326/abfb2e, 2021. a
Bala, G., Caldeira, K., Mirin, A., Wickett, M., Delire, C., and Phillips, T.: Biogeophysical effects of CO2 fertilization on global climate, Tellus B, 58, 620–627, https://doi.org/10.1111/j.1600-0889.2006.00210.x, 2006. a
Bastin, J.-F., Finegold, Y., Garcia, C., Mollicone, D., Rezende, M., Routh, D., Zohner, C. M., and Crowther, T. W.: The global tree restoration potential, Science, 365, 76–79, https://doi.org/10.1126/science.aax0848, 2019. a
Benedict, I., van Heerwaarden, C. C., van der Ent, R. J., Weerts, A. H., and Hazeleger, W.: Decline in Terrestrial Moisture Sources of the Mississippi River Basin in a Future Climate, J. Hydrometeorol., 21, 299–316, https://doi.org/10.1175/JHM-D-19-0094.1, 2020. a, b
Bjarke, N., Barsugli, J., and Livneh, B.: Ensemble of CMIP6 derived reference and potential evapotranspiration with radiative and advective components, Scientific Data, 10, 417, https://doi.org/10.1038/s41597-023-02290-0, 2023a. a, b, c, d
Bjarke, N., Barsugli, J., and Livneh, B.: CMIP6 derived ensemble of global vapor pressure deficit, potential evapotranspiration, and reference evapotranspiration, Zenodo [data set], https://doi.org/10.5281/zenodo.7789759, 2023b. a, b, c
Boucher, O., Servonnat, J., Albright, A. L., Aumont, O., Balkanski, Y., Bastrikov, V., Bekki, S., Bonnet, R., Bony, S., Bopp, L., Braconnot, P., Brockmann, P., Cadule, P., Caubel, A., Cheruy, F., Codron, F., Cozic, A., Cugnet, D., D'Andrea, F., Davini, P., de Lavergne, C., Denvil, S., Deshayes, J., Devilliers, M., Ducharne, A., Dufresne, J.-L., Dupont, E., Éthé, C., Fairhead, L., Falletti, L., Flavoni, S., Foujols, M.-A., Gardoll, S., Gastineau, G., Ghattas, J., Grandpeix, J.-Y., Guenet, B., Guez, Lionel, E., Guilyardi, E., Guimberteau, M., Hauglustaine, D., Hourdin, F., Idelkadi, A., Joussaume, S., Kageyama, M., Khodri, M., Krinner, G., Lebas, N., Levavasseur, G., Lévy, C., Li, L., Lott, F., Lurton, T., Luyssaert, S., Madec, G., Madeleine, J.-B., Maignan, F., Marchand, M., Marti, O., Mellul, L., Meurdesoif, Y., Mignot, J., Musat, I., Ottlé, C., Peylin, P., Planton, Y., Polcher, J., Rio, C., Rochetin, N., Rousset, C., Sepulchre, P., Sima, A., Swingedouw, D., Thiéblemont, R., Traore, A. K., Vancoppenolle, M., Vial, J., Vialard, J., Viovy, N., and Vuichard, N.: Presentation and Evaluation of the IPSL-CM6A-LR Climate Model, J. Adv. Model. Earth Sy., 12, e2019MS002010, https://doi.org/10.1029/2019MS002010, 2020. a
Budyko, M.: Climate and Life, Academic Press, New York, NY, USA, ISBN 9780080954530, 1974. a
Buechel, M., Berthou, S., Slater, L., Keat, W., Lewis, H., and Dadson, S.: Hydrometeorological response to afforestation in the UK: findings from a kilometer-scale climate model, Environ. Res. Lett., 19, 064060, https://doi.org/10.1088/1748-9326/ad4bf6, 2024. a, b
Bush, E. and Lemmen, D.: Canada's Changing Climate Report, Government of Canada, Ottawa, ON, https://publications.gc.ca/collections/collection_2019/eccc/En4-368-2019-eng.pdf (last access: 21 December 2023), 2019. a
Caretta, M., Mukherji, A., Arfanuzzaman, M., Betts, R., Gelfan, A., Hirabayashi, Y., Lissner, T., Liu, J., Gunn, E. L., Morgan, R., Mwanga, S., and Supratid, S.: Water, in: Climate Change 2022: Impacts, Adaptation and Vulnerability. Contribution of Working Group II to the Sixth Assessment Report of the Intergovernmental Panel on Climate Change, edited by: Pörtner, H.-O., Roberts, D. C., Tignor, M., Poloczanska, E. S., Mintenbeck, K., Alegría, A., Craig, M., Langsdorf, S., Löschke, S., Möller, V., Okem, A., and Rama, B., Cambridge University Press, Cambridge, UK and New York, NY, USA, https://doi.org/10.1017/9781009325844.006, p. 551–712, 2022. a
Chen, Z., Wang, W., Woods, R. A., and Shao, Q.: Hydrological effects of change in vegetation components across global catchments, J. Hydrol., 595, 125775, https://doi.org/10.1016/j.jhydrol.2020.125775, 2021. a
Ciric, D., Stojanovic, M., Drumond, A., Nieto, R., and Gimeno, L.: Tracking the Origin of Moisture over the Danube River Basin Using a Lagrangian Approach, Atmosphere, 7, 162, https://doi.org/10.3390/atmos7120162, 2016. a
Cook, B. I., Mankin, J. S., Marvel, K., Williams, A. P., Smerdon, J. E., and Anchukaitis, K. J.: Twenty-First Century Drought Projections in the CMIP6 Forcing Scenarios, Earths Future, 8, e2019EF001461, https://doi.org/10.1029/2019EF001461, 2020. a, b
Cui, J., Lian, X., Huntingford, C., Gimeno, L., Wang, T., Ding, J., He, M., Xu, H., Chen, A., Gentine, P., and Piao, S.: Global water availability boosted by vegetation-driven changes in atmospheric moisture transport, Nat. Geosci., 15, 982–988, https://doi.org/10.1038/s41561-022-01061-7, 2022. a
Davin, E. L. and de Noblet-Ducoudré, N.: Climatic Impact of Global-Scale Deforestation: Radiative versus Nonradiative Processes, J. Climate, 23, 97–112, https://doi.org/10.1175/2009JCLI3102.1, 2010. a
De Hertog, S. J., Lopez-Fabara, C. E., van der Ent, R., Keune, J., Miralles, D. G., Portmann, R., Schemm, S., Havermann, F., Guo, S., Luo, F., Manola, I., Lejeune, Q., Pongratz, J., Schleussner, C.-F., Seneviratne, S. I., and Thiery, W.: Effects of idealised land cover and land management changes on the atmospheric water cycle, EGUsphere [preprint], https://doi.org/10.5194/egusphere-2023-953, 2023. a, b, c, d, e, f, g
Denissen, J. M. C., Teuling, A. J., Pitman, A. J., Koirala, S., Migliavacca, M., Li, W., Reichstein, M., Winkler, A. J., Zhan, C., and Orth, R.: Widespread shift from ecosystem energy to water limitation with climate change, Nat. Clim. Change, 12, 677–684, https://doi.org/10.1038/s41558-022-01403-8, 2022. a
De Petrillo, E., Fahrländer, S., Tuninetti, M., Andersen, L., L., M., Ridolfi, M., and Laio, F.: Reconciling tracked atmospheric water flows to close the global freshwater cycle, Research Square [preprint], https://doi.org/10.21203/rs.3.rs-4177311/v3, 2024. a
Ding, B., Zhang, Y., Yu, X., Jia, G., Wang, Y., Wang, Y., Zheng, P., and Li, Z.: Effects of forest cover type and ratio changes on runoff and its components, International Soil and Water Conservation Research, 10, 445–456, https://doi.org/10.1016/j.iswcr.2022.01.006, 2022. a
Douville, H., Raghavan, K., Renwick, J., Allan, R., Arias, P., Barlow, M., Cerezo-Mota, R., Cherchi, A., Gan, T., Gergis, J., Jiang, D., Khan, A., Mba, W. P., Rosenfeld, D., Tierney, J., and Zolina, O.: Water Cycle Changes, in: Climate Change 2021: The Physical Science Basis. Contribution of Working Group I to the Sixth Assessment Report of the Intergovernmental Panel on Climate Change, edited by: Masson-Delmotte, V., Zhai, P., Pirani, A., Connors, S. L., Péan, C., Berger, S., Caud, N., Chen, Y., Goldfarb, L., Gomis, M. I., Huang, M., Leitzell, K., Lonnoy, E., Matthews, J. B. R., Maycock, T. K., Waterfield, T., Yelekçi, O., Yu, R., and Zhou, B., Cambridge University Press, Cambridge, United Kingdom and New York, NY, USA, https://doi.org/10.1017/9781009157896.010, pp. 1055–1210, 2021. a, b, c, d, e
Duveiller, G., Hooker, J., and Cescatti, A.: The mark of vegetation change on Earth's surface energy balance, Nat. Commun., 9, 679, https://doi.org/10.1038/s41467-017-02810-8, 2018. a
Ellison, D., Morris, C. E., Locatelli, B., Sheil, D., Cohen, J., Murdiyarso, D., Gutierrez, V., van Noordwijk, M., Creed, I. F., Pokorny, J., Gaveau, D., Spracklen, D. V., Tobella, A. B., Ilstedt, U., Teuling, A. J., Gebrehiwot, S. G., Sands, D. C., Muys, B., Verbist, B., Springgay, E., Sugandi, Y., and Sullivan, C. A.: Trees, forests and water: Cool insights for a hot world, Global Environ. Change, 43, 51–61, https://doi.org/10.1016/j.gloenvcha.2017.01.002, 2017. a, b
Earth System Grid Federation (ESGF): Lawrence Livermore National Laboratory (LLNL) Metagrid node – CMIP6 Search, https://esgf-node.llnl.gov/search/cmip6/, last access: 28 September 2023. a, b, c
Fahrländer, S. F, Wang-Erlandsson, L., Pranindita, A., and Jaramillo, F.: Hydroclimatic Vulnerability of Wetlands to Upwind Land Use Changes, Earths Future, 12, e2023EF003837, https://doi.org/10.1029/2023EF003837, 2024. a
Fick, S. E. and Hijmans, R. J.: WorldClim 2: new 1-km spatial resolution climate surfaces for global land areas, Int. J. Climatol., 37, 4302–4315, https://doi.org/10.1002/joc.5086, 2017. a
Findell, K. L., Keys, P. W., Van Der Ent, R. J., Lintner, B. R., Berg, A., and Krasting, J. P.: Rising temperatures increase importance of oceanic evaporation as a source for continental precipitation, J. Climate, 32, 7713–7726, https://doi.org/10.1175/JCLI-D-19-0145.1, 2019. a, b, c
Francis, J. and Skific, N.: Evidence linking rapid Arctic warming to mid-latitude weather patterns, Philos. T. R. Soc. A, 373, 20140170, https://doi.org/10.1098/rsta.2014.0170, 2015. a
Goeking, S. A. and Tarboton, D. G.: Forests and Water Yield: A Synthesis of Disturbance Effects on Streamflow and Snowpack in Western Coniferous Forests, J. Forest., 118, 172–192, https://doi.org/10.1093/jofore/fvz069, 2020. a
Griscom, B. W., Adams, J., Ellis, P. W., Houghton, R. A., Lomax, G., Miteva, D. A., Schlesinger, W. H., Shoch, D., Siikamäki, J. V., Smith, P., Woodbury, P., Zganjar, C., Blackman, A., Campari, J., Conant, R. T., Delgado, C., Elias, P., Gopalakrishna, T., Hamsik, M. R., Herrero, M., Kiesecker, J., Landis, E., Laestadius, L., Leavitt, S. M., Minnemeyer, S., Polasky, S., Potapov, P., Putz, F. E., Sanderman, J., Silvius, M., Wollenberg, E., and Fargione, J.: Natural climate solutions, P. Natl. Acad. Sci. USA, 114, 11645–11650, https://doi.org/10.1073/pnas.1710465114, 2017. a
Guimberteau, M., Ciais, P., Ducharne, A., Boisier, J. P., Dutra Aguiar, A. P., Biemans, H., De Deurwaerder, H., Galbraith, D., Kruijt, B., Langerwisch, F., Poveda, G., Rammig, A., Rodriguez, D. A., Tejada, G., Thonicke, K., Von Randow, C., Von Randow, R. C. S., Zhang, K., and Verbeeck, H.: Impacts of future deforestation and climate change on the hydrology of the Amazon Basin: a multi-model analysis with a new set of land-cover change scenarios, Hydrol. Earth Syst. Sci., 21, 1455–1475, https://doi.org/10.5194/hess-21-1455-2017, 2017. a
Hansen, M. C., Potapov, P. V., Moore, R., Hancher, M., Turubanova, S. A., Tyukavina, A., Thau, D., Stehman, S. V., Goetz, S. J., Loveland, T. R., Kommareddy, A., Egorov, A., Chini, L., Justice, C. O., and Townshend, J. R. G.: High-Resolution Global Maps of 21st-Century Forest Cover Change, Science, 342, 850–853, https://doi.org/10.1126/science.1244693, 2013. a, b, c, d
Hay, L. E. and McCabe, G. J.: Hydrologic effects of climate change in the Yukon River Basin, Climatic Change, 100, 509–523, https://doi.org/10.1007/s10584-010-9805-x, 2010. a, b, c
Herrick, J. E., Abrahamse, T., Abhilash, P. C., Ali, S. H., Alvarez-Torres, P., Barau, A. S., Branquinho, C., Chhatre, A., Chotte, J. L., Cowie, A. L., Davis, K. F., Edrisi, S. A., Fennessy, M. S., Fletcher, S., Flores-Díaz, A. C., Franco, I. B., Ganguli, A. C., Ifejika Speranza, C., Kamar, M. J., Kaudia, A. A., Kimiti, D. W., Luz, A. C., Matos, P., Metternicht, G., Neff, J., Nunes, A., Olaniyi, A. O., Pinho, P., Primmer, E., Quandt, A., Sarkar, P., Scherr, S. J., Singh, A., Sudoi, V., von Maltitz, G. P., Wertz, L., and Zeleke, G.: Land restoration for achieving the sustainable development goals: An international resource panel think piece, United Nations Environment Programme, https://www.resourcepanel.org/reports/land-restoration-achieving-sustainable-development-goals (last access: 17 January 2024), 2019. a
Hoek van Dijke, A. J., Herold, M., Mallick, K., Benedict, I., Machwitz, M., Schlerf, M., Pranindita, A., Theeuwen, J. J. E., Bastin, J.-F., and Teuling, A. J.: Shifts in regional water availability due to global tree restoration, Nat. Geosci., 15, 363–368, https://doi.org/10.1038/s41561-022-00935-0, 2022. a, b, c, d, e, f, g, h
Holgate, C. M., Evans, J. P., van Dijk, A. I. J. M., Pitman, A. J., and Virgilio, G. D.: Australian Precipitation Recycling and Evaporative Source Regions, J. Climate, 33, 8721–8735, https://doi.org/10.1175/JCLI-D-19-0926.1, 2020. a
Hong, T., Wu, J., Kang, X., Yuan, M., and Duan, L.: Impacts of Different Land Use Scenarios on Future Global and Regional Climate Extremes, Atmosphere, 13, 995, https://doi.org/10.3390/atmos13060995, 2022. a, b
Hurtt, G. C., Chini, L., Sahajpal, R., Frolking, S., Bodirsky, B. L., Calvin, K., Doelman, J. C., Fisk, J., Fujimori, S., Klein Goldewijk, K., Hasegawa, T., Havlik, P., Heinimann, A., Humpenöder, F., Jungclaus, J., Kaplan, J. O., Kennedy, J., Krisztin, T., Lawrence, D., Lawrence, P., Ma, L., Mertz, O., Pongratz, J., Popp, A., Poulter, B., Riahi, K., Shevliakova, E., Stehfest, E., Thornton, P., Tubiello, F. N., van Vuuren, D. P., and Zhang, X.: Harmonization of global land use change and management for the period 850–2100 (LUH2) for CMIP6, Geosci. Model Dev., 13, 5425–5464, https://doi.org/10.5194/gmd-13-5425-2020, 2020. a
Kazemi, H., Sarukkalige, R., and Badrzadeh, H.: Evaluation of streamflow changes due to climate variation and human activities using the Budyko approach, Environ. Earth Sci., 78, 713, https://doi.org/10.1007/s12665-019-8735-9, 2019. a
King, J. A., Weber, J., Lawrence, P., Roe, S., Swann, A. L. S., and Val Martin, M.: Global and regional hydrological impacts of global forest expansion, Biogeosciences, 21, 3883–3902, https://doi.org/10.5194/bg-21-3883-2024, 2024. a, b, c
Köppen, W.: Das geographische System der Klimate, Handbuch der Klimatologie, Gebrüder Borntraeger, Berlin, 1–44, https://upload.wikimedia.org/wikipedia/commons/3/3c/Das_geographische_System_der_Klimate_(1936).pdf (last access: 20 January 2024), 1936. a
Kuma, P., Bender, F. A.-M., and Jönsson, A. R.: Climate Model Code Genealogy and Its Relation to Climate Feedbacks and Sensitivity, J. Adv. Model. Earth Sy., 15, e2022MS003588, https://doi.org/10.1029/2022MS003588, 2023. a
Lee, J.-Y., Marotzke, J., Bala, G., Cao, L., Corti, S., Dunne, J., Engelbrecht, F., Fischer, E., Fyfe, J., Jones, C., Maycock, A., Mutemi, J., Ndiaye, O., Panickal, S., and Zhou, T.: Future Global Climate: Scenario-Based Projections and Near-Term Information, in: Climate Change 2021: The Physical Science Basis. Contribution of Working Group I to the Sixth Assessment Report of the Intergovernmental Panel on Climate Change, edited by: Masson-Delmotte, V., Zhai, P., Pirani, A., Connors, S. L., Péan, C., Berger, S., Caud, N., Chen, Y., Goldfarb, L., Gomis, M. I., Huang, M., Leitzell, K., Lonnoy, E., Matthews, J. B. R., Maycock, T. K., Waterfield, T., Yelekçi, O., Yu, R., and Zhou , B., Cambridge University Press, Cambridge, United Kingdom and New York, NY, USA, https://doi.org/10.1017/9781009157896.006, pp. 553–672, 2021. a
Li, S., Wang, G., Zhu, C., Lu, J., Ullah, W., Hagan, D. F. T., Kattel, G., and Peng, J.: Attribution of global evapotranspiration trends based on the Budyko framework, Hydrol. Earth Syst. Sci., 26, 3691–3707, https://doi.org/10.5194/hess-26-3691-2022, 2022a. a, b, c, d
Li, W., Migliavacca, M., Forkel, M., Denissen, J. M. C., Reichstein, M., Yang, H., Duveiller, G., Weber, U., and Orth, R.: Widespread increasing vegetation sensitivity to soil moisture, Nat. Commun., 13, 3959, https://doi.org/10.1038/s41467-022-31667-9, 2022b. a
Li, X. and Li, Z.: Global water availability and its distribution under the Coupled Model Intercomparison Project Phase Six scenarios, Int. J. Climatol., 42, 5748–5767, https://doi.org/10.1002/joc.7559, 2022. a, b, c, d
Liu, C. L. C., Kuchma, O., and Krutovsky, K. V.: Mixed-species versus monocultures in plantation forestry: Development, benefits, ecosystem services and perspectives for the future, Global Ecology and Conservation, 15, e00419, https://doi.org/10.1016/j.gecco.2018.e00419, 2018. a
Lovato, T., Peano, D., Butenschön, M., Materia, S., Iovino, D., Scoccimarro, E., Fogli, P. G., Cherchi, A., Bellucci, A., Gualdi, S., Masina, S., and Navarra, A.: CMIP6 Simulations With the CMCC Earth System Model (CMCC-ESM2), J. Adv. Model. Earth Sy., 14, e2021MS002814, https://doi.org/10.1029/2021MS002814, 2022. a
Meier, R., Schwaab, J., Seneviratne, S., Sprenger, M., Lewis, E., and Davin, E.: Empirical estimate of forestation-induced precipitation changes in Europe, Nat. Geosci., 14, 1–6, https://doi.org/10.1038/s41561-021-00773-6, 2021. a
Milly, P. C. and Dunne, K. A.: Potential evapotranspiration and continental drying, Nat. Clim. Change, 6, 946–949, https://doi.org/10.1038/nclimate3046, 2016. a
O'Neill, B. C., Tebaldi, C., van Vuuren, D. P., Eyring, V., Friedlingstein, P., Hurtt, G., Knutti, R., Kriegler, E., Lamarque, J.-F., Lowe, J., Meehl, G. A., Moss, R., Riahi, K., and Sanderson, B. M.: The Scenario Model Intercomparison Project (ScenarioMIP) for CMIP6, Geosci. Model Dev., 9, 3461–3482, https://doi.org/10.5194/gmd-9-3461-2016, 2016. a
Oudin, L., Andréassian, V., Lerat, J., and Michel, C.: Has land cover a significant impact on mean annual streamflow? An international assessment using 1508 catchments, J. Hydrol., 357, 303–316, https://doi.org/10.1016/j.jhydrol.2008.05.021, 2008. a, b
Piao, S., Friedlingstein, P., Ciais, P., de Noblet-Ducoudré, N., Labat, D., and Zaehle, S.: Changes in Climate and Land Use Have a Larger Direct Impact Than Rising CO2 on Global River Runoff Trends, P. Natl. Acad. Sci. USA, 104, 15242–15247, https://doi.org/10.1073/pnas.0707213104, 2007. a
Portmann, R., Beyerle, U., Davin, E., Fischer, E. M., De Hertog, S., and Schemm, S.: Global forestation and deforestation affect remote climate via adjusted atmosphere and ocean circulation, Nat. Commun., 13, 5569, https://doi.org/10.1038/s41467-022-33279-9, 2022. a, b, c
Priestley, C. H. B. and Taylor, R. J.: On the assessment of surface heat flux and evaporation using large-scale parameters, Mon. Weather Rev., 100, 81–92, https://doi.org/10.1175/1520-0493(1972)100<0081:OTAOSH>2.3.CO;2, 1972. a
Probst, E. and Mauser, W.: Climate Change Impacts on Water Resources in the Danube River Basin: A Hydrological Modelling Study Using EURO-CORDEX Climate Scenarios, Water, 15, 8, https://doi.org/10.3390/w15010008, 2023. a, b
Rasouli, K., Pomeroy, J. W., and Whitfield, P. H.: Are the effects of vegetation and soil changes as important as climate change impacts on hydrological processes?, Hydrol. Earth Syst. Sci., 23, 4933–4954, https://doi.org/10.5194/hess-23-4933-2019, 2019. a, b, c, d
Roebroek, C. T. J., Caporaso, L., Duveiller, G., Davin, E. L., Seneviratne, S. I., and Cescatti, A.: Tree cover carrying capacity, ETH Zurich [data set], https://doi.org/10.3929/ethz-b-000637086, 2023. a, b
Roebroek, C. T. J., Caporaso, L., Duveiller, G., Davin, E. L., Seneviratne, S. I., and Cescatti, A.: Potential tree cover under current and future climate scenarios, Sci. Data, 12, 564, https://doi.org/10.1038/s41597-025-04408-y, 2025. a, b, c, d, e, f, g, h
Sellar, A. A., Jones, C. G., Mulcahy, J. P., Tang, Y., Yool, A., Wiltshire, A., O'Connor, F. M., Stringer, M., Hill, R., Palmieri, J., Woodward, S., de Mora, L., Kuhlbrodt, T., Rumbold, S. T., Kelley, D. I., Ellis, R., Johnson, C. E., Walton, J., Abraham, N. L., Andrews, M. B., Andrews, T., Archibald, A. T., Berthou, S., Burke, E., Blockley, E., Carslaw, K., Dalvi, M., Edwards, J., Folberth, G. A., Gedney, N., Griffiths, P. T., Harper, A. B., Hendry, M. A., Hewitt, A. J., Johnson, B., Jones, A., Jones, C. D., Keeble, J., Liddicoat, S., Morgenstern, O., Parker, R. J., Predoi, V., Robertson, E., Siahaan, A., Smith, R. S., Swaminathan, R., Woodhouse, M. T., Zeng, G., and Zerroukat, M.: UKESM1: Description and Evaluation of the U. K. Earth System Model, J. Adv. Model. Earth Sy., 11, 4513–4558, https://doi.org/10.1029/2019MS001739, 2019. a
Shaw, T. A.: Mechanisms of Future Predicted Changes in the Zonal Mean Mid-Latitude Circulation, Current Climate Change Reports, 5, 345–357, https://doi.org/10.1007/s40641-019-00145-8, 2019. a
Shiogama, H., Fujimori, S., Hasegawa, T., Hayashi, M., Hirabayashi, Y., Ogura, T., Iizumi, T., Takahashi, K., and Takemura, T.: Important distinctiveness of SSP3-7.0 for use in impact assessments, Nat. Clim. Change, 13, 1276–1278, https://doi.org/10.1038/s41558-023-01883-2, 2023. a
Staal, A., Meijer, P., Nyasulu, M. K., Tuinenburg, O. A., and Dekker, S. C.: Global terrestrial moisture recycling in Shared Socioeconomic Pathways, Earth Syst. Dynam., 16, 215–238, https://doi.org/10.5194/esd-16-215-2025, 2025a. a, b
Staal, A., Theeuwen, J. J. E., Wang-Erlandsson, L., Wunderling, N., and Dekker, S. C.: Targeted rainfall enhancement as an objective of forestation, Glob. Change Biol., 30, e17096, https://doi.org/10.1111/gcb.17096, 2024b. a
Sterling, S., Ducharne, A., and Polcher, J.: The impact of global land-cover change on the terrestrial water cycle, Nat. Clim. Change, 3, 385–390, https://doi.org/10.1038/nclimate1690, 2013. a, b
Tatebe, H., Ogura, T., Nitta, T., Komuro, Y., Ogochi, K., Takemura, T., Sudo, K., Sekiguchi, M., Abe, M., Saito, F., Chikira, M., Watanabe, S., Mori, M., Hirota, N., Kawatani, Y., Mochizuki, T., Yoshimura, K., Takata, K., O'ishi, R., Yamazaki, D., Suzuki, T., Kurogi, M., Kataoka, T., Watanabe, M., and Kimoto, M.: Description and basic evaluation of simulated mean state, internal variability, and climate sensitivity in MIROC6, Geosci. Model Dev., 12, 2727–2765, https://doi.org/10.5194/gmd-12-2727-2019, 2019. a
Tavares, J. V., Oliveira, R. S., Mencuccini, M., Signori-Müller, C., Pereira, L., Diniz, F. C., Gilpin, M., Marca-Zevallos, M. J., Salas Yupayccana, C. A., Acosta, M., Pérez-Mullisaca, F. M., Barros, F. d. V., Bittencourt, P., Jancoski, H., Scalon, M. C., Marimon, B. S., Menor, I. O., Marimon Jr, B. H., Fancourt, M., Chambers-Ostler, A., Esquivel-Muelbert, A., Rowland, L., Meir, P., da Costa, A. C. L., Nina, A., Sanchez, J. M. B., Tintaya, J. S., Chino, R. S. C., Baca, J., Fernandes, L., Cumapa, E. R. M., Santos, J. A. R., Teixeira, R., Tello, L., Ugarteche, M. T. M., Cuellar, G. A., Martinez, F., Araujo-Murakami, A., Almeida, E., da Cruz, W. J. A., del Aguila Pasquel, J., Aragāo, L., Baker, T. R., de Camargo, P. B., Brienen, R., Castro, W., Ribeiro, S. C., de Souza, F. C., Cosio, E. G., Cardozo, N. D., da Costa Silva, R., Disney, M., Espejo, J. S., Feldpausch, T. R., Ferreira, L., Giacomin, L., Higuchi, N., Hirota, M., Honorio, E., Huasco, W. H., Lewis, S., Llampazo, G. F., Malhi, Y., Monteagudo-Mendoza, A., Morandi, P., Moscoso, V. C., Muscarella, R., Penha, D., Rocha, M. C., Rodrigues, G., Ruschel, A. R., Salinas, N., Schlickmann, M., Silveira, M., Talbot, J., Vásquez, R., Vedovato, L., Vieira, S. A., Phillips, O. L., Gloor, E., and Galbraith, D. R.: Basin-wide variation in tree hydraulic safety margins predicts the carbon balance of Amazon forests, Nature, 617, 111–117, https://doi.org/10.1038/s41586-023-05971-3, 2023. a
Teuling, A. J. and Hoek van Dijke, A. J.: Forest age and water yield, Nature, 578, E16–E18, https://doi.org/10.1038/s41586-020-1941-5, 2020. a
Teuling, A. J., de Badts, E. A. G., Jansen, F. A., Fuchs, R., Buitink, J., Hoek van Dijke, A. J., and Sterling, S. M.: Climate change, reforestation/afforestation, and urbanization impacts on evapotranspiration and streamflow in Europe, Hydrol. Earth Syst. Sci., 23, 3631–3652, https://doi.org/10.5194/hess-23-3631-2019, 2019. a, b, c, d, e, f, g, h
Theeuwen, J. J. E., Staal, A., Tuinenburg, O. A., Hamelers, B. V. M., and Dekker, S. C.: Local moisture recycling across the globe, Hydrol. Earth Syst. Sci., 27, 1457–1476, https://doi.org/10.5194/hess-27-1457-2023, 2023. a
Trenberth, K. E.: Changes in precipitation with climate change, Clim. Res., 47, 123–138, https://doi.org/10.3354/cr00953, 2011. a
Tuinenburg, O. A. and Staal, A.: Tracking the global flows of atmospheric moisture and associated uncertainties, Hydrol. Earth Syst. Sci., 24, 2419–2435, https://doi.org/10.5194/hess-24-2419-2020, 2020. a
Tuinenburg, O. A., Theeuwen, J. J. E., and Staal, A.: High-resolution global atmospheric moisture connections from evaporation to precipitation, Earth Syst. Sci. Data, 12, 3177–3188, https://doi.org/10.5194/essd-12-3177-2020, 2020a. a, b, c, d, e
Tuinenburg, O. A., Theeuwen, J. J. E., and Staal, A.: Global evaporation to precipitation flows obtained with Lagrangian atmospheric moisture tracking, PANGAEA [data set], https://doi.org/10.1594/PANGAEA.912710, 2020b. a, b
Tuinenburg, O. A., Bosmans, J. H. C., and Staal, A.: The global potential of forest restoration for drought mitigation, Environ. Res. Lett., 17, 1–8, https://doi.org/10.1088/1748-9326/ac55b8, 2022. a, b, c, d
Vecchi, G. A., Soden, B. J., Wittenberg, A. T., Held, I. M., Leetmaa, A., and Harrison, M. J.: Weakening of tropical Pacific atmospheric circulation due to anthropogenic forcing, Nature, 441, 73–76, https://doi.org/10.1038/nature04744, 2006. a
Veldman, J. W., Overbeck, G. E., Negreiros, D., Mahy, G., Le Stradic, S., Fernandes, G. W., Durigan, G., Buisson, E., Putz, F. E., and Bond, W. J.: Where Tree Planting and Forest Expansion are Bad for Biodiversity and Ecosystem Services, BioScience, 65, 1011–1018, https://doi.org/10.1093/biosci/biv118, 2015. a
Volodin, E. M., Mortikov, E. V., Kostrykin, S. V., Galin, V. Y., Lykossov, V. N., Gritsun, A. S., Diansky, N. A., Gusev, A. V., and Iakovlev, N. G.: Simulation of the present-day climate with the climate model INMCM5, Clim. Dynam., 49, 3715–3734, https://doi.org/10.1007/s00382-017-3539-7, 2017. a
Wang, A., Miao, Y., Kong, X., and Wu, H.: Future Changes in Global Runoff and Runoff Coefficient From CMIP6 Multi-Model Simulation Under SSP1-2.6 and SSP5-8.5 Scenarios, Earths Future, 10, e2022EF002910, https://doi.org/10.1029/2022EF002910, 2022. a
Wang-Erlandsson, L., Fetzer, I., Keys, P. W., van der Ent, R. J., Savenije, H. H. G., and Gordon, L. J.: Remote land use impacts on river flows through atmospheric teleconnections, Hydrol. Earth Syst. Sci., 22, 4311–4328, https://doi.org/10.5194/hess-22-4311-2018, 2018. a, b, c
Wey, H.-W., Pongratz, J., Nabel, J. E. M. S., and Naudts, K.: Effects of Increased Drought in Amazon Forests Under Climate Change: Separating the Roles of Canopy Responses and Soil Moisture, J. Geophys. Res.-Biogeo., 127, e2021JG006525, https://doi.org/10.1029/2021JG006525, 2022. a
Wilcoxon, F.: Individual Comparisons by Ranking Methods, Biometrics Bull., 1, 80–83, https://doi.org/10.2307/3001968, 1945. a
Yang, Y., Roderick, M., Guo, H., Miralles, D., Zhang, L., Fatichi, S., Luo, X., Zhang, Y., McVicar, T., Tu, Z., Keenan, T., Fisher, J., Gan, R., Zhang, X., Piao, S., Zhang, B., and Yang, D.: Evapotranspiration on a greening Earth, Nature Reviews Earth & Environment, 4, 626–641, https://doi.org/10.1038/s43017-023-00464-3, 2023. a
Yazdandoost, F., Moradian, S., Izadi, A., and Aghakouchak, A.: Evaluation of CMIP6 precipitation simulations across different climatic zones: Uncertainty and model intercomparison, Atmos. Res., 250, 105369, https://doi.org/10.1016/j.atmosres.2020.105369, 2021. a
Yu, L., Liu, Y., Liu, T., and Yan, F.: Impact of recent vegetation greening on temperature and precipitation over China, Agr. Forest Meteorol., 295, 108197, https://doi.org/10.1016/j.agrformet.2020.108197, 2020. a
Zhang, B., Tian, L., Yang, Y., and He, X.: Revegetation Does Not Decrease Water Yield in the Loess Plateau of China, Geophys. Res. Lett., 49, e2022GL098025, https://doi.org/10.1029/2022GL098025, 2022a. a
Zhang, L., Dawes, W. R., and Walker, G. R.: Response of mean annual evapotranspiration to vegetation changes at catchment scale, Water Resour. Res., 37, 701–708, https://doi.org/10.1029/2000wr900325, 2001. a, b, c, d
Zhang, L., Hickel, K., Dawes, W. R., Chiew, F. H. S., Western, A. W., and Briggs, P. R.: A rational function approach for estimating mean annual evapotranspiration, Water Resour. Res., 40, https://doi.org/10.1029/2003wr002710, 2004. a, b, c
Zhang, X., Zhang, Y., T. J., Ma, N., and Wang, Y.-P.: CO2 fertilization is spatially distinct from stomatal conductance reduction in controlling ecosystem water-use efficiency increase, Environ. Res. Lett., 17, 054048, https://doi.org/10.1088/1748-9326/ac6c9c, 2022b. a
Zhao, T. and Dai, A.: CMIP6 Model-projected Hydroclimatic and Drought Changes and Their Causes in the Twenty-First Century, J. Climate, 35, 897–921, https://doi.org/10.1175/JCLI-D-21-0442.1, 2021. a
Zhou, S., Yu, B., Huang, Y., and Wang, G.: The complementary relationship and generation of the Budyko functions, Geophys. Res. Lett., 42, 1781–1790, https://doi.org/10.1002/2015GL063511, 2015. a
Zhu, Z., Piao, S., Myneni, R. B., Huang, M., Zeng, Z., Canadell, J. G., Ciais, P., Sitch, S., Friedlingstein, P., Arneth, A., Cao, C., Cheng, L., Kato, E., Koven, C., Li, Y., Lian, X., Liu, Y., Liu, R., Mao, J., Pan, Y., Peng, S., Peuelas, J., Poulter, B., Pugh, T. A., Stocker, B. D., Viovy, N., Wang, X., Wang, Y., Xiao, Z., Yang, H., Zaehle, S., and Zeng, N.: Greening of the Earth and its drivers, Nat. Clim. Change, 6, 791–795, https://doi.org/10.1038/nclimate3004, 2016. a