the Creative Commons Attribution 4.0 License.
the Creative Commons Attribution 4.0 License.
 | 07 Apr 2025
Multivariate and long-term time series analysis to assess the effect of nitrogen management policy on groundwater quality in Wallonia, BE
Elise Verstraeten
Louise Collier
Marnik Vanclooster
Groundwater nitrate contamination remains a significant environmental and health concern, as the effectiveness of nitrogen management programmes has shown mixed results. This study leverages nearly 2 decades of groundwater monitoring data to assess and explain nitrate contamination trends in vulnerable zones in Wallonia, Belgium, following the implementation of the regional sustainable nitrogen management programme.
Using nitrate concentration time series (2002–2020) from 36 monitoring points across four groundwater bodies, we calculated six nitrate pollution indicators that capture the long-term trend and dynamics. To explain these trends and dynamics, spatially explicit variables describing potential contamination drivers were compiled, and their relationships with the nitrate pollution indicators were assessed using correlation analyses and multivariate regressions.
Although mean groundwater nitrate concentrations remained stable due to nitrogen legacy effects, decreases were observed in the Brusselian sands, where concentrations were initially higher relative to the other bodies, while increases were found in the Geer basin chalks, typically less contaminated. While these diverging trends could be explained by differences in aquifer characteristics and nitrate transfer time lags, results also suggest that agricultural land cover continues to have a negative impact on nitrate contamination, even 20 years after implementing the Programme de Gestion Durable de l'Azote en Agriculture (PGDA).
Importantly, the findings are not fully conclusive due to the limited predictive power of the regression models. This highlights the multifaceted nature of groundwater nitrate contamination and the challenges in defining input variables that accurately capture the drivers. Future studies could explore integrating modelling approaches to supplement observational data with modelled data as inputs to statistical models or to combine data-driven models and process-based models.
Overall, this study emphasizes the need for sustained and adaptive nitrogen management policies, especially in vulnerable aquifers and cropland-dominated regions, alongside sustained long-term monitoring efforts given the time lags and nitrogen legacy effects. It also underscores the need for spatially and temporally detailed datasets to successfully conduct non-linear machine learning approaches that can capture the complex interactions involved.
- Article
(2389 KB) - Full-text XML
-
Supplement
(470 KB) - BibTeX
- EndNote


For several decades, concerns have been raised about elevated nitrate concentrations in groundwater. These high nitrate levels are harmful to the environment, as they contribute to the biodiversity loss and eutrophication of the aquatic ecosystems (Grizzetti et al., 2011; Hornung, 1999; de Vries et al., 2024) and can pose serious health risks when the groundwater is used for drinking water (Bouchard et al., 1992; Comly, 1945; de Vries et al., 2024; Schullehner et al., 2018; Ward et al., 2018). Despite extensive research, understanding the factors underlying nitrate concentrations and trends is complicated by the diffuse, long-term, and multi-causal nature of the contamination (Shukla and Saxena, 2018).
The primary anthropogenic sources of nitrates in groundwater are agricultural activities (Spalding and Exner, 1993; Wick et al., 2012). However, non-agricultural sources, such as inadequate treatment and disposal of human waste and wastewater, landfill, and industrial waste, can also be significant contributors to high concentrations in aquifers (Mattern et al., 2009; Vanclooster et al., 2020; Wakida and Lerner, 2005). While human activities drive increased nitrogen input to the soil, the leaching of nitrates to groundwater is also influenced by natural processes as part of the nitrogen cycle (Ward, 2013).
Specifically, nitrate formation is driven by nitrification, a process in which ammonium, introduced into soils through atmospheric deposition, fertilizers, and the mineralization of organic matter, is oxidized to nitrate. In contrast, nitrate concentration levels decrease through plants and microbial uptake, as well as through denitrification, which transforms nitrate into nitrogen gas under anaerobic conditions. These processes are influenced by environmental factors such as climate, soil composition, geological formation, and the depth of groundwater tables.
To address the environmental and health risks associated with nitrate pollution, the European Union's Nitrates Directive (91/676/EEC) has played a central role in promoting best management practices (BMPs) that mitigate agricultural nitrate contamination. Established in 1991, the directive aims to protect water bodies by requiring member states to identify nitrate vulnerable zones (NVZs) and implement targeted measures to reduce nitrate leaching, aiming to maintain surface and groundwater nitrate concentrations below 50 mg L−1.
Studies evaluating the effectiveness of such policies have shown mixed results. While many report encouraging signs of reduced nitrate pollution due to improved nitrogen management practices, others highlight persistent challenges, with continued increases or limited improvement in concentrations in many locations (Ferguson, 2015; van Grinsven et al., 2012, 2016; Hansen et al., 2012, 2017). In Wallonia (Belgium), the European Directive was transposed into a programme for sustainable nitrogen management (Programme de Gestion Durable de l'Azote en Agriculture, PGDA) in 2002. This programme includes region-wide measures and additional requirements in the NVZs, including restrictions on manure spreading, mandatory soil cover, and groundwater monitoring (Picron et al., 2017). In compliance with the Water Framework Directive (WFD; 2000/60/EC) and the Groundwater Directive (GWD; 2006/118/EC), the Walloon regional authority monitors groundwater nitrate concentrations to identify vulnerable areas and to evaluate the effectiveness of the PGDA (SPW – DEE – Direction des Eaux souterraines, 2024). The observed effectiveness so far is debatable without clear overall signs of improvement (Batlle Aguilar et al., 2007; SPW – DEE – Direction des Eaux souterraines, 2024). Many control sites keep exceeding the European guide level of 25 mg L−1, and most of the groundwater bodies in the nitrate vulnerable zones (NVZs), partially or locally, have high levels and several exceedances of the standard of 50 mg L−1. Despite this, average nitrate levels in some aquifers have been shown to stabilize or even decrease in recent years.
To better understand the impacts of the PGDA on nitrogen dynamics, Sohier and Degré (2010) modelled soil nitrogen surpluses using a modified version of the process-oriented EPIC model (Williams et al., 1984). Their work demonstrated the positive effects of certain agricultural practices while also highlighting significant variability driven by weather conditions, particularly precipitation. The regional authority uses this model to assess the agricultural soil nitrogen balance (SPW, 2025). However, the results are dependent on the hypotheses and assumptions underlying the model. They might overlook parts of the complex biological, physical, and chemical interactions at play and limit the prediction accuracy (Sit et al., 2020). As a complement to the modelling approach, in order to evaluate the impact of nitrate management considering variations in geographical location, weather conditions, and culture types, soil nitrate concentrations were measured at the end of the agricultural crop season in 55 reference farms in Wallonia to assess potentially leachable nitrogen (known as “Azote Potentiellement Lessivable” – APL) (Marcoen et al., 2002). Vandenberghe (2016) showed that the in situ APL measurements are correlated with agricultural practices, such as fertilization and crop management, and with nitrate concentrations in soil. However, as these measurements are limited in both space and time, they do not allow comprehensive assessments of nitrate contamination trends. Moreover, soil and soil water nitrate concentrations differ from groundwater nitrate concentrations, as the latter are affected by nitrate transfer lags through soil matrices (Hansen et al., 2012; Mattern and Vanclooster, 2010; Visser et al., 2007) and the slow release of accumulated nitrogen (Ascott et al., 2017; Kyte et al., 2023; Liu et al., 2024), a phenomenon referred to as the “nitrogen legacy effect” (Basu et al., 2022; Van Meter et al., 2016).
Here, we consider that data-driven techniques, leveraging long-term groundwater quality data, are a promising approach (He et al., 2022; Rodriguez-Galiano et al., 2014) to complement the limitations raised and enable broader insights into nitrate pollution drivers. Such data encode all the processes controlling the nitrate contamination, and they are becoming widely available.
This study aims to conduct a data-driven approach to assess and explain the groundwater nitrate contamination trends in Wallonia over nearly 2 decades, following the implementation of the PGDA. Specifically, our objectives are
-
to assess the long-term (2002–2020) evolution of nitrate concentrations,
-
to identify the factors driving the nitrate concentration changes over time and across different locations.
2.1 Study area
Our study area focuses on key nitrate vulnerable zones (NVZs) in the region of Wallonia, Belgium, where nitrate contamination levels are the highest (SPW – DEE – Direction des Eaux souterraines, 2024). Specifically, it includes all monitored sites where levels currently exceed 50 mg L−1. The PGDA defines stricter measures which are applicable only in these areas, such as specific spreading periods and conditions, obligations regarding soil cover, and monitoring requirements (Picron et al., 2017). We selected four groundwater bodies where a major drinking water company supplying the monitoring data operates several extraction sites: the Geer basin chalks, the Brusselian sands, the Haine basin chalks, and the Landenian sands (Fig. 1). The concept of a “water body” was introduced within the Water Framework Directive to classify the various aquatic environments that characterize the European territory. A groundwater body consists of a distinct volume of groundwater within one or more aquifers. In Wallonia, the groundwater bodies were delineated by a group of experts based on hydrogeological criteria, such as the extent of geological layers or the interaction with surface waters, and on non-hydrogeological criteria, such as the administrative limits. The Geer basin chalks and the Brusselian sands were part of the first nitrate vulnerable zones as defined in 1994 and have thus been subjected to the associated regulations since then. The Haine basin chalks and the Landenian sands were added to the NVZ in 2013.
The groundwater body of the Geer basin chalks covers an area of 440 km2 and is located in the Meuse hydrographic basin (SPW, 2016). The groundwater body's aquifer, the Hesbaye aquifer, is said to have a substantial storage capacity and a high porosity. It is partly overlaid in its northeastern portion by the Landenian sands groundwater body. Agricultural land covers approximately 68 % of the land surface, with 14 % of it being meadows and 86 % being crops. The region has a high population density with 340 inhabitants per square kilometre.
The groundwater body of the Landenian sands spans a surface of 206 km2 and is located within the Scheldt hydrographic basin (SPW, 2010). The groundwater body's aquifer is the Landenian sands aquifer. Due to limited exploitation, the hydrogeological properties of this aquifer remain poorly defined. Agricultural land covers approximately 78 % of the total land surface, with meadows accounting for 8 % and crops making up the remaining 92 %. The population density is relatively low, with 160 inhabitants per square kilometre.
The groundwater body of the Brusselian sands spans a surface of 964.5 km2 and is situated in the Scheldt hydrographic basin (SPW, 2006b). Its aquifer is the Brusselian sands aquifer, which has a high storage capacity but a low hydraulic conductivity. Agriculture covers 71 % of the land surface, and another 10 % is urban land.
The groundwater body of the Haine basin chalks covers an area of 644 km2 and is situated in the Scheldt hydrographic basin (SPW, 2006a). The main aquifer of this water body is the Mons basin chalks aquifer. The aquifer's porosity has a permeability ranging from 10−5 to 10−7 m s−1, while the fissures in the chalk formation entail a permeability of to m s−1. In the northwest, the groundwater body is partially overlaid by the groundwater body of the Haine valley sands. The land surface area consists of 64 % agricultural land and 23 % urban land.
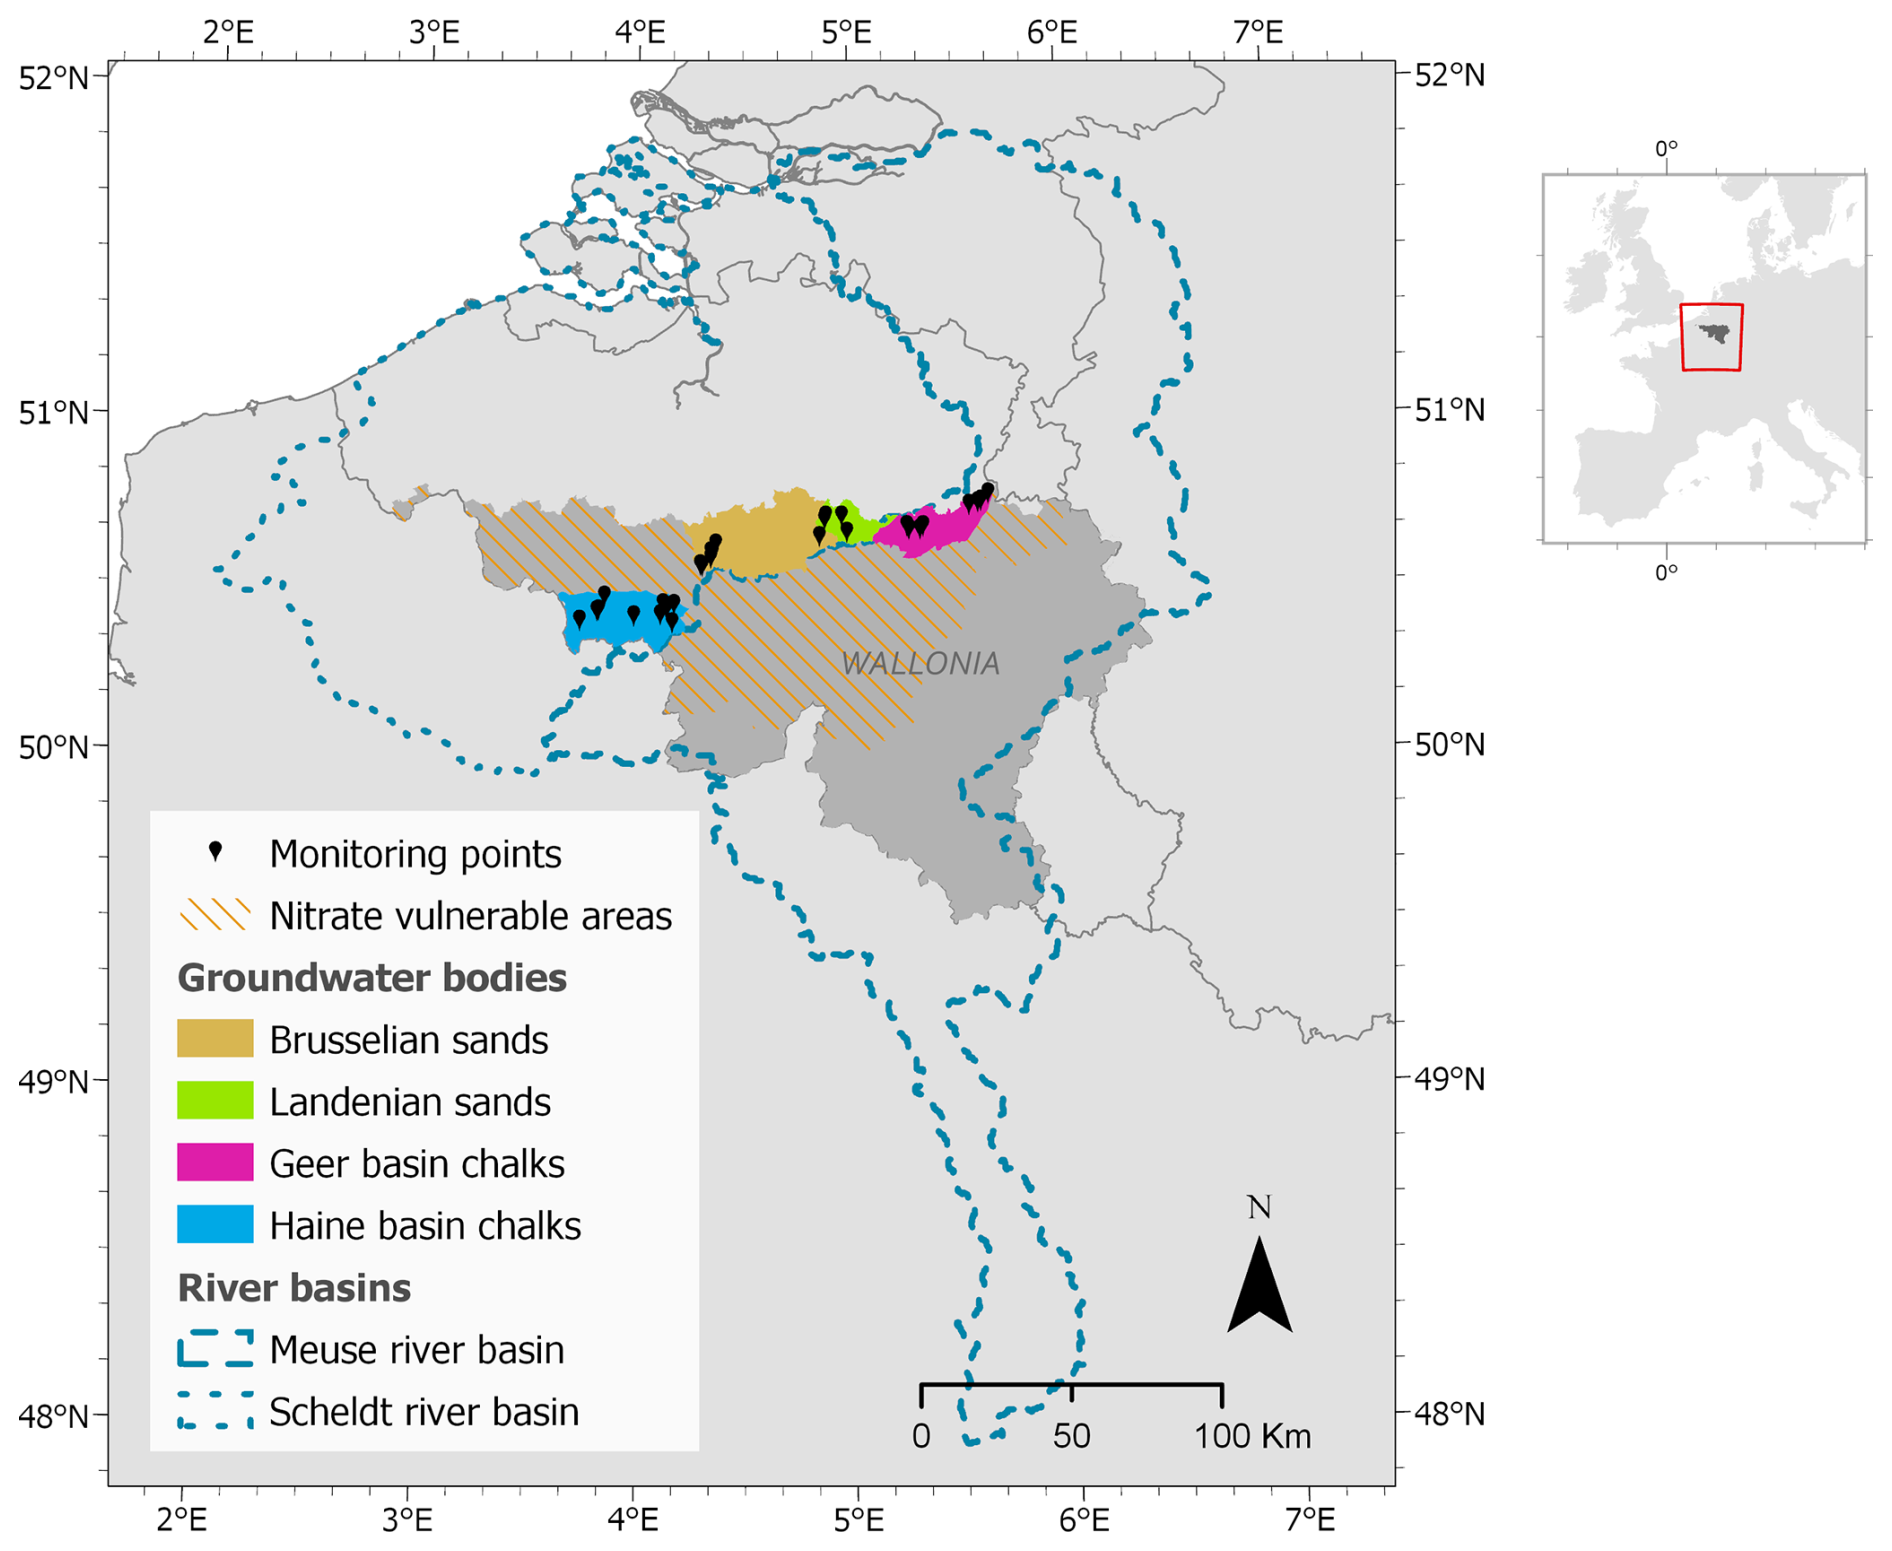
Figure 1Location of the four groundwater bodies and the 36 monitoring points.
2.2 Groundwater nitrate concentration
2.2.1 Data collection
The monitoring points are water intake structures exploited for drinking water production by the Société Wallonne des Eaux (SWDE). They are wells, galleries, springs, and drains. Only points in unconfined aquifers, with a water quality monitoring period exceeding 10 years, were selected. Since our focus is on vulnerable groundwater with high nitrate concentrations, we excluded one monitoring point located in anoxic groundwater, where nitrate levels are below 3 mg L−1, probably resulting from high denitrification rates (Rivett et al., 2008). The final dataset included 36 points, from which 13 points are in the Haine basin chalks, 9 points are in the Geer basin chalks, 9 points are in the Brusselian sands, and 5 points are in the Landenian sands (Fig. 1).
Time series were available for some points from the sixties onwards, but the trend and causal analysis covers 2002–2020, starting at the onset of the sustainable nitrate management programme (PGDA) and ending with the most recent year for which data were available. For 9 out of the 36 points, the first available data started after 2002: 7 in 2003, 1 in 2006, and 1 in 2009. The temporal resolution of the nitrate measurements is variable, with the total number of measurements per point ranging from 53 to 948 over the study period. The water samples were analysed by the laboratory of the drinking water production company, the SWDE, under ISO 17025 accreditation.
The nitrate concentration time series contained some problematic values that were noticeably lower or higher than their neighbours due to reported human errors. We thus filtered the time series using a moving window of 2 years, with an upper and lower limit being the mean of the data within the window plus and minus 3 times the standard deviation. Figure 2 shows the annual averages of the resulting time series.
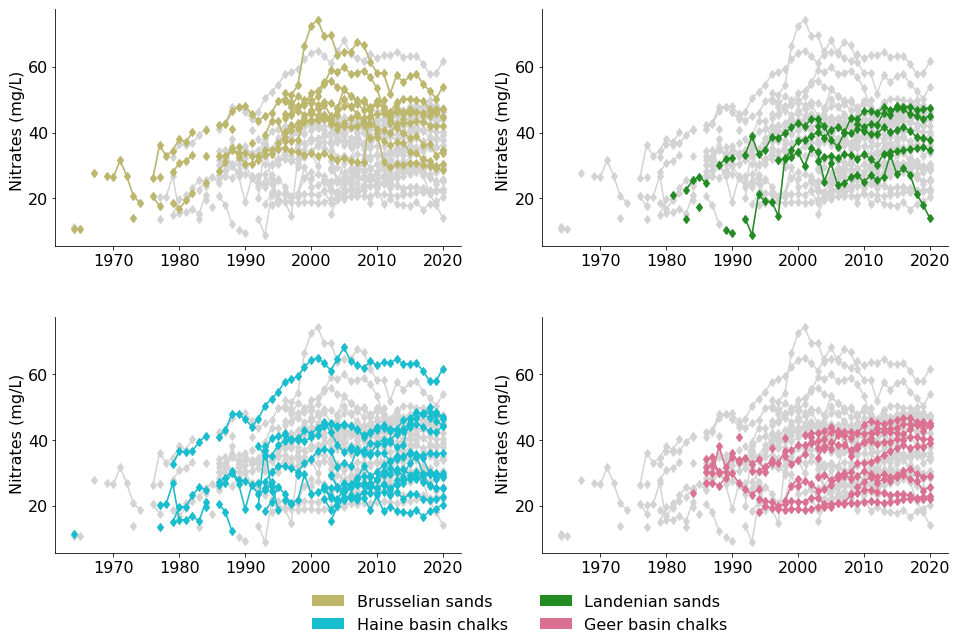
Figure 2Time series of the yearly mean nitrate concentrations at the 36 monitoring points, sorted by groundwater body. In grey, the time series of all points. In colour, the time series of the points in each groundwater body.
2.2.2 Definition of nitrate pollution indicators
We defined a set of six indicators that capture the state and rate of change in nitrate concentration in 2002 and 2020 and the evolution in between. The indicators are used to assess the spatial and temporal evolution of nitrate contamination at each monitoring point, and they serve as dependent variables in our data analysis to identify factors influencing nitrate concentrations. The indicators and their interpretation are defined in Table 1 and illustrated in Fig. 3.
Table 1Definition and interpretation of the nitrate pollution indicators.
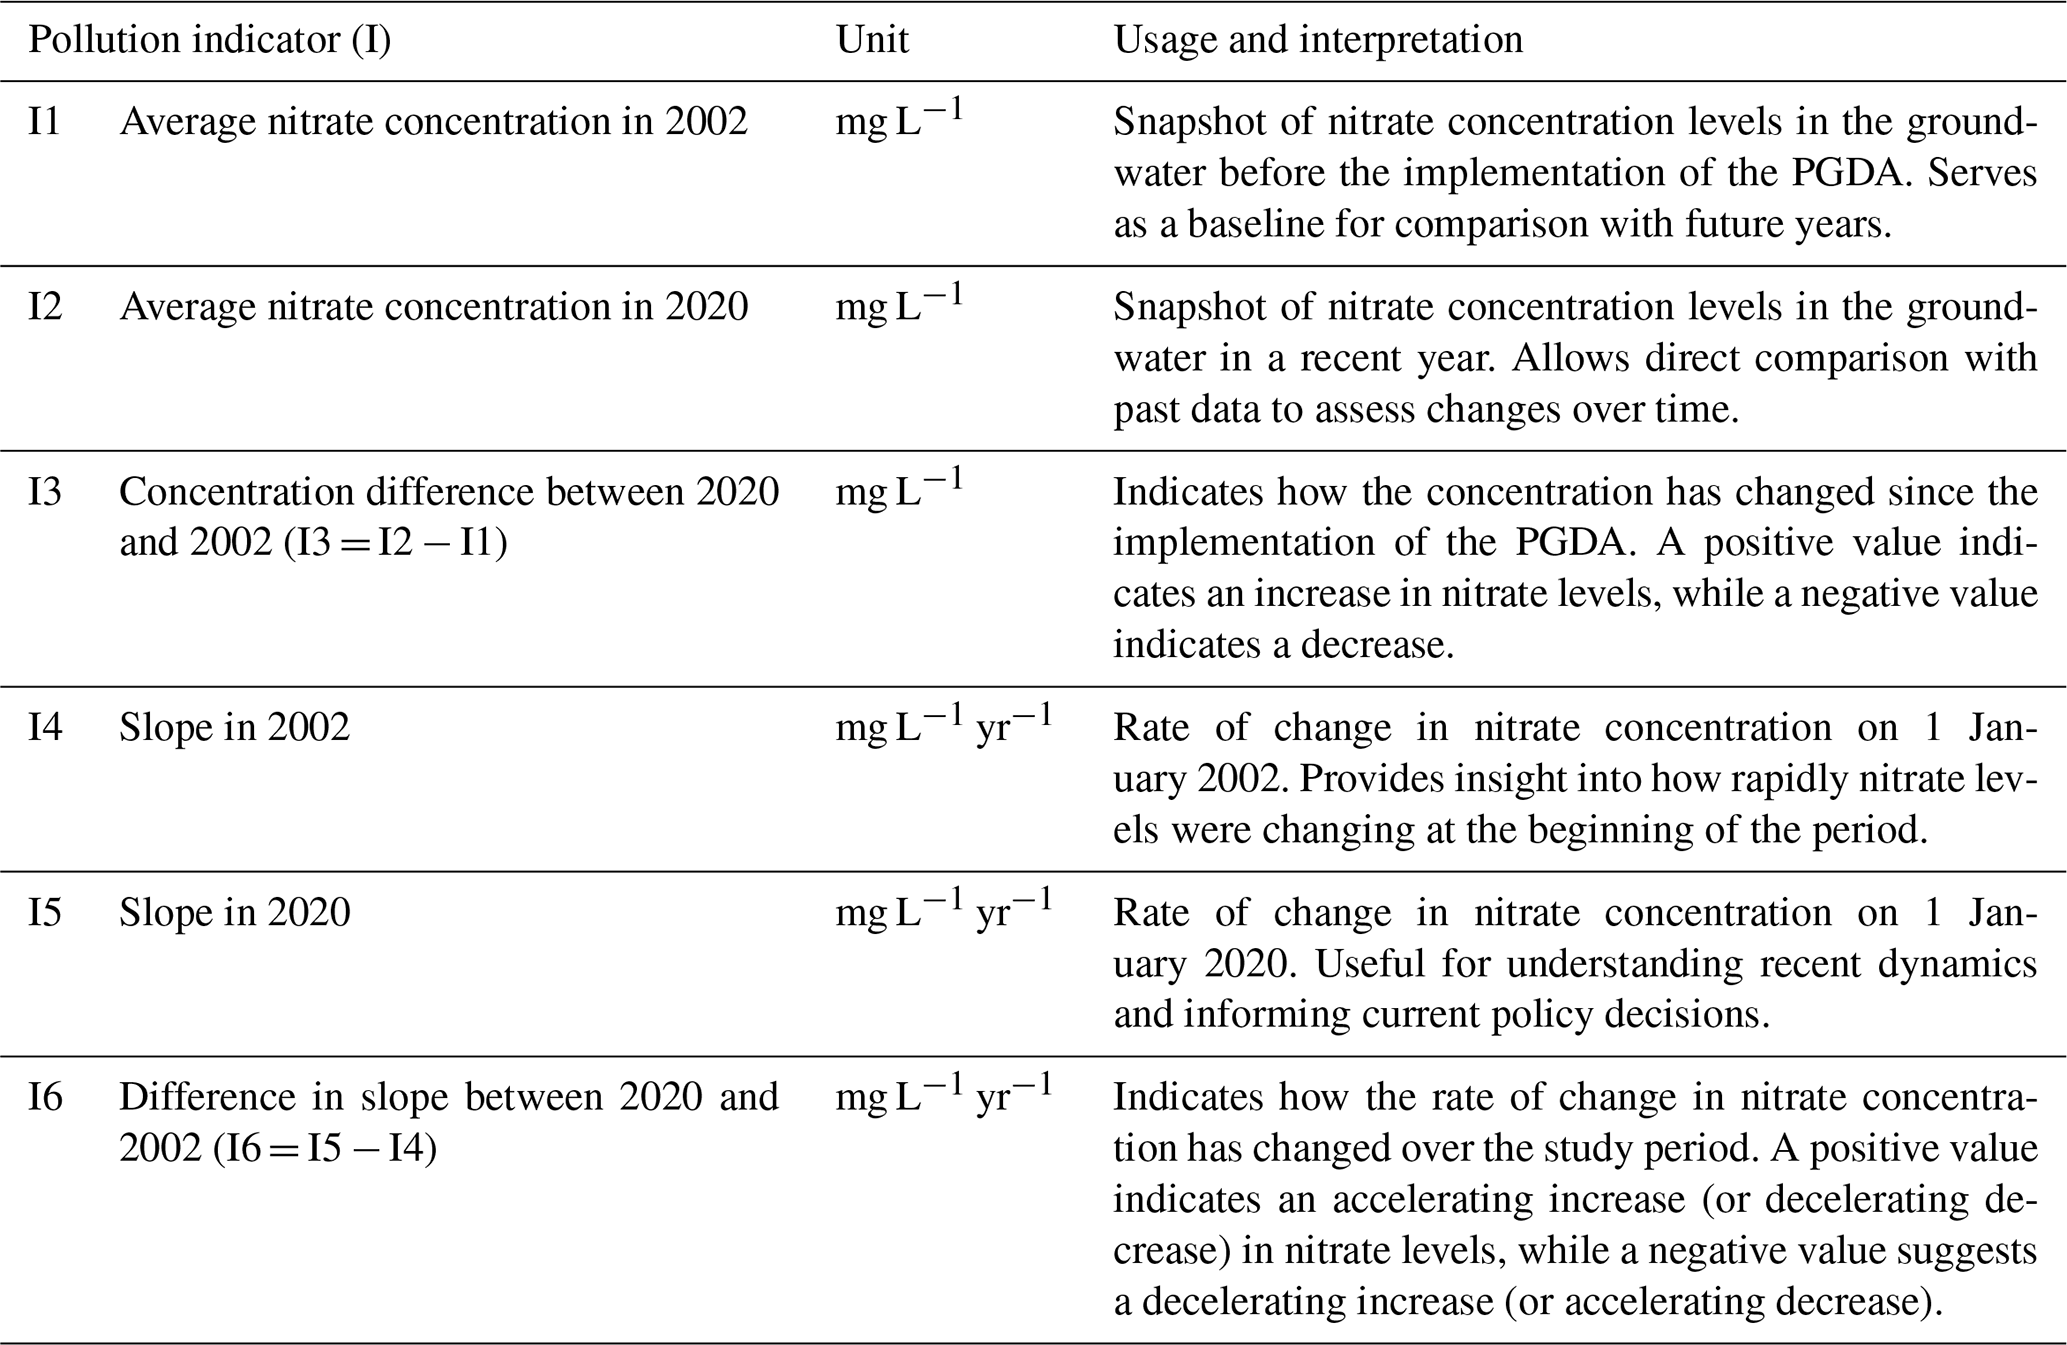
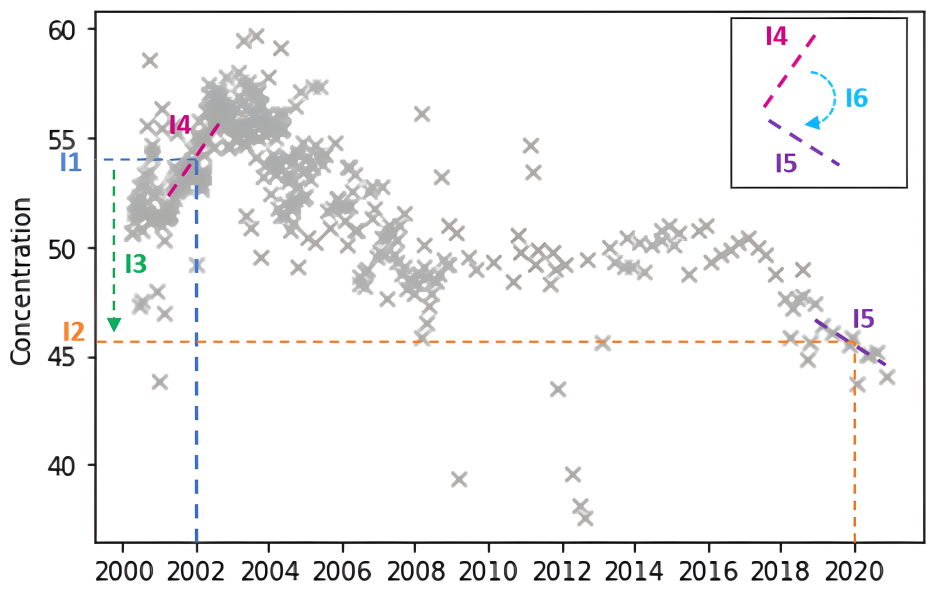
Figure 3Illustration of the six indicators of the nitrate pollution indicators. Times series data from a monitoring station in the Brusselian sands are used for illustrative purposes.
The method used for slope computation (I4 and I5) affects the trend diagnostics. The non-parametric Mann–Kendall test has been widely applied and recommended for groundwater pollution trend assessments (Frollini et al., 2021; Grath et al., 2001; Hirsch et al., 1991; Urresti-Estala et al., 2016). This method only captures a single linear trend, making it not directly applicable to detect trend changes in long, non-linear time series. To address this limitation, Lee et al. (2010) computed trends using local regression. In our analysis, we applied two different approaches: (i) computing tangent lines to a local regression and (ii) detecting change point and applying the Mann–Kendall test. Since both methods produced similar slope indicators, we focus on the local regression approach in the main text, with details of the change-point detection approach provided in the Supplement.
The local regression approach consisted of smoothing the time series using locally weighted scatterplot smoothing (LOWESS) (Cleveland, 1979) and computing the slope of the tangent line to the smoothed time series on 1 January 2002 (= I4) and on 1 January 2020 (= I5). The LOWESS window length was set to 8 years for time series longer than 12 years, allowing the capture of long-term fluctuations, and to two-thirds of the time series length for shorter series. Within a local window of 90 d, a linear interpolation was applied instead of a weighted regression to increase stability.
For the nine monitoring points whose first measurements were taken after 2002, the slope of the trend in 2002 (I4) was taken as the slope at the first data point, and the mean absolute nitrate concentration in 2002 (I1) was obtained by hindcasting that trend. All time series cover a period longer than 8 years, the minimum length recommended by Grath et al. (2001) for groundwater pollution trend assessments.
2.3 Candidate explanatory variables
We computed a set of potential explanatory variables standing for environmental and anthropogenic factors which may impact the nitrate concentration dynamics. We used these variables as independent variables in our data analysis to identify factors influencing nitrate concentrations. The variables encompass both the inherent vulnerability to pollution and the anthropogenic influence, which include human activities that could cause or affect punctual and/or diffuse pollution. The definitions of these indicators, computation means, and data sources are given in Table 2. The descriptive statistics of the values of these variables for the monitored locations are given in Table 3.
2.3.1 Delineation of the influence zones
The risk of groundwater contamination at a specific location is influenced by the traits of the land surface area that can potentially transport pollutants to it. Therefore, delineating this land surface area, here referred to as the “influence zone”, is crucial in the analysis of groundwater nitrate concentrations (Mattern et al., 2009). We defined the influence zones as the topographic surface watersheds of the legal protection zones of each water intake structure (Zones de protection des captages d'eau souterraine – État de l'environnement wallon, 2024). These zones correspond either to the groundwater table area, with a maximum transfer time of 50 d to the water intake structure as estimated through geological modelling, or they are defined as circular areas centred around the structure location, whose radius depends on the aquifer substrate: 100 m for sandy aquifers, 500 m for gravel aquifers, and 1000 m for karstic aquifers. The boundaries of these zones are available on the regional institution's geographical data portal (Catalogue des données et services | Géoportail de la Wallonie, 2023). We delineated the watersheds with the ArcGIS watershed toolbox, using a 2 m resolution raster of flow direction and flow accumulation generated by the LIDAX project (SPW, 2019).
2.3.2 Inherent vulnerability
To quantify the natural vulnerability, we considered the seven factors of groundwater natural vulnerability to pollution as defined in the DRASTIC model of the US Environmental Protection Agency (Aller et al., 1987): aquifer depth, recharge, aquifer media, soil type, topography, impact of the vadose zone, and hydraulic conductivity. We used the depth of the water intake structures as a proxy of the depth to the groundwater table, since piezometric measurements were not available for all structures. We used the mean annual rainfall as a proxy for the net recharge. We used a single categorical variable, namely the groundwater body of the water intake structure, as a proxy for the following three DRASTIC vulnerability factors: aquifer media, impact of the vadose zone, and hydraulic conductivity. The variable standing for the topography was the mean slope in the influence zone calculated using a 2 m resolution digital slope product derived from a 1 m digital elevation model. We did not include the soil in the set of explanatory variables, since the main soil type of all influence zones was identical, namely loam. We considered all the vulnerability variables to be time-invariant over the studied period.
To be able to include the categorical variable aquifer media (GWbody) in our analysis, we replaced it with four binary variables using one-hot encoding. We called the new variables GWbodyLS, GWbodyBS, GWbodyHBC, and GWbodyGBC; they indicate respectively the monitoring points in the Landenian sands, the Brusselian sands, the Haine basin chalks, and the Geer basin chalks. We do not expect any change in these variables over the study period.
2.3.3 Land use characteristics
Agricultural land is a significant source of nitrate leaching to groundwater (Cameron et al., 2013; Strebel et al., 1989), with nitrates originating from nitrogen fertilizers applied on cropland and from grazing livestock on meadows. Consequently, both crop land and meadow area were regarded as potential drivers in this study. We specifically included potato crop cover, as it is known to leave a high concentration of potentially leachable nitrates in the upper soil layer after the growing season (Bah et al., 2015). In contrast, forested and green areas are generally less prone to nitrate leaching (Cameron et al., 2013; Zhang et al., 2013); hence we also regarded them as drivers but expected them to have a mitigating impact. Urban wastewater losses represent an additional nitrate source (Torres-Martínez et al., 2020). We used built infrastructure area as a proxy to estimate wastewater production. We visually examined the trends in these variables over the study period, finding that only the meadow area exhibited a trend. Therefore, we included a sixth variable that accounts for the change in meadow cover over the study period.
2.3.4 Point pollution sources
We considered three potential point pollution sources. Graveyards can contribute to nitrate pollution through the decomposition of organic materials (Mattern et al., 2009). Farm buildings are included because they are often associated with manure storage and handling, which can be a direct source of nitrates if not managed properly. Finally, buildings not connected to the collective sewage system indicate potential nitrate sources from septic tanks or dry wells, which can leach untreated wastewater. The datasets used capture the situation in 2020 (Table 2). We expect little change for these variables over the studied period.
Table 2Definition of the potential explanatory variables used in the statistical models.
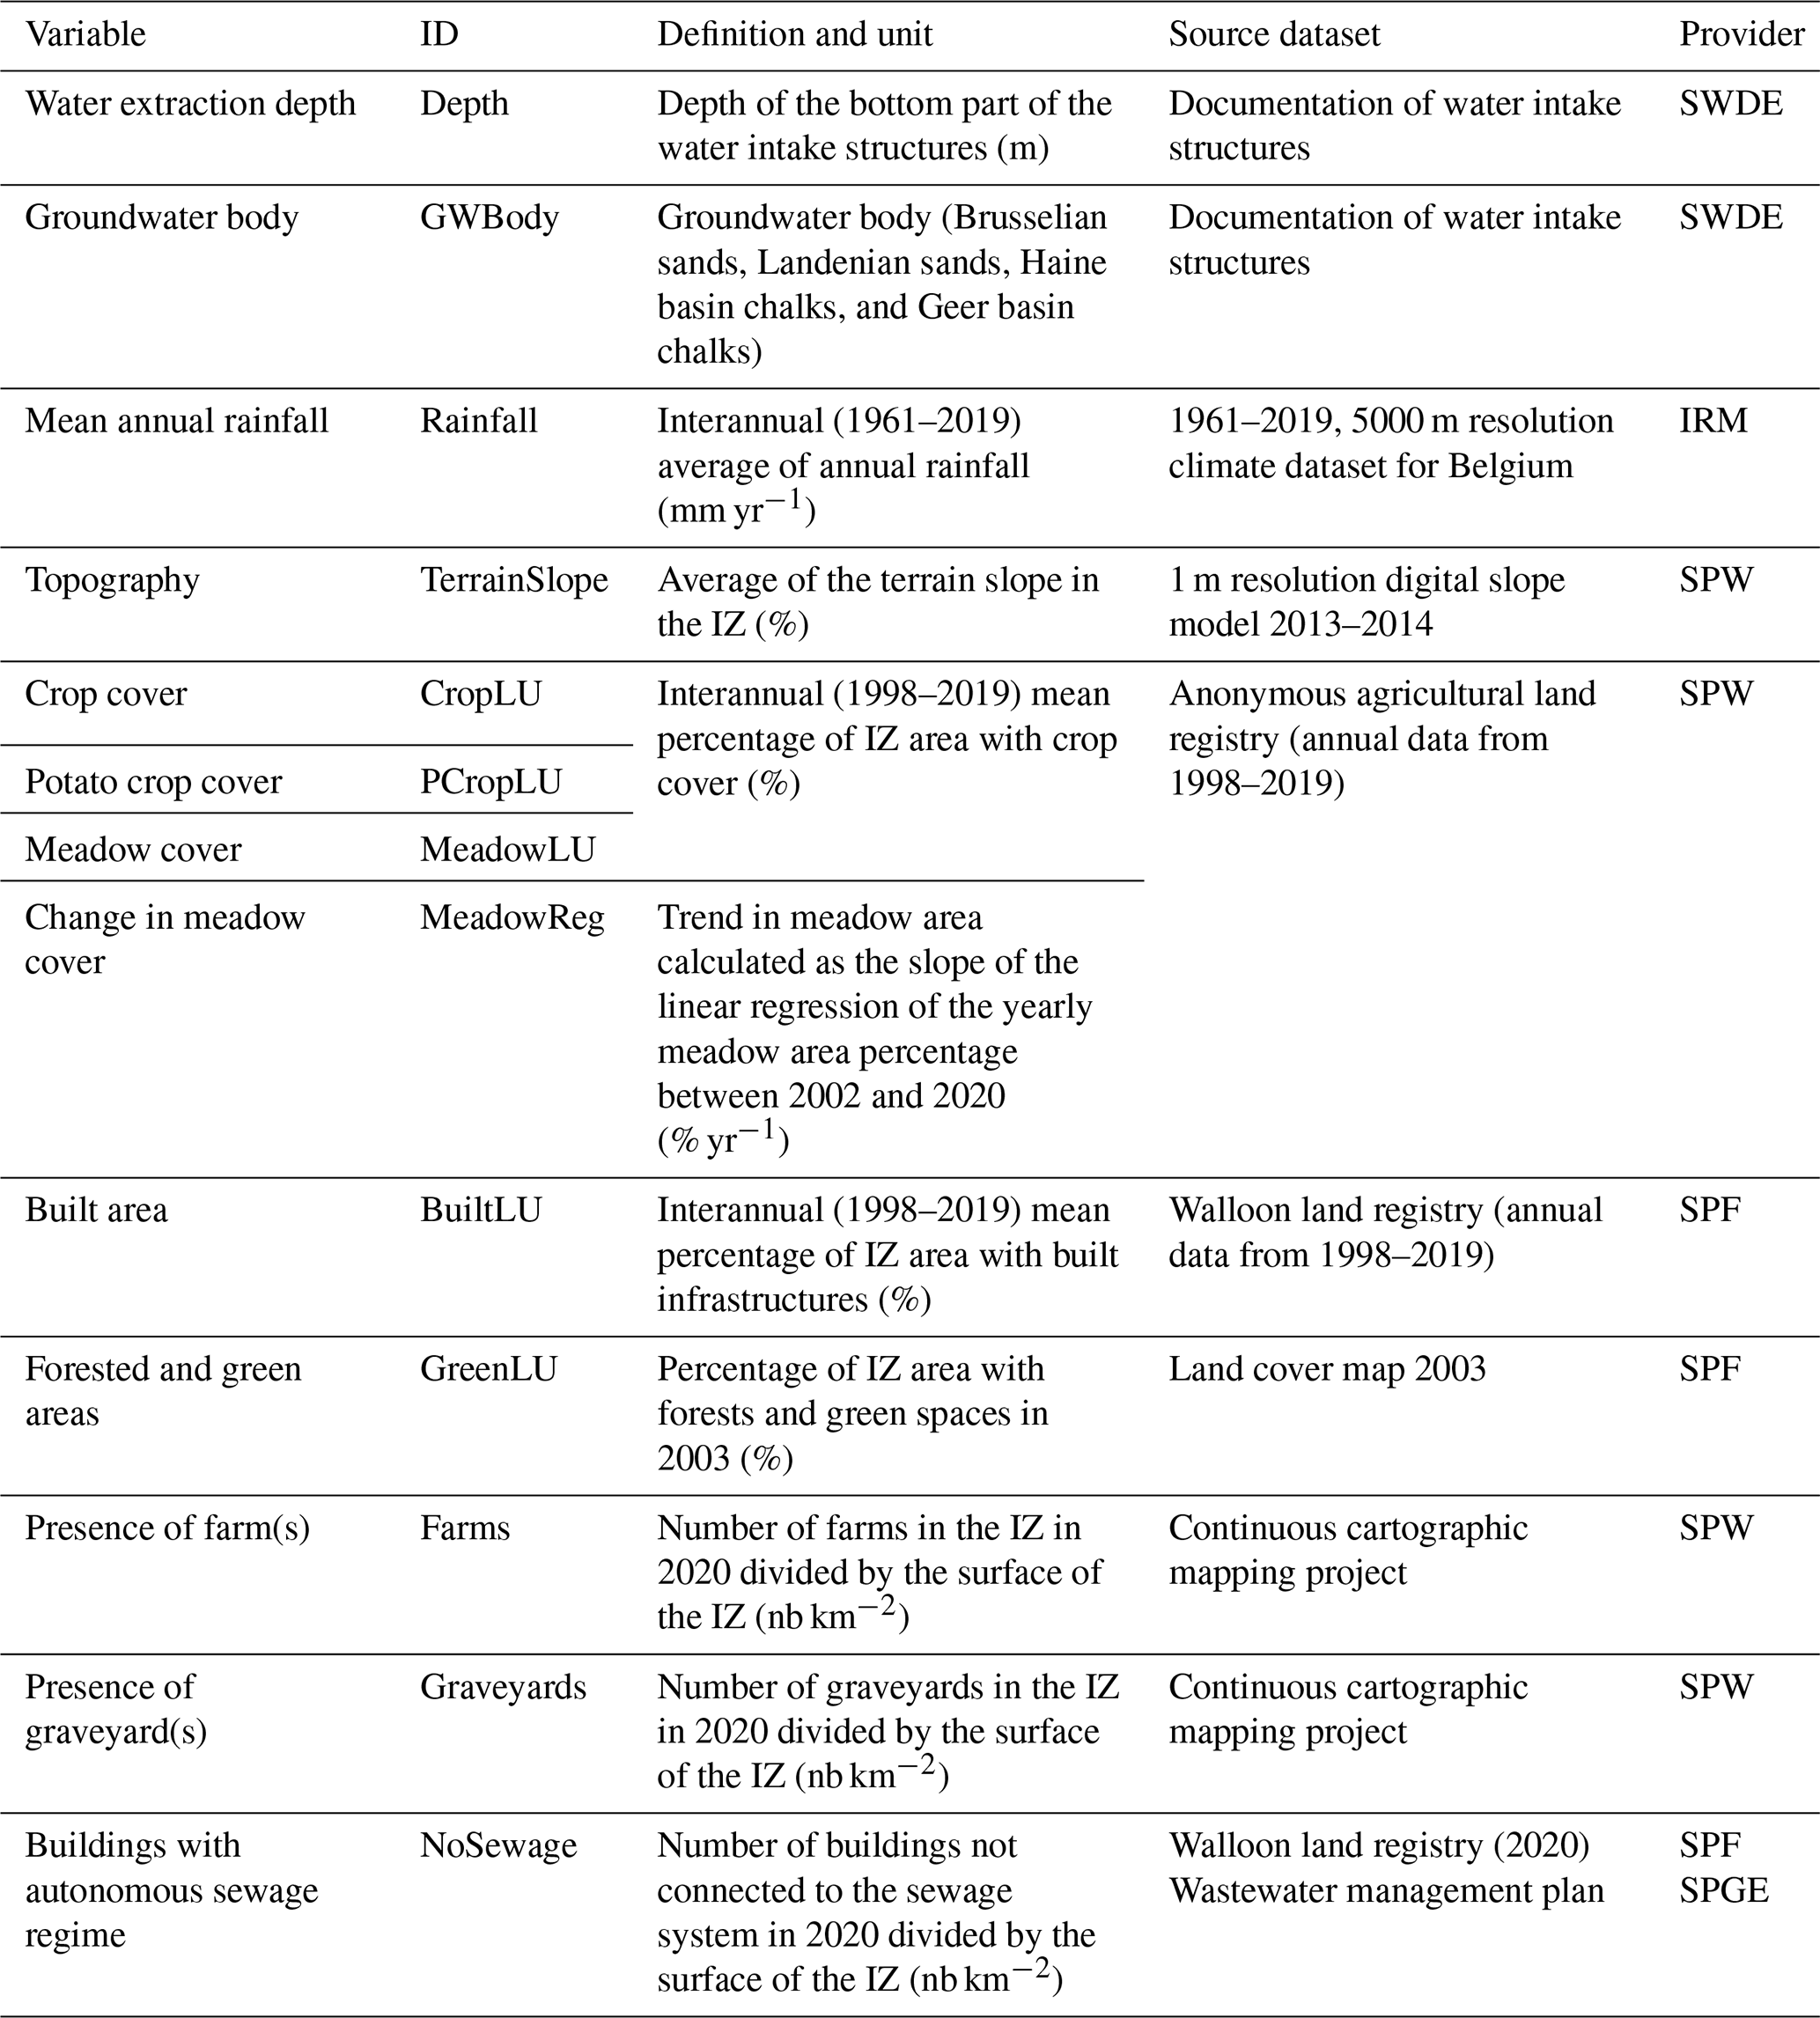
IZ: influence zone. SPW: Service Public de Wallonie. SPF: Service Public Fédéral. SPGE : Société Publique de Gestion de l'Eau. SWDE : Société Wallonne de Gestion de l'Eau. IRM : Institut Royal Météorologique.
Table 3Descriptive statistics of the independent variables for the 36 monitoring points.
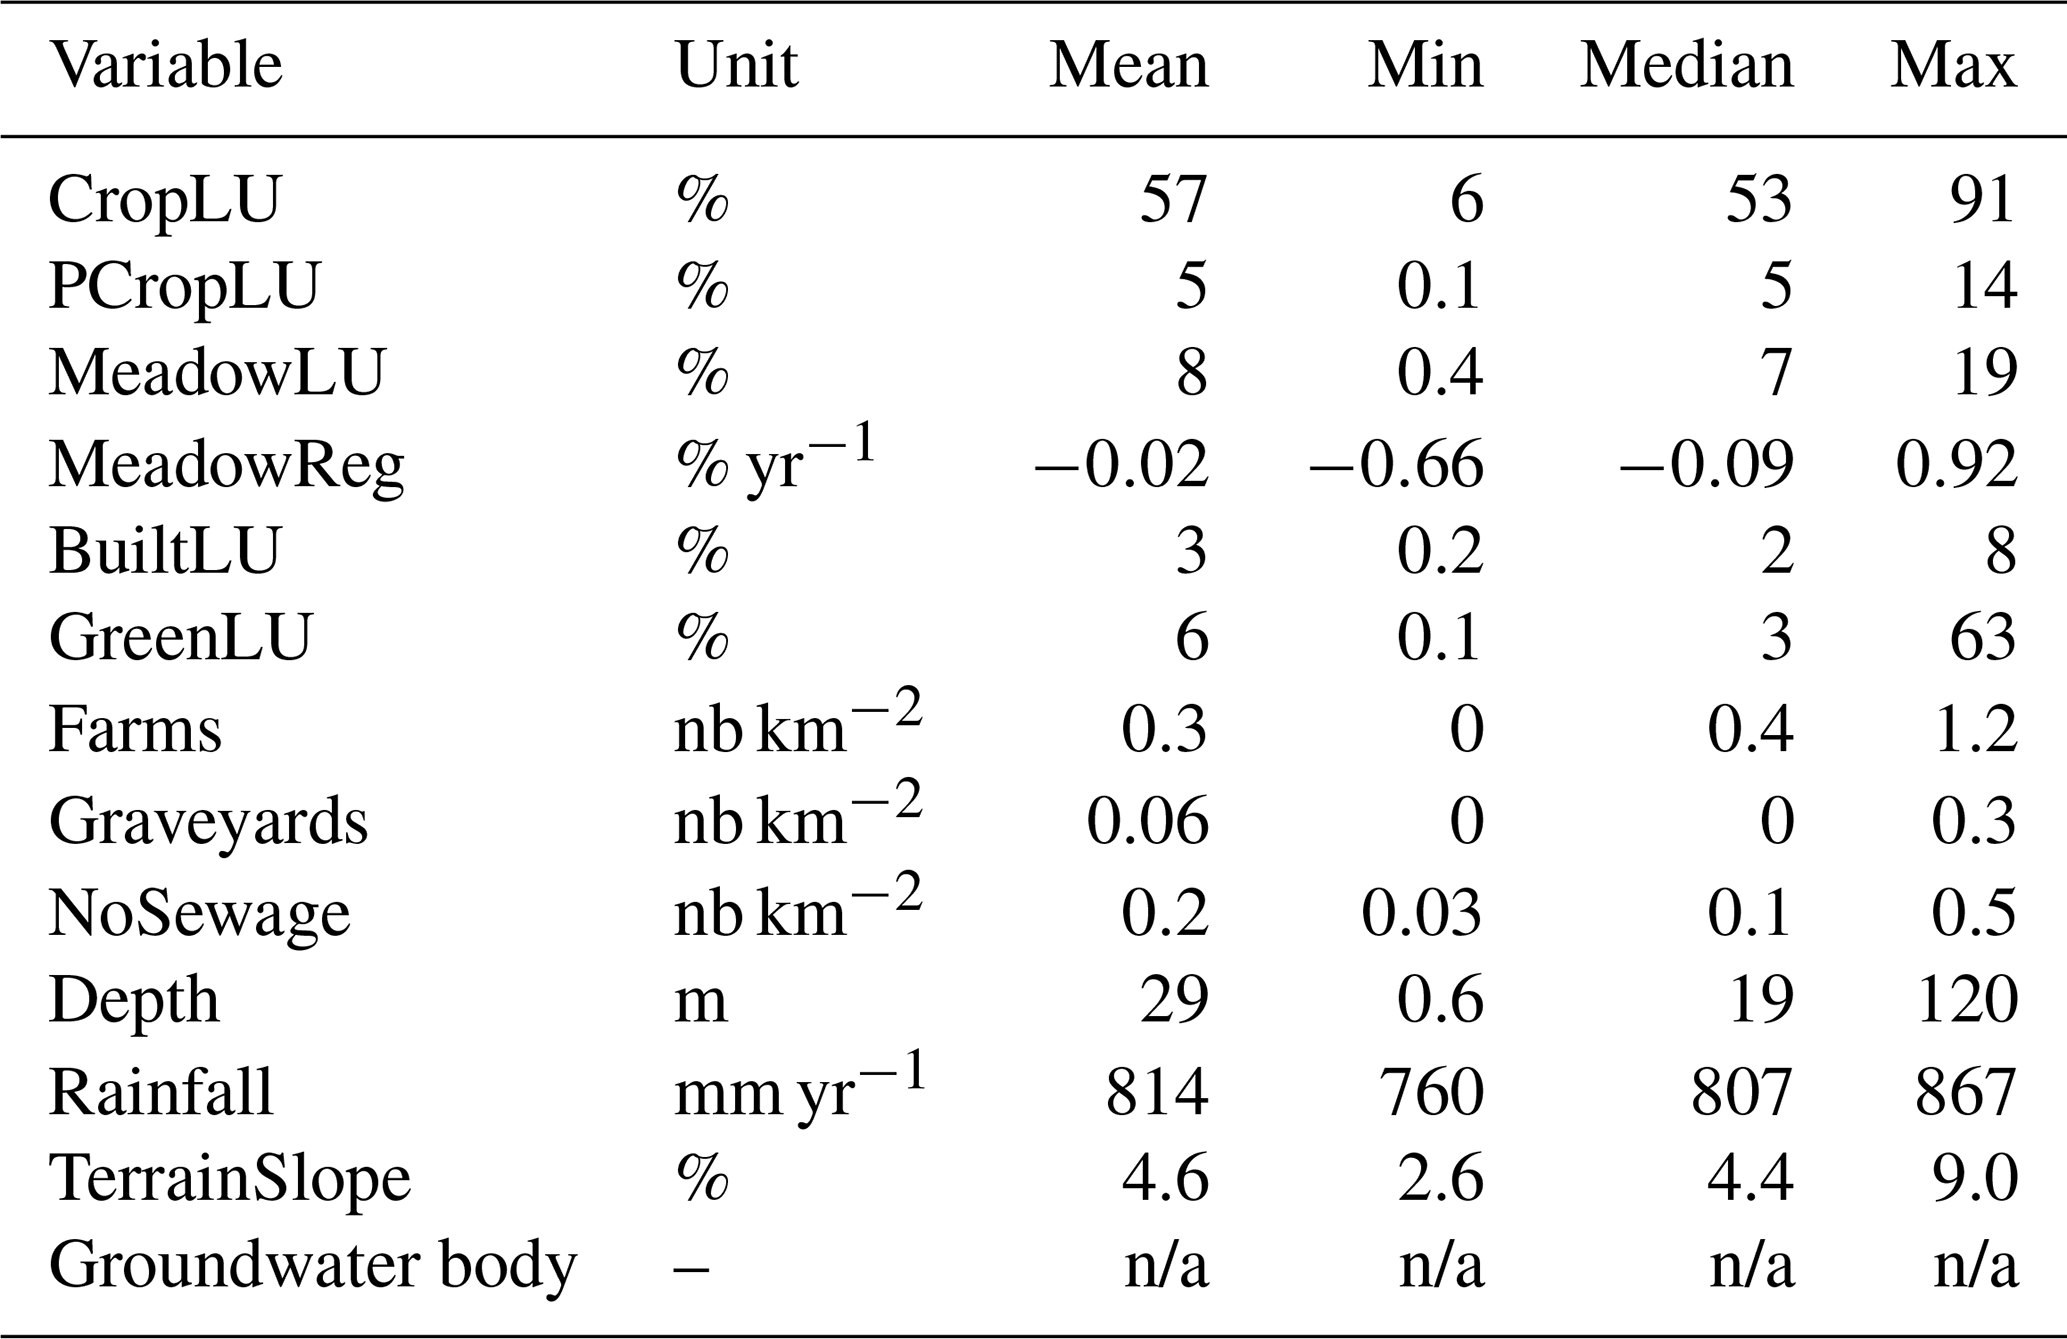
n/a: not applicable.
2.4 Data analysis
2.4.1 Evolution of the nitrate concentrations
We computed descriptive statistics and visuals to depict the past and present status and temporal changes in the nitrate concentrations in the studied groundwater bodies, using the nitrate pollution indicators (Table 1).
2.4.2 Bivariate analysis to identify the controlling factors
We tested the strength and direction of the association between the nitrate pollution indicators (Table 1) and each independent variable (Table 2) separately by computing the Kendall rank correlation (also known as Kendall's tau coefficient; Kendall, 1938). The value of Kendall's tau ranges from −1 to 1, and the closer the coefficient is to either −1 or 1, the stronger the association. A higher positive value indicates a strong positive association, while a higher negative value indicates a strong negative association.
2.4.3 Multivariate linear regressions to identify the controlling factors
We used multiple linear regressions to assess the individual contribution of each independent variable (Table 2) to account for potential confounding effects.
Before applying the regression models, we addressed multicollinearity by removing highly collinear variables, hence ensuring that the remaining variables provided reliable contributions to the analysis. Firstly, we replaced the four binary variables representing the groundwater bodies, which were highly collinear, with one single binary variable, “Aquifer”, distinguishing the aquifer media of the groundwater bodies: a value of 1 for the Brusselian and Landenian sands and a value of 0 for the Geer and Haine basin chalks. We then removed one variable at a time until the variance inflation factor (VIF) values (Mansfield and Helms, 1982) of all remaining variables were below a threshold of 5 (James et al., 2013). The variable to remove at each iteration was selected based on its VIF value, correlation with other variables, and importance as an explanatory variable, assessed by the authors' expert judgement.
We built nine multiple linear regression models with the remaining independent variables, one for each indicator and slope calculation method. We used the ordinary least squares (OLS) function of the Python statsmodels library (Seabold and Perktold, 2010). We standardized the independent variables to a mean of zero and a standard deviation of 1, facilitating the comparison of their respective impacts on the nitrate concentration indicators. We applied a stepwise multiple linear regression to identify the most important predictor variables, eliminating at each iteration the independent variable with the highest p value until the p values of all remaining variables were below 0.05.
3.1 Evolution of the nitrate concentrations
Table 4 shows statistical summaries for the six pollution indicators. It shows that the average concentration of nitrates in 2002 was 37.7 mg L−1, with a standard deviation of 12.2 mg L−1, and hardly decreased in 2020, with an average of 36.5 mg L−1 and a standard deviation of 10.8 mg L−1. The mean change in concentration levels between 2002 and 2020 (I3) exhibits a slight decrease of 1.2 mg L−1 on average but with a wide variation (standard deviation of 8.8 mg L−1), ranging from a decrease of 21.3 mg L−1 to an increase of 12.5 mg L−1. Altogether, 47 % of the monitored locations witnessed a decrease in concentration, while the other 53 % saw an increase (Fig. 4). The average rate of change in nitrate concentrations (I4 and I5) is slightly negative, whichever the method, but with variations ranging from a negative to a positive rate. They are slightly more negative in 2020 than in 2002. The maximum rate of change decreased from 2.7 mg L−1 yr−1 in 2002 to 0.6 mg L−1 yr−1 in 2020, which indicates an overall deceleration in the rate of change over the study period. This is confirmed by the negative values of the averaged I6.
While these statistics indicate a slightly mild decrease in nitrate concentrations since 2002, the distributions of the indicators colour-coded by the type of aquifer in Fig. 4 suggest that the decrease was mainly significant in the Brusselian sands, while the pink stacks of the histogram for I3 indicate an increase in the Geer basin chalks.
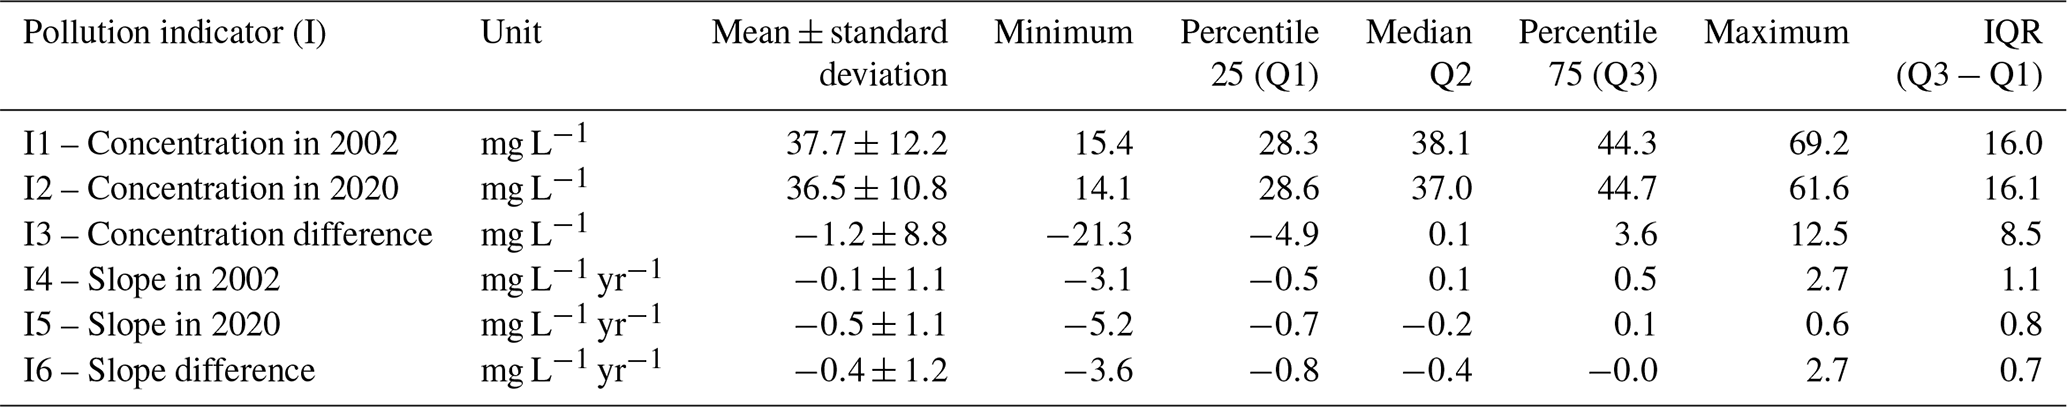
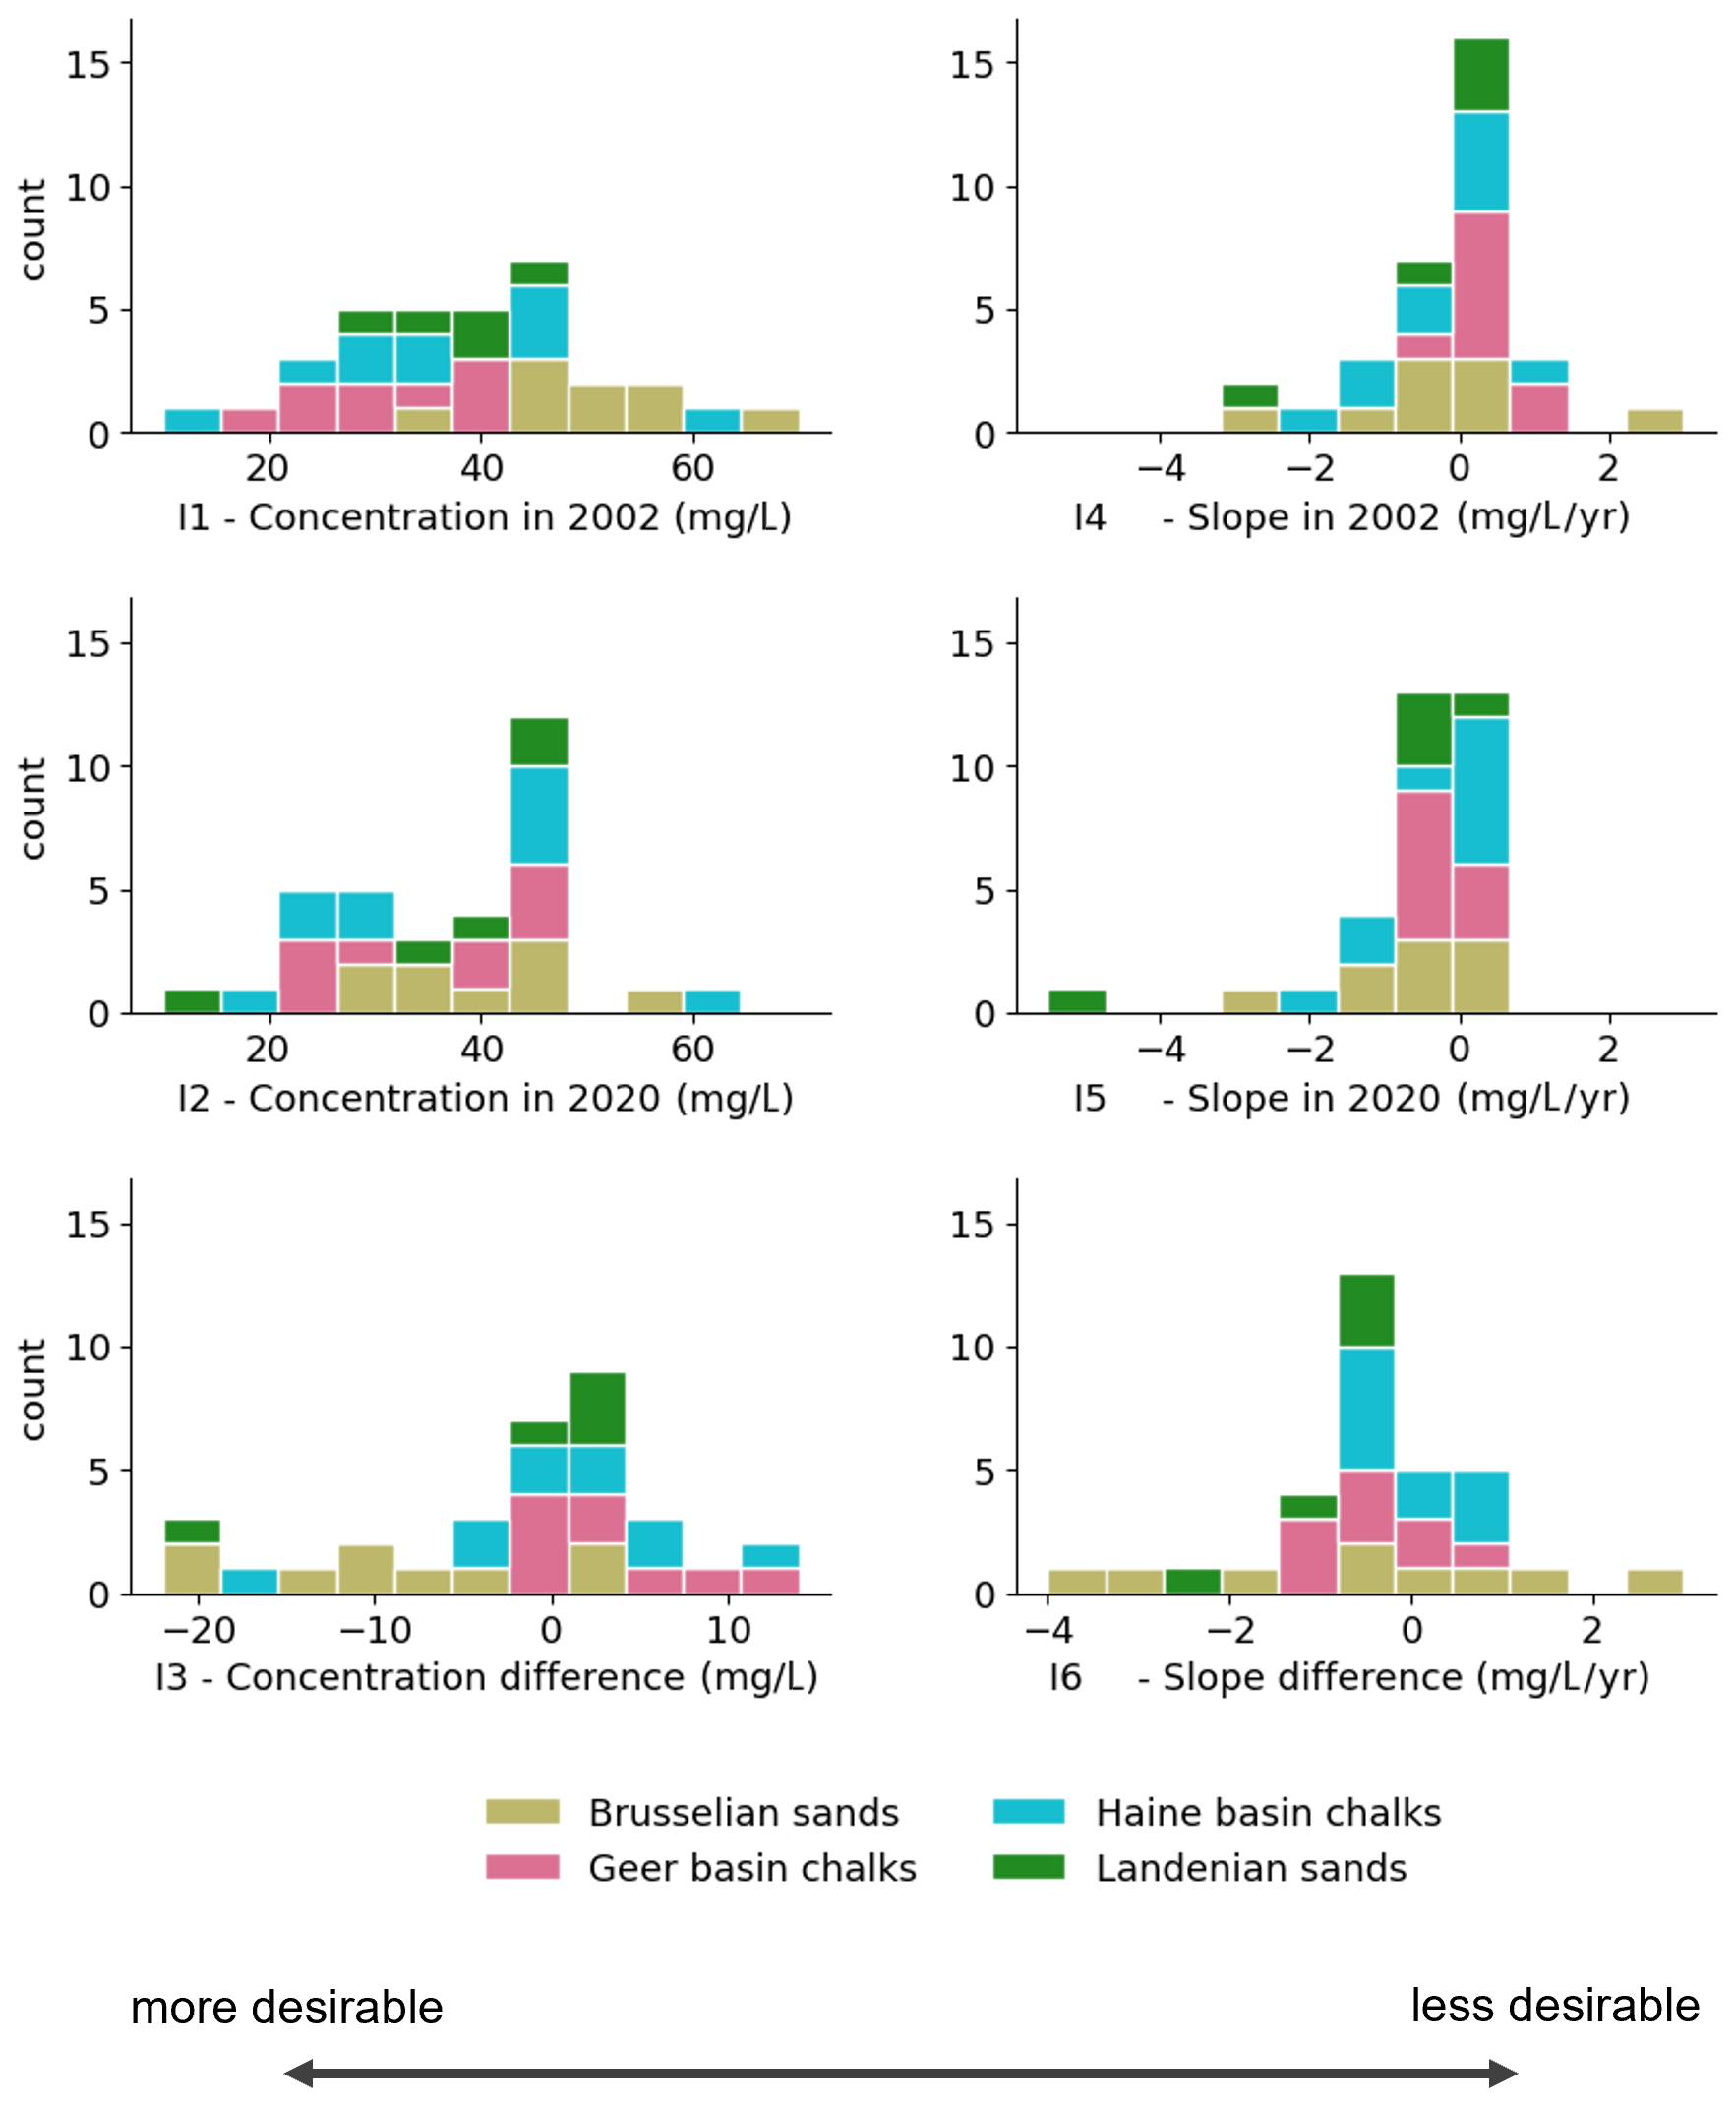
Figure 4Histograms of the six pollution indicators. The black arrow at the bottom indicates that, for each indicator, lower values are more desirable than higher values, as this entails lower nitrate concentrations, decreasing trends, and a decrease in concentration from 2002 to 2020.
3.2 Identification of the controlling factors
3.2.1 Bivariate analysis
The analysis reveals a consistently positive correlation between the crop and potato crop area and all the pollution indicators and hence the undesirable effect of these variables (Fig. 5). This effect is only significative on the nitrate concentration in 2020 (I2) and rate of change in 2002 (I4). On the other hand, the analysis reveals a consistently negative correlation between the forest and green space area and all the pollution indicators and hence the desirable effect of this variable. This effect is only significative on the nitrate concentration in 2020 (I2). Results also indicate a significantly positive relationship, or undesirable effect, of the meadow area on the rate of change in 2020 (I5). The temporal trend in the meadow area (MeadowReg) shows a significant negative correlation with concentrations in 2020 (I2), suggesting the desirable effect of an increase in meadow area on I2, but shows a positive correlation with the change in concentrations (I3), suggesting the undesirable effect of an increase in meadow area on I3.
The results show a positive relationship and hence the undesirable effect of the number of farms on all indicators and of the number of graveyards on the change in concentrations (I3) and the rates of change in 2002 and 2020 (I4 and I5). Conversely, graveyards displayed a significantly negative relationship with concentrations in 2002 (I1). Finally, there is no detected influence of the presence of building areas, a proxy for population density, and buildings not connected to wastewater treatment plants.
The depth of the water intake structure, serving as a surrogate for groundwater table depth, shows a significant correlation with the indicator of change in concentration (I3). However, it does not exhibit any correlation with the other indicators. There is a significantly negative relationship between the annual rainfall, a proxy for recharge, and the indicator of change in concentrations (I3), while there is a significantly positive relationship with the concentration in 2002 (I1). A weak negative relationship (positive effects) was found between the terrain slope and all the indicators.
Results also confirm a clear influence of the aquifer media. While concentrations in 2002 and 2020 were higher in Brusselian sands and lower in the chalk aquifers, the decrease and rate of decrease were more prominent in the sands.
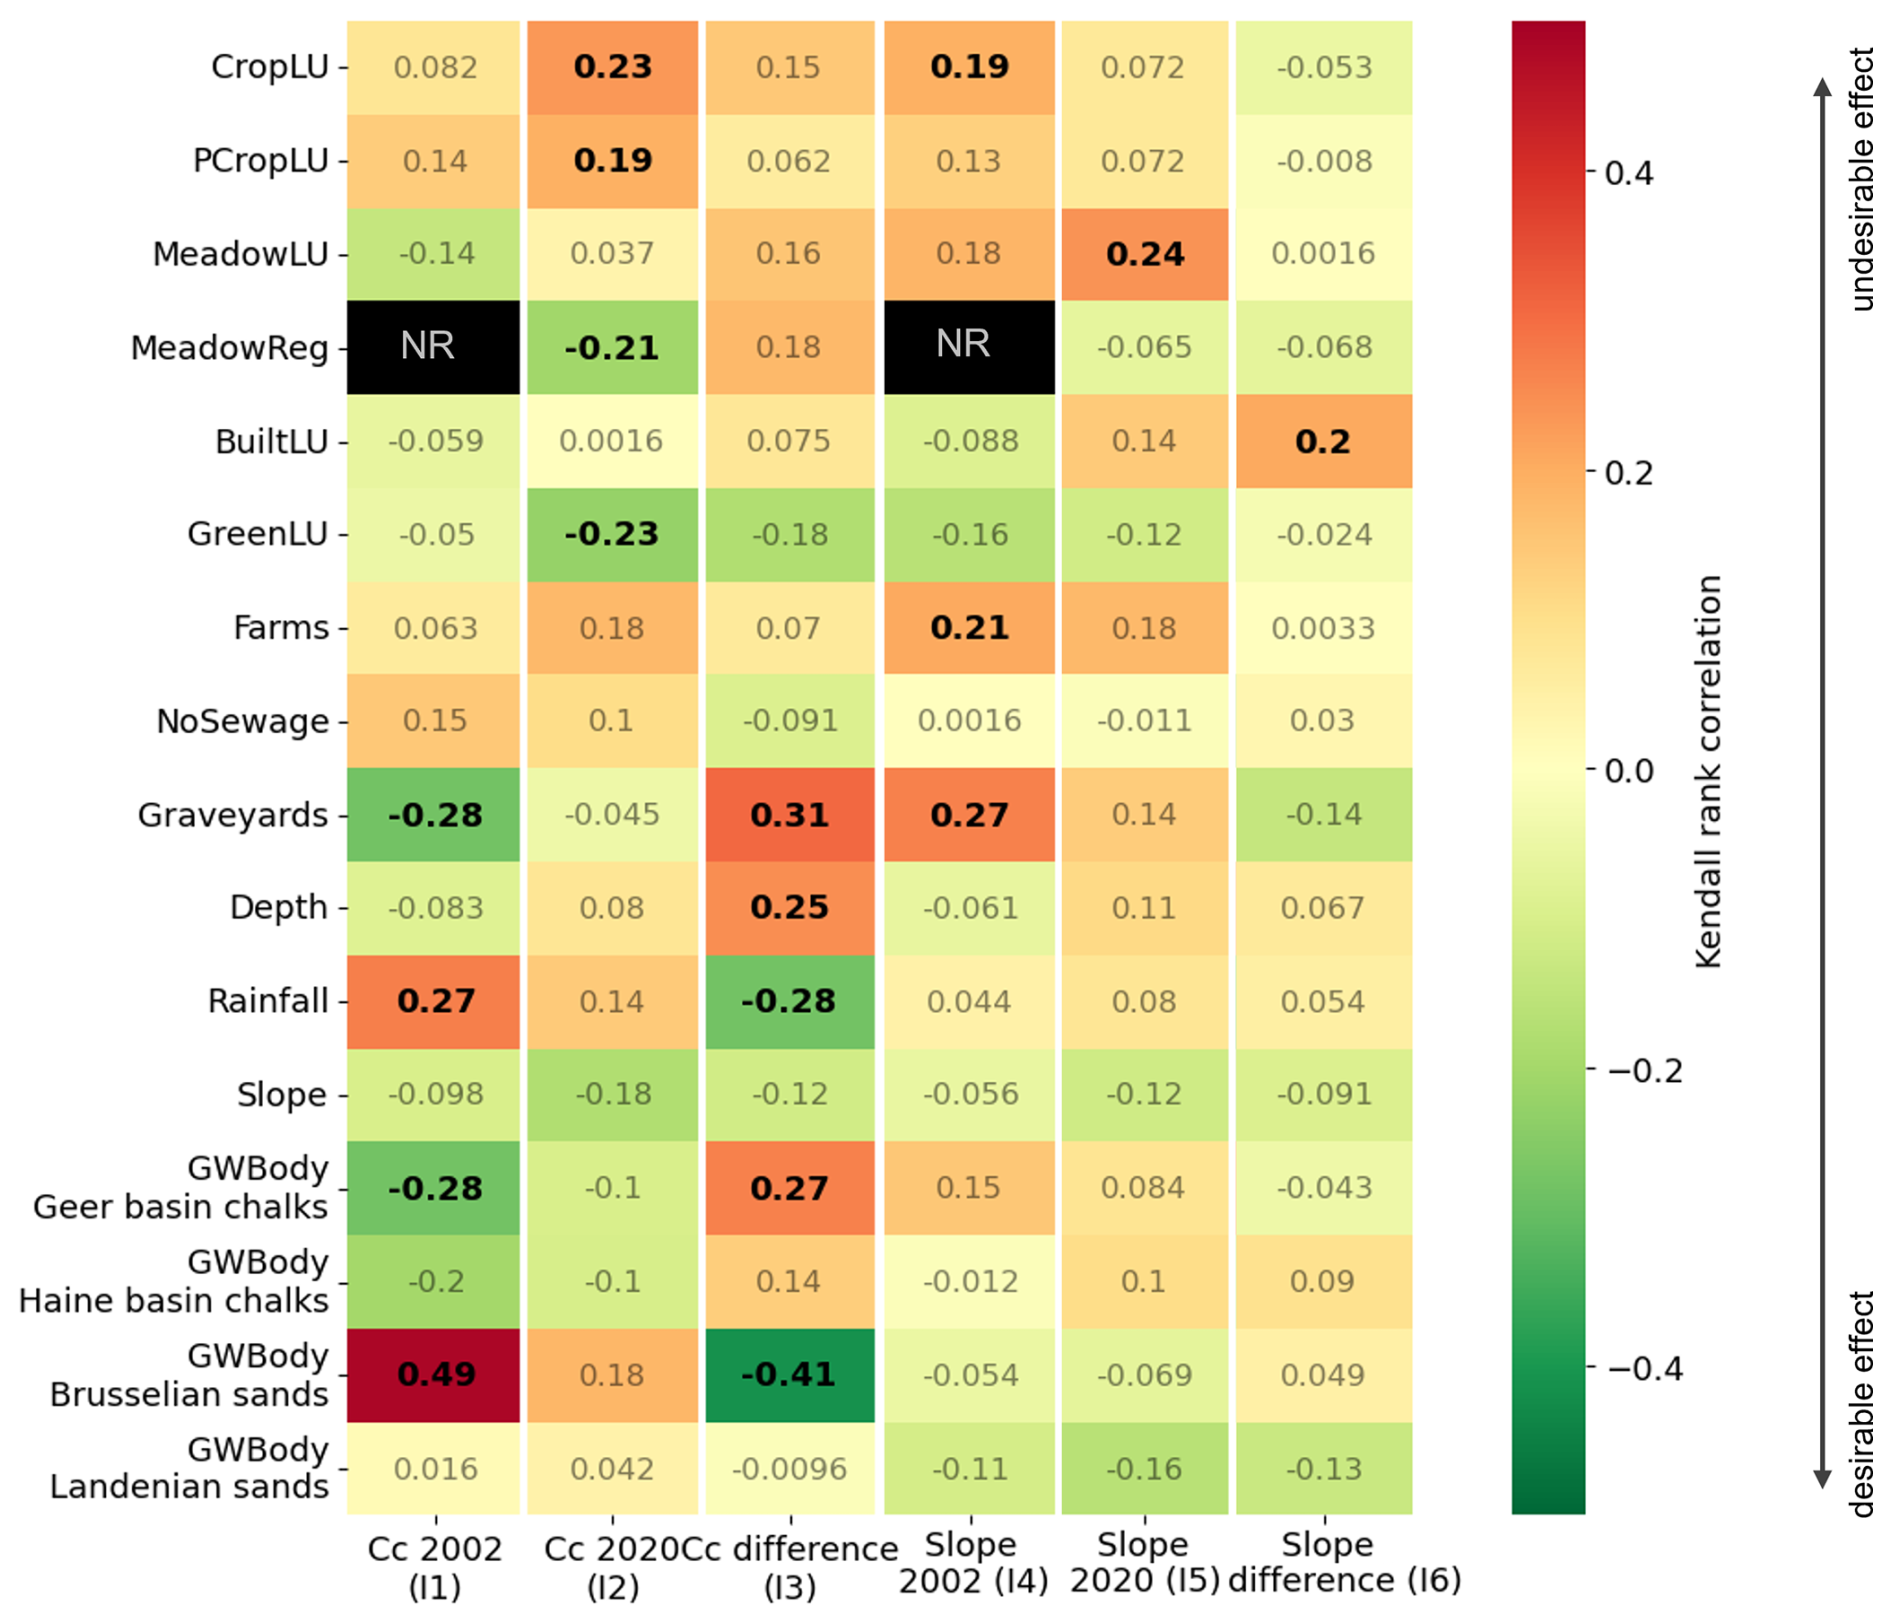
Figure 5Heat map of the Kendall rank correlation coefficients between the explanatory variables and the six pollution indicators. Coefficients in bold indicate a significant relationship (p value <0.1) NR: not relevant. The black arrow on the right indicates that low correlation is more desirable than high correlation, as low correlation leads to high values of the explanatory variables being correlated to low values for the six pollution indicators and vice versa.
3.2.2 Multivariate linear regression analyses
In the process of refining our multivariate regression models, we made several adjustments to address issues of multicollinearity among the variables. We removed the variable “Rainfall” for its high VIF of 242. The variables “CropLU” and “PCropLU” had a VIF of respectively 20 and 12 and were highly correlated (R2=0.77). Considering the importance of “CropLU” as an explanatory variable, we chose to retain it and remove “PCropLU”. The next variables we removed were “Slope” and “NoSewage”, as they each had the highest VIF values among the remaining variables (9 and 7 respectively). Finally, we removed the variables “Farms” and “Graveyards”, allowing us to satisfy the condition of all remaining variables having a VIF <5. The decision to exclude “Farms” was based on its redundancy with “CropLU” and “MeadowLU”, which already represent agricultural activity. As for “Graveyards”, their very sparse distribution in the considered areas led us to expect a limited effect.
The results of the multivariate regression models with the selected independent variables are presented in Table 5. The table shows the coefficients of the independent variables for each model after stepwise removal of all non-significant variables (p value of coefficient <0.05). Note that the interpretation of the coefficient value is difficult because the independent variables have been normalized. In this normalized context, the coefficient indicates the expected change in the dependent variable per standard deviation change in the independent variable. However, it allows us to interpret the relative importance of the variables, as a higher coefficient indicates a higher change in the pollution indicator per standard deviation change.
The regression models highlight the significant role of the aquifer media in explaining the variability in multiple indicators. Sandy aquifers tend to have higher nitrate concentrations but have also shown more desirable concentration changes and rates of change over the study period. The land use variables (CropLU, MeadowLU, GreenLU) exhibit varying influences across the response indicators. Larger crop areas correlate with higher concentrations and less desirable rate changes in 2020 (I2 and I5), while more forested and green areas are associated with more favourable concentration changes (I3). The models explain only 18 to 46 % of the variance in the indicator values, as indicated by the R2 coefficients.
Table 5Coefficients of the variables used in the multiple linear regressions. Only statistically significant coefficients (p value <0.05) are shown.
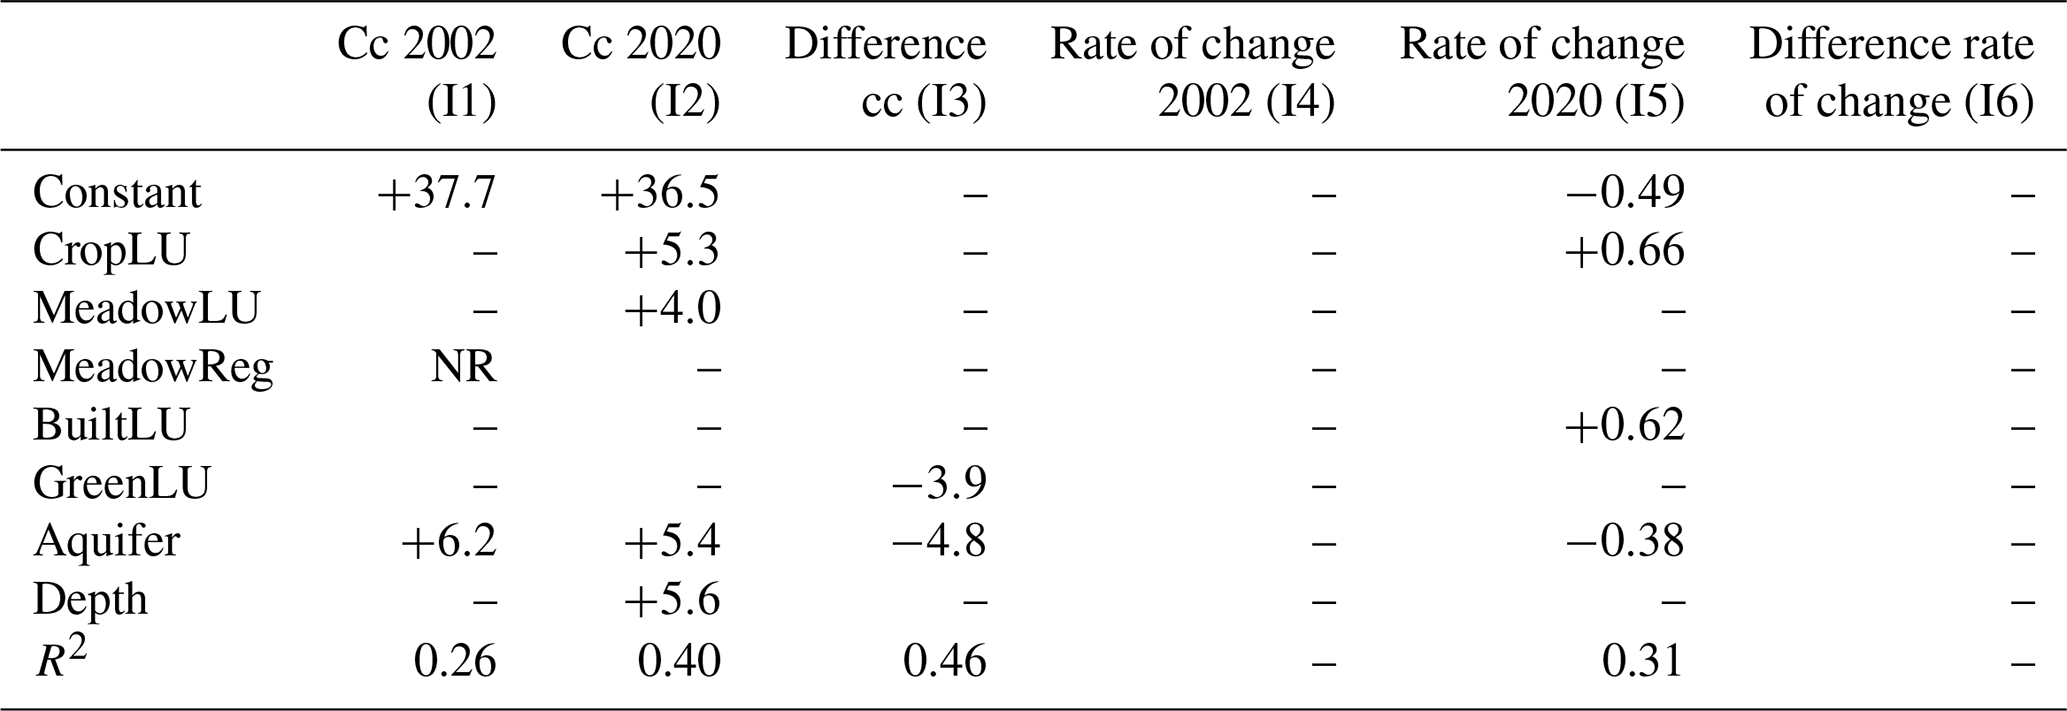
NR: not relevant.
4.1 Evolution of the nitrate concentrations
Since the implementation of the PGDA, the average nitrate concentration across monitoring sites has shown relative stability (Table 4). However, this overall trend conceals variations: 53 % of the sites recorded an increase in nitrate levels, while 47 % experienced a decrease. The most significant reduction was observed in the Brusselian sands, while concentrations increased at most sites in the Geer basin chalks (Fig. 4). These findings are consistent with those reported by (SPW – DEE – Direction des Eaux souterraines, 2024). The observed disparity in nitrate trends between these regions reflects differences in the hydrogeological characteristics of the aquifers. The Brusselian sands, characterized by higher permeability and lower nitrogen storage capacity, may exhibit shorter response times to changes in surface nitrogen loading, resulting in more immediate declines in nitrate concentrations. Conversely, the Geer basin chalks, with greater capacity for nitrogen storage and slower groundwater flow, may exhibit a delayed response to reduced nitrogen inputs. This lag effect suggests that, despite reductions in nitrogen loading (SPW, 2025), improvements in nitrate levels in the Geer basin chalks may only become evident in the coming years, provided that nitrogen management measures continue to be implemented. As Liu et al. (2024) emphasize, addressing the delayed response caused by lag effects and nitrogen legacy requires the implementation of sustained, long-term strategies.
Encouragingly, although nitrate levels continue to rise at some sites, the pace has slowed, being lower in 2020 (I5) compared to 2002 (I4, Table 4). The maximum rate of increase also dropped from 2.7 mg L−1 yr−1 in 2002 to 0.6 mg L−1 yr−1 in 2020 (Table 4). These results indicate a positive outcome of the measures implemented under the PGDA.
4.2 Identification of the controlling factors
Our analysis confirms the anticipated relationship between agricultural land use and nitrate contamination, as nitrate concentrations showed a positive correlation with cropland area (Fig. 5 and Table 5, I1 and I2) (Gurdak and Qi, 2012; Wick et al., 2012). However, while this correlation was expected for 2002 (I1; prior to the full implementation of the PGDA), its persistence in 2020 (I2) is concerning. Nearly 2 decades after the introduction of the PGDA, which was designed to reduce nitrogen inputs and nitrate leaching, the correlation between cropland and high nitrate concentrations suggests limited effectiveness of the measures in altering the relationship between land use and groundwater quality. This lack of decoupling might also reveal “legacy nitrogen” effects, whereby nitrate accumulated in soils and aquifers from past agricultural practices continues to leach into groundwater long after inputs have been reduced (Basu et al., 2022; Van Meter et al., 2016).
Additionally, one might have expected the croplands to be negatively related to the rate of nitrate concentration change (I5 in Table 5) due to the implementation of nitrogen management measures under the PGDA. Contrary to this expectation, the observed positive relationship suggests that nitrate accumulation in groundwater is ongoing. This may reflect the combined effects of legacy nitrogen and potentially insufficient compliance or enforcement of PGDA measures in some regions (Ascott et al., 2017; Hansen et al., 2012). These findings emphasize the importance of considering both historical nitrogen loads and ongoing agricultural practices when interpreting nitrate concentration data. Efforts to enhance the effectiveness of nitrate reduction policies should consider the incorporation of measures to accelerate the recovery of aquifers and reduce the potential nitrate leaching loss, such as the promotion of deep-rooted crops (Pierret et al., 2016; Thorup-Kristensen et al., 2020). Enhanced monitoring and stricter enforcement of fertilizer application limits may also help to mitigate further contamination. Furthermore, given the evident lag effects, long-term policy evaluations should account for the temporal dynamics of nitrate transfer and accumulation within aquifers.
Forested and green areas exhibit a negative association with nitrate pollution, showing a lesser contribution to nitrate leaching, which can be explained by lower nitrogen inputs and natural buffering effects. This aligns with findings by Zhang et al. (2013) and Cameron et al. (2013), who noted that forests promote nitrogen uptake and reduce its runoff. Moreover, the data suggest that nitrate contamination evolution (I3) was slightly better in more forested zones (Table 5). This implies that PGDA measures might currently be more effective in areas with lower inherent vulnerability. Interestingly, while reductions in meadow area over time correlate with lower nitrate concentrations, meadow area itself does not show a significant impact on nitrate levels. This may result from the failure to differentiate between pasture – typically associated with high nitrate leaching – and other types of meadows (Sacchi et al., 2013). Addressing this distinction in future assessments could enhance the specificity of land-use-related policies.
No significantly negative effect was observed from built infrastructures, which contrasts with the findings of Mattern et al. (2009), who identified residential land as having a negative influence on nitrate concentrations in the Brusselian sands. This discrepancy may be due to our study's focus on semi-rural areas, where built-up areas are limited (under 8 % of total land use; Table 3) and the associated sewage pressure is likely low. Expanding monitoring to include more urbanized areas could clarify the influence of residential land use on nitrate trends.
Aquifer type emerges as a critical predictor of nitrate vulnerability, with sandy aquifers showing higher contamination levels than chalk aquifers. This suggests that policies should prioritize sandy aquifer regions, particularly those under cropland, for targeted measures like stricter nitrogen application limits and buffer zones. However, aquifer type also predicts changes over time (I3), with a general decrease in nitrate concentrations in the Brusselian sands contrasting with increases in the Geer basin chalks (Fig. 5). This finding underscores the importance of tailoring strategies to the hydrogeological characteristics of aquifers. For example, in chalk aquifers, where response times to management measures are longer due to nitrogen storage and slower groundwater flow, additional interventions may be needed to address legacy nitrogen.
Depth also plays a significant role, with shallow groundwater intake structures, only a few metres deep, showing greater improvement in nitrate concentrations compared to deeper structures, which can extend beyond 100 m. This delayed response in deeper groundwater bodies to the PGDA measures reflects a time lag in nitrate transfer through the vadose zone. Supporting evidence from Masetti et al. (2008) in northern Italy highlights how higher annual precipitation and recharge rates can shorten lag times and improve nitrate trends.
The correlation between graveyards and less favourable nitrate trends warrants careful consideration, as sparse distribution of the graveyards may obscure localized effects. Targeted monitoring near such potential point sources could help identify specific mitigation needs.
The low predictive power of the multivariate models (R2=18 %–46 %) reflects the complexity of groundwater systems and the factors influencing nitrate concentrations Groundwater systems are influenced by numerous natural and anthropogenic elements, some of which have not been fully captured due to data limitations or to unaccounted sources of nitrate leachate (Masetti et al., 2008). This complexity is compounded by non-linear relationships and time lags between surface changes and groundwater response, which our linear regression models may not fully capture (Wick et al., 2012). Furthermore, the limited number of groundwater data points (36) restricts the model's ability to account for the full variability in the system (Ishwaran, 2007).
To mitigate multicollinearity, variables with high variance inflation factor (VIF) values were removed from the multivariate regression, which likely improved the stability of the coefficient estimates but could also have led to the exclusion of significant predictors. Rainfall was removed, as it exhibited highest collinearity, as expected, given its regional variability, which also applies to other variables such as aquifer type, crop land use, and depth. Potato cropland was quite obviously highly collinear with cropland and therefore excluded. Interestingly, land use variables were not as collinear as anticipated, which can be explained by the fact that built infrastructure only accounts for buildings rather than the total urban area and that the land use variables (crop + forest + built) thus do not encompass the entire area. The methodological trade-off of removing potential controlling factors to avoid collinearity further contributes to the relatively low model performance (Ishwaran, 2007).
4.3 Challenges in defining the pollution indicators and the independent variables
We provide six nitrate pollution indicators that collectively capture nitrate pollution state and trends over time. However, the use of these indicators comes with certain limitations. The indicator on the difference in nitrate concentration (I3) may miss short-term fluctuations, while indicators I4 and I5, representing the slopes at the beginning and end of the study period, may not be representative of the longer-term trend. The indicator I6, the difference in slopes, is quite abstract and harder to interpret.
The reliability of these indicators depends on the quality and completeness of the underlying data and on the methods used to compute them. The indicators of rate of change (I4, I5, and I6) demonstrate robustness, as they are not very sensitive to the chosen method for defining local slope, as evidenced by the similar statistics (see Table S1), which increases confidence in their values.
The precise delineation of the influence zones is essential for effectively characterizing and quantifying the independent variables representing the factors affecting nitrate pollution, as highlighted by Nobre et al. (2007) and Mattern et al. (2009). However, defining these zones is fraught with challenges, due to complex subsurface geology, the ever-changing dynamics of groundwater flow, and constraints related to data availability. In our study, we used methodological simplifications to delineate these zones, acknowledging the resulting approximation. Another pitfall is the spatial overlap of the influence zones of some monitoring points. This overlap implies that the monitoring points are not entirely independent, leading to similar values of potential explanatory variables for these points. This dependency in our dataset could have influenced the data analysis.
A key strength of our study lies in the comprehensive computation of a broad array of independent variables representing potential controlling factors. However, some choices made to characterize these variables, driven by data availability limitations, may have introduced additional noise or uncertainty to the data analysis. For instance, we used the variable “Depth Structure” rather than the more precise variable “Groundwater table depth” to account for the travel time in the saturated zone, and “Rainfall” was used as a proxy for “Precipitation surplus” to approximate net recharge. These substitutions, while necessary, can affect that accuracy of our analysis and mainly the lack of more significant relationships between the independent variable and the nitrate pollution indicators. Furthermore, some potentially important controlling factors, such as agricultural practices, mitigation measures, livestock density, and manure and fertilizer storage practices, were not included in our analysis due to the lack of readily available regional-scale proxies. Incorporating modelled variables as inputs, rather than relying solely on observational data, could improve certain current proxies and enable the inclusion of new critical drivers.
4.4 Perspectives
The findings of our current study open several pathways for future research. A primary direction, contingent to the data availability, is the enhancement of independent variables representing controlling factors. Future work should refine existing variables by distinguishing between more specific crop types and rotations and by differentiating grazed from non-grazed meadows. Additionally, incorporating data on fertilizer application rates, livestock densities, nitrogen surplus estimations, in situ leachable nitrogen measurements, the state of sewage systems, actual groundwater table depth and precipitation surplus, and concentrations of other pollutants representative of nitrate-generating activities, would help increase the representation of all factors potentially influencing nitrate contamination. These advancements depend heavily on the availability of comprehensive and open datasets.
A way forward is to supplement observational data with modelled data, leveraging outputs from models like EPIC-grid, which computes nitrate recharge and precipitation surplus (Sohier et al., 2009). Additionally, groundwater dating and chemical and isotopic analyses (Böhlke and Denver, 1995; Christiaens et al., 2023; Mattern et al., 2011; Vanclooster et al., 2020) could offer valuable temporal perspectives on the source and evolution of groundwater contamination. Expanding on the integration of methods, data-driven techniques could also be combined with process-based models, leveraging the strengths of both approaches. While process-based models capture the mechanisms affecting nitrate leaching, data-driven methods can harness the full potential of available data, sometimes outperforming traditional mechanistic equations.
Expanding the groundwater nitrate concentration dataset by incorporating additional monitoring points would strengthen the representativeness and predictive power of models. With a larger dataset and better-quality independent variables, more advanced, non-linear machine learning techniques could be employed to uncover new insights and capture the complexities of nitrate contamination. These approaches could provide a deeper understanding of the underlying processes and hence help guide future best management practices. However, expanding the dataset and collecting better-quality independent variables is a challenging task due to the limited availability of long-term and spatially explicit data and the complexities associated with data collection across multiple stakeholders. Addressing these challenges will be crucial for the development of more robust and advanced analytical approaches in future studies.
This study investigates the long-term spatial and temporal dynamics of nitrate contamination in groundwater, linking these trends to land use and hydrogeological conditions. By leveraging 2 decades of data following the implementation of Wallonia's sustainable nitrogen management programme, it provides insights into persistent contamination sources, such as cropland, and highlights the critical role of aquifer characteristics and depth in mediating nitrate responses. To enhance policy effectiveness, our results reinforce the relevance of targeted interventions by prioritizing vulnerable aquifers and cropland-dominated zones. They also highlight the need to sustain and intensify monitoring to capture time lags and nitrogen legacy effects.
The limited predictive power of the regression models reflects the inherent complexity of groundwater nitrate contamination and the difficulty of adequately representing its controlling factors. Constraints such as data availability and required simplifications in defining independent variables limit model reliability. This underlines the need for more detailed and accessible datasets that better capture the controlling factors and the need to sustain and perhaps expand the monitoring systems to better capture spatial variability and localized impacts of land use. Integrating modelled data alongside observational data could also offer the potential to improve the representation of controlling factors. In addition, combining data-driven techniques with process-based models, leveraging the strengths of both approaches, could help improve model performance.
Most data used in this study are not publicly available. For data access, please contact the corresponding author.
The supplement related to this article is available online at https://doi.org/10.5194/hess-29-1829-2025-supplement.
EV and AA conceptualized the study. EV performed the data curation and formal analysis. LC provided the data. MV did the funding acquisition and project administration. AA and MV carried out the supervision. AA and EV wrote the original article. EV, AA, and MV reviewed the article. EV did the final editing.
At least one of the (co-)authors is a member of the editorial board of Hydrology and Earth System Sciences. The peer-review process was guided by an independent editor, and the authors also have no other competing interests to declare.
Publisher's note: Copernicus Publications remains neutral with regard to jurisdictional claims made in the text, published maps, institutional affiliations, or any other geographical representation in this paper. While Copernicus Publications makes every effort to include appropriate place names, the final responsibility lies with the authors.
The authors thank the Société Publique de Gestion des Eaux (SPGE) for funding the EGERIEC project, in the context of which this research was conducted. The authors thank the laboratory of the Société Wallonne des Eaux (SWDE) for providing the requested water quality data. The authors acknowledge the use of ChatGPT (OpenAI), which was used to improve language and readability of previous versions of this article. Finally, the authors would like to express their gratitude to the reviewers and the editor for their valuable feedback, which substantially improved this article.
This research has been financially supported by the Société Publique de Gestion de l'Eau (project EGERIEC).
This paper was edited by Nunzio Romano and reviewed by Hans van Grinsven and one anonymous referee.
Aller, L., Lehr, J. H., Petty, R., and Bennett, T.: Drastic: A Standardized System to Evaluate Groundwater Pollution Potential using Hydrogeologic Setting, J. Geol. Soc. Ind., 29, 23–37, https://doi.org/10.17491/jgsi/1987/290112, 1987.
Ascott, M. J., Gooddy, D. C., Wang, L., Stuart, M. E., Lewis, M. A., Ward, R. S., and Binley, A. M.: Global patterns of nitrate storage in the vadose zone, Nat. Commun., 8, 1–7, https://doi.org/10.1038/s41467-017-01321-w, 2017.
Bah, B., Vandenberghe, C., and Colinet, G.: Méthodologie de diagnostic environnemental autour de captages d'eau potabilisable sensibles qualitativement du point de vue nitrate & application à six sites de la société wallonne des eaux. Rapport d'activités final, Partie GRENERA, Convention S.P.G.E. – SWDE, 1–149 pp., 2015.
Basu, N., Van Meter, K., Byrnes, D., Van Cappellen, P., Brouwer, R., Jacobsen, B., Jarsjö, J., Rudolph, D., Cunha, M., Nelson, N., Bhattacharya, R., Destouni, G., and Olsen, S. B.: Managing nitrogen legacies to accelerate water quality improvement, Nat. Geosci., 15, 97–105, https://doi.org/10.1038/s41561-021-00889-9, 2022.
Batlle Aguilar, J., Orban, P., Dassargues, A., and Brouyère, S.: Identification of groundwater quality trends in a chalk aquifer threatened by intensive agriculture in Belgium, Hydrogeol. J., 15, 1615–1627, https://doi.org/10.1007/s10040-007-0204-y, 2007.
Böhlke, J. K. and Denver, J. M.: Combined Use of Groundwater Dating, Chemical, and Isotopic Analyses to Resolve the History and Fate of Nitrate Contamination in Two Agricultural Watersheds, Atlantic Coastal Plain, Maryland, Water Resour. Res., 31, 2319–2339, https://doi.org/10.1029/95WR01584, 1995.
Bouchard, D. C., Williams, M. K., and Surampalli, R. Y.: Nitrate Contamination of Groundwater: Sources and Potential Health Effects, J. Am. Water Works Assoc., 84, 85–90, https://doi.org/10.1002/J.1551-8833.1992.TB07430.X, 1992.
Cameron, K. C., Di, H. J., and Moir, J. L.: Nitrogen losses from the soil/plant system: a review, Ann. Appl. Biol., 162, 145–173, https://doi.org/10.1111/aab.12014, 2013.
Catalogue des données et services | Géoportail de la Wallonie: https://geoportail.wallonie.be/catalogue-donnees-et-services, last access: 21 June 2023.
Christiaens, L., Orban, P., Brouyère, S., and Goderniaux, P.: Tracking the sources and fate of nitrate pollution by combining hydrochemical and isotopic data with a statistical approach, Hydrogeol. J., 31, 1271–1289, https://doi.org/10.1007/s10040-023-02646-1, 2023.
Cleveland, W. S.: Robust locally weighted regression and smoothing scatterplots, J. Am. Stat. A., 74, 829–836, https://doi.org/10.1080/01621459.1979.10481038, 1979.
Comly, H. H.: Cyanosis in Infants caused by Nitrates in Well Water, JAMA, 129, 112–116, https://doi.org/10.1001/JAMA.1945.02860360014004, 1945.
de Vries, W., Posch, M., Simpson, D., de Leeuw, F. A. A. M., van Grinsven, H. J. M., Schulte-Uebbing, L. F., Sutton, M. A., and Ros, G. H.: Trends and geographic variation in adverse impacts of nitrogen use in Europe on human health, climate, and ecosystems: A review, Earth Sci. Rev., 253, 104789, https://doi.org/10.1016/J.EARSCIREV.2024.104789, 2024.
Ferguson, R.: Groundwater Quality and Nitrogen Use Efficiency in Nebraska's Central Platte River Valley, J. Environ. Qual., 44, 449–59, https://doi.org/10.2134/jeq2014.02.0085, 2015.
Frollini, E., Preziosi, E., Calace, N., Guerra, M., Guyennon, N., Marcaccio, M., Menichetti, S., Romano, E., and Ghergo, S.: Groundwater quality trend and trend reversal assessment in the European Water Framework Directive context: an example with nitrates in Italy, Environ. Sci. Pollut. Res., 28, 22092–22104, https://doi.org/10.1007/s11356-020-11998-0, 2021.
Grath, J., Scheideler, A., Uhlig, N., Weber, K., Kralik, M., Keimel, T., Stockmarr, J., and Gruber, G.: The EU Water Framework Directive. Statistical aspects of the identification of groundwater pollution trends, and aggregation of monitoring results, Austrian Federal Ministry of Agriculture and Forestry, Environment and Water monitoring results, 2001.
Grizzetti, B., Bouraouri, F., Billen, G., van Grinsven, H., Cardoso, A. C., Thieu, V., Garnier, J., Curtis, C., Howarth, R., and Johnes, P.: Nitrogen as a threat to European water quality, in: The European Nitrogen Assessment, edited by: Sutton, M. A., Howard, C. M., Erisman, J. W., Billen, G., Bleeker, A., Grennfelt, P., van Grinsven, H., and Grizzetti, B., Cambridge University Press, 379–404, 2011.
Gurdak, J. and Qi, S. L.: Vulnerability of recently recharged groundwater in principal [corrected] aquifers of the United States to nitrate contamination., Environ. Sci. Technol., 46, 6004–6012, https://doi.org/10.1021/es300688b, 2012.
Hansen, B., Dalgaard, T., Thorling, L., Sørensen, B., and Erlandsen, M.: Regional analysis of groundwater nitrate concentrations and trends in Denmark in regard to agricultural influence, Biogeosciences, 9, 3277–3286, https://doi.org/10.5194/bg-9-3277-2012, 2012.
Hansen, B., Thorling, L., Schullehner, J., Termansen, M., and Dalgaard, T.: Groundwater nitrate response to sustainable nitrogen management, Scientific Reports, 7, 1–12, https://doi.org/10.1038/s41598-017-07147-2, 2017.
He, S., Wu, J., Wang, D., and He, X.: Predictive modeling of groundwater nitrate pollution and evaluating its main impact factors using random forest, Chemosphere, 290, 133388, https://doi.org/10.1016/J.CHEMOSPHERE.2021.133388, 2022.
Hirsch, R. M., Alexander, R. B., and Smith, R. A.: Selection of methods for the detection and estimation of trends in water quality, Water Resour. Res., 27, 803–813, https://doi.org/10.1029/91WR00259, 1991.
Hornung, M.: The Role of Nitrates in the Eutrophication and Acidification of Surface Waters, in: Managing risks of Nitrates to Humans and the Environment, edited by: Wilson, W. S., Ball, A. S., and Hinton, R. H., Woodhead Publishing, 155–174, 1999.
Ishwaran, H.: Variable importance in binary regression trees and forests, Electron. J. Stat., 1, 519–537, https://doi.org/10.1214/07-EJS039, 2007.
James, G., Witten, D., Hastie, T., and Tibshirani, R.: An Introduction to Statistical Learning, Springer, New York, NY, https://doi.org/10.1007/978-1-4614-7138-7, 2013.
Kendall, M. G.: A New Measure of Rank Correlation, Biometrika, 30, 81–93, 1938.
Kyte, E., Cey, E., Hrapovic, L., and Hao, X.: Nitrate in shallow groundwater after more than four decades of manure application, J. Contam. Hydrol., 256, 104200, https://doi.org/10.1016/j.jconhyd.2023.104200, 2023.
Lee, H. W., Bhang, K. J., and Park, S. S.: Effective visualization for the spatiotemporal trend analysis of the water quality in the Nakdong River of Korea, Ecol. Inform., 5, 281–292, https://doi.org/10.1016/J.ECOINF.2010.05.004, 2010.
Liu, X., Beusen, A. H. W., van Grinsven, H. J. M., Wang, J., van Hoek, W. J., Ran, X., Mogollón, J. M., and Bouwman, A. F.: Impact of groundwater nitrogen legacy on water quality, Nature Sustainability, 7, 891–900, https://doi.org/10.1038/s41893-024-01369-9, 2024.
Mansfield, E. R. and Helms, B. P.: Detecting Multicollinearity, Am. Stat., 36, 158–160, 1982.
Marcoen, J., Vandenberghe, C., Mohimont, A., and Garot, T.: Convention-Cadre relative au programme de gestion durable de l'azote en agriculture wallonne, Rapport d'activités annuel intermédiaire 2002, Region Wallonne – FUSAGx, https://www.gembloux.ulg.ac.be/gp/grenera/Bibliotheque/PROTECTeau/Rapportdact2002.pdf (last access: 30 January 2025), 2002.
Masetti, M., Poli, S., Sterlacchini, S., Beretta, G. P., and Facchi, A.: Spatial and statistical assessment of factors influencing nitrate contamination in groundwater, J. Environ. Manage., 86, 272–281, https://doi.org/10.1016/J.JENVMAN.2006.12.023, 2008.
Mattern, S. and Vanclooster, M.: Estimating travel time of recharge water through a deep vadose zone using a transfer function model, Environ. Fluid Mech., 10, 121–135, https://doi.org/10.1007/s10652-009-9148-1, 2010.
Mattern, S., Fasbender, D., and Vanclooster, M.: Discriminating sources of nitrate pollution in an unconfined sandy aquifer, J. Hydrol. (Amst.), 376, 275–284, https://doi.org/10.1016/J.JHYDROL.2009.07.039, 2009.
Mattern, S., Sebilob, M., and Vancloostera, M.: Identification of the nitrate contamination sources of the Brusselian sands groundwater body (Belgium) using a dual-isotope approach, Isotopes Environ. Health Stud., 47, 297–315, https://doi.org/10.1080/10256016.2011.604127, 2011.
Nobre, R. C. M., Rotunno Filho, O. C., Mansur, W. J., Nobre, M. M. M., and Cosenza, C. A. N.: Groundwater vulnerability and risk mapping using GIS, modeling and a fuzzy logic tool, J. Contam. Hydrol., 94, 277–292, https://doi.org/10.1016/J.JCONHYD.2007.07.008, 2007.
Picron, P., Copus, A., and Wouez, D.: Water protection against nitrate and pesticides from agricultural sources – History of actions taken at farm scale in Wallonia (Belgium) for 15 years, Farm Machinery and Processes Management in Sustainable Agriculture, 9th International Scientific Symposium, Lublin, Poland, 306–311, 2017.
Pierret, A., Maeght, J. L., Clément, C., Montoroi, J. P., Hartmann, C., and Gonkhamdee, S.: Understanding deep roots and their functions in ecosystems: an advocacy for more unconventional research, Ann. Bot., 118, 621–635, https://doi.org/10.1093/AOB/MCW130, 2016.
Rivett, M. O., Buss, S. R., Morgan, P., Smith, J. W. N., and Bemment, C. D.: Nitrate attenuation in groundwater: A review of biogeochemical controlling processes, Water Res., 42, 4215–4232, https://doi.org/10.1016/J.WATRES.2008.07.020, 2008.
Rodriguez-Galiano, V., Mendes, M. P., Garcia-Soldado, M. J., Chica-Olmo, M., and Ribeiro, L.: Predictive modeling of groundwater nitrate pollution using Random Forest and multisource variables related to intrinsic and specific vulnerability: A case study in an agricultural setting (Southern Spain), Sci. Total Environ., 476–477, 189–206, https://doi.org/10.1016/J.SCITOTENV.2014.01.001, 2014.
Sacchi, E., Acutis, M., Bartoli, M., Brenna, S., Delconte, C. A., Laini, A., and Pennisi, M.: Origin and fate of nitrates in groundwater from the central Po plain: Insights from isotopic investigations, Appl. Geochem., 34, 164–180, https://doi.org/10.1016/J.APGEOCHEM.2013.03.008, 2013.
Schullehner, J., Hansen, B., Thygesen, M., Pedersen, C. B., and Sigsgaard, T.: Nitrate in drinking water and colorectal cancer risk: A nationwide population-based cohort study, Int. J. Cancer, 143, 73–79, https://doi.org/10.1002/IJC.31306, 2018.
Seabold, S. and Perktold, J.: Statsmodels: Econometric and Statistical Modeling with Python, Python in Science Conference, Austin, Texas, 92–96, https://doi.org/10.25080/Majora-92bf1922-011, 2010.
Shukla, S. and Saxena, A.: Global Status of Nitrate Contamination in Groundwater: Its Occurrence, Health Impacts, and Mitigation Measures, Handbook of Environmental Materials Management, Springer Nature Link, 1–21, https://doi.org/10.1007/978-3-319-58538-3_20-1, 2018.
Sit, M., Demiray, B. Z., Xiang, Z., Ewing, G. J., Sermet, Y., and Demir, I.: A comprehensive review of deep learning applications in hydrology and water resources, Water Science and Technology, 82, 2635–2670, https://doi.org/10.2166/wst.2020.369, 2020.
Sohier, C. and Degré, A.: Modelling the effects of the current policy measures in agriculture: An unique model from field to regional scale in Walloon region of Belgium, Environ. Sci. Policy, 13, 754–765, https://doi.org/10.1016/J.ENVSCI.2010.08.008, 2010.
Sohier, C., Degré, A., and Dautrebande, S.: From root zone modelling to regional forecasting of nitrate concentration in recharge flows – The case of the Walloon Region (Belgium), J. Hydrol. (Amst.), 369, 350–359, https://doi.org/10.1016/J.JHYDROL.2009.02.041, 2009.
Spalding, R. and Exner, M.: Occurrence of nitrate in groundwater-a review, J. Environ. Qual., 22, 392–402, https://doi.org/10.2134/JEQ1993.00472425002200030002X, 1993.
SPW: Masse d'eau souterraine RWE030 Craies de la Haine, 2006a.
SPW: Masse d'eau souterraine RWE051 – Sables du Bruxellien, 2006b.
SPW: Etat des lieux de la masse d'eau RWE053 Sables du Landénien (Est), 2010.
SPW: Fiche de caractérisation de la masse d'eau RWM040 “Craies du Geer”, 2016.
SPW: Amélioration des axes de concentration du ruissellement générés sur base du LIDAR 2015 à la résolution de 1m et des données cours d'eau dérivées – Rapport final, 2019.
SPW: Bilan d'azote en agriculture et flux d’azote des sols vers les eaux – État de l’environnement wallon, https://etat.environnement.wallonie.be/contents/indicatorsheets/SOLS4.html, last access: 30 January 2025.
SPW – DEE – Direction des Eaux souterraines: Etat des nappes et des masses d'eau souterraine de Wallonie. Février 2024. Vingt-deuxième année, ISNN 2795-6091 (N) SPW – DEE – Direction des Eaux souterraines, 2024.
Strebel, O., Duynisveld, W. H. M., and Böttcher, J.: Nitrate pollution of groundwater in western Europe, Agric. Ecosyst. Environ., 26, 189–214, https://doi.org/10.1016/0167-8809(89)90013-3, 1989.
Thorup-Kristensen, K., Halberg, N., Nicolaisen, M., Olesen, J. E., Crews, T. E., Hinsinger, P., Kirkegaard, J., Pierret, A., and Bodin Dresbøll, D.: Digging Deeper for Agricultural Resources, the Value of Deep Rooting, Trends Plant Sci., 25, 406–417, https://doi.org/10.1016/j.tplants.2019.12.007, 2020.
Torres-Martínez, J. A., Mora, A., Knappett, P. S. K., Ornelas-Soto, N., and Mahlknecht, J.: Tracking nitrate and sulfate sources in groundwater of an urbanized valley using a multi-tracer approach combined with a Bayesian isotope mixing model, Water Res., 182, 115962, https://doi.org/10.1016/j.watres.2020.115962, 2020.
Urresti-Estala, B., Gavilán, P. J., Pérez, I. V., and Cantos, F. C.: Assessment of hydrochemical trends in the highly anthropised Guadalhorce River basin (southern Spain) in terms of compliance with the European groundwater directive for 2015, Environ. Sci. Pollut. Res., 23, 15990–16005, https://doi.org/10.1007/s11356-016-6662-9, 2016.
Vanclooster, M., Petit, S., Bogaert, P., Lietar, A., Vanclooster, M., Petit, S., Bogaert, P., and Lietar, A.: Modelling Nitrate Pollution Vulnerability in the Brussel's Capital Region (Belgium) Using Data-Driven Modelling Approaches, J. Water Resour. Prot., 12, 416–430, https://doi.org/10.4236/JWARP.2020.125025, 2020.
Vandenberghe, C.: Performance de l'indicateur Azote Potentiellement Lessivable pour l'évaluation de la gestion du nitrate en agriculture et du risque pour la qualité de l'eau, Thesis, ORBi-University of Liège, 2016.
van Grinsven, H. J. M., ten Berge, H. F. M., Dalgaard, T., Fraters, B., Durand, P., Hart, A., Hofman, G., Jacobsen, B. H., Lalor, S. T. J., Lesschen, J. P., Osterburg, B., Richards, K. G., Techen, A.-K., Vertès, F., Webb, J., and Willems, W. J.: Management, regulation and environmental impacts of nitrogen fertilization in northwestern Europe under the Nitrates Directive; a benchmark study, Biogeosciences, 9, 5143–5160, https://doi.org/10.5194/bg-9-5143-2012, 2012.
van Grinsven, H. J. M., Tiktak, A., and Rougoor, C. W.: Evaluation of the Dutch implementation of the nitrates directive, the water framework directive and the national emission ceilings directive, NJAS – Wageningen J. Life Sci., 78, 69–84, https://doi.org/10.1016/J.NJAS.2016.03.010, 2016.
Van Meter, K., Basu, N., Veenstra, J., and Burras, C.: The nitrogen legacy: emerging evidence of nitrogen accumulation in anthropogenic landscapes, Environ. Res. Lett., 11, 035014, https://doi.org/10.1088/1748-9326/11/3/035014, 2016.
Visser, A., Broers, H. P., Van Der Grift, B., and Bierkens, M. F. P.: Demonstrating trend reversal of groundwater quality in relation to time of recharge determined by 3H/3He, Environ. Pollut., 148, 797–807, https://doi.org/10.1016/J.ENVPOL.2007.01.027, 2007.
Wakida, F. T. and Lerner, D. N.: Non-agricultural sources of groundwater nitrate: a review and case study, Water Res., 39, 3–16, https://doi.org/10.1016/J.WATRES.2004.07.026, 2005.
Ward, B.: Nitrification, in: Encyclopedia of Ecology, vol. 2, Elsevier, 351–358, https://doi.org/10.1016/B978-0-12-409548-9.00697-7, 2013.
Ward, M., Jones, R., Brender, J., De Kok, T., Weyer, P., Nolan, B., Villanueva, C., and Van Breda, S.: Drinking Water Nitrate and Human Health: An Updated Review, Int. J. Environ. Res. Publ. He., 15, 1557, https://doi.org/10.3390/ijerph15071557, 2018.
Wick, K., Heumesser, C., and Schmid, E.: Groundwater nitrate contamination: Factors and indicators, J. Environ. Manage., 111, 178–186, https://doi.org/10.1016/J.JENVMAN.2012.06.030, 2012.
Williams, J. R., Jones, C. A., and Dyke, P. T.: A Modeling Approach to Determining the Relationship Between Erosion and Soil Productivity, Transactions of the ASAE, 27, 0129–0144, https://doi.org/10.13031/2013.32748, 1984.
Zhang, X., Xu, Z., Sun, X., Dong, W., and Ballantine, D.: Nitrate in shallow groundwater in typical agricultural and forest ecosystems in China, 2004–2010, J. Environ. Sci., 25, 1007–1014, https://doi.org/10.1016/S1001-0742(12)60139-9, 2013.
Zones de protection des captages d'eau souterraine – État de l'environnement wallon: http://etat.environnement.wallonie.be/contents/indicatorsheets/EAU 16.html, last access: 16 December 2024.