the Creative Commons Attribution 4.0 License.
the Creative Commons Attribution 4.0 License.
 | 04 Apr 2025
Can adaptations of crop and soil management prevent yield losses during water scarcity? A modeling study
Maria Eliza Turek
Bettina Schaefli
Andreas Keiser
Annelie Holzkämper
With climate change, the increasingly limited availability of irrigation water resources poses a major threat to agricultural production systems worldwide. This study explores climate adaptation options in soil and crop management to reduce yield losses due to water scarcity and irrigation restrictions during the 2022 summer drought. The focus is on potato production in the Broye catchment in Switzerland, which is representative of many mid-sized lowland catchments in central Europe facing reduced irrigation water availability. We employed the field-scale agro-hydrological Soil–Water–Atmosphere–Plant (SWAP) model in a distributed manner to simulate regional irrigation demand, yields, and deficits under drought stress. The results suggest that irrigation bans and drought in 2022 led to a 16.4 % reduction in potato yield due to a 59 % deficit in irrigation water. Our findings suggest that adding 1 % of soil organic carbon (SOC) down to a depth of 60 cm could have reduced the yield loss to only 7 %. Planting earlier-maturing potato varieties under less favorable pedoclimatic conditions further improves irrigation water productivity (IWP) and reduces irrigation water demand by 26 %. In this case, however, there is a tradeoff in yield, the reduction of which can only be −14.8 %. Overall, our findings highlight the great value of soil organic carbon for preventing productivity losses during droughts using the example of a recently experienced drought year. Furthermore, we show that irrigation water use efficiency can be optimized by location-specific combinations of adaptation choices. In the face of future droughts exacerbated by climate change, the measures studied here represent a valuable adaptation to mitigate yield losses and reduce dependence on irrigation.
- Article
(7534 KB) - Full-text XML
-
Supplement
(627 KB) - BibTeX
- EndNote


The agricultural sector is particularly vulnerable to climate change impacts and is confronted by rising temperatures and shifting precipitation patterns that trigger agricultural and hydrological droughts (Fahad et al., 2017; IPCC, 2023; Uniyal and Dietrich, 2021). The projections for the future indicate a substantial increase in drought frequency that is often compounded by heat waves, exacerbating the impacts of drought and heat stress on crops (IPCC, 2023). Elevated temperatures drive up potential evapotranspiration, amplifying crop water requirements (Allani et al., 2020). Simultaneously, ongoing and projected decreases in summer precipitation in regions across the middle and high latitudes amplify the demand for irrigation to satisfy these increasing crop water requirements (Allani et al., 2020). Following the drought in the summer of 2022, maize and soy yields in Europe declined by 16 % and 15 % (Toreti et al., 2022a, b). Compared to the current conditions, Leng and Hall (2019) project accelerated global yield losses for major crops. For wheat and maize, additional reductions of up to 12 % and up to 6.3 % are expected until the end of the century, compared to 1961–2016, if no adaptation measures are taken (Leng and Hall, 2019). Given that droughts are the leading cause of yield losses globally (Bodner et al., 2015), the imperative to enhance water utilization efficiency and adapt water and soil management practices is becoming increasingly evident (Bodner et al., 2015; Fahad et al., 2017).
Expanding irrigation to mitigate droughts may lead to distributional and prioritization conflicts among various water users and aquatic ecosystems (He et al., 2023; Kreins et al., 2015). Such conflicts are reinforced in locations where climate change affects seasonal water availability. In alpine regions, as warming progresses, more precipitation will fall as rain instead of snow (Yang et al., 2021), resulting in reduced snowmelt-driven streamflow during the subsequent melt period (spring and early summer). In pluvial lowland catchments, winter runoff will increase. At the same time, however, summer low flow is expected to continue to decrease as increasing evapotranspiration rates meet decreasing seasonal precipitation, as in most of central continental Europe (Floriancic et al., 2021). Consequently, irrigation will not always be feasible or able to alleviate the drought and heat stress for crops. Therefore, it is crucial to implement strategies that (i) reduce reliance on irrigation, (ii) maintain soil moisture for crops at sufficiently high levels for more extended periods, and (iii) minimize losses through evaporation or surface and subsurface runoff (Bodner et al., 2015).
Irrigation is often critical at specific stages of growth when a plant is especially prone to drought or heat stress induced by inadequate soil moisture levels and lacking precipitation. Earlier-maturing varieties can partially alleviate this issue by accelerating phenological development to “escape” the drought. Planting earlier-maturing crops or winter varieties is often recommended in temperate regions such as Switzerland (Federal Office for the Environment (FOEN), 2017, 2021). It should be noted that potatoes, for example, have very different uses depending on their maturity class. Late-maturing potatoes give higher yields and are most suitable for processing (crisps and fries), while earlier-maturing varieties are mainly used as table potatoes. In addition to the choice of crop variety, soil management practices, like cover cropping, mulching, conservation tillage, and organic amendments, can help boost soil moisture content (Diacono and Montemurro, 2010; Hou et al., 2012; Kader et al., 2019; Moussa et al., 2002; Mulumba and Lal, 2008; Wezel et al., 2014).
Organic amendments that target the increase in soil organic carbon (SOC) lead to increased water retention and water use efficiency (Diacono and Montemurro, 2010; Eden et al., 2017). Turek et al. (2023) tested different levels and depths of increase in SOC and their impacts on crop transpiration. The study reports that adding 2 % of SOC to a depth of 60 cm can reduce water stress and increase the resilience of crops at the onset of droughts. An increase in SOC can be achieved through several practices, e.g., conservational tillage, cover cropping, or the application of compost or manure (Krauss et al., 2022; Bolinder et al., 2020; Eden et al., 2017; Gross and Glaser, 2021).
These practices directly influence essential soil structural properties and the associated soil physical parameters (i.e., hydraulic conductivity and water retention capacity), thereby modifying the associated hydrological processes such as evapotranspiration, infiltration, local surface and subsurface runoff formation, and groundwater recharge. In their extensive review of the impact of soil health measures on water resources in irrigation, Acevedo et al. (2022) gave a broad overview of the principles and practices of soil health and listed future opportunities and challenges. They drew attention to the role of soil health in increasing green water consumption (the share of crop evapotranspiration that is satisfied by soil water provided by precipitation) and reducing reliance on blue water (irrigation water taken from the surface water or groundwater, which is needed to bridge potential deficits). Acevedo et al. (2022) argued that while there is a large body of work on individual or sometimes combined soil management measures, the representation of and translation into agro-hydrological models to quantify their impact on green and blue water beyond the field scale are still missing.
There are guidelines and studies on how to irrigate certain crops (Wriedt et al., 2009; Gu et al., 2020; Fricke and Riedel, 2019) or how to increase the efficiency of irrigation (Lalehzari and Kerachian, 2020; Maier and Dietrich, 2016). However, quantifying irrigation demand and supply deficits on a scale relevant to stakeholders such as infrastructure planners is complex and, therefore, rarely undertaken. This is a significant knowledge gap given that irrigation remains the world's largest user of freshwater (Acevedo et al., 2022; Kennan et al., 2019; Samimi et al., 2020). Regional water demand serves as a pivotal metric for decision-making regarding water allocation and the strategic planning of new irrigation infrastructure projects, such as water retention basins.
In their comprehensive review, Uniyal and Dietrich (2021) examined various approaches and (agro-)hydrological models for estimating catchment-scale irrigation demand and evaluating their characteristics and ability to represent both hydrological and agricultural processes. Included are distributed models of different complexity that operate on a catchment scale, like SWAT (Arnold et al., 2012), WaSiM (Schulla, 2021), HYPE (Swedish Meteorological and Hydrological Institute (SMHI), 2023), or WEAP (Stockholm Environment Institute (SEI), 2015), as well as one-dimensional (soil-column-scale) models like Soil–Water–Atmosphere–Plant (SWAP) (Kroes et al., 2000) or AquaCrop (Food and Agriculture Organization of the United Nation (FAO), 2016) that can be upscaled and regionalized. They further differentiated between mechanistic models and conceptual models. While mechanistic models like SWAP or WaSiM include and represent physical process descriptions, e.g., the Richards equation, models like SWAT or HYPE operate in a more simplistic way (Uniyal and Dietrich, 2021). Most catchment-scale agro-hydrological models employ a rough and static representation of crops and use the same parameterizations for entire crop classes (Uniyal and Dietrich, 2021; Zhang et al., 2021). When it comes to irrigation management, most models can schedule applications. The field-scale model SWAP is coupled with the comprehensive crop growth model WOrld FOod STudies (WOFOST) and, therefore, can dynamically simulate crop growth in response to primarily biogeochemical processes in a detailed way (Uniyal and Dietrich, 2021). Depending on the water source, SWAP can also represent water use constraints in a simplified way by reducing the time frame when irrigation is feasible or authorized. SWAP is widely used in water management and climate change impact studies. Cyano et al. (2007) applied SWAP to evaluate the impacts of climate change on crop growth (maize and wheat) and irrigation requirements in Türkiye. Using SWAP, Utset et al. (2007) modeled sugar beet water use in the Mediterranean region. They pointed out the importance of calibrating and validating the standard parameters of the model in order to adapt them to local conditions, especially for temperature sums, which strongly influence the development stages. Noory et al. (2011) used the integrated SWAP–WOFOST model to assess measures to improve water management in Iran. To capture its heterogeneity, they divided the region into homogeneous simulation units with specific climatic, edaphic, and irrigation data. Despite patchy land use data, the model achieved good accuracy in simulating annual surface runoff, although with a slight underestimation. Since irrigation scheduling can be automatized depending on different thresholds in soil moisture, the model is well suited to representing realistic irrigation applications and demand.
Winter et al. (2017) explored how agricultural assessments represent water scarcity. They concluded that, when quantifying irrigation demand, the actual supply is often not given and the impact of water availability on crop yield is not assessed. They advocated using loosely coupled crop and hydrological models to fully capture irrigated agricultural systems. The restriction of water use is often not considered in models, which Winter et al. (2017) identified as a limitation of state-of-the-art models. Brochet et al. (2024) used SWAT to integrate irrigation water withdrawals into their streamflow predictions to account for the significant anthropogenic influence in low-flow periods. In their study area, daily irrigation water withdrawal was measured and used for calibration and validation. However, they did not take into account water restrictions, which are described as common and influential in the catchment.
Gorguner and Kavvas (2020) calculated the water balance in a semi-arid catchment to quantify the future unmet irrigation demands under climate change and used the FAO56 approach (Allen et al., 1998) to estimate irrigation water requirements. They found that future water levels in the reservoirs are insufficient to meet the increase in irrigation water demand under future climate change (Gorguner and Kavvas, 2020). Such efforts to quantify current or future irrigation water demand and shortage have been made globally (Wada et al., 2014; Müller Schmied et al., 2021; Joseph et al., 2020), in semi-arid catchments (Gorguner and Kavvas, 2020), or without considering water restrictions (Brochet et al., 2024; Masia et al., 2021).
In this context, this study presents an approach to reduce critical knowledge gaps by (i) quantitatively assessing the impacts of water resource limitations on agricultural productivity and yield losses during a recent drought year and (ii) evaluating the benefits of soil and crop management adaptations in order to reduce such yield losses in the face of limited irrigation water resources. The selected case study is the Broye River catchment in Switzerland, which is representative of many mid-sized lowland catchments in central Europe that experience a reduction in low flows and, therefore, their irrigation water supply. Many catchments, like the Broye, are thus subject to temporary irrigation bans, impacting agricultural production.
The applied model is the field-scale SWAP model (Kroes et al., 2000), which is used here in a spatially explicit manner (Sect. 3.4.2). This physically based model is suitable for this study because it simulates crop growth, irrigation demand, and soil water fluxes in detail and can integrate irrigation water constraints through the irrigation module implemented within the WOFOST crop model (Supit and Van Diepen, 1994). We evaluate the effects of crop and soil management in the form of earlier-maturing varieties and increased SOC on potato irrigation demand and yield.
The Broye River catchment is located in the southwestern part of the Swiss Central Plateau and covers an area of 604 km2 with a maximum elevation of 1574 (Hydrological Atlas of Switzerland (HADES), 2024). The Broye River has its source in the Fribourg Prealps and flows into Lake Murten at an altitude of 644 (Hydrological Atlas of Switzerland (HADES), 2024).
The predominant soil types in the region are loam, clay loam, and sandy loam (Fig. 2; Swiss Competence Centre for Soil, 2023), and the mean SOC content is 1.7 %. The Broye River catchment, being a part of the Swiss Central Plateau and a primary agricultural production zone, comprises 68 % of the agricultural land in 2022 (Fig. 1, KGK-CGC, 2023).
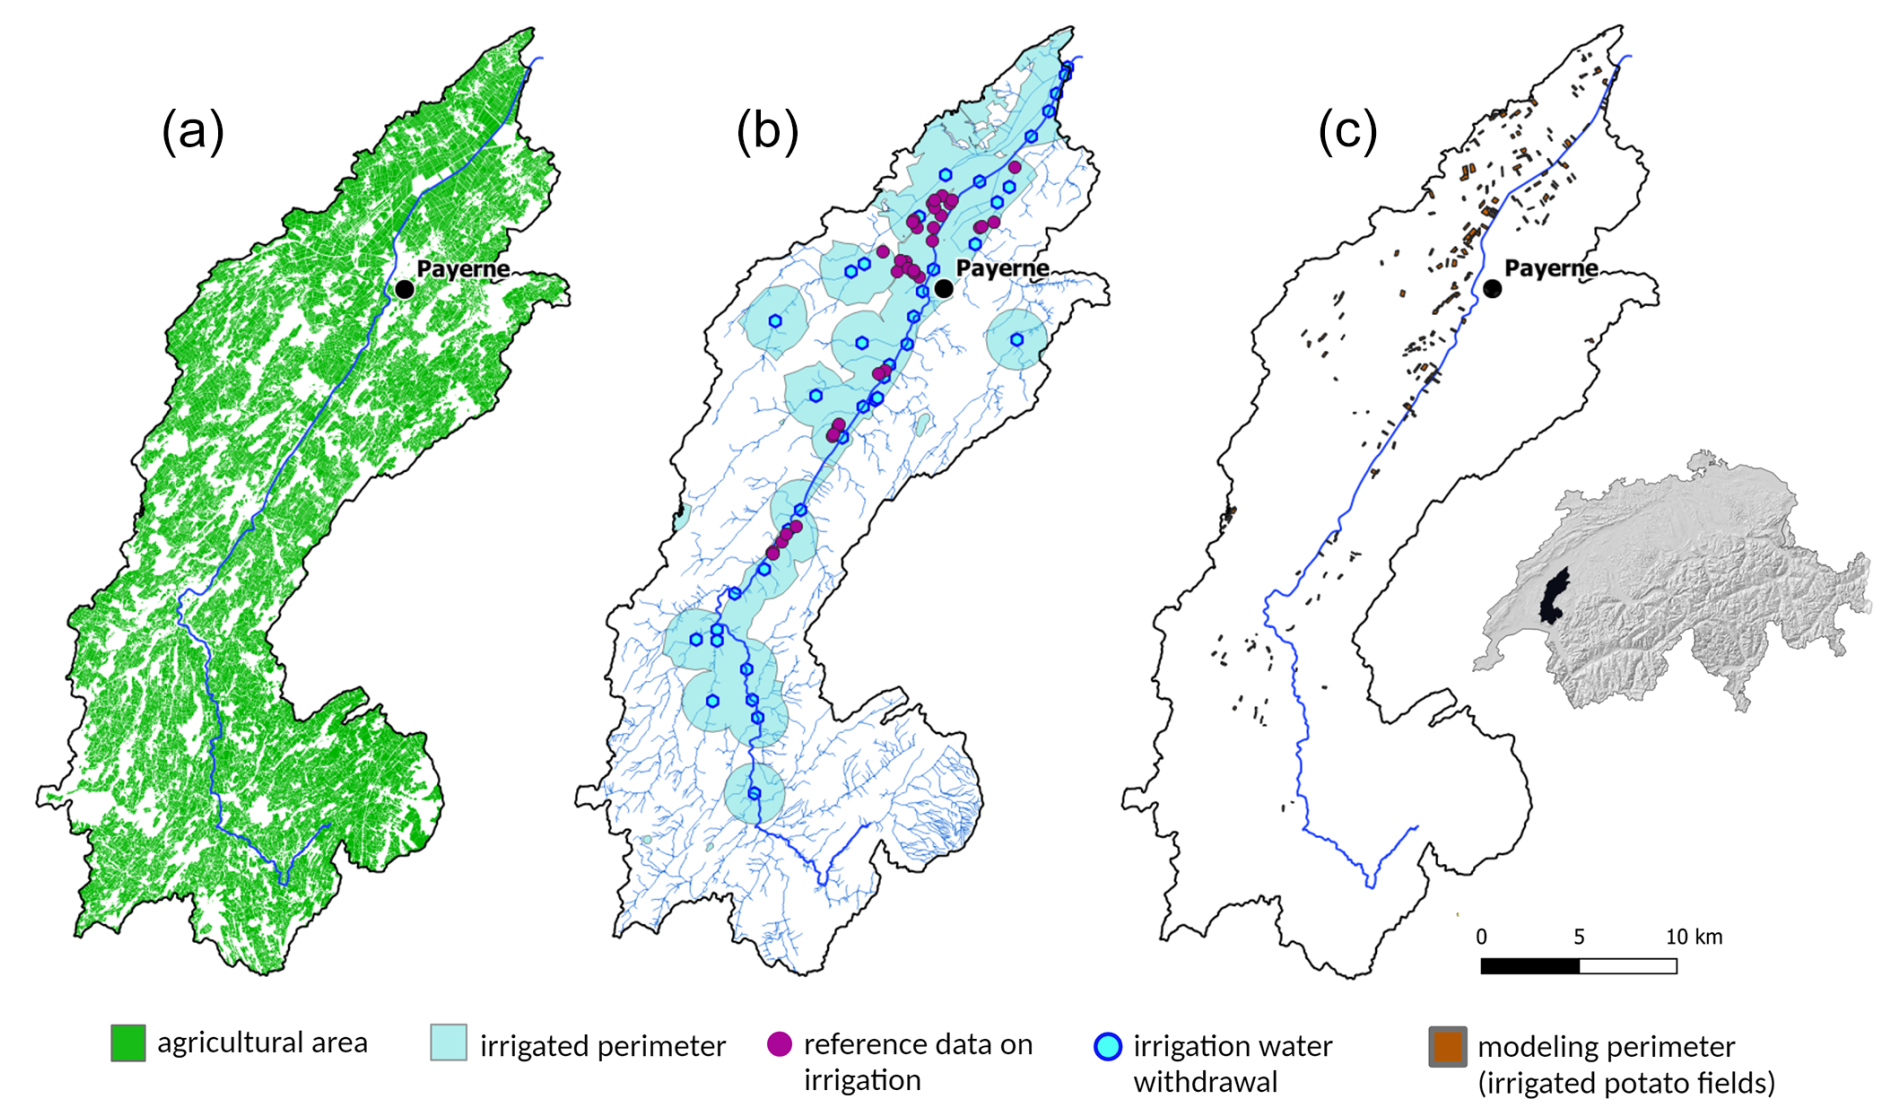
Figure 1(a) Agricultural land use in the Broye catchment (KGK-CGC, 2023). (b) The blue area is the potentially irrigated area (177 km2). The purple points are station year reference data points for irrigation (School of Agriculture, Forest and Food Sciences HAFL, unpublished data). The blue points are concession withdrawal stations for irrigation water, with the locations provided by the respective cantons as considered in the report of HAFL (School of Agricultural, Forest and Food Sciences HAFL, 2023). (c) Irrigated potato fields and modeling perimeter (9.12 km2).
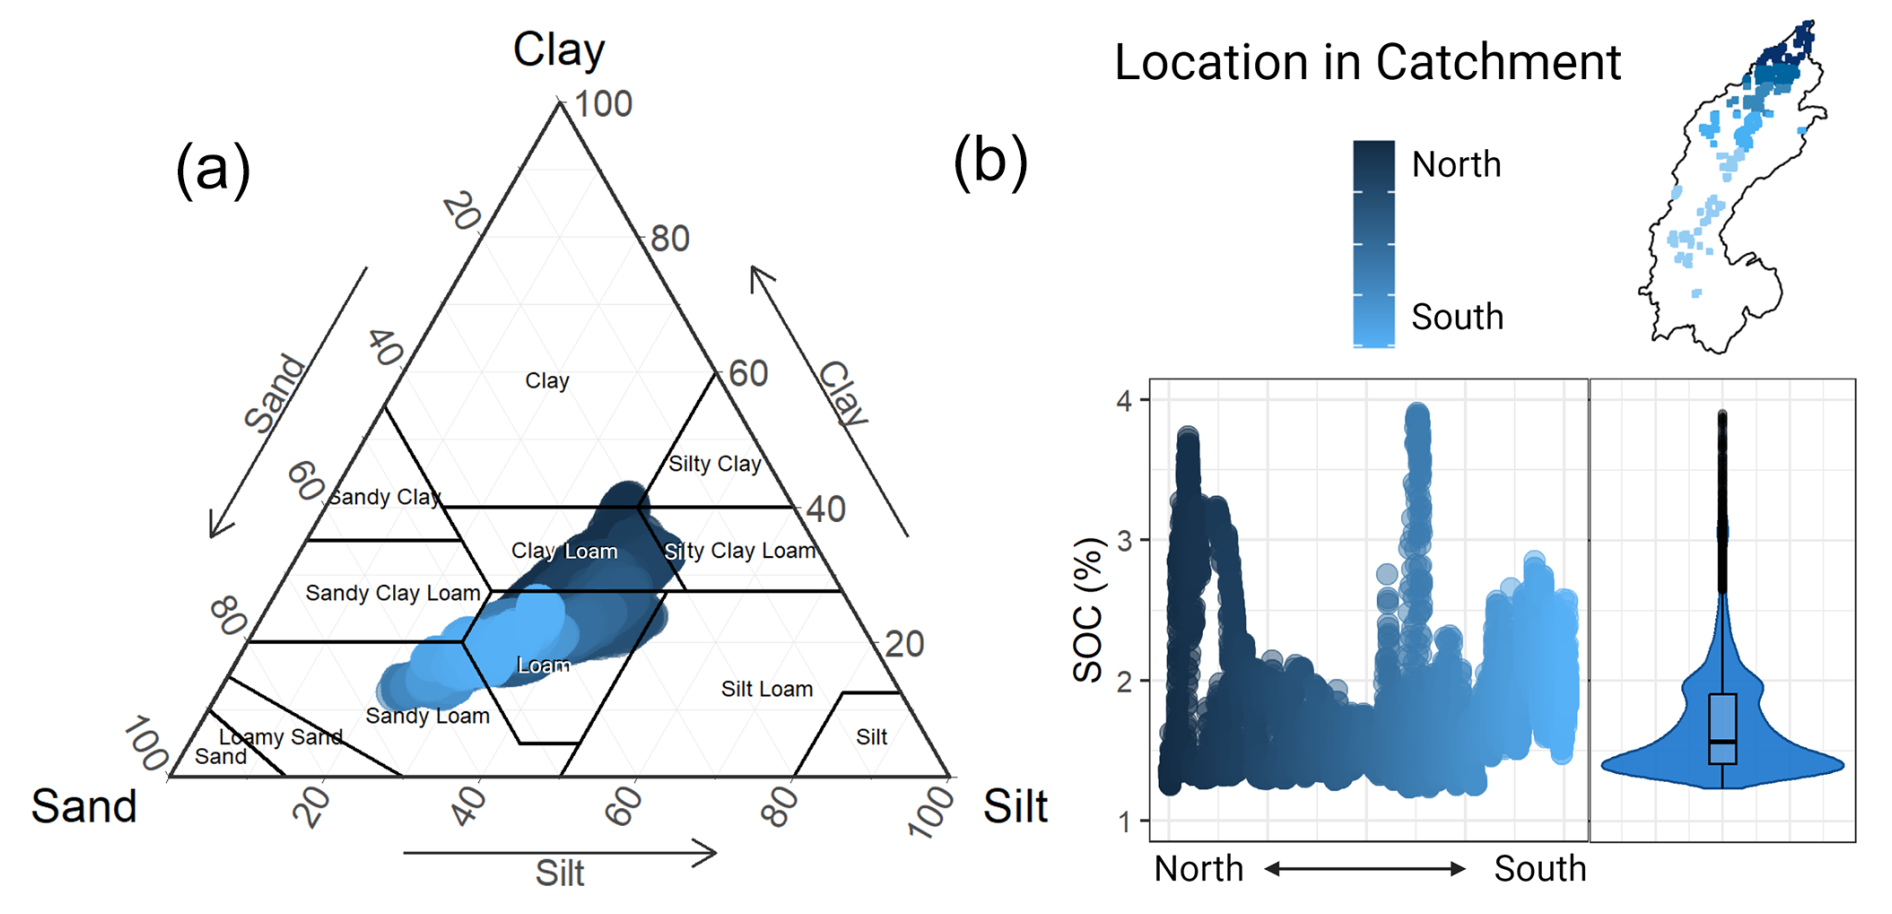
Figure 2Soil texture and soil organic carbon (SOC) content over the study perimeter. The color gradient corresponds to the longitudinal gradient within the study perimeter (Sect. 3.2.1).
The mean daily temperature in the catchment is 9 °C, and the mean annual precipitation is 1158 mm (1991–2020; MeteoSwiss, 2021a, b). In 2022, the mean temperature was 10.9 °C, and the annual precipitation was 1003 mm (−13.4 % precipitation compared to the long-term mean). For the meteorological station in Payerne, located within the main agricultural zone, the mean temperature in 2022 was 11.4 °C and the annual precipitation 816 mm (−29.3 % precipitation compared to the long-term mean) (MeteoSwiss, 2024). In 2022, precipitation was below the long-term monthly means already in spring, but especially in July and August (MeteoSwiss, 2024).
The average daily discharge of the Broye is 7.7 m3 s−1 (period 1920–2019), with a maximum monthly mean of 11 m3 s−1 in March and a minimum monthly mean of 4.1 m3 s−1 in August (Federal Office for the Environment (FOEN), 2023). Many lowland streams in western Switzerland, such as the Broye, experience extremely low flows during summer and fall droughts. In drought years, including 2003, 2015, and 2018, the annual discharge of the Broye and the monthly discharges from June to October were well below the long-term average (7.7 m3 s−1, Federal Office for the Environment (FOEN), 2015, 2017, 2020). Climate change is projected to reduce Swiss summer streamflow on average by up to 20 % (Federal Office for the Environment (FOEN), 2021). For lowland catchments such as the Broye (mean elevation <1500 ), a reduction by up to 50 % by the end of the century is projected (Federal Office for the Environment (FOEN), 2021).
In the Broye River catchment, 83 % of the irrigation water is withdrawn with mobile pumps from the Broye and the Petit Glâne (a tributary of the Broye) and the remaining 17 % from other smaller tributaries and local water distribution networks (Robra and Mastrullo, 2011). Farmers have to apply for concessions to be allowed to irrigate in certain places, and sometimes these concessions are shared. In a survey from 2011, Robra and Mastrullo (2011) found that 89 % of the area is irrigated with sprinkler irrigation, 6 % with linear irrigation (long mobile pipes that distribute water across the field), and only 4.5 % with drip irrigation (water is applied directly to the roots).
The withdrawals for irrigation are prohibited when the Broye in Payerne drops below the legal minimum environmental flow, which in Switzerland is fixed at the long-term streamflow 5th percentile. For the Broye, this value equals 1.26 m3 s−1 (Robra and Mastrullo, 2011). From 2011 to 2022, water withdrawal bans from the Broye (and its relevant tributaries) occurred in 9 years, beginning most often in mid-July and lasting until November (Canton of Vaud, unpublished data).
The main crops grown in this catchment are winter wheat (33 %), green and silage maize (13 %), winter rapeseed (11 %), winter barley (9 %), sugar beet (8 %), and potatoes (5 %) (Federal Office for Agriculture (FOAG), 2023b). According to an estimation based on a survey by Robra and Mastrullo (2011), 2.3 % of the land, including meadows and pastures, is irrigated, mainly with water directly from the Broye River. The most water-intensive crops are potatoes (50 % of the total regional irrigation water use), maize (15 %), tobacco (15 %), and sugar beet (8 %) (Robra and Mastrullo, 2011). We focus our modeling framework on potato fields because they have the most commercially relevant demand for irrigation, accounting for around 50 % of the water use in the area. Furthermore, reference data on irrigation practices and bans are available, improving model validation and further analysis.
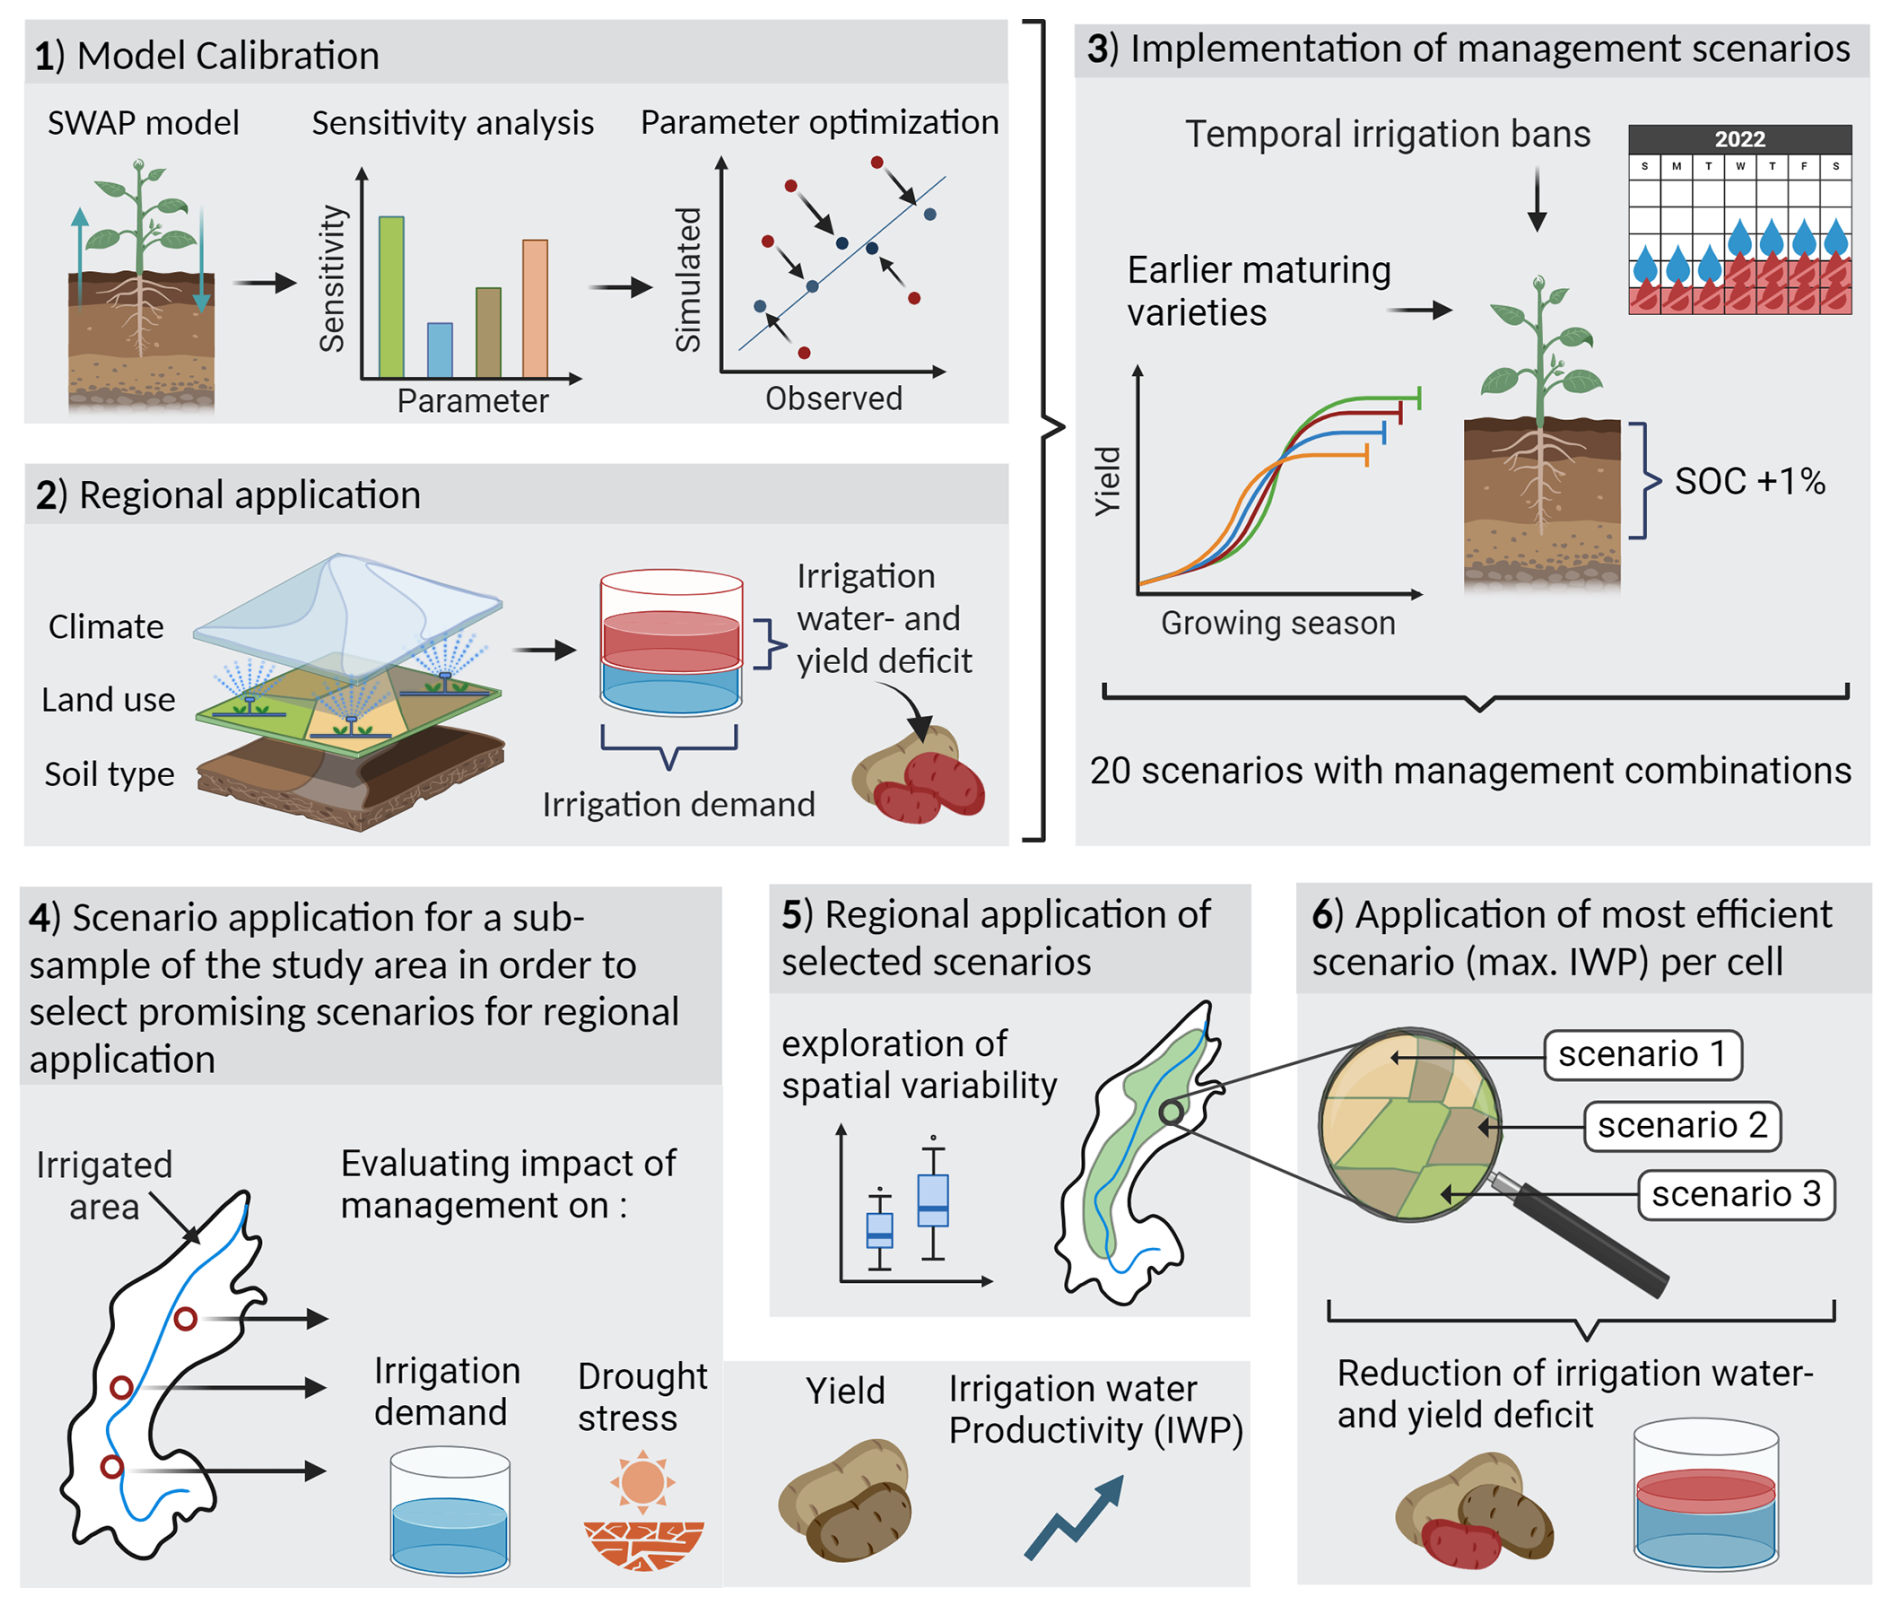
Figure 3Methodological framework.
We use the agro-hydrological model SWAP (version 4.01), which simulates potato development and yield formation in response to daily temperature and soil water availability to the plant. We apply the field-scale model at the catchment scale, using high-resolution input data. The aim is to assess the effectiveness of management measures in reducing irrigation demand and yield losses. This involves evaluating how seasonal irrigation demand, crop yield, and drought stress change in response to irrigation bans and adapted management practices.
3.1 Data
3.1.1 Meteorological data
As meteorological input, SWAP requires daily time series of minimum and maximum temperature, solar radiation, and precipitation. We use the corresponding data from the Swiss national weather service, MeteoSwiss, which are available on a 1 km×1 km resolution grid (MeteoSwiss, 2021a, b; Stoeckli, 2013). We calculate the reference evapotranspiration (ET0) with the Priestley–Taylor approach (Taylor and Priestley, 1972), as there are no vapor pressure and wind speed data available to use the Penman–Monteith approach.
3.1.2 Soil data
The digital map for soil properties from the Swiss Competence Centre for Soil (KOBO) (2023) provides data on soil texture and organic carbon at depths 0–30, 30–60, and 60–120 cm for Switzerland at a resolution of 30 m×30 m. The soil map is the product of a model trained and validated with a series of predictor variables combined with over 30 000 measurements of soil properties in Switzerland, which results in more than one sample per square kilometer. To estimate the Mualem–van Genuchten parameters (van Genuchten, 1980) required by SWAP, we use the pedotransfer function (PTF) sets of the euptf2 package in R (Szabó et al., 2021) with the option “ptf02” that uses soil texture and soil organic carbon content as inputs. Although no reference data are available to validate our estimates, we build on the literature that suggests that if the spatiotemporal state of the soil is known, PTFs can indeed be used to estimate soil hydraulic properties from soil maps for further use in numerical models (Weber et al., 2024). Considering a typical Swiss agricultural soil, Turek et al. (2023) applied this specific PTF and validated it with soil moisture measurements (r=0.79).
3.1.3 Observational data for model calibration and validation
We use two different datasets for the model calibration: (i) a field-scale dataset on irrigation water and (ii) regionally averaged yield data without information on irrigation practices. The field-scale dataset is available from the School of Agriculture, Forest and Food Sciences HAFL (unpublished data) and comprises information for a total of 33 station years, where each station year represents data collected from one potato field over 1 year (Fig. 1). This dataset includes detailed data such as sowing and harvest dates, yield, soil texture, and irrigation timing and amounts between the years 2018 and 2021. Note that not all of the fields have data available for each year within this range. Regionally averaged yield data are obtained from a national survey of selected potato production sites within a 15 km radius of Payerne, the location of the nearest weather station (Agroscope, 2023). Subsequently, the data are aggregated to compute an annual mean from 1991 to 2022. Due to limited amounts of data, all reference information within the study area is used for calibration. We employed two datasets for model validation: (i) a field-scale irrigation water use dataset encompassing 61 station years across the entire Swiss Central Plateau (School of Agricultural, Forest and Food Sciences HAFL, unpublished data) and (ii) regionally averaged yield data for a 15 km radius surrounding the Bern (BER) weather station situated within an agricultural area near our study region (Agroscope, 2023).
3.2 Model description and setup
The SWAP model is an open-source, field-scale, one-dimensional, vertically oriented, and physically based agro-hydrological model (Kroes et al., 2000; van Dam et al., 2008). The model uses a set of equations, such as the Richards equation, to simulate soil water flow, heat flow, and solute transport within the vadose zone (Noory et al., 2011). The model requires daily climate input data and soil texture and hydraulic parameters. According to Bonfante et al. (2010), SWAP is superior to similar crop models (MACRO, Jarvis, 1994; CropSyst, Stoeckle et al., 2003) in simulating surface infiltration, drying processes, and crop growth. This advantage is thought to be due to the fine resolution of the Richards equation and its numerical solution, particularly near the upper and lower boundaries (Bonfante et al., 2010; van Dam et al., 2008). SWAP can be coupled to the WOFOST model (Supit and Van Diepen, 1994) to simulate detailed crop growth based on light interception and CO2 assimilation (Hu et al., 2019). In WOFOST, dry matter yield results from a gradual reduction of the photosynthetically produced carbohydrates (biomass) and the distribution of this biomass to different plant organs, one of which is the potato tuber (Kroes et al., 2017).
ten Den et al. (2022) introduced a more dynamic concept for the allocation of biomass to different plant organs. Instead of using a tabular form for the allocation at different phenological development stages, we implement the sigmoid functions that describe the share of biomass allocated to each organ, depending on the plant's development stage, as introduced by ten Den et al. (2022). These functions allow a smoother and more realistic representation of biomass allocation (ten Den et al., 2022).
3.2.1 Model perimeter
To address the challenge of identifying the regularly irrigated areas, we estimate the irrigation perimeter based on technical considerations. In Swiss agriculture, it is reasonable to assume that mobile pumping stations transport water for an average distance of around 1600 m, contingent upon variables such as slope, hose diameter, and pump capacity (personal communication, Simon Baumgartner, smart farming engineer, 7 July 2023). Based on this rough estimate, we compute a buffer around all known water withdrawal concessions for (mobile) pumping stations (School of Agricultural, Forest and Food Sciences HAFL, 2023). We then adjust them based on logical constraints, such as tarred roads, and combine them with information on irrigated areas available from interviews in the region (Schaffner and Mastrullo, 2013). The resulting irrigation perimeter used for the modeling in this work is shown in Fig. 1, including the locations of irrigated potato fields from very detailed field-scale land use maps (KGK-CGC, 2023). The vector data on potato fields are combined with fine-resolution grid cells of the soil map (resolution 30 m×30 m) by assigning relative proportions of coverage by the potato fields to each grid cell (number between 0 and 1).
3.2.2 Other model setup options
We define the sowing date using the average sowing date from the field-scale reference data, i.e., 15 April, allowing the model to harvest whenever maturity is reached. In SWAP, we simulate irrigation by setting a period when it is allowed, the type of irrigation, a threshold to trigger irrigation based on soil properties, and the amount of water to apply when the threshold is reached. We set the irrigation period in such a way that 90 % of the observed irrigation amounts from the reference data fall within this period. As a result, the irrigation period is set to 4 June to 5 August. This period is consistent with the reference data and established irrigation practices (Fricke and Riedel, 2019; Kaspar et al., 2020). Irrigation is triggered by a predefined value of 40 % depletion of plant available water (water held in the soil between the field capacity and wilting point). We set the goal for the irrigation to bring the soil back to the field capacity but define lower (10 mm) and upper (30 mm) amounts to represent common agricultural practice and the capacity of the installed systems. The irrigation type is set to surface irrigation. The lower boundary condition of the model is set to free drainage. In 2022, several irrigation bans were imposed on water withdrawal from the Broye and its tributaries. These bans, imposed between 23 June 2022 and 26 September 2022, either prohibited irrigation altogether or allowed it only at night for certain users (Canton of Vaud, unpublished data). Consequently, in SWAP, the irrigation period is restricted to 5–23 June 2022.
3.3 Model calibration
A global sensitivity analysis (GSA) is performed to identify the most sensitive parameters for optimization. The crop parameters with the highest impact on yield and irrigation demand are then optimized using a genetic algorithm (DEoptim, Mullen et al., 2011) to closely match the reference data for the regionally averaged annual yield and field-scale seasonal irrigation demand.
3.3.1 GSA
We use Sobol indices (Puy et al., 2022), which have been used in several studies utilizing SWAP, to determine the most sensitive model parameters for a certain model output (Stahn et al., 2017; Wesseling et al., 2020; Xu et al., 2016). Sobol indices allow for a variance-based analysis of the first and total orders of effects, meaning independent parameter effects and parameter interactions (Puy et al., 2022). We set the algorithm parameters N (number of samples) and R (number of bootstrap replicates) to 3000 and 200, resulting in 93 000 model runs. To compute the sensitivity indices, we use Latin hypercube sampling (Wesseling et al., 2020; Xu et al., 2016) as implemented in the sensobol R package (Puy et al., 2022) to generate 3000 parameter sets. Guided by recommendations from the WOFOST manual (de Wit and Boogaard, 2021), we examine 29 parameters, including parameters that partially determine the phenology, CO2 assimilation, root architecture, oxygen stress, drought stress, and biomass partitioning to different parts of the plant. The sensitivity of these parameters is tested on yearly crop yields and irrigation amounts. Each parameter is varied within the range of ±15 % of the default values for almost all the parameters, as the default parameterization already gives a good fit to the reference data (ranges shown in Table S1 in the Supplement). The phenology of the crop is mainly determined by temperature sums in the form of growing degree days (GDDs), which in SWAP mark different development stages (DVSs) of the crop (0: sowing, 1: anthesis, and 2: maturity). The different temperature sums are called TSUMOPT (growing degree days from sowing to emergence), TSUMEA (from emergence to anthesis), and TSUMAM (from anthesis to maturity). As their high relevance for yield simulation is well known (Utset et al., 2007), we exclude them from the sensitivity analysis (and use the default values for potato) but include them later in the parameter optimization.
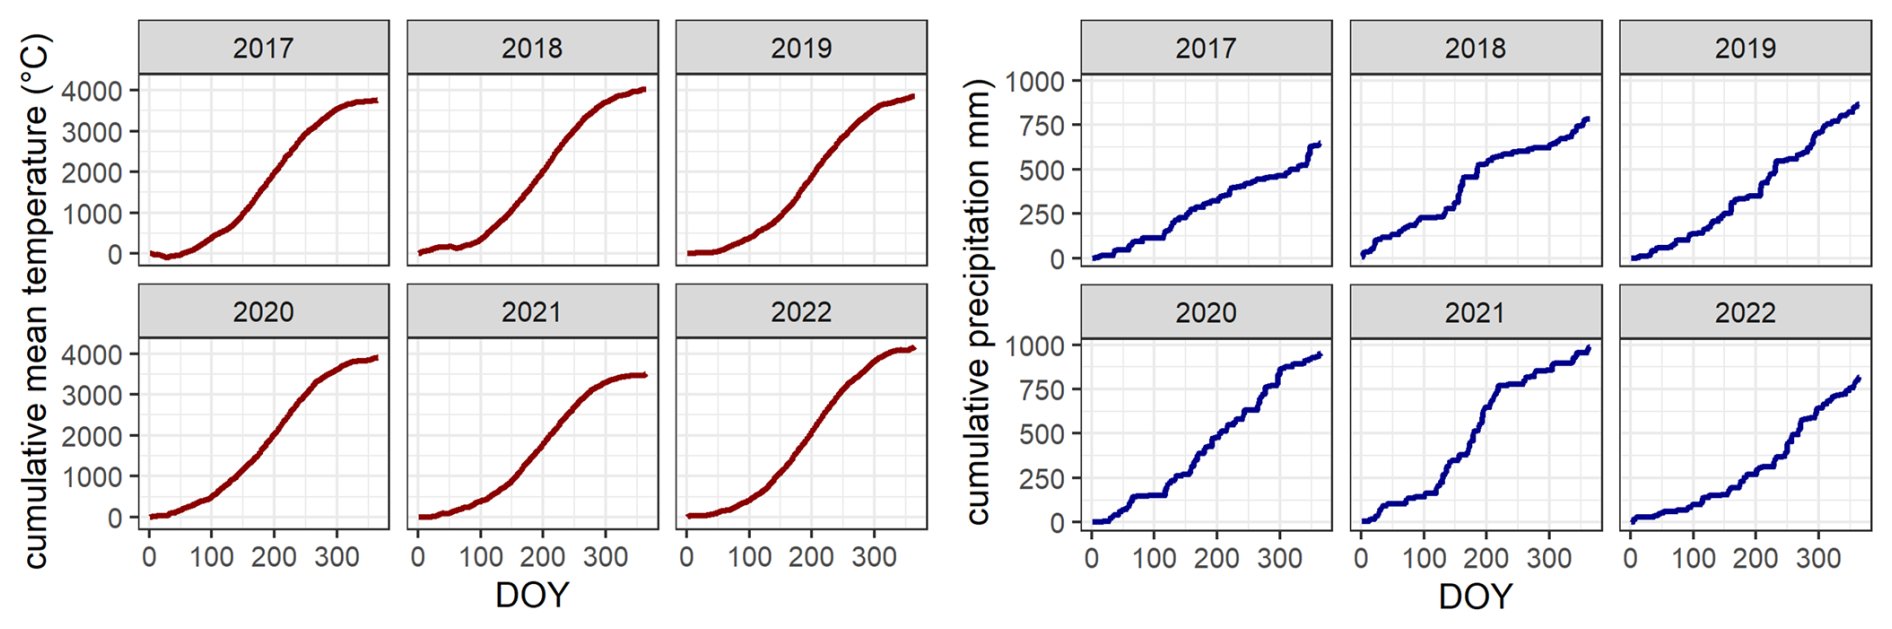
Furthermore, a representative soil texture of the field-scale reference sites is used to run the model simulations from 2017 to 2019. This period was chosen to capture meteorological variability. The year 2017 is characterized by relatively cool but dry conditions, the year 2018 by warmer temperatures and relatively dry conditions, and the year 2019 by temperatures in between the other years but with wetter conditions (Fig. 4).
3.3.2 Parameter optimization
We use the R package DEoptim (Mullen et al., 2011) to optimize the most sensitive parameters identified with the GSA. DEoptim employs a differential evolution algorithm (genetic algorithm) to develop different generations of parameter sets and shift them from the initial population towards a global optimum determined by the objective function defined by the user. Here, the following objective function (Fobj) is used:
where d is the index of agreement defined (Willmott, 1981) as
where N is the number of observations, Merr is the mean squared error, and Perr is the potential error. Ideally, both dyield (d between the observed and simulated yields) and dirr (d between the observed and simulated irrigation amounts) are 1. The index of agreement is used to describe the model prediction error in a standardized way between 0 and 1, where 0 means no agreement and 1 is a perfect model prediction (Willmott, 1981). We aim for the sum of both to be as close to 2 as possible, thereby minimizing the objective function and approaching an optimal model configuration. We set the algorithmic parameters NP (number of generations) to 100 and the maximum number of iterations to 110, resulting in 11 110 model runs. The parameter values of the initial population are set to the default SWAP values, and the search range for each parameter is again set to ±15 %. We determine TSUMEA and TSUMAM based on the observed sowing and harvest dates. Thereby, the total number of growing degree days, representing the sum of daily temperatures exceeding a 2 °C baseline during the growing seasons, is calculated using field-scale data. Note that, below 2 °C, there is no potato growth (Kroes et al., 2017). The growing season is defined as the period between the sowing and harvesting dates, resulting in an average of 2149 degree days over all the station years. TSUMEA and TSUMAM are then calibrated to the observed data, and TSUMOPT is left at its default value of 170 degree days and is subtracted from the total of 2149 degree days. From the resulting 1979 degree days, the parameter TSUMEA, which is determined during optimization, is subtracted, which in turn gives the value for TSUMAM for each parameter set.
3.4 Soil and crop management scenarios
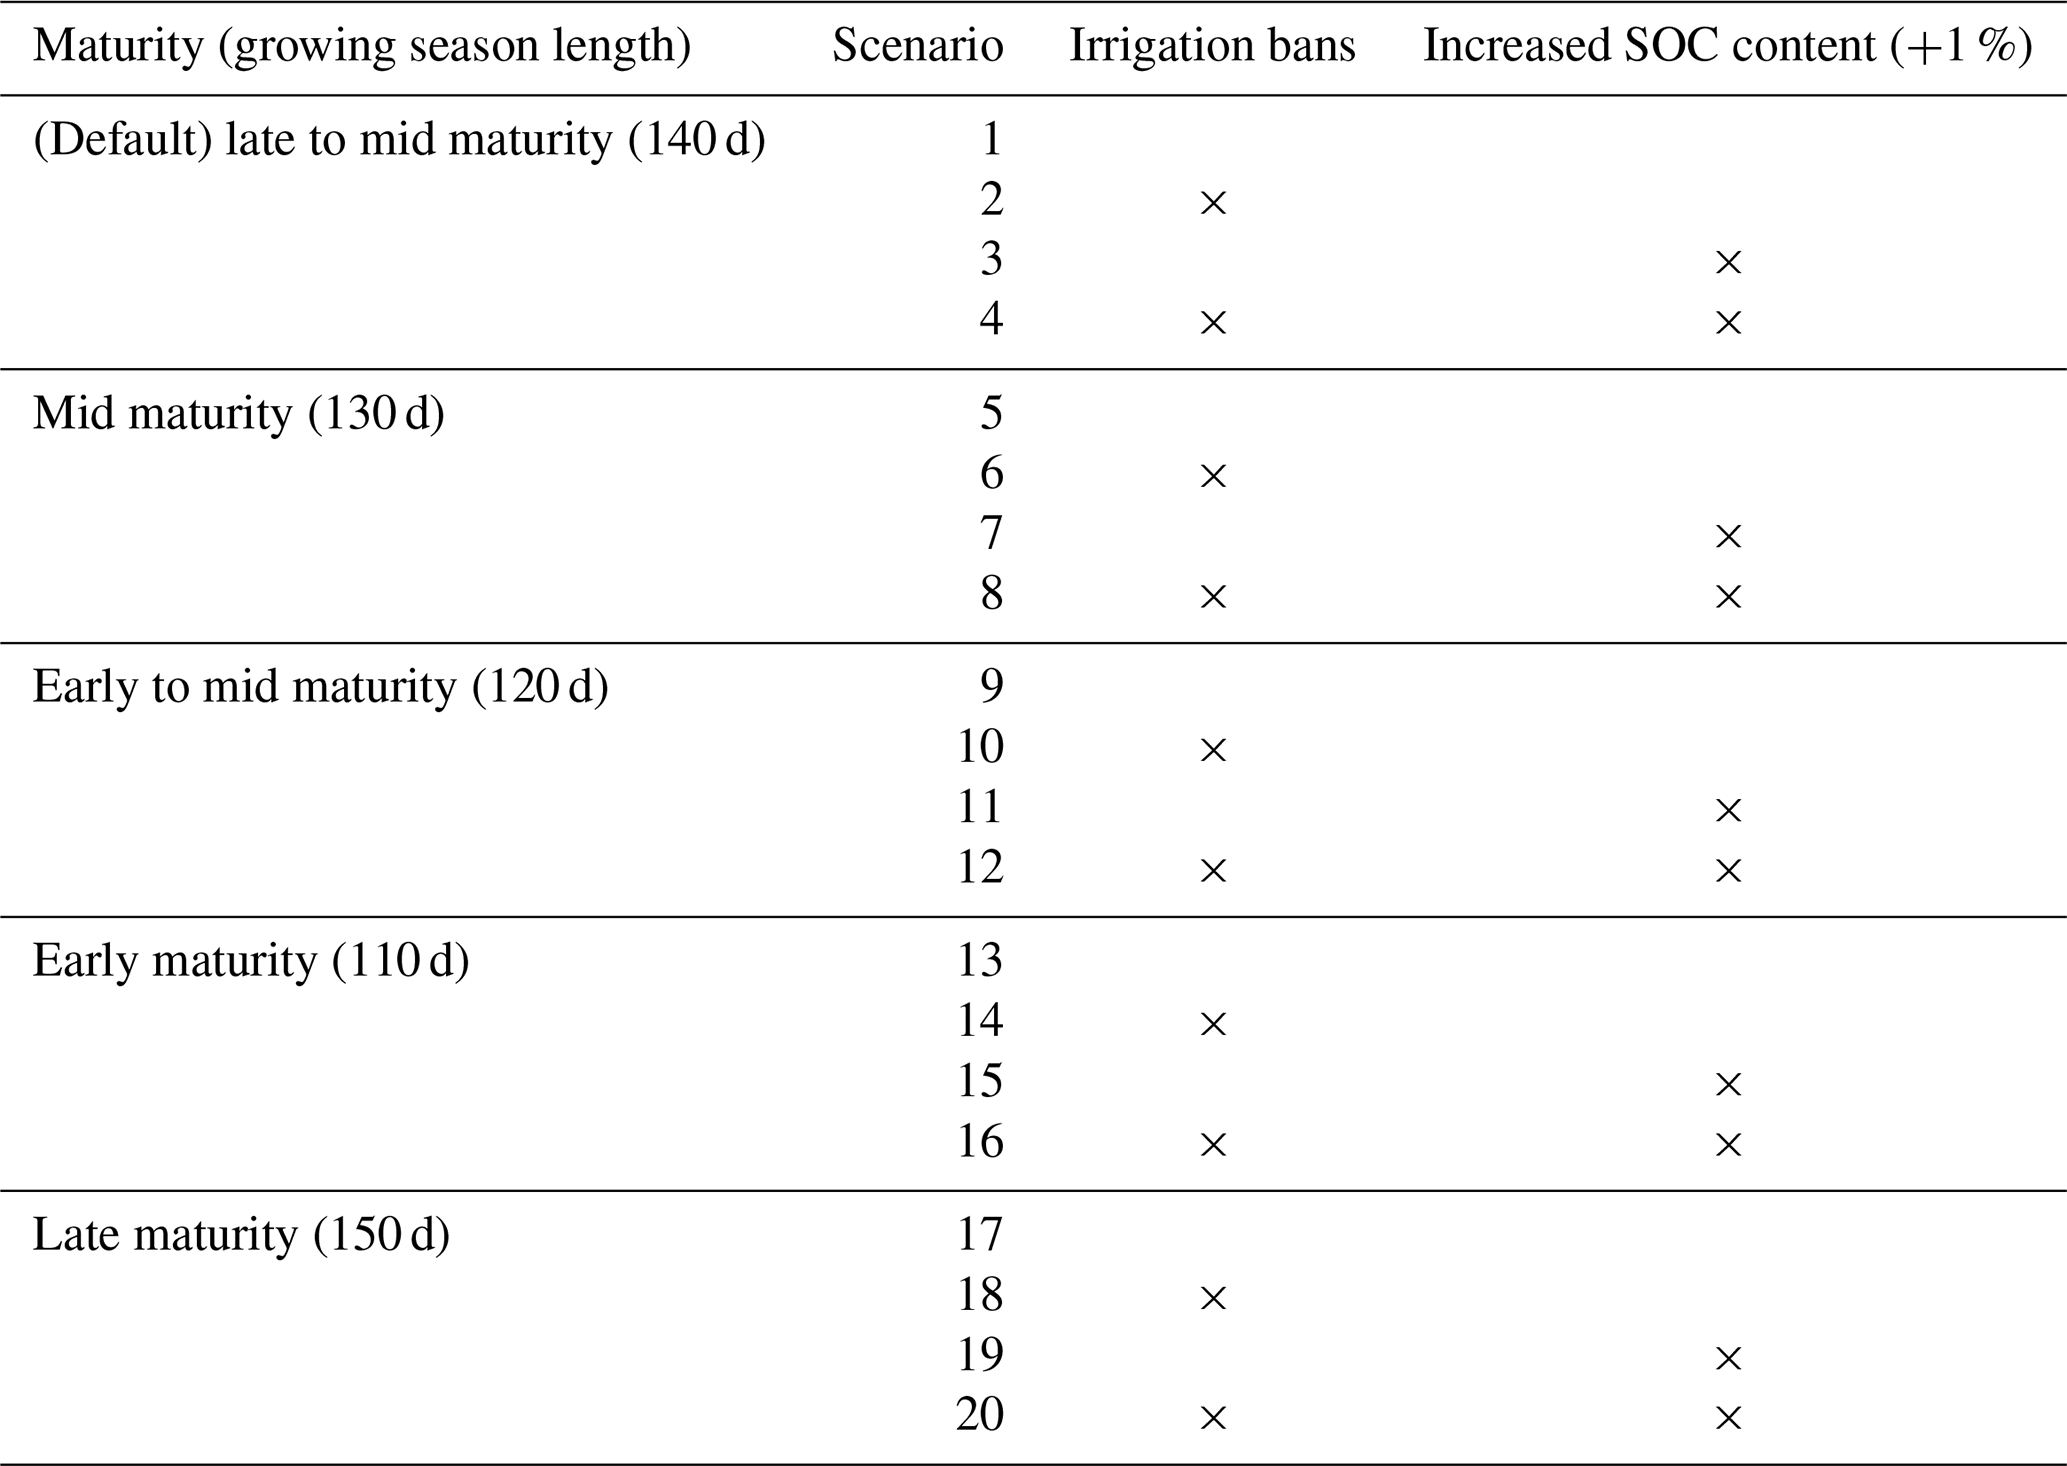
Two different management scenarios in irrigation demand (and, subsequently, yield) are evaluated with SWAP: an increase in soil organic carbon and the adoption of earlier-maturing varieties. We study the effects individually and combined as well as with and without considering irrigation bans, resulting in 20 management scenarios (Table 1). In line with Turek et al. (2023), we test a hypothetical scenario of soil carbon accumulation where we assume that continued cover cropping and organic amendments could lead to an increase in SOC of 1 % down to a depth of 60 cm. This scenario is thought to represent a maximum possible SOC accumulation given observed differences in SOC contents by depth depending on management (Diacono and Montemurro, 2010; Hirte et al., 2018; Wu, 2022; Skadell et al., 2023). The crop file calibrated and used in our study for baseline conditions represents the intermediate- and late-maturing varieties Innovator and Agria, which, on average, have a 140 d growing season in the Broye River catchment. In contrast, common Swiss earlier- to intermediate-maturing varieties like Fontane, Ivory Russet, Agata, Lady Christl, or Annabelle require as little as 90 d to reach maturity (Schwärzel et al., 2022). To simulate these earlier-maturing varieties, we adjust the phenology by recalculating the average growing-season degree days for shortened growing periods (130, 120, and 110 d) based on the observed temperature sums from all station years from the reference field-scale data (introduced in Sect. 3.1.3). To explore the effect of the growing season length further, we also include an even later-maturing variety with a growing season length of about 150 d.
Table 1Scenarios of management combinations applied to the representative subsample.
3.4.1 Representative subsample
We simulate the 20 scenarios (see Table 1) for a representative subsample of potato fields in the study area, based on the management options described above. In this way, we can preselect the most promising scenarios for the regional application (which are computationally demanding). We randomly sample 50 cells (a field is composed of several cells) and apply each scenario for the period from 2019 to 2022, focusing on the results from 2022. The most promising scenarios for the regional analysis are then selected based on several criteria: irrigation water productivity (IWP), irrigation demand reduction, yield loss level, and transpiration gain. IWP is computed as the total crop yield per cell (in decitons, dt) divided by the total irrigation water amount (m3). The transpiration gain gives a measure of drought stress where a high transpiration gain means a lower drought-stress-induced transpiration reduction relative to the reference scenario (scenario 1 of Table 1). We consider a scenario to be relevant for regional analysis if it yields a high IWP and transpiration gain and decreases irrigation demands without significantly compromising the yield.
3.4.2 Regional application
After selecting the most relevant management scenarios from the representative subsample (Sect. 3.4.1), we apply the model in these scenarios to the entire study area (model perimeter = 10 129 grid cells, Fig. 1) for the period 2019–2022. The warmup period is set to 3 years (required for state variable initialization; this data portion is discarded before analyzing the results). SWAP runs for each grid cell using the corresponding meteorological and soil data. The resulting outcomes (irrigation demand, L m−2; yield, kg ha−1) are summed over the irrigated fraction of each cell (see Sect. 3.2.1). The total computation time to run the model for 4 years and the entire study area on a PC with 16 GB of RAM is 17 h. To assess whether and how the spatial variability of climate and soil properties may explain spatial patterns in yield and irrigation water variability, we conduct a principal component analysis (function PCA from package FactoMineR, Husson et al., 2017, with the predictor variables scaled to the unit variance before analysis).
3.4.3 Optimal spatial configuration of the management options
The management scenarios shown in Table 1 are homogeneously applied to all grid cells of the model perimeter. Based on which of these scenarios yielded the highest IWP for each cell, this scenario is retained as the best management choice for that cell. We then run the model for each grid cell using this management to evaluate the impact of locally adapted management choices on regional irrigation demand and yield. This model run is referred to as the “best scenario”. To assess under which pedoclimatic conditions which management applications are most efficient, we conduct another PCA.
4.1 Model calibration and validation
The GSA revealed eight parameters that, in addition to the temperature sums (TSUMEA and TSUMAM), exhibit significant sensitivity to the yield and irrigation amount (default values are shown in Table 2, and the full GSA results are in Fig. S1 in the Supplement). This sub-selection of 8 out of the 29 crop parameters tested in the GSA is unsurprising, as they are closely related to either crop yield or drought stress. SLATB represents the specific leaf area (which influences light interception), and AMAXTB represents the maximum CO2 assimilation rate, depending on the DVS. Both light interception and CO2 assimilation are major drivers of crop growth and, thus, yield. As a function of crop water dynamics, the maximum rooting depth (RDC) of the crop plays an important role in the required irrigation water demand. ALPHACRIT and ADCRL are parameters of the Feddes–Jarvis function of root water uptake reduction (Feddes et al., 1978). ADCRL denotes the pressure head above which root water uptake will be reduced due to drought at low atmospheric demand. Low atmospheric demand is defined here by lower temperatures and evaporation. ALPHACRIT is a critical stress index that indicates the transpiration rate at which the plant can compensate for the water uptake reduction due to drought stress. It is assumed that the plant can compensate for low root water uptake from drier parts of the soil with (still) wetter parts in the soil (Jarvis, 2011).
Table 2Default and optimized crop parameter values. Some parameters change dynamically with the development stage (DVS) of the crop, while others are static (–).
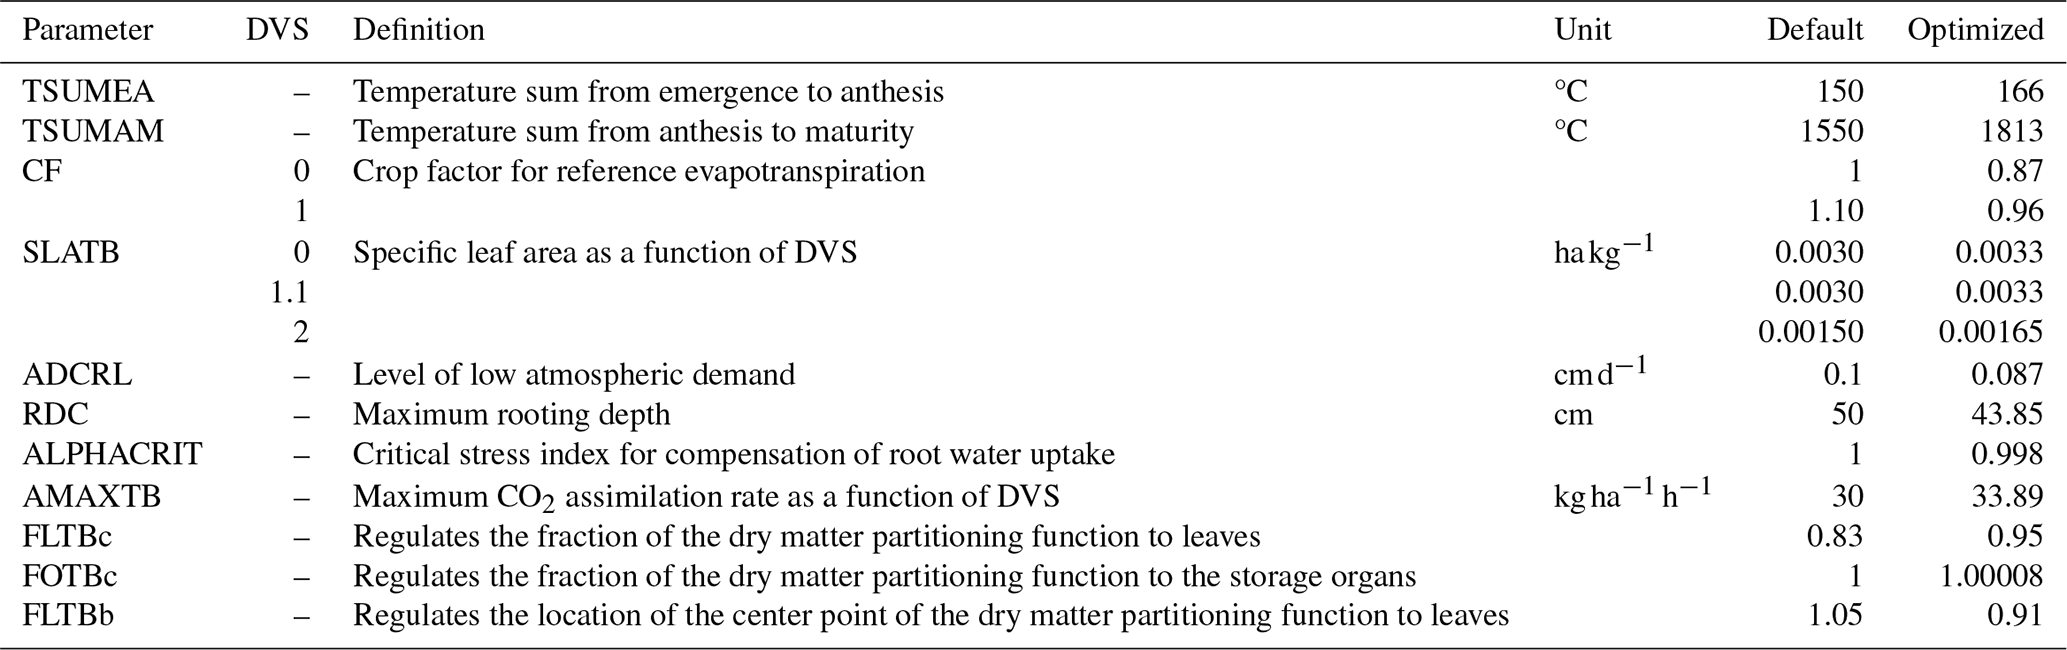
The remaining sensitive parameters, i.e., FLTBb, FLTBc, and FOTBc, relate to the partitioning of the generated biomass to different plant organs, which also strongly influences yield. The corresponding partitioning into the storage organs (FOTB), leaves (FLTB), and stems (FSTB) is given in Table S2. If a value is 0, no biomass is partitioned to this storage organ at this DVS.
The optimization of relevant model parameters identified in the GSA enabled an improved fit of the simulated data to the observed data (Fig. 5). The fit of the simulated and observed field-scale irrigation amounts increases from d=0.54 to d=0.84 (for optimized parameters) and the fit of the simulated and observed potato yields from r=0.58 to r=0.71 (optimized parameters) for the field-scale simulation of irrigation amounts. The fits to the regionally averaged reference data on yields increased from d=0.42 to d=0.67 and from r=0.46 to r=0.61. The fits also improved when the model was validated with reference data from outside the study area, indicating transferability to other regions and no overfitting of parameters (Fig. 5).
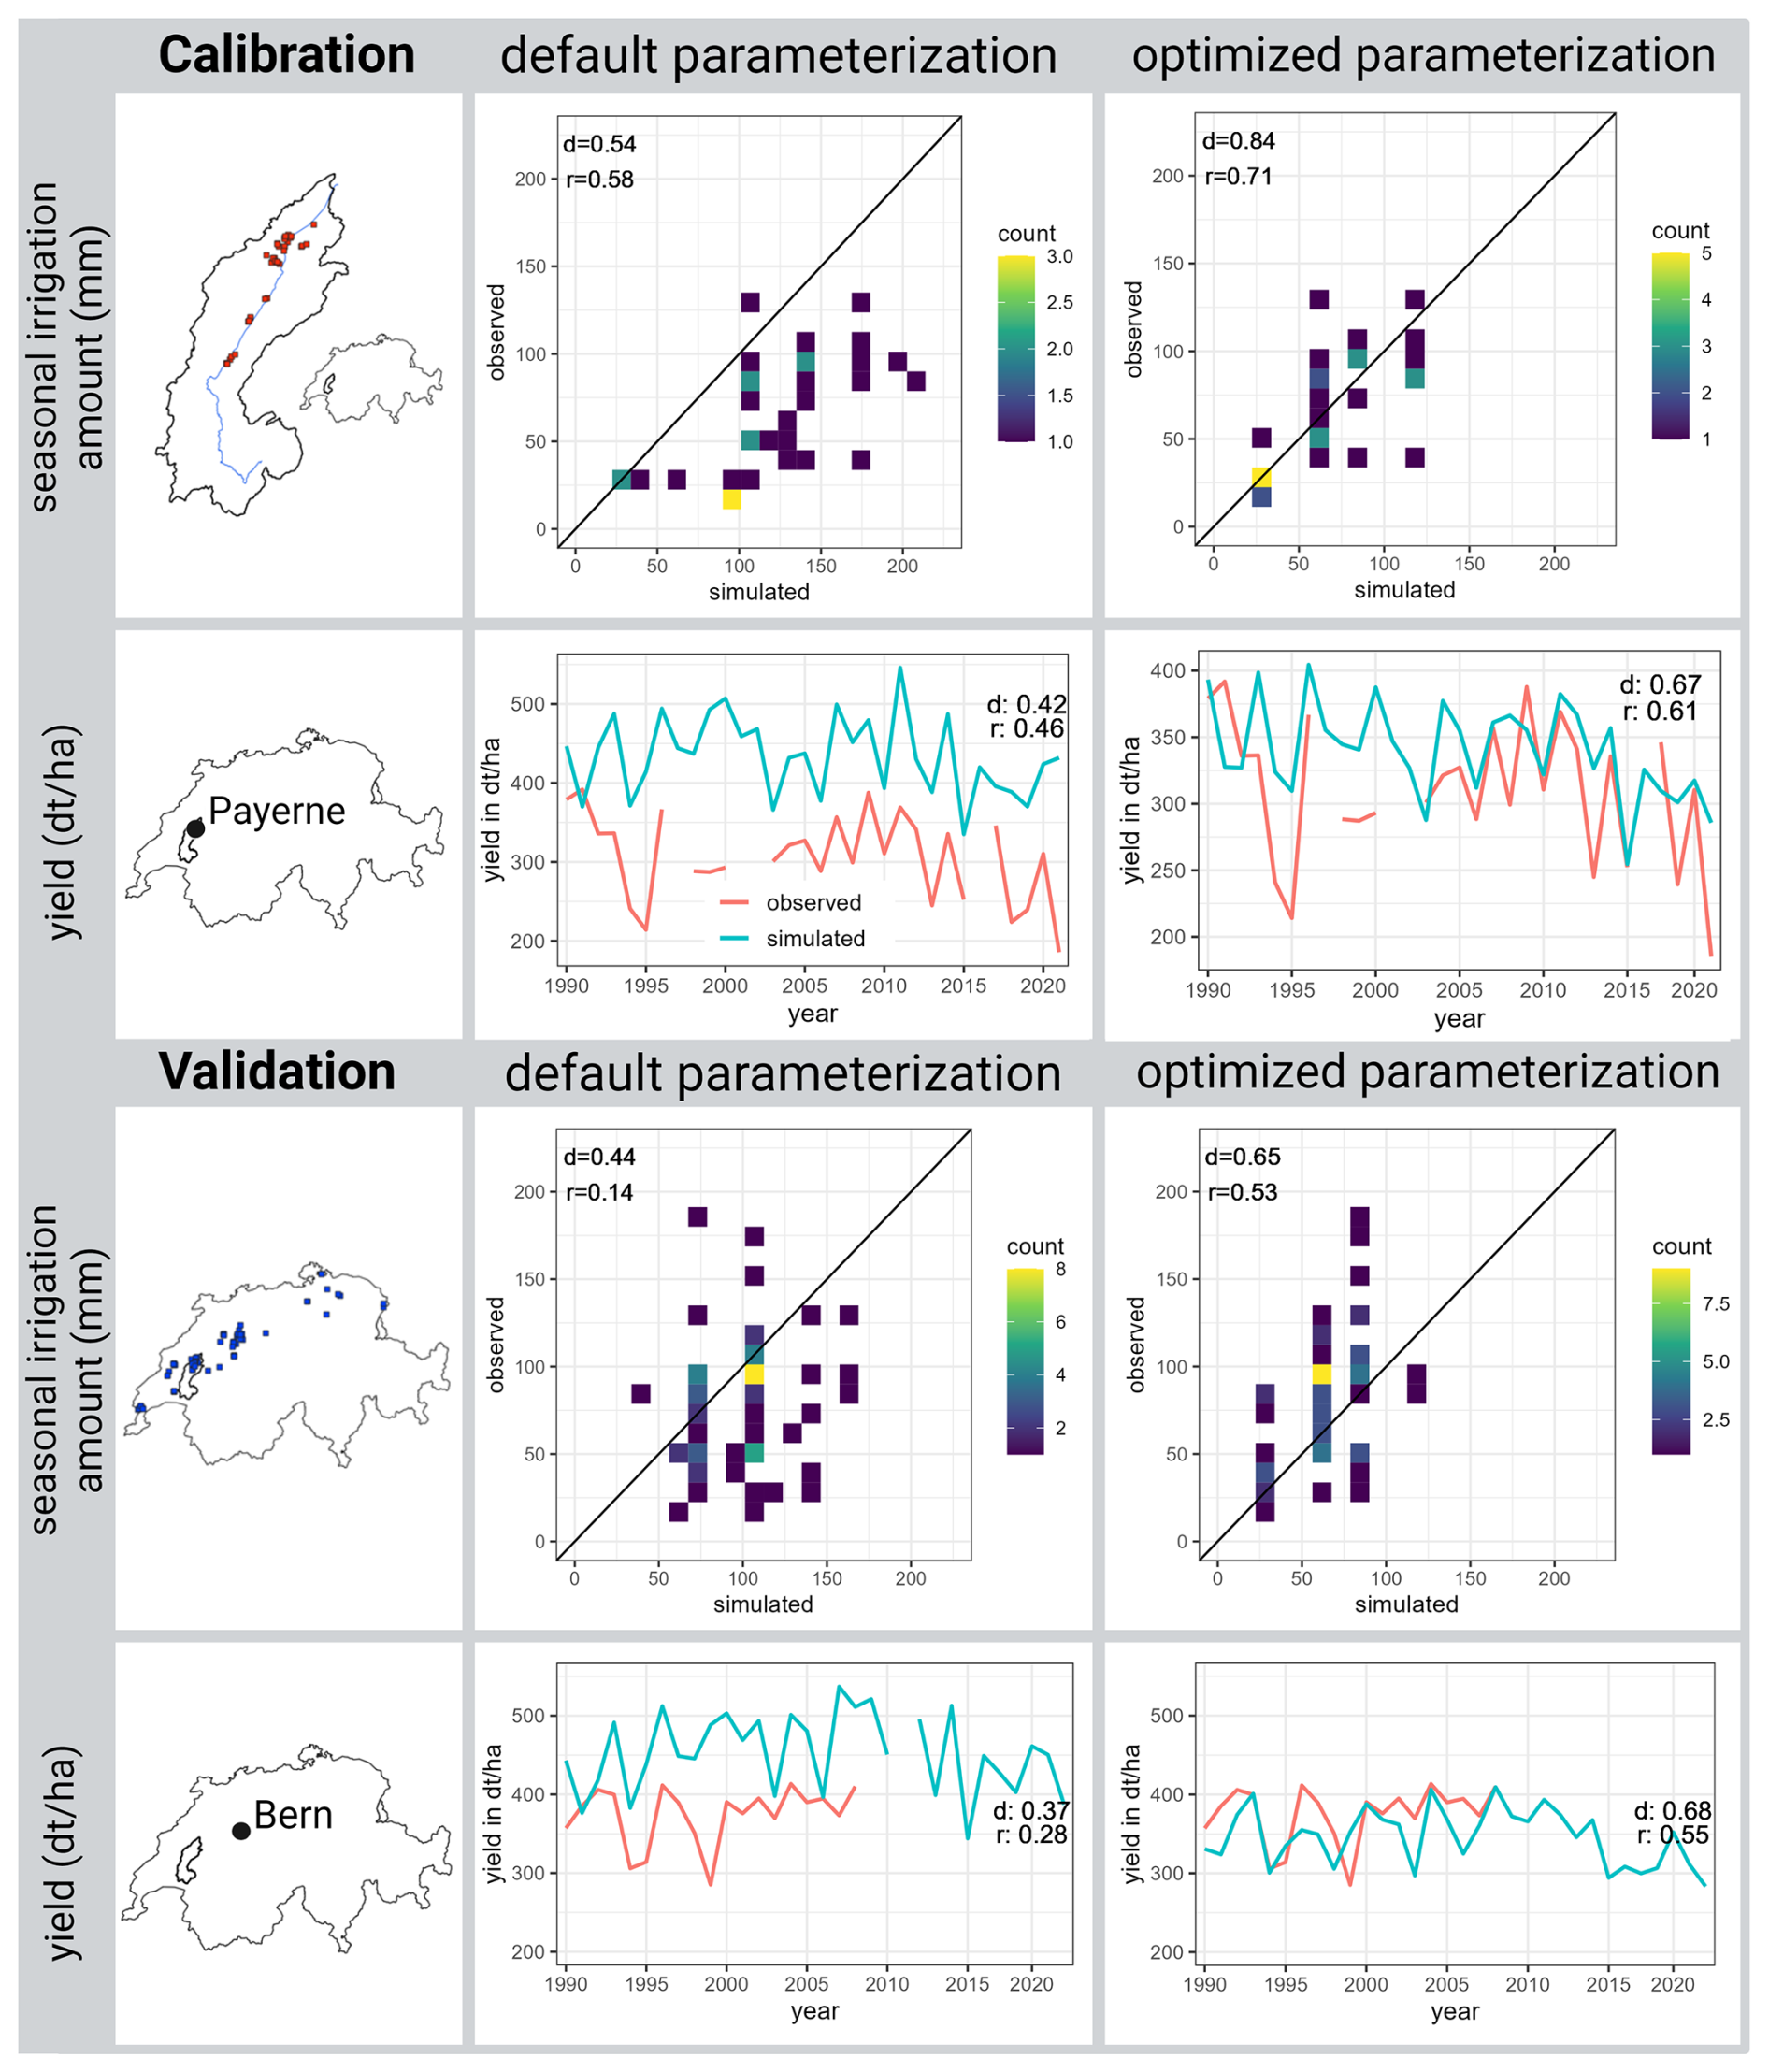
Figure 5Calibration: comparison of simulated and observed field-scale seasonal irrigation amounts (33 station years) with regional-scale yield data (15 km around Payerne), showcasing the default and optimized parameter values. Validation: extension of the comparison to 61 station years across Switzerland for seasonal irrigation amounts. Regional-scale yield data (15 km around Bern) are evaluated with default and optimized parameters.
4.2 Impacts of drought and supply deficit on crop productivity
For the year 2022, the overall regional irrigation demand was simulated to be 697 389 m3. The amount of water actually supplied (considering the temporary irrigation bans) was simulated to be 285 836 m3. This means that only 41 % of the demand could be satisfied, i.e., an irrigation deficit of 59 %. In terms of quantity, this translates into a yield deficit of about 16.4 %. To explain what drives the spatial variability in mean seasonal irrigation demands (Fig. 6), we conducted a PCA (the full results can be seen in Appendix Fig. A1). As expected, higher seasonal irrigation amounts are associated with higher sand contents and higher bulk density. In contrast, lower irrigation amounts are associated with higher silt and clay contents, higher SOC contents, and higher residual and saturated water contents of the soil. These results, therefore, verify the plausibility of the spatial variability we observe. The spatial heterogeneity of soil properties leads to significant differences in the amount of irrigation within agricultural fields (Fig. 6). Consequently, the most efficient management scenario also varies within the agricultural fields.
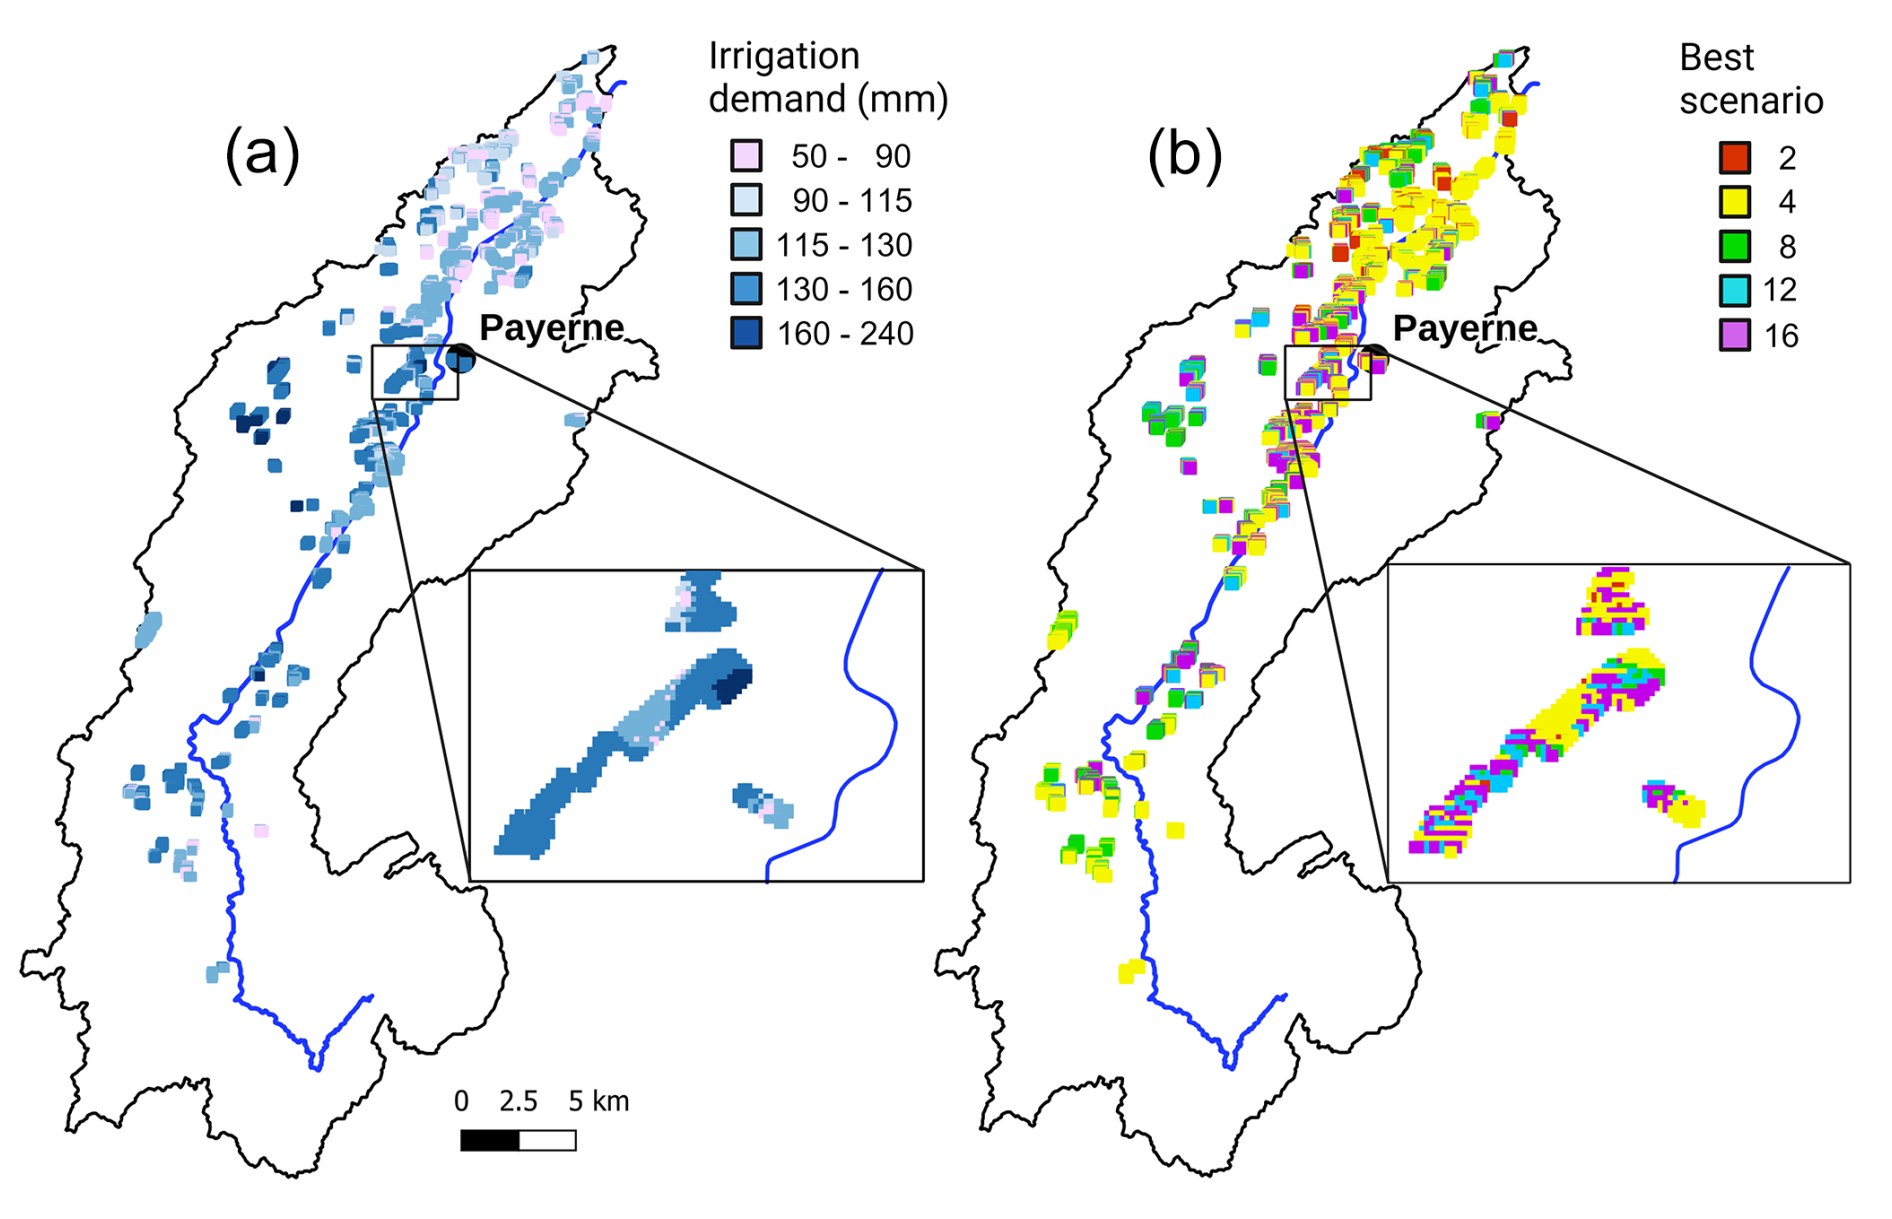
Figure 6(a) Seasonal irrigation demand per cell in 2022 without considering irrigation bans or management (reference scenario 1). (b) Best management scenario per cell considering the highest irrigation water productivity.
4.3 Adaptation scenarios
4.3.1 Preselection of scenarios
Based on the full results of the scenario analysis for the set of 50 randomly sampled cells (see Table S3), we identified scenarios 4 (default late to mid maturity, irrigation bans, and increased SOC), 8 (mid maturity, irrigation bans, and increased SOC), 12 (early to mid maturity, irrigation bans, and increased SOC), and 16 (early maturity, irrigation bans, and increased SOC) as the most promising ones. We are mainly interested in how the management choice impacts agricultural productivity when considering irrigation bans. Therefore, we excluded scenarios with a low IWP, low transpiration gain, and overly high reduction in yield or overly low reduction in irrigation demand (drought-induced transpiration loss is used as an indicator of drought stress in SWAP; its reduction compared to the reference scenario is therefore defined as transpiration gain). Since a change in agricultural practice should not lead to a higher water demand (i.e., a reinforcement of water use conflicts), we had to exclude the scenarios with the late-maturing variety (scenarios 17–20). We also excluded the scenarios that only considered earlier-maturing varieties (scenarios 6, 10, and 14) because these scenarios result in notable yield losses. The scenarios that most reduce the irrigation demand are those with earlier-maturing varieties (16, 12, and 8). In these scenarios, the yield reduction can partially be compensated for by the SOC increase. Although scenario 16 still leads to a relatively high yield reduction, the high transpiration gain indicates low drought stress. We decided to consider scenario 4 as it retains a high IWP through a substantial increase in yield, even though irrigation demand could not be decreased in this subsample.
4.3.2 Regional irrigation demand and deficits in selected management scenarios
Figure 7 shows the results for the simulation of all irrigated potato fields in the Broye River catchment in 2022 for the promising scenarios selected in Sect. 4.3.1. The results for each scenario are compared to the reference scenarios. Our simulations identified scenario 4 (default late to mid maturity and increased SOC) as having the highest total yield. Conversely, scenario 8 (mid maturity and increased SOC) exhibited the greatest amount of “realized” total irrigation (the fulfilled demand during water restrictions). Additionally, scenario 4 displayed the highest level of drought-induced transpiration reduction, indicating the most severe drought stress, while the best scenario resulted in the least severe drought stress.
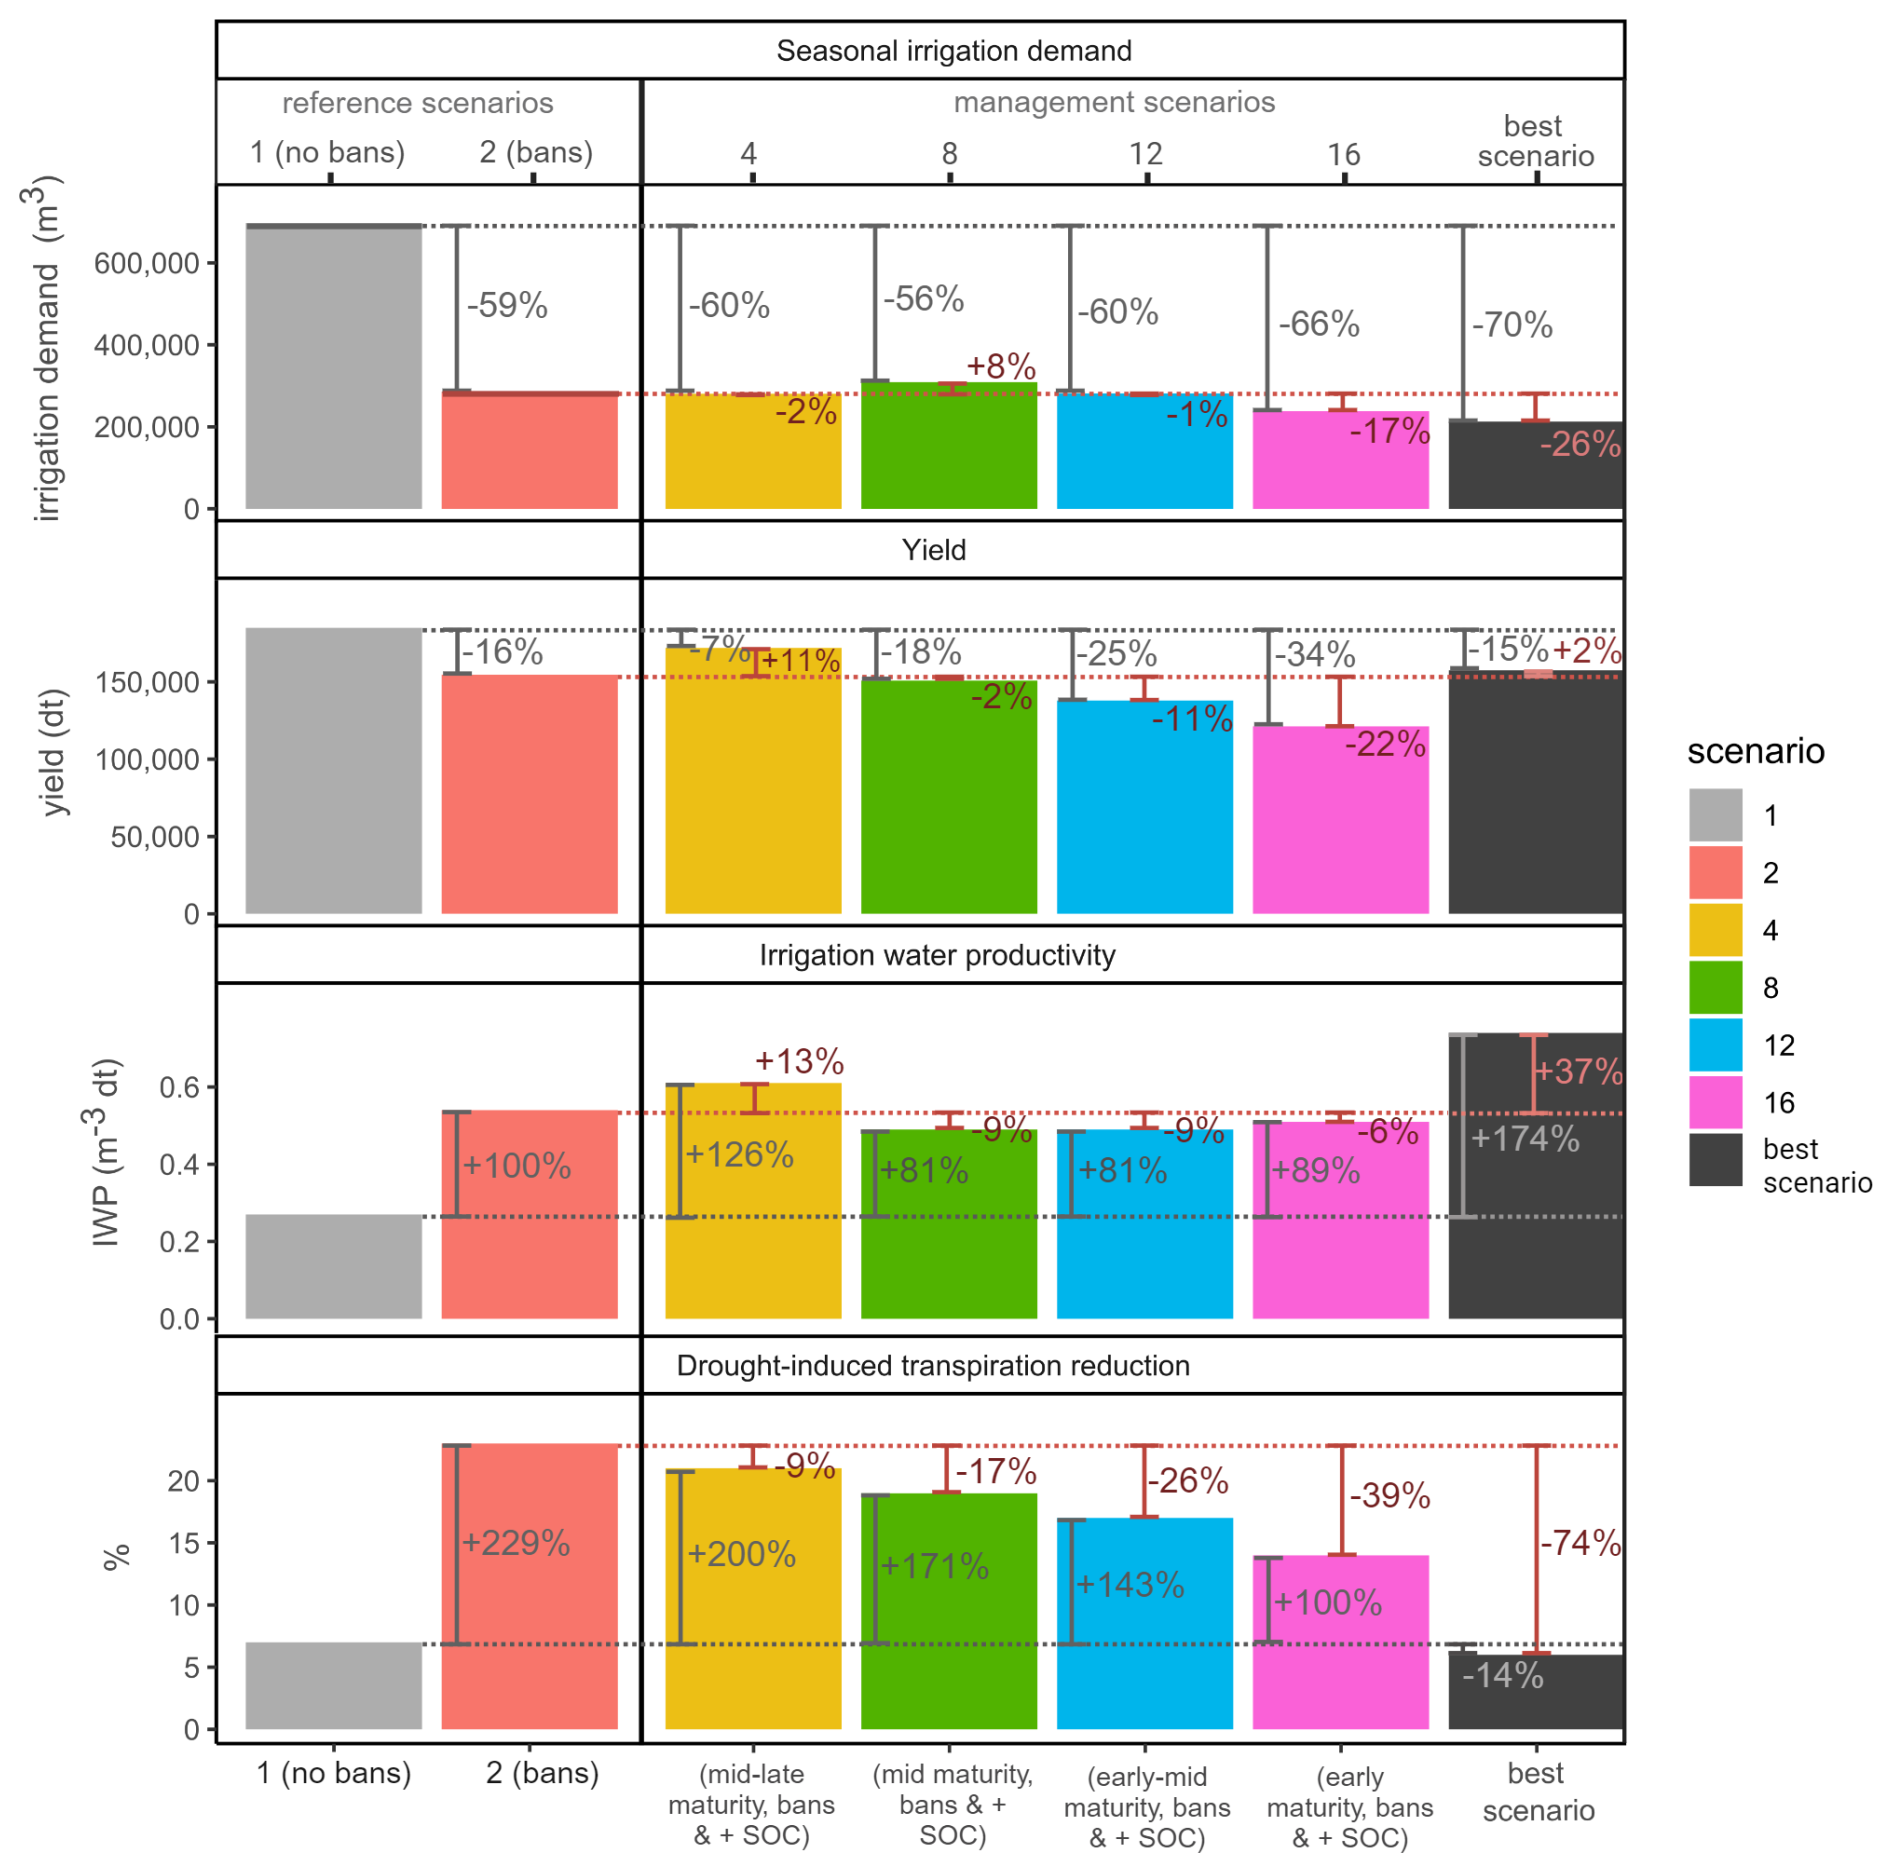
Figure 7Results for the simulations applied to all 10 129 cells in the reference and selected management scenarios as well as the “best scenario”, comprising the results for adjusted management to maximize IWP as explained further in Sect. 4.4.
It can be observed that the regional results did not completely mirror the results of the subsample described in Sect. 4.3.1: on the subsample level, the scenario with the highest irrigation amount was scenario 4, and on the regional level, scenario 8 shows the highest total irrigation amount but not the highest yield, which is lower than in scenario 4. Accordingly, the IWP of scenario 8 is lowest within this group of scenarios. The highest yield is obtained with scenario 4, which has a similar total irrigation amount to scenario 12 (early to mid maturity and increased SOC) but the highest IWP. The highest drought-induced transpiration reduction (higher drought stress) is also obtained for scenario 4. The lowest transpiration reduction (i.e., the lowest stress level) is obtained for scenario 16, which features the earliest-maturing variety. In terms of compensating yield loss, scenario 4 appears to be the best option on the regional scale, with a slight decrease in irrigation demand (in the case of irrigation bans) and a considerable increase in yield.
4.4 Site-specific management impact on regional irrigation demand
In Fig. 7, we show the results for the scenarios where we homogeneously applied the same management to the whole study area. The best-scenario column showcases the simulation results where, for each individual grid cell, the scenario with the highest IWP was chosen and applied. In this best-scenario case, irrigation water demand relative to the reference scenario (2) is decreased by 26 % and yield is increased by 2 %. The IWP is highest in all the scenarios. When not considering irrigation bans, irrigation demand still decreases by 9 % and yield increases by 2 % (see Table S4).
From the second PCA we conducted to identify the relation between the most efficient management and pedocliamtic conditions (Fig. 8), we can identify a general trend, although the groups cannot be clearly separated. As expected from the results in Fig. 7, scenario 4 had the highest IWP in most of the locations and, therefore, also dominated this visual representation. Most cells where scenario 4 had the highest IWP were associated with low irrigation levels and a high clay and silt content (i.e., favorable edaphic conditions, especially on the right side of the y axis). In exchange, in the cells with high irrigation amounts and a high sand content, the scenarios with earlier-maturing varieties were more prominent than the other scenarios. This indicates that an increase in SOC alone (scenario 4) is sufficient to promote high IWP values for cells with favorable edaphic conditions (high clay and silt content). For cells with unfavorable edaphic conditions (low silt and clay content, high conductivity, or high bulk density), a SOC increase is often insufficient to promote high IWP values; these locations would instead additionally require earlier-maturing varieties for more efficient water use.
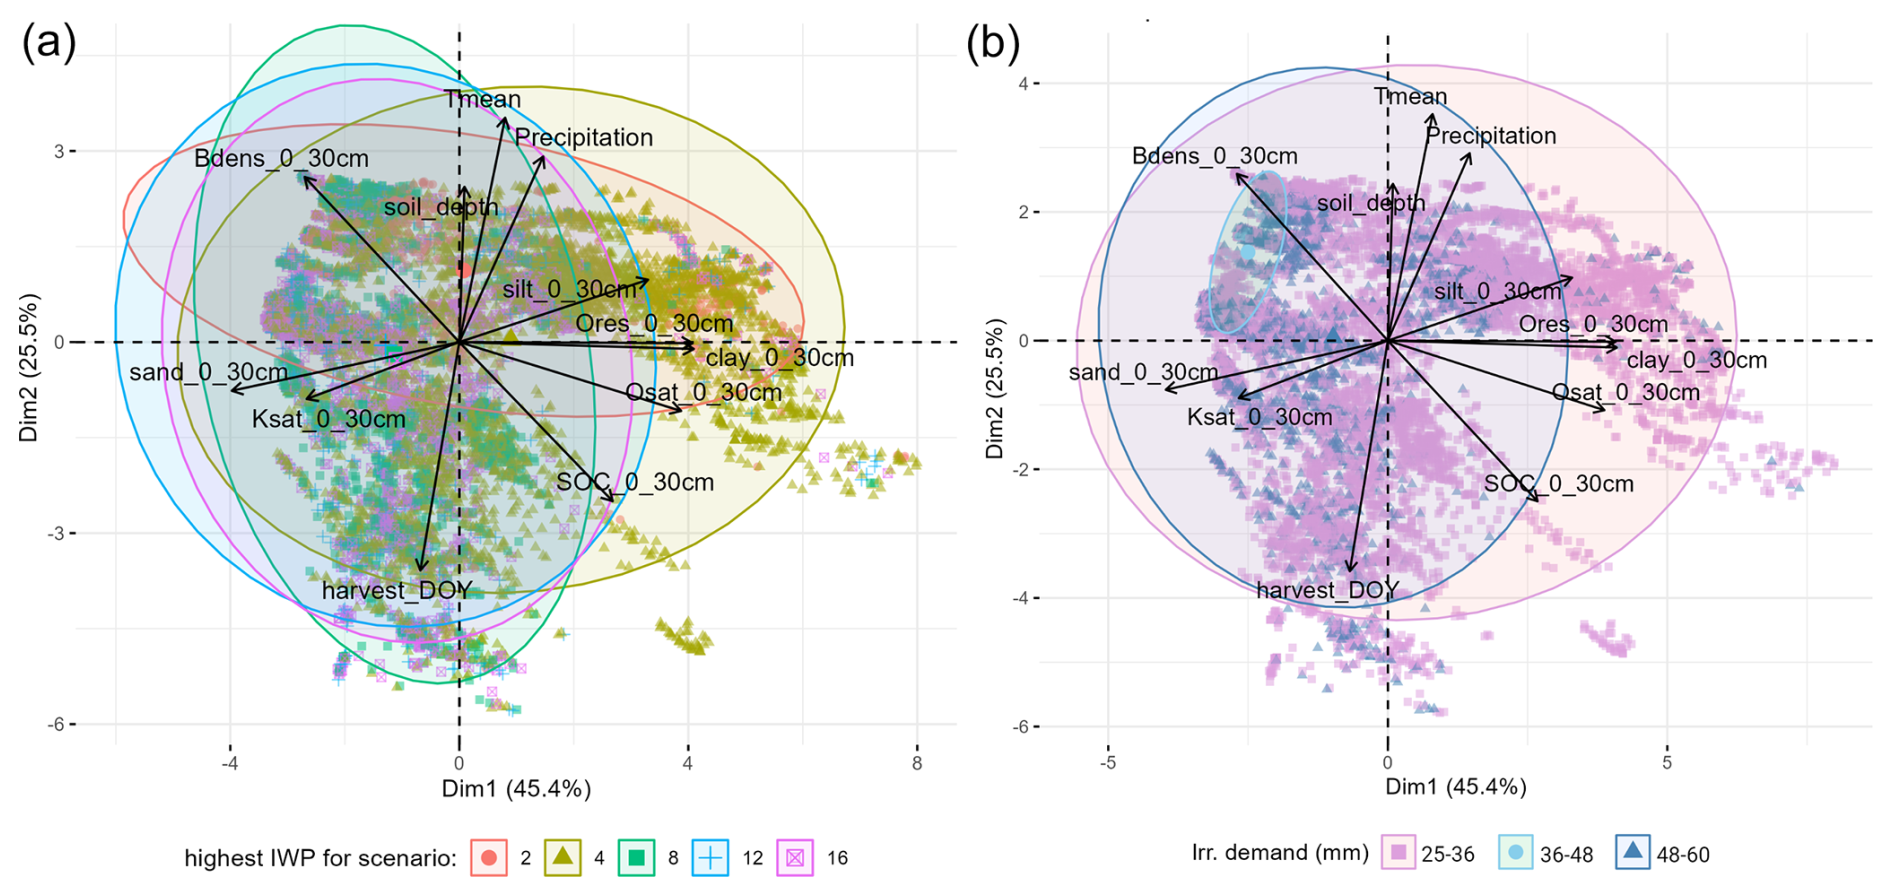
Figure 8(a) Biplot showing the observations and predictor variables within the dimensions of the first two principal components. Observations show the seasonal irrigation amount for 2022 without considering irrigation bans or management. The color coding corresponds to the best management scenario per cell based on IWP (only the ones considering irrigation bans, i.e., 2, 4, 8, 12, and 16). (b) Same biplot, but the color coding shows the seasonal irrigation water amount simulated in the associated best management scenario. The predictor variables are explained further in Appendix Fig. A1.
5.1 Potentials and limitations of the approach
The modeling approach employed in this study provided plausible estimates of yield deficits that could be attributed to irrigation water resource limitations during a recent drought year. The results of this case-based evaluation have high value for communication (Sprain and Timpson, 2012) to the broader public and regional stakeholders as it connects closely to personal experiences.
Estimating the regional irrigation demand requires detailed input and reference data, which might often not be available. In this study, the extent and location of the potentially irrigated fields especially are a rough estimation and include some uncertainty. However, where observations or estimates of irrigated areas are available, our approach could be used to fill important knowledge gaps on regional irrigation water demand. When coupled with climate projection data, estimates of future irrigation demand could inform the planning of irrigation infrastructure. Other options for climate adaptation, such as mulching, cover cropping, or reduced soil tillage, should also be taken into account.
The model was applied to a grid with 30 m resolution, which revealed considerable heterogeneity in irrigation demands across agricultural fields (see Fig. 6). However, the framework could also be applied at larger scales, such as the actual field scale, to reduce computational costs. This may be particularly relevant in larger catchments or where there is a higher proportion of irrigated cropland.
The retained model is a state-of-the-art crop growth model that accounts for the dominant processes. It should be noted that quantified yields, irrigation amounts, and water deficits are subject to uncertainties due to model inputs, model parameters, and model structures. Some uncertainty arises from the use of a pedotransfer function (PTF) derived from point measurements for larger-scale applications. This scaling issue is described in Weber et al. (2024), who also pointed out that the transferability is highly dependent on the quality of the input data and the use of other environmental predictors. Due to the lack of sufficient observed soil moisture data, we were not able to validate the estimated soil hydraulic properties from the PTF. However, we still have confidence in the approach as the underlying soil map was derived by using a thoroughly trained and validated model and a large sample size (Swiss Competence Centre for Soil (KOBO), 2023). Also, the particular PTF we used in this study was used and validated by Turek et al. (2023) on a typical Swiss agricultural soil. Future work could investigate in detail how the different uncertainty sources impact the overall model output, e.g., by simulating parameter ensembles rather than single best parameter sets.
5.2 Impact of irrigation bans on agricultural productivity in the case study
We simulated the regional irrigation demand for potatoes within the Broye River catchment in 2022 with and without consideration of the temporal bans on water withdrawal for irrigation in different scenarios. The model results show a significant deficit in the irrigation water supply of 59 % and a subsequent yield deficit of 16.4 % for reference scenario 1 (without any management adaptation).
To put the yield reduction into perspective, we can refer to observed yields of potato in Switzerland for the year 2022, which were reduced by 11 % relative to 2017–2021 and by 22 % relative to the high-yield year of 2020 (Federal Office for Agriculture (FOAG), 2023a). This decline is thought to be due to extreme drought and heat, leading to quality degradation that could not be avoided due to local bans on irrigation (Federal Office for Agriculture (FOAG), 2023a).
Regional estimations of irrigation demand are generally challenging to validate, primarily due to a lack of data on demand, estimates of deficits in irrigation water supply, and the resulting deficits in harvest. In places such as Switzerland, where water scarcity has rarely been an issue in the past, these data are even more rare. As droughts are projected to increase in magnitude and frequency in Switzerland (CH2018, 2018), the associated upcoming information demand must be addressed. Datasets that cover information on how much water would theoretically be needed and how much water is likely to be lacking in a drought year are essential tools for supporting the implementation of water retention or harvesting measures. The year 2022 was the second-warmest year in the study region since the weather station in Payerne started operating in 1964, only beaten by the year 2023 (MeteoSwiss, 2024). The high levels of irrigation deficit and yield reduction simulated for 2022 are expected to be a reoccurring phenomenon.
Since our simulations only account for quantity, we cannot estimate the marketable yield share from the total harvested yield. However, a further reduction in marketable produce is expected, since drought and heat stress reduce transpiration, leading to stomatal closure and decreased photosynthesis and impacting yield formation (Obidiegwu et al., 2015). Potatoes with shallow root systems are highly vulnerable to drought, particularly when combined with soil compaction, which leads to fewer tubers (Nasir and Toth, 2022). Drought stress can also cause physiological defects like small (<3 cm), deformed, or immature tubers, making them unmarketable (Obidiegwu et al., 2015; Rykaczewska, 2017).
5.3 Potential of soil and crop management adaptations
Increasing SOC can significantly reduce yield losses under an irrigation ban. The positive effect of higher SOC on water retention is well documented (Diacono and Montemurro, 2010; Eden et al., 2017), as is the improvement in crop yield we observed (Porter et al., 1999). However, without additional management measures, the reduction in irrigation demand is limited, and drought stress may even increase. When irrigation water is unrestricted, increased SOC and the resulting amplified plant growth could raise water demand. These findings align with those of Porter et al. (1999), who observed that, while SOC alone did not compensate for the absence of irrigation, it did improve potato yields.
Contrary to our expectations, combining increased SOC with earlier-maturing varieties resulted in only a slight reduction (scenario 12) or even an increase (scenario 8) in regional irrigation demand. One reason may be that earlier-maturing varieties have higher transpiration rates early on, which increases root water uptake. If this demand is not met by precipitation, the irrigation demand rises. Given the small window for irrigation in 2022 due to the irrigation bans, if this period coincides with peak transpiration, the earlier varieties may require more water than the later varieties. Additionally, the early varieties develop shallower root systems, making them more dependent on irrigation during critical growth stages. As the earlier-maturing varieties have less time to develop tubers, their IWP is also relatively low. The ability of different varieties to escape or combat drought impacts relies a lot on the timing, magnitude, and duration of the drought. This was also observed by Chang et al. (2018), who analyzed the drought impacts on canopy development and tuber growth across the different potato maturity classes.
We analyzed the conditions leading to higher irrigation demands and those promoting the highest IWP. As expected, soil texture plays a key role in water retention and plant water availability, directly influencing the extent of the irrigation requirements. Soils with higher sand content or bulk density showed greater irrigation demand, while soils with more clay and silt required less. Increased precipitation during the growing season lowers irrigation needs, while higher temperatures shorten the growing season due to their accelerating effect on phenology, thereby reducing the overall demand. The spatial variation in irrigation demand across the study region highlights the importance of site-specific crop and soil management. In areas with favorable pedoclimatic conditions, increased SOC (scenario 4) led to the highest IWP, while the earlier-maturing varieties combined with more SOC improved the IWP in less favorable locations. These findings align with Ahmadi et al. (2010), who concluded that soil texture plays a significant role in choosing the best irrigation practice for maximizing water productivity.
The scenario with site-specific crop and soil management (the best scenario in Fig. 7) resulted in the greatest irrigation water efficiency and a significant reduction in irrigation water demand while even slightly increasing yield (compared to no management adaptations in scenario 2). This approach is particularly valuable from the perspective of sustainable use of resources, as the overall reduction in yield loss due to the irrigation bans is only marginal. We observed a high IWP and significantly reduced drought-induced transpiration reductions. This indicates that the crop was less stressed and, therefore, less affected in terms of quantity (as seen in an increase in yield) but likely also quality. This effect persisted even without water restrictions, suggesting that optimizing management can mitigate drought impacts and improve both yield quantity and quality.
5.4 Practical limitations on managing SOC stocks
Our assumption of an increase in SOC of +1 % down to a depth of 60 cm was supported by experimental studies which had shown that such differences could be achieved through particular types of crop and soil management, such as cover cropping, continued applications of compost and other organic amendments, or reduced tillage (Wezel et al., 2014; Diacono and Montemurro, 2010; Eden et al., 2017; Holland, 2004; Hirte et al., 2018; Hou et al., 2012; Skadell et al., 2023; Krauss et al., 2022; Bolinder et al., 2020; Gross and Glaser, 2021). For example, Diacono and Montemurro (2010) reviewed long-term experiments on organic amendments and found that continuous applications may lead to an increase in soil organic carbon of up to 90 %. In a comprehensive meta-analysis, Gross and Glaser (2021) found an average increase of 35 % in SOC stocks following organic amendments. Depending on the initial SOC content, this increase would result in an additional +0.25 % (initial SOC = 0.5 %) to +1.13 (initial SOC = 2.5 %). The highest relative increases (48 %) were found in soils with <1 % initial SOC content and higher clay content. The SOC levels in our study region are 1 %–2 %; most soils can be classified as loam, clay loam, or sandy loam, so we expect the potential increases to be closer to the average of 35 %. Porter et al. (1999) reported an increase in organic matter of +1.2 % that roughly corresponds to an increase in SOC of +0.7 %.
In conclusion, the static increase of +1 % in SOC can be achieved in principle. However, it remains to be investigated in future studies which types of management adaptations could lead to the SOC increase assumed in this study and whether this would be economically viable (given the regional pedoclimatic conditions in the case study region). The level of SOC increase applied here requires significant sources of organic material, such as compost or manure, which may not always be available due to the management system (low livestock production) or conflicts of use (e.g., biogas production). Efforts to increase the supply of organic matter would require long-term and systemic adaptations, as SOC stocks are expected to decrease due to accelerated decomposition with continuously increasing temperatures (Wiesmeier et al., 2016).
Irrespective of these considerations, our study emphasizes the critical role of SOC in drought resilience, particularly as droughts are projected to intensify with climate change. Maintaining and enhancing SOC through soil management not only benefits moisture retention but also offers the co-benefit of carbon sequestration, with significant potential in Switzerland (Keel et al., 2023).
This study presents a comprehensive evaluation of climate adaptation options in soil and crop management to mitigate yield losses and increase irrigation water productivity during periods of water scarcity in a recent drought year. Our focus is on the Broye River catchment in Switzerland, which is representative of similar mid-sized lowland catchments in central Europe. Therefore, we can provide valuable insights into the challenges faced by regions experiencing reduced low flows and subsequent limitations in irrigation water supply from surface waters.
Our analysis indicates that irrigation bans and the summer drought in 2022 significantly reduced potato yields by 16 %, which is attributed to a 59 % deficit in irrigation water. Hypothetical adaptation scenarios suggest that adding 1 % of soil organic carbon down to a depth of 60 cm could reduce the drought and irrigation-ban-induced yield loss from −16.4 % to only −7 %. Additionally, planting earlier-maturing potato varieties at sites with less favorable pedoclimatic conditions could enhance irrigation water productivity and decrease irrigation demand by 26 %. Yield losses, in this case, could only be reduced to −14.8 %. These results highlight the great value of soil organic carbon for preventing productivity losses during droughts and show that irrigation water use efficiency increases can best be promoted by location-specific combinations of adaptation choices. Alarmingly, SOC stocks are observed and projected to decline in response to climate change. This calls for maintenance and enhancement of SOC through soil management, which not only promotes adaptation in the form of increased soil moisture retention but also enhances mitigation through carbon sequestration.
The regional application of the field-scale, physically based SWAP model enabled simulations of regional irrigation demand, potato yields, and deficits in response to drought stress. Such estimates are not only critical for planning irrigation or water retention infrastructure but also highlight the need for proactive measures to reduce reliance on supplemental irrigation. Future studies should investigate the large-scale impact on a broader range of adjustments in crop and soil management strategies, including conservation tillage, mulching, and cultivation of better-adapted crops. Additionally, the impacts of large-scale adoptions of adjusted management on the hydrological cycle at the catchment scale should be explored. This will contribute to developing more holistic and resilient agricultural systems capable of adapting to changing hydrological conditions in the face of increasing drought extremes.
A1 Spatial variability of irrigation demand
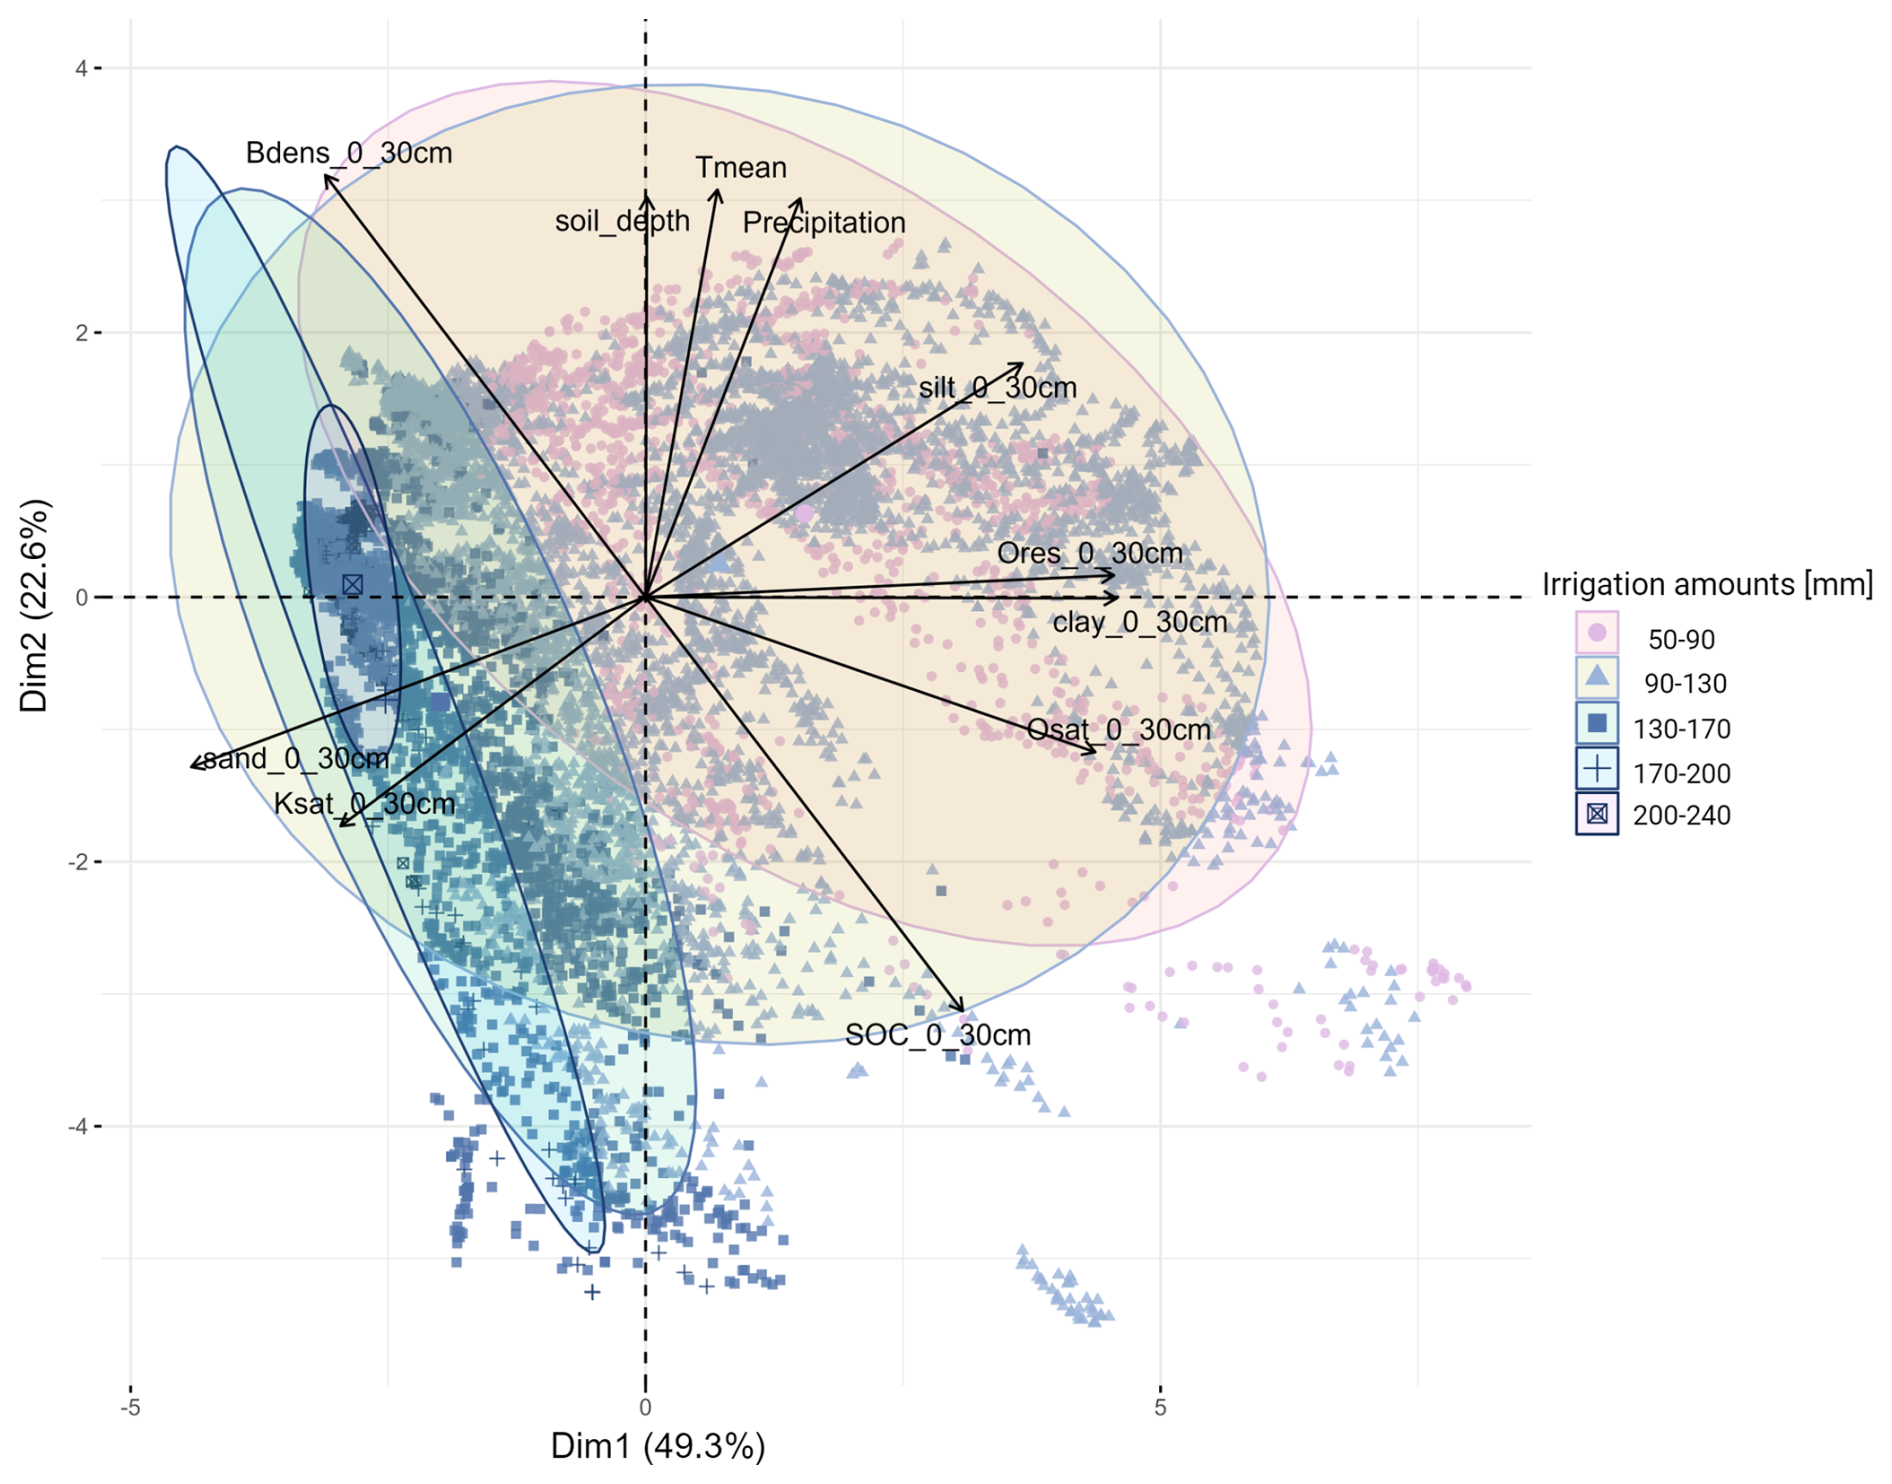
Figure A1Biplot showing the observations and variables within the dimensions of the first two principal components that explain 71 % of the total variance. Observations show the seasonal irrigation amount for 2022 without considering irrigation bans or management. The color coding corresponds to five equal ranges of irrigation amounts. Edaphic parameters are always taken from the first 30 cm. Bdens: bulk density; soil_depth: total depth of the soil profile; Tmean: mean temperature over the growing season; Precipitation: cumulative precipitation over the growing season; Ksat: saturated hydraulic conductivity; harvest_DOY: day of the year at harvest; θres: residual water content; θsat: saturated water content.
The code is available on GitHub (https://github.com/MalveHeinz/SWAP_regional (last access: 18 March 2025), https://doi.org/10.5281/zenodo.13866022, Heinz, 2025).
Data will be made available upon request.
The supplement related to this article is available online at https://doi.org/10.5194/hess-29-1807-2025-supplement.
Conceptualization: MH, AH, and BS. Methodology: MH and AH. Data curation: MH, AH, and AK. Formal analysis: MH. Resources: MH, AH, and BS. Supervision: AH, MET, and BS. Writing – original draft: MH. Writing – review and editing: MH, AH, BS, and MET.
The contact author has declared that none of the authors has any competing interests.
The irrigation water withdrawal locations are as of 2022 according to the HAFL survey. There is no claim to completeness. FOEN or HAFL assume no liability and give no guarantees of the correctness of the data.
Publisher's note: Copernicus Publications remains neutral with regard to jurisdictional claims made in the text, published maps, institutional affiliations, or any other geographical representation in this paper. While Copernicus Publications makes every effort to include appropriate place names, the final responsibility lies with the authors.
This article is part of the special issue “Drought, society, and ecosystems (NHESS/BG/GC/HESS inter-journal SI)”. It is not associated with a conference.
We would like to thank the three anonymous reviewers for their helpful comments. We would also like to thank Christoph Raible for reviewing and revising the manuscript. We used AI tools in polishing the language, i.e., DeepL and Gemini. Several graphs were created with the help of https://www.BioRender.com (last access: 30 January 2025).
The work was mainly funded by the Bretscher Fonds managed by the Oeschger Centre for Climate Change Research (OCCR), by the Federal Office for the Environment (FOEN) under project 20.0078.PJ Grundlagen Trockenheitsinformation. FP 1: Grundlageninformationen landwirtschaftliche Bewässerung (SwissIrrigationInfo), and the EJP SoilX project of the European Union Horizon 2020 research and innovation program (grant no. 862695).
This paper was edited by Shreedhar Maskey and reviewed by three anonymous referees.
Acevedo, S. E., Waterhouse, H., Barrios-Masias, F., Dierks, J., Renwick, L. L. R., and Bowles, T. M.: How does building healthy soils impact sustainable use of water resources in irrigated agriculture?, Elementa: Science of the Anthropocene, 10, 00043, https://doi.org/10.1525/elementa.2022.00043, 2022. a, b, c
Agroscope: Ergebnisse der Zentralen Auswertung von Buchhaltungsdaten, Agroscope, 2023. a, b
Ahmadi, S. H., Andersen, M. N., Plauborg, F., Poulsen, R. T., Jensen, C. R., Sepaskhah, A. R., and Hansen, S.: Effects of irrigation strategies and soils on field grown potatoes: yield and water productivity, Agr. Water Manage., 97, 1923–1930, https://doi.org/10.1016/j.agwat.2010.07.007, 2010. a
Allani, M., Mezzi, R., Zouabi, A., Béji, R., Joumade-Mansouri, F., Hamza, M. E., and Sahli, A.: Impact of future climate change on water supply and irrigation demand in a small mediterranean catchment. Case study: Nebhana dam system, Tunisia, J. Water Clim. Change, 11, 1724–1747, https://doi.org/10.2166/wcc.2019.131, 2020. a, b
Allen, R., Pereira, L., Raes, D., and Smith, M.: FAO Irrigation and Drainage Paper No. 56. Crop Evapotranspiration: Guidelines for Computing Crop Water Requirements, Report, Food and Agriculture Organization of the United Nations, ISBN 92J5J104219J5, 1998. a
Arnold, J., Moriasi, D., Gassman, P., Abbaspour, K., White, M., Srinivasan, R., Santhi, C., Harmel, R., van Griensven, A., Van Liew, M., Kannan, N., and Jha, M.: SWAT: Model Use, Calibration, and Validation, T. ASABE, 55, 1491–1508, https://doi.org/10.13031/2013.42256, 2012. a
Bodner, G., Nakhforoosh, A., and Kaul, H. P.: Management of crop water under drought: a review, Agron. Sustain. Dev., 35, 401–442, https://doi.org/10.1007/s13593-015-0283-4, 2015. a, b, c
Bolinder, M. A., Crotty, F., Elsen, A., Frac, M., Kismányoky, T., Lipiec, J., Tits, M., Tóth, Z., and Kätterer, T.: The effect of crop residues, cover crops, manures and nitrogen fertilization on soil organic carbon changes in agroecosystems: a synthesis of reviews, Mitig. Adapt. Strat. Gl., 25, 929–952, https://doi.org/10.1007/s11027-020-09916-3, 2020. a, b
Bonfante, A., Basile, A., Acutis, M., De Mascellis, R., Manna, P., Perego, A., and Terribile, F.: SWAP, CropSyst and MACRO comparison in two contrasting soils cropped with maize in Northern Italy, Agr. Water Manage., 97, 1051–1062, https://doi.org/10.1016/j.agwat.2010.02.010, 2010. a
Brochet, E., Grusson, Y., Sauvage, S., Lhuissier, L., and Demarez, V.: How to account for irrigation withdrawals in a watershed model, Hydrol. Earth Syst. Sci., 28, 49–64, https://doi.org/10.5194/hess-28-49-2024, 2024. a, b
CH2018: CH2018 – Climate Scenarios for Switzerland. Technical Report, National Centre for Climate Services, ISBN 978-3-9525031-4-0, 2018. a
Chang, D. C., Jin, Y. I., Nam, J. H., Cheon, C. G., Cho, J. H., Kim, S. J., and Yu, H.-S.: Early drought effect on canopy development and tuber growth of potato cultivars with different maturities, Field Crop. Res., 215, 156–162, https://doi.org/10.1016/j.fcr.2017.10.008, 2018. a
Cyano, T., Aydin, M., and Haraguchi, T.: Impact of climate change on irrigation deman and crop growth in a mediterranean environment of Turkey, Sensors, 7, 2297–2315, 2007. a
de Wit, A. and Boogaard, H.: Gentle Introduction to WOFOST, Report, Wageningen University, 2021. a
Diacono, M. and Montemurro, F.: Long-term effects of organic amendments on soil fertility. A review, Agron. Sustain. Dev., 30, 401–422, https://doi.org/10.1051/agro/2009040, 2010. a, b, c, d, e, f
Eden, M., Gerke, H. H., and Houot, S.: Organic waste recycling in agriculture and related effects on soil water retention and plant available water: a review, Agron. Sustain. Dev., 37, 11, https://doi.org/10.1007/s13593-017-0419-9, 2017. a, b, c, d
Fahad, S., Bajwa, A. A., Nazir, U., Anjum, S. A., Farooq, A., Zohaib, A., Sadia, S., Nasim, W., Adkins, S., Saud, S., Ihsan, M. Z., Alharby, H., Wu, C., Wang, D., and Huang, J.: Crop production under drought and heat stress: plant responses and management options, Front. Plant Sci., 8, 1147, https://doi.org/10.3389/fpls.2017.01147, 2017. a, b
Feddes, R., Kowalik, P., and Zaradny, H.: Simulation of field water use and crop yield, Simulation monographs, Wiley, ISBN 90-220-0676-X, 1978. a
Federal Office for Agriculture (FOAG): Agrarbericht 2023, Report, FOAG, Federal Office for Agriculture, https://2023.agrarbericht.ch/de (last access: 29 January 2024), 2023a. a, b
Federal Office for Agriculture (FOAG): Agrarinformationssystem AGIS 2023. Individual-Farm Database of the Federal Office for Agriculture, FOAG, 2023b. a
Federal Office for the Environment (FOEN): Abfluss Jahrestabellen. Broye-Payerne 2003, https://www.hydrodaten.admin.ch/de/2034.html (last access: 20 April 2024), 2015. a
Federal Office for the Environment (FOEN): Abfluss Jahrestabellen. Broye-Payerne 2015, https://www.hydrodaten.admin.ch/de/2034.html (last access: 20 April 2024), 2017. a
Federal Office for the Environment (FOEN): Hitze und Trockenheit im Sommer 2018. Auswirkungen auf Mensch und Umwelt, Report, Federal Office for the Environment (FOEN), 2019. a
Federal Office for the Environment (FOEN): Abfluss Jahrestabellen. Broye-Payerne 2018, https://www.hydrodaten.admin.ch/de/2034.html (last access: 20 April 2024), 2020. a
Federal Office for the Environment (FOEN): Auswirkungen des Klimawandels auf die Schweizer Gewässer. Hydrologie, Gewässerökologie und Wasserwirtschaft, Report, FOEN, Federal Office for the Environment, 2021. a, b, c
Federal Office for the Environment (FOEN): Broye – Payerne, Caserne d'aviation, https://www.hydrodaten.admin.ch/de/seen-und-fluesse/stationen-und-daten/2034 (last access: 20 April 2024), 2023. a
Floriancic, M. G., Berghuijs, W. R., Molnar, P., and Kirchner, J. W.: Seasonality and drivers of low flows across Europe and the United States, Water Resour. Res., 57, e2019WR026928, https://doi.org/10.1029/2019wr026928, 2021. a
Food and Agriculture Organization of the United Nation (FAO): Introducing Aquacrop, Report, Food and Agriculture Organization of the United Nation (FAO), 2016. a
Fricke, E. and Riedel, A.: Gezielter Einsatz der Durstlöscher, Top Agrar, 7, 2019. a, b
Gorguner, M. and Kavvas, M. L.: Modeling impacts of future climate change on reservoir storages and irrigation water demands in a Mediterranean basin, Sci. Total Environ., 748, 141246, https://doi.org/10.1016/j.scitotenv.2020.141246, 2020. a, b, c
Gross, A. and Glaser, B.: Meta-analysis on how manure application changes soil organic carbon storage, Sci. Rep., 11, 5516, https://doi.org/10.1038/s41598-021-82739-7, 2021. a, b, c
Gu, Z., Qi, Z., Burghate, R., Yuan, S., Jiao, X., and Xu, J.: Irrigation scheduling approaches and applications: a review, J. Irrig. Drain. E., 146, 04020007-1–04020007-15, https://doi.org/10.1061/(asce)ir.1943-4774.0001464, 2020. a
He, Y., Zheng, Y., Chen, X., Liu, B., and Tan, Q.: Water resources allocation considering water supply and demand uncertainties using newsvendor model-based framework, Sci. Rep., 13, 13639, https://doi.org/10.1038/s41598-023-40692-7, 2023. a
Heinz, M.: MalveHeinz/SWAP_regional: Version_1, Zenodo [code], https://doi.org/10.5281/zenodo.13866022, 2025. a
Hirte, J., Leifeld, J., Abiven, S., Oberholzer, H.-R., and Mayer, J.: Below ground carbon inputs to soil via root biomass and rhizodeposition of field-grown maize and wheat at harvest are independent of net primary productivity, Agr. Ecosyst. Environ., 265, 556–566, https://doi.org/10.1016/j.agee.2018.07.010, 2018. a, b
Holland, J. M.: The environmental consequences of adopting conservation tillage in Europe: reviewing the evidence, Agr. Ecosyst. Environ., 103, 1–25, https://doi.org/10.1016/j.agee.2003.12.018, 2004. a
Hou, X., Li, R., Jia, Z., Han, Q., Wang, W., and Yang, B.: Effects of rotational tillage practices on soil properties, winter wheat yields and water-use efficiency in semi-arid areas of north-west China, Field Crop. Res., 129, 7–13, https://doi.org/10.1016/j.fcr.2011.12.021, 2012. a, b
Hu, S., Shi, L., Huang, K., Zha, Y., Hu, X., Ye, H., and Yang, Q.: Improvement of sugarcane crop simulation by SWAP-WOFOST model via data assimilation, Field Crop. Res., 232, 49–61, https://doi.org/10.1016/j.fcr.2018.12.009, 2019. a
Husson, F., Le, S., and Pagès, J.: Exploratory Multivariate Analysis by Example Using R, Chapman and Hall/CRC, 2nd edn., https://doi.org/10.1201/b21874, 2017. a
Hydrological Atlas of Switzerland (HADES): Hydromaps, https://hydromaps.ch/#de/8/46.830/8.193/bl_hds+0+0 (last access: 12 February 2024), 2024. a, b
IPCC: Synthesis report of the IPCC sixth Assessment Report (AR6), Report, IPCC, https://doi.org/10.59327/IPCC/AR6-9789291691647, 2023. a, b
Jarvis, N.: The MACRO Model (Version 3.1): Technical Description and Sample Simulations, model descritption, 1994. a
Jarvis, N. J.: Simple physics-based models of compensatory plant water uptake: concepts and eco-hydrological consequences, Hydrol. Earth Syst. Sci., 15, 3431–3446, https://doi.org/10.5194/hess-15-3431-2011, 2011. a
Joseph, N., Ryu, D., Malano, H. M., George, B., and Sudheer, K. P.: A review of the assessment of sustainable water use at continental-to-global scale, Sustainable Water Resources Management, 6, 18, https://doi.org/10.1007/s40899-020-00379-7, 2020. a
Kader, M. A., Singha, A., Begum, M. A., Jewel, A., Khan, F. H., and Khan, N. I.: Mulching as water-saving technique in dryland agriculture: review article, Bulletin of the National Research Centre, 43, 147, https://doi.org/10.1186/s42269-019-0186-7, 2019. a
Kaspar, M., Kellermann, A., Landzettel, C., Steppich, F., Peters, R., Dennert, H., and Müller, M.: Bewässerung von Kartoffeln, Report, Arbeitsgemeinschaft Landtechnik und Landwirtschaftliches Bauwesen in Bayern e.V., 2020. a
Keel, S. G., Bretscher, D., Leifeld, J., von Ow, A., and Wüst-Galley, C.: Soil carbon sequestration potential bounded by population growth, land availability, food production, and climate change, Carbon Manag., 14, 2244456, https://doi.org/10.1080/17583004.2023.2244456, 2023. a
Kennan, N., Roy, S., Rath, J., Munill, C., and Goldstein, R.: Estimating crop consumption of irrigation water for the conterminous US, Transactions of the American Society of Agriculture and Biological Engineers, 62, 984–1002, 2019. a
KGK-CGC: Agricultural Landuse 2022, https://geodienste.ch/ (last access: 20 November 2023), 2023. a, b, c
Krauss, M., Wiesmeier, M., Don, A., Cuperus, F., Gattinger, A., Gruber, S., Haagsma, W. K., Peigné, J., Palazzoli, M. C., Schulz, F., van der Heijden, M. G. A., Vincent-Caboud, L., Wittwer, R. A., Zikeli, S., and Steffens, M.: Reduced tillage in organic farming affects soil organic carbon stocks in temperate Europe, Soil Till. Res., 216, 105262, https://doi.org/10.1016/j.still.2021.105262, 2022. a, b
Kreins, P., Henseler, M., Anter, J., Herrmann, F., and Wendland, F.: Quantification of Climate Change Impact on Regional Agricultural Irrigation and Groundwater Demand, Water Resour. Manag., 29, 3585–3600, https://doi.org/10.1007/s11269-015-1017-8, 2015. a
Kroes, J., Wesseling, J., and Van Dam, J.: Integrated modelling of the soil water atmosphere plant system using the model SWAP, Hydrol. Process., 14, 1993–2002, 2000. a, b, c
Kroes, J., van Dam, J., Bartholomeus, R., Groenendijk, P., Heinen, M., Hendriks, R., Mulder, H., Supit, I., and van Walsum, P.: SWAP version 4. Theory description and user manual, model manual, Wageningen University, 1566–7197, 2017. a, b
Lalehzari, R. and Kerachian, R.: An integrated framework for optimal irrigation planning under uncertainty: application of soil, water, atmosphere and plant modeling, IJST-T. Civ. Eng., 45, 429–442, https://doi.org/10.1007/s40996-020-00442-5, 2020. a
Leng, G. and Hall, J.: Crop yield sensitivity of global major agricultural countries to droughts and the projected changes in the future, Sci. Total Environ., 654, 811–821, https://doi.org/10.1016/j.scitotenv.2018.10.434, 2019. a, b
Maier, N. and Dietrich, J.: Using SWAT for strategic planning of basin scale irrigation control policies: a case study from a humid region in Northern Germany, Water Resour. Manag., 30, 3285–3298, https://doi.org/10.1007/s11269-016-1348-0, 2016. a
Masia, S., Trabucco, A., Spano, D., Snyder, R. L., Sušnik, J., and Marras, S.: A modelling platform for climate change impact on local and regional crop water requirements, Agr. Water Manage., 255, 107005, https://doi.org/10.1016/j.agwat.2021.107005, 2021. a
MeteoSwiss: Daily Precipitation (final analysis): RhiresD, Federal Office of Meteorology and Climatology MeteoSwiss, 2021a. a, b
MeteoSwiss: Daily Mean, Minimum and Maximum Temperature: TabsD, TminD, TmaxD, Federal Office of Meteorology and Climatology MeteoSwiss, 2021b. a, b
MeteoSwiss: Meteorological data Payerne 1990–2023, MeteoSchweiz, 2024. a, b, c
Moussa, R., Voltz, M., and Andrieux, P.: Effects of the spatial organization of agricultural management on the hydrological behaviour of a farmed catchment during flood events, Hydrol. Process., 16, 393–412, https://doi.org/10.1002/hyp.333, 2002. a
Mullen, K., Ardia, D., Gil, D. L., Windover, D., and Cline, J.: DEoptim: an R package for global optimization by differential evolution, J. Stat. Softw., 40, 2011. a, b
Mulumba, L. N. and Lal, R.: Mulching effects on selected soil physical properties, Soil Till. Res., 98, 106–111, https://doi.org/10.1016/j.still.2007.10.011, 2008. a
Müller Schmied, H., Cáceres, D., Eisner, S., Flörke, M., Herbert, C., Niemann, C., Peiris, T. A., Popat, E., Portmann, F. T., Reinecke, R., Schumacher, M., Shadkam, S., Telteu, C.-E., Trautmann, T., and Döll, P.: The global water resources and use model WaterGAP v2.2d: model description and evaluation, Geosci. Model Dev., 14, 1037–1079, https://doi.org/10.5194/gmd-14-1037-2021, 2021. a
Nasir, M. W. and Toth, Z.: Effect of drought stress on potato production: a review, Agronomy, 12, 635, https://doi.org/10.3390/agronomy12030635, 2022. a
Noory, H., van der Zee, S. E. A. T. M., Liaghat, A. M., Parsinejad, M., and van Dam, J. C.: Distributed agro-hydrological modeling with SWAP to improve water and salt management of the Voshmgir Irrigation and Drainage Network in Northern Iran, Agr. Water Manage., 98, 1062–1070, https://doi.org/10.1016/j.agwat.2011.01.013, 2011. a, b
Obidiegwu, J. E., Bryan, G. J., Jones, H. G., and Prashar, A.: Coping with drought: stress and adaptive responses in potato and perspectives for improvement, Front. Plant Sci., 6, 542, https://doi.org/10.3389/fpls.2015.00542, 2015. a, b
Porter, G. A., Bradbury, W. B., Sisson, J. A., Opena, G. B., and McBurnie, J. C.: Soil management and supplemental irrigation effects on potato: I. Soil properties, tuber yield, and quality, Agron. J., 91, 416–425, https://doi.org/10.2134/agronj1999.00021962009100030010x, 1999. a, b, c
Puy, A., Piano, S. L., Saltelli, A., and Levin, S. A.: sensobol: an R package to compute variance-based sensitivity indices, J. Stat. Softw., 102, 1–37, https://doi.org/10.18637/jss.v102.i05, 2022. a, b, c
Robra, J. P. and Mastrullo, J.: Evaluation des besoins en eau d'irrigation dans la Broye, Report, MandaTerre sàrl, 2011. a, b, c, d, e
Rykaczewska, K.: Impact of heat and drought stresses on size and quality of the potato yield, Plant Soil Environ., 63, 40–46, https://doi.org/10.17221/691/2016-pse, 2017. a
Samimi, M., Mirchi, A., Moriasi, D., Ahn, S., Alian, S., Taghvaeian, S., and Sheng, Z.: Modeling arid/semi-arid irrigated agricultural watersheds with SWAT: applications, challenges, and solution strategies, J. Hydrol., 590, 125418, https://doi.org/10.1016/j.jhydrol.2020.125418, 2020. a
Schaffner, L. and Mastrullo, J.: Diagnostic des besoins en eau d'irrigation dans le canton de Vaud, Report, MandaTerre sàrl, Canton du Vaud, Département de l'intérieur Service du développement territorial Division améliorations foncières, 2013. a
School of Agricultural, Forest and Food Sciences HAFL: Datengrundlage und künftige Datenerfassung zur landwirtschaftlichen Bewässerung in der Schweiz Projekt “Swiss Irrigation Info”: Schlussbericht Modul 1, Report, https://www.bfh.ch/dam/jcr:0e6320b6-d140-4911-8c72-ea8f66eab7c7/final_Schlussbericht Modul 1 190427.pdf (last access: 26 March 2025), 2023. a, b
Schulla, J.: Model Description WaSiM, Report, http://www.wasim.ch/downloads/doku/wasim/wasim_2021_en.pdf (last access: 26 March 2025), 2021. a
Schwärzel, R., Torche, J.-M., de Werra, P., and Dupuis, B.: Schweizer Sortenliste für Kartoffeln 2023, Agroscope Transfer, 453, 2296–7214, 2022. a
Skadell, L. E., Schneider, F., Gocke, M. I., Guigue, J., Amelung, W., Bauke, S. L., Hobley, E. U., Barkusky, D., Honermeier, B., Kögel-Knabner, I., Schmidhalter, U., Schweitzer, K., Seidel, S. J., Siebert, S., Sommer, M., Vaziritabar, Y., and Don, A.: Twenty percent of agricultural management effects on organic carbon stocks occur in subsoils – Results of ten long-term experiments, Agr. Ecosyst. Environ., 356, 108619, https://doi.org/10.1016/j.agee.2023.108619, 2023. a, b
Sprain, L. and Timpson, W. M.: Pedagogy for sustainability science: case-based approaches for interdisciplinary instruction, Environ. Commun., 6, 532–550, https://doi.org/10.1080/17524032.2012.714394, 2012. a
Stahn, P., Busch, S., Salzmann, T., Eichler-Löbermann, B., and Miegel, K.: Combining global sensitivity analysis and multiobjective optimisation to estimate soil hydraulic properties and representations of various sole and mixed crops for the agro-hydrological SWAP model, Environ. Earth Sci., 76, 367, https://doi.org/10.1007/s12665-017-6701-y, 2017. a
Stockholm Environment Institute (SEI): WEAP Water Evaluation And Planning System, Report, Stockholm Environment Institute (SEI), 2015. a
Stoeckle, C., Donatelli, M., and Nelson, R.: CropSyst, a cropping systems simulation model, Eur. J. Agron., 18, 289–397, 2003. a
Stoeckli, R.: The HelioMont Surface Solar Radiation Processing (2022 Version), Report, MeteoSwiss, 2013. a
Supit, I. and Van Diepen, C.: System description of the Wofost 6.0 crop simulation model implemented in CGM S. Volume 1: Theory and Algorithms, Report, European Commission, 1994. a, b
Swedish Meteorological and Hydrological Institute (SMHI): HYPE model description, Report, Swedish Meteorological and Hydrological Institute (SMHI), 2023. a
Swiss Competence Centre for Soil (KOBO): Hinweiskarten für Bodeneigenschaften Landesweit modellierte Karten für Bodeneigenschaften für drei Tiefenstufen, Report, Swiss Competence Centre for Soil, 2023. a, b
Szabó, B., Weynants, M., and Weber, T. K. D.: Updated European hydraulic pedotransfer functions with communicated uncertainties in the predicted variables (euptfv2), Geosci. Model Dev., 14, 151–175, https://doi.org/10.5194/gmd-14-151-2021, 2021. a
Taylor, C. H. B. and Priestley, R. J.: On the assessment of surface heat flux and evaporation using large-scale parameters, Mon. Weather Rev., 100, 81–92, 1972. a
ten Den, T., van de Wiel, I., de Wit, A., van Evert, F. K., van Ittersum, M. K., and Reidsma, P.: Modelling potential potato yields: accounting for experimental differences in modern cultivars, Eur. J. Agron., 137, 126510, https://doi.org/10.1016/j.eja.2022.126510, 2022. a, b, c
Toreti, A., Bavera, D., Acosta Navarro, J., Cammalleri, C., de Jager, A., Di Ciollo, C., Hrast Essenfelder, A., Maetens, W., Magni, D., Masante, D., Mazzeschi, M., Niemeyer, S., and Spinoni, J.: Drought in Europe August 2022, Report JRC130493, https://doi.org/10.2760/264241, 2022a. a
Toreti, A., Masante, D., Acosta, D., Navarro, J., Bavera, D., Cammalleri, C., De Felipe, M., de Jager, A., Ciollo, C., Maetens, W., Magni, D., Mazzeschi, D., and Spioni, J.: Drought in Europe July 2022, Report, European Comission, https://doi.org/10.2760/014884, 2022b. a
Turek, M. E., Nemes, A., and Holzkämper, A.: Sequestering carbon in the subsoil benefits crop transpiration at the onset of drought, SOIL, 9, 545–560, https://doi.org/10.5194/soil-9-545-2023, 2023. a, b, c, d
Uniyal, B. and Dietrich, J.: Simulation of irrigation demand and control in catchments – a review of methods and case studies, Water Resour. Res., 57, e2020WR029263, https://doi.org/10.1029/2020wr029263, 2021. a, b, c, d, e
Utset, A., Velicia, H., del Río, B., Morillo, R., Centeno, J. A., and Martínez, J. C.: Calibrating and validating an agrohydrological model to simulate sugarbeet water use under mediterranean conditions, Agr. Water Manage., 94, 11–21, https://doi.org/10.1016/j.agwat.2007.07.007, 2007. a, b
van Dam, J. C., Groenendijk, P., Hendriks, R. F. A., and Kroes, J. G.: Advances of modeling water flow in variably saturated soils with SWAP, Vadose Zone J., 7, 640–653, https://doi.org/10.2136/vzj2007.0060, 2008. a, b
van Genuchten, M. T. V.: A Closed-form equation for predicting the hydraulic conductivity of unsaturated soils, Soil Sci. Soc. Am. J., 44, 892–898, 1980. a
Wada, Y., Wisser, D., and Bierkens, M. F. P.: Global modeling of withdrawal, allocation and consumptive use of surface water and groundwater resources, Earth Syst. Dynam., 5, 15–40, https://doi.org/10.5194/esd-5-15-2014, 2014. a
Weber, T. K. D., Weihermüller, L., Nemes, A., Bechtold, M., Degré, A., Diamantopoulos, E., Fatichi, S., Filipović, V., Gupta, S., Hohenbrink, T. L., Hirmas, D. R., Jackisch, C., de Jong van Lier, Q., Koestel, J., Lehmann, P., Marthews, T. R., Minasny, B., Pagel, H., van der Ploeg, M., Shojaeezadeh, S. A., Svane, S. F., Szabó, B., Vereecken, H., Verhoef, A., Young, M., Zeng, Y., Zhang, Y., and Bonetti, S.: Hydro-pedotransfer functions: a roadmap for future development, Hydrol. Earth Syst. Sci., 28, 3391–3433, https://doi.org/10.5194/hess-28-3391-2024, 2024. a, b
Wesseling, J., Kroes, J., Campos Oliveira, T., and Damiano, F.: The impact of sensitivity and uncertainty of soil physical parameters on the terms of the water balance: some case studies with default R packages. Part I: Theory, methods and case descriptions, Comput. Electron. Agr., 170, 105054, https://doi.org/10.1016/j.compag.2019.105054, 2020. a, b
Wezel, A., Casagrande, M., Celette, F., Vian, J.-F., Ferrer, A., and Peigné, J.: Agroecological practices for sustainable agriculture. A review, Agron. Sustain. Dev., 34, 1–20, https://doi.org/10.1007/s13593-013-0180-7, 2014. a, b
Wiesmeier, M., Poeplau, C., Sierra, C. A., Maier, H., Fruhauf, C., Hubner, R., Kuhnel, A., Sporlein, P., Geuss, U., Hangen, E., Schilling, B., von Lutzow, M., and Kogel-Knabner, I.: Projected loss of soil organic carbon in temperate agricultural soils in the 21(st) century: effects of climate change and carbon input trends, Sci. Rep., 6, 32525, https://doi.org/10.1038/srep32525, 2016. a
Willmott, C. I.: On the validation of models, Phys. Geogr., 2, 184–194, 1981. a, b
Winter, J. M., Lopez, J. R., Ruane, A. C., Young, C. A., Scanlon, B. R., and Rosenzweig, C.: Representing water scarcity in future agricultural assessments, Anthropocene, 18, 17–22, 2017. a, b
Wriedt, G., Van der Velde, M., Aloe, A., and Bouraoui, F.: Estimating irrigation water requirements in Europe, J. Hydrol., 373, 527–544, https://doi.org/10.1016/j.jhydrol.2009.05.018, 2009. a
Wu, L.: Sequestering organic carbon in soils through land use change and agricultural practices: a review, Frontiers of Agricultural Science and Engineering, 10, 210–225, https://doi.org/10.15302/j-fase-2022474, 2022. a
Xu, X., Sun, C., Huang, G., and Mohanty, B. P.: Global sensitivity analysis and calibration of parameters for a physically-based agro-hydrological model, Environ. Modell. Softw., 83, 88–102, https://doi.org/10.1016/j.envsoft.2016.05.013, 2016. a, b
Yang, D., Yang, Y., and Xia, J.: Hydrological cycle and water resources in a changing world: a review, Geography and Sustainability, 2, 115–122, https://doi.org/10.1016/j.geosus.2021.05.003, 2021. a
Zhang, Y., Wu, Z., Singh, V. P., Su, Q., He, H., Yin, H., Zhang, Y., and Wang, F.: Simulation of Crop Water Demand and Consumption Considering Irrigation Effects Based on Coupled Hydrology Crop Growth Model, J. Adv. Model. Earth Sy., 13, e2020MS002360, https://doi.org/10.1029/2020ms002360, 2021. a