the Creative Commons Attribution 4.0 License.
the Creative Commons Attribution 4.0 License.
 | 26 Mar 2025
Investigating the global and regional response of drought to idealized deforestation using multiple global climate models
Chunping Tan
Xia Zhang
Francesco Cherubini
Henning W. Rust
Land use change, particularly deforestation, significantly influences the global climate system. While various studies have explored how deforestation affects temperature and precipitation, its impact on drought remains less explored. Understanding these effects across different climate zones and timescales is crucial for crafting effective land use policies aimed at mitigating climate change. This study investigates how changes in forest cover affect drought across different timescales and climate zones using simulated deforestation scenarios, where forests are converted to grasslands. The study utilizes data from nine global climate models, including BCC-CSM2-MR, CMCC-ESM2, CNRM-ESM2-1, CanESM5, EC-Earth3-Veg, GISS-E2-1-G, IPSL-CM6A-LR, MIROC-ES2L, and UKESM1-0-LL, which contribute to the Land Use Model Intercomparison Project (LUMIP). Drought effects are assessed by examining the Standardized Precipitation Evapotranspiration Index (SPEI) in the idealized global deforestation experiment (deforest-global) using the pre-industrial control simulation (piControl) as the reference. At the 3-month scale (SPEI03), global SPEI responses to deforestation are negative overall, indicating increased dryness conditions, particularly in tropical regions, while causing wetter conditions in dry regions. The multi-model ensemble mean (MME) of SPEI03 is (mean ± standard deviation) in tropical regions and 0.07±0.05 in dry regions. The impact on drought conditions becomes more significant over longer timescales. In tropical regions, the MME of SPEI at the 24-month scale is , while it is 0.19±0.08 in dry regions, highlighting the lasting effects of deforestation on drought conditions. Seasonal responses of SPEI03 to deforestation are more pronounced during autumn and winter, with especially significant effects observed in tropical and northern polar regions. For the MME of SPEI03, the values in tropical regions are and , while, in northern polar regions, they are and , respectively. Continental zones experience significant seasonal changes, becoming drier in winter and wetter in summer due to global deforestation, while the Northern Hemisphere's dry regions see increased wetter conditions, particularly in autumn. Deforestation alters surface albedo by changing surface land cover structure, which affects the surface energy and water balance by modifying net solar radiation, evapotranspiration, and precipitation patterns. These changes affect water deficits, leading to varying drought responses to deforestation. The findings deepen our understanding of the relationship between vegetation change and climate change, offering valuable insights for better resource management and mitigation strategies against future climate change impacts.
- Article
(9624 KB) - Full-text XML
-
Supplement
(4000 KB) - BibTeX
- EndNote


Forests cover approximately 30 % of the global ice-free land surface and are distributed widely from the tropics to boreal regions (Crowther et al., 2015; Hansen et al., 2013). Forests are one of the largest carbon storages on the planet and play a crucial role in regulating the Earth's climate (Bonan, 2008; Pan et al., 2011). However, global forests are rapidly changing due to a variety of human activities, including deforestation, forest degradation, and climate change effects (Hansen et al., 2013; Keenan et al., 2015; Forzieri et al., 2021). In the tropics, deforestation and conversion to agriculture (mainly pasture) or other land uses are the primary drivers of forest loss (Vancutsem et al., 2021). In temperate and boreal regions, forest cover disturbances are often driven by logging and natural disturbances (fires, pests, or wind outbreaks) (Ceccherini et al., 2020; Seidl et al., 2017). These changes can have significant impacts on local and global climate patterns by altering both biogeochemical and biogeophysical processes (Bonan, 2008; Jia et al., 2022). Biogeochemical processes refer to the exchange of gases and particles between the atmosphere and forest ecosystems, such as the absorption and release of carbon dioxide and other greenhouse gases. Biogeophysical processes encompass modifications in surface energy balance, including the reflection of sunlight, evapotranspiration, and heat exchange between the land and atmosphere. The loss of forest cover can alter biogeochemical processes by reducing the amount of carbon dioxide stored in vegetation and increasing greenhouse gas concentrations in the atmosphere (Harris et al., 2012). Deforestation induces changes in biogeophysical processes, such as increased surface albedo and reduced surface roughness and evapotranspiration, which result in changes to regional climate patterns (Alkama and Cescatti, 2016; Bonan, 2008; Davidson et al., 2012).
Many observational and modeling studies show that alterations of forest cover have a significant influence on the climate system (Douville et al., 2021; Jia et al., 2022; Lee et al., 2011). The effects are highly spatially heterogeneous. In the tropical region, large-scale deforestation can lead to a decline in annual total precipitation of approximately 30 % (Snyder et al., 2004; Smith et al., 2023a; Leite et al., 2021), although the streamflow in the deforested area can increase (Taylor et al., 2022; Douville et al., 2021), and to an increase in temperature in both observational and modeling studies (Alkama and Cescatti, 2016; Zeng et al., 2021; Smith et al., 2023b; Crompton et al., 2021). The size of deforestation patches can also influence tropical precipitation. Small-scale deforestation in the tropics may lead to a localized increase in precipitation (Lawrence and Vandecar, 2014; Douville et al., 2021). In the boreal region, the conversion of forests to bare land or grassland can lead to land surface cooling of (observational studies) or (modeling studies) (Perugini et al., 2017). There may also be a slight reduction in precipitation following deforestation in the boreal region (Cherubini et al., 2018). In the temperate area, the impacts of forest change on temperature and precipitation are more uncertain and variable across regions (Lejeune et al., 2018). Mahmood et al. (2014) found that deforestation can lead to both warming and cooling effects depending on the region, and Findell et al. (2017) noted significant spatial variability in the temperature impacts. Detecting the signal of forest cover changes on precipitation in the temperate region is challenging due to the high variability in synoptic-scale meteorological systems that impact local to regional circulation and rainfall patterns (Bala et al., 2007; Bonan, 2008; Field et al., 2007).
Climate model is a valuable tool for investigating the impact of changes in forest cover on the climate system. However, the results of modeling studies are variable and model-dependent, and a wide range of estimated effects is usually observed. For instance, in the boreal region, the cooling effect of forest change on the surface air temperature ranges from −4.0 to −0.82 °C, depending on the specific model used, the parameters used to represent forest cover, the region where the replacement of land cover occurs, and the type of land cover conversion considered (Perugini et al., 2017). To facilitate a consensus on forest management decisions, the climate and ecology communities are working towards establishing a unified framework with standardized settings for assessing forest change impacts. The Land Use Model Intercomparison Project (LUMIP) (Lawrence et al., 2016), a component of the Coupled Model Intercomparison Project Phase 6 (CMIP6) (Eyring et al., 2016), is a prominent example of such an effort. LUMIP aims to address key scientific questions related to the impacts of land use on climate (Lawrence et al., 2016). The idealized coupled deforestation experiment (deforest-global) is a specific experiment within LUMIP that focuses on the global biogeophysical and biogeochemical impacts of deforestation on climate. To ensure comparability between models, participating models were required to use a similar deforestation pattern, even if they employ different variables to represent the deforestation signal (Lawrence et al., 2016). Researchers utilized the datasets from LUMIP to examine the responses of temperature (Boysen et al., 2020), precipitation (Boysen et al., 2020; Luo et al., 2022), and carbon storage (Ito et al., 2020; Li et al., 2022) from global deforestation at both the global and regional scales.
Previous studies primarily focused on the biogeophysical effect of forest change on individual climate variables such as temperature and precipitation, without considering the potential impact on meteorological drought conditions (hereafter referred to drought), which are of greater relevance to decision-makers in shaping policies for sustainable land use and water management. However, changes in temperature and precipitation can have significant effects on drought, a natural hazard that has caused extensive economic and social damage worldwide. Drought is characterized by below-normal rainfall over a period of months to years (Dai, 2011) and is mainly driven by the combined effect of temperature, precipitation, wind speed, and solar radiation (Seneviratne, 2012). Understanding the behavior of droughts is essential for better water resource management and planning. In addition to human wellbeing, it poses a serious threat to ecosystems by altering soil moisture, forest structure, and carbon content (Nepstad et al., 2007). While several studies have explored the impact of deforestation on regional drought conditions, these have primarily focused on the Amazon region. For instance, deforestation can lead to less water being recycled, thereby intensifying regional dry seasons (Bagley et al., 2014; Staal et al., 2020), and converting mid-latitude natural forests to cropland and pastures may increase the frequency of hot, dry summers (Findell et al., 2017). Furthermore, forest cover change can modulate the impacts of precipitation and temperature on drought (Li et al., 2024). The impact of forest changes on drought conditions across different regions and timescales remains largely unexplored.
The study focuses on analyzing the response of droughts to deforestation using idealized experiments with data from nine LUMIP models. The aim is to address several key scientific questions related to this topic:
-
What are the global and regional-scale responses of droughts to idealized deforestation?
-
What is the drought response to deforestation across different climate zones and timescales?
-
Does short-term drought exhibit seasonal variability in response to large-scale deforestation?
Through our study, we aim to contribute to the scientific understanding of the complex relationship between deforestation and droughts, shedding light on the spatial and temporal aspects of this interaction. By addressing these scientific questions, we hope to provide valuable insights for policymakers and land managers in formulating effective strategies for drought mitigation and adaptation. This information can also be used to inform forest management decisions aimed at mitigating the negative impacts of deforestation on water resources and ecosystems. The paper is structured as follows: Section 1 presents a brief introduction, while Sect. 2 provides an overview of the methods and datasets used, including the experiment design, model introduction, drought index used, climate regions, and the evaluation of the effect. Section 3 analyzes the changes in meteorological factors (temperature and precipitation) and droughts in response to deforestation, specifically exploring how droughts respond in different climate zones and timescales, along with seasonal changes in short-term drought. Section 4 discusses the limitations and potential avenues for future research, and Sect. 5 summarizes the main conclusions.
2.1 Experiment design and introduction of models
Two experiments from LUMIP are used in this study: piControl and deforest-global. The piControl experiment is a standard control experiment, with spatial resolution ranging from 0.7°×0.7° to 2.8°×2.8° (depending on the model) and at 15–60 min time steps, that is designed to provide a reference state for climate models. It is typically run for several hundred years to ensure that the model reaches a steady state, and it is used to evaluate the performance of the model (Eyring et al., 2016). The deforest-global experiment is an idealized experiment designed to investigate the effects of global deforestation on climate. It is branched from the piControl experiment and uses the same forcing, including CO2 concentration, land use maps, and land management (Lawrence et al., 2016). The deforest-global experimental design involves sorting land grid cells based on their forest area in 1850 and selecting the top 30 % of grid cells for tree replacement and calculating tree plant type loss for each year at each grid cell by attributing the 0.4 ×10⁶ km2 yr−1 forest loss proportionally to their forest cover fraction across the forest replacement grid cells. Therefore, a total of 20 ×106 km2 of the forest is replaced by grassland in a linear fashion over 50 years. After forest replacement, the ground biomass is removed and the underground biomass is changed to litter pools. The dynamic vegetation modules can be closed over the deforestation grids to ensure the proper process of carbon transition, while, outside of the deforestation grids, the dynamic vegetation modules can be kept because the impact of climate change caused by deforestation on tree fraction is small.
Several climate variables are needed to calculate the drought index, including temperature, precipitation, wind speeds, latitude, surface air pressure, and cloud cover (Table S1 in the Supplement). Nine models cover these variables, including BCC-CSM2-MR (Wu et al., 2019), CMCC- ESM2 (Lovato et al., 2022), CNRM-ESM2-1 (Séférian et al., 2019), CanESM5 (Swart et al., 2019), EC-Earth3-Veg (Döscher et al., 2022), GISS-E2-1-G (Kelley et al., 2020), IPSL-CM6A-LR (Boucher et al., 2020), MIROC-ES2L (Hajima et al., 2020), and UKESM1-0-LL (Sellar et al., 2020). More information regarding the deforestation simulation and the land surface model for each Earth system model can be found in Table S2 and Sect. S1 in the Supplement. All simulation datasets for both the piControl and deforest-global experiments can be downloaded from the Earth System Grid Federation (ESGF) at https://esgf-node.llnl.gov/search/cmip6/ (last access: 7 February 2025) (Balaji et al., 2018). Most models have only one run member, except for IPSL-CM6A-LR, which has three run members. To ensure consistency in the results, we selected the first run for all models in our analysis. Additionally, both CESM and MPI-ESM1-2-LR contribute to the CMIP6 LUMIP projection. However, some variables necessary for calculating drought are missing from the data archive. CESM lacks daily maximum/minimum near-surface air temperature and near-surface wind speed, while MPI-ESM1-2-LR does not include daily maximum/minimum near-surface air temperature. As a result, we excluded these two models from our study. As the datasets have varying spatial resolutions, they were interpolated to the N48 lat–long resolution (i.e., 1.875°×1.875°) by using bilinear interpolation. This interpolation approach is a commonly used method for adjusting differing resolutions to a uniform grid in multi-model comparisons and analyses. It is generally appropriate for most model output variables (Li and Heap, 2011; Wang et al., 2012).
2.2 Introduction of the drought indices
In this study, the Standardized Precipitation Evapotranspiration Index (SPEI) is employed to characterize drought, an indicator that is well established in the literature (Vicente-Serrano et al., 2010). Table S1 lists the climate variables necessary to compute the SPEI. The SPEI is an extension of the Standardized Precipitation Index (SPI), which maps precipitation intensity onto a standard Gaussian variable and is based solely on precipitation amounts (Mckee et al., 1993). Compared to SPI, the SPEI additionally takes the influence of potential evapotranspiration (PET) into account, which refers to the amount of water that could evaporate and transpire under specific environmental conditions if water availability is not a limiting factor. This makes the SPEI a more comprehensive measure of drought than the SPI. SPEI can also be used to analyze drought conditions at different timescales. The water deficit (Di,j) for month i, year j is defined by
Di,j can be aggregated over the desired timescales, denoted k months. The aggregated Di,j over k months yields a series , representing the water deficit for month i of year j, with a timescale of k months. The series starts from month (if i<k) or month i−k (if i≥k):
To model the distribution of , the three-parameter log-logistic distribution is identified as the appropriate model for this purpose (Vicente-Serrano et al., 2010). The probability density function (PDF) is Eq. (4) and the cumulative function (CDF) as Eq. (5) for the three-parameter log-logistic distribution:
where α, β, and γ denote the scale, shape, and origin parameter, respectively. Given a specific point, month of a year, and timescale, the parameters (α, β, and γ) can be estimated using unbiased probability-weighted moments (PWMs; “ub-pwm”), plotting-position PWMs (“pp-pwm”), and maximum likelihood (“max-lik”). Then, the CDF for the log-logistic distribution is obtained.
In order to more easily compare drought conditions at different timescales, months, and sites, the CDF from Eq. (5) is then transformed to the standard normal random variable (with a mean of zero and a variance of 1) based on the equiprobability transformation (Panofsky and Brier, 1968). It converts a log-logistic variable into a standard normal variable, ensuring that the probability of the original variable being less than a given value matches the probability of the transformed being less than its corresponding value. The resulting value is the SPEI.
The SPEI was calculated using the R package “SPEI” (https://cran.r-project.org/web/packages/SPEI, last access: 7 February 2025). The log-logistic distribution is suitable to describe the water deficit change, and unbiased probability-weighted moments (“ub-pwm”) were used for parameter estimation. PET was calculated using the FAO-56 Penman–Monteith method (Allen et al., 1998). Here, SPEI was computed for different accumulation timescales, including 3 months (SPEI03, short-term), 6 months (SPEI06, mid-term), 12 months (SPEI12, mid-term), and 24 months (SPEI24, long-term).
2.3 Climate classification
The latest Köppen–Geiger world map data (http://www.gloh2o.org/koppen/, last access: 7 February 2025) are used in this analysis to classify the climate regime (Beck et al., 2018). This classification was formulated by Wladimir Köppen and has undergone several updates over the years (Peel et al., 2007; Kriticos et al., 2012). The most recent version was introduced by Beck et al. (2018) and has an unprecedented resolution of 0.0083° (approximately 1 km at the Equator), which provides a more accurate representation of highly heterogeneous regions. To ensure accuracy and assess uncertainties in map classifications, the authors combined climatic air temperature and precipitation data from multiple independent sources, including WorldClim V1 and V2 (Fick and Hijmans, 2017; Hijmans et al., 2005), Climatologies at high resolution for the Earth's land surface areas (CHELSA) V1.2 (Karger et al., 2017), and Climate Hazards Group's Precipitation Climatology (CHPclim) V1 (Funk et al., 2015). These datasets have been explicitly corrected for topographic effects and, except the CHELSA V1.2 temperature dataset, are based on a large number of stations (≥34 542 for precipitation and ≥20 268 for temperature). The use of multiple data sources allows an estimate of uncertainty in the derived classes. The resulting dataset defines 30 possible climate types, which can be grouped into five main categories: tropical, dry, temperate, continental, and polar regions (Fig. S1 in the Supplement). The current climate Köppen-Geiger world map was employed in the subsequent analysis to delineate the five core climate zones. This choice is based on its remarkable consistency across timescales (Yoo and Rohli, 2016).
The Earth's tilted axis results in significant seasonal differences in solar radiation between the Northern and Southern hemispheres. To accurately represent the seasonal impact of deforestation in these regions, we have classified them into dry climate zones in the Northern Hemisphere (Dry_n) and Southern Hemisphere (Dry_s), temperate climate zones in the Northern Hemisphere (T_n) and Southern Hemisphere (T_s), and the polar climate zones in the Northern Hemisphere (Polar_n) and Southern Hemisphere (Polar_s), corresponding to dry, temperate, and polar regions in hemispheres.
2.4 Evaluation of the effect of deforestation on droughts
The deforest-global experiment is a branch of the piControl experiment, sharing identical parameters except for the land cover data. We can assess the climate response to land cover change by contrasting the outcomes of these two experiments (Lawrence et al., 2016). We seek to evaluate the effects of deforestation on drought by analyzing changes in SPEI with and without deforestation. In this study, we use water deficits from the piControl experiment to estimate the parameters of the log-logistic distribution which defines the reference for evaluating the SPEI of the subsequent deforest-global experiment. The non-exceedance probabilities for water deficits from the deforest-global experiment with respect to the piControl CDF are then mapped via the equiprobability transformation to a Gaussian variable. The process clarifies the SPEI in this study, describing the relative conditions (dry or wet) compared to those in the piControl experiment, which indicates comparing conditions before and after forest loss. The last 30 years of the experiment (from year 51 to year 80) are considered the stabilized period (Boysen et al., 2020; Luo et al., 2022). During this period, the effects of deforestation are fully expressed. Consequently, in this study, if not stated otherwise, all analyses are carried out exclusively on data from this specific period. The subsequent analysis is concentrated solely on land grids and SPEI changes in deforest-global relative to piControl. We utilize a two-tailed t-test to assess the significance of changes in SPEI induced by deforestation.
To improve visualization of the time series of drought indices, we use the cubic spline regression to obtain smooth curves. This smoothness of the curve is determined using generalized cross-validation (Wood, 2017). The “gam()” function from the R package mgcv was used in this study to obtain the cubic splines (https://cran.r-project.org/web/packages/mgcv/mgcv.pdf, last access: 7 February 2025).
3.1 Impact of deforestation on meteorological factors
The deforest-global experiment focuses on removing trees from grid cells that were predominantly covered by forests. Deforestation mainly occurs in selected areas of tropical, temperate, and continental regions, and the global pattern of deforestation is similar for all models (Fig. S2 in the Supplement). The multi-model ensemble mean (MME) results reveal that the Amazon basin, central Africa, eastern North America, and Europe experience the most significant forest reductions. Large-scale deforestation leads to an average global land reduction in precipitation of (mean ± standard deviation) from year 51 to year 80 (Fig. S3 in the Supplement). There are some differences in precipitation variability patterns in response to deforestation (Fig. S4 in the Supplement). For temperature, MME shows that deforestation leads to a global land cooling effect of (Table S3 in the Supplement). There is a clear cooling trend in global temperature, and in four regions (excluding the tropical region), compared to the piControl experiment (Fig. S4 in the Supplement). The temperature response to forest change exhibits inter-model variability in specific regions (Fig. S5 in the Supplement).
Deforestation leads to a reduction in global precipitation and near-surface cooling, but the magnitude of these changes varies across regions and models (Fig. 1). According to the different model outputs, some models estimate that the tropical region experiences the most significant decrease in precipitation and the least pronounced cooling. In contrast, the continental region typically experiences significant cooling, but the decrease in precipitation is less pronounced. In the temperate region, both precipitation and cooling changes are not very pronounced. The dry and polar regions, where fewer trees are removed, show slight variability in precipitation and temperature changes. Interestingly, there is no linear relationship between deforestation area and precipitation or temperature changes across regions, highlighting the complex and non-local nature of the biogeophysical effects of deforestation. Global and regional changes in forest fraction, precipitation, and near-surface temperature for individual models can be found in Fig. S6 in the Supplement.
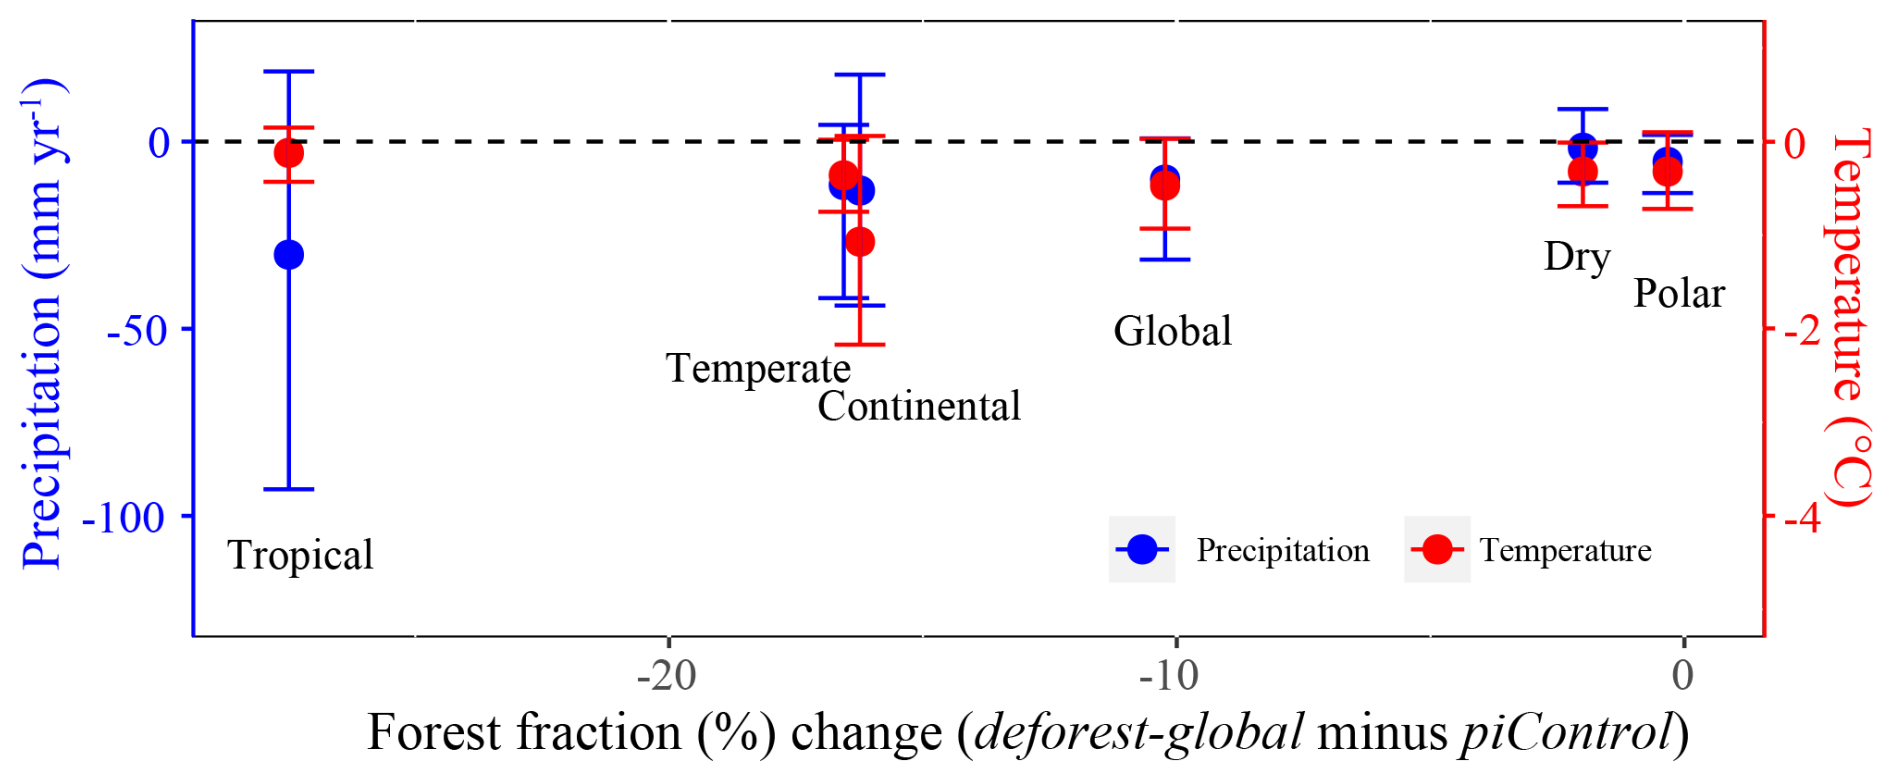
Figure 1Global (only over land) and regional mean changes (deforest-global minus piControl) in forest fraction (%), precipitation (mm yr−1), and near-surface temperature (°C). The dots represent the 30-year (from simulation year 51 to 80) average of multi-model ensemble mean results, and the vertical error bars represent the range of results from the nine models.
3.2 Impact of deforestation on drought indices (SPEIs)
3.2.1 Analysis of annually averaged SPEI response to deforestation
For short-term drought (SPEI03), seven models indicate a tendency towards drier conditions in the Amazon and tropical Africa. However, two models (CMCC-ESM2 and EC-Earth3-Veg) show a significant wet trend in these regions (Fig. 2). Most models simulate positive SPEI03 changes in northern Africa, the Middle East, central Asia, and central North America, which are classified as dry climate zones in global climate classification, suggesting an increase in atmosphere moisture. Notably, CMCC-ESM2 and EC-Earth3-Veg show a significant positive change in these areas. The MME also captures the drier Amazon and tropical Africa and the wetter conditions in dry climate zones.
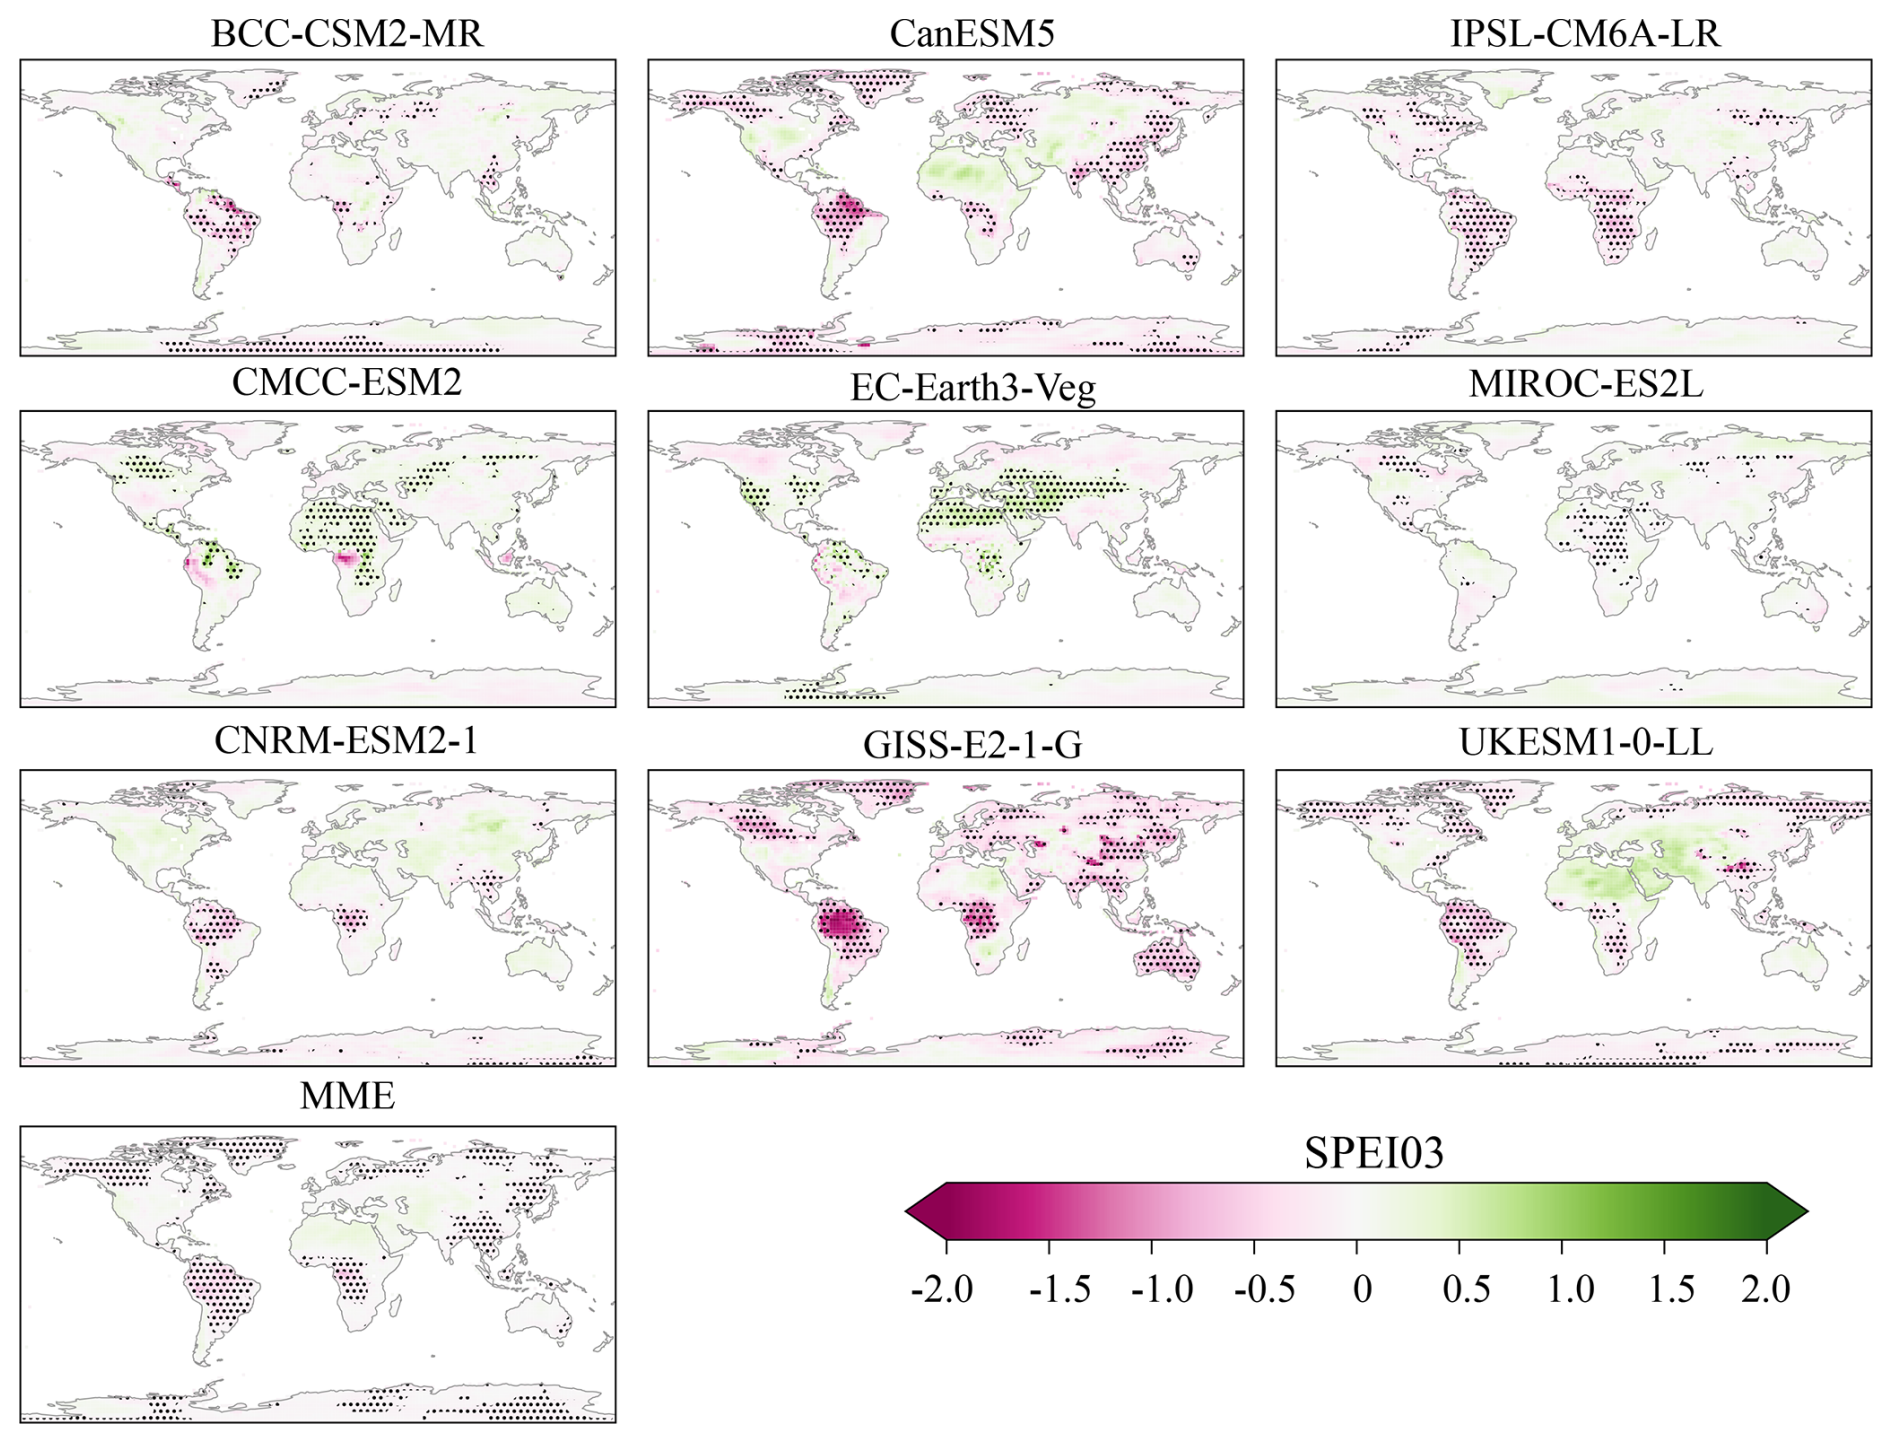
Figure 2Standardized Precipitation Evapotranspiration Index calculated over a 3-month timescale (SPEI03) from the deforest-global experiment using the piControl experiment as a reference for nine global climate models (GCMs) and the multi-model ensemble mean (MME). Positive values signify increased moisture (wet conditions), while negative values denote reduced moisture (dry conditions) relative to the piControl experiment. The black dots indicate the changes in SPEI03, with significance tested using a two-tailed t-test at a p value of 0.05.
For long-term drought (SPEI24), models exhibit a similar pattern of changes in dry–wet conditions as observed for short-term drought. Notably, significant changes in SPEI are evident in the Amazon and tropical Africa across most models (Fig. 3). In specific dry regions such as northern Africa, the Middle East, central Asia, and central North America, CMCC-ESM2, EC-Earth3-Veg, and CNRM-ESM2-1 show a significant tendency towards wetter conditions, while other models, excluding GISS-E2-1-G, indicate a slight wet trend that does not pass the significance test. This highlights the influence of large-scale deforestation on local dry–wet conditions, with some variability among models. The MME results demonstrate more agreement with the majority of individual models in capturing the changes.
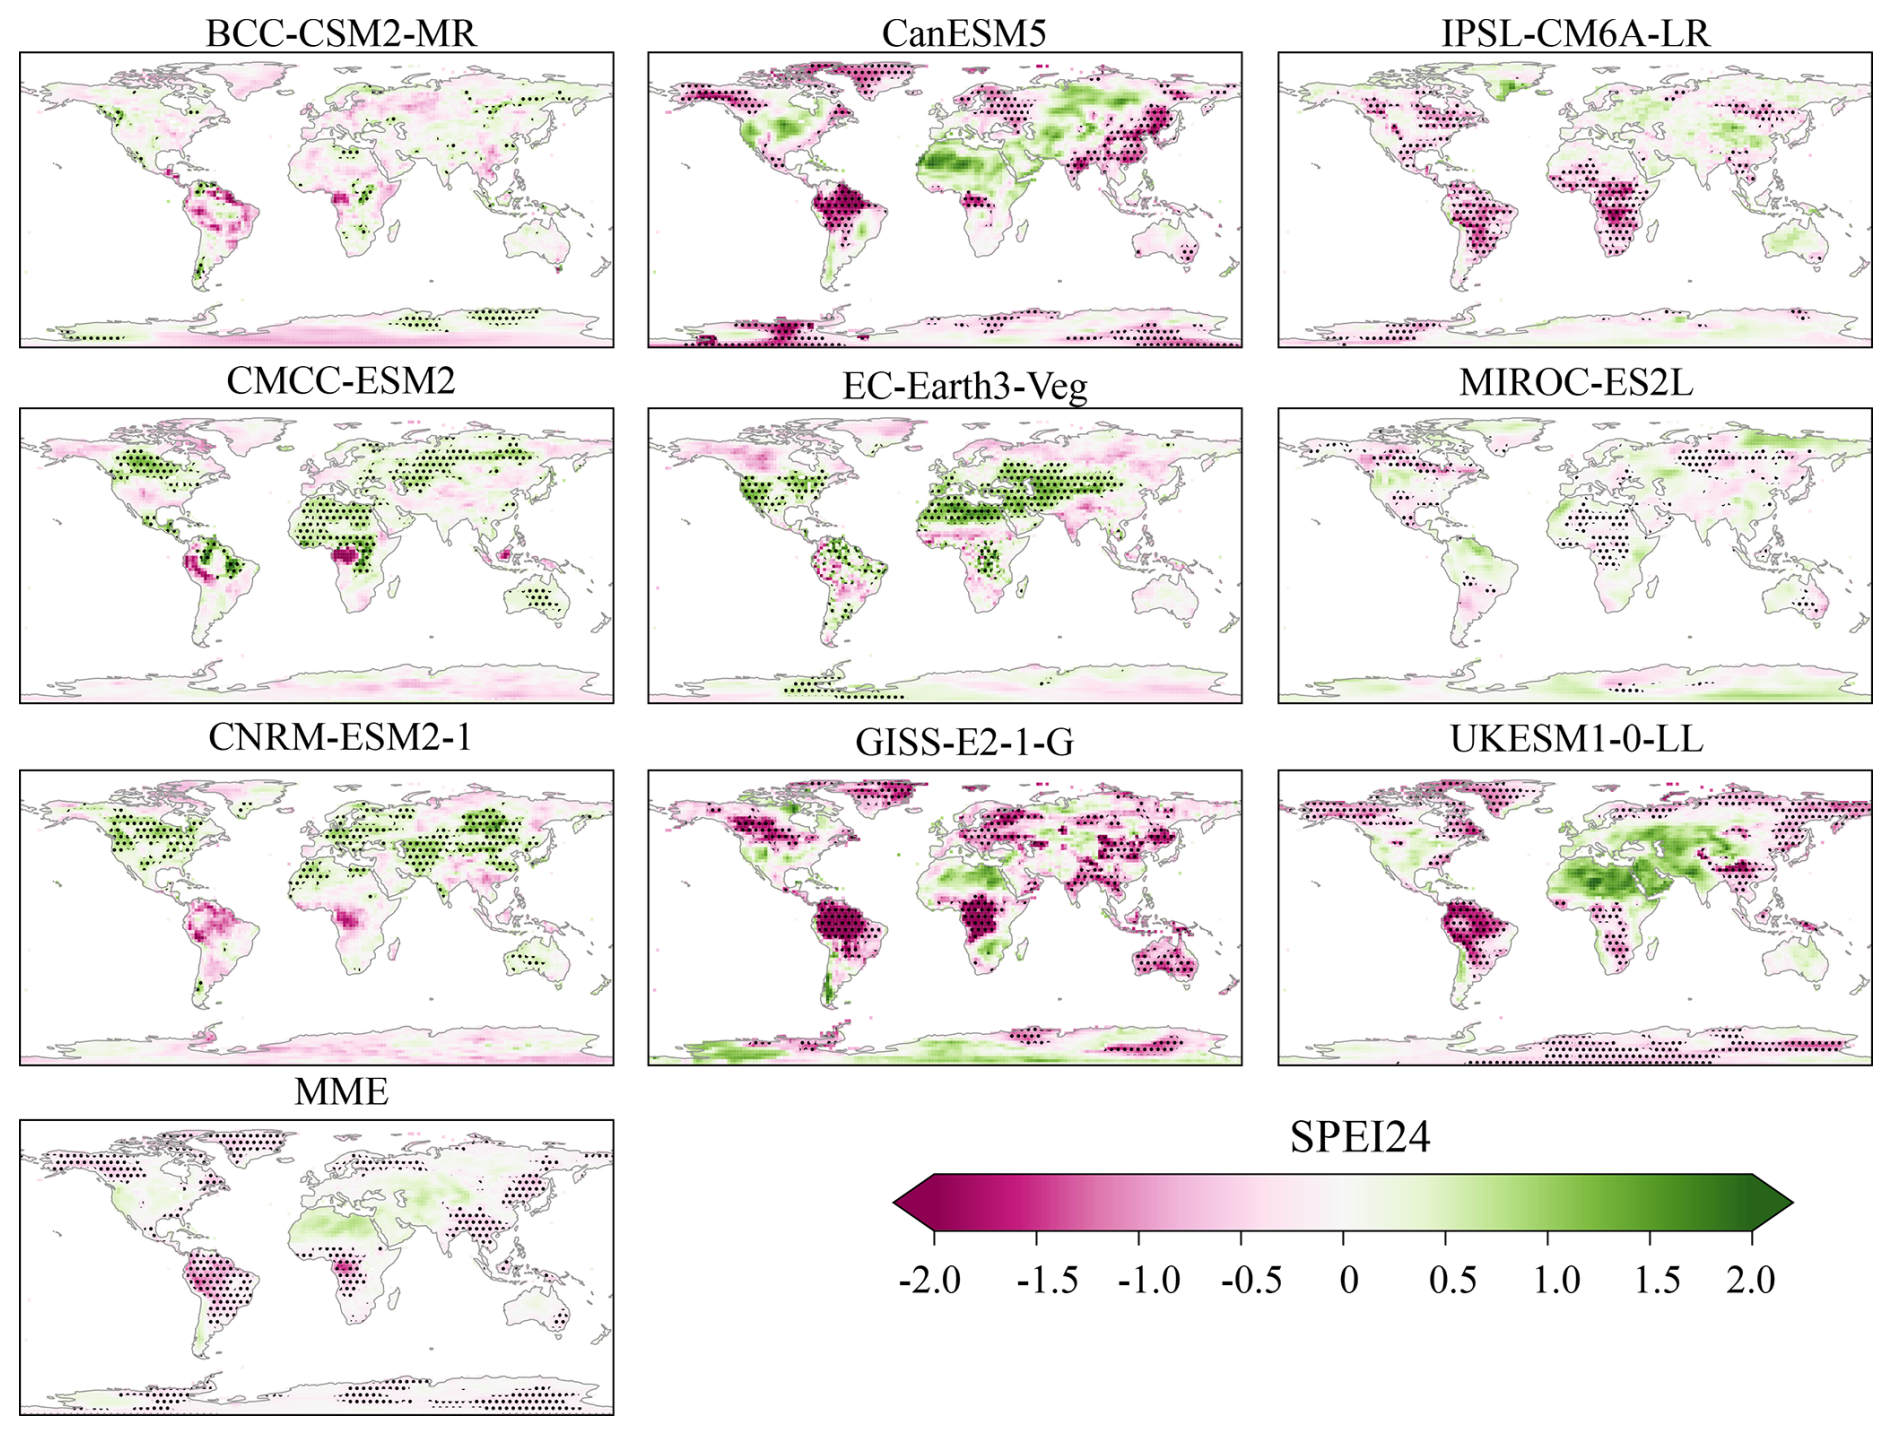
Figure 3Same as Fig. 2 but for the SPEI calculated over a 24-month timescale (SPEI24).
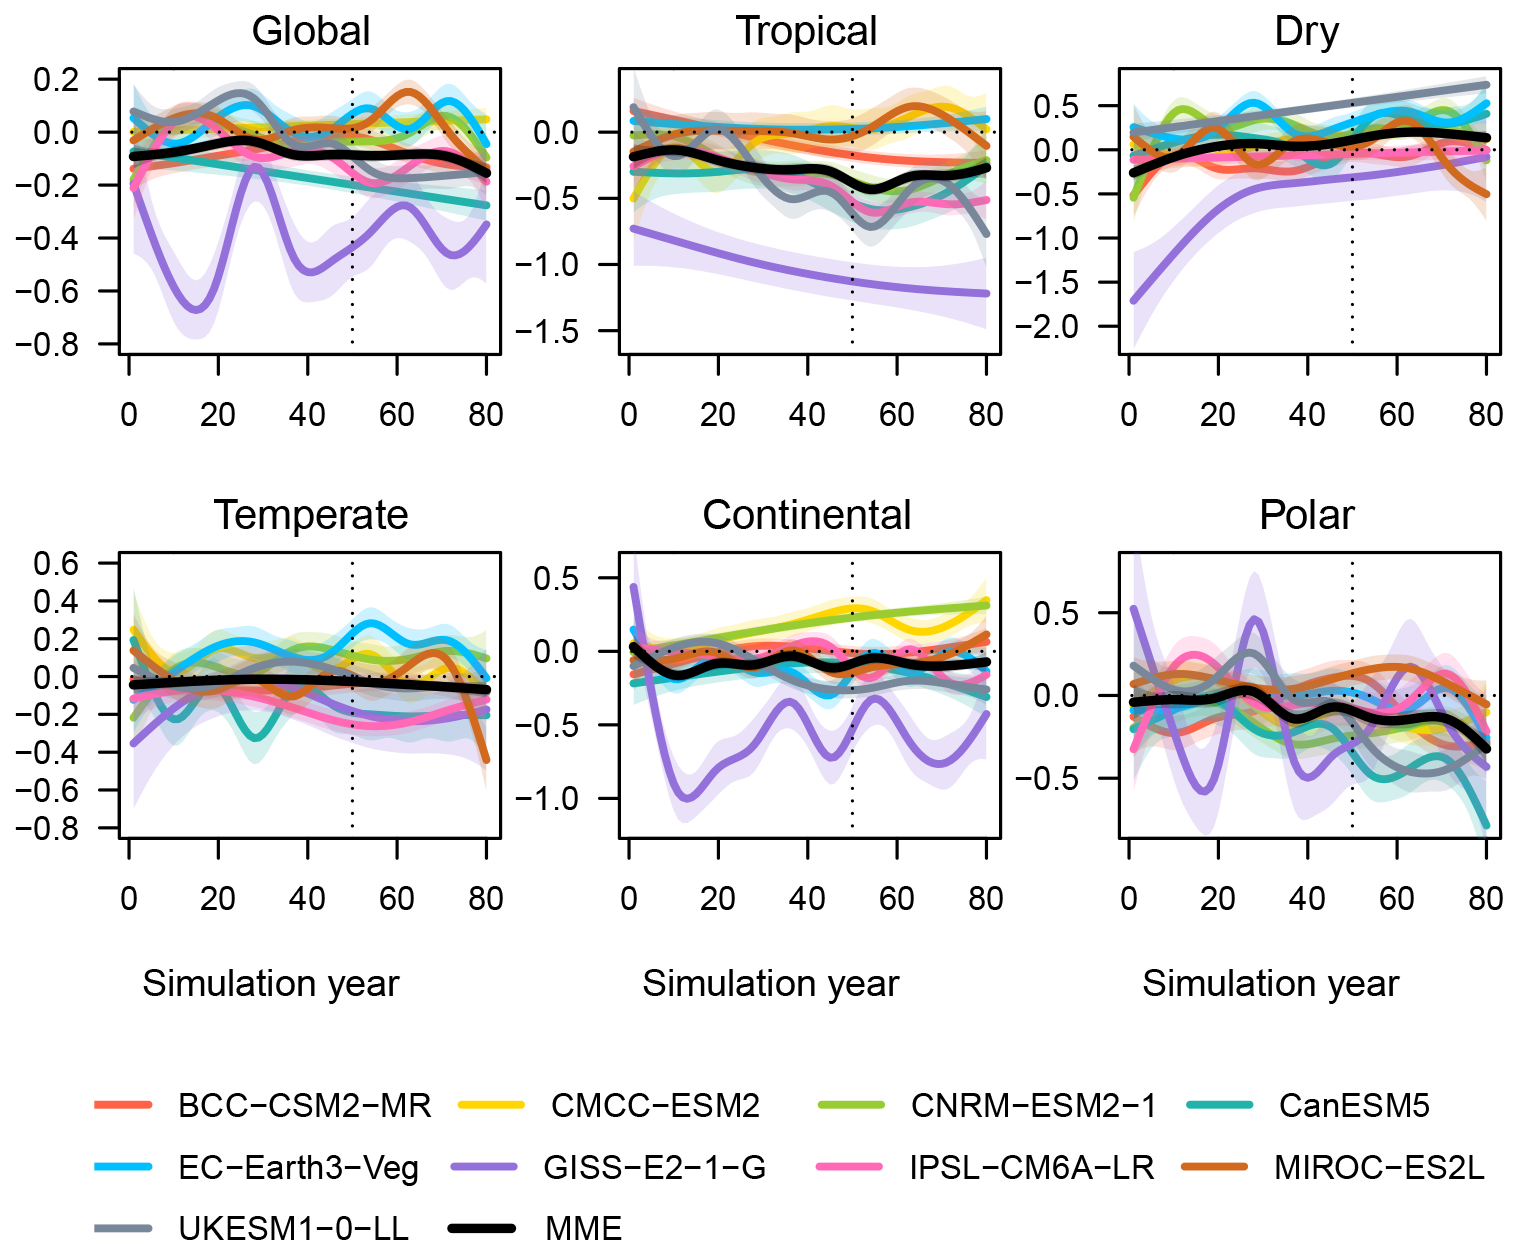
After the main forest is removed, the global mean short-term drought (SPEI03) shows a negative trend for the next 30 years (Fig. 4), with an average value of (mean ± standard deviation) during this period (Table S4 in the Supplement). This negative trend remains relatively constant over the last 30 years. However, our findings show notable variations in the SPEI03 changes across different climate zones. In the tropical region, the SPEI03 time series indicates a significant decrease, with the rate of decline slowing down in the latter 30 years, resulting in a stable average value of (Table S4), and this region experiences the most significant dryness after deforestation. On the other hand, the dry region becomes more humid after global deforestation, with an average SPEI03 change of The temperate, continental, and polar regions all experience negative changes in SPEI03, indicating varying degrees of desiccation. These findings underscore the crucial role of forests in regulating local and global climate patterns, especially in dry regions.
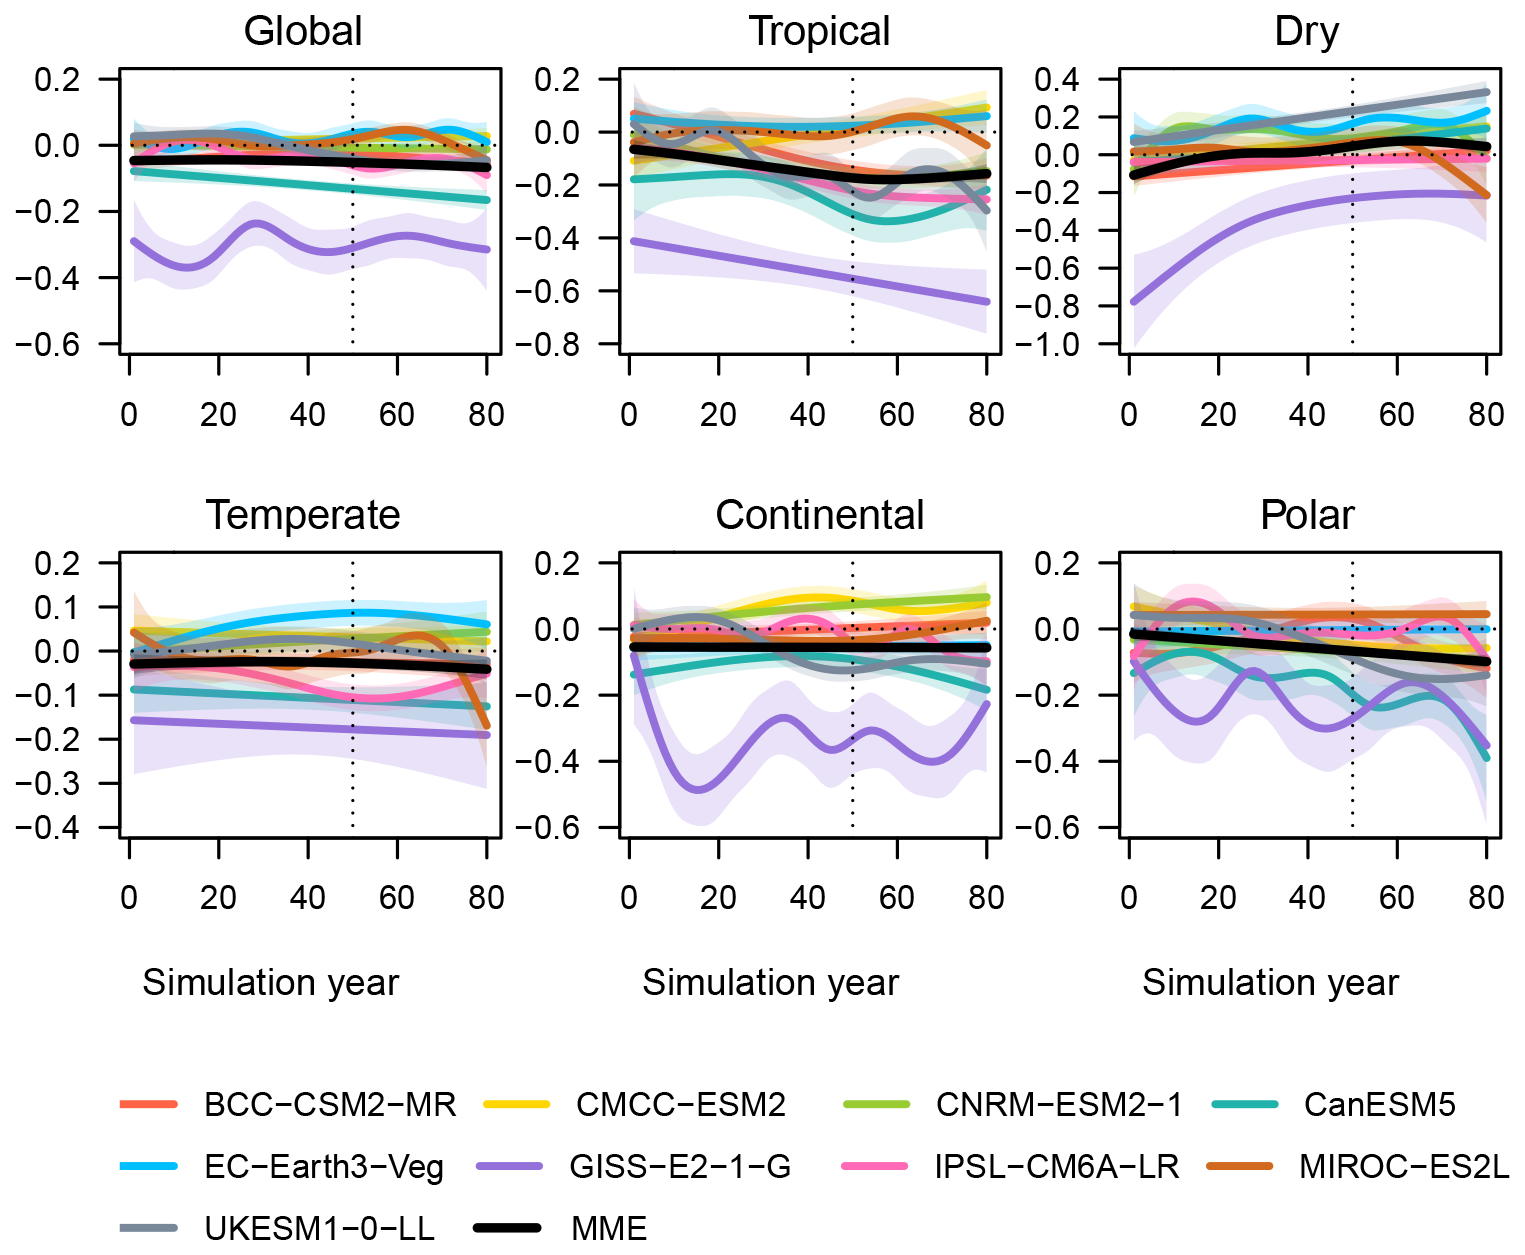
Figure 4Global and regional annually averaged SPEI03 in the deforest-global experiment using piControl as the reference for each model and for the MME. Different colors indicate different models. The solid lines denote cubic spline regression, with significance indicated by shaded areas at a level of 0.05.
The impacts of deforestation on long-term drought (SPEI24) are more severe and have a large magnitude, and these changes are evident globally and regionally (Fig. 5). However, there are differences in the simulation results among individual models. For instance, GISS-E2-1-G predicts the most severe droughts globally, in the tropical, dry, and continental regions, while IPSL-CM6A-LR produces the largest absolute average value for the latter 30 years in the temperate region. Additionally, CanESM5 shows that the polar region most clearly becomes drier after deforestation. These differences highlight the importance of considering multiple models when assessing the impacts of deforestation on droughts, as the specific outcomes may depend on the modeling approach used. The changes in spatial and temporal distribution for each model and the MME in mid-term drought can be observed in Figs. S7 and S9 in the Supplement for SPEI06, while Figs. S8 and S10 in the Supplement showcase the same for SPEI12.
Comprehensive perspective on the spatial variability in global and regional impacts resulting from deforestation on various SPEI indices for the MME is shown in Fig. 6. The analysis shows that large-scale deforestation tends to lead to drier conditions, particularly noticeable in the context of long-term droughts. The tropical region is the most severely affected, followed by the dry, continental, and polar regions. In contrast, the temperate region seems to be the least affected, with a small mean value and large standard deviation (Table S4). For a specific model like GISS-E2-1-G, the most significant changes in drought indices due to large-scale forest removal are observed, barring the polar region (Fig. S11 in the Supplement). Interestingly, in the polar areas, CanESM5 has the most substantial impact. Conversely, MIROC-ES2L demonstrates the slightest change, with a small value and large standard deviation. To our notice, GISS-E2-1-G indicates negative SPEI values in the dry region, which diverge from the results of other models.
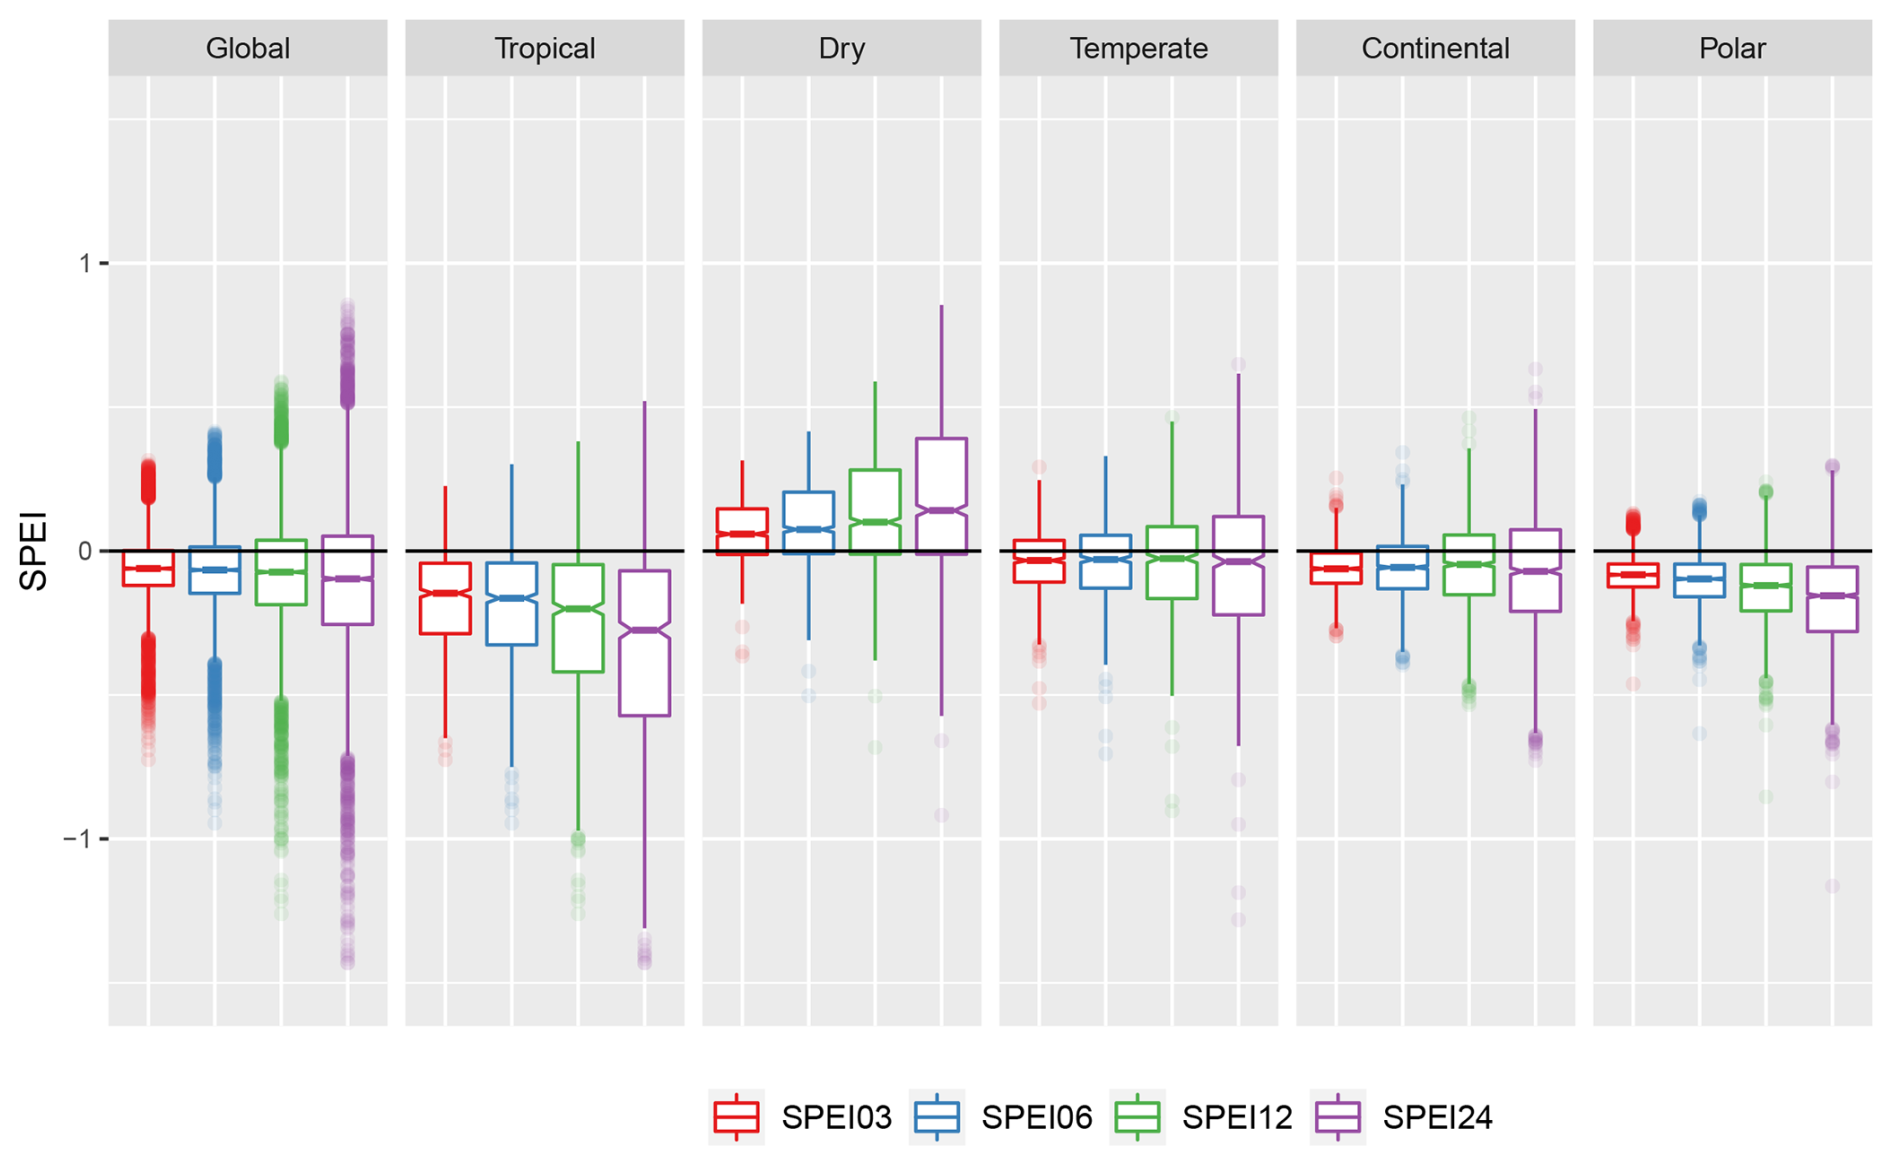
Figure 6Box plots of SPEIs (SPEI03, SPEI06, SPEI12, SPEI24) in the deforestation experiment (deforest-global), with the piControl experiment as the reference, averaged over years 51–80, both globally and for five climate regions, for the MME. Each box plot represents the spatial variability in a specific SPEI, where the box represents the interquartile range (IQR) between the 25th and 75th percentiles and the line inside the box represents the median. The whiskers extend to the minimum and maximum values within 1.5 times the IQR, and any data beyond the whiskers are shown as points. Different colors indicate different SPEIs.
Large-scale deforestation induces a global mean negative change in SPEIs, indicating increased global aridity post-deforestation (Fig. 7). Among the five climate regions, tropical and arid areas appear most susceptible to deforestation. Deforestation within the tropical belt results in a negative SPEI change, signalling heightened aridity in the region. Conversely, deforestation in arid zones yields a positive SPEI change, indicative of increased moisture. Despite its lower deforestation rate (Table S3), the polar region displays a more substantial SPEI change compared to the continental and temperate regions (ranking second and third, respectively, in deforestation within the deforest-global experiment). These findings suggest that the impact of deforestation extends to global climates, especially in regions with relatively uniform ecological compositions, such as arid and polar zones. As the timescale increases, the impact of global forest removal on drought conditions becomes more pronounced, suggesting a greater influence on long-term drought conditions compared to the pre-industrial forest cover (Fig. 7).
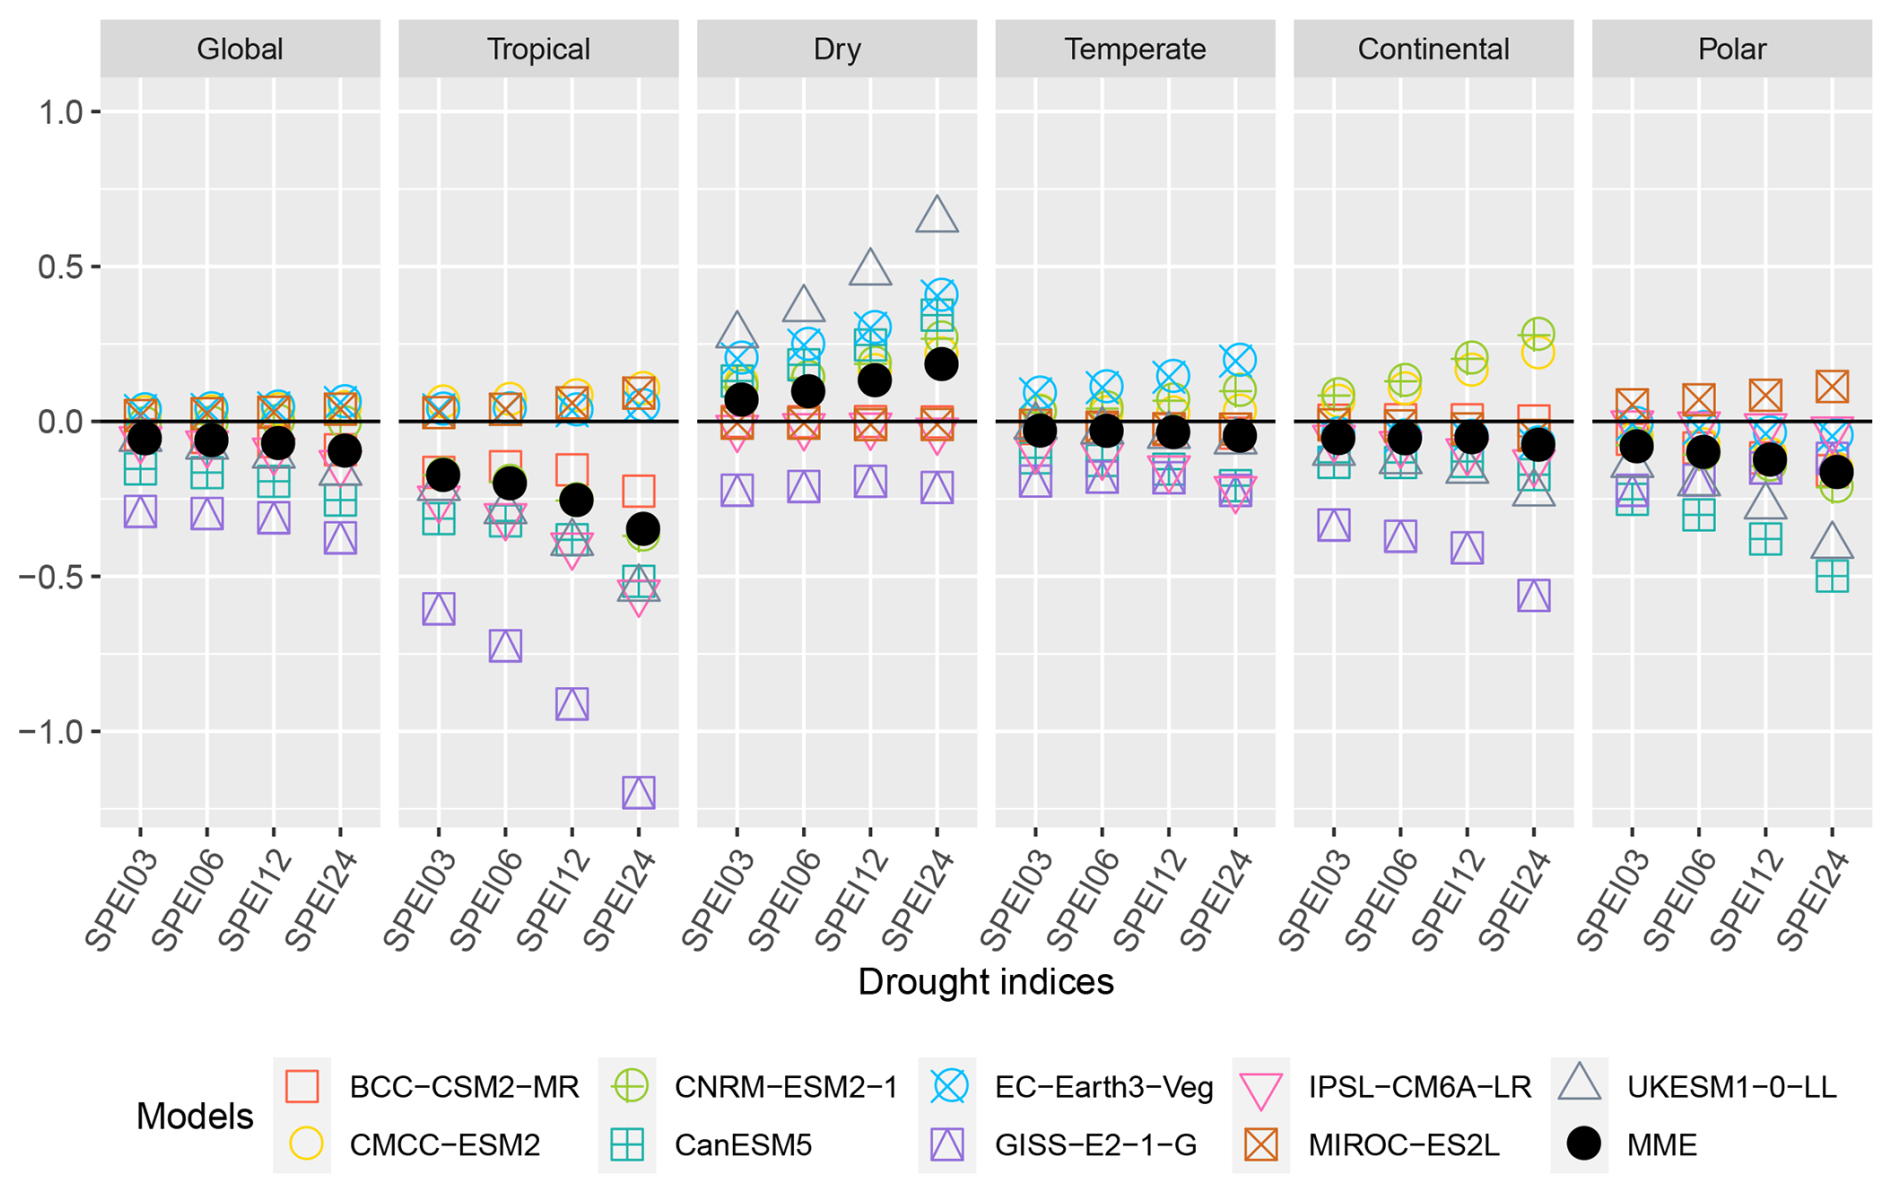
Figure 7Spatial and temporal averages (from year 51 to 80) of SPEIs (SPEI03, SPEI06, SPEI12, and SPEI24) in the deforest-global experiment (piControl experiment as the reference) globally and across five climate regions for each model and the MME. Each model is represented by a different colored marker, while the MME averages are represented by solid black circles.
3.2.2 Analysis of SPEI03 response to deforestation at seasonal scale
The high-latitude regions in northern North America, northern Europe (excluding Greenland), and northern Asia experience more pronounced seasonal changes in SPEI03 following deforestation (Figs. 8 and 9). Specifically, these regions become drier in December–January–February (DJF; Fig. 8) and wetter in June–July–August (JJA; Fig. 9). In contrast, there is no clear seasonal pattern in the SPEI03 variation in the middle and low latitudes, with some variation depending on the latitude. We also observe that SPEI03 becomes negative in the tropical region after deforestation, while, in the dry region in the Northern Hemisphere, it becomes positive, with no significant seasonal variation. Additionally, Figs. S12 and S13 in the Supplement show the March–April–May (MAM) and September–October–November (SON) changes resulting from deforestation during the same period. Overall, our results suggest that deforestation has a significant impact on the seasonal variability in short-term drought, especially in high-latitude regions.
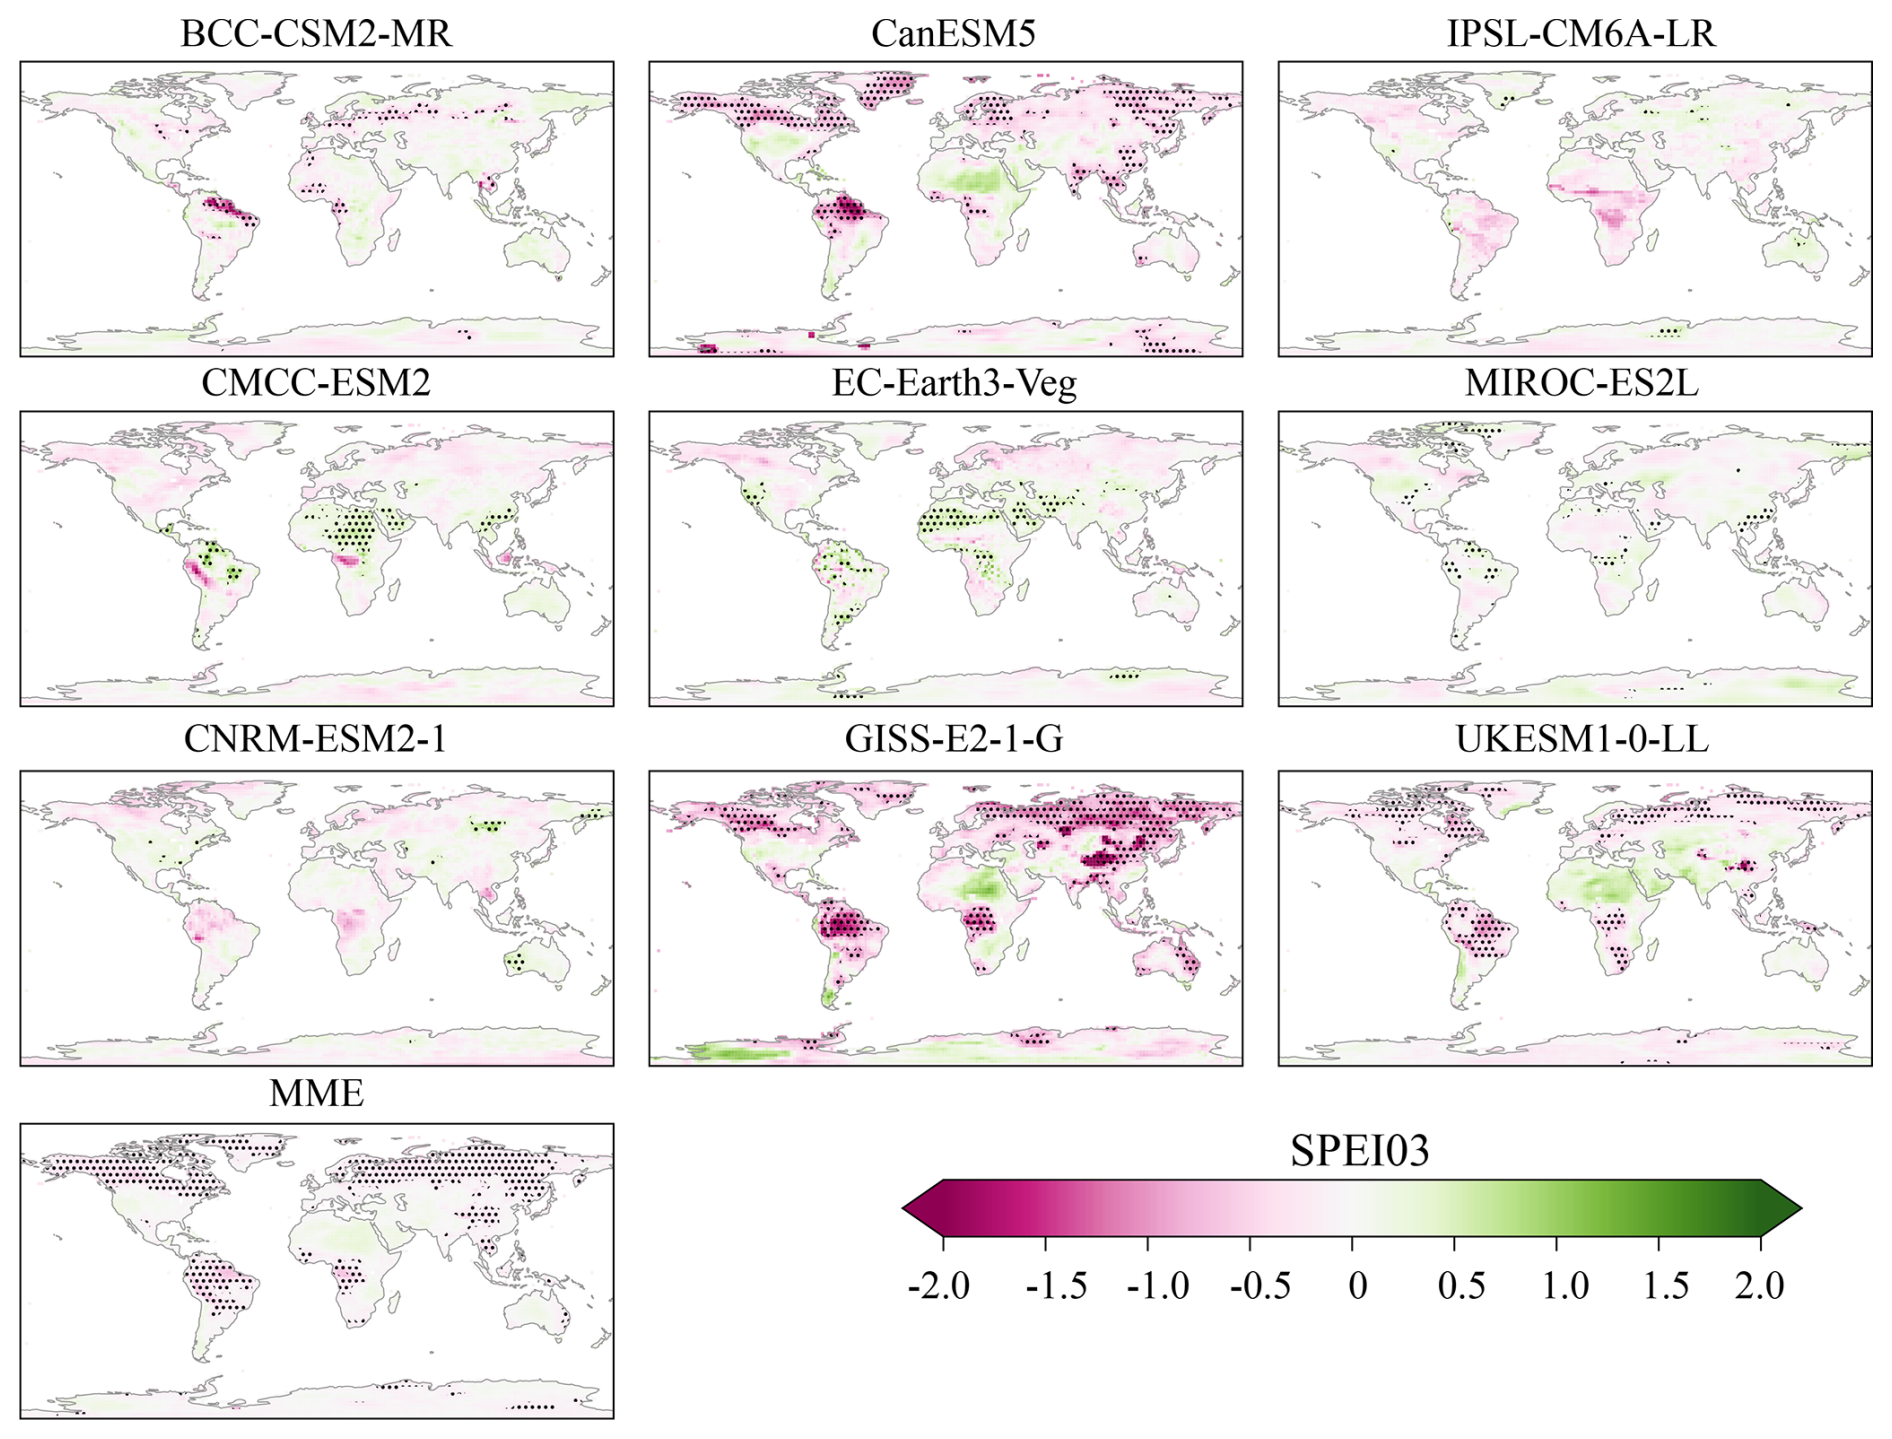
Figure 8SPEI03 in deforest-global (piControl as the reference) during December–January–February (DJF) for nine GCMs and the MME. Positive values signify increased moisture (wet conditions), while negative values denote reduced moisture (dry conditions) relative to the pi-Control experiment. The black dots indicate the changes in SPEI03, with significance tested using a two-tailed t-test at a p value of 0.05.
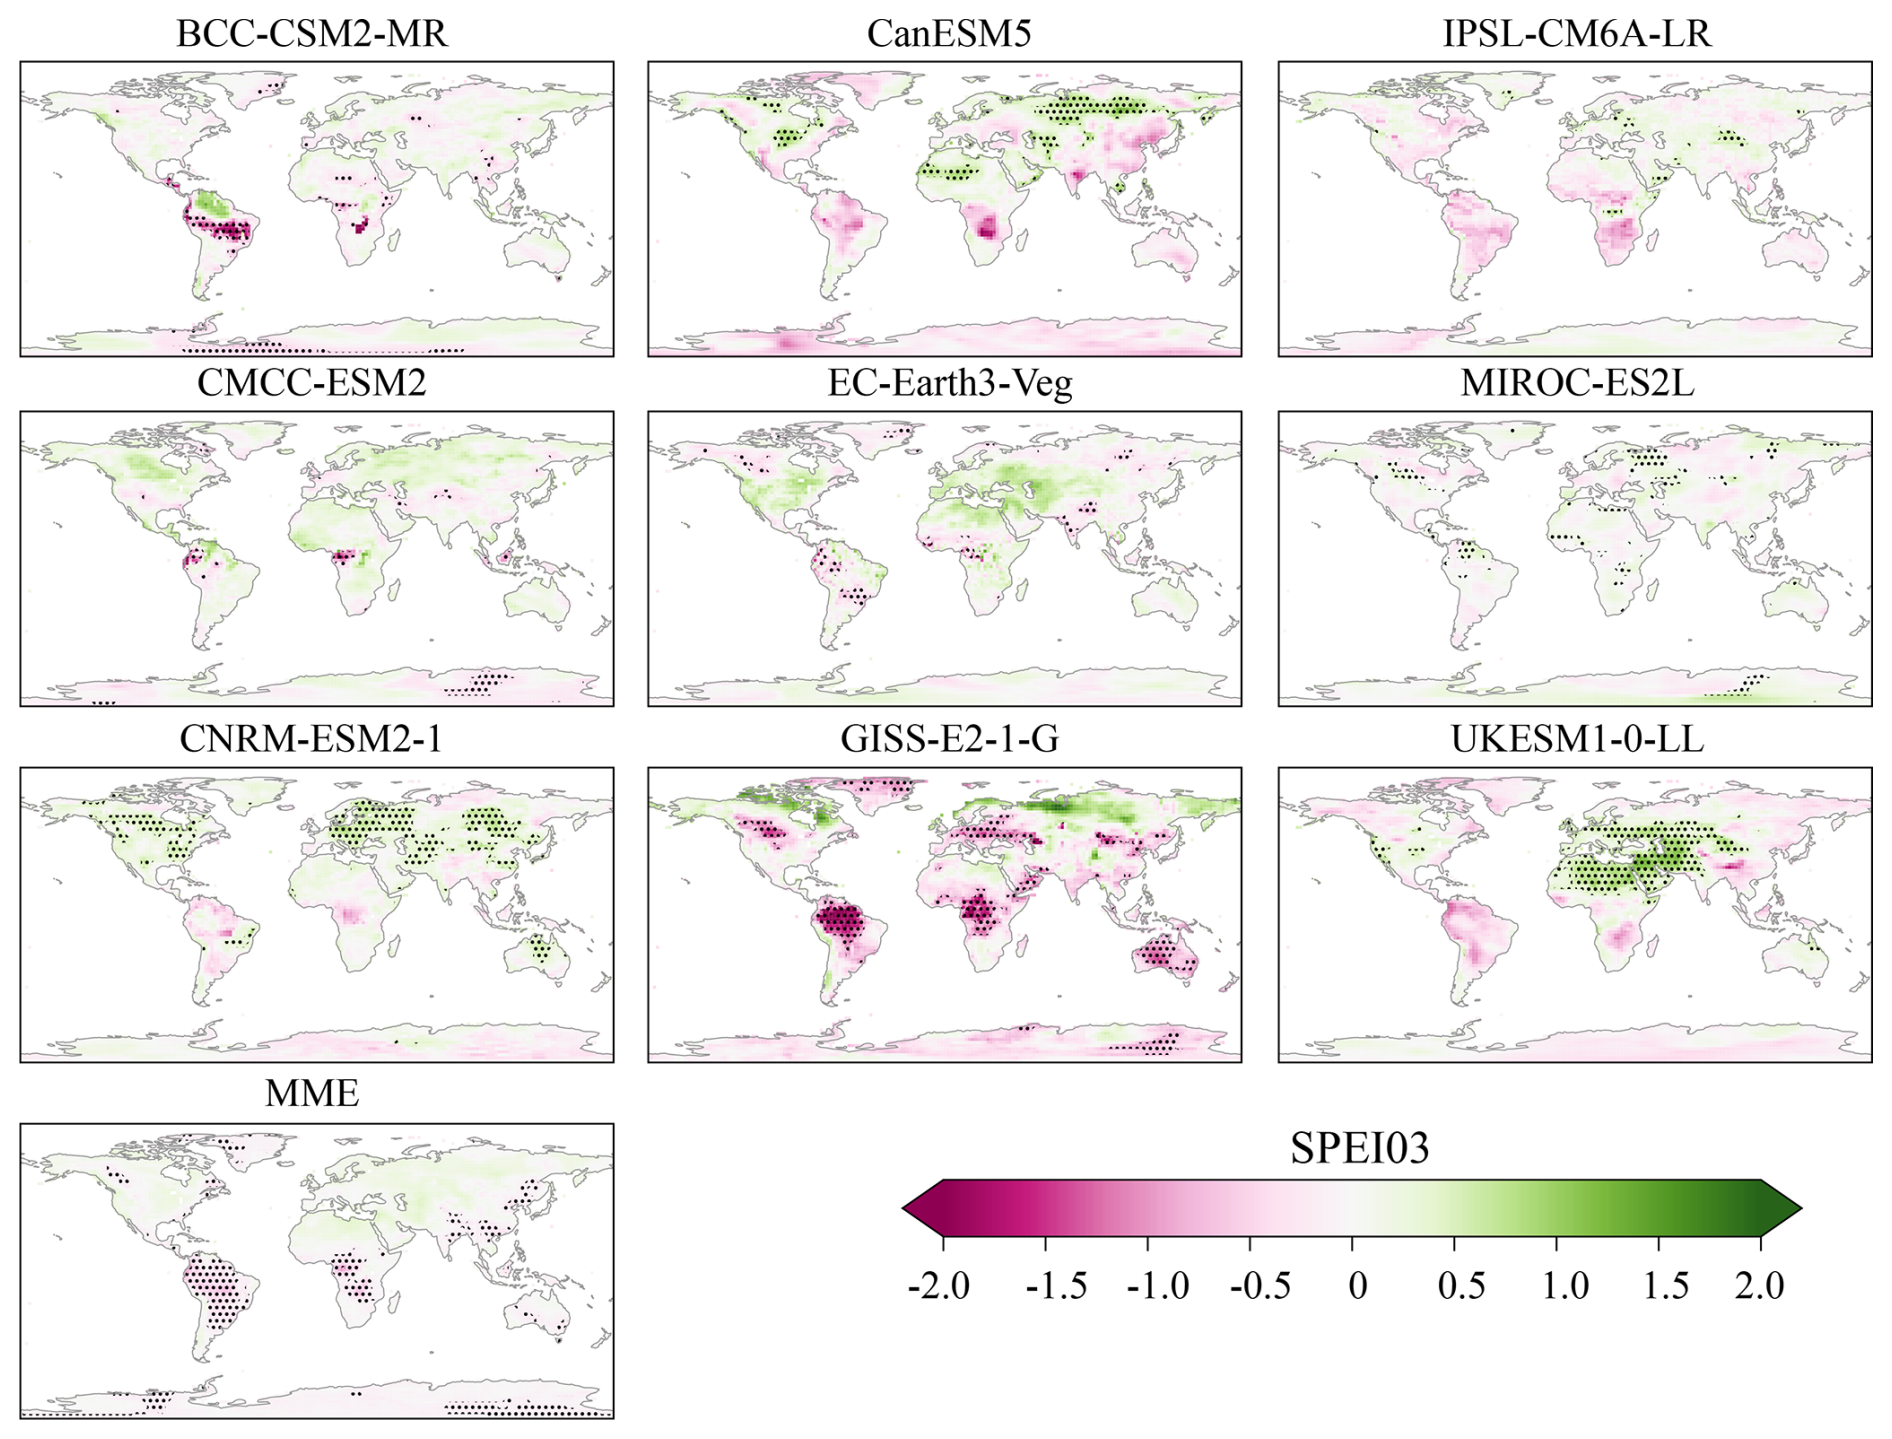
Figure 9Same as Fig. 8 but during June–July–August (JJA).
The impact of deforestation on seasonal changes in SPEI03 varies across models, with some unable to accurately capture the seasonal changes in drought induced by deforestation as seen in the MME. IPSL-CM6A-LR, for example, shows no significant difference in SPEI03 variation between DJF and JJA. Furthermore, simulation results for certain regions in Asia and Europe's high latitudes indicate the opposite result to the MME, with a wetter winter and drier summer. It is worth noting that the regions with the most significant seasonal fluctuations in SPEI03 are mainly located in the continental zone. Therefore, a deeper analysis of the seasonal impact of deforestation on drought in this region is needed.
Deforestation impact on continental drought is most significant during DJF and JJA, with a smaller effect during MAM and SON (Fig. 10). The MME results show negative values for winter SPEI03 time series changes, with an average of . Most models, except for IPSL-CM6A-LR (with an average of 0.00±0.14), can capture the characteristics of a drier-condition tendency in DJF. Similarly, in the Northern Hemisphere summer (JJA), MME and most models (except IPSL-CM6A-LR, with an average of ) indicate positive values. However, in the MAM and SON seasons, the model outputs display a blend of both positive and negative values. In contrast, the MME results are predominantly negative, although to a lesser extent compared to the winter season. More details about the seasonal changes in SPEI03 in different regions are available in Figs. S14–S18 in the Supplement.
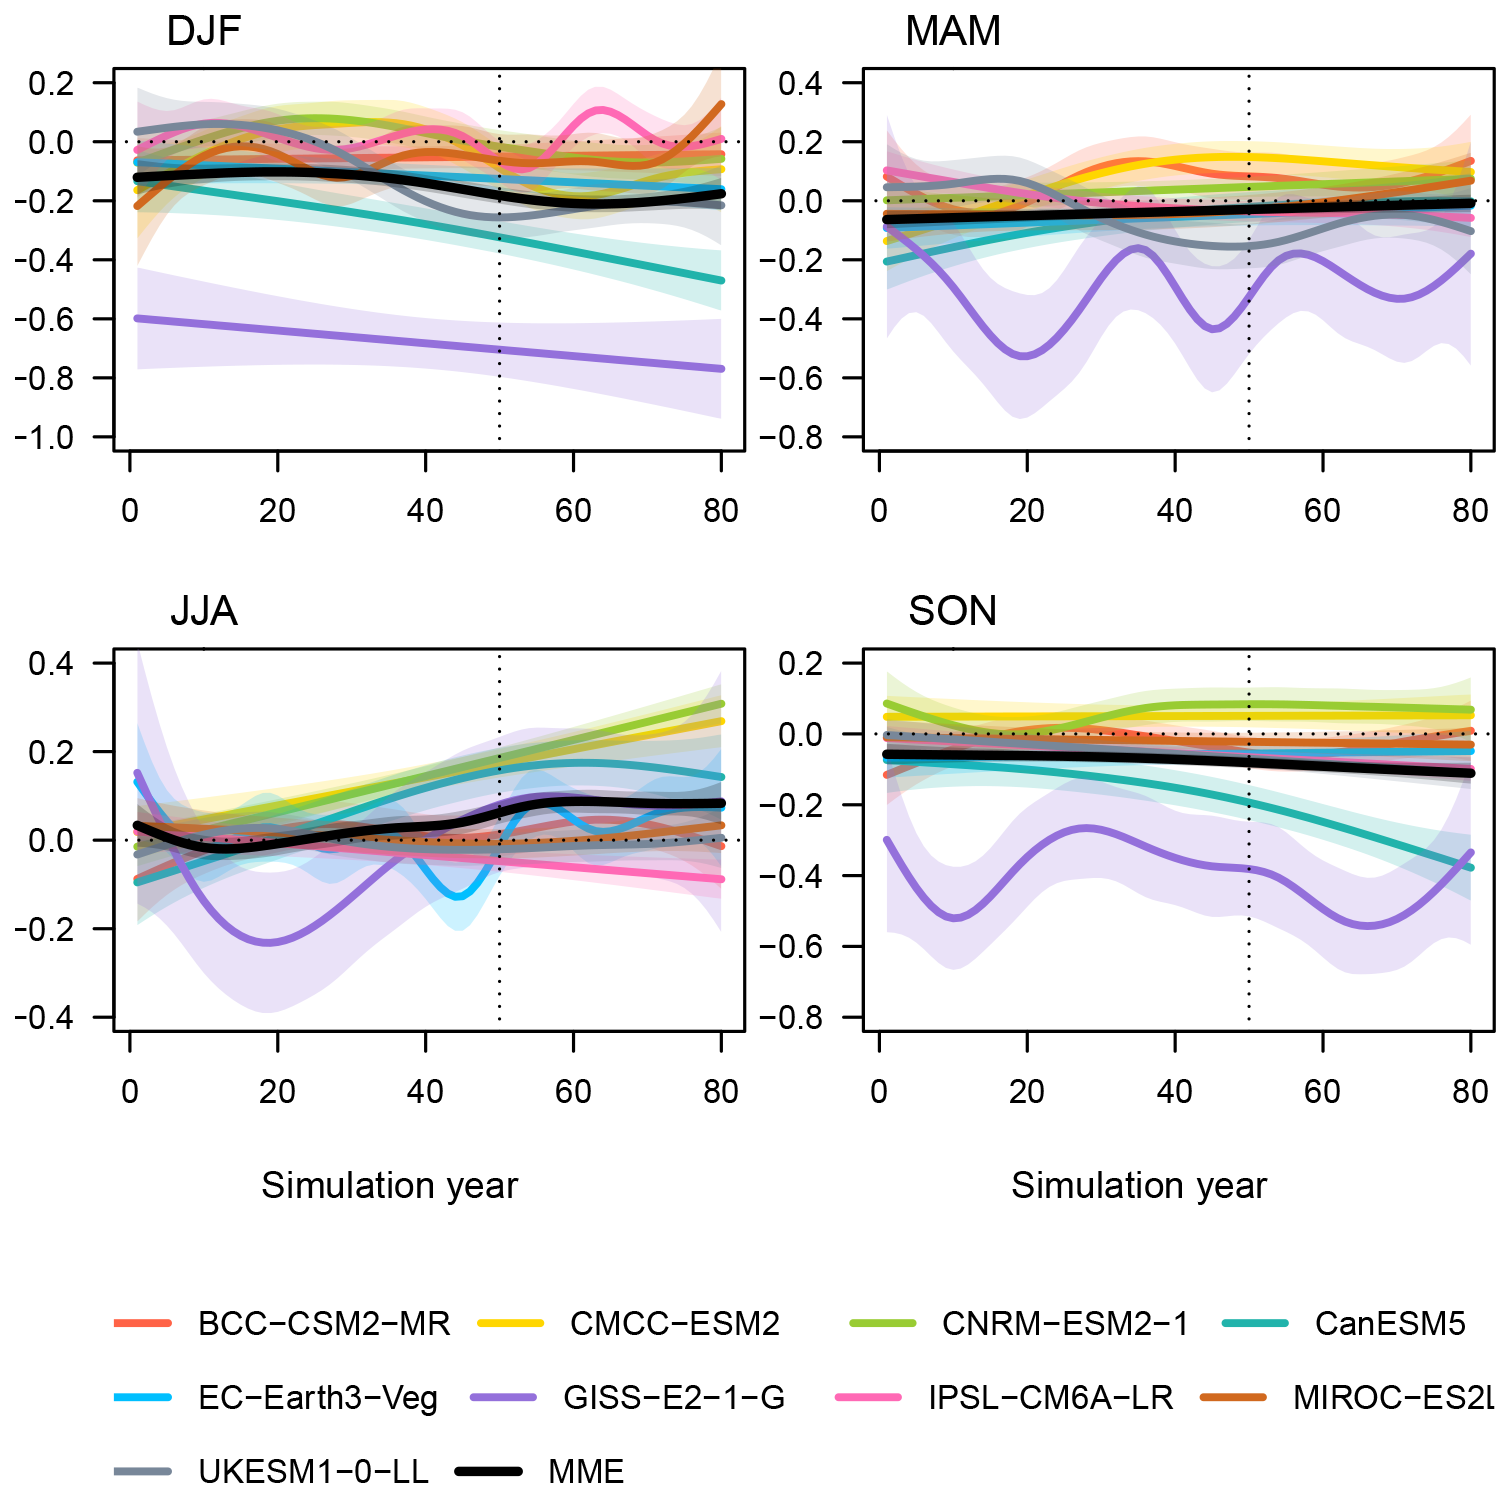
Figure 10Seasonal changes in SPEI03 induced by deforestation averaged in the continental region for each model and the MME. Each model is represented by a different color. The solid lines denote cubic spline regression, with significance indicated by shaded areas at a level of 0.05.
Figure 11 highlights the impact of deforestation on SPEI03 across different regions and seasons. The MME results reveal that deforestation leads to a negative effect on SPEI03 in all seasons, with the most substantial impact observed in the Northern Hemisphere's winter half-year (SON and DJF). In the tropical region, deforestation significantly decreases SPEI03 in all seasons. Conversely, the Dry_n region experiences a positive change in SPEI03 following deforestation, indicating a wetter climate, with the effect being more pronounced in summer and autumn. The Dry_s region, however, does not exhibit any significant change in SPEI03. Notably, the continental region experiences the most significant seasonal change in SPEI03 following deforestation, with a considerable decrease in the Northern Hemisphere's winter and a marked increase in the Northern Hemisphere's summer, indicating that the impact of deforestation differs between the two seasons. These results underscore the region-specific nature of the impact of deforestation on drought, and understanding the seasonal patterns of these changes is crucial for developing effective mitigation and adaptation strategies.
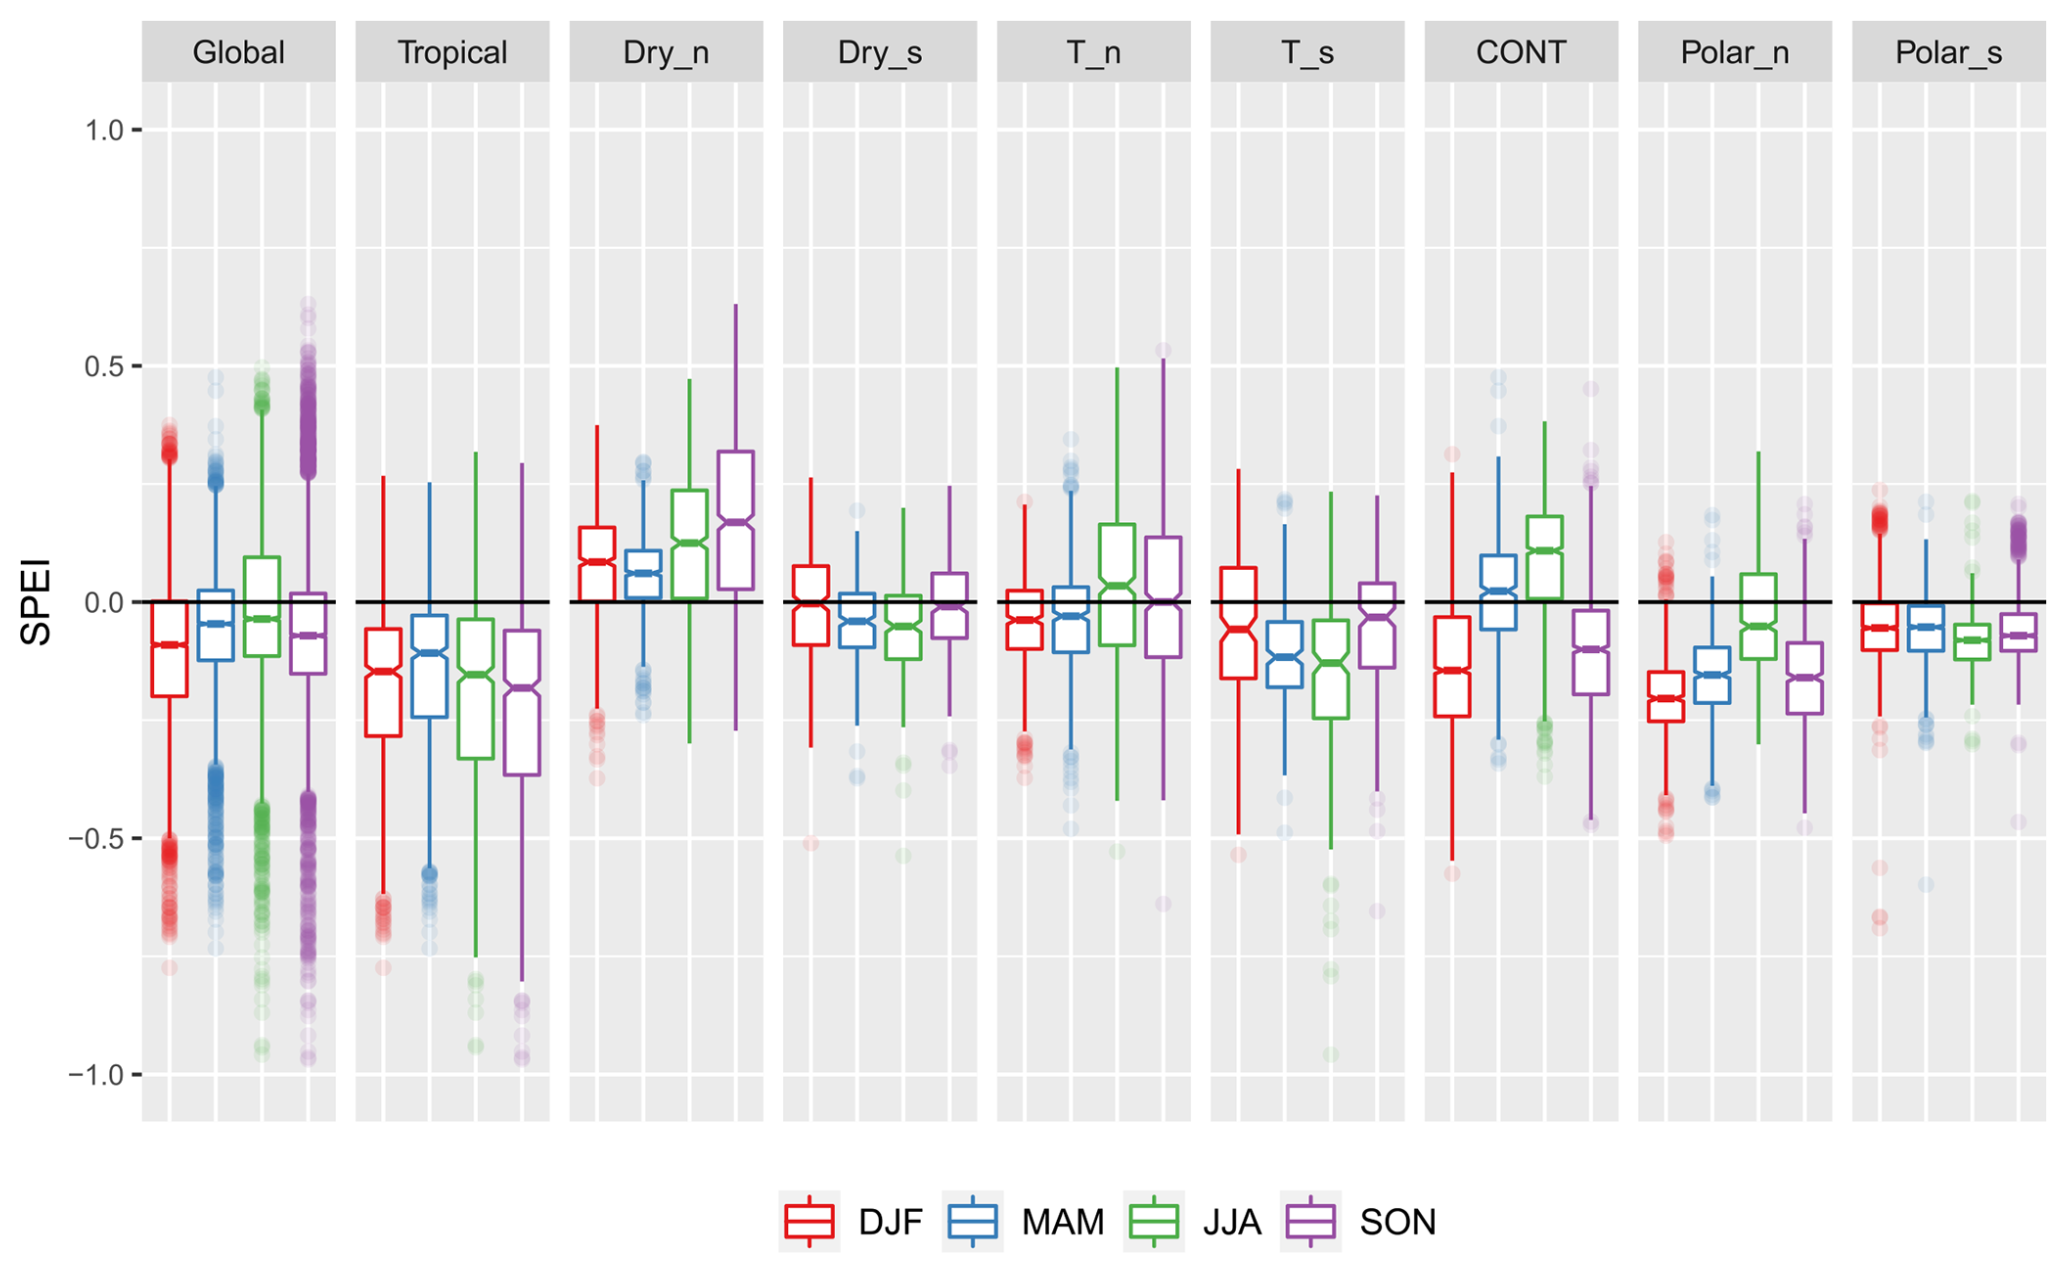
Figure 11Box plots of seasonal (DJF, MAM, JJA, SON) changes in SPEI03 in the deforest-global experiment (piControl experiment as the reference) across different areas (global and eight regions) for the MME. Each box shows the interquartile range (IQR) of the SPEI03 changes within a specific region, with the lower and upper edges corresponding to the 25th (Q1) and 75th (Q3) percentiles, respectively. Outliers are also displayed and defined as values less than Q1-1.5×(IQR) or greater than Q3+1.5×(IQR). Different colors are used to represent different seasons.
The variability in SPEI03 seasonal changes is evident across different regions and models (Fig. S19 in the Supplement). The global region, for instance, presents diverse trends in SPEI03 changes across models. Specifically, while five models (BCC-CSM2-MR, CanESM5, GISS-E2-1-G, IPSL-CM6A-LR, UKESM1-0-LL) indicate an overall decrease in SPEI03 for four seasons, one model (MIROC-ES2L) shows an overall increase in SPEI03 for four seasons, and it suggests that deforestation leads to positive changes in SPEI03 for the tropical and Polar_n regions, which contradicts the conclusions of most models. These results highlight the need to account for the variability across multiple models when interpreting the findings of this study. It is essential to exercise caution when drawing conclusions based on the results of any individual model and consider a more comprehensive approach that accounts for the variability across multiple models.
There is a clear distinction among the models in illustrating the global and regional averaged SPEI03 shifts following deforestation (Fig. 12). Overall, the results show that deforestation leads to a negative shift in average SPEI03 values globally, indicating a drier climate, particularly during the Northern Hemisphere winter and autumn. This trend is consistent in the tropical and Northern Hemisphere polar regions as well. In the continental region, however, the average changes in SPEI03 are negative during DJF and positive during JJA, showing an opposing trend. These findings are in line with the box plots presented in Fig. 11. Furthermore, the comparison among the nine models shows that GISS-E2-1-G is more sensitive to the seasonal effects of deforestation on drought, with results mostly spread in the lower part of the figure (except for the polar region, where CanESM5 shows the most fluctuation in SPEI03). Conversely, the majority of SPEI03 outcomes for EC-Earth3-Veg and CNRM-ESM2-1 are positive, suggesting that the world will become wetter following deforestation.
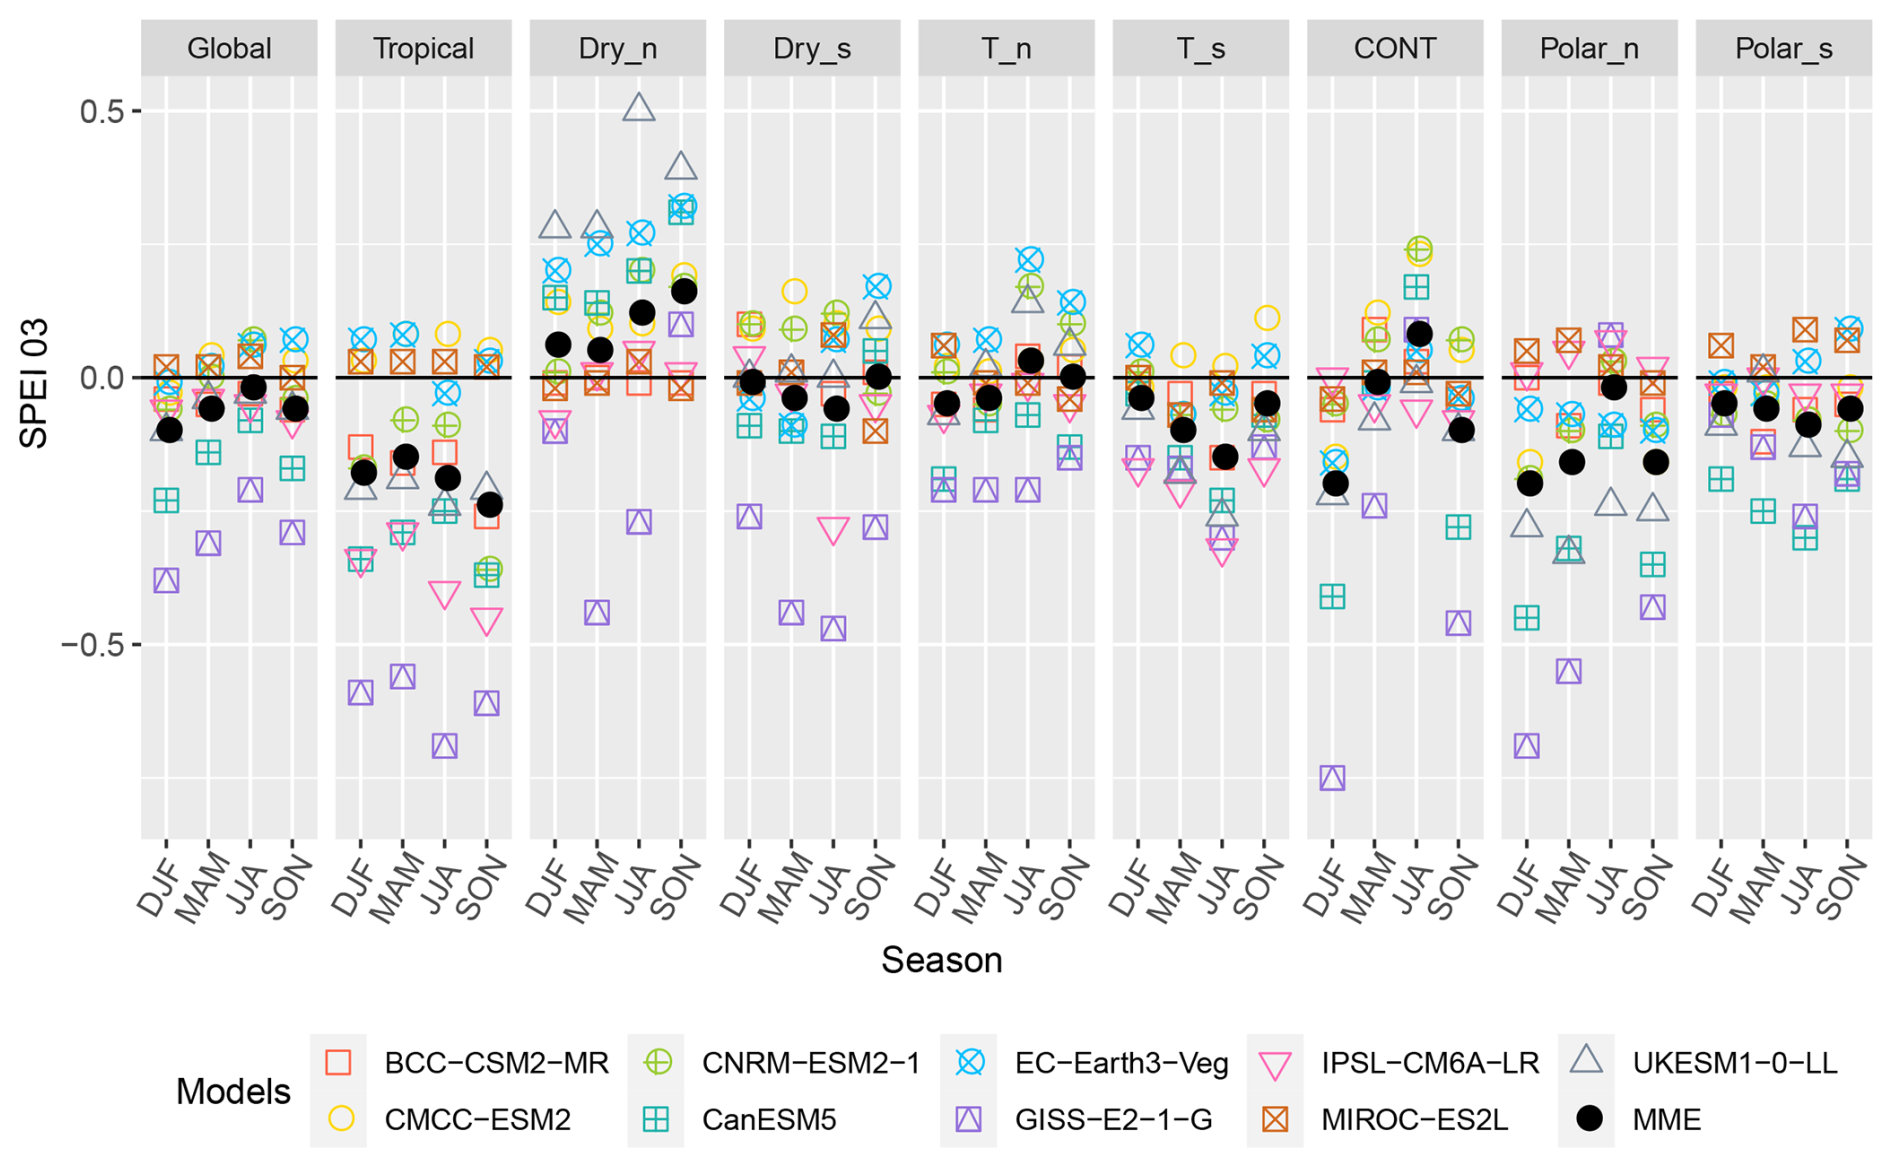
Figure 12Global and climate regional averaged SPEI03 in the deforest-global experiment (piControl as the reference) for each season and model, along with the MME. Each colored marker represents a different model.
In general, the global averaged SPEI03 shifts are more prominent in the boreal autumn and winter seasons following deforestation, which is also observed in both tropical and Northern Hemisphere polar regions. The temperate zone is the least affected by deforestation. Moreover, the continental region experiences the most seasonal change, with a negative SPEI03 (drier) in winter and a positive SPEI03 (wetter) in summer. In line with the previous analysis of annual variability, the Northern Hemisphere dry region is the only area that becomes wetter following deforestation, and this is most noticeable in the autumn season.
In this study, we use idealized deforestation experiments (deforest-global) and pre-industrial control simulation experiments (piControl) conducted by nine global climate models from the LUMIP dataset bank to examine the impacts of global deforestation on droughts across different climate regions and timescales. Model simulations consistently show that deforestation leads to a global decrease in precipitation (Luo et al., 2022), with the most significant reduction occurring in tropical regions (Smith et al., 2023a, b), and causes an average surface cooling (Boysen et al., 2020). Biogeophysical mechanisms such as changes in evapotranspiration and atmospheric moisture convergence play a crucial role in causing changes in precipitation (Zhang et al., 2021), while reduced available energy is primarily responsible for temperature changes (Luo et al., 2022). The effects of deforestation on the climate vary depending on the location, with boreal deforestation primarily increasing albedo and tropical deforestation mainly decreasing evapotranspiration (Chen and Dirmeyer, 2020; Spracklen et al., 2012; Winckler et al., 2019).
Large-scale deforestation can significantly increase the risk of global droughts, as droughts are influenced by various factors such as precipitation, temperature, solar radiation, and wind speed. Deforestation has contrasting effects on cloud cover across different regions: it typically decreases cloud cover in tropical areas while increasing it in dry, temperate, and continental regions (Fig. S20 in the Supplement). This reduction in cloud cover in the tropics is primarily attributed to a decrease in local cloud formation, whereas there is a non-local enhancement of cloud cover in temperate and boreal regions (Duveiller et al., 2021; Hua et al., 2023). The changes in cloud cover induced by deforestation are predominantly driven by sensible heating, with areas of higher sensible heat more likely to experience cloud enhancement, while areas with lower sensible heat tend to see cloud inhibition over forests (Xu et al., 2022). These alterations in cloud cover subsequently influence incoming surface radiation. Meanwhile, the changes in forests also impact on the surface albedo and then on the flux exchange between land surface and atmosphere, which in turn impacts surface potential evapotranspiration. Specifically, deforestation tends to increase potential evapotranspiration in tropical regions while decreasing it in middle to high latitudes, particularly in dry regions (Fig. S21 in the Supplement). Despite these changes, large-scale deforestation typically results in more precipitation in dry regions and less precipitation in tropical regions (Figs. S3 and S6). In tropical regions, deforestation leads to a significant reduction in transpiration, which disrupts water recycling processes and contributes to lower precipitation levels, exacerbating dry conditions (Staal et al., 2020, 2018; Van Der Ent et al., 2014). Conversely, in dry regions, the increase in precipitation and decrease in potential evapotranspiration induced by deforestation often result in wetter conditions. Li et al. (2024) also confirmed that precipitation is the primary factor affecting droughts in the tropical region, while temperature is the primary factor affecting droughts in the dry region. The dry region experiences precipitation deficits and cooling effects after the removal of trees, and the cooling effect could contribute to increased moisture, so global deforestation can potentially mitigate droughts in this region, showcasing the non-local impact of deforestation. In contrast, the temperate and continental regions are the most stable in terms of droughts following deforestation (Li et al., 2024).
Our study also focuses on analyzing the effects of an idealized deforestation scenario on seasonal changes in SPEI03 and finds that the continental zone is most affected through variations in drought. The insights into the possible reasons behind this phenomenon are that deforestation in the continental region has contrasting effects on temperature, causing cooling in winter and spring but warming in summer, as previously reported in other studies (Alkama and Cescatti, 2016; Cherubini et al., 2018). Deforestation increases surface albedo in winter by removing tree cover, which leads to a decrease in the net radiation balance and surface temperature. Conversely, in summer, the reduced evapotranspiration and surface roughness are the primary causes of temperature increases. Additionally, using the CCM3-IBIS coupled atmosphere–biosphere model, Snyder et al. (2004) demonstrated that deforestation leads to a substantial reduction in precipitation in summer () and the least reduction in winter () in the continental region. Removing trees leads to a significant reduction in transpiration, which is particularly pronounced during summer and to a smaller extent in winter (Cai et al., 2019). This reduction may contribute to a situation where there is a greater conflict between reduced precipitation and transpiration during winter compared to summer, which then leads to a drier winter in the continental region. Therefore, we conclude that the combined biogeophysical effects of deforestation in the continental region could explain the wetting effect in summer and the drying effect in winter.
We investigate the influence of global deforestation on regional drought patterns within the five main climate zones as classified by the Köppen–Geiger system. However, it is important to acknowledge that our analysis does not account for sub-climates within these zones. Instead, we focus on determining the average changes in drought for each climate zone, providing a broader assessment. Among the climate zones studied, the dry climate zone, encompassing steppe and desert climates and representing approximately 26 % of the Earth's land area, exhibited heightened vulnerability to changes in drought patterns. Interestingly, our findings indicate that this region is likely to experience reduced drought occurrences following forest removal, primarily due to the non-local effects associated with global deforestation. It is worth noting that the extent of forest replacement with grass was relatively lower within the dry climate zone in our study. To obtain more precise and specific conclusions, it is advisable to further subdivide the climate divisions, enabling a more nuanced analysis. This approach would enhance the accuracy and granularity of our findings, particularly when examining the response of different sub-climates within each climate zone to deforestation-induced changes in drought. Furthermore, our study utilizes models with relatively coarse spatial resolutions, ranging from 0.7°×0.7° to 2.8°×2.8°, depending on the specific model employed. This coarse resolution may have resulted in some loss of information, particularly when investigating regional variations in drought. To address this limitation, future studies could employ higher-resolution models, which would provide a more accurate understanding of how land use changes impact regional drought patterns. For instance, the integration of data from projects such as the Land Use and Climate Across Scales Flagship Pilot Study (LUCAS FPS) could significantly enhance our investigations. LUCAS FPS utilizes regional climate models to quantify the biogeophysical effects of land cover change in specific regions, such as Europe (Davin et al., 2020). Incorporating regional climate models and higher-resolution data would enable a more comprehensive examination of the intricate relationship between land use changes and drought patterns at the regional level. The integration intervals in the LUMIP models range from 15 to 60 min. This variation could affect fast physical processes, such as convection and turbulence, which in turn may influence precipitation patterns and drought responses to deforestation.
Recent observations indicate that changes in dry spells across northeastern South America and western Africa/the Sahel region are primarily influenced by anthropogenic factors (Wainwright et al., 2022). Specifically, the lengthening trend of dry spells in South America is likely linked to deforestation, altering moisture recycling and reducing latent heat flux (Leite et al., 2019). Changes in forest cover, predominantly due to restoration of forest from cropland, have significant local climatic impacts in Europe (Huang et al., 2020). Model simulations reveal that deforestation induces a cooler and drier climate in Europe (Hu et al., 2019; Cherubini et al., 2018). Furthermore, alterations in forests, including activities like forest harvesting, modify various surface attributes such as leaf area index and canopy structure, consequently affecting surface roughness, energy transfer, and solar radiation absorption (Anderson et al., 2011; Huang et al., 2023, 2024). These surface disturbances can potentially influence the general circulation of the atmosphere (Badger and Dirmeyer, 2016). However, the extent of modifications in the general circulation, propelled by changes in forests and their influence on inter-hemispheric heating, particularly impacting the position of the intertropical convergence zone (Frierson et al., 2013; Stephens et al., 2022) and the movement of rainfall belts (Frierson et al., 2013; Dong and Sutton, 2015), remains largely unknown.
This analysis shows a diverse climate response (temperature, precipitation, and SPEIs) resulting from large-scale forest losses. Although these models share a common framework by deforesting the top 30 % grid cells relative to their forested fraction in the piControl land cover (Lawrence et al., 2016), there are variations in defining forest fractions within the piControl stage across models. For instance, IPSL-CM6A-LR utilizes the ORCHIDEE land surface model, representing vegetation heterogeneity with 15 plant functional types (Boucher et al., 2020), while CNRM-ESM2-1, coupled with the ISBA-CTRIP land surface model, incorporates 16 vegetation types (Decharme et al., 2019; Delire et al., 2020). Differences in the spatial pattern of deforestation among models predominantly stem from variations in initial forest cover, ranging from 36 to 66 ×106 km2 (Boysen et al., 2020). This disparity underscores the challenges in implementing consistent land use and cover change scenarios (Di Vittorio et al., 2014). Moreover, these models employ distinct land surface models with varying approaches to vegetation phenology and carbon cycle, further influencing the climate response to deforestation (Boysen et al., 2020). For example, the terrestrial biogeochemical processes in CMCC-ESM2 are represented by the Community Land Model version 4.5 (CLM4.5) in its biogeochemical configuration, including key processes concerning global carbon and nitrogen cycles (Oleson et al., 2013; Koven et al., 2013). Photosynthesis descriptions vary among plant types, with C3 plants (Farquhar et al., 1980) and C4 plants (Collatz et al., 1992). These methods differ in leaf-level parameterization of carboxylation and limiting factors. The resulting photosynthate is allocated into various vegetation carbon pools, and the transfer of carbon into litter–soil pools follows a dynamic cascade (Parton et al., 1988). EC-Earth-veg employs the LPJ-GUESS land surface model to simulate vegetation dynamics, management, land use, and terrestrial carbon and nitrogen cycles, and it incorporates six stand types (natural, pasture, urban, crop, irrigated crop, and peatland). LPJ-GUESS features competition among plant functional types within each stand type, with tree establishment disabled in deforested areas, leaving only herbaceous PFTs in competition. The model represents global carbon and nitrogen cycles within vegetation, litter, and soil organic matter pools, influencing soil biogeochemistry, CO2 fluxes, and nitrogen trace gas emissions. In addition, UKESM1-0-LL continues the removal of forest cover after year 50, which may result in varying responses in specific regions. For example, a more significant climate response occurs in dry regions where there is less forest loss. The distinct variations in vegetation phenology and structures across models will also influence aerodynamic resistance following forest replacement, thereby significantly contributing to changes in surface temperature (Liu et al., 2023). These temperature changes can subsequently impact potential evapotranspiration and, consequently, drought conditions.
Considering the wide-ranging initial forest cover and the distinct land surface models used, a comprehensive approach involving multi-model simulations from LUMIP is essential for a more accurate assessment the drought condition response to large-scale deforestation. This approach provides a more comprehensive understanding of the realistic climate effects associated with large-scale deforestation. However, due to differences in the implementation of initial land cover, the representation of vegetation phenology, the parameterization of albedo, and the treatment of evapotranspiration across land cover types, multi-model analyses may introduce significant variation and uncertainties in the climate response to land cover change (Pitman et al., 2009; Boysen et al., 2020). Most LUMIP models released only a single simulation, limiting the ability to assess uncertainties in climate responses to large-scale deforestation due to the lack of large ensemble members. This presents a challenge in evaluating the impact of inter-model variability on drought conditions driven by deforestation. A single model with multiple realizations has the potential to provide a more robust estimate of climate responses to deforestation. Notably, MPI-ESM1-2-LR includes seven ensemble members that contribute to LUMIP. However, some key variables necessary for calculating the SPEI are missing from the available data, preventing their use in this study. Future researchers working on related topics could leverage these larger ensemble members to improve estimates of climate responses to deforestation.
Changes in land cover can significantly alter local surface water and energy balances, which can have teleconnection effects that influence other regions through modifications in the planetary boundary layer (Zhao et al., 2001). These changes can subsequently impact the position and strength of general circulation patterns, such as the Walker and Hadley circulations, via mesoscale wind circulation (Mahmood et al., 2014; Portmann et al., 2022). However, the extent of these modifications in general circulation strength varies depending on the model used (Pielke et al., 2011). The response of the SPEI to large-scale deforestation also demonstrates these teleconnection effects. For instance, some regions, like Antarctica, may not experience forest cover changes but still show significant SPEI variations. Notably, this teleconnection effect is pronounced in some models, such as CanESM5, GISS-E2-1-G, and UKESM1-0-LL, while it remains relatively weak in others. In this paper, we focus on the combined effects of local and non-local effects of deforestation, and, in the future, we can further analyze the different responses (local and non-local) to deforestation and the weight of the different responses in each region. Here, we have only analyzed the effect of deforestation on the magnitude of the drought, but we can also analyze the effect on the onset, termination, and duration of the drought. Future research also could consider incorporating other factors that may influence the response of drought to deforestation, such as soil characteristics, topography, and vegetation type. It would be interesting to investigate the potential feedback mechanisms between the changes in climate and the resulting changes in vegetation cover and the impacts of deforestation on other hydrological processes, such as runoff and groundwater recharge. Lastly, further research can be conducted to assess the economic and social impacts of deforestation-induced drought and to explore potential mitigation and adaptation strategies for vulnerable regions.
This study extensively investigates the impact of deforestation on droughts at various timescales (SPEI03, SPEI06, SPEI12, SPEI24) across different climate regions (tropical, dry, temperate, continental, and polar regions). We accomplish this by utilizing simulations from nine models in the pre-industrial control simulation (piControl) of CMIP6 and the LUMIP global deforestation experiment (deforest-global). Based on our analysis of the results, we draw the following conclusions about the effects of deforestation on droughts in different climate regions:
-
The LUMIP global deforestation experiment was conducted with the same framework requirements. Deforestation primarily occurs in tropical, temperate, and continental regions. This is because the experimental setup involved deforestation in the grid where the forest area was among the top 30 % largest, meaning that the most heavily forested areas were selected for deforestation. The results of the experiment indicate that deforestation on a global scale can significantly alter precipitation and temperature patterns. Tree removal caused a considerable reduction in temperature over the land, particularly in the continental regions, while also resulting in a decrease in global and regional precipitation. The tropical regions are the most affected by this reduction in precipitation.
-
The analysis reveals that deforestation leads to negative changes in the global average of SPEIs, resulting in drier conditions. This trend is most pronounced in the tropical region. However, in the dry region, deforestation results in increased SPEIs. In the temperate and continental regions, which are major global forest belts, deforestation has a relatively limited impact. Moreover, our findings indicate that the effect of deforestation on drought indices increases with longer timescales, suggesting that deforestation has a more significant impact on the long-term drought index.
-
At the seasonal scale, global average SPEI03 changes are more significant in autumn and winter following deforestation. This trend is also detected in tropical and northern polar regions, while the Northern Hemisphere temperate zone is the least affected. The continental region experiences the most significant seasonal changes, becoming drier in winter and wetter in summer due to global deforestation. In the dry Northern Hemisphere region, deforestation leads to increased atmospheric moisture, which is most evident in autumn.
In summary, this study provides valuable insights into the impact of large-scale deforestation on global and regional droughts across different timescales, which serves as a starting point for further exploration of the complex relationships between land cover change and climate. In terms of climate mitigation, forest management policies should account for regional differences. Changes in forests within tropical and dry regions can significantly affect local drought conditions. Deforestation in tropical regions often leads to a drier climate, potentially causing water shortages. Afforestation is highly recommended in tropical regions. Conversely, deforestation in dry regions can result in a wetter climate. Therefore, afforestation is not recommended in dry areas. Overall, our study could inform the development of climate-oriented land use policies and increase our understanding of the regional and global climate impacts of land cover change. Further research in this field could ultimately help us to mitigate the negative effects of land use change on the environment and society.
The simulations of the CMIP6 piControl experiment and the LUMIP deforest-global experiment are available at https://esgf-node.llnl.gov/search/cmip6/ (ESGF, 2025). More information is shown in detail in Table S2. The statistical analysis primarily relies on the stats package in R (https://www.r-project.org/, R Core Team, 2022). R codes and all the datasets produced during this study are available upon request.
The supplement related to this article is available online at https://doi.org/10.5194/hess-29-1637-2025-supplement.
The research was conceptualized and designed by YL, BH, and HWR. BH was responsible for downloading and initially processing the data. YL and BH conducted data analysis and generated the figures. YL drafted the initial version of the paper. All authors participated in the interpretation of results and contributed to writing the final paper.
The contact author has declared that none of the authors has any competing interests.
Publisher's note: Copernicus Publications remains neutral with regard to jurisdictional claims made in the text, published maps, institutional affiliations, or any other geographical representation in this paper. While Copernicus Publications makes every effort to include appropriate place names, the final responsibility lies with the authors.
This article is part of the special issue “Drought, society, and ecosystems (NHESS/BG/GC/HESS inter-journal SI)”. It is not associated with a conference.
Yan Li gratefully acknowledges the support provided by the China Scholarship Council (CSC). The authors would also like to extend their appreciation to the CMIP6 LUMIP modeling group and ESGF for providing access to the available CMIP6 data.
This research has been supported by the Norges Forskningsråd (grant nos. 286773 and 294534), the National Natural Science Foundation of China (grant no. 42201085), and the Science and Technology Department of Sichuan Province (grant no. 2023YFQ0105).
This paper was edited by Khalid Hassaballah and reviewed by Wenjian Hua and two anonymous referees.
Alkama, R. and Cescatti, A.: Biophysical climate impacts of recent changes in global forest cover, Science, 351, 600–604, https://doi.org/10.1126/science.aac8083, 2016.
Allen, R. G., Pereira, L. S., Raes, D., and Smith, M.: Crop evapotranspiration-Guidelines for computing crop water requirements-FAO Irrigation and drainage paper 56, Fao, Rome, 300, D05109, ISBN 92-5-104219-5, 1998.
Anderson, R. G., Canadell, J. G., Randerson, J. T., Jackson, R. B., Hungate, B. A., Baldocchi, D. D., Ban-Weiss, G. A., Bonan, G. B., Caldeira, K., Cao, L., Diffenbaugh, N. S., Gurney, K. R., Kueppers, L. M., Law, B. E., Luyssaert, S., and O'Halloran, T. L.: Biophysical considerations in forestry for climate protection, Front. Ecol. Environ., 9, 174–182, https://doi.org/10.1890/090179, 2011.
Badger, A. M. and Dirmeyer, P. A.: Remote tropical and sub-tropical responses to Amazon deforestation, Clim. Dynam., 46, 3057–3066, https://doi.org/10.1007/s00382-015-2752-5, 2016.
Bagley, J. E., Desai, A. R., Harding, K. J., Snyder, P. K., and Foley, J. A.: Drought and Deforestation: Has Land Cover Change Influenced Recent Precipitation Extremes in the Amazon?, J. Climate, 27, 345–361, https://doi.org/10.1175/jcli-d-12-00369.1, 2014.
Bala, G., Caldeira, K., Wickett, M., Phillips, T. J., Lobell, D. B., Delire, C., and Mirin, A.: Combined climate and carbon-cycle effects of large-scale deforestation, P. Natl. Acad. Sci. USA, 104, 6550–6555, https://doi.org/10.1073/pnas.0608998104, 2007.
Balaji, V., Taylor, K. E., Juckes, M., Lawrence, B. N., Durack, P. J., Lautenschlager, M., Blanton, C., Cinquini, L., Denvil, S., Elkington, M., Guglielmo, F., Guilyardi, E., Hassell, D., Kharin, S., Kindermann, S., Nikonov, S., Radhakrishnan, A., Stockhause, M., Weigel, T., and Williams, D.: Requirements for a global data infrastructure in support of CMIP6, Geosci. Model Dev., 11, 3659–3680, https://doi.org/10.5194/gmd-11-3659-2018, 2018.
Beck, H. E., Zimmermann, N. E., McVicar, T. R., Vergopolan, N., Berg, A., and Wood, E. F.: Present and future Koppen-Geiger climate classification maps at 1 km resolution, Sci. Data, 5, 180214, https://doi.org/10.1038/sdata.2018.214, 2018.
Bonan, G. B.: Forests and climate change: forcings, feedbacks, and the climate benefits of forests, Science, 320, 1444–1449, https://doi.org/10.1126/science.1155121, 2008.
Boucher, O., Servonnat, J., Albright, A. L., Aumont, O., Balkanski, Y., Bastrikov, V., Bekki, S., Bonnet, R., Bony, S., Bopp, L., Braconnot, P., Brockmann, P., Cadule, P., Caubel, A., Cheruy, F., Codron, F., Cozic, A., Cugnet, D., D'Andrea, F., Davini, P., de Lavergne, C., Denvil, S., Deshayes, J., Devilliers, M., Ducharne, A., Dufresne, J. L., Dupont, E., Éthé, C., Fairhead, L., Falletti, L., Flavoni, S., Foujols, M. A., Gardoll, S., Gastineau, G., Ghattas, J., Grandpeix, J. Y., Guenet, B., Guez, L. E., Guilyardi, E., Guimberteau, M., Hauglustaine, D., Hourdin, F., Idelkadi, A., Joussaume, S., Kageyama, M., Khodri, M., Krinner, G., Lebas, N., Levavasseur, G., Lévy, C., Li, L., Lott, F., Lurton, T., Luyssaert, S., Madec, G., Madeleine, J. B., Maignan, F., Marchand, M., Marti, O., Mellul, L., Meurdesoif, Y., Mignot, J., Musat, I., Ottlé, C., Peylin, P., Planton, Y., Polcher, J., Rio, C., Rochetin, N., Rousset, C., Sepulchre, P., Sima, A., Swingedouw, D., Thiéblemont, R., Traore, A. K., Vancoppenolle, M., Vial, J., Vialard, J., Viovy, N., and Vuichard, N.: Presentation and Evaluation of the IPSL-CM6A-LR Climate Model, J. Adv. Model. Earth Sy., 12, e2019MS002010, https://doi.org/10.1029/2019MS002010, 2020.
Boysen, L. R., Brovkin, V., Pongratz, J., Lawrence, D. M., Lawrence, P., Vuichard, N., Peylin, P., Liddicoat, S., Hajima, T., Zhang, Y., Rocher, M., Delire, C., Séférian, R., Arora, V. K., Nieradzik, L., Anthoni, P., Thiery, W., Laguë, M. M., Lawrence, D., and Lo, M.-H.: Global climate response to idealized deforestation in CMIP6 models, Biogeosciences, 17, 5615–5638, https://doi.org/10.5194/bg-17-5615-2020, 2020.
Cai, X. T., Riley, W. J., Zhu, Q., Tang, J. Y., Zeng, Z. Z., Bisht, G., and Randerson, J. T.: Improving Representation of Deforestation Effects on Evapotranspiration in the E3SM Land Model, J. Adv. Model. Earth Sy., 11, 2412–2427, https://doi.org/10.1029/2018ms001551, 2019.
Ceccherini, G., Duveiller, G., Grassi, G., Lemoine, G., Avitabile, V., Pilli, R., and Cescatti, A.: Abrupt increase in harvested forest area over Europe after 2015, Nature, 583, 72–77, https://doi.org/10.1038/s41586-020-2438-y, 2020.
Chen, L. and Dirmeyer, P. A.: Reconciling the disagreement between observed and simulated temperature responses to deforestation, Nat. Commun., 11, 202, https://doi.org/10.1038/s41467-019-14017-0, 2020.
Cherubini, F., Huang, B., Hu, X. P., Tölle, M. H., and Stromman, A. H.: Quantifying the climate response to extreme land cover changes in Europe with a regional model, Environ. Res. Lett., 13, 074002, https://doi.org/10.1088/1748-9326/aac794, 2018.
Collatz, G. J., Ribas-Carbo, M., and Berry, J. A.: Coupled Photosynthesis-Stomatal Conductance Model for Leaves of C4 Plants, Aust. J. Plant Physiol., 19, 519–538, https://doi.org/10.1071/Pp9920519, 1992.
Crompton, O., Corrêa, D., Duncan, J., and Thompson, S.: Deforestation-induced surface warming is influenced by the fragmentation and spatial extent of forest loss in Maritime Southeast Asia, Environ. Res. Lett., 16, 114018 https://doi.org/10.1088/1748-9326/ac2fdc, 2021.
Crowther, T. W., Glick, H. B., Covey, K. R., Bettigole, C., Maynard, D. S., Thomas, S. M., Smith, J. R., Hintler, G., Duguid, M. C., Amatulli, G., Tuanmu, M. N., Jetz, W., Salas, C., Stam, C., Piotto, D., Tavani, R., Green, S., Bruce, G., Williams, S. J., Wiser, S. K., Huber, M. O., Hengeveld, G. M., Nabuurs, G. J., Tikhonova, E., Borchardt, P., Li, C. F., Powrie, L. W., Fischer, M., Hemp, A., Homeier, J., Cho, P., Vibrans, A. C., Umunay, P. M., Piao, S. L., Rowe, C. W., Ashton, M. S., Crane, P. R., and Bradford, M. A.: Mapping tree density at a global scale, Nature, 525, 201–205, https://doi.org/10.1038/nature14967, 2015.
Dai, A. G.: Drought under global warming: a review, WIREs Clim. Change, 2, 45–65, https://doi.org/10.1002/wcc.81, 2011.
Davidson, E. A., de Araujo, A. C., Artaxo, P., Balch, J. K., Brown, I. F., Bustamante, M. M. C., Coe, M. T., DeFries, R. S., Keller, M., Longo, M., Munger, J. W., Schroeder, W., Soares-Filho, B. S., Souza Jr., C. M., and Wofsy, S. C.: The Amazon basin in transition, Nature, 481, 321–328, https://doi.org/10.1038/nature10717, 2012.
Davin, E. L., Rechid, D., Breil, M., Cardoso, R. M., Coppola, E., Hoffmann, P., Jach, L. L., Katragkou, E., de Noblet-Ducoudré, N., Radtke, K., Raffa, M., Soares, P. M. M., Sofiadis, G., Strada, S., Strandberg, G., Tölle, M. H., Warrach-Sagi, K., and Wulfmeyer, V.: Biogeophysical impacts of forestation in Europe: first results from the LUCAS (Land Use and Climate Across Scales) regional climate model intercomparison, Earth Syst. Dynam., 11, 183–200, https://doi.org/10.5194/esd-11-183-2020, 2020.
Decharme, B., Delire, C., Minvielle, M., Colin, J., Vergnes, J. P., Alias, A., Saint-Martin, D., Séférian, R., Sénési, S., and Voldoire, A.: Recent Changes in the ISBA-CTRIP Land Surface System for Use in the CNRM-CM6 Climate Model and in Global Off-Line Hydrological Applications, J. Adv. Model. Earth Sy., 11, 1207–1252, https://doi.org/10.1029/2018ms001545, 2019.
Delire, C., Séférian, R., Decharme, B., Alkama, R., Calvet, J. C., Carrer, D., Gibelin, A. L., Joetzjer, E., Morel, X., Rocher, M., and Tzanos, D.: The Global Land Carbon Cycle Simulated With ISBA-CTRIP: Improvements Over the Last Decade, J. Adv. Model. Earth Sy., 12, e2019MS001886, https://doi.org/10.1029/2019MS001886, 2020.
Di Vittorio, A. V., Chini, L. P., Bond-Lamberty, B., Mao, J., Shi, X., Truesdale, J., Craig, A., Calvin, K., Jones, A., Collins, W. D., Edmonds, J., Hurtt, G. C., Thornton, P., and Thomson, A.: From land use to land cover: restoring the afforestation signal in a coupled integrated assessment–earth system model and the implications for CMIP5 RCP simulations, Biogeosciences, 11, 6435–6450, https://doi.org/10.5194/bg-11-6435-2014, 2014.
Dong, B. W. and Sutton, R.: Dominant role of greenhouse-gas forcing in the recovery of Sahel rainfall, Nat. Clim. Change, 5, 757–760, https://doi.org/10.1038/Nclimate2664, 2015.
Döscher, R., Acosta, M., Alessandri, A., Anthoni, P., Arsouze, T., Bergman, T., Bernardello, R., Boussetta, S., Caron, L.-P., Carver, G., Castrillo, M., Catalano, F., Cvijanovic, I., Davini, P., Dekker, E., Doblas-Reyes, F. J., Docquier, D., Echevarria, P., Fladrich, U., Fuentes-Franco, R., Gröger, M., v. Hardenberg, J., Hieronymus, J., Karami, M. P., Keskinen, J.-P., Koenigk, T., Makkonen, R., Massonnet, F., Ménégoz, M., Miller, P. A., Moreno-Chamarro, E., Nieradzik, L., van Noije, T., Nolan, P., O'Donnell, D., Ollinaho, P., van den Oord, G., Ortega, P., Prims, O. T., Ramos, A., Reerink, T., Rousset, C., Ruprich-Robert, Y., Le Sager, P., Schmith, T., Schrödner, R., Serva, F., Sicardi, V., Sloth Madsen, M., Smith, B., Tian, T., Tourigny, E., Uotila, P., Vancoppenolle, M., Wang, S., Wårlind, D., Willén, U., Wyser, K., Yang, S., Yepes-Arbós, X., and Zhang, Q.: The EC-Earth3 Earth system model for the Coupled Model Intercomparison Project 6, Geosci. Model Dev., 15, 2973–3020, https://doi.org/10.5194/gmd-15-2973-2022, 2022.
Douville, H., Raghavan, K., Renwick, J., Allan, R. P., Arias, P. A., Barlow, M., Cerezo-Mota, R., Cherchi, A., Gan, T. Y., Gergis, J., Jiang, D., Khan, A., Pokam Mba, W., Rosenfeld, D., Tierney, J., and Zolina, O.: Water Cycle Changes, in: Climate Change 2021 – The Physical Science Basis: Working Group I Contribution to the Sixth Assessment Report of the Intergovernmental Panel on Climate Change, edited by: Masson-Delmotte, V., Zhai, P., Pirani, A., Connors, S. L., Péan, C., Berger, S., Caud, N., Chen, Y., Goldfarb, L., Gomis, M. I., Huang, M., Leitzell, K., Lonnoy, E., Matthews, J. B. R., Maycock, T. K., Waterfield, T., Yelekçi, O., Yu, R., and Zhou, B., Cambridge University Press, Cambridge, United Kingdom and New York, NY, USA, 1055–1210, https://doi.org/10.1017/9781009157896.010, 2021.
Duveiller, G., Filipponi, F., Ceglar, A., Bojanowski, J., Alkama, R., and Cescatti, A.: Revealing the widespread potential of forests to increase low level cloud cover, Nat. Commun., 12, 4337, https://doi.org/10.1038/s41467-021-24551-5, 2021.
ESGF: CMIP6, ESGF [data set], https://esgf-node.llnl.gov/search/cmip6/ (last access: 24 March 2025), 2025.
Eyring, V., Bony, S., Meehl, G. A., Senior, C. A., Stevens, B., Stouffer, R. J., and Taylor, K. E.: Overview of the Coupled Model Intercomparison Project Phase 6 (CMIP6) experimental design and organization, Geosci. Model Dev., 9, 1937–1958, https://doi.org/10.5194/gmd-9-1937-2016, 2016.
Farquhar, G. D., Caemmerer, S. V., and Berry, J. A.: A Biochemical-Model of Photosynthetic Co2 Assimilation in Leaves of C-3 Species, Planta, 149, 78–90, https://doi.org/10.1007/Bf00386231, 1980.
Fick, S. E. and Hijmans, R. J.: WorldClim 2: new 1 km spatial resolution climate surfaces for global land areas, Int. J. Climatol., 37, 4302–4315, https://doi.org/10.1002/joc.5086, 2017.
Field, C. B., Lobell, D. B., Peters, H. A., and Chiariello, N. R.: Feedbacks of terrestrial ecosystems to climate change, Annu. Rev. Env. Resour., 32, 1–29, https://doi.org/10.1146/annurev.energy.32.053006.141119, 2007.
Findell, K. L., Berg, A., Gentine, P., Krasting, J. P., Lintner, B. R., Malyshev, S., Santanello Jr., J. A., and Shevliakova, E.: The impact of anthropogenic land use and land cover change on regional climate extremes, Nat. Commun., 8, 989, https://doi.org/10.1038/s41467-017-01038-w, 2017.
Forzieri, G., Girardello, M., Ceccherini, G., Spinoni, J., Feyen, L., Hartmann, H., Beck, P. S. A., Camps-Valls, G., Chirici, G., Mauri, A., and Cescatti, A.: Emergent vulnerability to climate-driven disturbances in European forests, Nat. Commun., 12, 1081, https://doi.org/10.1038/s41467-021-21399-7, 2021.
Frierson, D. M. W., Hwang, Y. T., Fuçkar, N. S., Seager, R., Kang, S. M., Donohoe, A., Maroon, E. A., Liu, X. J., and Battisti, D. S.: Contribution of ocean overturning circulation to tropical rainfall peak in the Northern Hemisphere, Nat. Geosci., 6, 940–944, https://doi.org/10.1038/Ngeo1987, 2013.
Funk, C., Verdin, A., Michaelsen, J., Peterson, P., Pedreros, D., and Husak, G.: A global satellite-assisted precipitation climatology, Earth Syst. Sci. Data, 7, 275–287, https://doi.org/10.5194/essd-7-275-2015, 2015.
Hajima, T., Watanabe, M., Yamamoto, A., Tatebe, H., Noguchi, M. A., Abe, M., Ohgaito, R., Ito, A., Yamazaki, D., Okajima, H., Ito, A., Takata, K., Ogochi, K., Watanabe, S., and Kawamiya, M.: Development of the MIROC-ES2L Earth system model and the evaluation of biogeochemical processes and feedbacks, Geosci. Model Dev., 13, 2197–2244, https://doi.org/10.5194/gmd-13-2197-2020, 2020.
Hansen, M. C., Potapov, P. V., Moore, R., Hancher, M., Turubanova, S. A., Tyukavina, A., Thau, D., Stehman, S. V., Goetz, S. J., Loveland, T. R., Kommareddy, A., Egorov, A., Chini, L., Justice, C. O., and Townshend, J. R.: High-resolution global maps of 21st-century forest cover change, Science, 342, 850–853, https://doi.org/10.1126/science.1244693, 2013.
Harris, N. L., Brown, S., Hagen, S. C., Saatchi, S. S., Petrova, S., Salas, W., Hansen, M. C., Potapov, P. V., and Lotsch, A.: Baseline map of carbon emissions from deforestation in tropical regions, Science, 336, 1573–1576, https://doi.org/10.1126/science.1217962, 2012.
Hijmans, R. J., Cameron, S. E., Parra, J. L., Jones, P. G., and Jarvis, A.: Very high resolution interpolated climate surfaces for global land areas, Int. J. Climatol., 25, 1965–1978, https://doi.org/10.1002/joc.1276, 2005.
Hu, X. P., Huang, B., and Cherubini, F.: Impacts of idealized land cover changes on climate extremes in Europe, Ecol. Indic., 104, 626–635, https://doi.org/10.1016/j.ecolind.2019.05.037, 2019.
Hua, W. J., Zhou, L. M., Dai, A. G., Chen, H. S., and Liu, Y.: Important non-local effects of deforestation on cloud cover changes in CMIP6 models, Environ. Res. Lett., 18, 094047, https://doi.org/10.1088/1748-9326/acf232, 2023.
Huang, B., Hu, X., Fuglstad, G. A., Zhou, X., Zhao, W., and Cherubini, F.: Predominant regional biophysical cooling from recent land cover changes in Europe, Nat. Commun., 11, 1066, https://doi.org/10.1038/s41467-020-14890-0, 2020.
Huang, B., Li, Y., Liu, Y., Hu, X. P., Zhao, W. W., and Cherubini, F.: A simplified multi-model statistical approach for predicting the effects of forest management on land surface temperature in Fennoscandia, Agr. Forest Meteorol., 332, 109362, https://doi.org/10.1016/j.agrformet.2023.109362, 2023.
Huang, B., Li, Y., Zhang, X., Tan, C., Hu, X., and Cherubini, F.: Regional temperature response to different forest development stages in Fennoscandia explored with a regional climate model, Agr. Forest Meteorol., 354, 110083, https://doi.org/10.1016/j.agrformet.2024.110083, 2024.
Ito, A., Hajima, T., Lawrence, D. M., Brovkin, V., Delire, C., Guenet, B., Jones, C. D., Malyshev, S., Materia, S., McDermid, S. P., Peano, D., Pongratz, J., Robertson, E., Shevliakova, E., Vuichard, N., Wårlind, D., Wiltshire, A., and Ziehn, T.: Soil carbon sequestration simulated in CMIP6-LUMIP models: implications for climatic mitigation, Environ. Res. Lett., 15, 124061, https://doi.org/10.1088/1748-9326/abc912, 2020.
Jia, G., Shevliakova, E., Artaxo, P., De Noblet-Ducoudré, N., Houghton, R., House, J., Kitajima, K., Lennard, C., Popp, A., Sirin, A., Sukumar, R., and Verchot, L.: Land–climate interactions, In: Climate Change and Land, edited by: Shukla, P. R., Skea, J., Calvo Buendia, E., Masson-Delmotte, V., Pörtner, H.-O., Roberts, D. C., Zhai, P., Slade, R., Connors, S., van Diemen, R., Ferrat, M., Haughey, E. Luz, S., Neogi, S., Pathak, M., Petzold, J., Portugal Pereira, J., Vyas, P., Huntley, E., Kissick, K., Belkacemi, M., and Malley, J., Cambridge University Press, Cambridge, 131–248, https://doi.org/10.1017/9781009157988.004, 2022.
Karger, D. N., Conrad, O., Bohner, J., Kawohl, T., Kreft, H., Soria-Auza, R. W., Zimmermann, N. E., Linder, H. P., and Kessler, M.: Climatologies at high resolution for the earth's land surface areas, Sci. Data, 4, 170122, https://doi.org/10.1038/sdata.2017.122, 2017.
Keenan, R. J., Reams, G. A., Achard, F., de Freitas, J. V., Grainger, A., and Lindquist, E.: Dynamics of global forest area: Results from the FAO Global Forest Resources Assessment 2015, Forest Ecol. Manag., 352, 9–20, https://doi.org/10.1016/j.foreco.2015.06.014, 2015.
Kelley, M., Schmidt, G. A., Nazarenko, L. S., Bauer, S. E., Ruedy, R., Russell, G. L., Ackerman, A. S., Aleinov, I., Bauer, M., Bleck, R., Canuto, V., Cesana, G., Cheng, Y., Clune, T. L., Cook, B. I., Cruz, C. A., Del Genio, A. D., Elsaesser, G. S., Faluvegi, G., Kiang, N. Y., Kim, D., Lacis, A. A., Leboissetier, A., LeGrande, A. N., Lo, K. K., Marshall, J., Matthews, E. E., McDermid, S., Mezuman, K., Miller, R. L., Murray, L. T., Oinas, V., Orbe, C., Garcia-Pando, C. P., Perlwitz, J. P., Puma, M. J., Rind, D., Romanou, A., Shindell, D. T., Sun, S., Tausnev, N., Tsigaridis, K., Tselioudis, G., Weng, E., Wu, J., and Yao, M. S.: GISS-E2.1: Configurations and Climatology, J. Adv. Model. Earth. Sy., 12, e2019MS002025, https://doi.org/10.1029/2019MS002025, 2020.
Koven, C. D., Riley, W. J., Subin, Z. M., Tang, J. Y., Torn, M. S., Collins, W. D., Bonan, G. B., Lawrence, D. M., and Swenson, S. C.: The effect of vertically resolved soil biogeochemistry and alternate soil C and N models on C dynamics of CLM4, Biogeosciences, 10, 7109–7131, https://doi.org/10.5194/bg-10-7109-2013, 2013.
Kriticos, D. J., Webber, B. L., Leriche, A., Ota, N., Macadam, I., Bathols, J., and Scott, J. K.: CliMond: global high-resolution historical and future scenario climate surfaces for bioclimatic modelling, Methods Ecol. Evol., 3, 53–64, https://doi.org/10.1111/j.2041-210X.2011.00134.x, 2012.
Lawrence, D. and Vandecar, K.: Effects of tropical deforestation on climate and agriculture, Nat. Clim. Change, 5, 27–36, https://doi.org/10.1038/nclimate2430, 2014.
Lawrence, D. M., Hurtt, G. C., Arneth, A., Brovkin, V., Calvin, K. V., Jones, A. D., Jones, C. D., Lawrence, P. J., de Noblet-Ducoudré, N., Pongratz, J., Seneviratne, S. I., and Shevliakova, E.: The Land Use Model Intercomparison Project (LUMIP) contribution to CMIP6: rationale and experimental design, Geosci. Model Dev., 9, 2973–2998, https://doi.org/10.5194/gmd-9-2973-2016, 2016.
Lee, X., Goulden, M. L., Hollinger, D. Y., Barr, A., Black, T. A., Bohrer, G., Bracho, R., Drake, B., Goldstein, A., Gu, L., Katul, G., Kolb, T., Law, B. E., Margolis, H., Meyers, T., Monson, R., Munger, W., Oren, R., Paw, U. K., Richardson, A. D., Schmid, H. P., Staebler, R., Wofsy, S., and Zhao, L.: Observed increase in local cooling effect of deforestation at higher latitudes, Nature, 479, 384–387, https://doi.org/10.1038/nature10588, 2011.
Leite, A. T., Pontes, V. Y. D., and Costa, M. H.: Effects of Deforestation on the Onset of the Rainy Season and the Duration of Dry Spells in Southern Amazonia, J. Geophys. Res.-Atmos., 124, 5268–5281, https://doi.org/10.1029/2018jd029537, 2019.
Leite, A. T., Soares, B. S., Davis, J. L., Abrahao, G. M., and Börner, J.: Deforestation reduces rainfall and agricultural revenues in the Brazilian Amazon, Nat. Commun., 12, 2591, https://doi.org/10.1038/s41467-021-22840-7, 2021.
Lejeune, Q., Davin, E. L., Gudmundsson, L., Winckler, J., and Seneviratne, S. I.: Historical deforestation locally increased the intensity of hot days in northern mid-latitudes, Nat. Clim. Change, 8, 386–390, https://doi.org/10.1038/s41558-018-0131-z, 2018.
Li, J. and Heap, A. D.: A review of comparative studies of spatial interpolation methods in environmental sciences: Performance and impact factors, Ecol. Inform., 6, 228–241, https://doi.org/10.1016/j.ecoinf.2010.12.003, 2011.
Li, Y., Brando, P. M., Morton, D. C., Lawrence, D. M., Yang, H., and Randerson, J. T.: Deforestation-induced climate change reduces carbon storage in remaining tropical forests, Nat. Commun., 13, 1964, https://doi.org/10.1038/s41467-022-29601-0, 2022.
Li, Y., Huang, B., and Rust, H. W.: Using statistical models to depict the response of multi-timescale drought to forest cover change across climate zones, Hydrol. Earth Syst. Sci., 28, 321–339, https://doi.org/10.5194/hess-28-321-2024, 2024.
Liu, S. Y., Hua, W. J., Zhou, L. M., Chen, H. S., Yu, M., Li, X., and Cui, Y. Z.: Local and Non-Local Biophysical Impacts of Deforestation on Global Temperature During Boreal Summer: CMIP6-LUMIP Multimodel Analysis, J. Geophys. Res.-Atmos., 128, e2022JD038229, https://doi.org/10.1029/2022JD038229, 2023.
Lovato, T., Peano, D., Butenschön, M., Materia, S., Iovino, D., Scoccimarro, E., Fogli, P. G., Cherchi, A., Bellucci, A., Gualdi, S., Masina, S., and Navarra, A.: CMIP6 Simulations With the CMCC Earth System Model (CMCC-ESM2), J. Adv. Model. Earth Sy., 14, e2021MS002814, https://doi.org/10.1029/2021MS002814, 2022.
Luo, X., Ge, J., Guo, W. D., Fan, L., Chen, C. R., Liu, Y., and Yang, L. M.: The Biophysical Impacts of Deforestation on Precipitation: Results from the CMIP6 Model Intercomparison, J. Climate, 35, 3293–3311, https://doi.org/10.1175/Jcli-D-21-0689.1, 2022.
Mahmood, R., Pielke, R. A., Hubbard, K. G., Niyogi, D., Dirmeyer, P. A., McAlpine, C., Carleton, A. M., Hale, R., Gameda, S., Beltrán-Przekurat, A., Baker, B., McNider, R., Legates, D. R., Shepherd, M., Du, J. Y., Blanken, P. D., Frauenfeld, O. W., Nair, U. S., and Fall, S.: Land cover changes and their biogeophysical effects on climate, Int. J. Climatol., 34, 929–953, https://doi.org/10.1002/joc.3736, 2014.
McKee, T. B., Doesken, N. J., and Kleist, J.: The relationship of drought frequency and duration to time scales, in: Proceedings of the 8th Conference on Applied Climatology, vol. 17, American Meteorological Society Boston, Anaheim, California 17–22 January 1993, 179–183, https://climate.colostate.edu/pdfs/relationshipofdroughtfrequency.pdf (last access: 24 March 2025), 1993.
Nepstad, D. C., Tohver, I. M., Ray, D., Moutinho, P., and Cardinot, G.: Mortality of large trees and lianas following experimental drought in an Amazon forest, Ecology, 88, 2259–2269, https://doi.org/10.1890/06-1046.1, 2007.
Oleson, K., Lawrence, D., Bonan, G., Drewniak, B., Huang, M., Koven, C., Levis, S., Li, F., Riley, W., Subin, Z., Swenson, S., Thornton, P., Bozbiyik, A., Rosie, F., Heald, C., Kluzek, E., Lamarque, J.-F., Lawrence, P., Leung, L., and Yang, Z.-L.: Technical description of version 4.5 of the Community Land Model (CLM), NCAR Technical Note NCAR/TN-503+STR, 169, 2013.
Pan, Y., Birdsey, R. A., Fang, J., Houghton, R., Kauppi, P. E., Kurz, W. A., Phillips, O. L., Shvidenko, A., Lewis, S. L., Canadell, J. G., Ciais, P., Jackson, R. B., Pacala, S. W., McGuire, A. D., Piao, S., Rautiainen, A., Sitch, S., and Hayes, D.: A large and persistent carbon sink in the world's forests, Science, 333, 988–993, https://doi.org/10.1126/science.1201609, 2011.
Panofsky, H. A. and Brier, G. W.: Some applications of statistics to meteorology, The Pennsylvania State University Press, 224 pp., 1968.
Parton, W. J., Stewart, J. W. B., and Cole, C. V.: Dynamics of C, N, P and S in Grassland Soils – a Model, Biogeochemistry, 5, 109–131, https://doi.org/10.1007/Bf02180320, 1988.
Peel, M. C., Finlayson, B. L., and McMahon, T. A.: Updated world map of the Köppen-Geiger climate classification, Hydrol. Earth Syst. Sci., 11, 1633–1644, https://doi.org/10.5194/hess-11-1633-2007, 2007.
Perugini, L., Caporaso, L., Marconi, S., Cescatti, A., Quesada, B., de Noblet-Ducoudré, N., House, J. I., and Arneth, A.: Biophysical effects on temperature and precipitation due to land cover change, Environ. Res. Lett., 12, 053002, https://doi.org/10.1088/1748-9326/aa6b3f, 2017.
Pielke, R. A., Pitman, A., Niyogi, D., Mahmood, R., McAlpine, C., Hossain, F., Goldewijk, K. K., Nair, U., Betts, R., Fall, S., Reichstein, M., Kabat, P., and de Noblet, N.: Land use/land cover changes and climate: modeling analysis and observational evidence, WIREs Clim. Change, 2, 828–850, https://doi.org/10.1002/wcc.144, 2011.
Pitman, A. J., de Noblet-Ducoudré, N., Cruz, F. T., Davin, E. L., Bonan, G. B., Brovkin, V., Claussen, M., Delire, C., Ganzeveld, L., Gayler, V., van den Hurk, B. J. J. M., Lawrence, P. J., van der Molen, M. K., Müller, C., Reick, C. H., Seneviratne, S. I., Strengers, B. J., and Voldoire, A.: Uncertainties in climate responses to past land cover change: First results from the LUCID intercomparison study, Geophys. Res. Lett., 36, L14814, https://doi.org/10.1029/2009gl039076, 2009.
Portmann, R., Beyerle, U., Davin, E., Fischer, E. M., De Hertog, S., and Schemm, S.: Global forestation and deforestation affect remote climate via adjusted atmosphere and ocean circulation, Nat. Commun., 13, 5569, https://doi.org/10.1038/s41467-022-33279-9, 2022.
R Core Team: R: A Language and Environment for Statistical Computing. R Foundation for Statistical Computing, Vienna, Austria, https://www.r-project.org/ (last access: 24 March 2025), 2022.
Séférian, R., Nabat, P., Michou, M., Saint-Martin, D., Voldoire, A., Colin, J., Decharme, B., Delire, C., Berthet, S., Chevallier, M., Sénési, S., Franchisteguy, L., Vial, J., Mallet, M., Joetzjer, E., Geoffroy, O., Guérémy, J. F., Moine, M. P., Msadek, R., Ribes, A., Rocher, M., Roehrig, R., Salas-y-Mélia, D., Sanchez, E., Terray, L., Valcke, S., Waldman, R., Aumont, O., Bopp, L., Deshayes, J., Éthé, C., and Madec, G.: Evaluation of CNRM Earth System Model, CNRM-ESM2–1: Role of Earth System Processes in Present-Day and Future Climate, J. Adv. Model. Earth Sy., 11, 4182–4227, https://doi.org/10.1029/2019ms001791, 2019.
Seidl, R., Thom, D., Kautz, M., Martin-Benito, D., Peltoniemi, M., Vacchiano, G., Wild, J., Ascoli, D., Petr, M., Honkaniemi, J., Lexer, M. J., Trotsiuk, V., Mairota, P., Svoboda, M., Fabrika, M., Nagel, T. A., and Reyer, C. P. O.: Forest disturbances under climate change, Nat. Clim. Change, 7, 395–402, https://doi.org/10.1038/nclimate3303, 2017.
Sellar, A. A., Walton, J., Jones, C. G., Wood, R., Abraham, N. L., Andrejczuk, M., Andrews, M. B., Andrews, T., Archibald, A. T., de Mora, L., Dyson, H., Elkington, M., Ellis, R., Florek, P., Good, P., Gohar, L., Haddad, S., Hardiman, S. C., Hogan, E., Iwi, A., Jones, C. D., Johnson, B., Kelley, D. I., Kettleborough, J., Knight, J. R., Köhler, M. O., Kuhlbrodt, T., Liddicoat, S., Linova-Pavlova, I., Mizielinski, M. S., Morgenstern, O., Mulcahy, J., Neininger, E., O'Connor, F. M., Petrie, R., Ridley, J., Rioual, J. C., Roberts, M., Robertson, E., Rumbold, S., Seddon, J., Shepherd, H., Shim, S., Stephens, A., Teixiera, J. C., Tang, Y., Williams, J., Wiltshire, A., and Griffiths, P. T.: Implementation of UK Earth System Models for CMIP6, J. Adv. Model. Earth Sy., 12, e2019MS001946, https://doi.org/10.1029/2019ms001946, 2020.
Seneviratne, S. I.: Climate science: Historical drought trends revisited, Nature, 491, 338–339, https://doi.org/10.1038/491338a, 2012.
Smith, C., Baker, J. C. A., and Spracklen, D. V.: Tropical deforestation causes large reductions in observed precipitation, Nature, 615, 270–275, https://doi.org/10.1038/s41586-022-05690-1, 2023a.
Smith, C., Robertson, E., Chadwick, R., Kelley, D., Argles, A. P. K., Coelho, C. A. S., de Souza, D. C., Kubota, P. Y., Talamoni, I. L., Spracklen, D., and Baker, J. C. A.: Observed and simulated local climate responses to tropical deforestation, Environ. Res. Lett., 18, 104004 https://doi.org/10.1088/1748-9326/acf0da, 2023b.
Snyder, P. K., Delire, C., and Foley, J. A.: Evaluating the influence of different vegetation biomes on the global climate, Clim. Dynam., 23, 279–302, https://doi.org/10.1007/s00382-004-0430-0, 2004.
Spracklen, D. V., Arnold, S. R., and Taylor, C. M.: Observations of increased tropical rainfall preceded by air passage over forests, Nature, 489, 282–285, https://doi.org/10.1038/nature11390, 2012.
Staal, A., Tuinenburg, O. A., Bosmans, J. H. C., Holmgren, M., van Nes, E. H., Scheffer, M., Zemp, D. C., and Dekker, S. C.: Forest-rainfall cascades buffer against drought across the Amazon, Nat. Clim. Change, 8, 539–543, https://doi.org/10.1038/s41558-018-0177-y, 2018.
Staal, A., Flores, B. M., Aguiar, A. P. D., Bosmans, J. H. C., Fetzer, I., and Tuinenburg, O. A.: Feedback between drought and deforestation in the Amazon, Environ. Res. Lett., 15, 044024, https://doi.org/10.1088/1748-9326/ab738e, 2020.
Stephens, G. L., Hakuba, M. Z., Kato, S., Gettleman, A., Dufresne, J. L., Andrews, T., Cole, J. N. S., Willem, U., and Mauritsen, T.: The changing nature of Earth's reflected sunlight, P. Roy. Soc. A-Math. Phy., 478, 20220053, https://doi.org/10.1098/rspa.2022.0053, 2022.
Swart, N. C., Cole, J. N. S., Kharin, V. V., Lazare, M., Scinocca, J. F., Gillett, N. P., Anstey, J., Arora, V., Christian, J. R., Hanna, S., Jiao, Y., Lee, W. G., Majaess, F., Saenko, O. A., Seiler, C., Seinen, C., Shao, A., Sigmond, M., Solheim, L., von Salzen, K., Yang, D., and Winter, B.: The Canadian Earth System Model version 5 (CanESM5.0.3), Geosci. Model Dev., 12, 4823–4873, https://doi.org/10.5194/gmd-12-4823-2019, 2019.
Taylor, C. M., Klein, C., Parker, D. J., Gerard, F., Semeena, V. S., Barton, E. J., and Harris, B. L.: “Late-stage” deforestation enhances storm trends in coastal West Africa, P. Natl. Acad. Sci. USA, 119, e2109285119, https://doi.org/10.1073/pnas.2109285119, 2022.
Van der Ent, R., Wang-Erlandsson, L., Keys, P. W., and Savenije, H.: Contrasting roles of interception and transpiration in the hydrological cycle–Part 2: Moisture recycling, Earth Syst. Dynam., 5, 471–489, 2014.
Vancutsem, C., Achard, F., Pekel, J. F., Vieilledent, G., Carboni, S., Simonetti, D., Gallego, J., Aragao, L., and Nasi, R.: Long-term (1990–2019) monitoring of forest cover changes in the humid tropics, Sci. Adv., 7, eabe1603, https://doi.org/10.1126/sciadv.abe1603, 2021.
Vicente-Serrano, S. M., Beguería, S., and López-Moreno, J. I.: A Multiscalar Drought Index Sensitive to Global Warming: The Standardized Precipitation Evapotranspiration Index, J. Climate, 23, 1696–1718, https://doi.org/10.1175/2009jcli2909.1, 2010.
Wainwright, C. M., Allan, R. P., and Black, E.: Consistent Trends in Dry Spell Length in Recent Observations and Future Projections, Geophys. Res. Lett., 49, e2021GL097231, https://doi.org/10.1029/2021GL097231, 2022.
Wang, T. L., Hamann, A., Spittlehouse, D. L., and Murdock, T. Q.: ClimateWNA-High-Resolution Spatial Climate Data for Western North America, J. Appl. Meteorol. Clim., 51, 16–29, https://doi.org/10.1175/Jamc-D-11-043.1, 2012.
Winckler, J., Reick, C. H., Luyssaert, S., Cescatti, A., Stoy, P. C., Lejeune, Q., Raddatz, T., Chlond, A., Heidkamp, M., and Pongratz, J.: Different response of surface temperature and air temperature to deforestation in climate models, Earth Syst. Dynam., 10, 473–484, https://doi.org/10.5194/esd-10-473-2019, 2019.
Wood, S. N.: Generalized additive models: an introduction with R, CRC press, ISBN 9781315370279, 2017.
Wu, T., Lu, Y., Fang, Y., Xin, X., Li, L., Li, W., Jie, W., Zhang, J., Liu, Y., Zhang, L., Zhang, F., Zhang, Y., Wu, F., Li, J., Chu, M., Wang, Z., Shi, X., Liu, X., Wei, M., Huang, A., Zhang, Y., and Liu, X.: The Beijing Climate Center Climate System Model (BCC-CSM): the main progress from CMIP5 to CMIP6 , Geosci. Model Dev., 12, 1573–1600, https://doi.org/10.5194/gmd-12-1573-2019, 2019.
Xu, R., Li, Y., Teuling, A. J., Zhao, L., Spracklen, D. V., Garcia-Carreras, L., Meier, R., Chen, L., Zheng, Y. T., Lin, H. Q., and Fu, B. J.: Contrasting impacts of forests on cloud cover based on satellite observations, Nat. Commun., 13, 670, https://doi.org/10.1038/s41467-022-28161-7, 2022.
Yoo, J. and Rohli, R. V.: Global distribution of Koppen-Geiger climate types during the Last Glacial Maximum, Mid-Holocene, and present, Palaeogeogr. Palaeocl., 446, 326–337, https://doi.org/10.1016/j.palaeo.2015.12.010, 2016.
Zeng, Z. Z., Wang, D. S., Yang, L., Wu, J., Ziegler, A. D., Liu, M. F., Ciais, P., Searchinger, T. D., Yang, Z. L., Chen, D. L., Chen, A. P., Li, L. Z. X., Piao, S. L., Taylor, D., Cai, X. T., Pan, M., Peng, L. Q., Lin, P. R., Gower, D., Feng, Y., Zheng, C. M., Guan, K. Y., Lian, X., Wang, T., Wang, L., Jeong, S. J., Wei, Z. W., Sheffield, J., Caylor, K., and Wood, E. F.: Deforestation-induced warming over tropical mountain regions regulated by elevation, Nat. Geosci., 14, 23–29, https://doi.org/10.1038/s41561-020-00666-0, 2021.
Zhang, B. Q., Tian, L., Zhao, X. N., and Wu, P. T.: Feedbacks between vegetation restoration and local precipitation over the Loess Plateau in China, Sci. China Earth Sci., 64, 920–931, https://doi.org/10.1007/s11430-020-9751-8, 2021.
Zhao, M., Pitman, A. J., and Chase, T.: The impact of land cover change on the atmospheric circulation, Clim. Dynam., 17, 467–477, https://doi.org/10.1007/Pl00013740, 2001.