the Creative Commons Attribution 4.0 License.
the Creative Commons Attribution 4.0 License.
 | 25 Mar 2025
Projections of streamflow intermittence under climate change in European drying river networks
Alexandre Devers
Flora Branger
Sven Kralisch
Claire Lauvernet
Jean-Philippe Vidal
Núria Bonada
Zoltán Csabai
Heikki Mykrä
Petr Pařil
Luka Polović
Thibault Datry
Climate and land use changes, as well as human water use and flow alteration, are causing worldwide shifts in river flow dynamics. During the last decades, low flows, flow intermittence, and drying have increased in many regions of the world, including Europe. This trend is projected to continue and amplify in the future, resulting in more frequent and intense hydrological droughts. However, due to a lack of data and studies on temporary rivers in the past, little is known about the processes governing the development of flow intermittence and drying, their timing and frequency, or their long-term evolution under climate change. Moreover, understanding the impact of climate change on the drying up of rivers is crucial to assess the impact of climate change on aquatic ecosystems, including the biodiversity and functional integrity of freshwater systems.
This study is one of the first to present future projections of drying in intermittent river networks and to analyse future changes in the drying patterns at a high spatial and temporal resolution. Flow intermittence projections were produced using a hybrid hydrological model forced with climate projection data from 1985 until 2100 under three climate scenarios in six European drying river networks. The studied watershed areas are situated in different biogeographic regions, located in Spain, France, Croatia, Hungary, Czechia, and Finland, and their areas range from 150 to 350 km2. Additionally, flow intermittence indicators were developed and calculated to assess (1) changes in the characteristics of the drying spells at the reach scale and (2) changes in the spatial extent of drying in the river network at various time intervals.
The results for all three climate scenarios show that drying patterns are projected to increase and expand in time and space, despite differences in the amplitude of changes. Temporally, in addition to the average frequency of drying events, the duration increases over the year. Seasonal changes are expected to result in an earlier onset and longer persistence of drying throughout the year. Summer drying maxima are likely to shift to earlier in the spring, with extended drying periods or additional maxima occurring in autumn and extending into the winter season in some regions. A trend analysis of extreme events shows that the extreme dry spells observed in recent years could become regular by the end of the century. Additionally, we observe transitions from perennial to intermittent reaches in the future.
- Article
(10262 KB) - Full-text XML
-
Supplement
(1684 KB) - BibTeX
- EndNote


Low-flow situations and flow intermittence, where sections of rivers run dry, are becoming increasingly common around the world due to climate change and human water use or flow alteration. These factors often interact in complex ways and can lead to prolonged and intensified periods of dryness and drought, disrupting river ecosystem functions and threatening the valuable services that they provide (Pal et al., 2015; Datry et al., 2018, 2022; Van Loon et al., 2016). Messager et al. (2021) showed that a large proportion (51 %–60 %) of the 64×106 km of the global river network studied alternates between flowing and dry conditions, particularly in arid and semiarid regions. These intermittent rivers are characterized by the cessation of streamflow, and extreme low flow can result in pool formation or in fully dry terrestrial riverbeds (Datry, 2017). This expansion and contraction of temporal river networks can be caused by various conditions of pedo-lithological, topographical, and meteorological origin (Van Meerveld et al., 2019). In addition to these natural causes, anthropogenic drivers, such as water abstraction or land use change, can also trigger flow intermittence or increase the duration and frequency of dry spells (Datry et al., 2022; Van Loon et al., 2016). Observed and simulated hydrological processes and river flow alteration show an increase in low-flow situations and drying over the last decades in many river basins around the world (Gudmundsson et al., 2021; Gelfan et al., 2023).
Changes in natural flow regimes can impact freshwater ecology, leading to habitat degradation, loss of species adapted to specific flow conditions, reduced biodiversity, and a decline in overall ecosystem health (Poff et al., 1997). Even though rivers cover less than 2 % of the Earth's surface, they are home to around 13 % of all known species, making them a hotspot for biodiversity (Strayer and Dudgeon, 2010; Datry et al., 2023). Intermittent rivers and streams, in particular, support species that have evolved to adapt to these variable conditions of flow dynamics, thereby forming unique ecosystems (Datry et al., 2014). Increases in hydrological droughts and shifts from perennial to intermittent flow regimes threaten both aquatic and terrestrial ecosystems by challenging species adapted to intermittent flow regimes (Leigh et al., 2016; Pörtner et al., 2021) and, hence, compromising river biodiversity as well as ecosystem functions and services (Tonkin et al., 2019; Bond et al., 2008; Steward et al., 2012; Tramblay et al., 2021; Gudmundsson and Seneviratne, 2016).
Projections of the Intergovernmental Panel on Climate Change (IPCC) indicate that the persistence of global warming throughout the 21st century will be largely determined by the socioeconomic pathways chosen by societies (IPCC, 2023), ranging from sustainable development to scenarios dominated by fossil-fuel-related growth. The Shared Socioeconomic Pathways (SSPs) framework represents these diverse scenarios, providing a detailed foundation for understanding how socioeconomic decisions might impact future climate conditions, as well as climate change mitigation and adaptation strategies (Riahi et al., 2017). However, the continuation of global warming will lead to increased evapotranspiration, mainly driven by higher temperatures and changes in atmospheric moisture demand, exacerbating the frequency and intensity of dry spells and droughts (Naumann et al., 2018; Calvin et al., 2023). Depending on the environmental characteristics of each river basin, the projected impacts of climate change on river runoff are manifold, ranging from the increased occurrence of high flows to an amplification of low-flow situations (Gusev et al., 2018). An increase in extreme streamflow patterns under climate change has also been observed in various river basins located in different European climate zones (Schneider et al., 2013). Studies have indicated that the frequency and severity of low-flow conditions, streamflow droughts, and drying events are projected to increase significantly until the end of the century in Europe (Feyen and Dankers, 2009), potentially causing shifts from perennial to intermittent flow regimes (Döll and Schmied, 2012; Sarremejane et al., 2022).
Despite recent advancements, intermittent rivers and ephemeral streams remain understudied, leaving critical gaps in our understanding of ecohydrological interactions across different spatial and temporal scales, especially as climate change and human water use increasingly threaten ecosystem functions and services in drying river networks (Sauquet et al., 2020; Acuña et al., 2014; Leigh and Datry, 2017; Datry et al., 2017). An important reason for this is the spatial scale of both the observations and the associated modelling results. Observations of drying patterns are often biased because of the installation of gauging stations in larger rivers instead of smaller tributaries, which can result in misleading interpretations and an oversight with respect to changing patterns in the entire river network (Yu et al., 2020). Döll et al. (2024) introduced a novel approach to estimating flow intermittence across Europe. However, despite increasing their spatial resolution to 15 arcsec (≈500 m), their global modelling approach cannot achieve the high resolution needed to capture small intermittent reaches (Döll et al., 2024). Additionally, hydrological models used for rainfall–runoff simulations at the catchment scale often generalize river networks, which can compromise the fine-scale details necessary to accurately represent reach-level dynamics. This limitation reflects the broader challenges of scaling in basin hydrology when aiming to capture the internal heterogeneity, especially at finer spatial scales (Blöschl and Sivapalan, 1995; Thompson et al., 2011). Another reason for gaps in our understanding of intermittent rivers and ephemeral streams is linked to the projection of flow intermittence under climate change. While notable studies assess the impacts of climate change on hydrological processes at the river basin scale and evaluate low flows under climate change (Cammalleri et al., 2020; Krysanova and Hattermann, 2017; Parey and Gailhard, 2022), limited data and models exist to quantify the climate change impacts on flow intermittence and drying patterns at a high spatiotemporal scale.
To address these gaps, we present, to our knowledge, the first study assessing projections of flow intermittence under various climate change scenarios, utilizing an ensemble of five global climate models across six European drying river networks (DRNs). The DRNs are located in different biogeographic regions of Europe, ranging from southern Spain to Finland. The spatiotemporal resolution allows one to observe changes in flow intermittence at both river-network-level (150–350 km2) and reach-level (mean length ≈900 m) scales. For this purpose, we use a hybrid modelling approach developed by Mimeau et al. (2024), who combined process-based hydrological modelling with machine learning techniques to predict flow intermittence in European DRNs. These models are forced with climate projection data (Devers et al., 2023) to estimate and assess streamflow intermittence under climate change in six pilot DRNs. Similarly to Mimeau et al. (2024), the term “flow intermittence” refers to two conditions in this study: flowing phases and phases with interrupted flow. The latter applies to both a completely dry riverbed and disconnected pools.
In this paper, we seek to use our results to answer the following questions:
-
Are there changes in flow regimes, particularly in the transitions of reaches from perennial to intermittent? If so, where do these changes occur (upstream, downstream, or randomly distributed), under which emission scenarios might these transitions take place, and what is the time frame for such changes?
-
How are the spatiotemporal patterns of flow intermittence changing across the pilot DRNs? This includes examining both network-scale changes, such as the percentage of the river network experiencing intermittence, and reach-scale changes, such as the number of days with dry conditions.
-
What changes are occurring in the characteristics of drying events at the reach scale, focusing not only on the number of events but also on the duration of drying events per year and the timing of the first dry events?
-
What is the potential evolution of extreme drying events? This question involves analysing the annual maximum extent of 10 consecutive dry days within the river network.
This work is embedded in the DRYvER project, aiming to integrate hydrology, ecology, and socioeconomics to better understand, predict, and project changes in river flow regimes and their subsequent effects on biodiversity, ecosystem functions, and services, with the goal of developing strategies and tools for mitigating the impacts of climate change on intermittent river networks (Datry et al., 2021). Within the scope of this collaboration, tools such as the DRYRivERS mobile application were developed to monitor stages of flow, disconnected pools, and dry riverbeds (Truchy et al., 2023), which were used, among other crowdsourced data (Kampf et al., 2018), to calibrate the flow intermittence models developed (Mimeau et al., 2024).
2.1 Study area
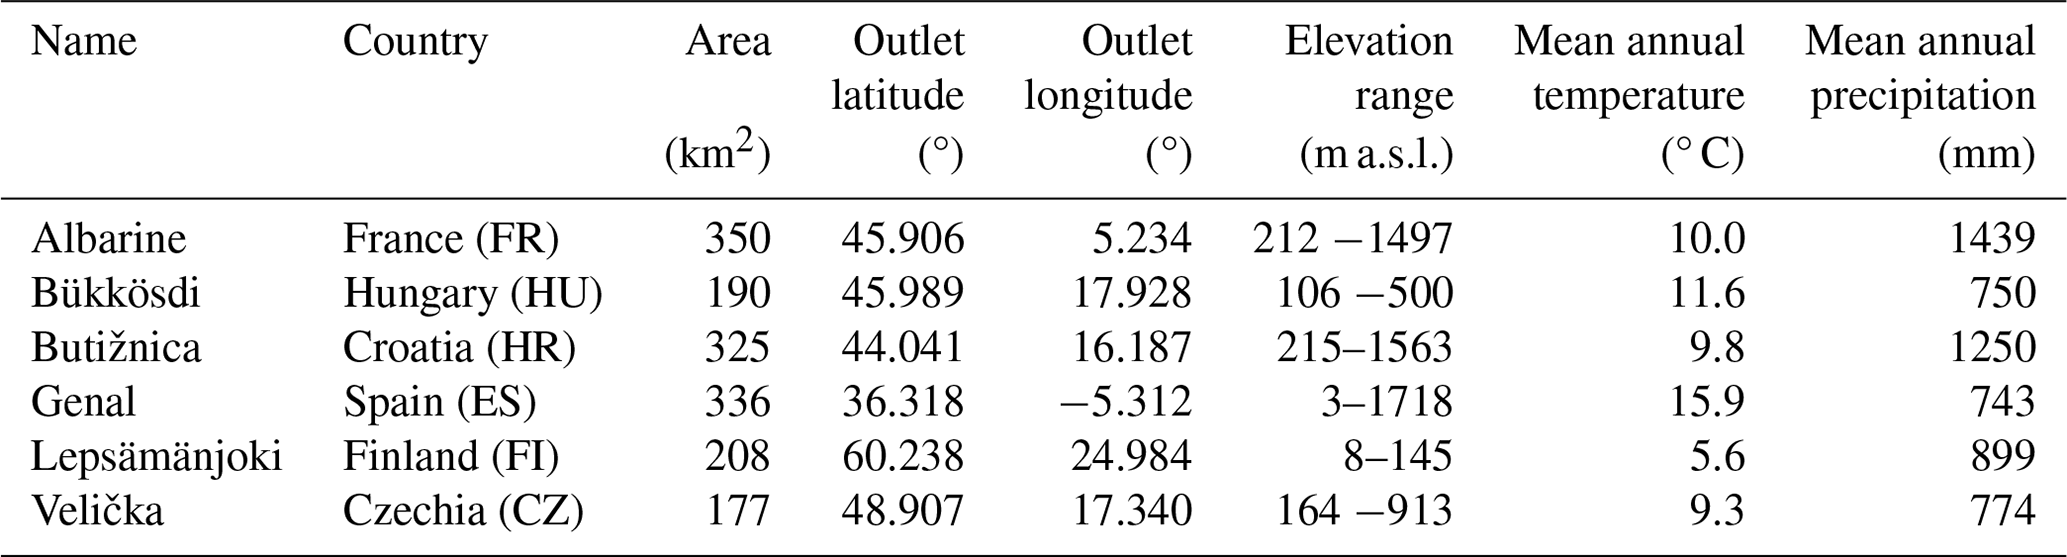
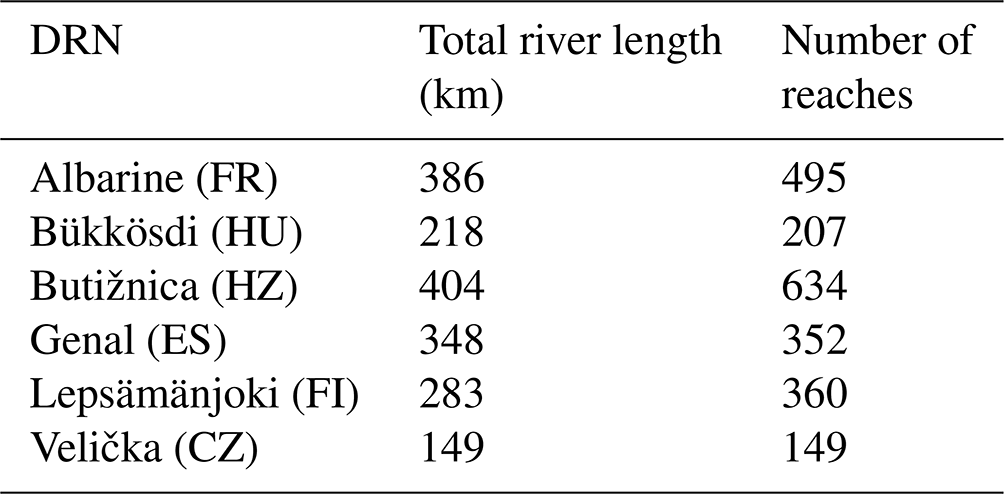
This study focuses on the six European drying river networks (DRNs) studied in the DRYvER project (Datry et al., 2021). The studied DRNs are located in Croatia (HR), Czechia (CZ), Finland (FI), France (FR), Hungary (HU), and Spain (ES) (Fig. 1). The sites are characterized by contrasting climates, with a Mediterranean climate for the Genal (ES) and Butižnica (HR) catchments, a pre-alpine climate for the Albarine catchment (FR), a continental climate for the Bükkösdi (HU) and Velička (CZ) catchments, and a boreal climate for the Lepsämänjoki catchment (FI) (Tables 1 and 2).
These sites were regularly monitored by local DRN teams during the DRYvER project, with observations of the state of flow in the river streams (Truchy et al., 2023), and were also the subject of several biological samplings campaigns to monitor the impact of drying on the metacommunity dynamics (Silverthorn et al., 2024; López‐Rojo et al., 2024).
The six sites are characterized by regular drying up of part of the river networks, although the patterns and causes of drying differ from one site to another. The Genal (ES) and Butižnica (HR) are the driest DRNs, with a large proportion of the river length drying during summer months (June–September) due to meteorological and hydrological droughts. Furthermore, in the Butižnica DRN, karst plays a major role in drying. The highly permeable substrate allows for substantial water storage in aquifers. This permeability often includes larger openings, facilitating groundwater flow. After prolonged periods without precipitation, groundwater levels can drop, leading to dry riverbeds or partial cessation of flow (where the river continues to flow, but flow is partly above and partly below the ground surface). For instance, in November 2021, the largest tributary to the Butižnica River, the Radljevac, was flowing at the upper sampling location but was dry at the lower part, indicating that the flow continued underground, leaving the surface dry. Some sections of the main river in the Genal(ES) catchment experience drying due to water abstraction for irrigation purposes. Flow intermittence in the Albarine (FR) DRN is caused by its geological characteristics, with seepage of the river streams into a moraine deposit in the downstream part of the catchment and into karstic geology in the upstream part of the catchment. Drying in the Velička (CZ) DRN is caused by a combination of human activities, such as water abstraction and land use changes, and climatic factors related to its continental location that are exacerbated by climate change, with drying events mostly occurring in late-summer and autumn. Lepsämänjoki (FI) is the least intermittent DRN. Flow intermittence is only observed in small headwater streams in July or August and drying events are shorter than in the other DRNs, covering a few weeks at most.
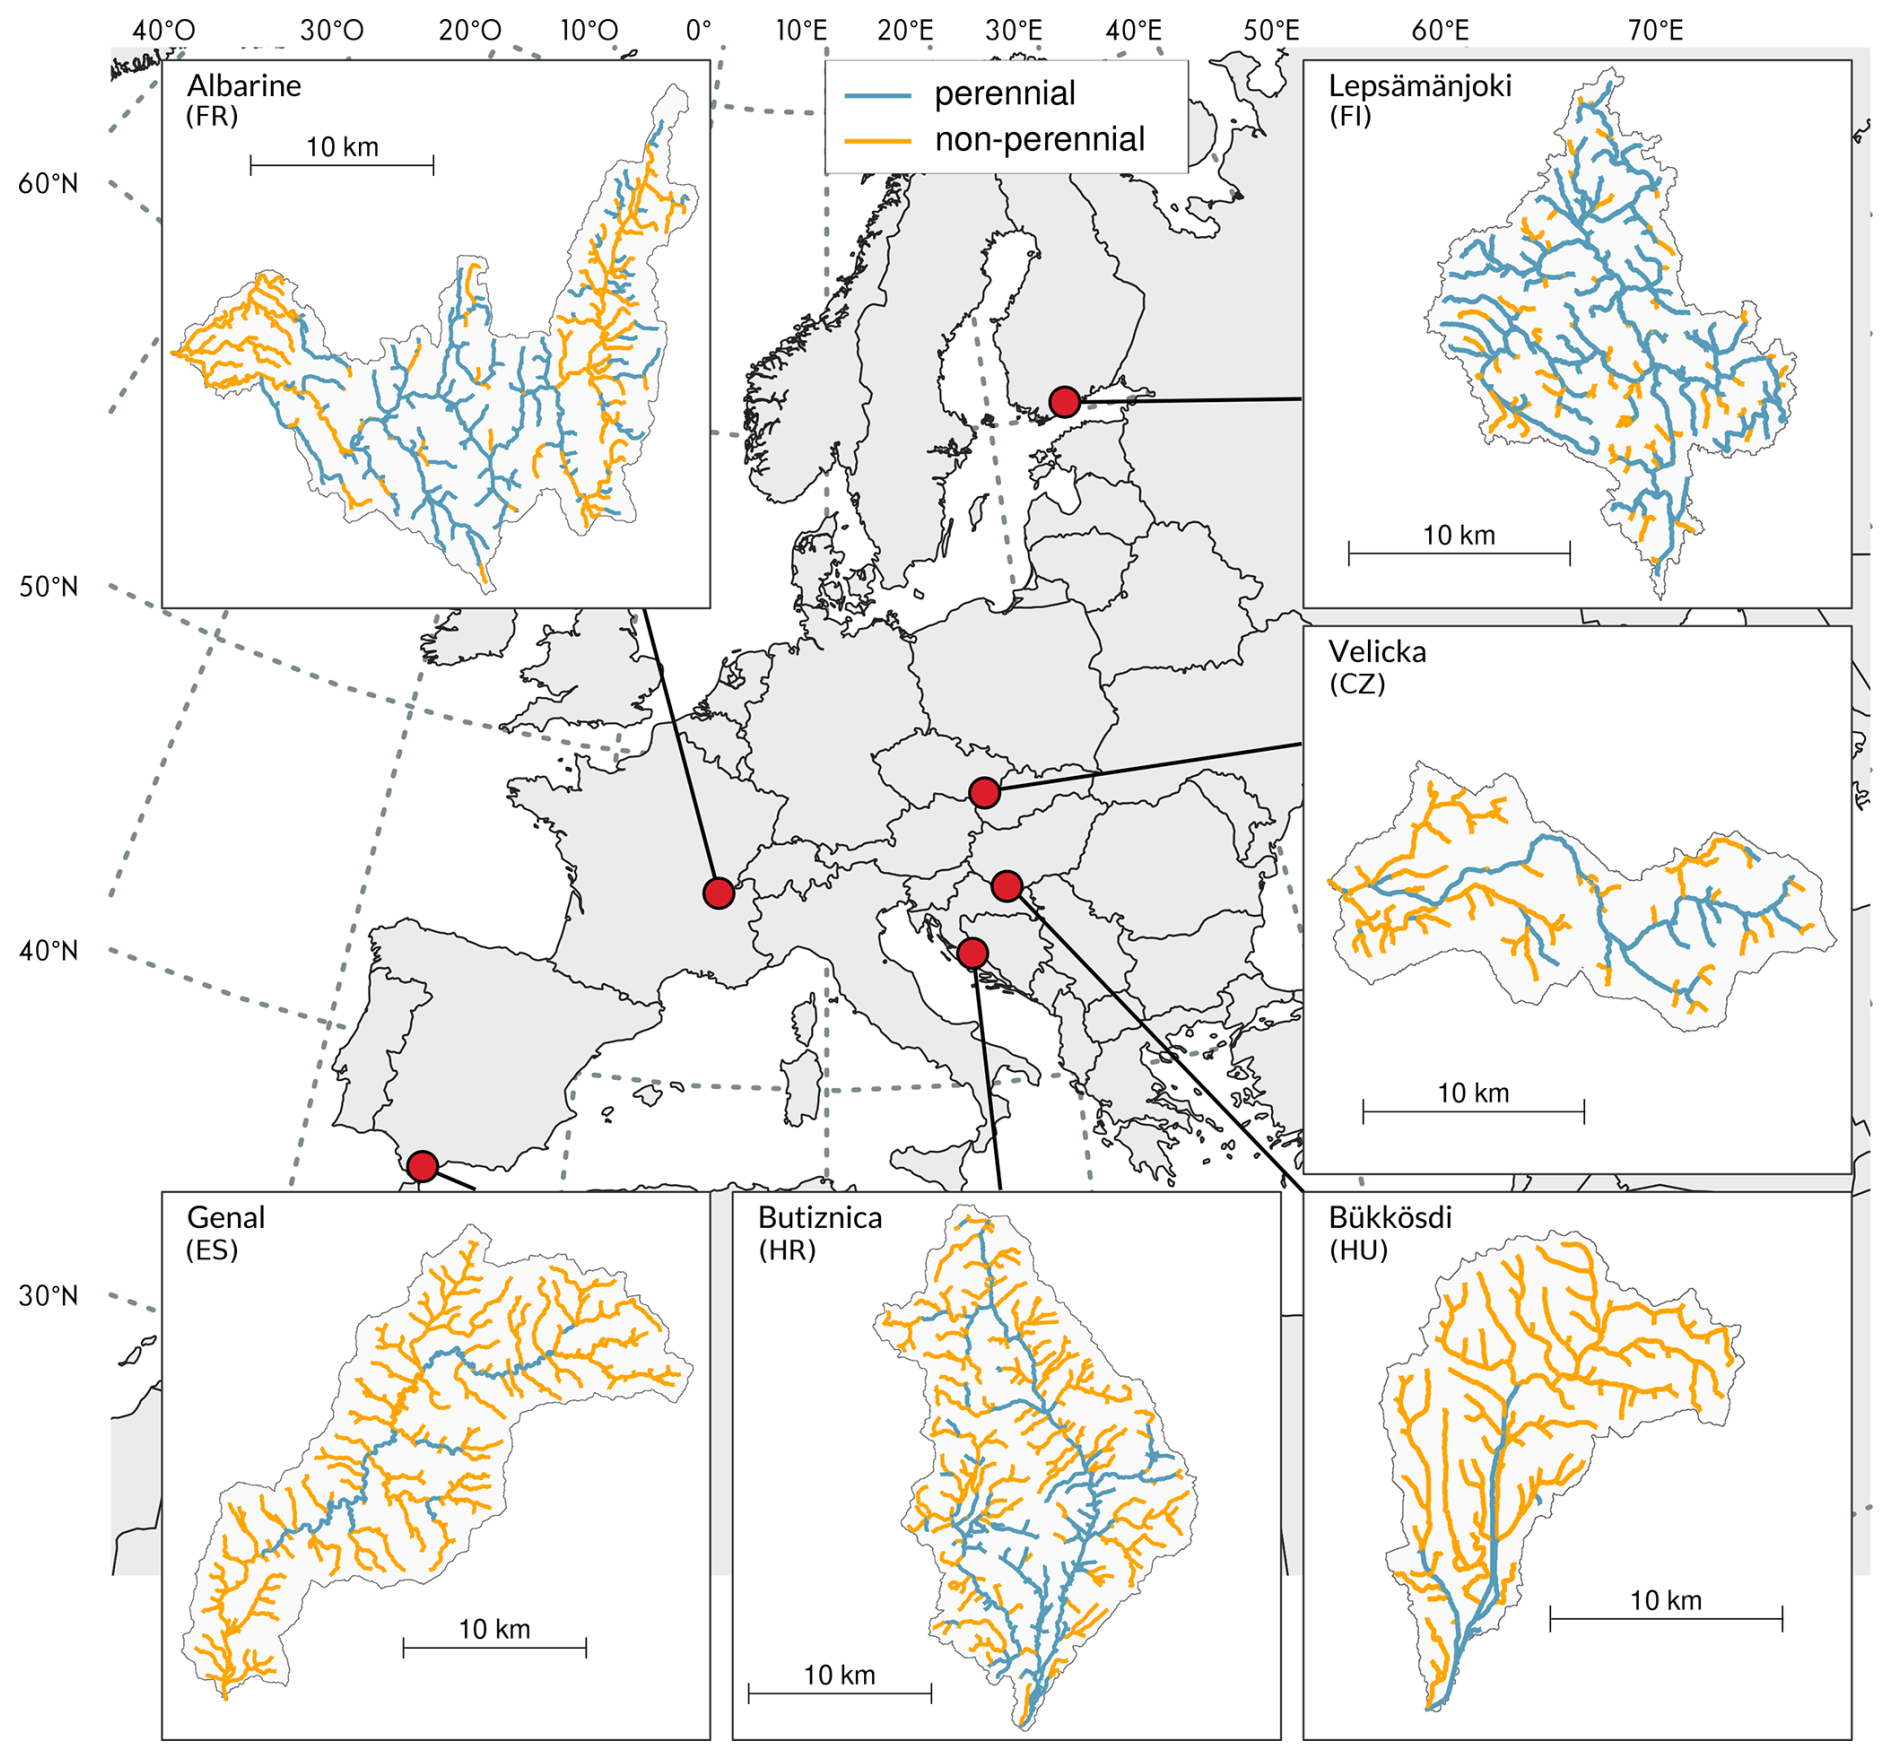
Figure 1Flow intermittence regimes in the six studied DRNs. Flow intermittence regimes for each reach were obtained from the reconstruction simulation over the period from 1985 to 2014 (see Sect. 2.3). A reach is considered to be perennial if the mean of the annual number of dry days is below 1.
Table 1Characteristics of the studied DRNs. Mean annual precipitation and temperature are computed from the ERA5-Land reanalysis for the period from 1991 to 2020.
2.2 Flow intermittence model
This section provides a summary description of the flow intermittence model used in this study; a more detailed description is presented in Mimeau et al. (2024).
Flow intermittence is simulated using a hydrological model coupled to a random forest (RF) model (Fig. 2). The spatially distributed JAMS-J2000 hydrological model (Kralisch and Krause, 2006) is used to simulate the streamflow as well as various hydrological variables such as interception, actual evapotranspiration, water content in the soil and groundwater reservoirs. As the JAMS-J2000 model is unable to represent the drying up of rivers, it is coupled to a statistical RF model (Breiman, 2001) that predicts the daily state of flow using hydrological variables simulated by JAMS-J2000 (streamflow, groundwater contribution to streamflow, evapotranspiration, saturation of the soil reservoir, and saturation of the groundwater reservoir) as well as hydrometeorological variables (precipitation and temperature) and reach characteristics (drainage area, slope, land use, type of soil, and type of geology) as predictors. The RF model is trained using observations of the state of flow collected in the DRNs and then used to predict the state of flow in every reach of the DRNs according to the meteorological and hydrological conditions of the previous days.
There are several reasons for using a hybrid model in this study, rather than a model such as ParFlow, HGS, or MIKE SHE that is able to represent groundwater–river interactions and directly simulate the drying up of rivers. A first reason is that these physically based models are limited by high data requirements, computational costs, and difficulties simulating zero-flow conditions, which are critical for predicting flow intermittence (Shanafield et al., 2021; Gutierrez-Jurado et al., 2021; Herzog et al., 2021). Additionally, the origins of flow intermittence are complex, involving local geological, climatic, and anthropogenic processes, making it difficult for physically based models to capture these dynamics without extensive datasets (Datry et al., 2016, 2018). The hybrid modelling technique used in this study integrates physical hydrological modelling and machine learning to enable robust long-term projections of flow intermittence across high spatial and temporal scales, minimizing data requirements and, consequently, high computational efforts (Mimeau et al., 2024).
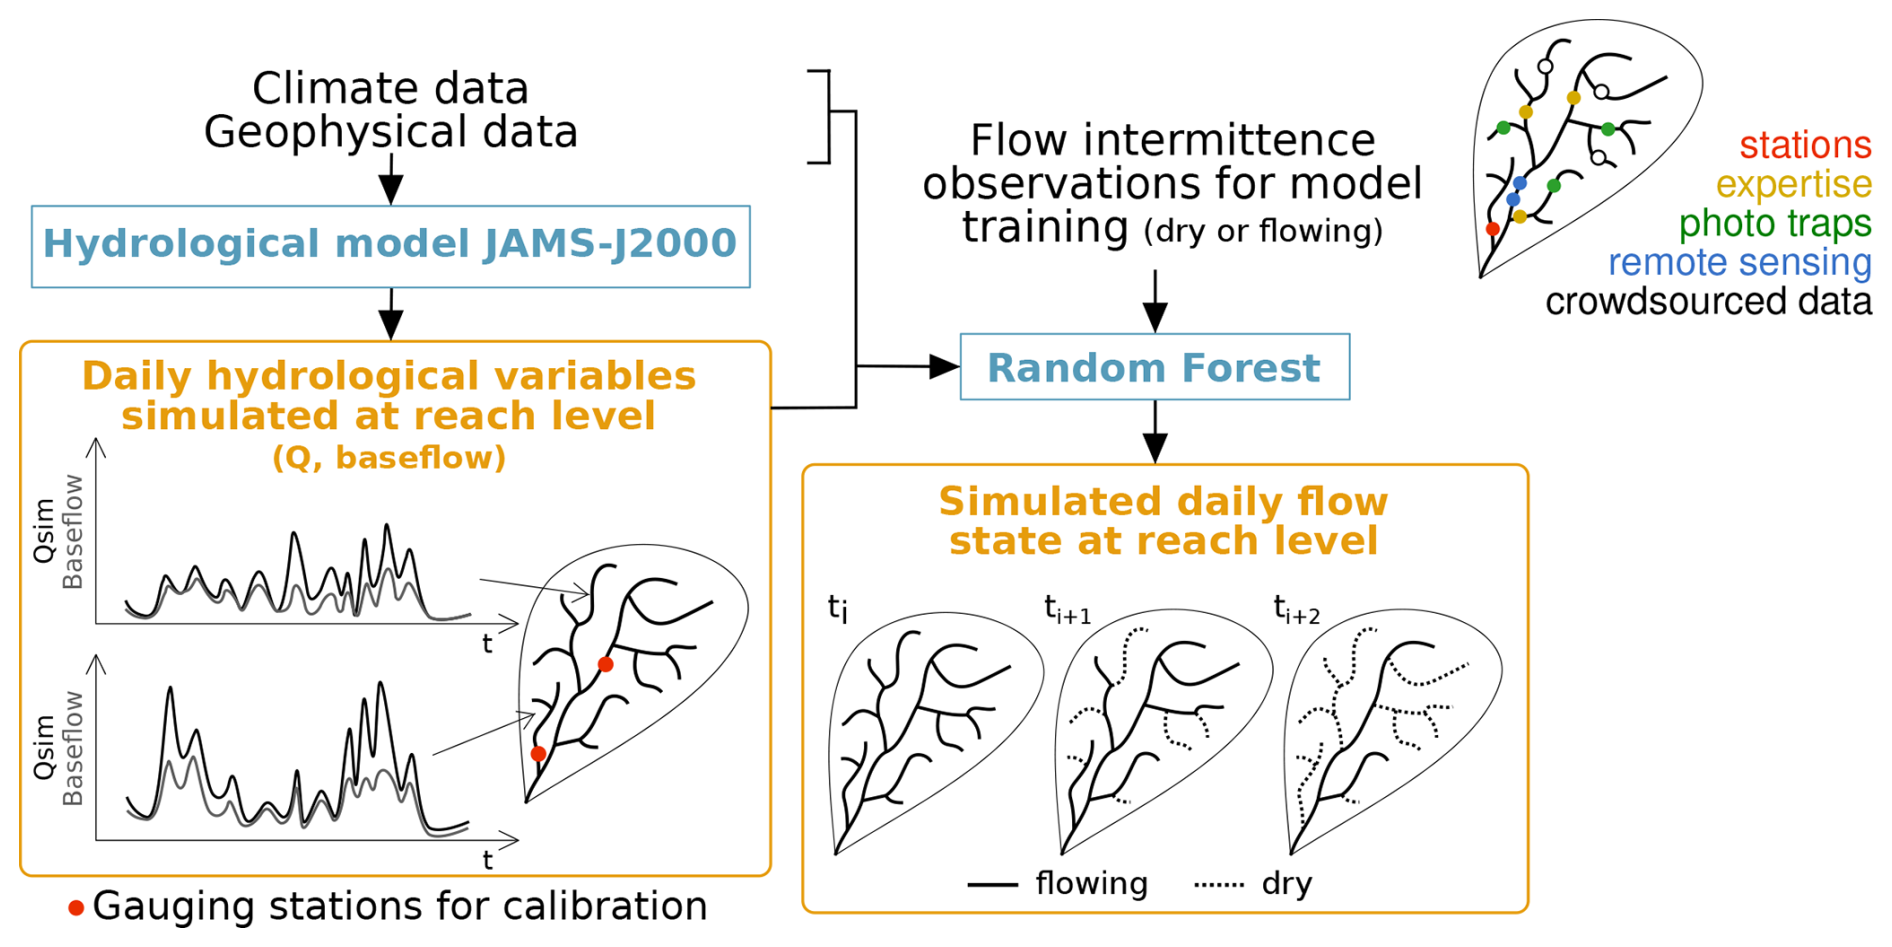
Figure 2Principles of the flow intermittence model (adapted from Mimeau et al., 2024).
The hybrid flow intermittence model was applied in the six studied catchments using (to the extent possible) the same datasets and methodology. The JAMS-J2000 model was calibrated and validated in the DRNs on the period from 1995 to 2020 using gauging station data, and the RF model was trained separately in the six DRNs during the period from 1 October 2005 to 30 April 2022 using multiple datasets of the observed state of flow during the training period.
All information regarding the set-up of the JAMS-J2000 hydrological model (spatial data, parameter values, calibration method, and model performance at the gauging stations) is available in Mimeau et al. (2024) for the Albarine (FR), Genal (ES), and Lepsämänjoki (FI) DRNs or in Künne et al. (2022) for the Bükkösdi (HU), Butižnica (HR), and Velička (CZ) DRNs. Details on the observed state of flow data used to train the RF models are presented in Sect. S1 in the Supplement.
In order to evaluate the flow intermittence model performance, the RF model was trained with 75 % of available observed data selected randomly over the period from 2005 to 2021 and was evaluated on the remaining 25 %. Figure 3 shows the ranges for the probability of detection of drying events (POD) and the false-alarm ratio (FAR) for an ensemble of 20 training and evaluation runs of the RF model. The POD and FAR criteria are computed as follows:
Here, a is the number of dry observations correctly simulated by the model, b is the number of flowing observations that were simulated as dry, and c is the number of dry observations that were simulated as flowing. Figure 3 shows good performance of the flow intermittence model for the Albarine (FR), Bükkösdi (HU), Lepsämänjoki (FI), and Velička (CZ) DRNs, with POD values above 90 % and FAR values of around 5 %. For the respective Butižnica (HR) and Genal (ES) DRNs, the average POD is equal to 71 % and 65 % and the average FAR is 12 % and 19 %. The poorer performance of these two DRNs can be explained by the lack of observed data on which to train the RF model (Table S1 and Fig. S1).
To reduce the number of simulations for the projection scenarios and to use most of the observed data, only one member of the RF models trained with 100 % of the observed data is used in the rest of the study. Figure S2 shows the simulated seasonal drying pattern with the selected member for each of the DRNs compared with the seasonal drying patterns obtained with the full RF model ensemble. The uncertainty related to the training of RF models under data-scarce conditions is discussed in greater details in Mimeau et al. (2024).
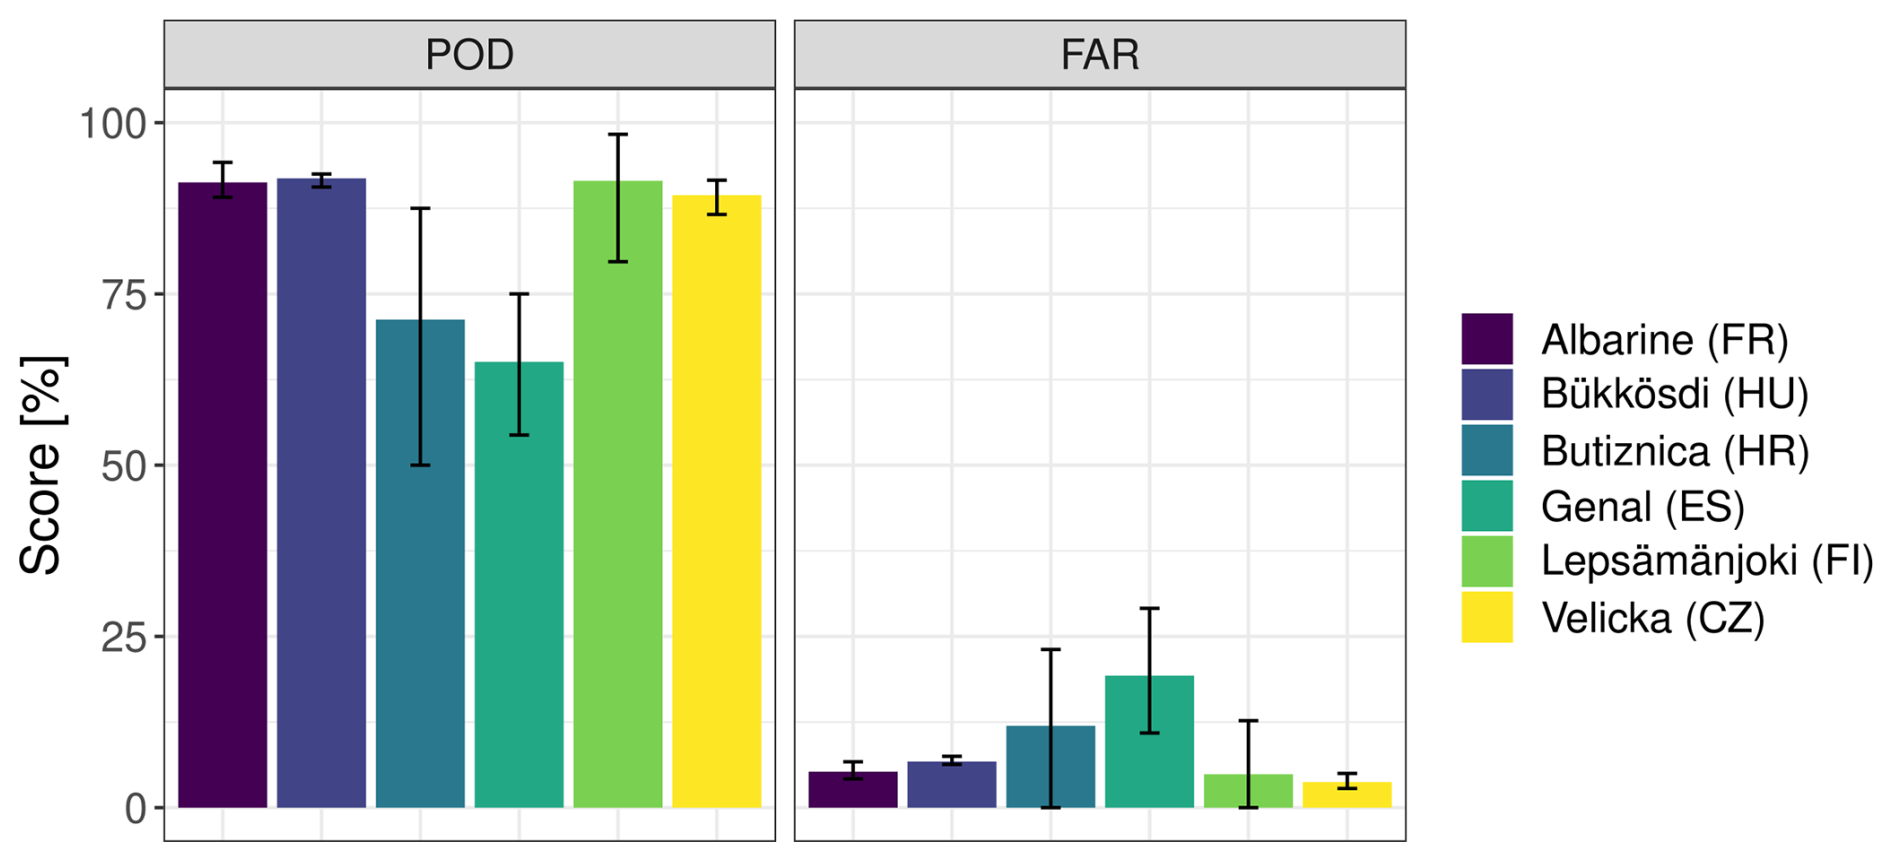
Figure 3Performance of the flow intermittence model on the training period (2005–2021) for the six DRNs. Bars show the average value for the 20-member ensemble, while error bars present the minimum and maximum values for the 20-member ensemble. POD denotes the probability of detecting a drying event. FAR is the false-alarm ratio.
2.3 Reconstruction simulations
To simulate flow intermittence during the past observed period (1960–2021), the flow intermittence model was forced with the ERA5-Land reanalysis (Muñoz-Sabater et al., 2021). The following variables were extracted at an hourly time step and 0.1° spatial resolution over the six studied catchments between 1 January 1950 and 31 December 2021 and then aggregated at a daily time step:
-
2 m air temperature (°C),
-
2 m dew point temperature (°C),
-
2 m relative humidity (%),
-
10 m u and v wind speed components (m s−1),
-
surface pressure (Pa),
-
surface downward solar radiation (W m−2),
-
surface downward thermal radiation (W m−2),
-
total precipitation (mm).
The daily variables are then used to calculate the reference evapotranspiration using the Penman–Monteith equation (Allen et al., 1998).
The model is then forced with the daily time series of precipitation, temperature, and reference evapotranspiration. Simulations are run over the period from 1950 to 2021, and results are analysed over the period from 1960 to 2021, removing the first 10 years of initialization.
2.4 Future projections
Climate projections from the Inter-Sectoral Impact Model Intercomparison Project (ISIMIP3a and ISIMIP3b, http://www.isimip.org, last access: 19 August 2024) were used. This study uses projections from five Coupled Model Intercomparison Project Phase 6 (CMIP6) general circulation models (GCMs) (GFDL-ESM4, IPSL-CM6A-LR, MPI-ESM1-2-HR, MRI-ESM2-0, and UKESM1-0-LL) selected in the ISIMIP project on the basis of their historical performance and to reflect the climate sensitivity of the full CMIP6 ensemble (Frieler et al., 2024). Three SSP scenarios are considered: SSP1-2.6 – “Sustainability”; SSP3-7.0 – “Regional rivalry”; and SSP5-8.5 – “Fossil-fuelled development”.
The data were extracted at a daily time step between 1971 and 2100. The variables extracted are the same as for the ERA5-Land reanalysis, and evapotranspiration was calculated with the Penman–Monteith equation. The GCM projections, with a 0.5° spatial resolution, were downscaled to obtain high-resolution projections with a 0.1° spatial resolution using the analogy method, which is fully described in Devers et al. (2023). The downscaling method produced 20-member ensembles for each GCM–SSP scenario combination for the six studied catchments. The dispersion of the 20 members relates to the uncertainty in the analogue downscaling method. As stated by Devers et al. (2023, see e.g. their Fig. 4), this uncertainty is rather negligible with respect to both the SSP uncertainty and the GCM uncertainty. As a consequence (and in order to limit the computation time), only one member is considered in the following. Moreover, the 20-member ensemble was built to be unbiased as a whole, with individual members being either slightly too wet or slightly too dry systematically over time. Therefore, the 10th member at the centre of the distribution was chosen to minimize the bias in downscaled projections.
The high-resolution projections of daily temperature, precipitation, and evapotranspiration produced by the downscaling method were used to force the flow intermittence model over the 1971–2100 period, including a 14-year initialization period.
To clarify the terminology used throughout the paper, we provide the following definitions:
-
Reconstruction period refers to simulations of flow intermittence during the past observed period (1960–2021) using climate reanalysis data from ERA5-Land as forcing data. These simulations aim to reconstruct historical hydrological conditions based on observed climate data.
-
Historical period (1985–2014) refers to simulations of flow intermittence under historical climate conditions, utilizing climate projections from the ISIMIP3a. These simulations are based on climate data obtained from the five climate models used, and they serve as a baseline for comparison with future scenarios.
-
The terms future projections and SSP scenarios (2015–2100) refer to different Shared Socioeconomic Pathway (SSP) scenarios used to represent plausible future socioeconomic and climate trajectories. In this study, we consider three SSP scenarios: SSP1-2.6 (Sustainability), SSP3-7.0 (Regional rivalry), and SSP5-8.5 (Fossil-fuelled development), each representing different assumptions about future societal and economic development pathways and corresponding greenhouse gas (GHG) emissions. These simulations are conducted for each GCM across the 3 SSP scenarios, resulting in a total of 15 simulations (5 GCMs × 3 SSP scenarios). In Sect. 3, the flow intermittence projections are analysed for two time horizons: the medium term (2041–2070) and the long term (2071–2100).
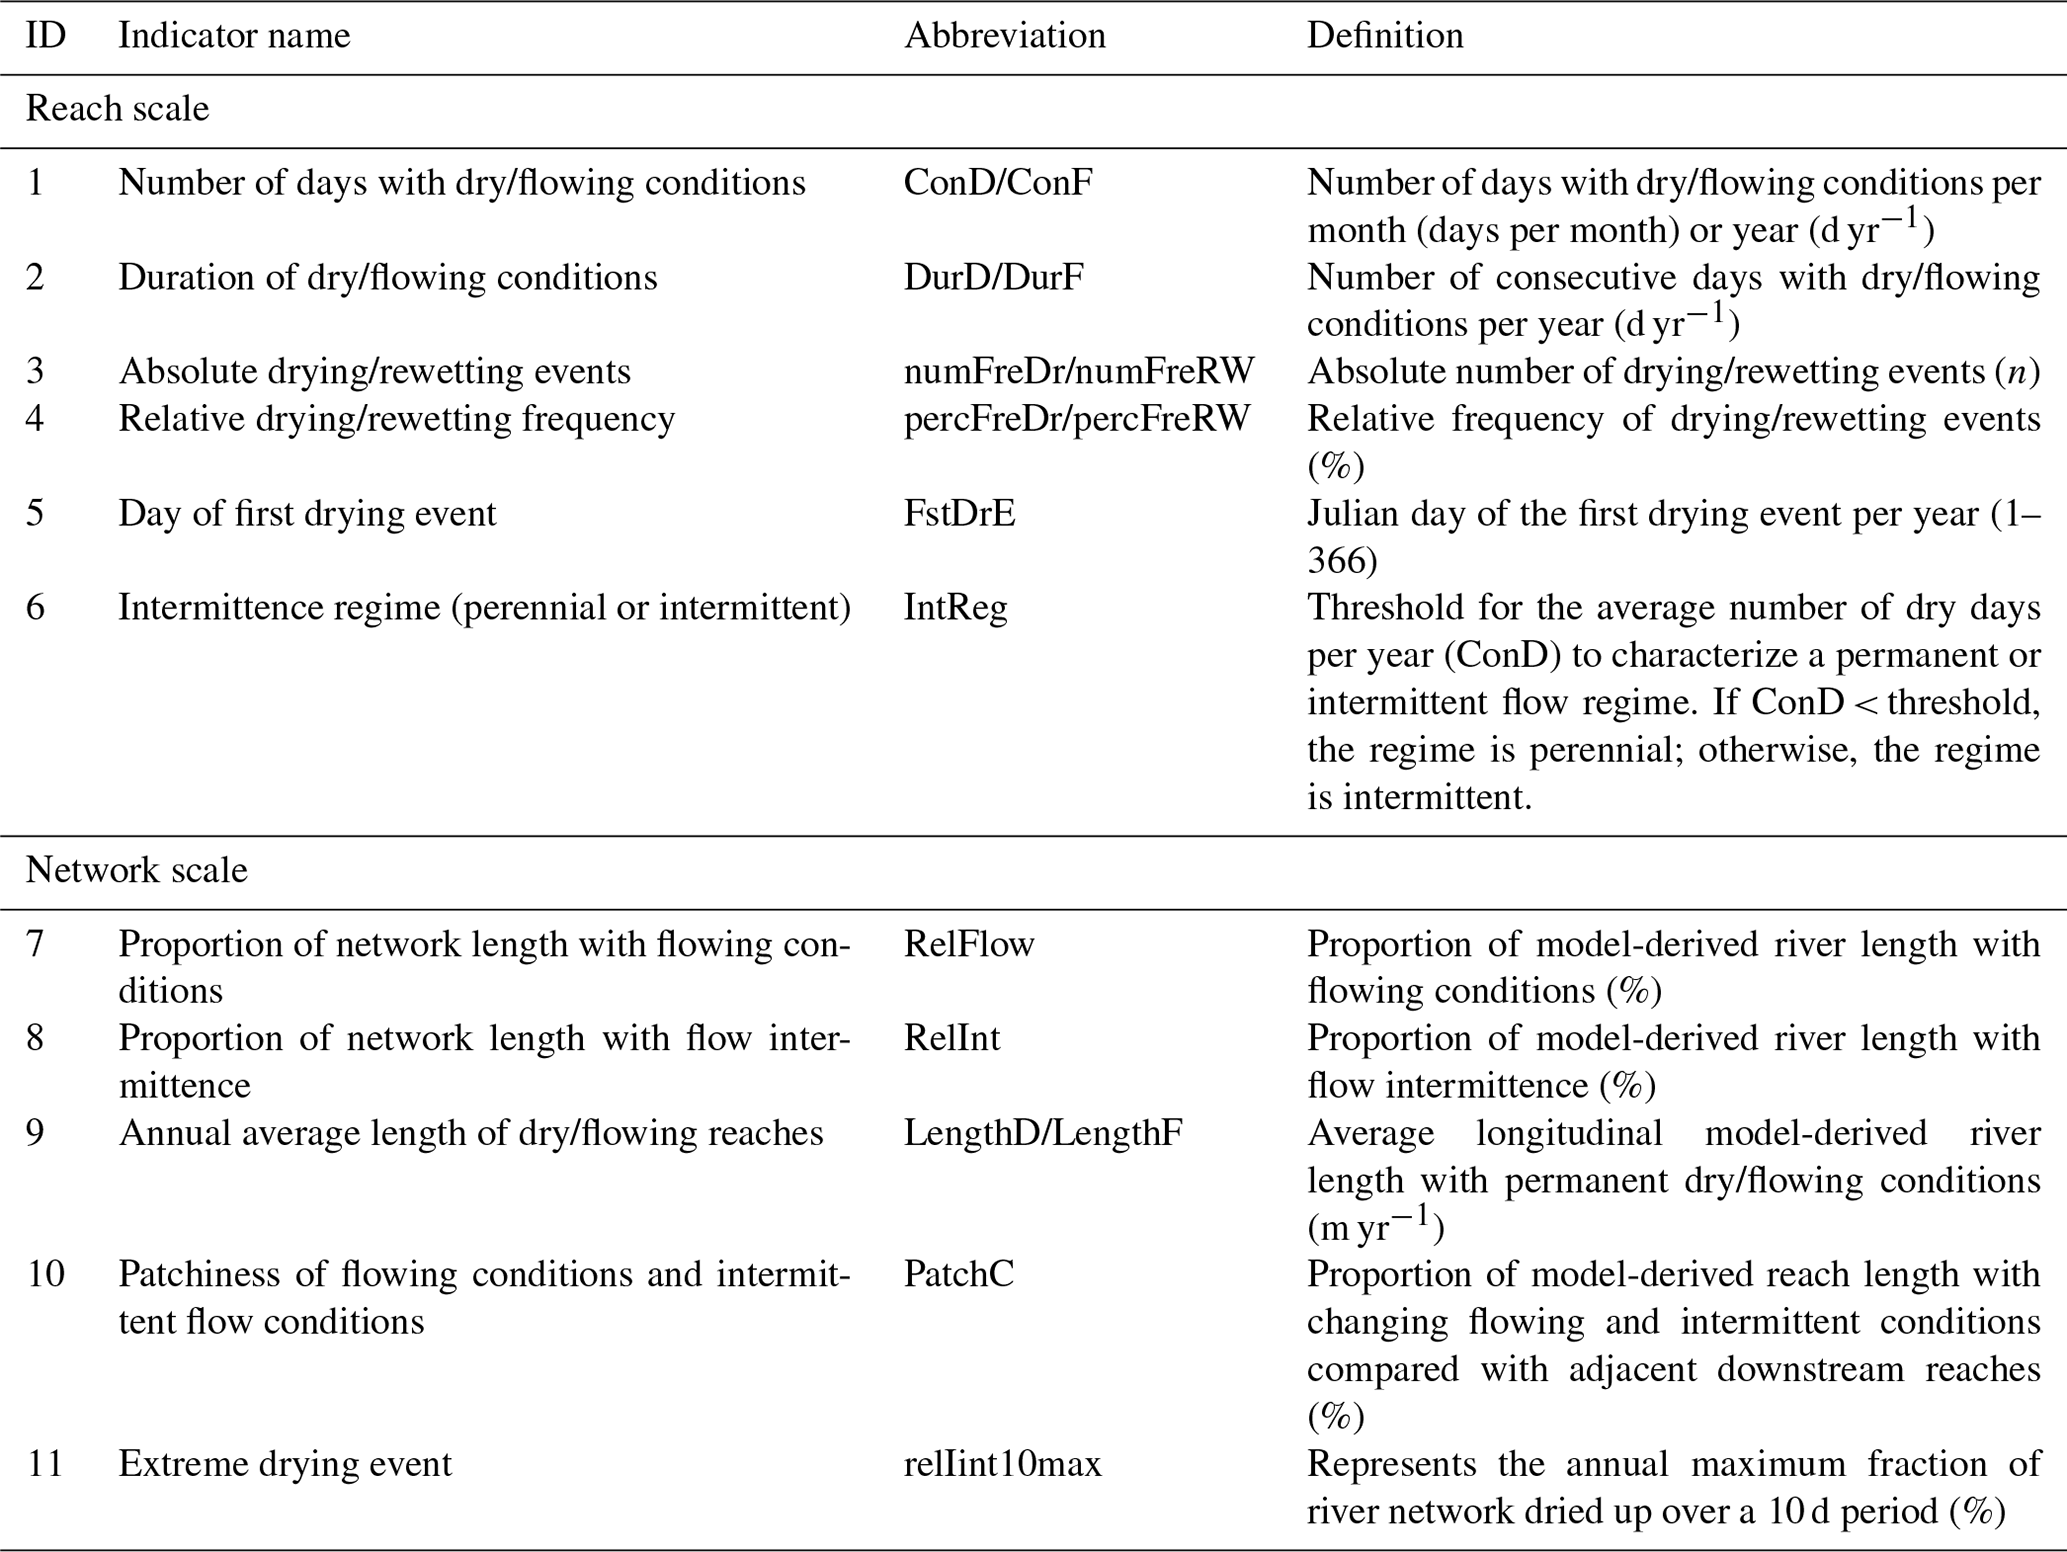
2.5 Flow intermittence indicators
To better quantify and evaluate the modelled outputs of flow intermittence at the reach scale, a suite of flow intermittence indicators was developed. This was a joint effort within the DRYvER project consortium to ensure that these indicators provide insights into the impact of flow intermittence on biological, chemical, and socioeconomic processes and potential change signals under present and projected climate conditions (Künne and Kralisch, 2021). In this study, a subset of these indicators were used to assess hydrological patterns and projected changes. Their definitions are listed in Table 3. They either quantify information in relation to the reach scale (i.e. ID 1–6) or the river network scale (i.e. ID 7–11). At the reach scale, flow intermittence is quantified differently by several indicators on a monthly and annual basis. The number of days with dry (ConD) or flowing (ConF) conditions (ID1 in Table 3) allows one to track how frequently a river reach experiences these states over different timescales, which helps to identify seasonal patterns and long-term trends. In addition to the frequency, the duration of dry (DurD) or flowing (DurF) conditions (ID2 in Table 3) measures the number of consecutive days that a reach remains in these states within a year. This provides insights into the persistence of specific hydrological conditions. The absolute number of drying (numFreDr) or rewetting (numFreRW) events (ID3 in Table 3) and their relative frequencies (percFreDr and percFreRW; ID4 in Table 3) help to understand the dynamics of flow intermittence by counting transitions between dry and wet states. On an annual basis, we also examine the day of the first drying event (FstDrE; ID5 in Table 3), which records the Julian day on which the first drying event occurs each year. This is crucial for understanding changes in the onset of dry conditions in reaches. Furthermore, the intermittence regime (IntReg; ID6 in Table 3) classifies the flow regime of a reach as either perennial or intermittent based on the average number of dry days per year: this threshold can be adapted for each DRN, based on the different climatological and environmental characteristics of the basin. In this study, we define a reach as perennial if it experiences less than 1 d of flow intermittence on average over a 30-year period. Conversely, a reach is considered non-perennial if it experiences more than 1 d of flow intermittence on average over the same period.
At the network scale, several indicators help to assess spatial patterns of drying and connectivity. The proportion of network length with flowing conditions (RelFlow; ID7 in Table 3) measures the percentage of the river network experiencing flowing conditions. Similarly, the proportion of network length with flow intermittence (RelInt; ID8 in Table 3) quantifies the extent of intermittent flow conditions within the network. Moreover, annually and at the network scale, the average longitudinal length of dry (LengthD) or flowing (LengthF) reaches (ID9 in Table 3) is calculated, providing a spatial dimension to flow intermittence by determining the average length of reaches experiencing permanent dry or flowing conditions each year. In addition, the patchiness of flowing conditions or intermittent flow conditions (PatchC; ID10 in Table 3) assesses the proportion of the river network where flow conditions change between adjacent downstream reaches, thereby enabling computation of the variability in flow conditions. The indicator can help to identify where flow conditions change frequently along the stream, which can be crucial for understanding habitat connectivity and ecological dynamics. Finally, the extreme drying events (RelInt10max; ID11 in Table 3) describe the annual maximum fraction of the river network that dries up over a 10 d period, helping to identify and quantify extreme drying events that can have significant impacts on aquatic ecosystems and water quality.
These indicators allow a comprehensive assessment of flow intermittence across different temporal and spatial scales, providing valuable insights into the dynamics of drying river networks under current and future climate conditions. The calculation of these indicators is explained in more detail in Sect. S2 in the Supplement.
Table 3The suite of indicators and their definitions at the reach scale and network scale.
3.1 Climate and hydrological projections
Figure 4 shows the evolution of climate and hydrological variables in the DRNs for the three SSP scenarios. Projections of the mean annual temperature and precipitation are directly obtained from the downscaled climate projections, and projections of mean annual actual evapotranspiration and streamflow are simulated with the JAMS-J2000 models. Flow trends are given for river sections corresponding to the location of gauging stations (see Fig. S3), where streamflow is known to be perennial. The mean annual temperature is increasing in the DRNs and across the three SSP scenarios. For the SSP1-2.6 scenario, temperatures rise during the first half of the 21st century and then start to fall, with an increase in 2071–2100 compared with 1985–2014 that ranges between +1.2 and +2.0 °C. For the SSP3-7.0 and SSP5-8.5 scenarios, temperatures keep rising until 2100. The temperature increase by 2071–2100 ranges between 3.2 and 4.6 °C for SSP3-7.0 and between 4.1 and 5.6 °C for SSP5-8.5.
The trends in precipitation vary depending on the scenario and DRN. For the SSP1-2.6 scenario, there is no clear trend in the six DRNs. However, for the SSP3-7.0 and SSP5-8.5 scenarios, there is a north–south gradient in precipitation changes, with a slight increase in cumulative annual precipitation in Lepsämänjoki (FI) (+4 % for SSP3-7.0 and SSP5-8.5), a slight decrease in the Albarine (FR) and Velička (CZ) basins (between −5 % and −9 % for SSP5-8.5), a more marked downward trend for Bükkösdi (HU) and Butižnica (HR) (−7 % for SSP3-7.0 and −14 % for SSP5-8.5), and a sharp decrease for the Genal (ES) (−26 % for SSP3-7.0 and −33 % for SSP5-8.5).
Due to the temperature increase, evapotranspiration tends to increase for the three SSP scenarios for Lepsämänjoki (FI), Velička (CZ), Albarine (FR), and Butižnica (HR). The increase in evapotranspiration is greatest for Lepsämänjoki (FI) (+17 % for SSP5-8.5 by 2071–2100), due to the combined effect of rising temperatures and precipitation. For the Bükkösdi (HU) and Genal (ES) basins, evapotranspiration decreases by 2071–2100 for the SSP3-7.0 (−3 and −12 %) and SSP5-8.5 (−9 and −17 %) scenarios because, as a result of falling precipitation, the evaporative demand can no longer be met.
Streamflow decreases sharply for all DRNs and for the three SSP scenarios. The Lepsämänjoki (FI) dries out the least, with a decrease in streamflow that ranges between −10 % and −17 %, depending on the SSP scenario, by the end of the 21st century as the increase in evapotranspiration is partly compensated for by the increase in precipitation. For the other DRNs, the decrease in streamflow at the end of the century is particularly significant for the SSP3-7.0 and SSP5-8.5 scenarios. The mean annual streamflow in the Bükkösdi (HU), Genal (ES), and Velička (CZ) catchments could be reduced by more than half by 2071–2100 for SSP5-8.5. All of the projected values for temperature, precipitation, evapotranspiration, and streamflow for 2071–2100 for the three SSP scenarios and six DRNs are given in Table S2.
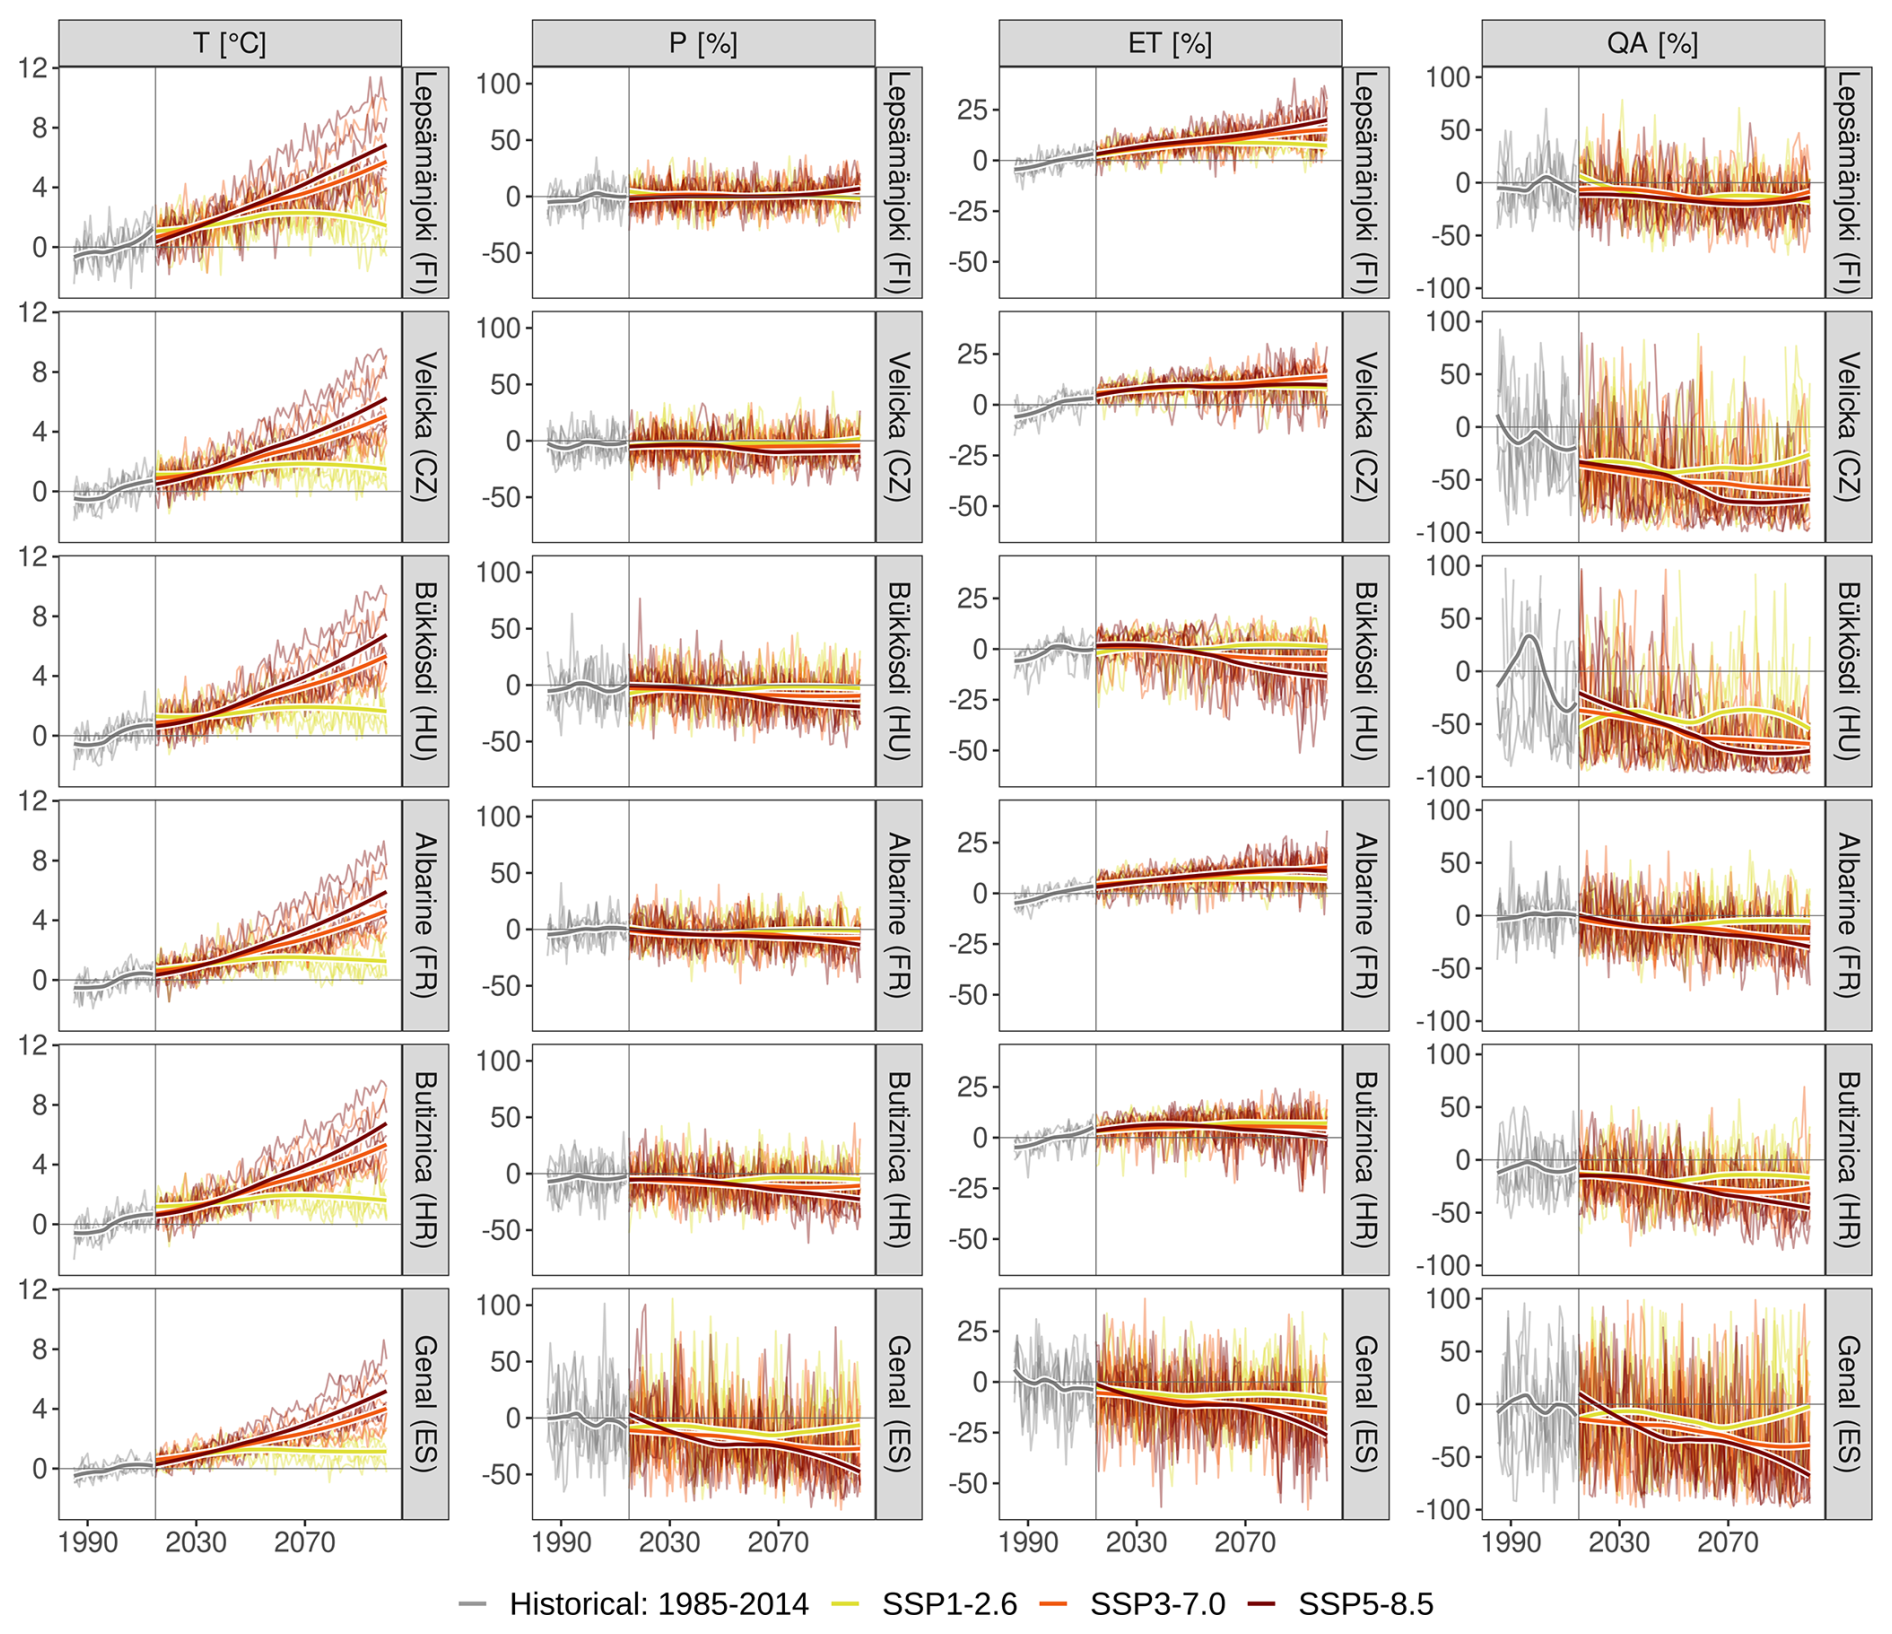
Figure 4Projections of annual temperature (T), precipitation (P), actual evapotranspiration (ET), and streamflow at the main gauging station (QA) (see Fig. S3 for the locations of the gauging stations) for the three SSP scenarios (anomaly compared to the historical reconstruction). Thin lines represent the results obtained for the five downscaled GCM models, whereas wider lines represent the smoothed average of the five GCMs.
3.2 Flow regime transition
In this section, we analyse the evolution of flow regimes in river systems under climate change scenarios. As a reminder, in this study, a reach is defined as perennial if it has less than 1 d of dryness on average per 30-year period or as non-perennial in the opposite case. Figure 5a shows the majority flow regime simulated with the SSP5-8.5 scenario for the period from 2071 to 2100 in the DRNs for the five GCMs; in particular, it shows the reaches for which there is a transition from a perennial to a non-perennial regime compared with the historical period. Figure 5b show the temporal evolution of the proportion of river length with a perennial flow regime for the three SSP scenarios. For the six DRNs, the results show a decrease in the projected length of rivers with a perennial flow regime in 2041–2070 and 2071–2100 compared with 1985–2014.
In the Genal (ES) and Velička (CZ) DRNs, a very high proportion of the river networks could transition from a perennial to a non-perennial regime by the end of the 21st century. The results show a −57 % (for SSP3-7.0) and −60 % (for SSP5-8.5) decrease in the length of perennial rivers in Velička and a decrease of −77 % (for SSP3-7.0) and −93 % (for SSP5-8.5) in Genal. For the Velička DRN, the flow regime transitions occur mainly in the downstream part of the catchment, notably on sections of the main river. For the Genal DRN, transitions occur along the main river, making almost all of the river network river intermittent.
Lepsämänjoki (FI) and Butižnica (HR) also have a significant proportion of their river network switching to a non-perennial regime by 2071–2100 (on average, −19 % of the perennial river length for Lepsämänjoki and −39 % for Butižnica with SSP5-8.5), although with different spatial patterns of regime shift. For the Lepsämänjoki DRN, the flow regime transitions mainly occur in the headwater reach, whereas the transitions occur for all types of reaches, from the headwaters to the main river sections, in Butižnica.
There are less projected transitions from perennial to non-perennial regimes in the Albarine (FR) and Bükkösdi DRNs. For the Bükkösdi DRN, this is mainly due to the fact that the river network is already highly intermittent during the historical period. For the Albarine DRN, a few reaches, mainly located in the two main areas of flow intermittence (downstream and all the way upstream), show a switch in their flow regime with SSP5-8.5. The low proportion of the river section with a regime transition in the Albarine compared with similar DRNs such as Velička (CZ) and Butižnica (HR) could be due to the flow intermittence model structure (see Sect. 4.5).
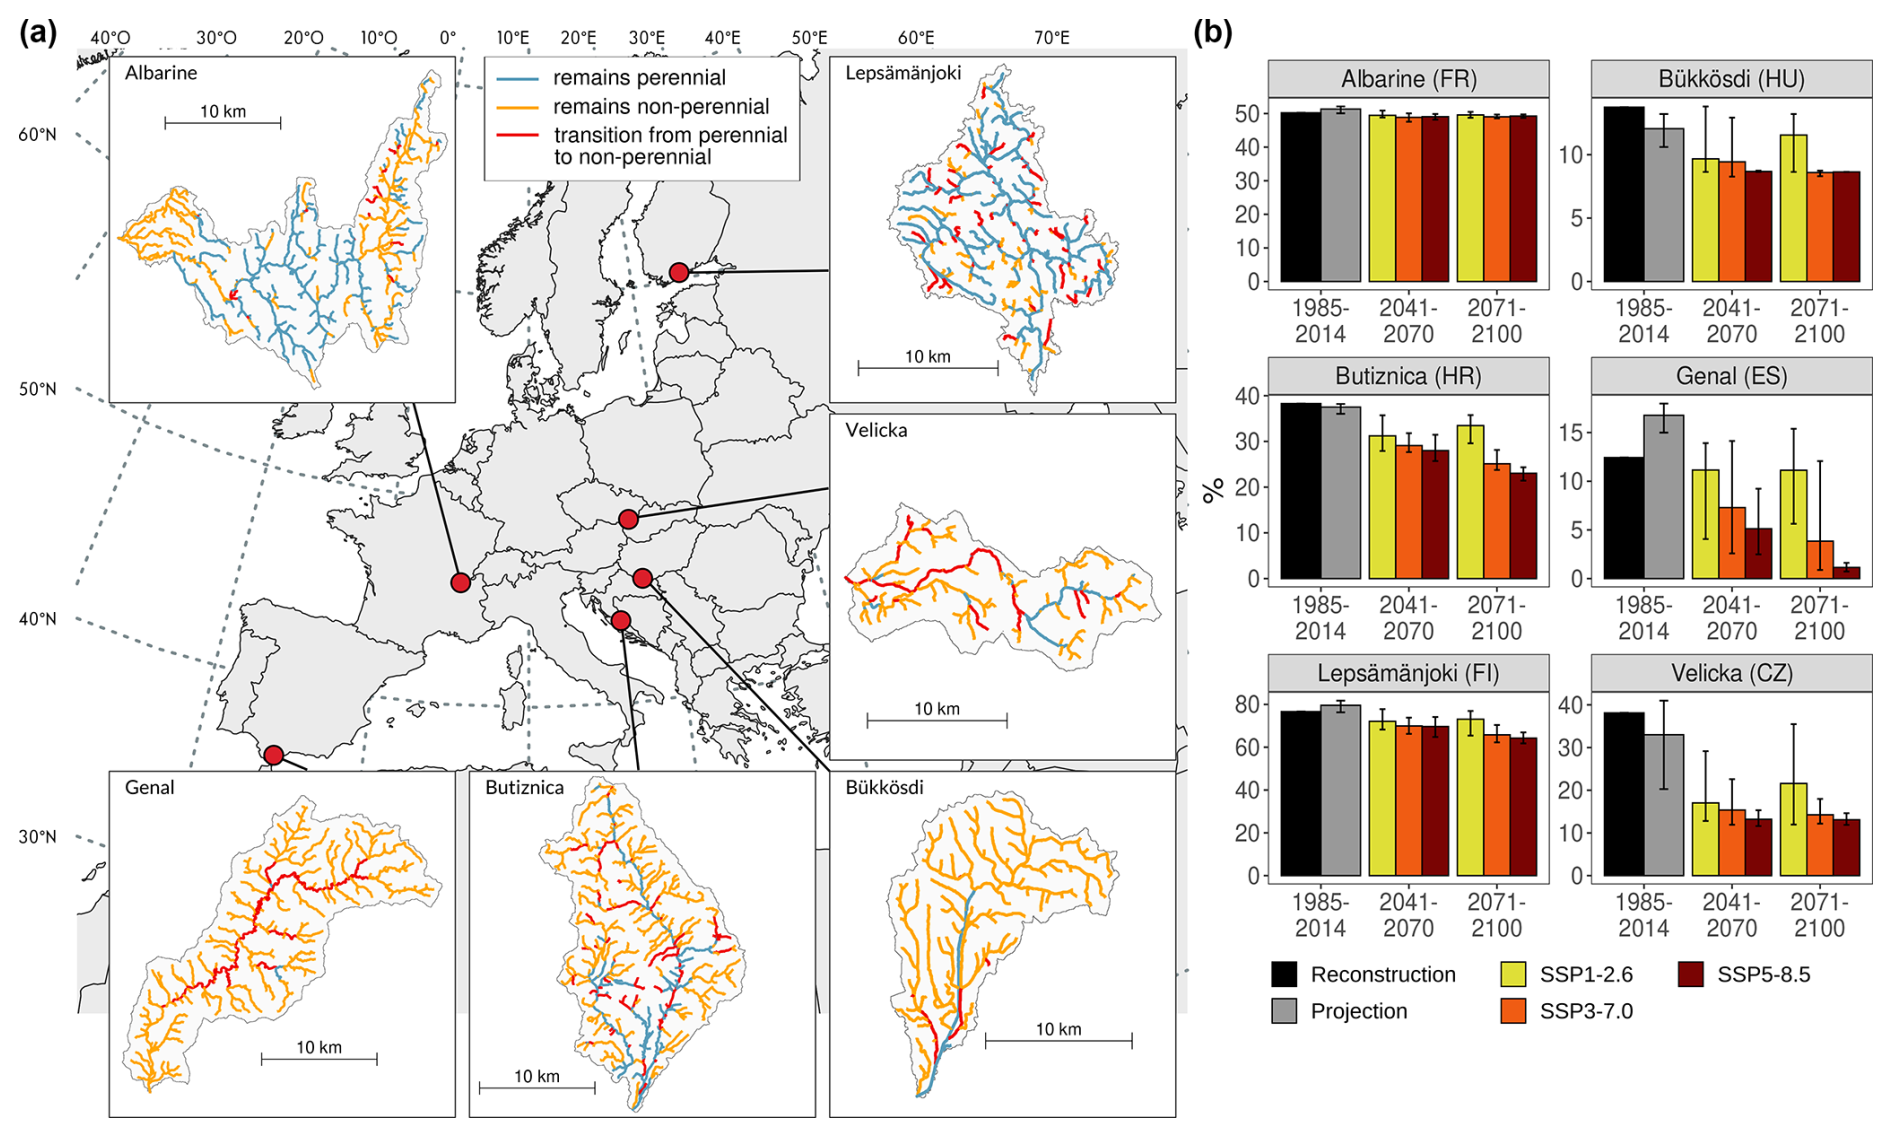
Figure 5(a) The evolution of flow regimes (2071–2100 vs. 1985–2014) for SSP5-8.5. Red colour shows the reaches for which three or more GCMs present a transition from a perennial to a non-perennial regime. (b) Evolution of the proportion of river length with a perennial flow regime for scenarios SSP1-2.6, SSP3-7.0, and SSP5-8.5. Bar plots show the average of the five GCMs, while error bars present the range of the five GCMs.
3.3 Evolution of flow intermittence in the river networks
As a result of the decrease in streamflow simulated by the JAMS-J2000 hydrological model, the flow intermittence model simulates a strong increase in the average annual length of dry rivers by 2100 (Fig. 6). For the SSP1-2.6 scenario, the annual length of the dry river network keeps increasing until 2050 and then stabilizes or slightly decrease in the second half of the century. For scenarios SSP3-7.0 and SSP5-8.5, drying continues to increase until 2100.
The intensification of drying up is greatest in the Bükkösdi (HU) DRN, with 94 km (+43 %) more river drying up on average per year by 2071–2100 than in the historical period for SSP5-8.5. Lepsämänjoki (FI) is the DRN with the smallest increase in drying, with +8 km (+3 %) of dry rivers on average by 2071–2100. For the other DRNs, the anomaly of annual dry river length ranges between +6 % and +13 % for the SSP5-8.5 scenario: +46 km (+13 %) for Genal (ES), +13 km (+8.5 %) for Velička (CZ), +35 km (+8.4 %) for Butižnica (HR), and +24 km (+6.1 %) for Albarine (FR).
Figure 7 shows the evolution of the seasonal patterns of drying in the DRNs by 2071–2100. For the Lepsämänjoki (FI) DRN, drying become more intense during the summer season: July stays the driest month in the projections, but the drying up season is longer starting in May and ending in June vs. June–August for the historical period. For the Albarine (FR) DRN, the drying period also increases, with its maximum of drying up shifted to the end of the summer and the end of drying up later, until October. For the Butižnica (HR) DRN, the projections show a strong modification of the seasonal pattern of drying, with intensification of drying during the second half of the year. The driest period is shifting from May to September for the historical period to June to November for the period from 2071 to 2100. For the Velička (CZ) and Bükkösdi (HU) DRNs, the intensification of drying is fairly homogeneous throughout the year. For these two DRNs, projections show an increase in drying during both the summer and winter season. The Genal (ES) DRN, is the only DRN showing a higher intensification of drying during the winter season than during the summer season. This is due to the fact that the Genal river network is already very dry in summer in the historical season (around 70 % of the river network dries up in July–August) and cannot dry up much further in the future, even for the SSP5-8.5 scenario.
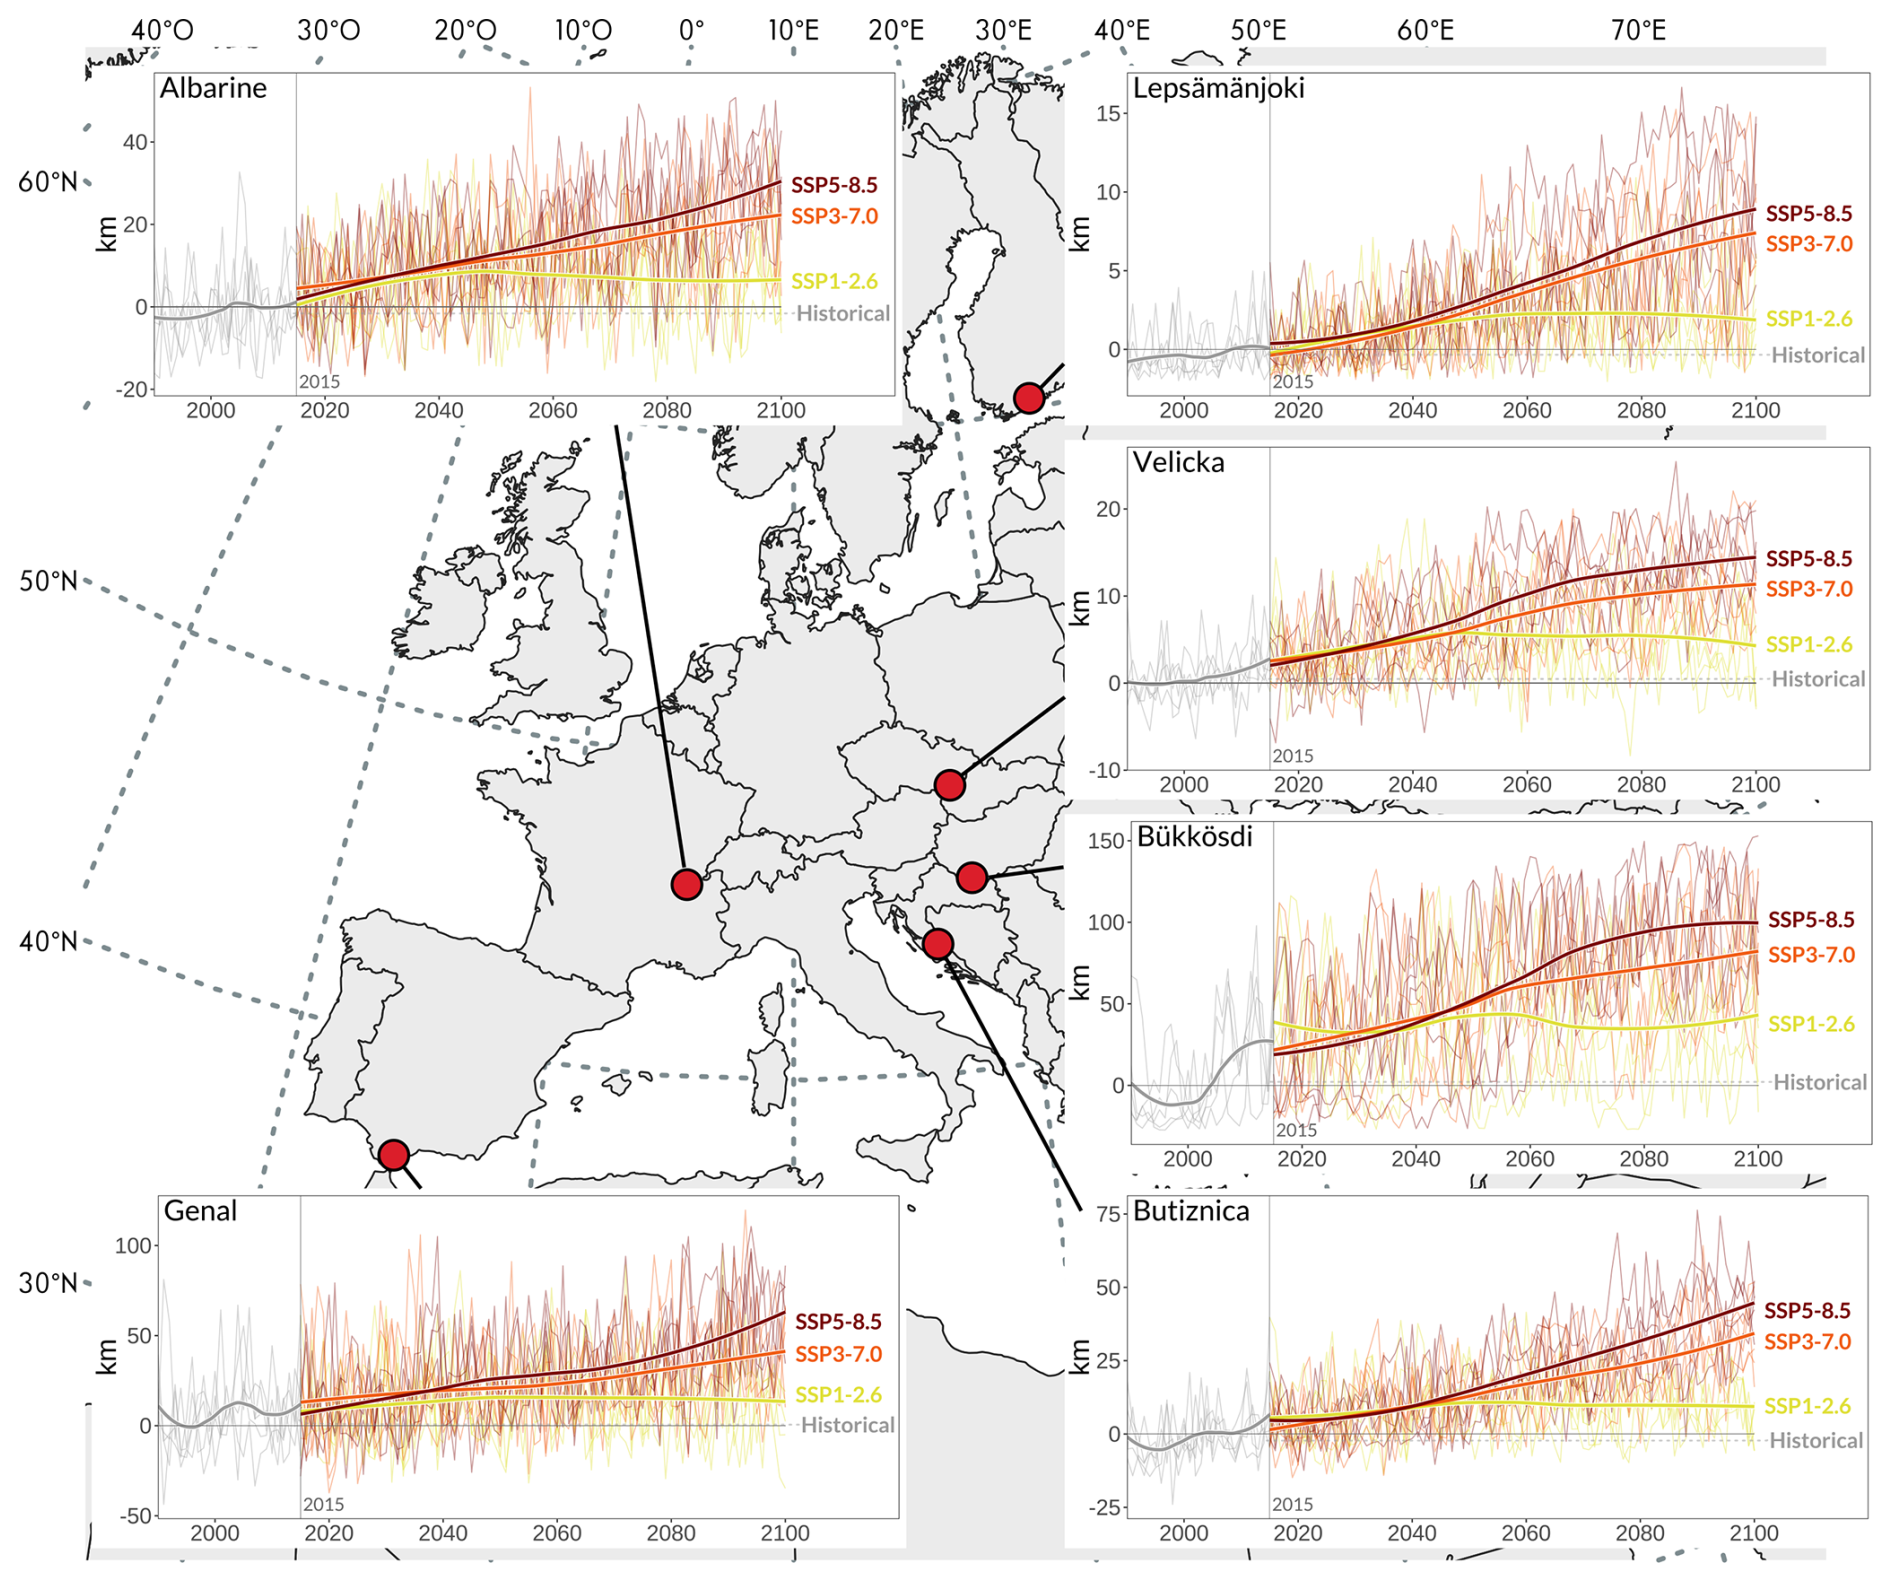
Figure 6Anomaly of the mean annual length of dry river network (in km) compared with the historical reconstruction for the three SSP scenarios. Thin lines represent the results the five downscaled GCM models, whereas wider lines show the smoothed average of the five GCMs. The y-axis scale is different for each DRN.
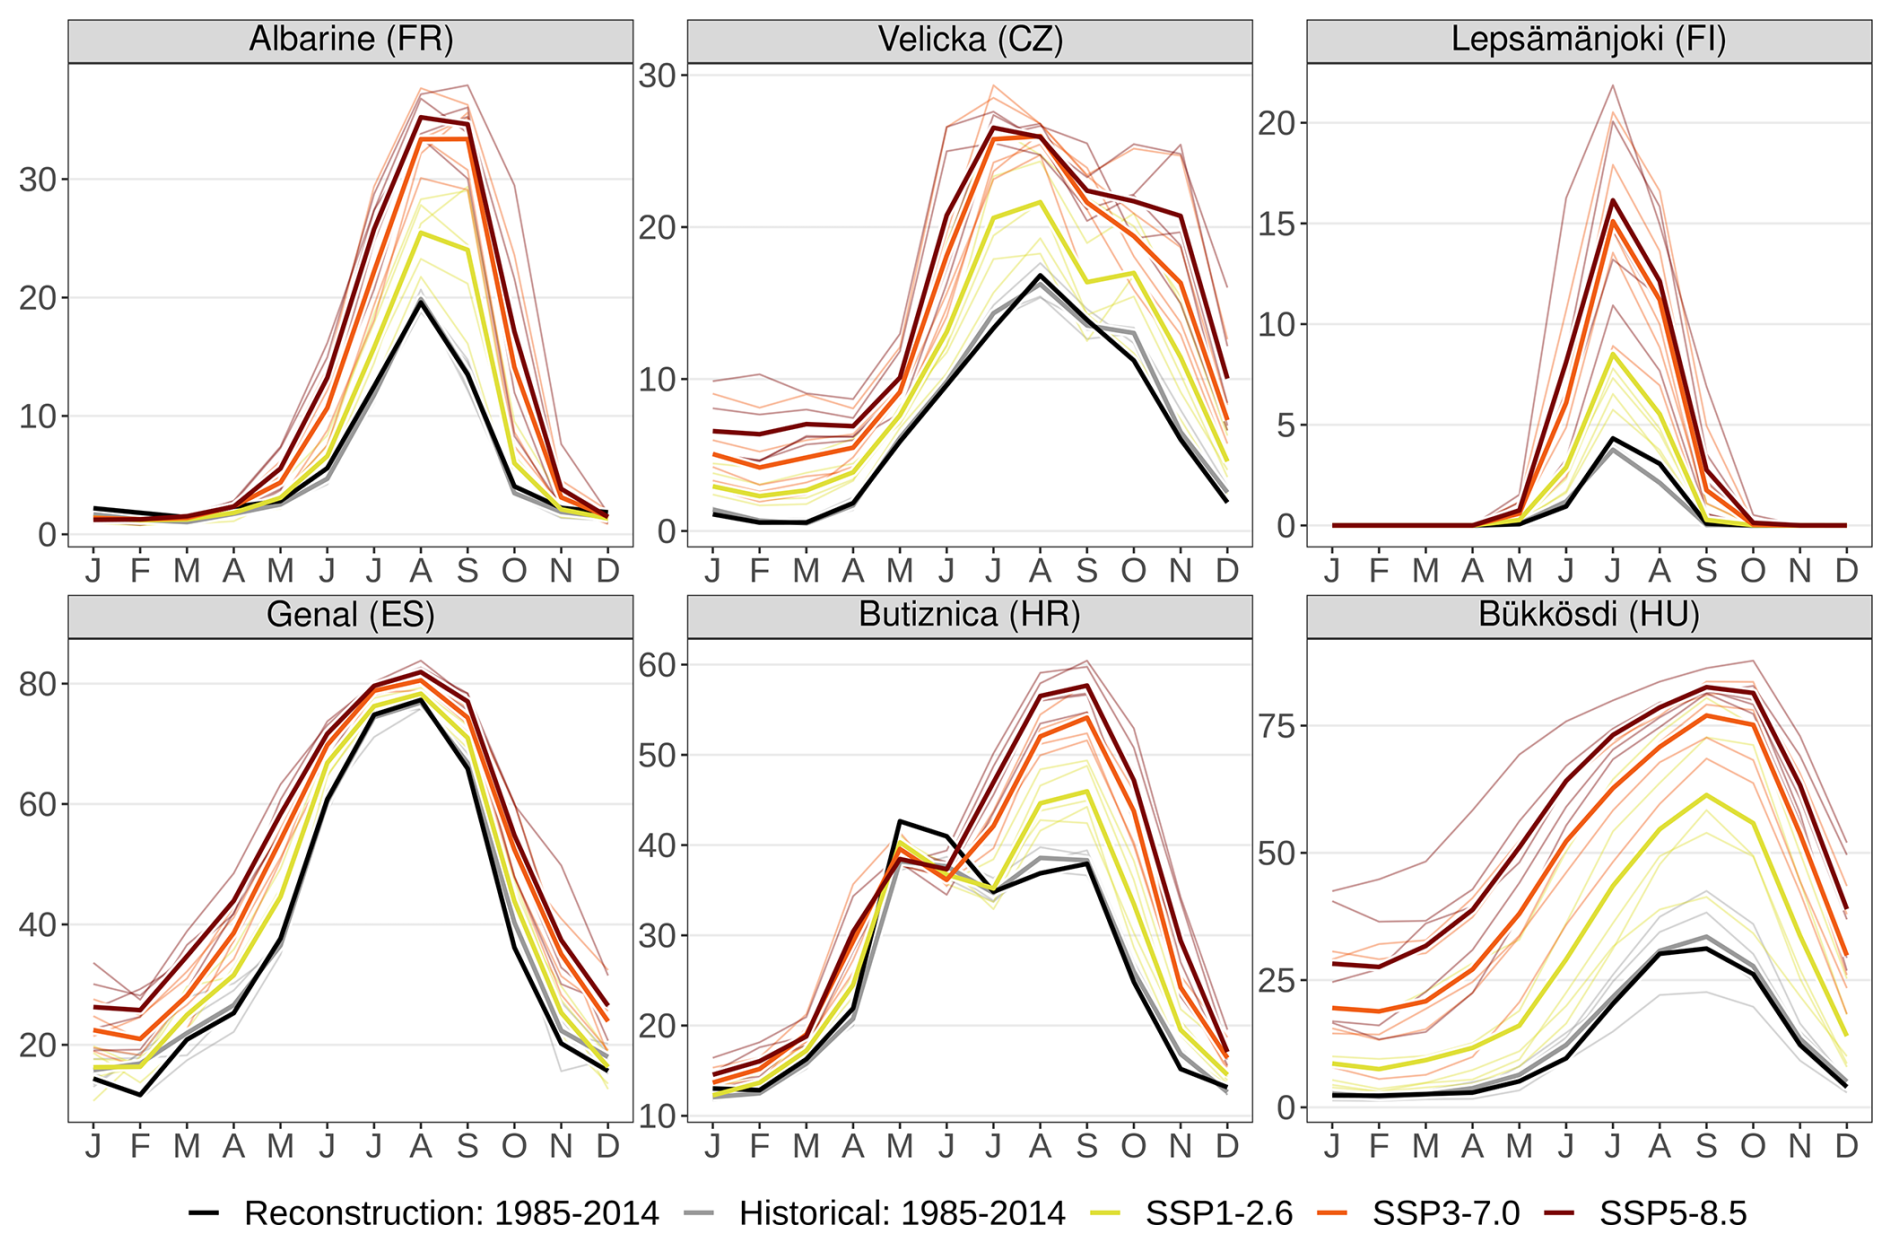
Figure 7Evolution of the seasonal pattern of the proportion of dry river length (in %) by 2071–2100 for three SSP scenarios. Thin lines represent the results for the five downscaled GCM models, whereas wider lines show the average of the five GCMs.
3.4 Characteristics of dry spells at the reach scale
This section focuses on the evolution of local drying at the reach scale. Here, a dry spell is defined as consecutive days with a dry condition in a reach without considering the flowing condition in the other reaches during the same period. To do this, we consider four classes of reaches based on the average mean annual number of dry days (ConD) from the reconstruction simulation (1985–2014) (Fig. 8b): Class 1 for reaches with ConD <5 d yr−1, Class 2 for reaches with ConD between 5 and 30 d yr−1, Class 3 for reaches with ConD between 30 and 120 d yr−1, and Class 4 for reaches with ConD >120 d yr−1.
Figure 8a shows the anomaly in the first annual day of drying (FstDrE), in the annual number of days with dry spells (numFreDr), and in the maximum duration of dry spells (DurD) of the projection simulations compared with the reconstruction simulation. Firstly, the projection simulations show that FstDrE values tend to decrease for the three SSP scenarios at the 2071–2100 horizon compared with the historical period from 1985 to 2014; this means that there is a general trend towards earlier dry conditions in the DRNs in the future, with an increasing intensity according to the severity of the SSP scenario. However, there is no general pattern that emerges according to the reach classes in all of the DRNs. For the Velička (CZ), the anticipation of dry spells becomes greater at the end of the century for the driest reach classes. For the Lepsämänjoki (FI), there is little difference between the three reach classes. For Butižnica (HR), it is classes 1 and 2 that show the greatest changes towards earlier dry spells, whereas it is classes 2 and 3 for the Albarine (FR) and Bükkösdi (HU). Finally, for Genal (ES), the anticipation of dry periods is more marked for Class 3, but the results also show a trend towards later dry periods for Class 1.
Regarding the evolution of DurD, Fig. 8a shows a massive increase in the six DRNs, correlated with the reach class: the more the reach dries up in the historical period, the greater the increase in the maximum duration of drying in future projections. For reach classes 3 and 4, DurD barely exceeds a few weeks for the projection simulations in the historical periods, but it regularly becomes greater than 1 month in the DRNs or even several months for the Bükkösdi (HU), Butižnica (HR), and Velička (CZ) DRNs for the SSP3-7.0 and SSP5-8.5 scenarios by 2071–2100.
In contrast, the number of annual dry spells changes little with the climate change scenarios. For reach classes 1 and 2, numFreDr tends to slightly increase in the projections by 2070–2100 compared with the historical period. Trends show more contrast for Class 3, whereas there is no change for the Butižnica (HR) and Velička (CZ) DRNs and a decreasing trend for the Albarine (FR), Bükkösdi (HU), and Genal (ES) DRNs for Class 4.
Overall, the projections show two main types of change in intermittence in the DRNs at the 2071–2100 horizon. Reaches characterized by infrequent or moderate drying over the historical period (classes 1 and 2) will tend to become more intermittent, with slightly more frequent and longer drying events. In the case of reaches that dry up frequently and for a long time in the historical period (classes 3 and 4), the duration of drying up will tend to be much longer, reducing the alternation between phases of flowing and dry conditions and leading to prolonged periods of continuous dry spells. In both cases, dry spells will tend to start earlier in the year, with the dates of first dry condition shifting to earlier in the year by a few weeks to more than a month, depending on the DRNs and SSP scenarios.
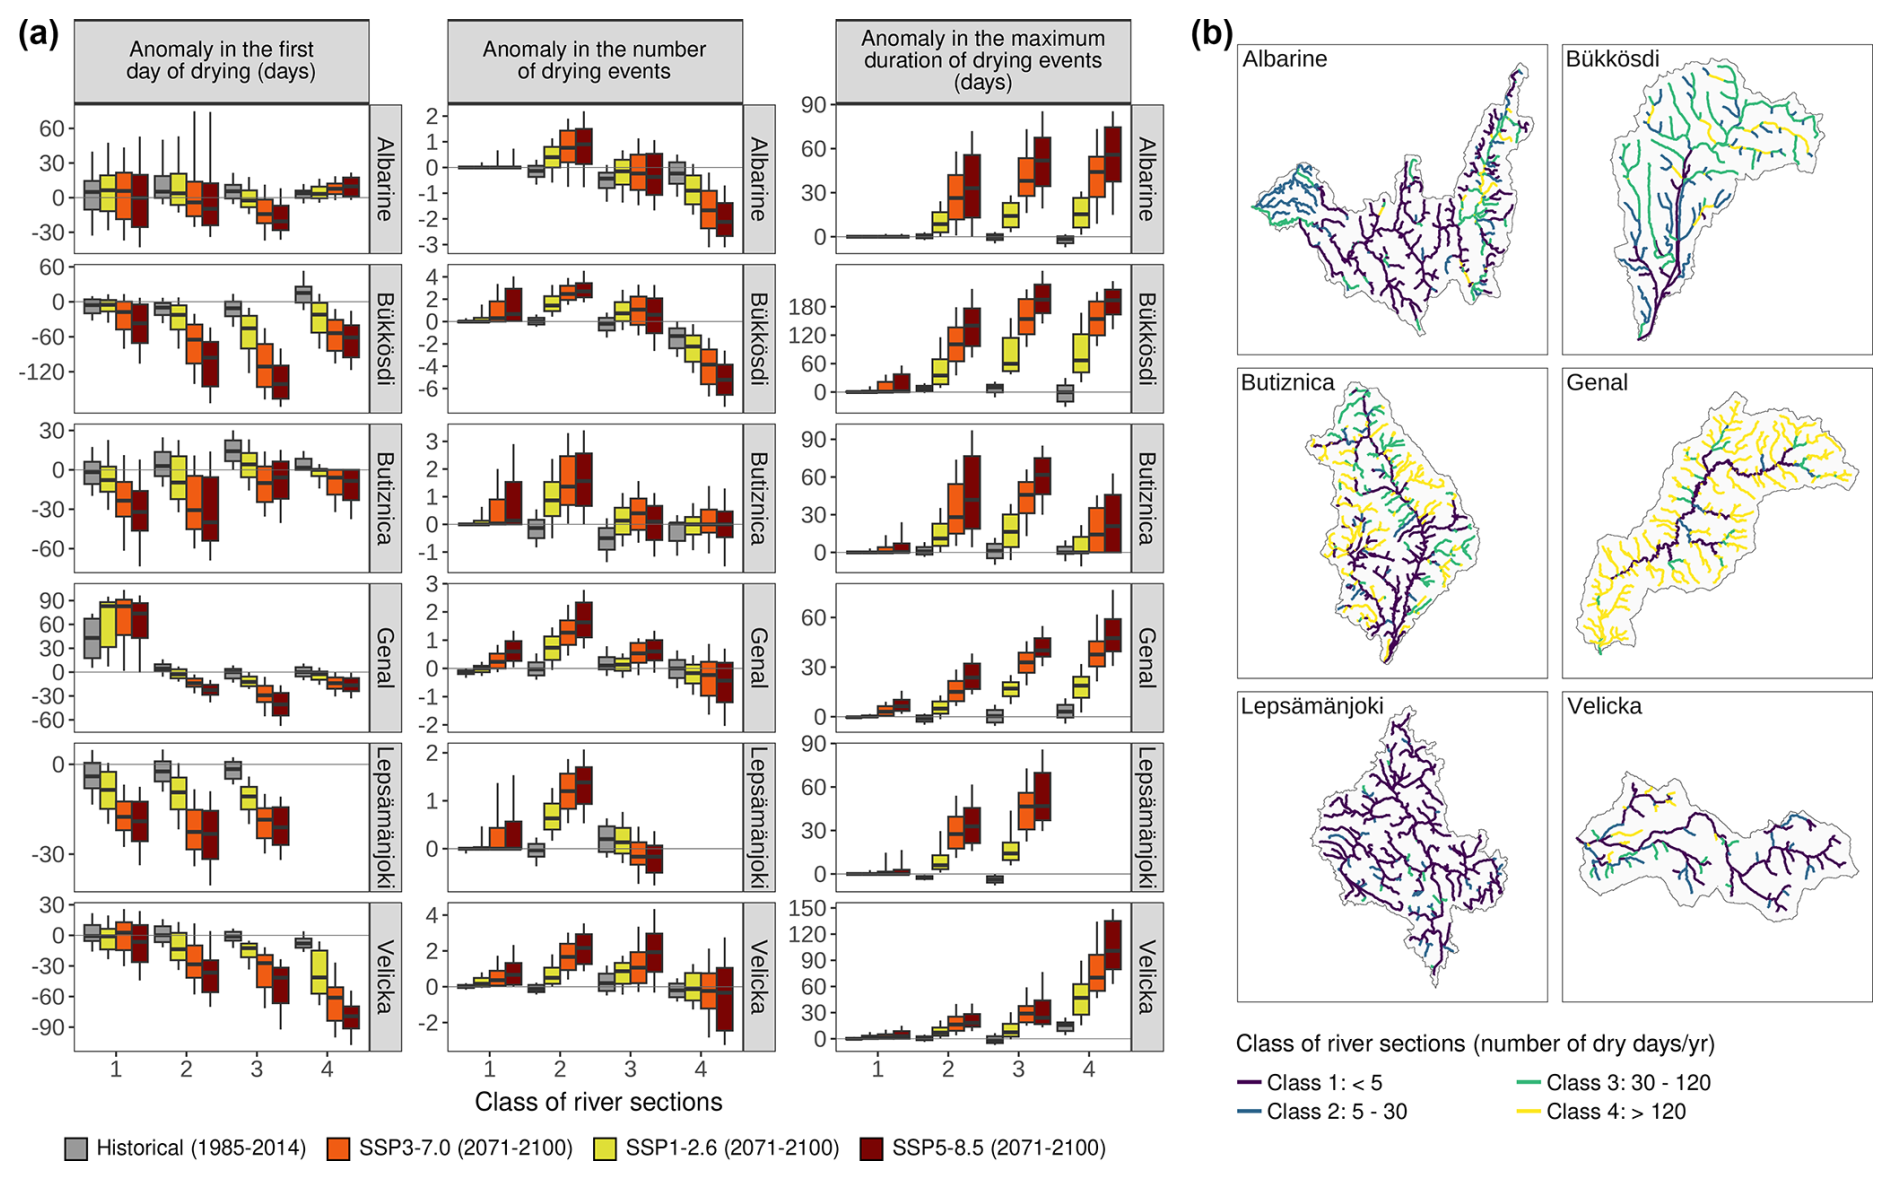
Figure 8Evolution of the FstDrE, numFreDr, and DurD indicators (anomaly compared with the historical reconstruction, ERA5-Land 1985–2014, per reach class, 1–4). Reach classes are determined from the yearly ConD indicator averaged over the period from 1985 to 2014 for the reconstruction simulation (ERA5-Land). The box plot whiskers range from the 10th to the 90th percentile.
3.5 Extreme droughts
This section focuses on extreme drying or droughts, i.e. periods with intense and widespread drying across the entire river network. To do this, we analyse the evolution of the relinInt10max indicator, which represents the annual maximum fraction of the river network that dried up over a 10 d period.
Figure 9a shows the dates and spatial extent of the maximum drought event for the reconstruction simulation over the period from 1980 to 2022 for each DRN. In the six DRNs, the most intense droughts happened during the last 10 years of the 1980–2022 period. For the Genal (ES) and Bükkösdi (HU) DRNs, more than 80 % of the river network is simulated as dry during the maximum drought event. For Velička (CZ), around two-thirds of the river network dried up during the maximum event, whereas this amount was around half for Albarine (FR) and Butižnica (HR) and a quarter for Lepsämänjoki (FI).
Figure 9b shows the projections of the annual maximum drought event (RelInt10max) for the three SSP scenarios. For the six DRNs, all of the projection simulations show an increase in the intensity of extreme drought in both the long and medium term. Projections show that the historical drought maxima presented in Fig. 9a will be exceeded on a regular basis by the end of the century for the SSP3-7.0 and SSP5-8.5 scenarios for Bükkösdi (HU), Butižnica (HR), and Lepsämänjoki (FI).
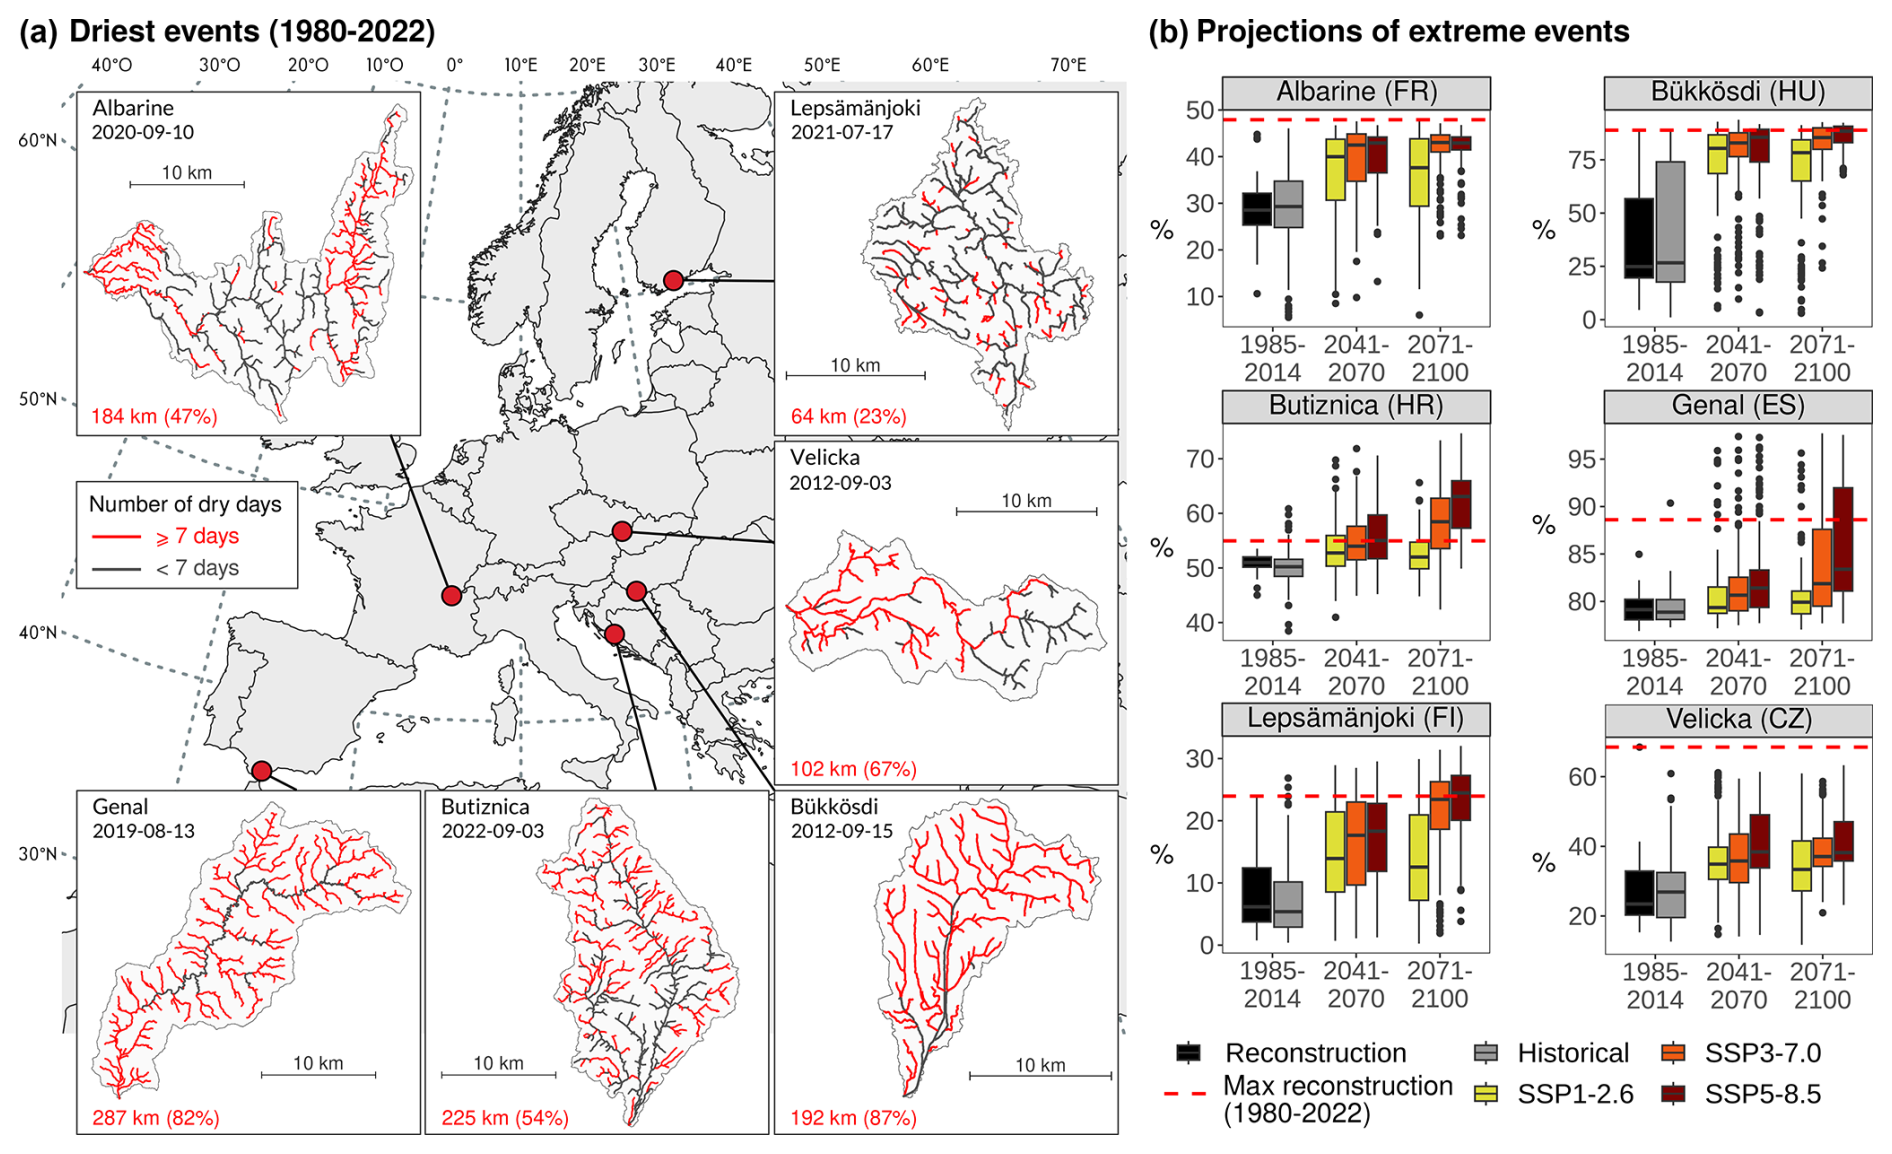
Figure 9(a) State of flow in the DRNs during the driest 10 d event of the reconstruction simulation (1980–2022 with ERA5-Land). Red colour denotes reaches that were dry for more than 7 d during the event. The starting date of the event and the length of river network that was dry for more than 7 d are indicated in each panel. (b) Evolution of RelInt10max for the three SSP scenarios compared with the historical period. The horizontal dashed red line shows the RelInt10max value corresponding to the driest historical event.
4.1 Evaluation of the reconstruction simulations
This study is one of the first attempting to simulate the long-term evolution of drying at the river reach level. One main difficulty is to assess the ability of a flow intermittence model to predict realistic spatiotemporal patterns of drying in river systems. This is partially due to the fact that observed data on flow intermittence are point measurements in both space (time series from a few sites that are insufficient to represent the entire network) and time (although participatory science or remote sensing can provide well-distributed spatial observations, those are typically infrequent and discontinuous over time). In addition, measures to observe the intermittence of watercourses have only recently been put in place, most commonly after 2010. As a result, the available time series are not long enough to observe long-term changes in the state of watercourse flow. Of the six study sites, only the Saint-Denis-en-Bugey gauging station, located in the Albarine (FR), has been recording observations on an intermittent section of river for several decades (since 1957). As a result, there are almost no quantitative observed data to characterize past spatiotemporal changes in the state of flow in river systems and evaluate the modelling results.
This study was conducted in collaboration with teams of local researchers specializing in freshwater ecology in drying rivers systems. Through their field sampling activities, these teams have acquired in-depth knowledge of the intermittent characteristics of these basins. Thanks to their expertise, local researchers were able to provide maps of the flow regime in the Albarine (FR), Bükkösdi (HU), Genal (ES), and Velička (CZ) river networks (Fig. S4). These data are subjective, as they are based on the researchers' perceptions, but they provide useful information for assessing the flow intermittence model's ability to represent the dynamics of drying up observed in the field. Comparison between Figs. S4 and 1 shows that the model seems to provide a good representation of the intermittency regimes in the Albarine (FR) and Velička (CZ) DRNs for the reconstruction period. For the Genal (ES) DRN, the observation data are spatially very fragmented and relate only to recent years (2020–2023); thus, it is more difficult to assess the model on the basis of these data. However, the observations seem to confirm the simulated pattern, with a main perennial river and intermittent tributaries. The section of the main river simulated as intermittent in Fig. 1 in the Genal DRN comes from the value of the threshold set to define the perennial or intermittent regimes (taken here at 1 dry day per year on average over a 30-year period); however, when taking a threshold equal to 2 dry days per year, this section of river is simulated as perennial (the uncertainty related to this threshold is further discussed in Sect. 4.2). For the Bükkösdi (HU) DRN, flow intermittence is clearly overestimated by the model, which simulates almost all tributaries to the Bükkösdi River as intermittent, whereas local expertise shows that there are more river sections with a perennial flow regime. This error possibly comes from a misclassification of flowing and dry events in the streamflow time series (see the location of the gauging stations in Fig. S3). One reason for this is the use of a common threshold of 0.005 m3 s−1 to identify dry days in the observed streamflow time series for the six DRNs, which led to an overestimate of the number of observed dry events in the Bükkösdi DRN. Another reason for this stems from zero flows that are possibly erroneous in the measured streamflow time series (Zimmer et al., 2020).
In addition, the uncertainties related to the training of the random forest model (quantity and quality of the observations used to train the model) also affect the simulated flow intermittence patterns. These modelling uncertainties have been described in detail in Mimeau et al. (2024).
4.2 Definition of perennial and non-perennial regimes
There is no consensus among studies on a threshold for defining perennial and non-perennial flow regimes. For example, Snelder et al. (2013) considered rivers with 0 d of drying over the entire period to be perennial rivers, whereas Messager et al. (2021) used a threshold of 1 d yr−1 on average, and other studies used thresholds of 5 d yr−1 on average (Costigan et al., 2017) or up to 18 d yr−1 on average (Van Meerveld et al., 2020).
Threshold values ranging from 0 to 20 d yr−1 were tested to analyse the sensitivity of this study's results to the definition of non-perennial rivers (Fig. 10). Figure 10a shows that the proportion of perennial rivers during the historical period can be very sensitive to the threshold value, with the proportion ranging from 16 % to 58 % for the Velička (CZ) DRN and from 71 % to 90 % for the Lepsämänjoki (FI) DRN for threshold values of between 0 and 5 d yr−1 on average. Sensitivity to the threshold value varies between DRNs, but there is a significant difference between considering a threshold equal to 0 or 1 dry day per year for all DRNs. On average for the six DRNs, 7.6 % more river length is considered to be perennial with a threshold of 1 d yr−1 compared to a threshold of no dry days at all. The threshold value also impacts the projected changes in the proportion of perennial rivers under climate change scenarios (Fig. 10b). The projections of the river lengths switching from a perennial to a non-perennial regime at the 2071–2100 horizon for the SSP5-8.5 scenario are very sensitive to the threshold value. For example, for the Velička DRN, depending on whether a threshold of 0 or 5 d yr−1 is considered, the percentage of the river network switching to a non-perennial regime by the end of the century varies from 8 % to 32 %.
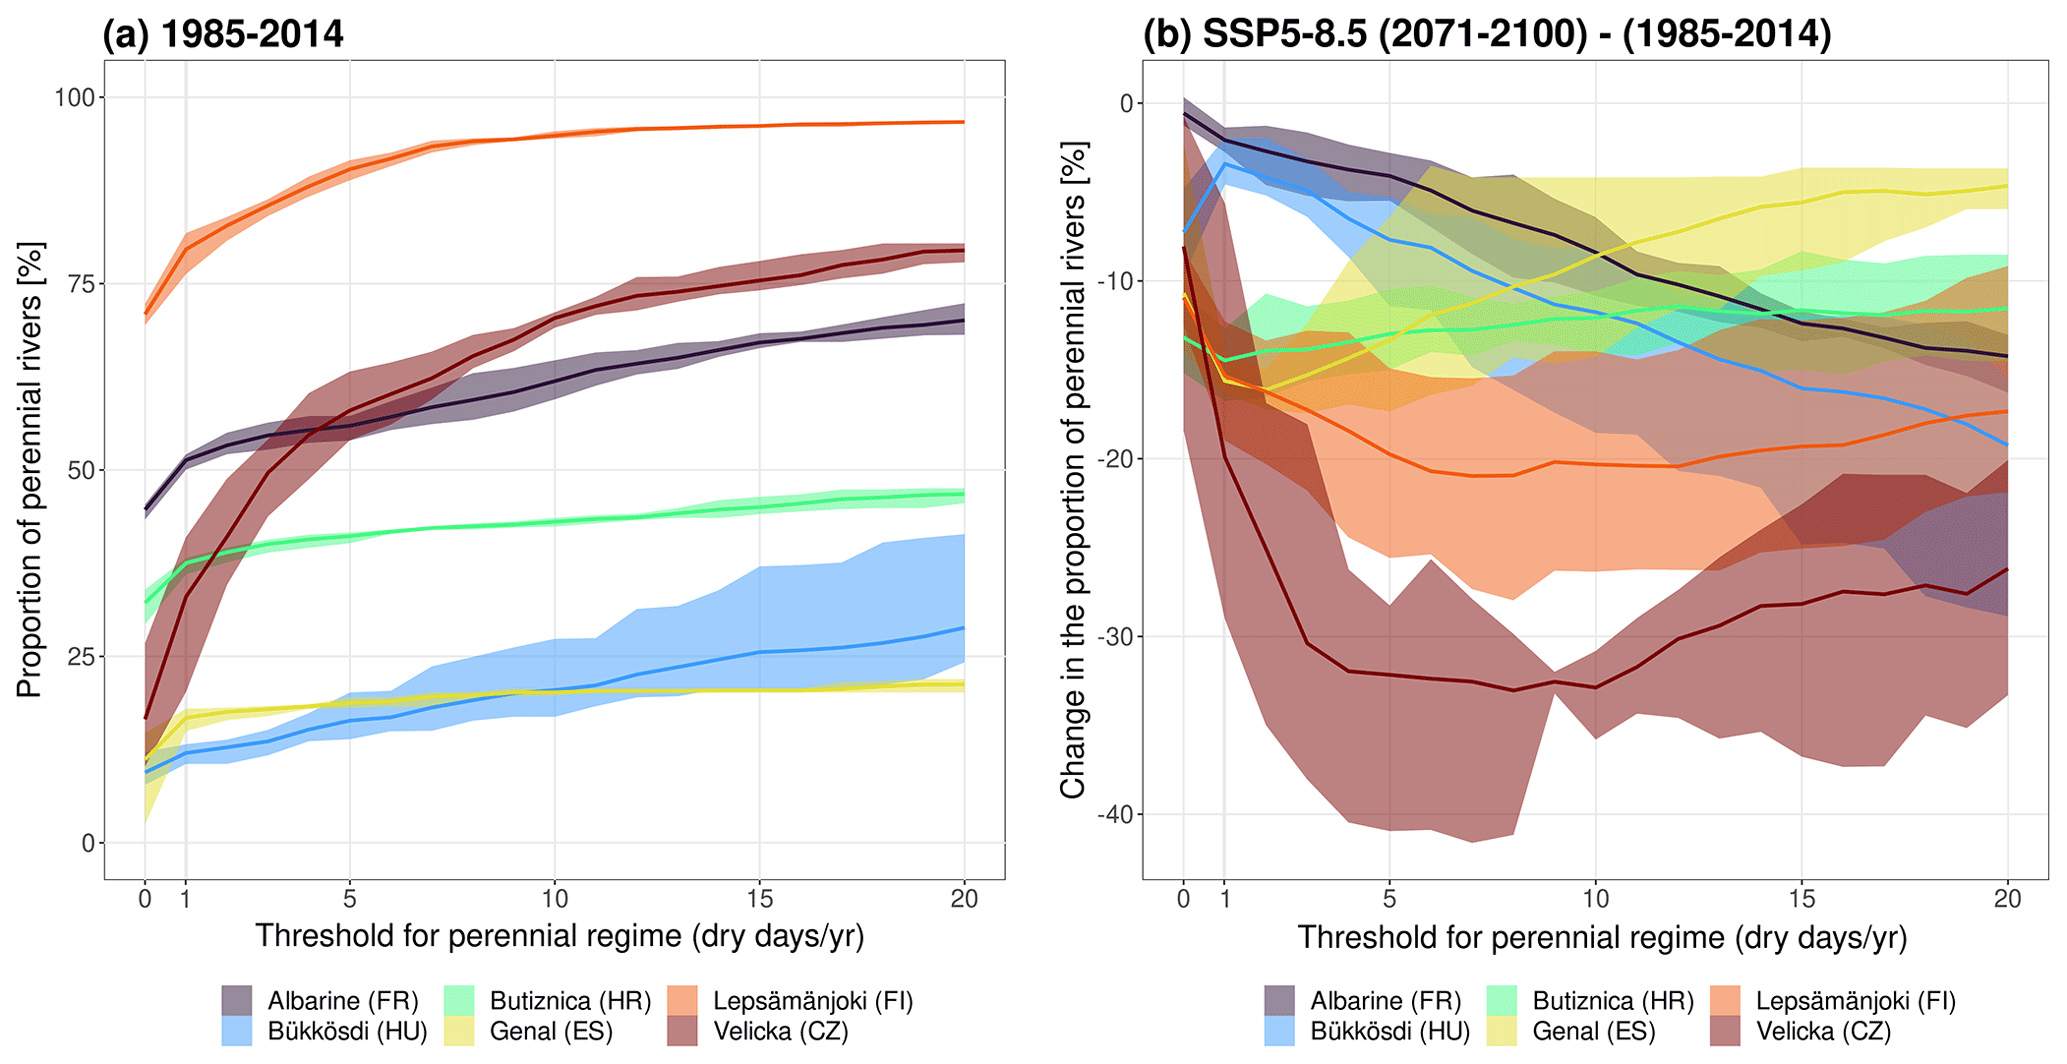
Figure 10(a) Proportion of perennial rivers for the 1985–2014 period. (b) Change in the proportion of perennial rivers in 2071–2100 compared with 1985–2014, according to the threshold for defining a perennial regime (average, minimum, and maximum values of the five GCMs).
4.3 Conceptualization of extreme events
The concept of what constitutes an “extreme” event varies based on the historical flow regime of the river reach. For example, a single dry day could be considered extreme for a historically perennial reach, whereas 2 months of dryness might be moderate for a reach that typically dries 50 % of the time. By coupling temporal and spatial drying patterns, we aim to identify possible extreme events at the network scale, such as those observed in the Albarine River in 2022 (Sarremejane et al., 2022; Datry et al., 2023).
In Czechia, dry episodes shorter than 7 d are considered mild for near-perennial streams and have a limited impact on biota, as refugia are not destroyed, allowing for quick recovery. This threshold has proven effective, achieving about 90 % accuracy in distinguishing between intermittent and perennial reaches (Straka et al., 2019). However, this definition is specific to the region; in Mediterranean catchments, the critical period may be longer, whereas it may be shorter in Finland due to differing hydrological conditions. To account for these regional differences, this study employs the RelInt10max indicator, which measures the annual maximum fraction of the river network that dries up over a 10 d period, as a metric for identifying extreme drying events. This indicator is conceptually similar to the Q10 flow metric used in hydrology, providing insight into low-flow conditions. The effectiveness of RelInt10max has been validated across the study sites. For example, in the Albarine River, the worst simulated historical event aligned with observed data. In the Bükkösdi River basin, 2012 was identified as the year with the most extreme drying within the 1984–2014 period. Similarly, while 2022 was a significant drought year for the Butižnica River, 2012 remains the most intense drought year. Such variations underscore the need for a region-specific definition of extreme events. In the Genal River, for instance, events with over 10 consecutive dry days are common and may not be considered extreme unless they affect the typically perennial main channel. The accuracy of RelInt10max has been further demonstrated in the Lepsämänjoki River, where the severe dry event of 2021 was accurately captured. However, for the Velička River, while the driest event in 2012 was correctly identified, future projections did not match this severity, suggesting potential underestimation of future extreme events under changing climatic conditions. These findings highlight the importance of considering local hydrological characteristics when applying indicators like RelInt10max to identify extreme events. The variability across regions emphasizes the need for a tailored approach in defining and identifying extreme drying events in river networks with different environmental characteristics.
4.4 Influence of the river geometry on the flow intermittence indicators
The resolution of the digital elevation models (DEMs) used to delineate the spatial reach entities influences the accuracy of reach length and connectivity calculations, which evidently has an impact on the indicators. Thus, the overall river length with a certain flow condition (LengthD/LengthF; Table 3) is determined by the DEM used, which varies from a resolution of 10 to 30 m. In addition, smaller streams and tributaries may not be well represented in the data, which can result in underestimations of flow intermittence in smaller streams. The calculation of the indicator (PatchC; Table 3) also relies on accurate representations of network connectivity. Moreover, DEM resolution determines reach connections, which should be taken into account when using this indicator to assess parameters such as habitat fragmentation.
The river network geometry influences hydrological processes by shaping flow pathways, connectivity, and retention across the network (Roy et al., 2022). Properties, such as number of reaches, sinuosity, and hydrological connectivity, directly affect flow dynamics, including flow intermittence. For example, steeper upstream reaches typically lead to faster runoff and shorter flow durations, while flatter downstream reaches can sustain pooling or prolonged drying phases, as observed in our case studies. Future studies could benefit from incorporating additional metrics and methodologies, such as Horton's laws or advanced clustering approaches (Roy et al., 2022), to further investigate the influence of river network geometry on hydrological processes. The limited number of six case studies constrains the generalization of these findings, but the results highlight the significant role of network geometry and connectivity in shaping flow intermittence and seasonality.
4.5 Projections of flow intermittence with an RF model
Nowadays, machine learning techniques are commonly employed in hydrology and can be used for flood or drought forecasting (Zennaro et al., 2021; Zounemat-Kermani et al., 2021). However, they are less widely used for future projections, mainly because they cannot extrapolate outside of their training range (Hengl et al., 2018). One expected result of this study was that the hybrid flow intermittence model would predict an increase in the frequency and duration of drying events under climate change scenarios in reaches where some drying was observed during the training period but that the model would continue to simulate flowing conditions, whatever the climatic conditions, for the reaches known as perennial during the training period. On the contrary, results show that the flow intermittence model can simulate transitions from a perennial to an intermittent regime in some reaches. One of the reasons for this is the definition of perennial and non-perennial regimes: as a perennial regime is defined as less than 1 d of drying per year on average, it happens that a few days of drying are observed in certain reaches during the training period without this reach being considered to be intermittent. In this case, the RF model can easily predict a change towards an intermittent regime in the future, as it has been trained with some drying observations. However results show that, even with a threshold strictly equal to 0 dry days per year, the model can simulate a decrease in the proportion of perennial rivers for the SSP5-8.5 scenario (Fig. 10b) in all DRNs, except for the Albarine (FR) for which almost no transition from perennial to intermittent is simulated. This difference between the Albarine and the other DRNs is most likely due to the fact that the training of the RF model was much more constrained for this DRN, with the addition of many flow condition observations in perennial reaches based on the expertise of the local DRN team (see Sect. S1 and Mimeau et al., 2024).
We assume that the ability of the flow intermittence model to predict some drying conditions that were never observed in the river networks may be due to its hybrid structure. This is (1) because the JAMS-J2000 hydrological model enables one to simulate streamflow projections under climate change scenarios and provide unprecedented hydrological conditions as input data to the RF model and (2) because the RF model is trained on the whole river network at once (not reach by reach), which allows one to predict unprecedented drying conditions in some reaches based on the drying pattern observed in intermittent reaches during the training period.
In all cases, a major limitation of this flow intermittence model is that the projections of flow intermittence are very sensitive to the training dataset of the RF model. As seen in the Albarine example, a highly constrained model in river sections considered to be perennial during the training phase can certainly predict changes in drying patterns on historically intermittent sections, but it cannot predict changes on perennial sections. On the other hand, models that are less constrained on perennial reaches might overestimate drying in the historical period and overestimate flow regime transitioning in the future projections.
Another limitation with respect to using a model based on an RF algorithm to predict future change in flow intermittence is that the physical processes causing flow intermittence, such as water abstraction, are not explicitly represented in the model. This introduces uncertainty, particularly for the Genal River (ES), which is intermittent in its downstream section due to abstraction for irrigation. The future intermittence projections produced by the model therefore consider not only the impact of climate change but also the impact of water abstraction; therefore, it is not possible to separate the two impacts and determine the model's sensitivity to climate change.
4.6 Spatial patterns of flow intermittence changes at the European scale
The six European DRNs studied in the DRYvER project were selected to evaluate the impact of climate change on flow intermittence in different regions characterized by diverse climatic and hydrological regimes across Europe. Although the six study basins are local basins of relatively small size, their locations can provide information about the impacts of climate change on intermittency on a larger scale on the European continent. The reconstruction simulations (Fig. 1) show the differences in intermittence between the different climatic regions: the DRNs in southern Europe with dry climates (the Genal and Butižnica) are very intermittent, whereas the DRN in northern Europe (Lepsämänjoki) shows relatively little intermittence. The flow intermittence projections under climate change scenarios also show a general tendency for the intermittent river network percentage to increase more for southern sites than for those in the north (Figs. 6, 7, 8). However, our results also show that local processes, such as geological characteristics and water abstraction, have a significant influence on intermittence. This suggests that the climatic region alone is insufficient to fully explain intermittence at the scale of local river networks.
This study presents some future projections of drying in river networks under climate change scenarios in six European basins. The river flow intermittence is spatially simulated in river networks at a daily time step, using a hybrid hydrological model combining a spatially distributed hydrological model and a random forest model (Mimeau et al., 2024).
Flow intermittence indicators have been produced to characterize changes in drying patterns in river networks at various spatial scales (i.e. the reach scale and river network scale) and temporal scales (i.e. the drying event scale and seasonal and interannual scales). The projections of these indicators in the six study basins show that flow intermittence will intensify throughout the 21st century, regardless of the GHG scenario, at different levels depending on the basins and the scenarios considered. Overall, the results show an intensification of flow intermittence, with an increase in the maximum length of the dried-up river network during the summer months (JJA), and an increase in the duration of drying, which starts earlier at the beginning of the low-flow season (late spring and early summer) and extends later into the autumn (SON). The projections show a spatial extension of intermittent rivers with transitions from perennial to intermittent flow regimes, particularly for the SSP3-7.0 and SSP5-8.5 scenarios. An analysis of extreme drying events shows that the historical extreme events observed over the past decade could become frequent by 2071–2100 under the SSP3-7.0 and SSP5-8.5 scenarios.
An interactive web application – DRYvER-Hydro (https://dryver-hydro.sk8.inrae.fr/, last access: 28 August 2024; Mimeau, 2023) – was developed to help visualize the evolution of intermittence indicators under climate change in the six study basins. DRYvER-Hydro is a Shiny application (Chang et al., 2024), developed in R (R Core Team, 2023), that allows one to visualize changes in climate (temperature, precipitation, and reference evapotranspiration) and flow intermittence (RelInt, RelFlow, and PatchC) globally over the six basins and to track changes in flow intermittence (ConD, ConF, DurD, DurF, numFreDr, numFreRW, FstDrE, and IntReg) for each river section. Flow intermittence indicators can be displayed for the past and present period (reconstruction simulation 1960–2021) and for the future period (projection simulations 1985–2100).
The flow intermittence indicators presented in this study were designed to answer questions related to ecological issues concerning the impact of flow intermittence and climate change on freshwater ecosystems. In particular, these indicators have been used in interdisciplinary studies on the impact of flow intermittence on river's GHG emissions (López‐Rojo et al., 2024) and the impact of flow intermittence on the degradation of microplastics (Barthelemy et al., 2024). Flow intermittence indicators are also being used in other studies currently being carried out as part of the European interdisciplinary H2020 DRYvER project on the impact of change on the biodiversity and ecosystem services of intermittent rivers (Datry et al., 2021).
In order to improve the quality of the flow intermittence projections and indicators for freshwater ecology studies, a future perspective of this work is to consider more than just two conditions (flowing or dry), particularly the pool condition which can also have a significant impact on aquatic species (Steward et al., 2022). Another perspective is to improve the flow intermittence modelling by further improving the understanding of the impact of the data used to train the RF model on the simulated future projections. For these two perspectives, more observed data on flow intermittence in drying river networks will be necessary.
The J2000 hydrological models and random forest models for predicting flow intermittence are available at https://doi.org/10.57745/LCT9L6 (Mimeau et al., 2025a), shapefiles of the watersheds and river networks are available at https://doi.org/10.57745/U0KJL3 (Mimeau et al., 2025b), observed flow intermittence data collected at the six study sites are available at https://doi.org/10.57745/VIPKDP (Mimeau et al., 2025c), simulated hydrological variables and flow intermittence indicators for the reconstruction period (1960–2021) are available at https://doi.org/10.57745/JDQ4KO (Mimeau et al., 2025d), downscaled climate projections are available at https://doi.org/10.57745/CPIKSQ (Devers et al., 2025), and simulated hydrological variables and flow intermittence indicators for the projection period (1985–2100) are available at https://doi.org/10.57745/5JDNWF (Mimeau et al., 2025e).
The supplement related to this article is available online at https://doi.org/10.5194/hess-29-1615-2025-supplement.
LM and AK: conceptualization; LM, AK, and AD: model implementation and analysis; AD, JPV, and CL: climate projection downscaling; AK and SK: flow intermittence indicator computation; LM, AK, FB, SK, and JPV: draft preparation and discussions; NB, ZC, TD, HM, PP, and LP: local DRN observations and expertise. All authors read and approved the final paper.
The contact author has declared that none of the authors has any competing interests.
Publisher's note: Copernicus Publications remains neutral with regard to jurisdictional claims made in the text, published maps, institutional affiliations, or any other geographical representation in this paper. While Copernicus Publications makes every effort to include appropriate place names, the final responsibility lies with the authors. Regarding the maps used in this paper, please note that Figs. 1, 5, 6, and 9 contain disputed territories.
This article is part of the special issue “Drought, society, and ecosystems (NHESS/BG/GC/HESS inter-journal SI)”. It is not associated with a conference.
The authors thank all members of the DRYvER project who helped collect data at the six study sites. The authors also thank the editor, Khalid Hassaballah, and the two anonymous referees for their comments and suggestions that improved the quality of this paper.
This research has been supported by the European Commission's H2020 Research and Innovation action (grant no. 869226).
This paper was edited by Khalid Hassaballah and reviewed by two anonymous referees.
Acuña, V., Datry, T., Marshall, J., Barceló, D., Dahm, C. N., Ginebreda, A., McGregor, G., Sabater, S., Tockner, K., and Palmer, M.: Why should we care about temporary waterways?, Science, 343, 1080–1081, https://doi.org/10.1126/science.1246666, 2014. a
Allen, R. G., Pereira, L. S., Raes, D., and Smith, M.: Crop evapotranspiration-Guidelines for computing crop water requirements-FAO Irrigation and drainage paper 56, Fao, Rome, 300, D05109, http://www.fao.org/docrep/x0490e/x0490e00.htm (last access: 13 September 2022), 1998. a
Barthelemy, N., Mermillod-Blondin, F., Krause, S., Simon, L., Mimeau, L., Devers, A., Vidal, J.-P., and Datry, T.: The Duration of Dry Events Promotes PVC Film Fragmentation in Intermittent Rivers, Environ. Sci. Technol., 58, 12621–12632, https://doi.org/10.1021/acs.est.4c00528, 2024. a
Blöschl, G. and Sivapalan, M.: Scale issues in hydrological modelling: A review, Hydrol. Process., 9, 251–290, https://doi.org/10.1002/hyp.3360090305, 1995. a
Bond, N. R., Lake, P. S., and Arthington, A. H.: The impacts of drought on freshwater ecosystems: an Australian perspective, Hydrobiologia, 600, 3–16, https://doi.org/10.1007/s10750-008-9326-z, 2008. a
Breiman, L.: Random forests, Mach. Learn., 45, 5–32, https://doi.org/10.1023/a:1010933404324, 2001. a
Calvin, K., Dasgupta, D., Krinner, G., Mukherji, A., Thorne, P. W., Trisos, C., Romero, J., Aldunce, P., Barrett, K., Blanco, G., Cheung, W. W., Connors, S., Denton, F., Diongue-Niang, A., Dodman, D., Garschagen, M., Geden, O., Hayward, B., Jones, C., Jotzo, F., Krug, T., Lasco, R., Lee, Y.-Y., Masson-Delmotte, V., Meinshausen, M., Mintenbeck, K., Mokssit, A., Otto, F. E., Pathak, M., Pirani, A., Poloczanska, E., Pörtner, H.-O., Revi, A., Roberts, D. C., Roy, J., Ruane, A. C., Skea, J., Shukla, P. R., Slade, R., Slangen, A., Sokona, Y., Sörensson, A. A., Tignor, M., Van Vuuren, D., Wei, Y.-M., Winkler, H., Zhai, P., Zommers, Z., Hourcade, J.-C., Johnson, F. X., Pachauri, S., Simpson, N. P., Singh, C., Thomas, A., Totin, E., Arias, P., Bustamante, M., Elgizouli, I., Flato, G., Howden, M., Méndez-Vallejo, C., Pereira, J. J., Pichs-Madruga, R., Rose, S. K., Saheb, Y., Sánchez Rodríguez, R., Ürge Vorsatz, D., Xiao, C., Yassaa, N., Alegría, A., Armour, K., Bednar-Friedl, B., Blok, K., Cissé, G., Dentener, F., Eriksen, S., Fischer, E., Garner, G., Guivarch, C., Haasnoot, M., Hansen, G., Hauser, M., Hawkins, E., Hermans, T., Kopp, R., Leprince-Ringuet, N., Lewis, J., Ley, D., Ludden, C., Niamir, L., Nicholls, Z., Some, S., Szopa, S., Trewin, B., Van Der Wijst, K.-I., Winter, G., Witting, M., Birt, A., Ha, M., Romero, J., Kim, J., Haites, E. F., Jung, Y., Stavins, R., Birt, A., Ha, M., Orendain, D. J. A., Ignon, L., Park, S., Park, Y., Reisinger, A., Cammaramo, D., Fischlin, A., Fuglestvedt, J. S., Hansen, G., Ludden, C., Masson-Delmotte, V., Matthews, J. R., Mintenbeck, K., Pirani, A., Poloczanska, E., Leprince-Ringuet, N., and Péan, C.: IPCC, 2023: Climate Change 2023: Synthesis Report. Contribution of Working Groups I, II and III to the Sixth Assessment Report of the Intergovernmental Panel on Climate Change [Core Writing Team, edited by: Lee, H. and Romero, J., IPCC, Geneva, Switzerland, Tech. rep., Intergovernmental Panel on Climate Change (IPCC), https://doi.org/10.59327/IPCC/AR6-9789291691647, 1st edn., 2023. a
Cammalleri, C., Naumann, G., Mentaschi, L., Bisselink, B., Gelati, E., De Roo, A., and Feyen, L.: Diverging hydrological drought traits over Europe with global warming, Hydrol. Earth Syst. Sci., 24, 5919–5935, https://doi.org/10.5194/hess-24-5919-2020, 2020. a
Chang, W., Cheng, J., Allaire, J., Sievert, C., Schloerke, B., Xie, Y., Allen, J., McPherson, J., Dipert, A., and Borges, B.: shiny: Web Application Framework for R, r package version 1.8.1.9001, https://shiny.posit.co/ (last access: 17 March 2025), 2024. a
Costigan, K. H., Kennard, M. J., Leigh, C., Sauquet, E., Datry, T., and Boulton, A. J.: Flow regimes in intermittent rivers and ephemeral streams, in: Intermittent rivers and ephemeral streams, 51–78, Elsevier, https://doi.org/10.1016/B978-0-12-803835-2.00003-6, 2017. a
Datry, T.: Ecological effects of flow intermittence in gravel-bed rivers, John Wiley & Sons Ltd, ISBN 9781118971437, https://doi.org/10.1002/9781118971437, 2017. a
Datry, T., Larned, S. T., and Tockner, K.: Intermittent rivers: a challenge for freshwater ecology, BioScience, 64, 229–235, 2014. a
Datry, T., Pella, H., Leigh, C., Bonada, N., and Hugueny, B.: A landscape approach to advance intermittent river ecology, Freshwater Biology, 61, 1200–1213, https://doi.org/10.1093/biosci/bit027, 2016. a
Datry, T., Boulton, A. J., Bonada, N., Fritz, K., Leigh, C., Sauquet, E., Tockner, K., Hugueny, B., and Dahm, C. N.: Flow intermittence and ecosystem services in rivers of the Anthropocene, J. Appl. Ecol., 55, 353–364, https://doi.org/10.1111/1365-2664.12941, 2017. a
Datry, T., Boulton, A. J., Bonada, N., Fritz, K., Leigh, C., Sauquet, E., Tockner, K., Hugueny, B., and Dahm, C. N.: Flow intermittence and ecosystem services in rivers of the Anthropocene, J. Appl. Ecol., 55, 353–364, https://doi.org/10.1111/1365-2664.12941, 2018. a, b
Datry, T., Allen, D., Argelich, R., Barquin, J., Bonada, N., Boulton, A., Branger, F., Cai, Y., Cañedo-Argüelles, M., Cid, N., Csabai, Z., Dallimer, M., de Araújo, J.-C., Declerck, S., Dekker, T., Döll, P., Encalada, A., Forcellini, M., Foulquier, A., Heino, J., Jabot, F., Keszler, P., Kopperoinen, L., Kralisch, S., Künne, A., Lamouroux, N., Lauvernet, C., Lehtoranta, V., Loskotová, B., Marcé, R., Martin Ortega, J., Matauschek, C., Miliša, M., Mogyorósi, S., Moya, N., Müller, S. H., Munné, A., Munoz, F., Mykrä, H., Pal, I., Paloniemi, R., Pařil, P., Pengal, P., Pernecker, B., Polášek, M., Rezende, C., Sabater, S., Sarremejane, R., Schmidt, G., Senerpont Domis, L., Singer, G., Suárez, E., Talluto, M., Teurlincx, S., Trautmann, T., Truchy, A., Tyllianakis, E., Väisänen, S., Varumo, L., Vidal, J.-P., Vilmi, A., and Vinyoles, D.: Securing Biodiversity, Functional Integrity, and Ecosystem Services in Drying River Networks (DRYvER), Research Ideas and Outcomes, 7, e77750, https://doi.org/10.3897/rio.7.e77750, 2021. a, b, c
Datry, T., Truchy, A., Olden, J. D., Busch, M. H., Stubbington, R., Dodds, W. K., Zipper, S., Songyan, Y., Messager, M. L., Tonkin, J. D., Kaiser, K. E., Hammond, J. C., Moody, E. K., Burrows, R. M., Sarremejane, R., Delvecchia, A. G., Fork, M. L., Little, C. J., Walker, R. H., Walters, A. W., and Allen, D.: Causes, Responses, and Implications of Anthropogenic versus Natural Flow Intermittence in River Networks, BioScience, 73, 9–22, https://doi.org/10.1093/biosci/biac098, 2022. a, b
Datry, T., Boulton, A. J., Fritz, K., Stubbington, R., Cid, N., Crabot, J., and Tockner, K.: Non-perennial segments in river networks, Nat. Rev. Earth Environ., 4, 815–830, https://doi.org/10.1038/s43017-023-00495-w, 2023. a, b
Devers, A., Lauvernet, C., and Vidal, J.-P.: DRYvER Deliverable D1.6 – Report on downscaling global climate projections for catchment-scale hydrological modelling, Tech. rep., INRAE, https://www.dryver.eu/results/reports-and-documents (last access: 17 March 2025), 2023. a, b, c
Devers, A., Lauvernet, C., and Vidal, J.-P.: Downscaled climate projections (1970–2100) for the 6 European catchments studied in the DRYvER project, Recherche Data Gouv, V1 [data set], https://doi.org/10.57745/CPIKSQ, 2025. a
Döll, P. and Schmied, H. M.: How is the impact of climate change on river flow regimes related to the impact on mean annual runoff? A global-scale analysis, Environ. Res. Lett., 7, 014037, https://doi.org/10.1088/1748-9326/7/1/014037, 2012. a
Döll, P., Abbasi, M., Messager, M. L., Trautmann, T., Lehner, B., and Lamouroux, N.: Streamflow intermittence in Europe: Estimating high-resolution monthly time series by downscaling of simulated runoff and random forest modeling, Water Resour. Res., 60, e2023WR036900, https://doi.org/10.1029/2023WR036900, 2024. a, b
Feyen, L. and Dankers, R.: Impact of global warming on streamflow drought in Europe, J. Geophys. Res.-Atmos., 114, 2008JD011438, https://doi.org/10.1029/2008JD011438, 2009. a
Frieler, K., Volkholz, J., Lange, S., Schewe, J., Mengel, M., del Rocío Rivas López, M., Otto, C., Reyer, C. P. O., Karger, D. N., Malle, J. T., Treu, S., Menz, C., Blanchard, J. L., Harrison, C. S., Petrik, C. M., Eddy, T. D., Ortega-Cisneros, K., Novaglio, C., Rousseau, Y., Watson, R. A., Stock, C., Liu, X., Heneghan, R., Tittensor, D., Maury, O., Büchner, M., Vogt, T., Wang, T., Sun, F., Sauer, I. J., Koch, J., Vanderkelen, I., Jägermeyr, J., Müller, C., Rabin, S., Klar, J., Vega del Valle, I. D., Lasslop, G., Chadburn, S., Burke, E., Gallego-Sala, A., Smith, N., Chang, J., Hantson, S., Burton, C., Gädeke, A., Li, F., Gosling, S. N., Müller Schmied, H., Hattermann, F., Wang, J., Yao, F., Hickler, T., Marcé, R., Pierson, D., Thiery, W., Mercado-Bettín, D., Ladwig, R., Ayala-Zamora, A. I., Forrest, M., and Bechtold, M.: Scenario setup and forcing data for impact model evaluation and impact attribution within the third round of the Inter-Sectoral Impact Model Intercomparison Project (ISIMIP3a), Geosci. Model Dev., 17, 1–51, https://doi.org/10.5194/gmd-17-1-2024, 2024. a
Gelfan, A., Kalugin, A., and Krylenko, I.: Detection, attribution, and specifying mechanisms of hydrological changes in geographically different river basins, Clim. Change, 176, 122, https://doi.org/10.1007/s10584-023-03557-6, 2023. a
Gudmundsson, L. and Seneviratne, S. I.: Anthropogenic climate change affects meteorological drought risk in Europe, Environ. Res. Lett., 11, 044005, https://doi.org/10.1088/1748-9326/11/4/044005, 2016. a
Gudmundsson, L., Boulange, J., Do, H. X., Gosling, S. N., Grillakis, M. G., Koutroulis, A. G., Leonard, M., Liu, J., Müller Schmied, H., Papadimitriou, L., Pokhrel, Y., Seneviratne, S. I., Satoh, Y., Thiery, W., Westra, S., Zhang, X., and Zhao, F.: Globally observed trends in mean and extreme river flow attributed to climate change, Science, 371, 1159–1162, https://doi.org/10.1126/science.aba3996, 2021. a
Gusev, Y. M., Nasonova, O. N., Kovalev, E. E., and Ayzel, G. V.: Impact of possible climate changes on river runoff under different natural conditions, Proc. IAHS, 379, 293–300, https://doi.org/10.5194/piahs-379-293-2018, 2018. a
Gutierrez-Jurado, K. Y., Partington, D., and Shanafield, M.: Taking theory to the field: streamflow generation mechanisms in an intermittent Mediterranean catchment, Hydrol. Earth Syst. Sci., 25, 4299–4317, https://doi.org/10.5194/hess-25-4299-2021, 2021. a
Hengl, T., Nussbaum, M., Wright, M. N., Heuvelink, G. B., and Gräler, B.: Random forest as a generic framework for predictive modeling of spatial and spatio-temporal variables, PeerJ, 6, e5518, https://doi.org/10.7717/peerj.5518, 2018. a
Herzog, A., Hector, B., Cohard, J., Vouillamoz, J., Lawson, F. M. A., Peugeot, C., and De Graaf, I.: A parametric sensitivity analysis for prioritizing regolith knowledge needs for modeling water transfers in the West African critical zone, Vadose Zone J., 20, e20163, https://doi.org/10.1002/vzj2.20163, 2021. a
IPCC: Climate Change 2021: The Physical Science Basis. Contribution of Working Group I to the Sixth Assessment Report of the Intergovernmental Panel on Climate Change, Cambridge University Press, https://doi.org/10.1017/9781009157896, 2023. a
Kampf, S., Strobl, B., Hammond, J., Anenberg, A., Etter, S., Martin, C., Puntenney-Desmond, K., Seibert, J., and van Meerveld, I.: Testing the waters: Mobile apps for crowdsourced streamflow data, Eos, 99, 30–34, https://doi.org/10.1029/2018EO096355, 2018. a
Kralisch, S. and Krause, P.: JAMS – A framework for natural resource model development “Summit on Environmental Modelling and Software”, Burlington, USA, edited by: Voinov, A., Jakeman, A., and Rizzoli, A., http://www.iemss.org/iemss2006/papers/s5/254_Kralisch_1-4.pdf (last access: 21 September 2023), 2006. a
Krysanova, V. and Hattermann, F. F.: Intercomparison of climate change impacts in 12 large river basins: overview of methods and summary of results, Clim. Change, 141, 363–379, https://doi.org/10.1007/s10584-017-1919-y, 2017. a
Künne, A. and Kralisch, S.: Report on flow intermittence indicators, Tech. rep., Horizon 2020 project DRYvER, Securing biodiversity, functional integrity and ecosystem services in DRYing riVER networks, https://www.dryver.eu/results/reports-and-documents (last access: 17 March 2025), 2021. a
Künne, A., Mimeau, L., Branger, F., and Kralisch, S.: Report on catchment-scale spatially distributed models for the 6 European focal DRNs, Tech. rep., Horizon 2020 project DRYvER, Securing biodiversity, functional integrity and ecosystem services in DRYing riVER networks, https://www.dryver.eu/results/reports-and-documents (last access: 17 March 2025), 2022. a
Leigh, C. and Datry, T.: Drying as a primary hydrological determinant of biodiversity in river systems: A broad-scale analysis, Ecography, 40, 487–499, https://doi.org/10.1111/ecog.02230, 2017. a
Leigh, C., Boulton, A. J., Courtwright, J. L., Fritz, K., May, C. L., Walker, R. H., and Datry, T.: Ecological research and management of intermittent rivers: an historical review and future directions, Freshwater Biol., 61, https://doi.org/10.1111/fwb.12646, 2016. a
López‐Rojo, N., Datry, T., Peñas, F. J., Singer, G., Lamouroux, N., Barquín, J., Rodeles, A. A., Silverthorn, T., Sarremejane, R., Del Campo, R., Estévez, E., Mimeau, L., Boyer, F., Künne, A., Dalvai Ragnoli, M., and Foulquier, A.: Carbon emissions from inland waters may be underestimated: Evidence from European river networks fragmented by drying, Limnol. Oceanogr. Lett., 9, 553–562, https://doi.org/10.1002/lol2.10408, 2024. a, b
Messager, M. L., Lehner, B., Cockburn, C., Lamouroux, N., Pella, H., Snelder, T., Tockner, K., Trautmann, T., Watt, C., and Datry, T.: Global prevalence of non-perennial rivers and streams, Nature, 594, 391–397, https://doi.org/10.1038/s41586-021-03565-5, 2021. a, b
Mimeau, L.: DRYvER-Hydro, https://dryver-hydro.sk8.inrae.fr (last access: 17 March 2025), 2023. a
Mimeau, L., Künne, A., Branger, F., Kralisch, S., Devers, A., and Vidal, J.-P.: Flow intermittence prediction using a hybrid hydrological modelling approach: influence of observed intermittence data on the training of a random forest model, Hydrol. Earth Syst. Sci., 28, 851–871, https://doi.org/10.5194/hess-28-851-2024, 2024. a, b, c, d, e, f, g, h, i, j, k
Mimeau, L., Künne, A., Devers, A., Branger, F., Kralisch, S., Lauvernet, C., and Vidal, J.-P.: Hydrological and flow intermittence models for the 6 European catchments studied in the DRYvER project, Recherche Data Gouv, V1 [data set], https://doi.org/10.57745/LCT9L6, 2025a. a
Mimeau, L., Künne, A., Branger, F., and Kralisch, S.: Geographical information for the European Drying River Networks, Recherche Data Gouv, V1 [data set], https://doi.org/10.57745/U0KJL3, 2025b. a
Mimeau, L., Künne, A., Datry, T., Csabai, Z., Polović, L., Bonada, N., Mykrä, H., and Pařil, P.: Flow intermittence observations collected in the European Drying River Networks, Recherche Data Gouv, V1 [data set], https://doi.org/10.57745/VIPKDP, 2025c. a
Mimeau, L., Künne, A., Devers, A., Branger, F., Kralisch, S., Lauvernet, C., and Vidal, J.-P.: Simulated hydrological variables and flow intermittence indicators for the reconstruction period (1960–2021) for the 6 European catchments studied in the DRYvER project, Recherche Data Gouv, V1 [data set], https://doi.org/10.57745/JDQ4KO, 2025d. a
Mimeau, L., Künne, A., Devers, A., Branger, F., Kralisch, S., Lauvernet, C., and Vidal, J.-P.: Simulated hydrological variables and flow intermittence indicators for the projection period (1985–2100) for the 6 European catchments studied in the DRYvER project, Recherche Data Gouv, V1 [data set], https://doi.org/10.57745/5JDNWF, 2025e. a
Muñoz-Sabater, J., Dutra, E., Agustí-Panareda, A., Albergel, C., Arduini, G., Balsamo, G., Boussetta, S., Choulga, M., Harrigan, S., Hersbach, H., Martens, B., Miralles, D. G., Piles, M., Rodríguez-Fernández, N. J., Zsoter, E., Buontempo, C., and Thépaut, J.-N.: ERA5-Land: a state-of-the-art global reanalysis dataset for land applications, Earth Syst. Sci. Data, 13, 4349–4383, https://doi.org/10.5194/essd-13-4349-2021, 2021. a
Naumann, G., Alfieri, L., Wyser, K., Mentaschi, L., Betts, R. A., Carrao, H., Spinoni, J., Vogt, J., and Feyen, L.: Global Changes in Drought Conditions Under Different Levels of Warming, Geophys. Res. Lett., 45, 3285–3296, https://doi.org/10.1002/2017GL076521, 2018. a
Pal, I., Towler, E., and Livneh, B.: How Can We Better Understand Low River Flows as Climate Changes?, Eos, 96, https://doi.org/10.1029/2015EO033875, 2015. a
Parey, S. and Gailhard, J.: Extreme Low Flow Estimation under Climate Change, Atmosphere, 13, 164, https://doi.org/10.3390/atmos13020164, 2022. a
Poff, N. L., Allan, J. D., Bain, M. B., Karr, J. R., Prestegaard, K. L., Richter, B. D., Sparks, R. E., and Stromberg, J. C.: The Natural Flow Regime, BioScience, 47, 769–784, https://doi.org/10.2307/1313099, 1997. a
Pörtner, H.-O., Scholes, R. J., Agard, J., Archer, E., Arneth, A., Bai, X., Barnes, D., Burrows, M., Chan, L., Cheung, W. L. W., Diamond, S., Donatti, C., Duarte, C., Eisenhauer, N., Foden, W., Gasalla, M. A., Handa, C., Hickler, T., Hoegh-Guldberg, O., Ichii, K., Jacob, U., Insarov, G., Kiessling, W., Leadley, P., Leemans, R., Levin, L., Lim, M., Maharaj, S., Managi, S., Marquet, P. A., McElwee, P., Midgley, G., Oberdorff, T., Obura, D., Osman Elasha, B., Pandit, R., Pascual, U., Pires, A. P. F., Popp, A., Reyes-García, V., Sankaran, M., Settele, J., Shin, Y.-J., Sintayehu, D. W., Smith, P., Steiner, N., Strassburg, B., Sukumar, R., Trisos, C., Val, A., Wu, J., Aldrian, E., Parmesan, C., Pichs-Madruga, R., Roberts, D. C., Rogers, A. D., Díaz, S., Fischer, M., Hashimoto, S., Lavorel, S., Wu, N., and Ngo, H.: Scientific outcome of the IPBES-IPCC co-sponsored workshop on biodiversity and climate change, Tech. rep., Zenodo, https://doi.org/10.5281/zenodo.5101125, 2021. a
R Core Team: R: A Language and Environment for Statistical Computing, R Foundation for Statistical Computing, Vienna, Austria, https://www.R-project.org/ (last access: 17 March 2025), 2023. a
Riahi, K., Van Vuuren, D. P., Kriegler, E., Edmonds, J., O'Neill, B. C., Fujimori, S., Bauer, N., Calvin, K., Dellink, R., Fricko, O., Lutz, W., Popp, A., Cuaresma, J. C., Kc, S., Leimbach, M., Jiang, L., Kram, T., Rao, S., Emmerling, J., Ebi, K., Hasegawa, T., Havlik, P., Humpenöder, F., Da Silva, L. A., Smith, S., Stehfest, E., Bosetti, V., Eom, J., Gernaat, D., Masui, T., Rogelj, J., Strefler, J., Drouet, L., Krey, V., Luderer, G., Harmsen, M., Takahashi, K., Baumstark, L., Doelman, J. C., Kainuma, M., Klimont, Z., Marangoni, G., Lotze-Campen, H., Obersteiner, M., Tabeau, A., and Tavoni, M.: The Shared Socioeconomic Pathways and their energy, land use, and greenhouse gas emissions implications: An overview, Global Environ. Change, 42, 153–168, https://doi.org/10.1016/j.gloenvcha.2016.05.009, 2017. a
Roy, J., Tejedor, A., and Singh, A.: Dynamic Clusters to Infer Topologic Controls on Environmental Transport of River Networks, Geophys. Res. Lett., 49, e2021GL096957, https://doi.org/10.1029/2021GL096957, 2022. a, b
Sarremejane, R., Messager, M. L., and Datry, T.: Drought in intermittent river and ephemeral stream networks, Ecohydrology, 15, e2390, https://doi.org/10.1002/eco.2390, 2022. a, b
Sauquet, E., van Meerveld, I., Gallart, F., Sefton, C., Parry, S., Gauster, T., Laaha, G., Alves, M. H., Arnaud, P., Banasik, K., Beaufort, A., Bezdan, A., Datry, T., De Girolamo, A. M., Dörflinger, G., Elçi, A., Engeland, K., Estrany, J., Fialho, A., Fortesa, J., Hakoun, V., Karagiozova, T., Kohnova, S., Kriauciuniene, J., Morais, M., Ninov, P., Osuch, M., Reis, E., Rutkowska, A., Stubbington, R., Tzoraki, O., and Żelazny, M.: A catalogue of European intermittent rivers and ephemeral streams, Tech. rep., Zenodo, https://doi.org/10.5281/ZENODO.3763419, 2020. a
Schneider, C., Laizé, C. L. R., Acreman, M. C., and Flörke, M.: How will climate change modify river flow regimes in Europe?, Hydrol. Earth Syst. Sci., 17, 325–339, https://doi.org/10.5194/hess-17-325-2013, 2013. a
Shanafield, M., Bourke, S. A., Zimmer, M. A., and Costigan, K. H.: An overview of the hydrology of non-perennial rivers and streams, Wiley Interdisciplinary Reviews: Water, 8, e1504, https://doi.org/10.1002/wat2.1504, 2021. a
Silverthorn, T., López‐Rojo, N., Sarremejane, R., Foulquier, A., Chanudet, V., Azougui, A., Del Campo, R., Singer, G., and Datry, T.: River network‐scale drying impacts the spatiotemporal dynamics of greenhouse gas fluxes, Limnol. Oceanogr., 69, 861–873, https://doi.org/10.1002/lno.12531, 2024. a
Snelder, T. H., Datry, T., Lamouroux, N., Larned, S. T., Sauquet, E., Pella, H., and Catalogne, C.: Regionalization of patterns of flow intermittence from gauging station records, Hydrol. Earth Syst. Sci., 17, 2685–2699, https://doi.org/10.5194/hess-17-2685-2013, 2013. a
Steward, A. L., von Schiller, D., Tockner, K., Marshall, J. C., and Bunn, S. E.: When the river runs dry: human and ecological values of dry riverbeds, Front. Ecol. Environ., 10, 202–209, https://doi.org/10.1890/110136, 2012. a
Steward, A. L., Datry, T., and Langhans, S. D.: The terrestrial and semi-aquatic invertebrates of intermittent rivers and ephemeral streams, Biol. Rev., 97, 1408–1425, 2022. a
Straka, M., Polášek, M., Syrovátka, V., Stubbington, R., Zahrádková, S., Němejcová, D., Šikulová, L., Řezníčková, P., Opatřilová, L., Datry, T., and Pařil, P.: Recognition of stream drying based on benthic macroinvertebrates: A new tool in Central Europe, Ecological Indicators, 106, 105486, https://doi.org/10.1016/j.ecolind.2019.105486, 2019. a
Strayer, D. L. and Dudgeon, D.: Freshwater biodiversity conservation: recent progress and future challenges, J. N. Am. Benthol. Soc., 29, 344–358, https://doi.org/10.1899/08-171.1, 2010. a
Thompson, S. E., Harman, C. J., Troch, P. A., Brooks, P. D., and Sivapalan, M.: Spatial scale dependence of ecohydrologically mediated water balance partitioning: A synthesis framework for catchment ecohydrology, Water Resour. Res., 47, 2010WR009998, https://doi.org/10.1029/2010WR009998, 2011. a
Tonkin, J. D., Poff, N. L., Bond, N. R., Horne, A., Merritt, D. M., Reynolds, L. V., Olden, J. D., Ruhi, A., and Lytle, D. A.: Prepare river ecosystems for an uncertain future, Nature, 570, 301–303, https://doi.org/10.1038/d41586-019-01877-1, 2019. a
Tramblay, Y., Rutkowska, A., Sauquet, E., Sefton, C., Laaha, G., Osuch, M., Albuquerque, T., Alves, M. H., Banasik, K., Beaufort, A., Brocca, L., Camici, S., Csabai, Z., Dakhlaoui, H., DeGirolamo, A. M., Dörflinger, G., Gallart, F., Gauster, T., Hanich, L., Kohnová, S., Mediero, L., Plamen, N., Parry, S., Quintana-Seguí, P., Tzoraki, O., and Datry, T.: Trends in flow intermittence for European rivers, Hydrol. Sci. J., 66, 37–49, https://doi.org/10.1080/02626667.2020.1849708, 2021. a
Truchy, A., Csabai, Z., Mimeau, L., Künne, A., Pernecker, B., Bertin, W., Pellizzaro, F., and Datry, T.: Citizen scientists can help advance the science and management of intermittent rivers and ephemeral streams, BioScience, 73, 513–521, https://doi.org/10.1093/biosci/biad045, 2023. a, b
Van Loon, A. F., Stahl, K., Di Baldassarre, G., Clark, J., Rangecroft, S., Wanders, N., Gleeson, T., Van Dijk, A. I. J. M., Tallaksen, L. M., Hannaford, J., Uijlenhoet, R., Teuling, A. J., Hannah, D. M., Sheffield, J., Svoboda, M., Verbeiren, B., Wagener, T., and Van Lanen, H. A. J.: Drought in a human-modified world: reframing drought definitions, understanding, and analysis approaches, Hydrol. Earth Syst. Sci., 20, 3631–3650, https://doi.org/10.5194/hess-20-3631-2016, 2016. a, b
van Meerveld, H. J. I., Kirchner, J. W., Vis, M. J. P., Assendelft, R. S., and Seibert, J.: Expansion and contraction of the flowing stream network alter hillslope flowpath lengths and the shape of the travel time distribution, Hydrol. Earth Syst. Sci., 23, 4825–4834, https://doi.org/10.5194/hess-23-4825-2019, 2019. a
Van Meerveld, H. I., Sauquet, E., Gallart, F., Sefton, C., Seibert, J., and Bishop, K.: Aqua temporaria incognita, Hydrol. Process., 34, 5704–5711, https://doi.org/10.1002/hyp.13979, 2020. a
Yu, S., Do, H. X., van Dijk, A. I. J. M., Bond, N. R., Lin, P., and Kennard, M. J.: Evaluating a landscape-scale daily water balance model to support spatially continuous representation of flow intermittency throughout stream networks, Hydrol. Earth Syst. Sci., 24, 5279–5295, https://doi.org/10.5194/hess-24-5279-2020, 2020. a
Zennaro, F., Furlan, E., Simeoni, C., Torresan, S., Aslan, S., Critto, A., and Marcomini, A.: Exploring machine learning potential for climate change risk assessment, Earth-Sci. Rev., 220, 103752, https://doi.org/10.1016/j.earscirev.2021.103752, 2021. a
Zimmer, M. A., Kaiser, K. E., Blaszczak, J. R., Zipper, S. C., Hammond, J. C., Fritz, K. M., Costigan, K. H., Hosen, J., Godsey, S. E., Allen, G. H., Kampf, S., Burrows, R. M., Krabbenhoft, C. A., Dodds, Walter andHale, R., Olde, J. D., Shanafield, M., and DelVecchia, A. G. A. A. S. A. M. C., Datry, T., Bogan, M. T., Boersma, K. S., Busch, M. H., Jones, C. N., Burgin, A. J., and Allen, D. C.: Zero or not? Causes and consequences of zero-flow stream gage readings, Wiley Interdisciplinary Reviews: Water, 7, e1436, https://doi.org/10.1002/wat2.1436, 2020. a
Zounemat-Kermani, M., Batelaan, O., Fadaee, M., and Hinkelmann, R.: Ensemble machine learning paradigms in hydrology: A review, J. Hydrol., 598, 126266, https://doi.org/10.1016/j.jhydrol.2021.126266, 2021. a